Hazard Mapping of the Rainfall–Landslides Disaster Chain Based on GeoDetector and Bayesian Network Models in Shuicheng County, China


 and
and
Abstract
1. Introduction
2. Study Area and Data
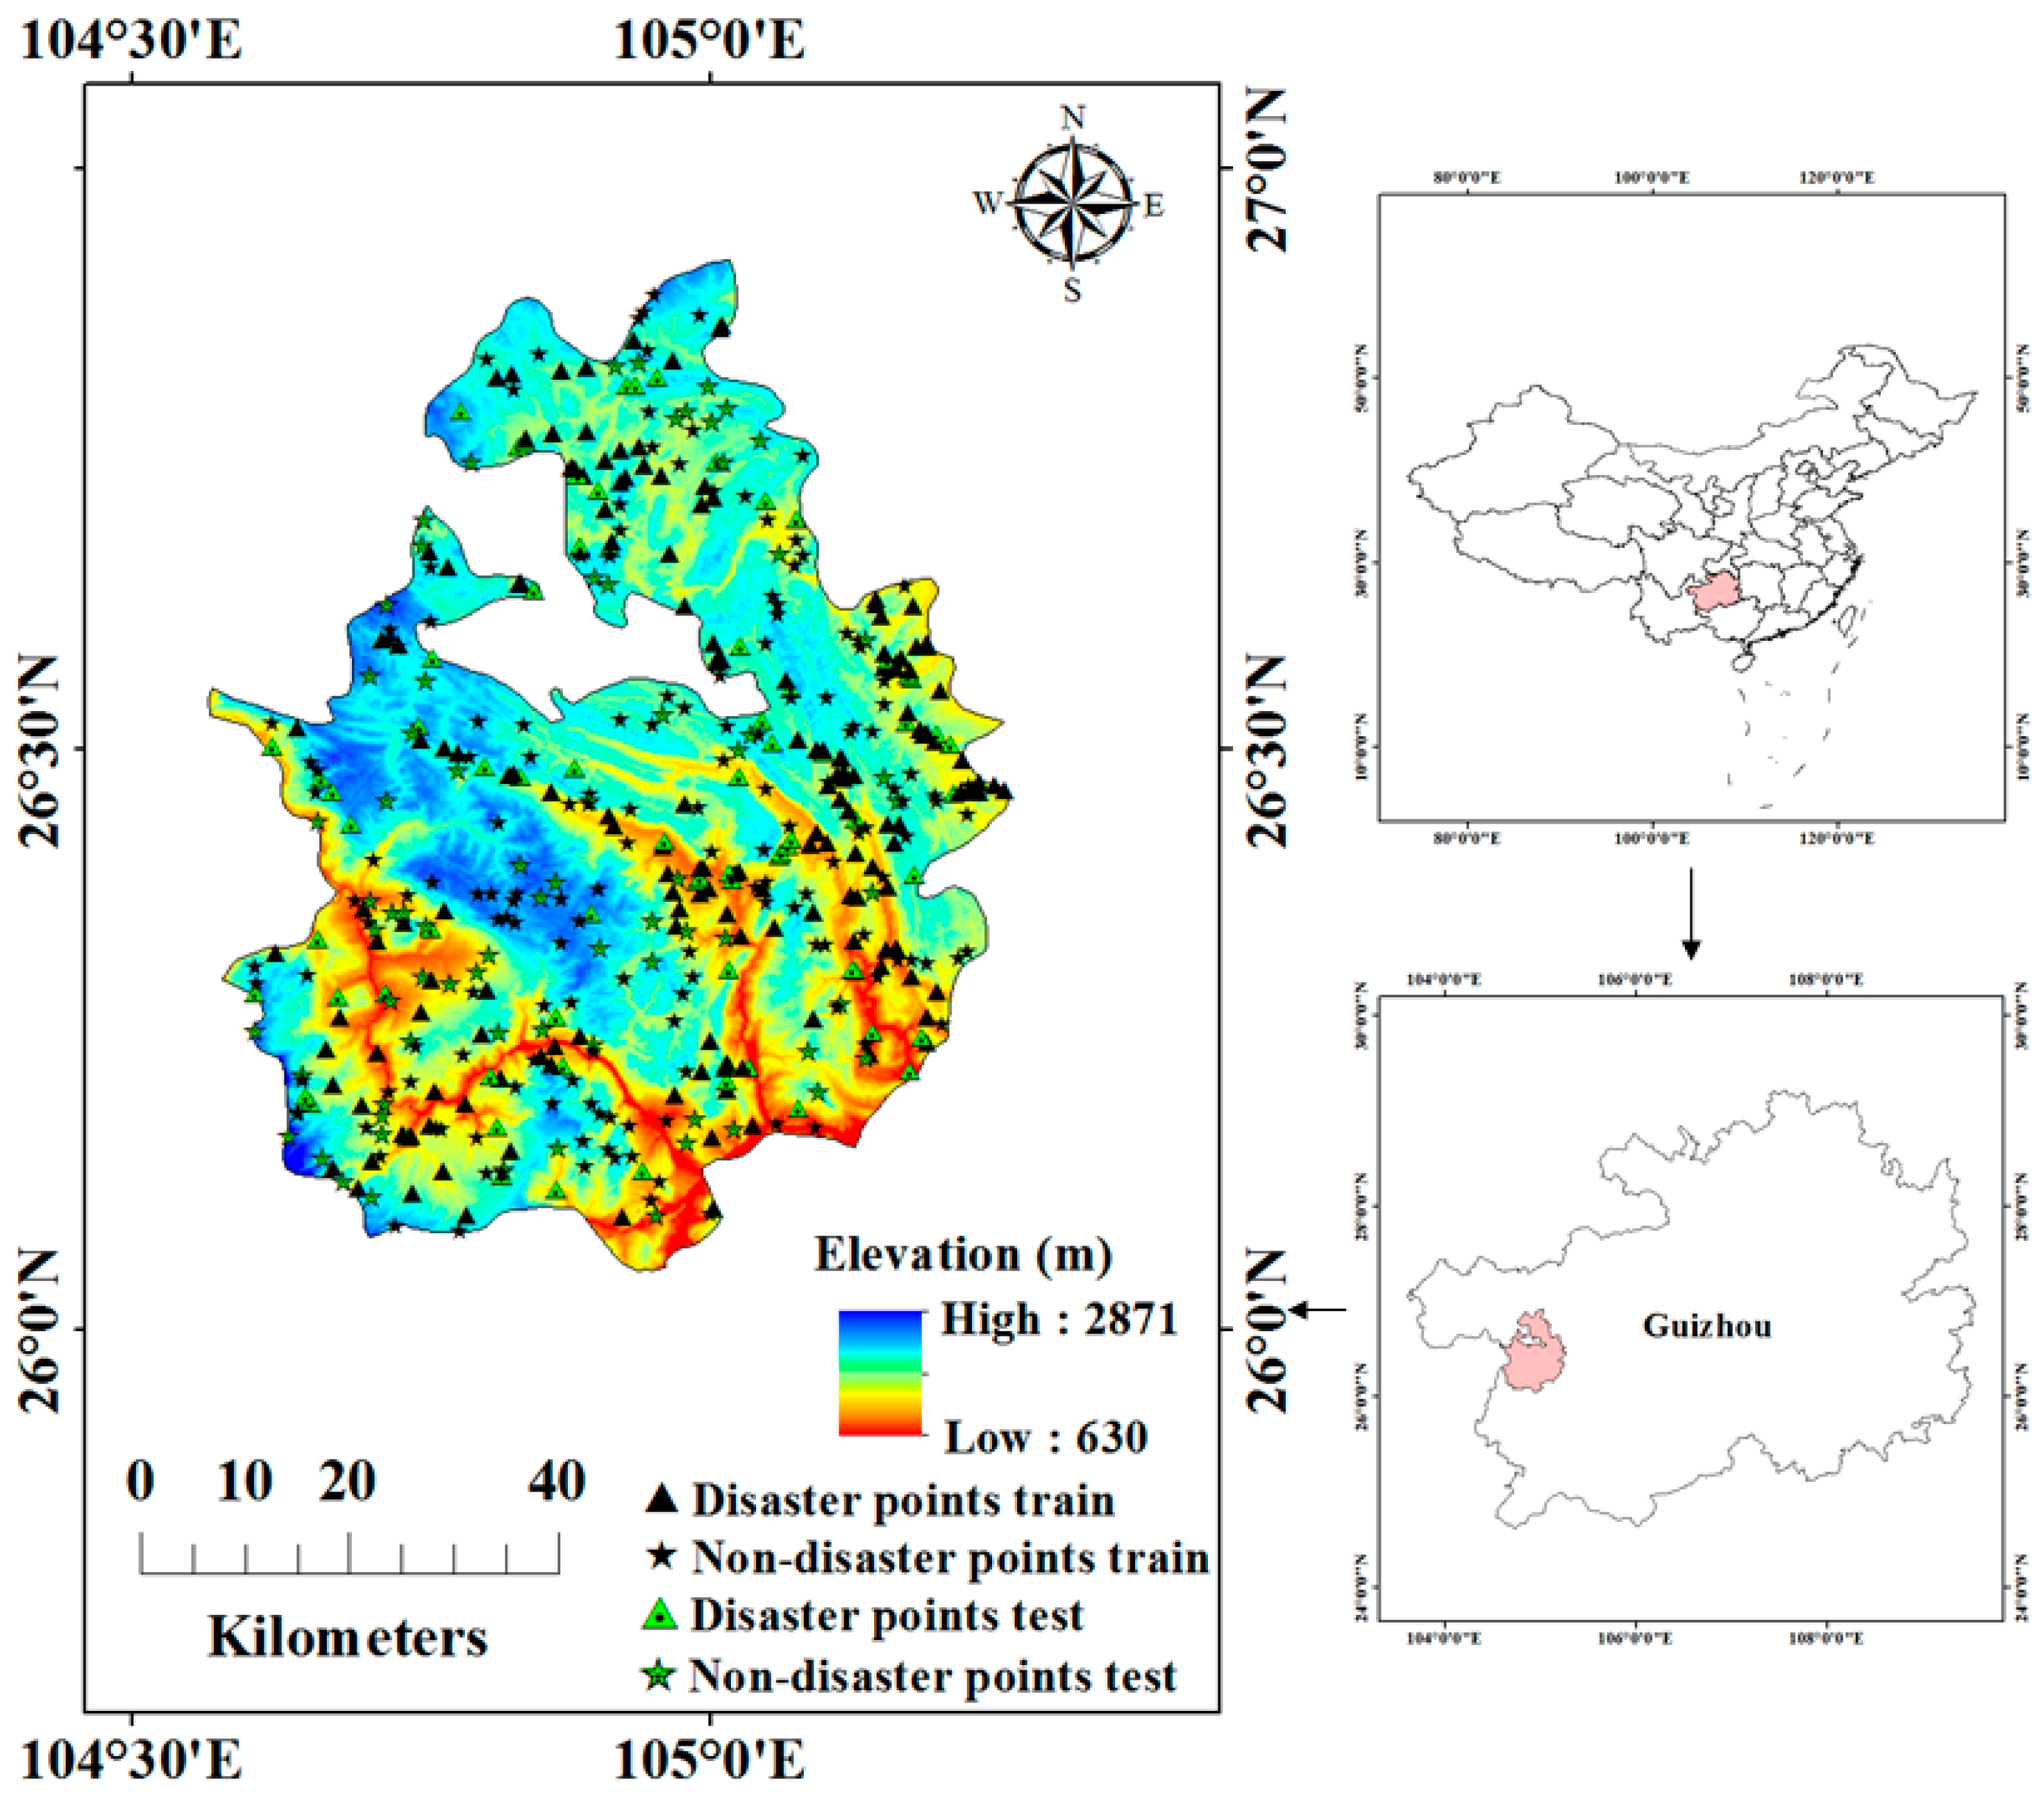
2.1. Study Area
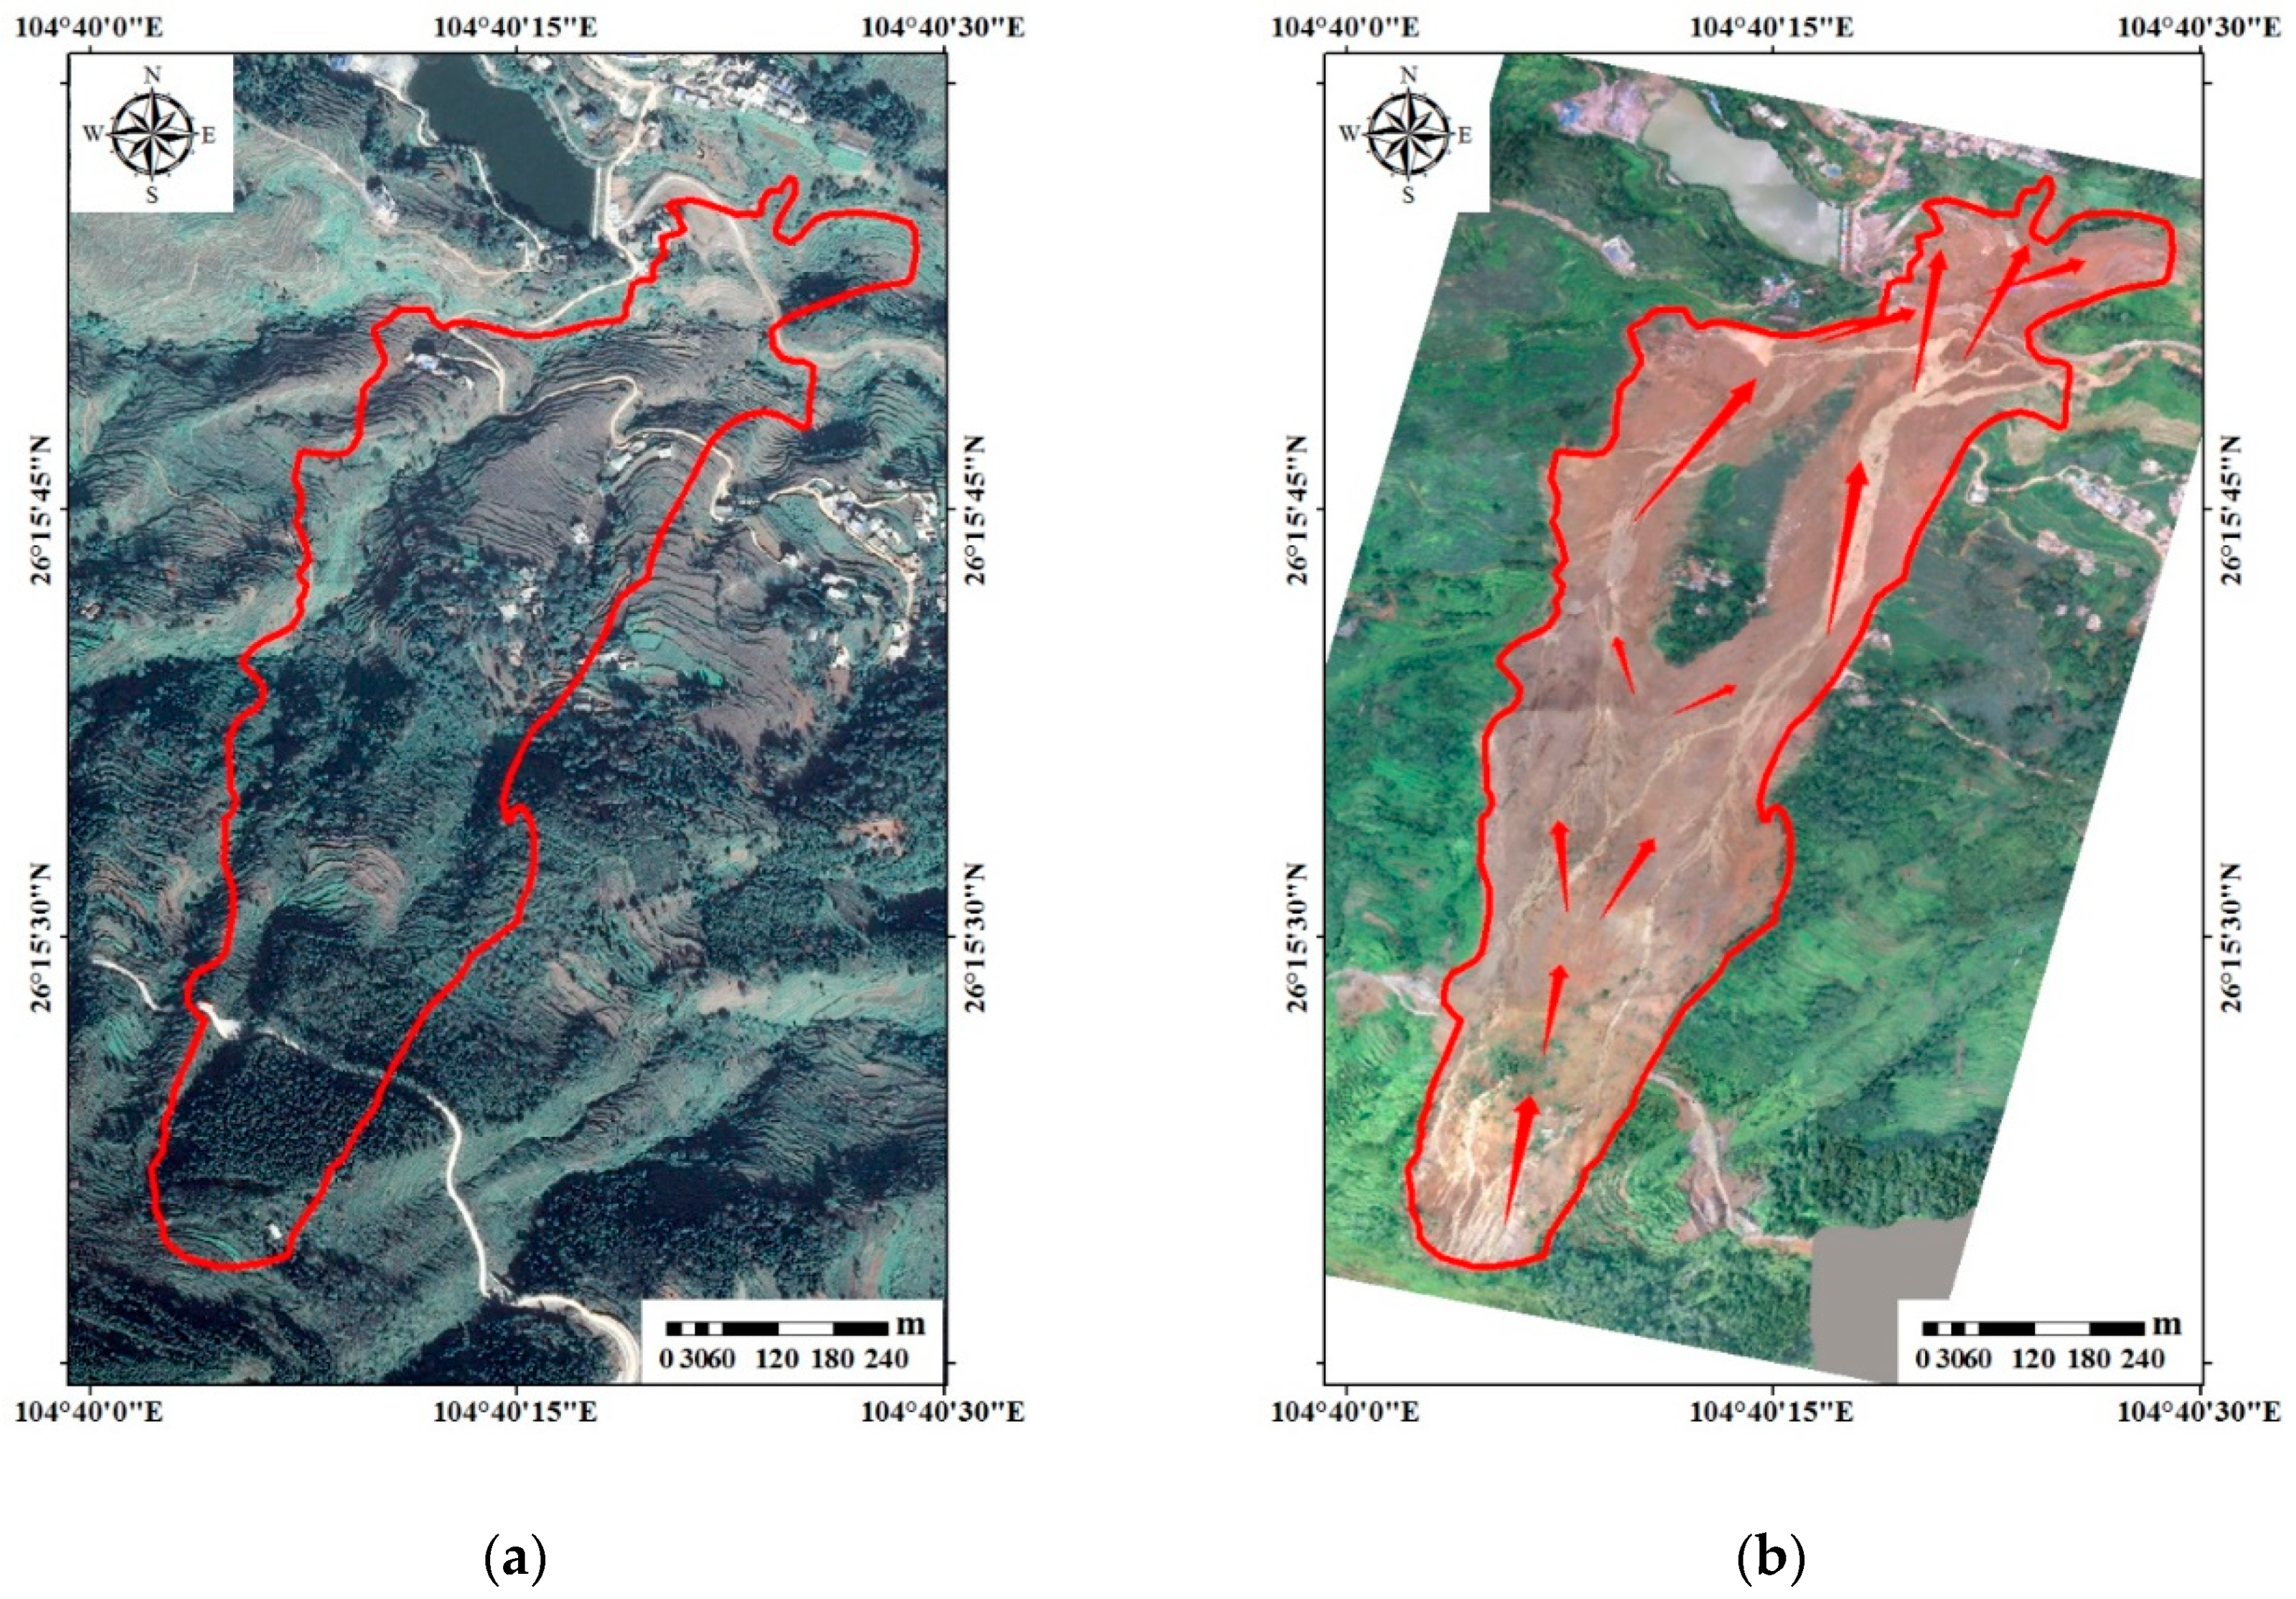
2.2. Landslides Inventory
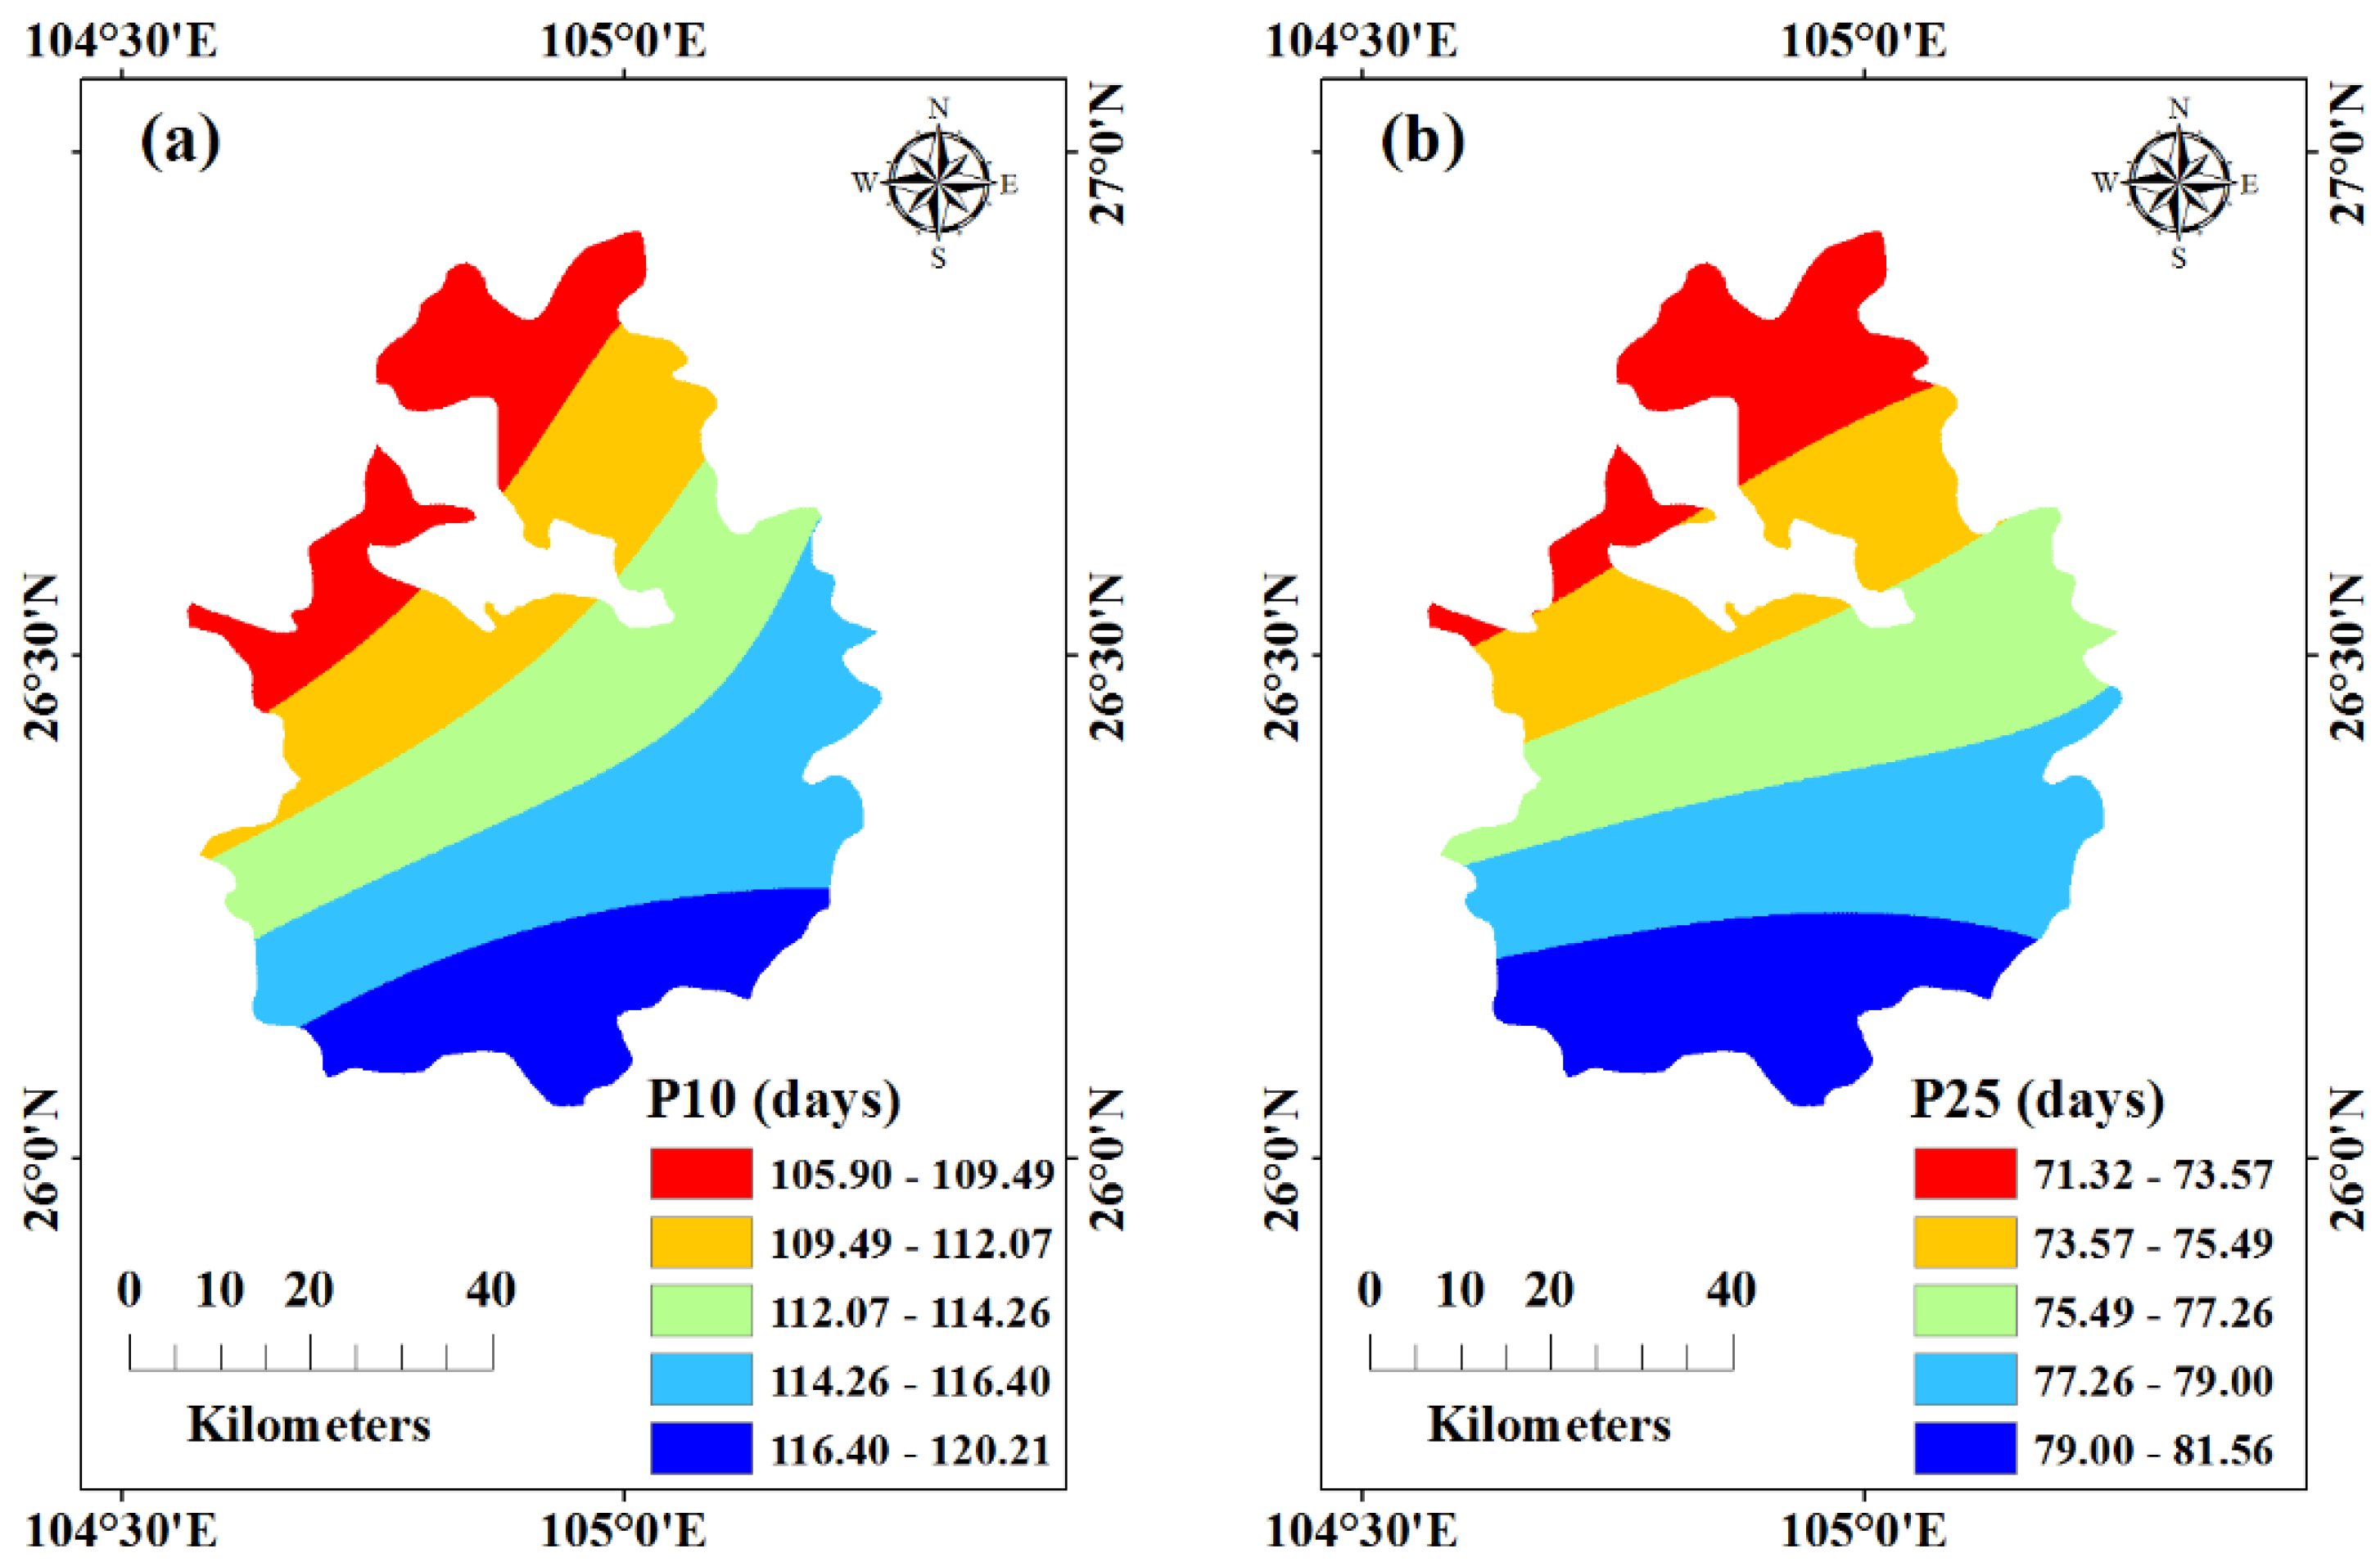
2.3. Extreme Rainfall Factors
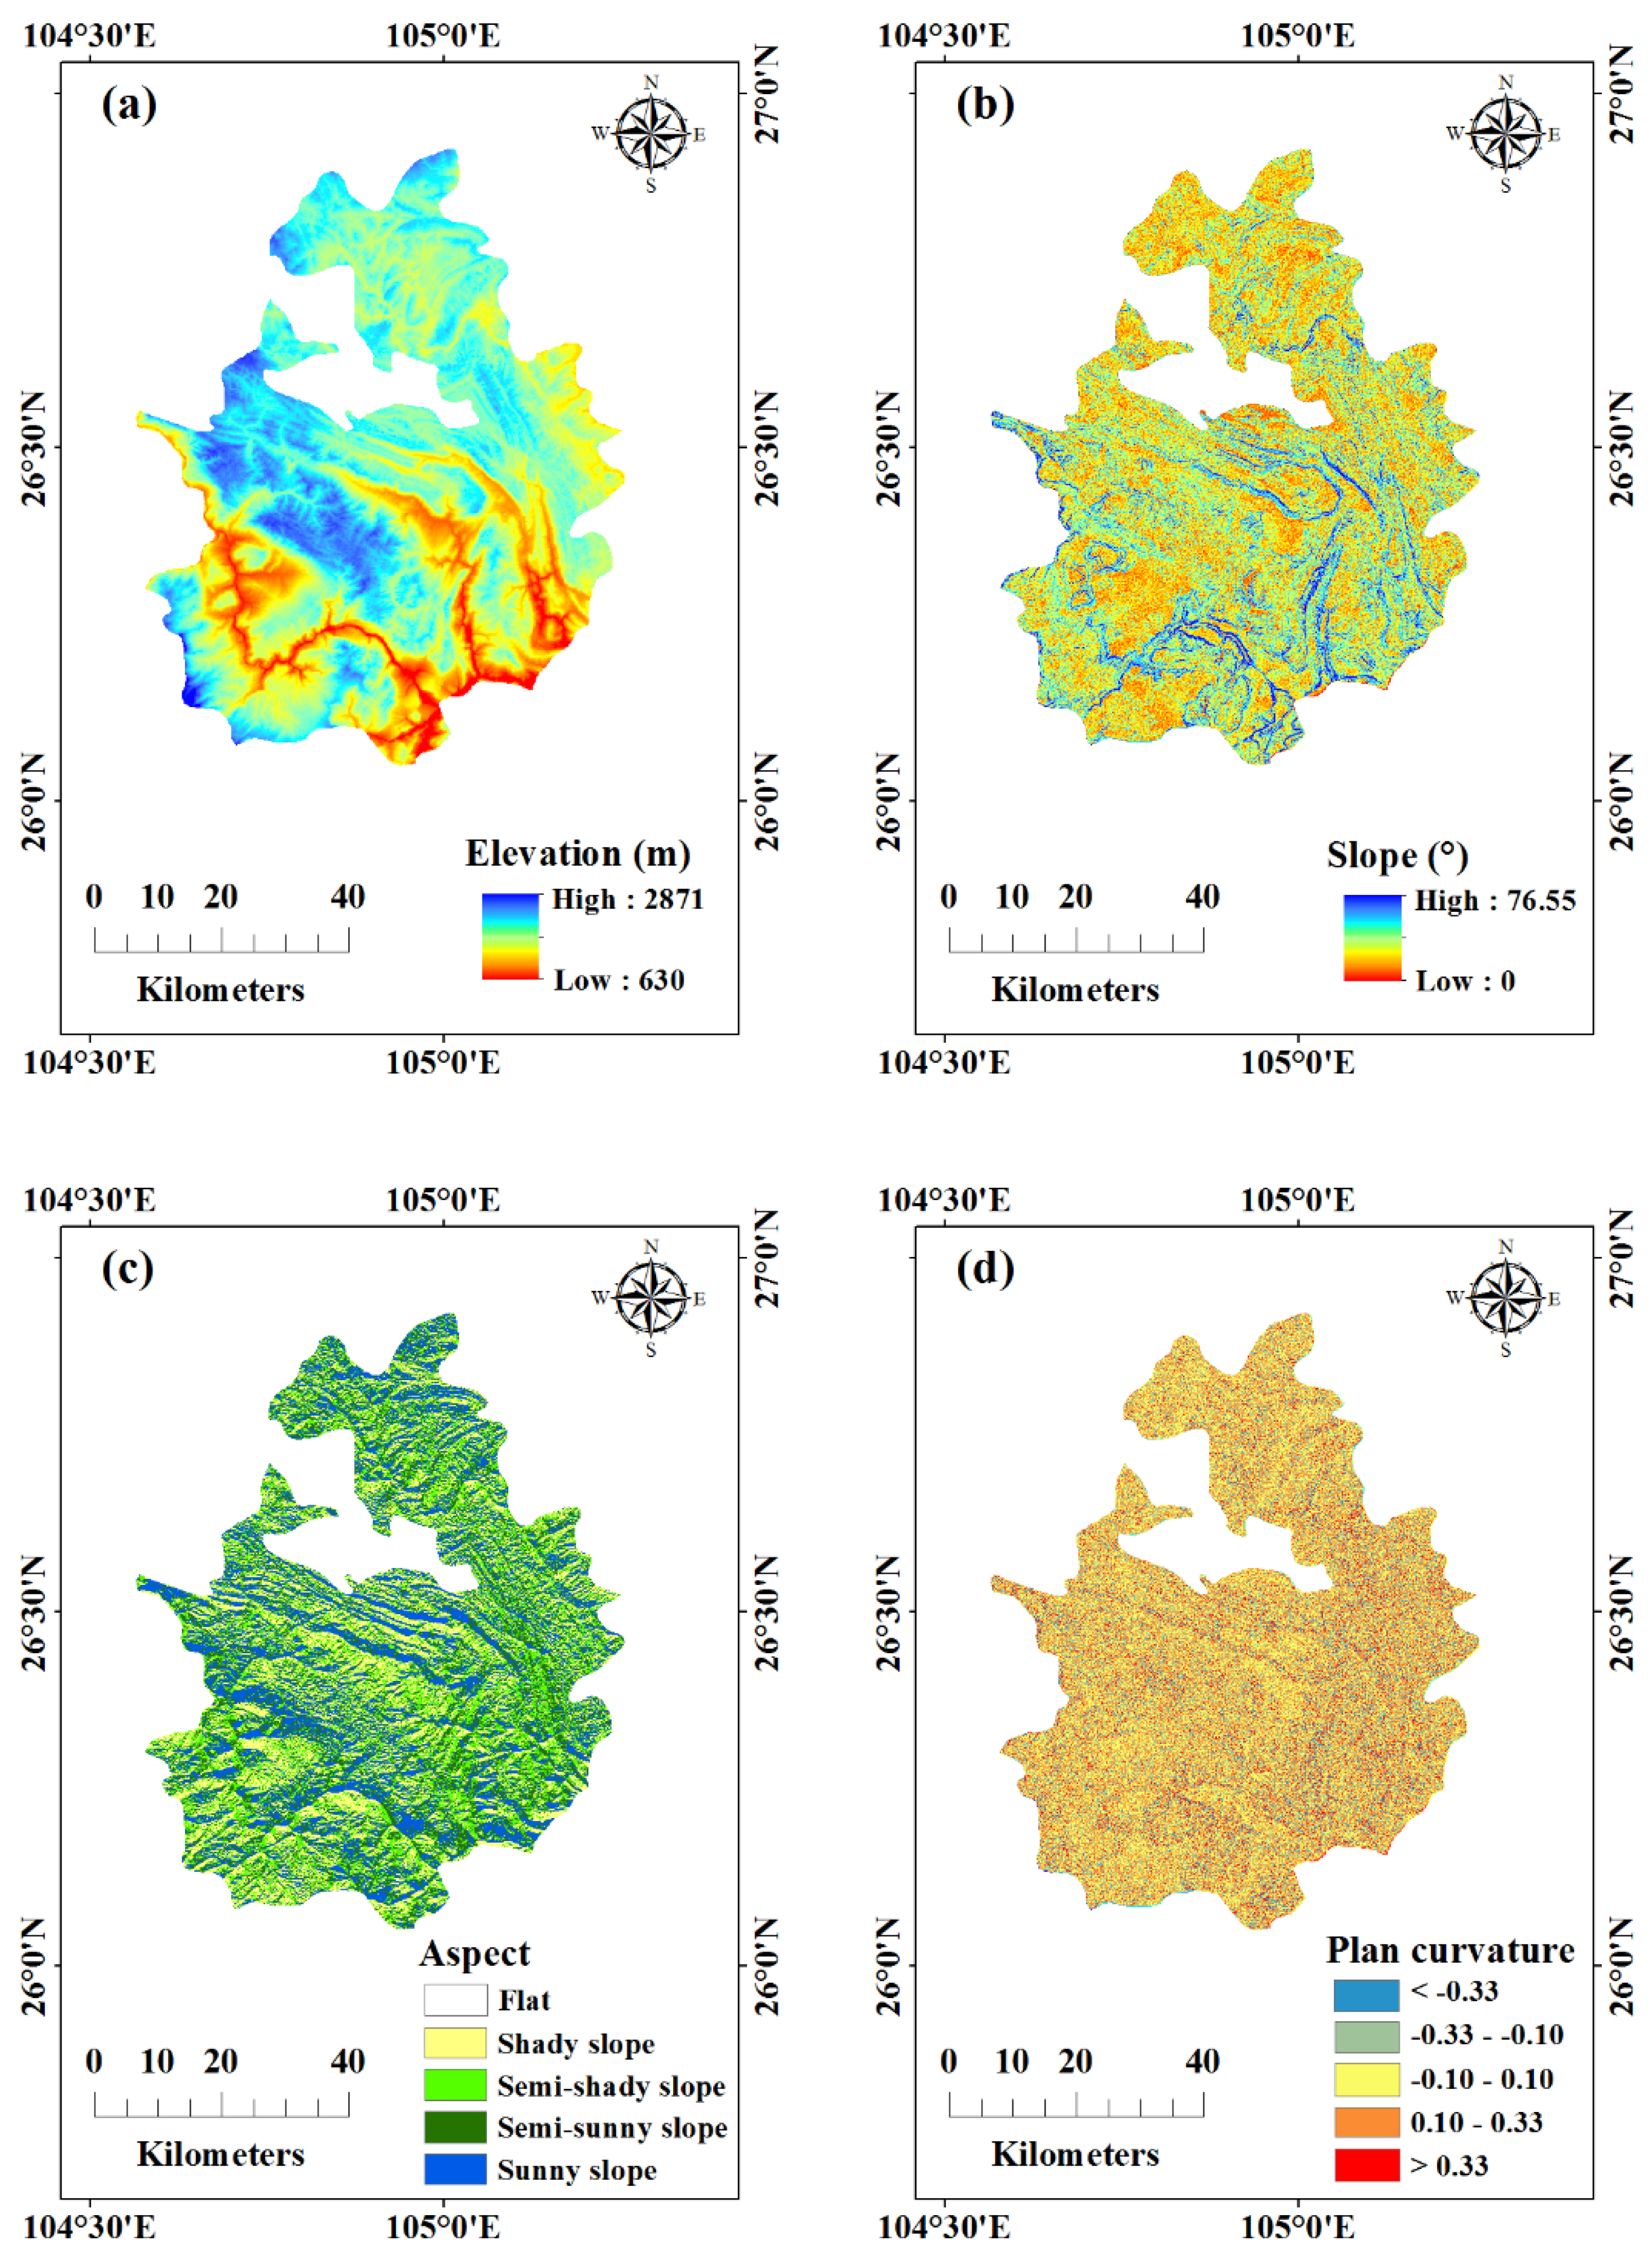
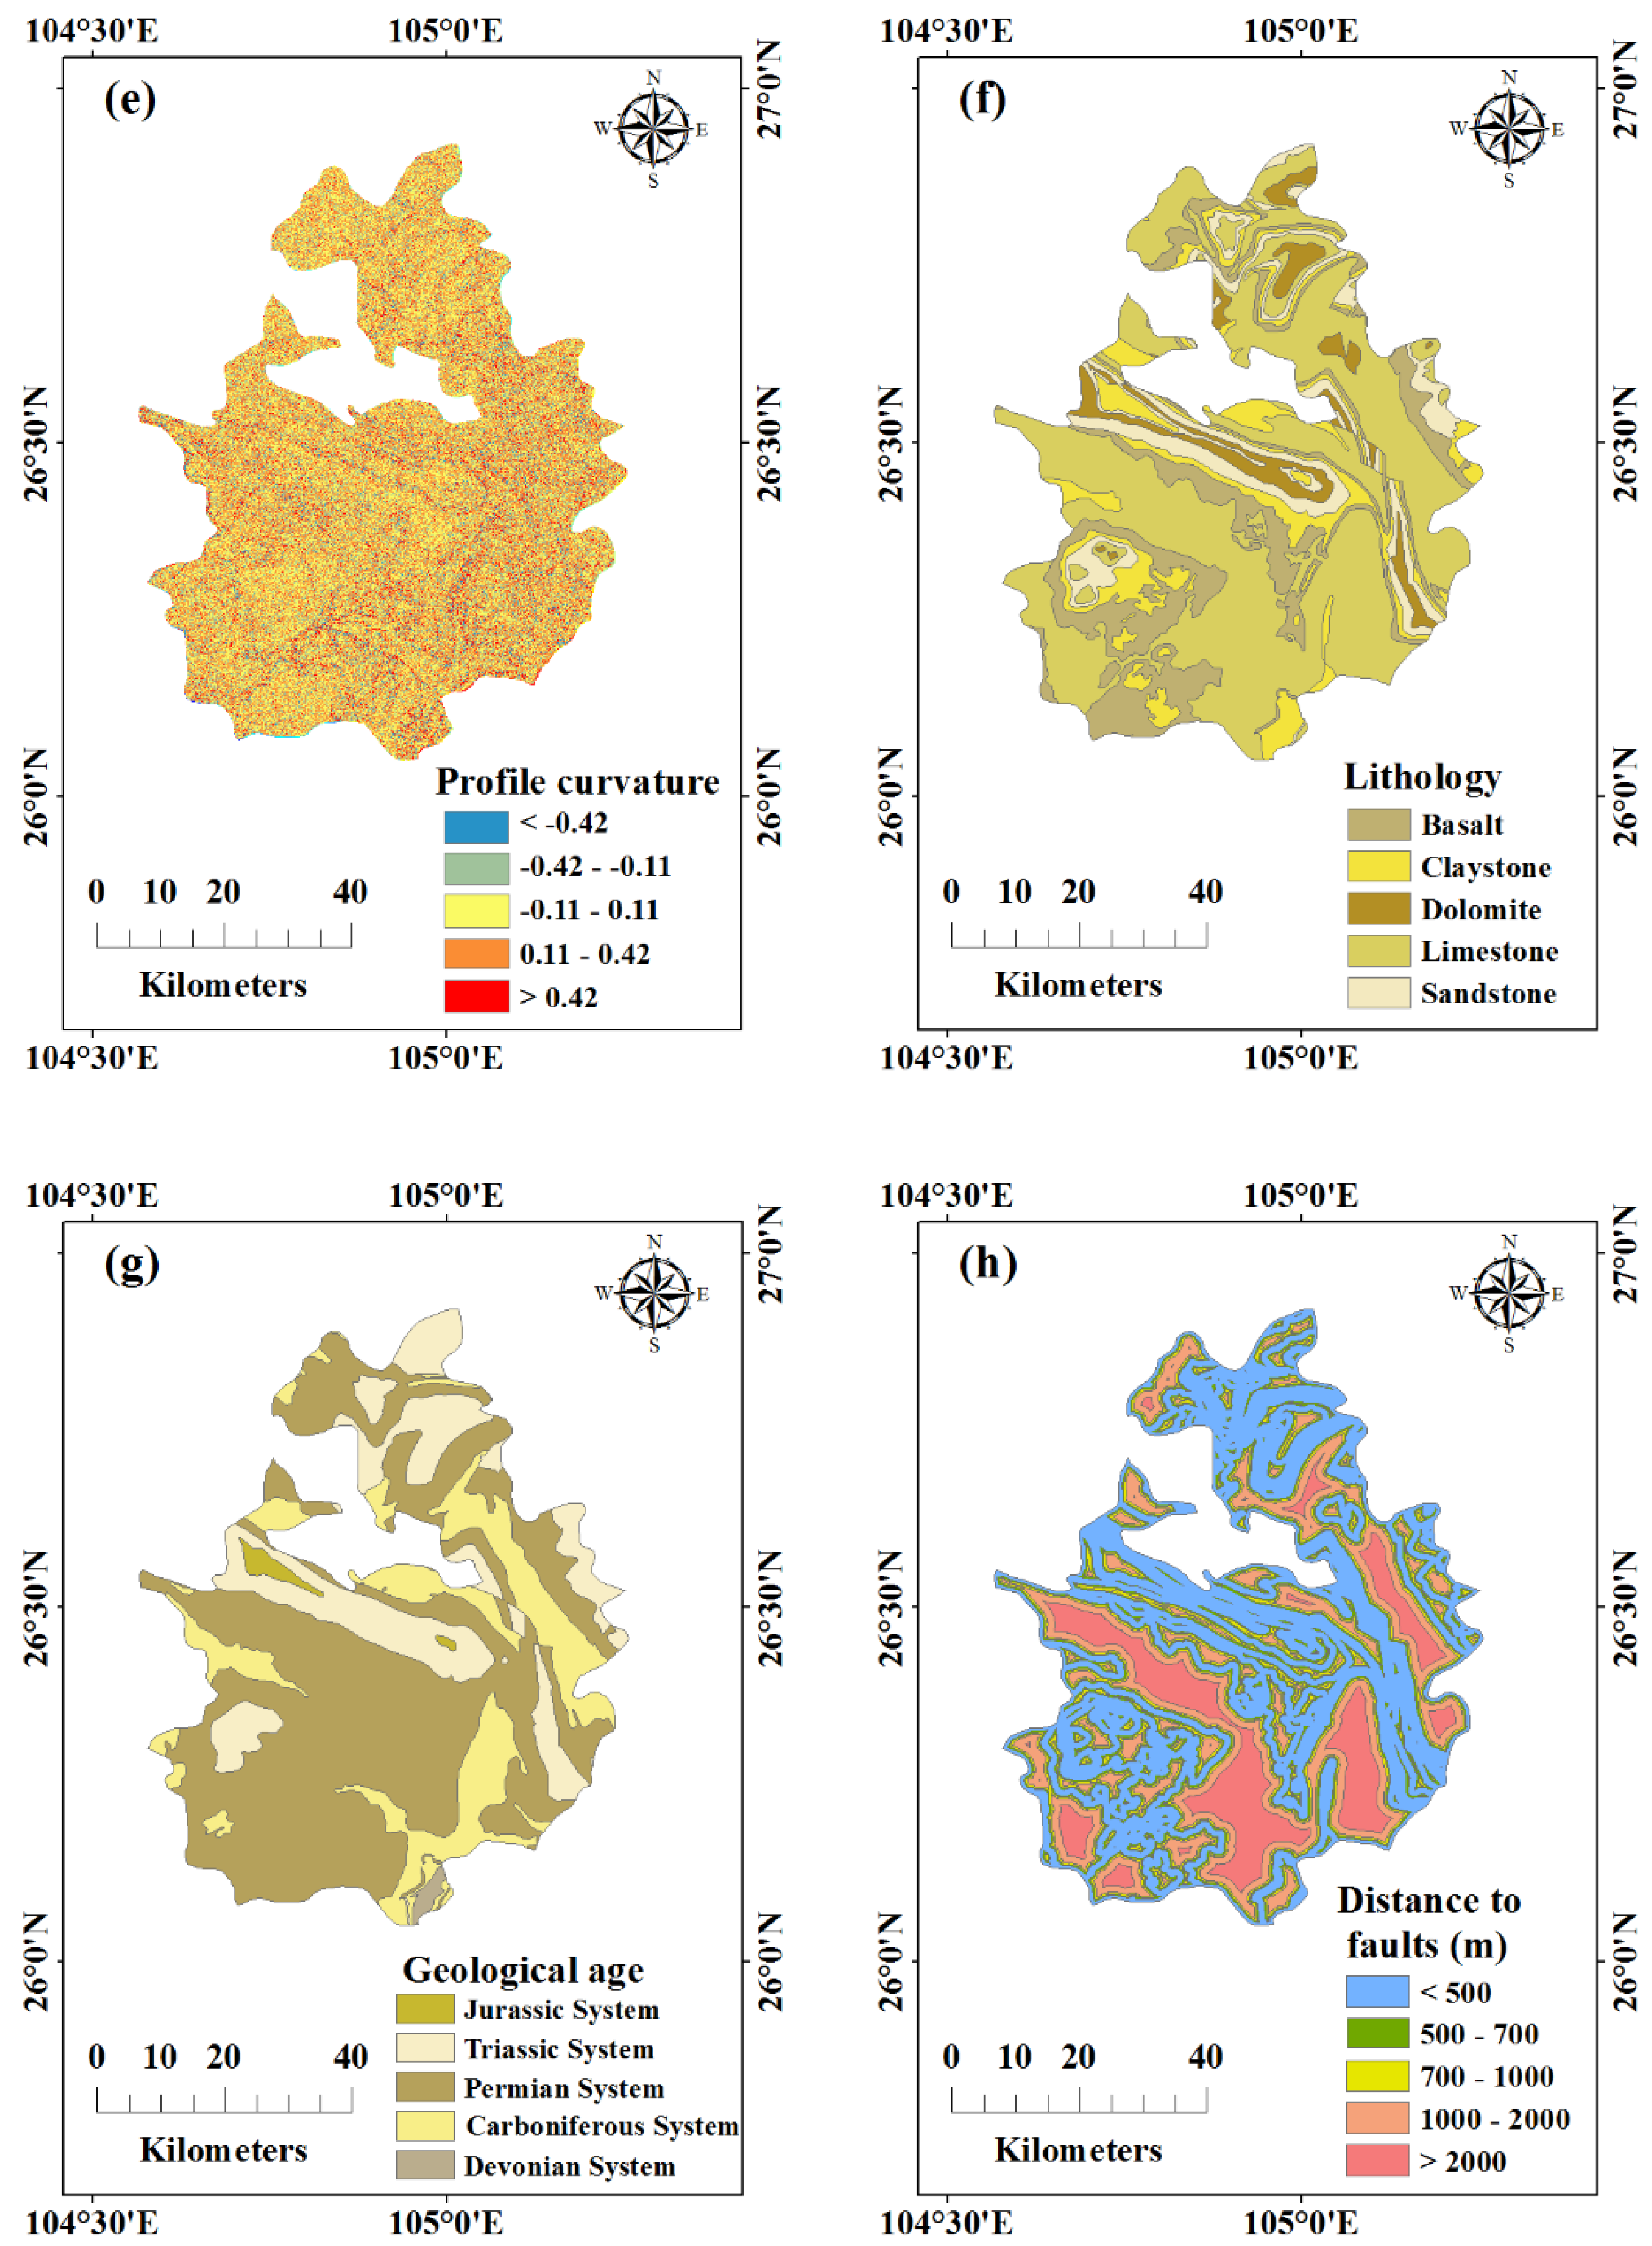
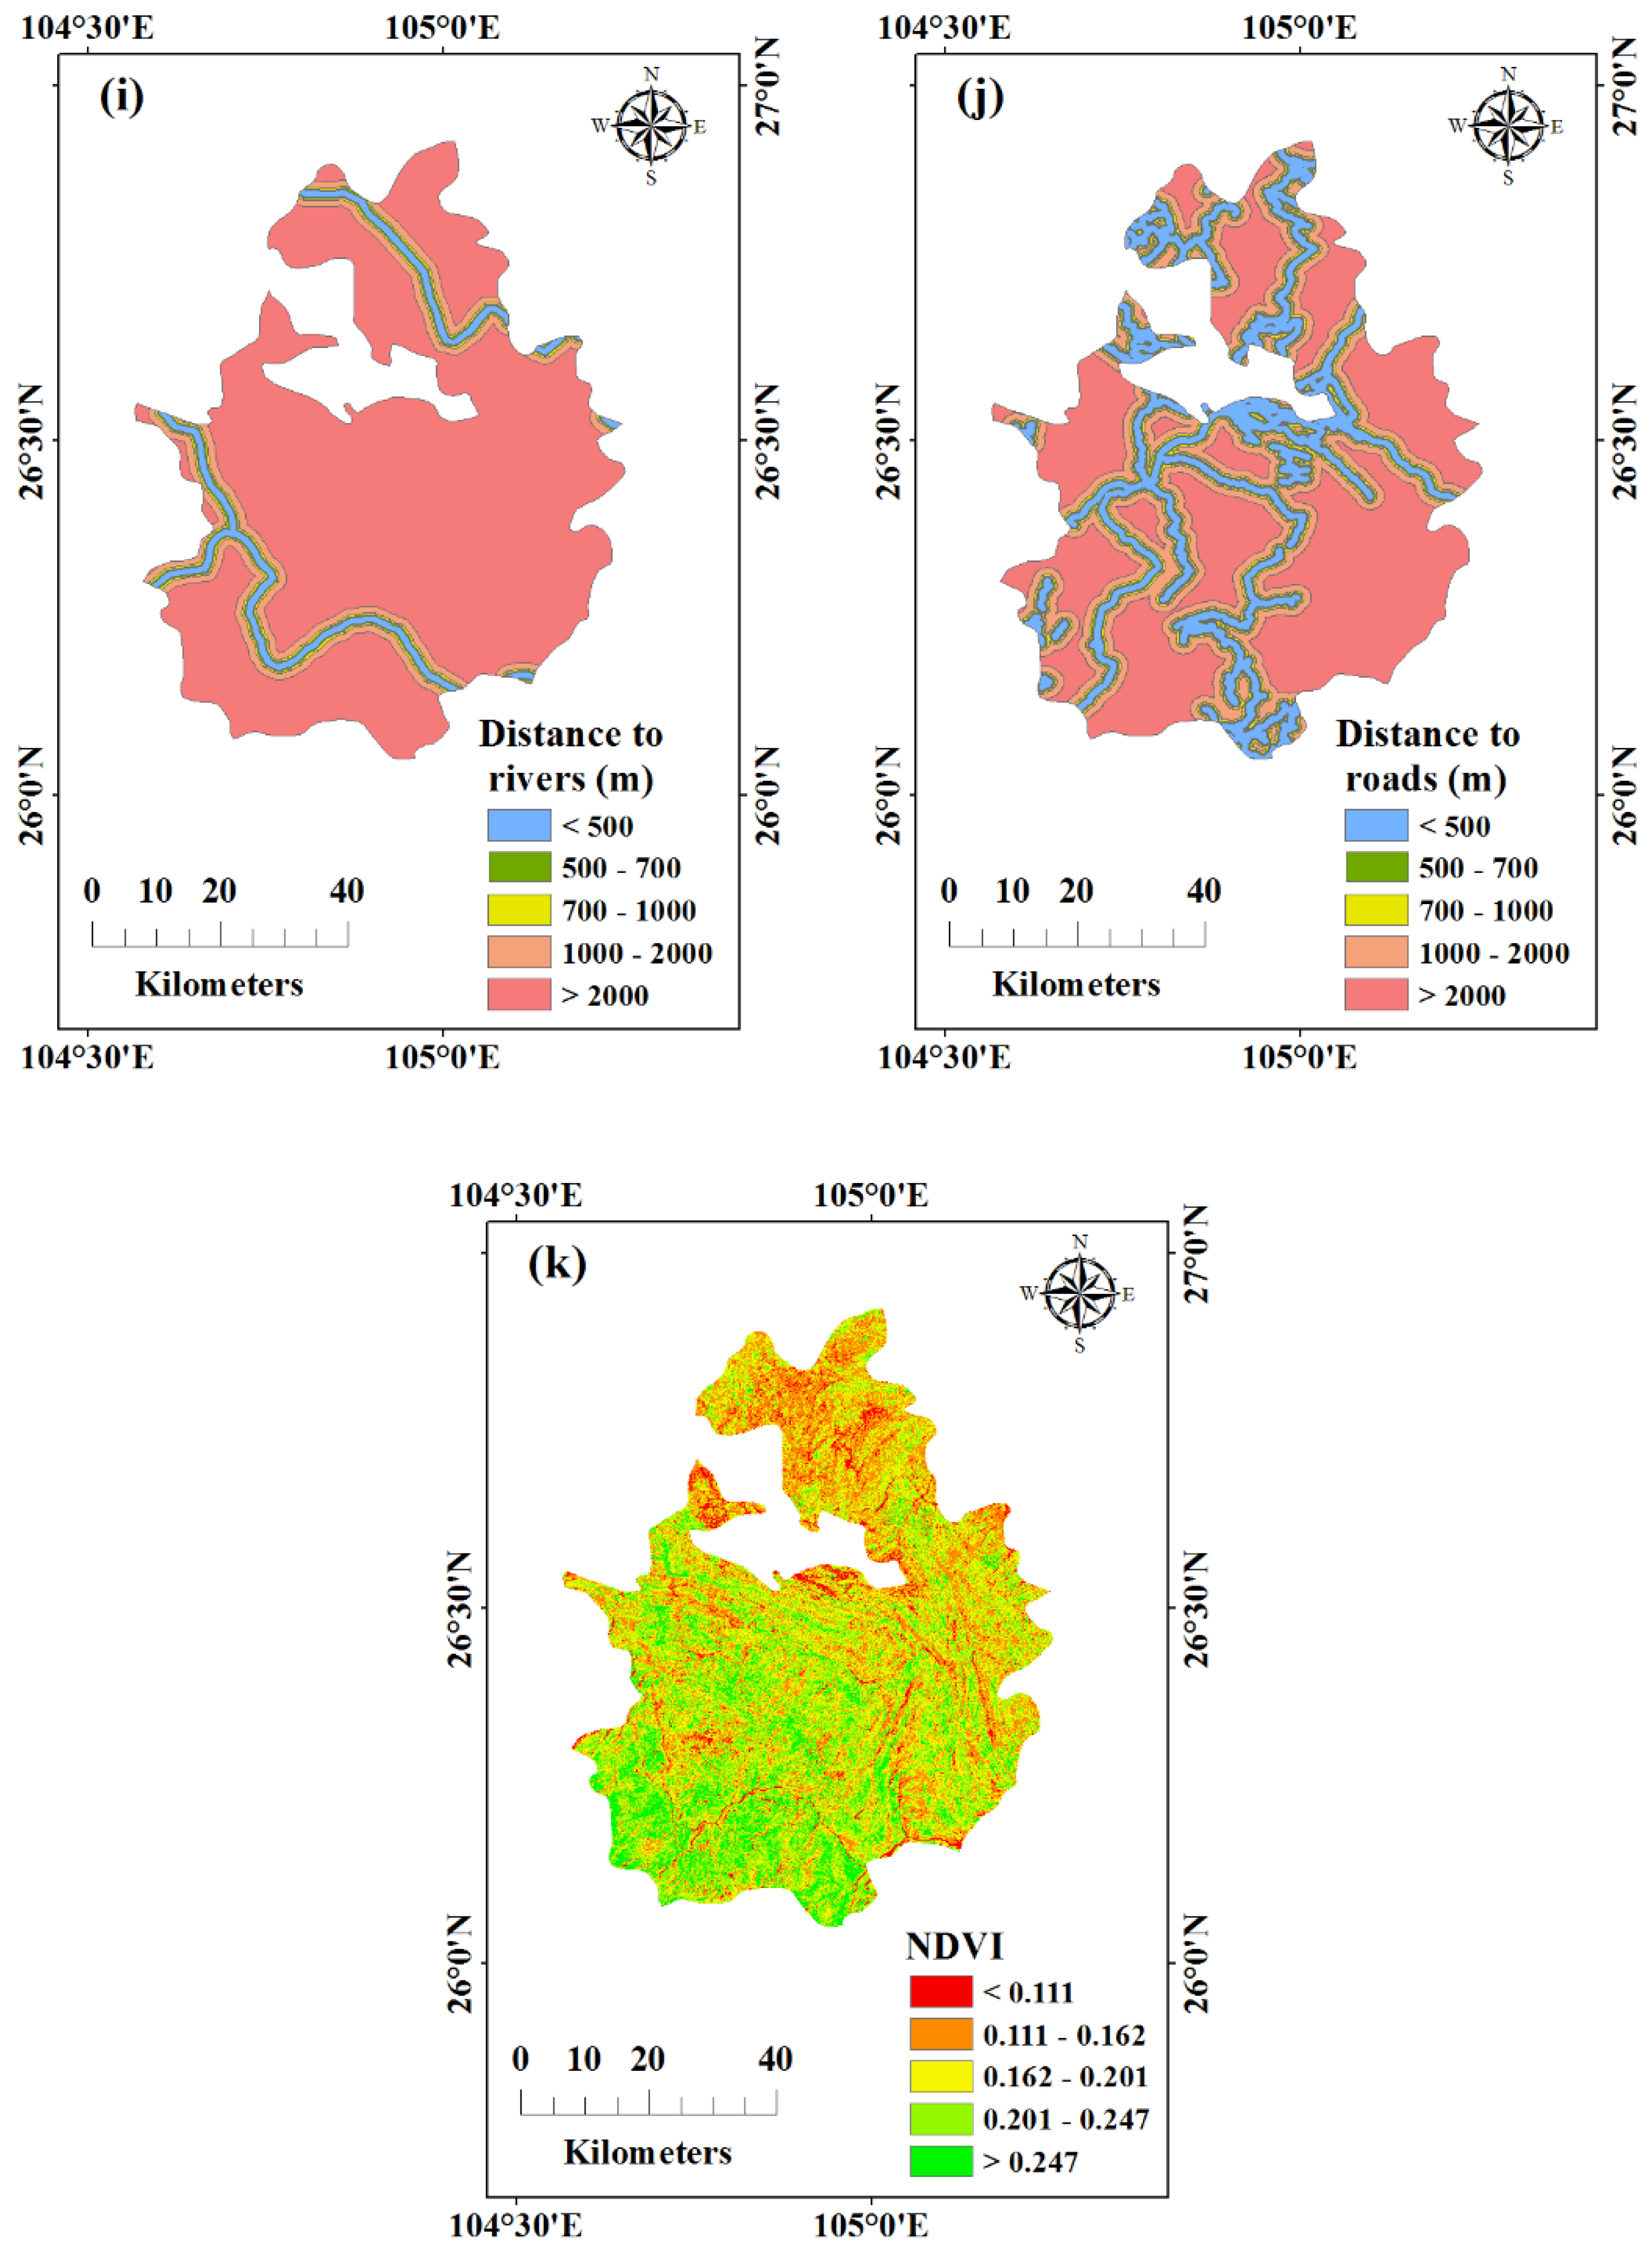
2.4. landslides Influencing Factors
3. Methods
3.1. Data Pretreatment
3.2. GeoDetector Model
- (1)
- Single factor driven analysis. The GeoDetector quantitatively determines the contribution of the independent variable x to the dependent variable y by factor explanatory power, thereby checking whether the factor is the reason for the spatial differentiation of the geographical phenomenon. The principle of factor explanatory power is as follows:where is the factor explanatory power, indicating to what extent the independent variable explains the spatial distribution of landslides; is the count of independent variable class, and are the grids number of class and the whole area, respectively. and are the variance of the dependent variable of the class and whole area, respectively. The larger the values of become, the greater the contribution of the x-layer to landslides occurrence.
- (2)
- Factors interaction driven analysis. The interaction detector compares the explanatory power of the pairwise factors and their sum with the explanatory power after the interaction, to analyze the influence form of the two factors coincidence on the geographical phenomenon. X1 and X2 are two factors, spatially superposed X1 and X2 form a new spatial factor X1 ∩ X2, then we compare the interaction relationship between the factor explanatory power of X1 ∩ X2 and X1, X2.
3.3. BN Model
3.4. Model Evaluation
4. Results
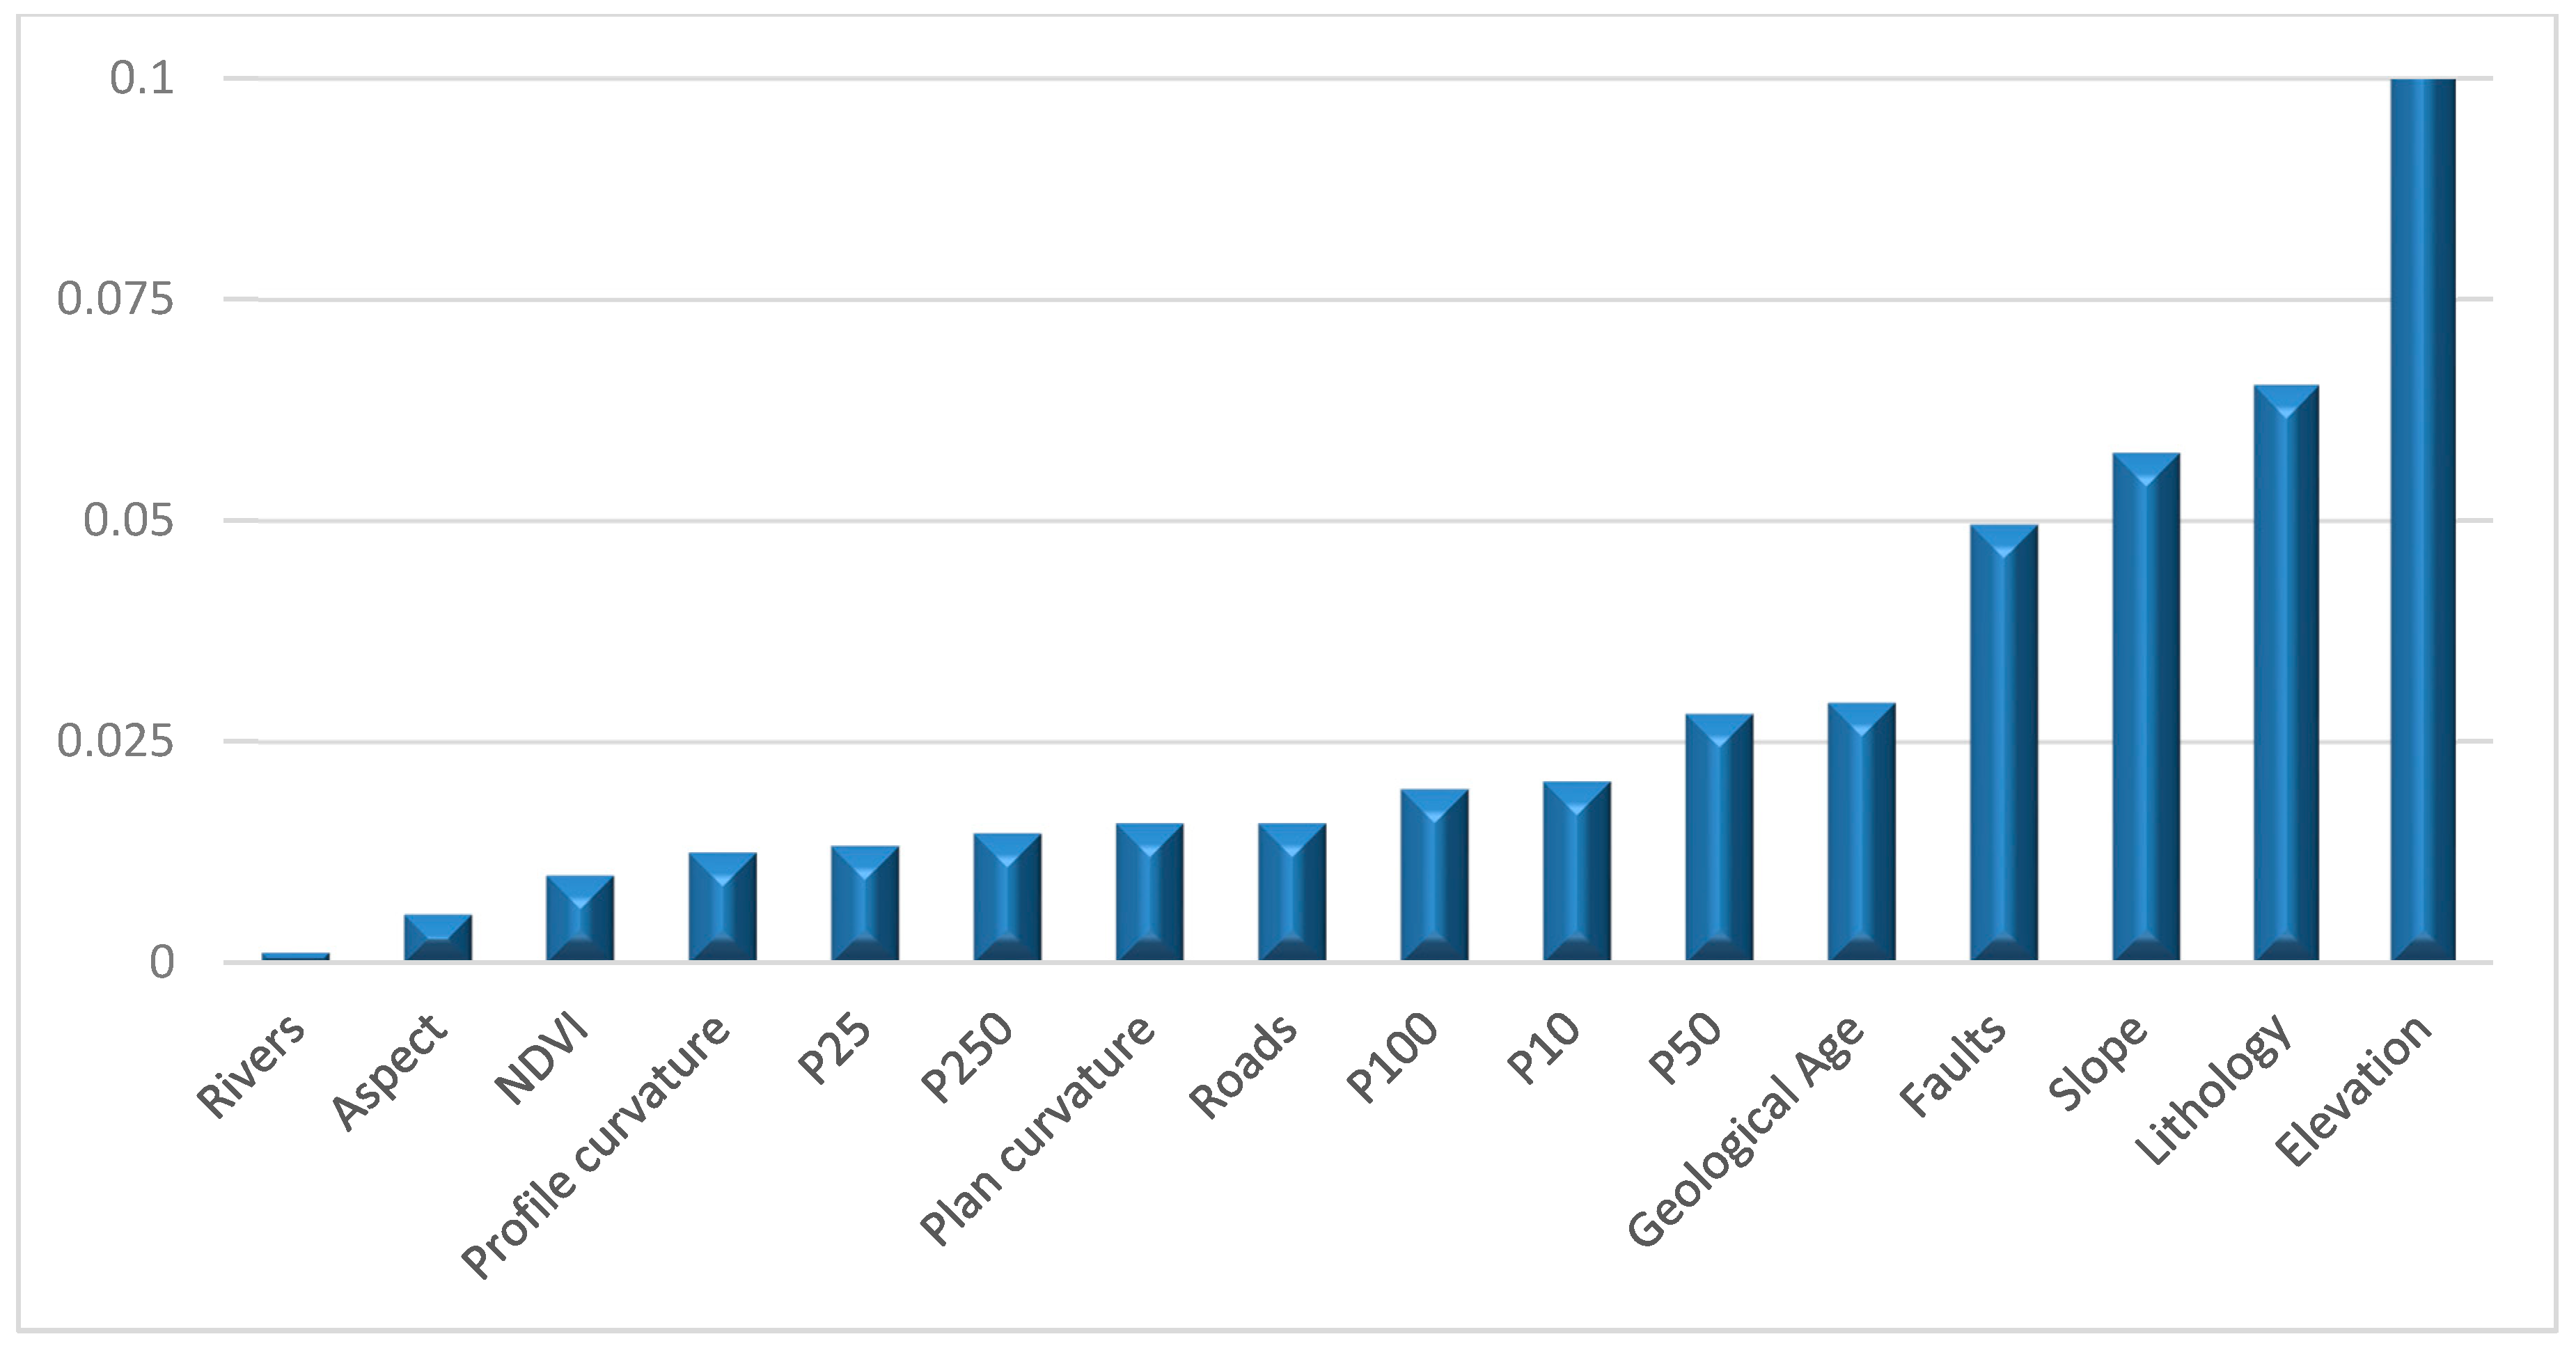
4.1. Single Factor Driven Analysis
4.2. Factors Interaction Driven Analysis
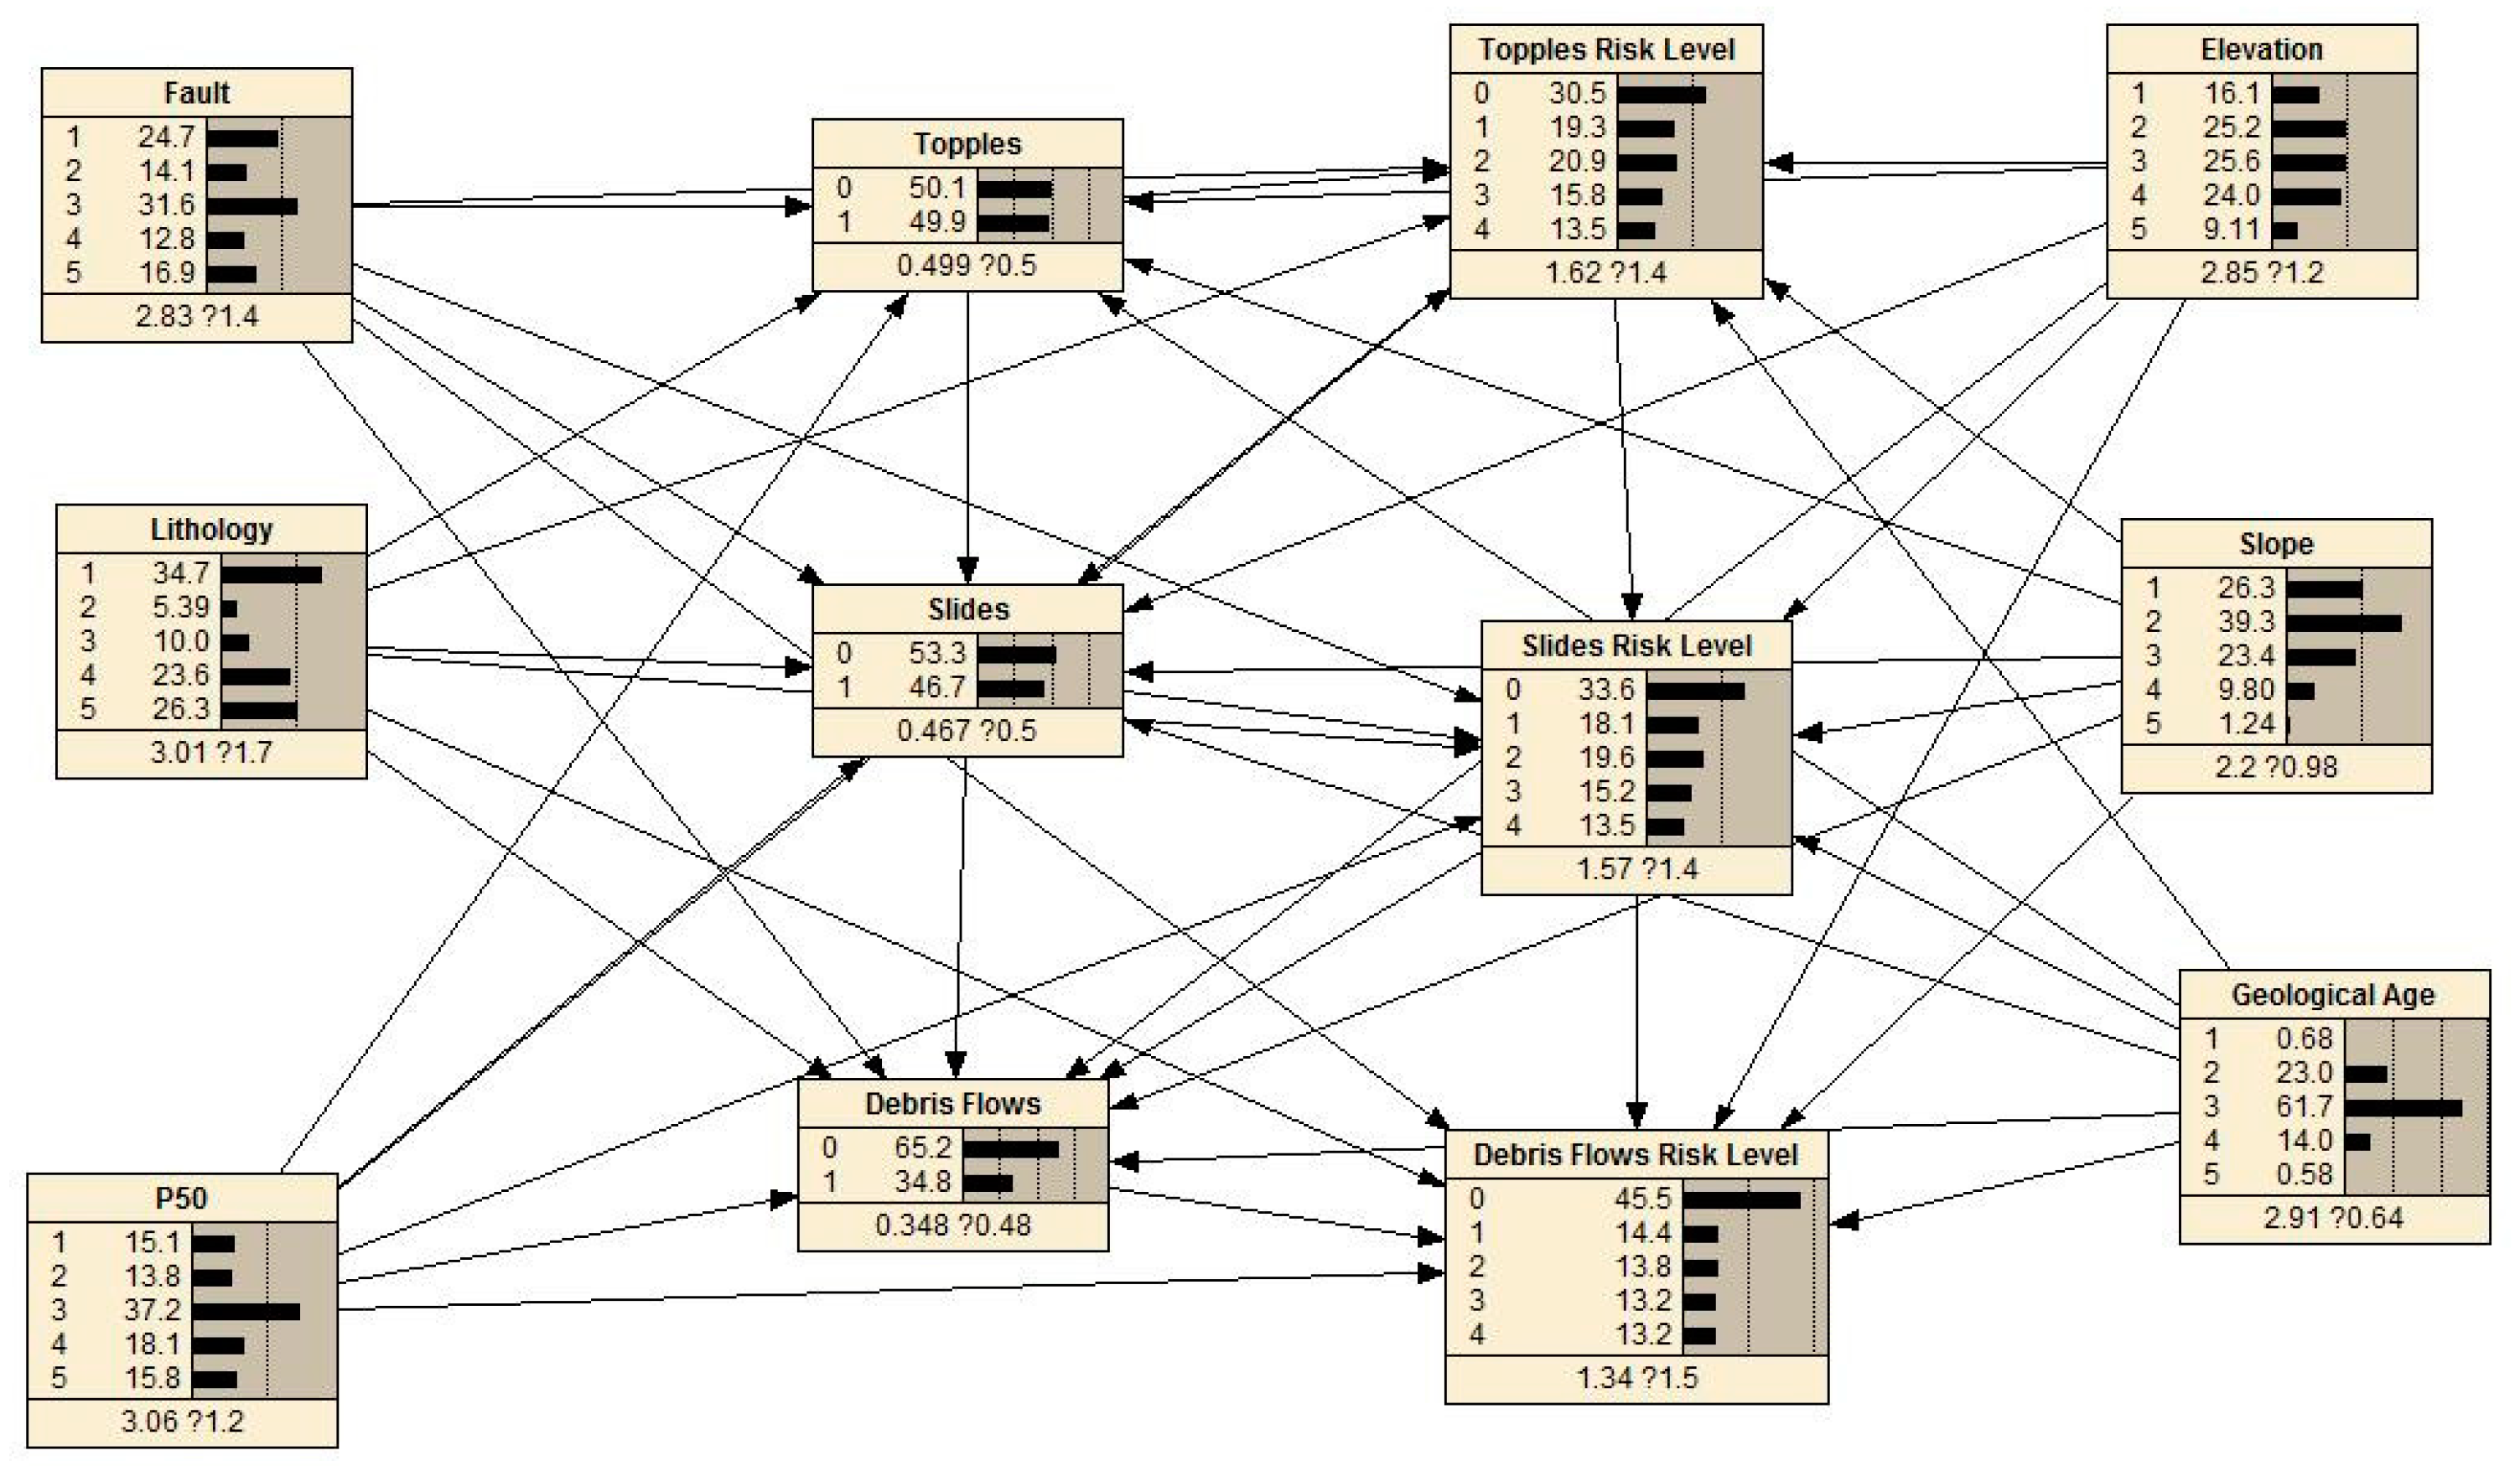
4.3. Results of the BN Model
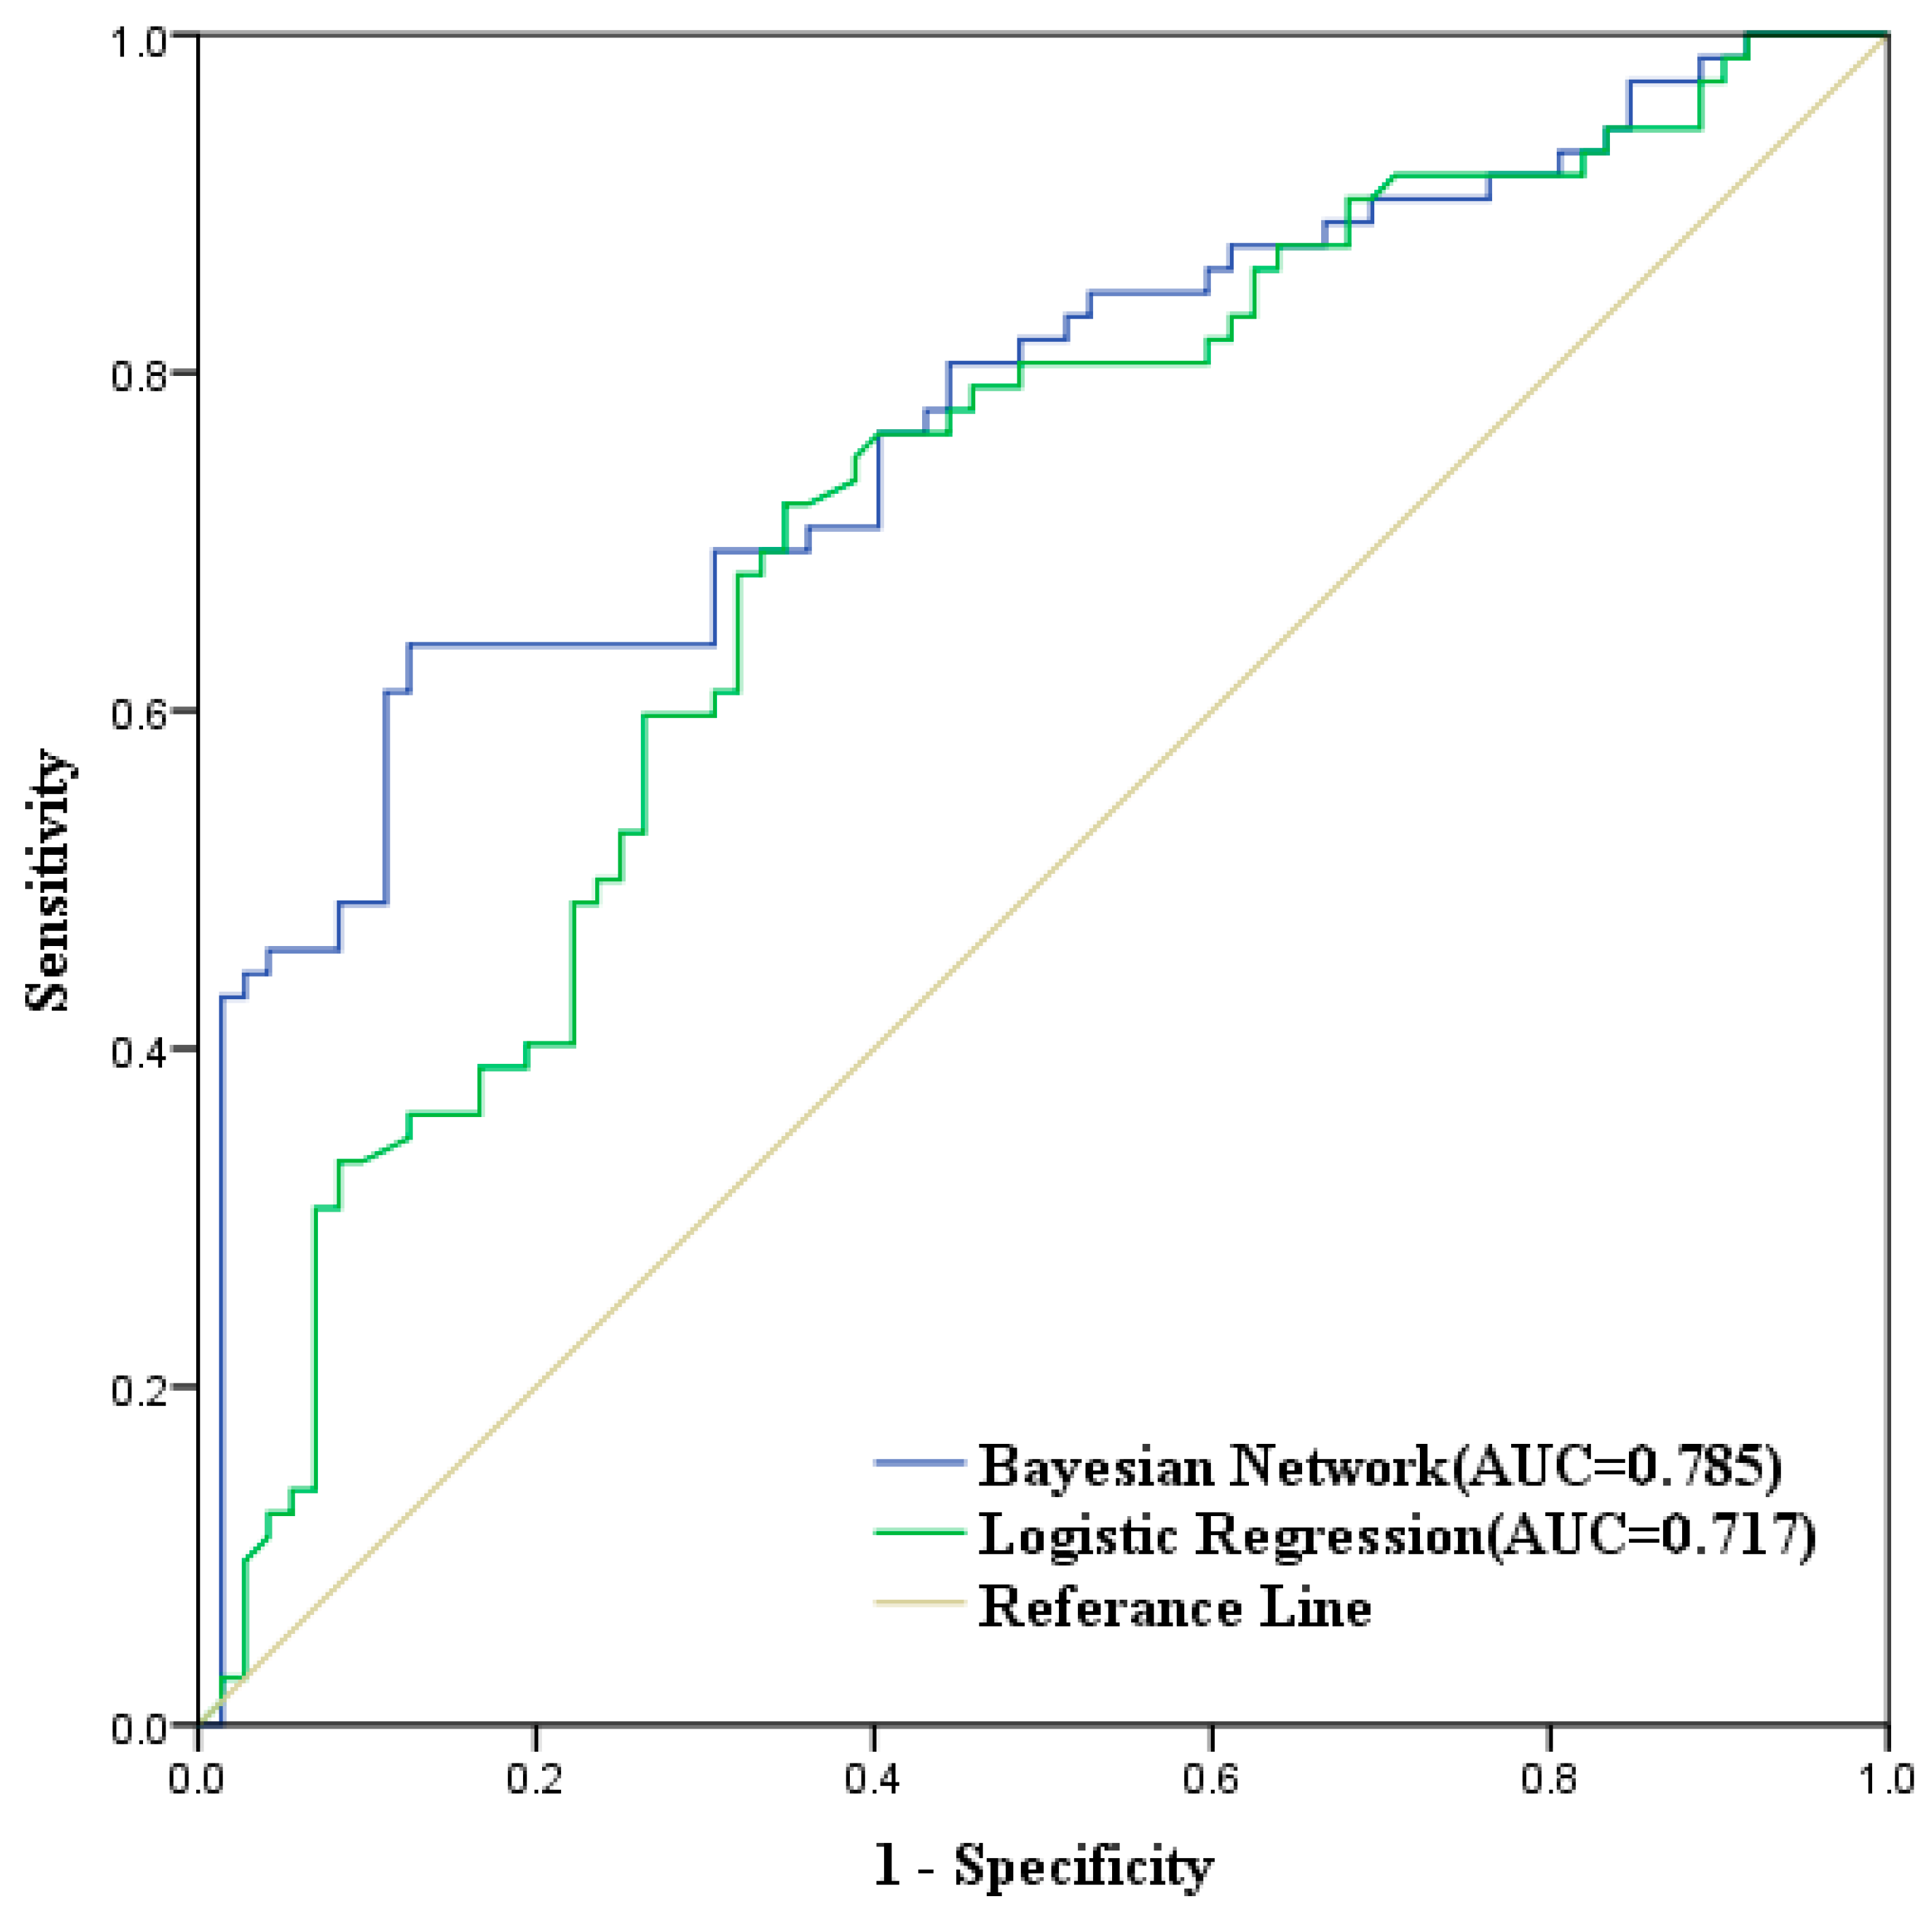
4.4. Preliminary Evaluation of the BN Model
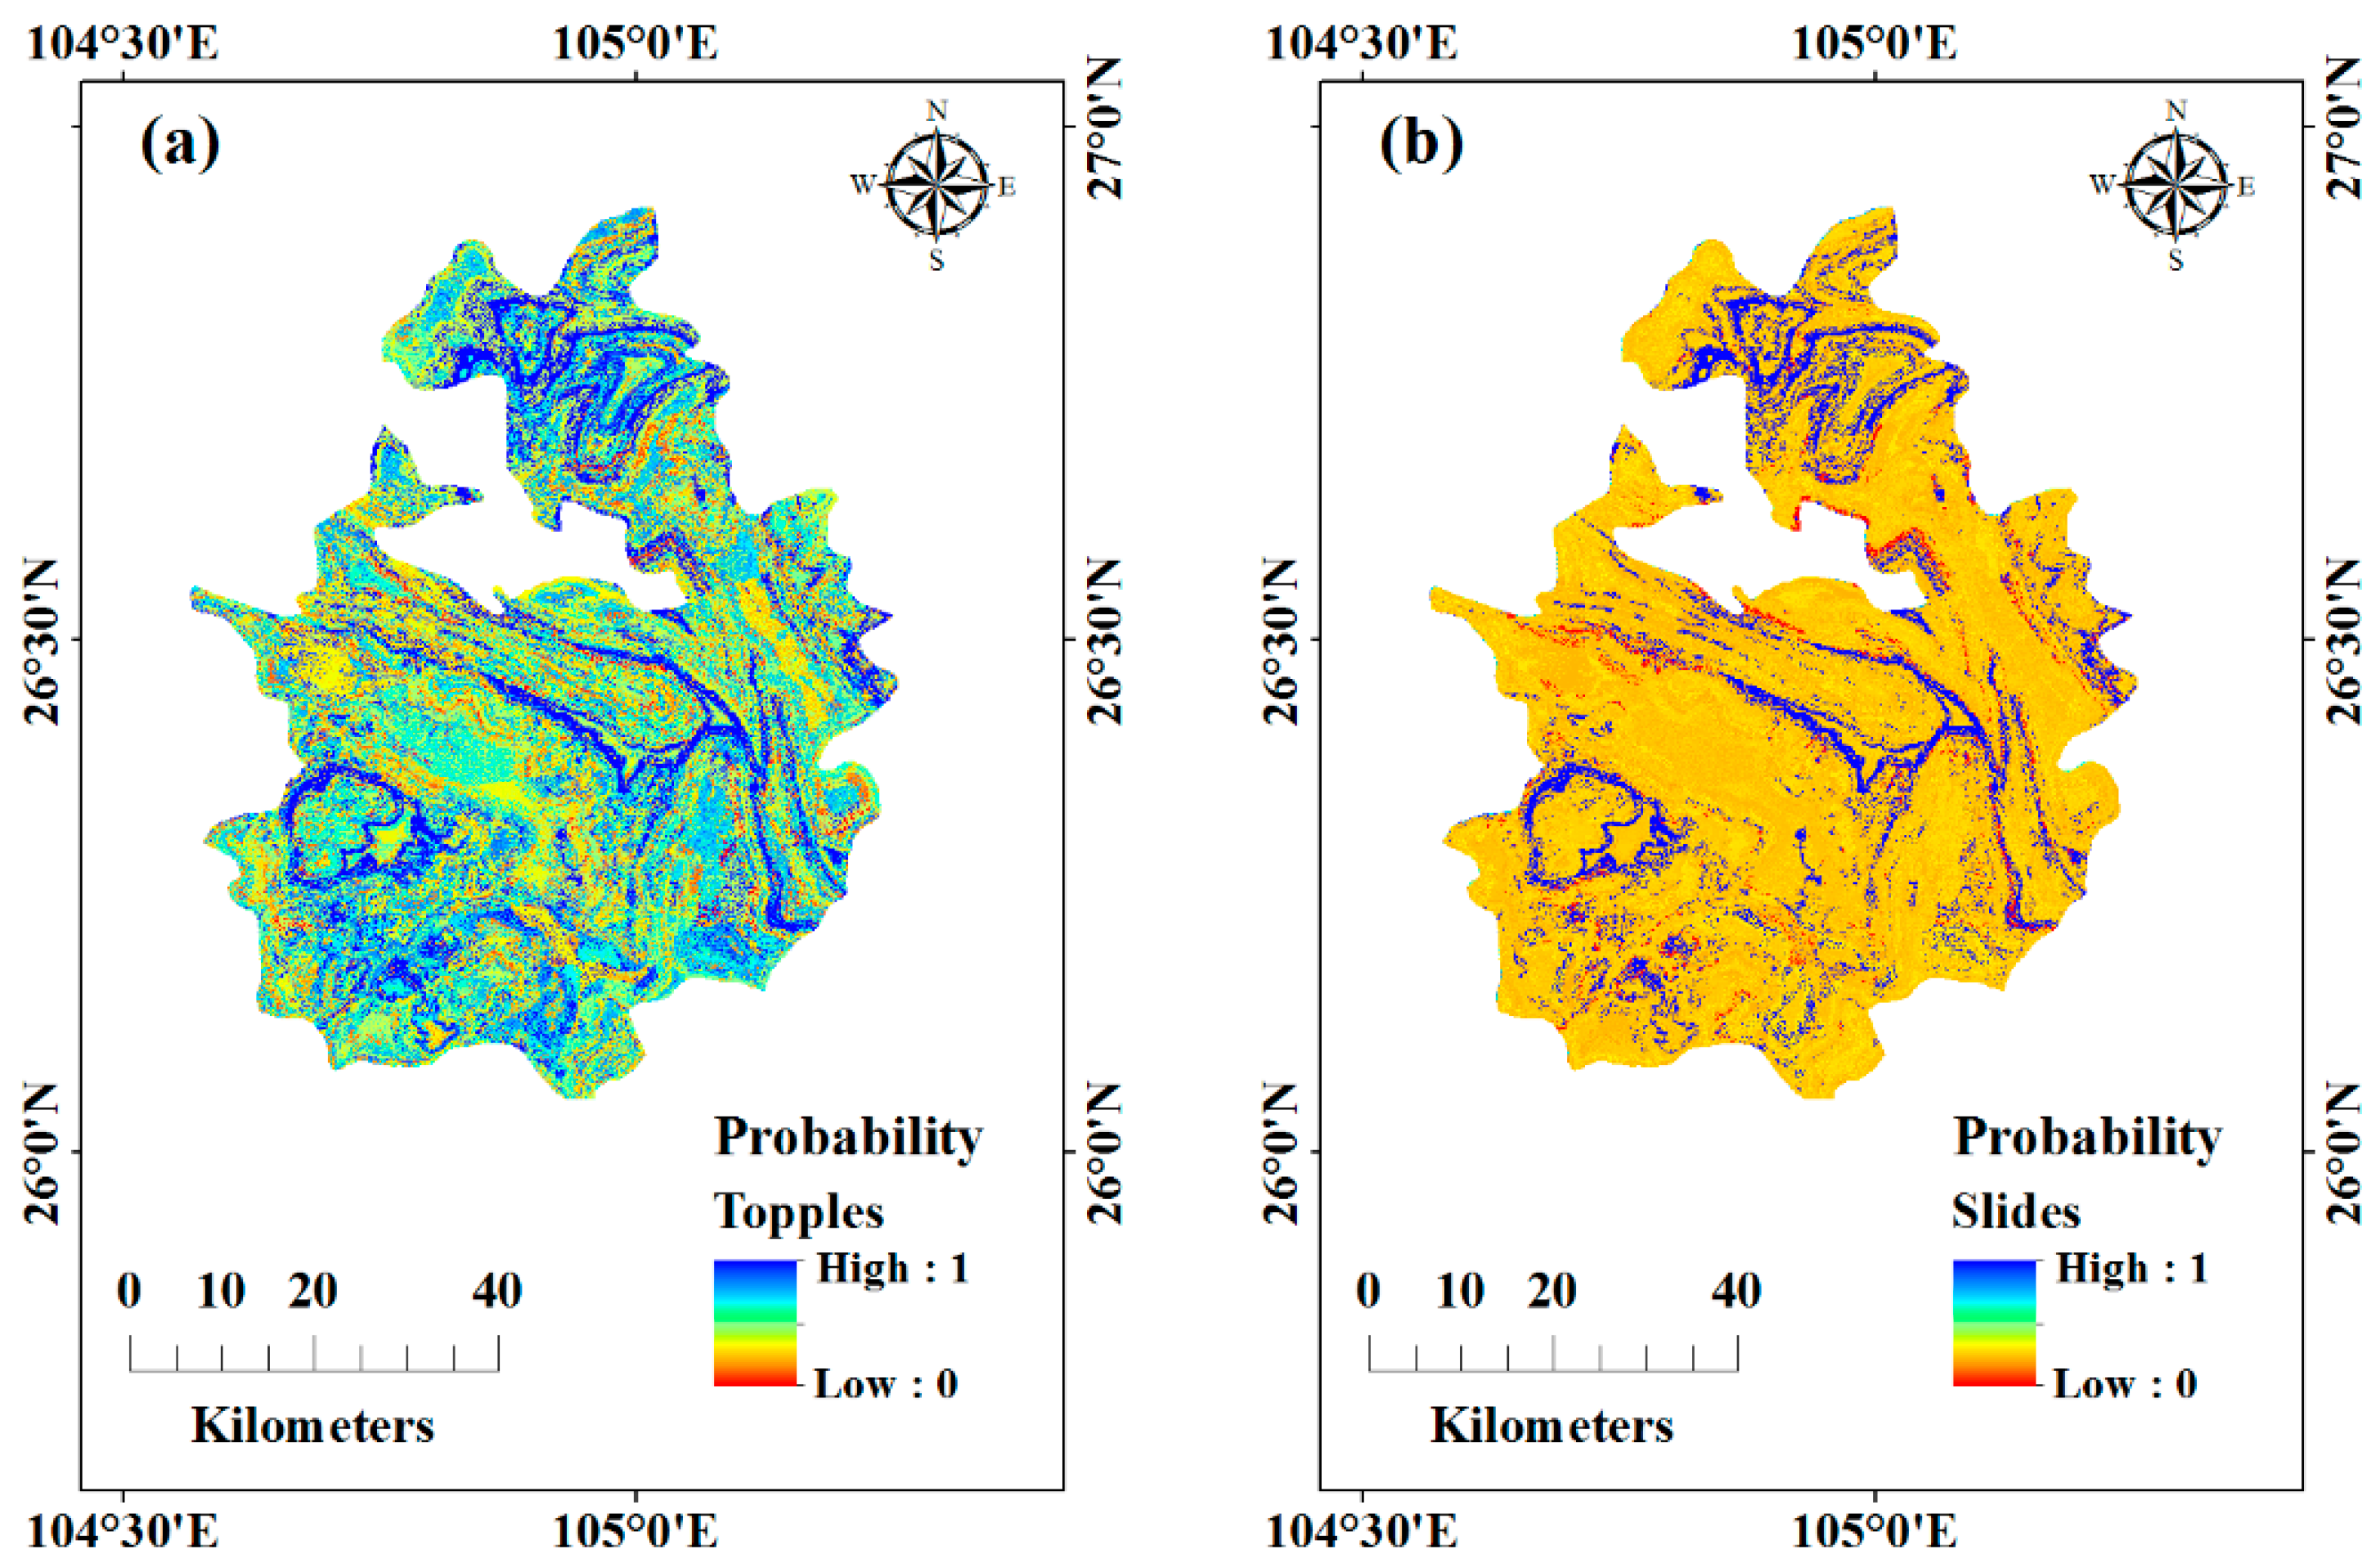
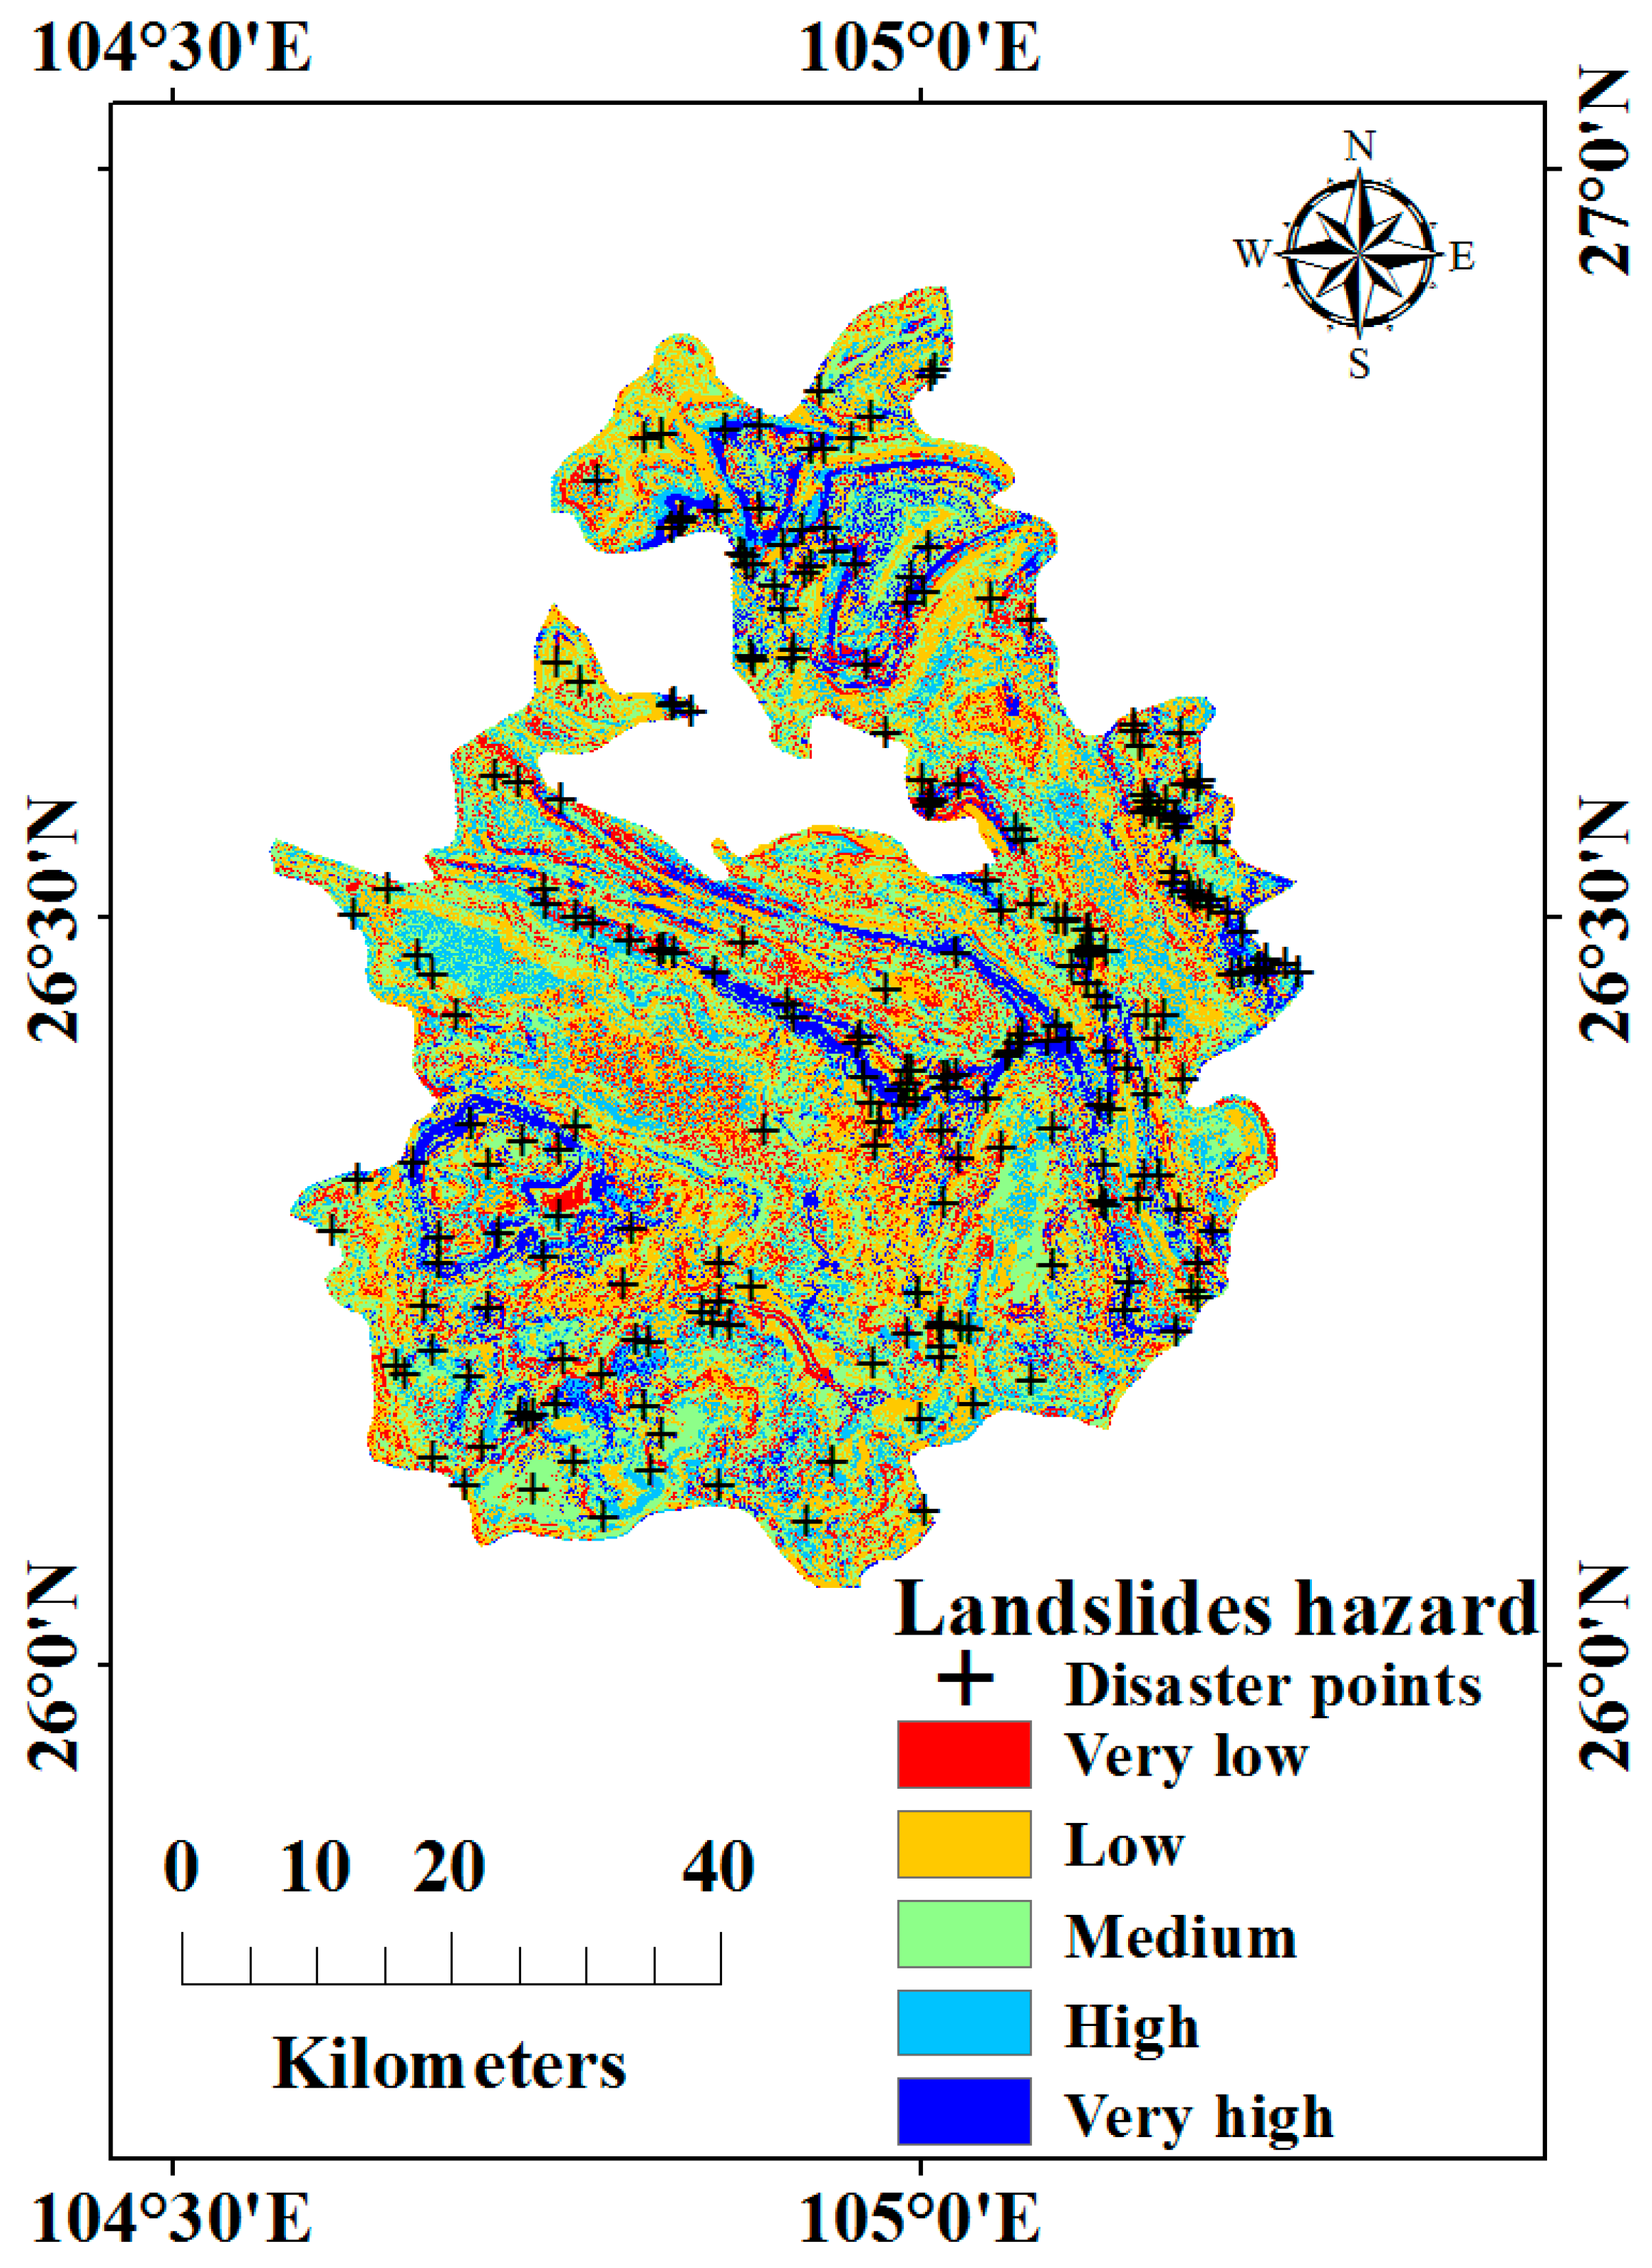
4.5. Landslide Hazard Mapping and Model Evaluation
5. Discussion
6. Conclusions
Author Contributions
Funding
Acknowledgments
Conflicts of Interest
References
- Zhu, A.-X.; Miao, Y.; Yang, L.; Bai, S.; Liu, J.; Hong, H. Comparison of the presence-only method and presence-absence method in landslide susceptibility mapping. Catena 2018, 171, 222–233. [Google Scholar] [CrossRef]
- Petley, D. Global patterns of loss of life from landslides. Geology 2012, 40, 927–930. [Google Scholar] [CrossRef]
- Ministry of Natural Resources of the People’s Republic of China. Available online: http://zd.mlr.gov.cn (accessed on 25 August 2019).
- Haque, U.; Blum, P.; Da Silva, A.P.F.; Andersen, P.; Pilz, J.; Chalov, S.R.; Malet, J.-P.; Auflič, M.J.; Andres, N.; Poyiadji, E.; et al. Fatal landslides in Europe. Landslides 2016, 13, 1545–1554. [Google Scholar] [CrossRef]
- Dai, F.C.; Lee, C.F.; Ngai, Y.Y. Landslide risk assessment and management: An overview. Eng. Geol. 2002, 64, 65–87. [Google Scholar] [CrossRef]
- Golovko, D.; Roessner, S.; Behling, R.; Wetzel, H.-U.; Kleinschmit, B. Evaluation of Remote-Sensing-Based Landslide Inventories for Hazard Assessment in Southern Kyrgyzstan. Remote Sens. 2017, 9, 943. [Google Scholar] [CrossRef]
- Kennedy, I.T.R.; Petley, D.N.; Williams, R.; Murray, V. A Systematic Review of the Health Impacts of Mass Earth Movements (Landslides). PLoS Curr. 2015, 7, 1–24. [Google Scholar] [CrossRef]
- Shi, P.J. Theory on disaster science and disaster dynamics. J. Nat. Disasters 2002, 11, 1–9. [Google Scholar]
- Gao, F.; Zhou, K.; Chen, X.; Luo, X. Disaster Chains induced by Mining and Chain-cutting Disaster Mitigation Technology. Disaster Adv. 2012, 5, 971–975. [Google Scholar]
- Zhou, H.; Wang, X.; Yuan, Y. Risk assessment of disaster chain: Experience from Wenchuan earthquake-induced landslides in China. J. Mt. Sci. 2015, 12, 1169–1180. [Google Scholar] [CrossRef]
- Melillo, M.; Brunetti, M.T.; Peruccacci, S.; Gariano, S.L.; Guzzetti, F. An algorithm for the objective reconstruction of rainfall events responsible for landslides. Landslides 2015, 12, 311–320. [Google Scholar] [CrossRef]
- Lee, M.; Ng, K.; Huang, Y.; Li, W. Rainfall-induced landslides in Hulu Kelang area, Malaysia. Nat. Hazards 2014, 70, 353–375. [Google Scholar] [CrossRef]
- Conte, E.; Troncone, A. A method for the analysis of soil slips triggered by rainfall. Géotechnique 2012, 62, 187–192. [Google Scholar] [CrossRef]
- Guzzetti, F.; Peruccacci, S.; Rossi, M.; Stark, C.P. Rainfall thresholds for the initiation of landslides in central and southern Europe. Meteorol. Atmos. Phys. 2007, 98, 239–267. [Google Scholar] [CrossRef]
- Brunetti, M.T.; Peruccacci, S.; Rossi, M.; Luciani, S.; Valigi, D.; Guzzetti, F. Rainfall thresholds for the possible occurrence of landslides in Italy. Nat. Hazards Earth Syst. Sci. 2010, 10, 447–458. [Google Scholar] [CrossRef]
- Conte, E.; Troncone, A. Analytical Method for Predicting the Mobility of Slow-Moving Landslides owing to Groundwater Fluctuations. J. Geotech. Geoenviron. Eng. 2011, 137, 777–784. [Google Scholar] [CrossRef]
- Conte, E.; Troncone, A. Stability analysis of infinite clayey slopes subjected to pore pressure changes. Géotechnique 2012, 62, 87–91. [Google Scholar] [CrossRef]
- Yi, Y.; Zhang, Z.; Zhang, W.; Xu, Q.; Deng, C.; Li, Q. GIS-based earthquake-triggered-landslide susceptibility mapping with an integrated weighted index model in Jiuzhaigou region of Sichuan Province, China. Nat. Hazards Earth Syst. Sci. 2019, 19, 1973–1988. [Google Scholar] [CrossRef]
- Wu, C. Landslide Susceptibility Based on Extreme Rainfall-Induced Landslide Inventories and the Following Landslide Evolution. Water 2019, 11, 2609. [Google Scholar] [CrossRef]
- Jebur, M.N.; Pradhan, B.; Tehrany, M.S. Optimization of landslide conditioning factors using very high-resolution airborne laser scanning (LiDAR) data at catchment scale. Remote Sens. Environ. 2014, 152, 150–165. [Google Scholar] [CrossRef]
- Yang, J.; Song, C.; Yang, Y.; Xu, C.; Guo, F.; Xie, L. New method for landslide susceptibility mapping supported by spatial logistic regression and GeoDetector: A case study of Duwen Highway Basin, Sichuan Province, China. Geomorphology 2019, 324, 62–71. [Google Scholar] [CrossRef]
- Pham, B.T.; Bui, D.T.; Pourghasemi, H.R.; Indra, P.; Dholakia, M.B. Landslide susceptibility assesssment in the Uttarakhand area (India) using GIS: A comparison study of prediction capability of naïve bayes, multilayer perceptron neural networks, and functional trees methods. Theor. Appl. Clim. 2017, 128, 255–273. [Google Scholar] [CrossRef]
- Mao, Y.; Zhang, M.; Sun, P.; Wang, G. Landslide susceptibility assessment using uncertain decision tree model in loess areas. Environ. Earth Sci. 2017, 76, 752. [Google Scholar] [CrossRef]
- Huang, Y.; Zhao, L. Review on landslide susceptibility mapping using support vector machines. Catena 2018, 165, 520–529. [Google Scholar] [CrossRef]
- Dou, J.; Chang, K.-T.; Chen, S.; Yunus, A.P.; Liu, J.-K.; Xia, H.; Zhu, Z. Automatic Case-Based Reasoning Approach for Landslide Detection: Integration of Object-Oriented Image Analysis and a Genetic Algorithm. Remote Sens. 2015, 7, 4318–4342. [Google Scholar] [CrossRef]
- Dou, J.; Yunus, A.P.; Bui, D.T.; Merghadi, A.; Sahana, M.; Zhu, Z.; Chen, C.-W.; Khosravi, K.; Yang, Y.; Pham, B.T. Assessment of advanced random forest and decision tree algorithms for modeling rainfall-induced landslide susceptibility in the Izu-Oshima Volcanic Island, Japan. Sci. Total Environ. 2019, 662, 332–346. [Google Scholar] [CrossRef]
- Wang, Y.; Wu, X.; Chen, Z.; Ren, F.; Feng, L.; Du, Q. Optimizing the Predictive Ability of Machine Learning Methods for Landslide Susceptibility Mapping Using SMOTE for Lishui City in Zhejiang Province, China. Int. J. Environ. Res. Public Health 2019, 16, 368. [Google Scholar] [CrossRef]
- Gokceoglu, C. Combining landslide susceptibility maps obtained from frequency ratio, logistic regression, and artificial neural network models using ASTER images and GIS. Eng. Geol. 2012, 129, 104–105. [Google Scholar] [CrossRef]
- Wang, Y.; Fang, Z.; Hong, H. Comparison of convolutional neural networks for landslide susceptibility mapping in Yanshan County, China. Sci. Total Environ. 2019, 666, 975–993. [Google Scholar] [CrossRef] [PubMed]
- Wang, Y.; Fang, Z.; Wang, M.; Peng, L.; Hong, H. Comparative study of landslide susceptibility mapping with different recurrent neural networks. Comput. Geosci. 2020, 138, 104445. [Google Scholar] [CrossRef]
- Wang, J.; Gu, X.; Huang, T. Using Bayesian networks in analyzing powerful earthquake disaster chains. Nat. Hazards 2013, 68, 509–527. [Google Scholar] [CrossRef]
- Luo, W.; Liu, C.-C. Innovative landslide susceptibility mapping supported by geomorphon and geographical detector methods. Landslides 2018, 15, 465–474. [Google Scholar] [CrossRef]
- Guizhou Provincial Bureau of Statistics. Available online: http://stjj.guizhou.gov.cn (accessed on 25 August 2019).
- China Geological Survey. Available online: http://www.cgs.gov.cn (accessed on 25 August 2019).
- Zhao, W.; Wang, R.; Liu, X.; Ju, N.; Xie, M. Field survey of a catastrophic high-speed long-runout landslide in Jichang Town, Shuicheng County, Guizhou, China, on July 23. Landslides 2020, 17, 1415–1427. [Google Scholar] [CrossRef]
- Dou, J.; Yunus, A.P.; Merghadi, A.; Shirzadi, A.; Nguyen, H.; Hussain, Y.; Avtar, R.; Chen, Y.; Pham, B.T.; Yamagishi, H. Different sampling strategies for predicting landslide susceptibilities are deemed less consequential with deep learning. Sci. Total Environ. 2020, 720, 137320. [Google Scholar] [CrossRef]
- China Meteorological Information Center. Available online: http://data.cma.cn (accessed on 31 August 2019).
- Reichenbach, P.; Rossi, M.; Malamud, B.D.; Mihir, M.; Guzzetti, F. A review of statistically-based landslide susceptibility models. Earth Sci. Rev. 2018, 180, 60–91. [Google Scholar] [CrossRef]
- Lazzari, M.; Piccarreta, M. Landslide Disasters Triggered by Extreme Rainfall Events: The Case of Montescaglioso (Basilicata, Southern Italy). Geosciences 2018, 8, 377. [Google Scholar] [CrossRef]
- Lazzari, M.; Piccarreta, M.; Capolongo, D. Landslide Triggering and Local Rainfall Thresholds in Bradanic Foredeep, Basilicata Region (Southern Italy). In Landslide Sci and Practice; Springer: Berlin/Heidelberg, Germany, 2013; pp. 671–677. [Google Scholar]
- Geospatial Data Cloud Site, Chinese Academy of Sciences. Available online: http://www.gscloud.cn (accessed on 31 August 2019).
- Abdollahi, S.; Pourghasemi, H.R.; Ghanbarian, G.; Safaeian, R. Prioritization of effective factors in the occurrence of land subsidence and its susceptibility mapping using an SVM model and their different kernel functions. Bull. Int. Assoc. Eng. Geol. 2019, 78, 4017–4034. [Google Scholar] [CrossRef]
- Pham, B.T.; Bui, D.; Prakash, I.; Dholakia, M.B. Evaluation of predictive ability of support vector machines and naive Bayes trees methods for spatial prediction of landslides in Uttarakhand state (India) using GIS. J. Geomat. 2016, 10, 71–79. [Google Scholar]
- Pham, B.T.; Bui, D.T.; Prakash, I.; Dholakia, M.B. Rotation forest fuzzy rule-based classifier ensemble for spatial prediction of landslides using GIS. Nat. Hazards 2016, 83, 97–127. [Google Scholar] [CrossRef]
- Tong, S.; Zhang, J.; Ha, S.; Lai, Q.; Ma, Q. Dynamics of Fractional Vegetation Coverage and Its Relationship with Climate and Human Activities in Inner Mongolia, China. Remote Sens. 2016, 8, 776. [Google Scholar] [CrossRef]
- U.S. Geological Survey. Available online: https://earthexplorer.usgs.gov (accessed on 31 August 2019).
- Wang, J.; Zhang, T.; Fu, B. A measure of spatial stratified heterogeneity. Ecol. Indic. 2016, 67, 250–256. [Google Scholar] [CrossRef]
- Wang, J.F.; Xu, C.D. Geodetector: Principle and prospective. Acta Geogr. Sin. 2017, 72, 116–134. [Google Scholar]
- Wang, J.; Li, X.; Christakos, G.; Liao, Y.; Zhang, T.; Gu, X.; Zheng, X. Geographical Detectors-Based Health Risk Assessment and its Application in the Neural Tube Defects Study of the Heshun Region, China. Int. J. Geogr. Inf. Sci. 2010, 24, 107–127. [Google Scholar] [CrossRef]
- Geodetector Software for Measure and Attribution of Stratified Heterogeneity. Available online: http://www.geodetector.cn (accessed on 31 August 2019).
- Song, Y.; Gong, J.; Gao, S.; Wang, D.; Cui, T.; Li, Y.; Wei, B. Susceptibility assessment of earthquake-induced landslides using Bayesian network: A case study in Beichuan, China. Comput. Geosci. 2012, 42, 189–199. [Google Scholar] [CrossRef]
- Laitila, P.; Virtanen, K. Improving Construction of Conditional Probability Tables for Ranked Nodes in Bayesian Networks. IEEE Trans. Knowl. Data Eng. 2016, 28, 1691–1705. [Google Scholar] [CrossRef]
- Hu, J.; Liu, H. Bayesian network models for probabilistic evaluation of earthquake-induced liquefaction based on CPT and Vs databases. Eng. Geol. 2019, 254, 76–88. [Google Scholar] [CrossRef]
- Wu, J.; Hu, Z.; Chen, J.; Li, Z. Risk Assessment of Underground Subway Stations to Fire Disasters Using Bayesian Network. Sustainability 2018, 10, 3810. [Google Scholar] [CrossRef]
- Norsys Software Corp. Available online: https://www.norsys.com (accessed on 31 August 2019).
- Han, L.; Zhang, J.; Zhang, Y.; Ma, Q.; Alu, S.; Lang, Q. Hazard Assessment of Earthquake Disaster Chains Based on a Bayesian Network Model and ArcGIS. ISPRS Int. J. Geo Inf. 2019, 8, 210. [Google Scholar] [CrossRef]
- Shen, X.; Cao, L. Tree-Species Classification in Subtropical Forests Using Airborne Hyperspectral and LiDAR Data. Remote Sens. 2017, 9, 1180. [Google Scholar] [CrossRef]
- Li, Y.; Xia, J.; Zhang, S.; Yan, J.; Ai, X.; Dai, K. An efficient intrusion detection system based on support vector machines and gradually feature removal method. Expert Syst. Appl. 2012, 39, 424–430. [Google Scholar] [CrossRef]
- Fawcett, T. An introduction to ROC analysis. Pattern Recognit. Lett. 2006, 27, 861–874. [Google Scholar] [CrossRef]
- Nhu, V.-H.; Hoang, N.-D.; Nguyen, H.; Ngo, P.-T.T.; Bui, T.T.; Hoa, P.; Samui, P.; Bui, D.T. Effectiveness assessment of Keras based deep learning with different robust optimization algorithms for shallow landslide susceptibility mapping at tropical area. Catena 2020, 188, 104458. [Google Scholar] [CrossRef]
- Alatorre-Cejudo, L.C.; Sánchez-Andrés, R.; Cirujano, S.; Beguería, S.; Sánchez-Carrillo, S. Identification of Mangrove Areas by Remote Sensing: The ROC Curve Technique Applied to the Northwestern Mexico Coastal Zone Using Landsat Imagery. Remote Sens. 2011, 3, 1568–1583. [Google Scholar] [CrossRef]
- Tsangaratos, P.; Ilia, I.; Hong, H.; Chen, W.; Xu, C. Applying Information Theory and GIS-based quantitative methods to produce landslide susceptibility maps in Nancheng County, China. Landslides 2016, 14, 1091–1111. [Google Scholar] [CrossRef]
- Doyuran, V. A comparison of the GIS based landslide susceptibility assessment methods: Multivariate versus bivariate. Environ. Geol. 2004, 45, 665–679. [Google Scholar] [CrossRef]
- Marcot, B.G.; Steventon, J.D.; Sutherland, G.D.; McCann, R.K. Guidelines for developing and updating Bayesian belief networks applied to ecological modeling and conservation. Can. J. For. Res. 2006, 36, 3063–3074. [Google Scholar] [CrossRef]
- Pradhan, B.; Lee, S. Landslide susceptibility assessment and factor effect analysis: Backpropagation artificial neural networks and their comparison with frequency ratio and bivariate logistic regression modelling. Environ. Model. Softw. 2010, 25, 747–759. [Google Scholar] [CrossRef]
- Chen, W.; Panahi, M.; Tsangaratos, P.; Shahabi, H.; Ilia, I.; Panahi, S.; Li, S.; Jaafari, A.; Ahmed, B. Applying population-based evolutionary algorithms and a neuro-fuzzy system for modeling landslide susceptibility. Catena 2019, 172, 212–231. [Google Scholar] [CrossRef]
- Han, L.; Zhang, J.; Zhang, Y.; Lang, Q. Applying a Series and Parallel Model and a Bayesian Networks Model to Produce Disaster Chain Susceptibility Maps in the Changbai Mountain area, China. Water 2019, 11, 2144. [Google Scholar] [CrossRef]


| Extreme Rainfall Factors | 24 h Rainfall | Rainfall Intensity Grade |
|---|---|---|
| P10 | >10 mm | Above moderate rain |
| P25 | >25 mm | Above heavy rain |
| P50 | >50 mm | Above rainstorm |
| P100 | >100 mm | Above heavy rainstorm |
| P250 | >250 mm | Above torrential rainstorm |
| Name | Data Structure | Variable Type | Data Description |
|---|---|---|---|
| Elevation | Raster | Continuous | Height above sea level |
| Slope | Raster | Continuous | Extracted from DEM |
| Aspect | Raster | Discrete | Extracted from DEM |
| Plan curvature | Raster | Discrete | Extracted from DEM |
| Profile curvature | Raster | Discrete | Extracted from DEM |
| Lithology | Polygon | Discrete | Digitized from geological map |
| Geological age | Polygon | Discrete | Digitized from geological map |
| Faults | Line | Continuous | Distance to faults |
| Rivers | Line | Continuous | Distance to rivers |
| Roads | Line | Continuous | Distance to roads |
| NDVI | Raster | Continuous | The vegetation of land cover |
| Training Set | Test Set | |
|---|---|---|
| Topples | 168 | 72 |
| Slides | 136 | 59 |
| Debris flows | 29 | 11 |
| Non-topples | 168 | 72 |
| Non-slides | 200 | 85 |
| Non-debris flows | 307 | 133 |
| Topples | |||||||||
|---|---|---|---|---|---|---|---|---|---|
| Predicted | Actual | Error rate | 0.1806 | ||||||
| Logarithmic loss | 0.5180 | ||||||||
| Yes | No | Quadratic loss | 0.2508 | ||||||
| 57 | 15 | Yes | Spherical payoff | 0.8589 | |||||
| 11 | 61 | No | Area under ROC | 0.9105 | |||||
| Topples Risk Level | |||||||||
| Predicted | Actual | Error rate | 0.2639 | ||||||
| Very Low | Low | Medium | High | Very High | Logarithmic loss | 0.7157 | |||
| 64 | 4 | 2 | 2 | 0 | Very Low | ||||
| 8 | 21 | 3 | 1 | 0 | Low | Quadratic loss | 0.3522 | ||
| 0 | 3 | 15 | 1 | 0 | Medium | ||||
| 2 | 1 | 2 | 5 | 1 | High | Spherical payoff | 0.7914 | ||
| 0 | 0 | 0 | 0 | 1 | Very High | ||||
| Slides | |||||||||
| Predicted | Actual | Error rate | 0.1944 | ||||||
| Logarithmic loss | 0.6005 | ||||||||
| Yes | No | Quadratic loss | 0.2870 | ||||||
| 40 | 19 | Yes | Spherical payoff | 0.8407 | |||||
| 9 | 76 | No | Area under ROC | 0.8791 | |||||
| Slides Risk Level | |||||||||
| Predicted | Actual | Error rate | 0.2639 | ||||||
| Very Low | Low | Medium | High | Very High | Logarithmic loss | 0.7561 | |||
| 78 | 3 | 2 | 1 | 1 | Very Low | ||||
| 9 | 16 | 2 | 1 | 0 | Low | Quadratic loss | 0.3598 | ||
| 9 | 3 | 9 | 1 | 0 | Medium | ||||
| 4 | 0 | 2 | 2 | 0 | High | Spherical payoff | 0.7911 | ||
| 0 | 0 | 0 | 0 | 1 | Very High | ||||
| Debris Flows | |||||||||
| Predicted | Actual | Error rate | 0.0625 | ||||||
| Logarithmic loss | 0.2069 | ||||||||
| Yes | No | Quadratic loss | 0.1055 | ||||||
| 4 | 7 | Yes | Spherical payoff | 0.9425 | |||||
| 2 | 131 | No | Area under ROC | 0.8906 | |||||
| Debris Flows Risk Level | |||||||||
| Predicted | Actual | Error rate | 0.0625 | ||||||
| Very Low | Low | Medium | High | Very High | Logarithmic loss | 0.2098 | |||
| 131 | 1 | 1 | 0 | 0 | Very Low | ||||
| 7 | 3 | 0 | 2 | 0 | Low | Quadratic loss | 0.1057 | ||
| 0 | 0 | 1 | 0 | 0 | Medium | ||||
| 0 | 0 | 0 | 0 | 0 | High | Spherical payoff | 0.9425 | ||
| 0 | 0 | 0 | 0 | 0 | Very High | ||||
| P10 | P25 | P50 | P100 | P250 | Elevation | Slope | Aspect | Plan Curvature | Profile Curvature | Lithology | Geological Age | Faults | Rivers | Roads | NDVI | |
|---|---|---|---|---|---|---|---|---|---|---|---|---|---|---|---|---|
| P10 | 0.0205 | |||||||||||||||
| P25 | 0.0536 | 0.0132 | ||||||||||||||
| P50 | 0.0674 | 0.0397 | 0.0281 | |||||||||||||
| P100 | 0.0609 | 0.0225 | 0.0388 | 0.0197 | ||||||||||||
| P250 | 0.0254 | 0.0482 | 0.0704 | 0.0563 | 0.0146 | |||||||||||
| Elevation | 0.1536 | 0.1583 | 0.1742 | 0.1626 | 0.1430 | 0.1142 | ||||||||||
| Slope | 0.0836 | 0.0764 | 0.0877 | 0.0828 | 0.0758 | 0.1768 | 0.0576 | |||||||||
| Aspect | 0.0447 | 0.0376 | 0.0517 | 0.0416 | 0.0404 | 0.1265 | 0.0619 | 0.0055 | ||||||||
| Plan curvature | 0.0472 | 0.0424 | 0.0688 | 0.0453 | 0.0630 | 0.1385 | 0.0760 | 0.0327 | 0.0158 | |||||||
| Profile curvature | 0.0523 | 0.0366 | 0.0595 | 0.0479 | 0.0501 | 0.1247 | 0.0746 | 0.0226 | 0.0308 | 0.0125 | ||||||
| Lithology | 0.1106 | 0.1115 | 0.1258 | 0.1123 | 0.1098 | 0.1546 | 0.1261 | 0.0966 | 0.0950 | 0.0905 | 0.0653 | |||||
| Geological Age | 0.0527 | 0.0479 | 0.0602 | 0.0641 | 0.0643 | 0.1343 | 0.0880 | 0.0469 | 0.0530 | 0.0497 | 0.1108 | 0.0294 | ||||
| Faults | 0.0934 | 0.1033 | 0.1154 | 0.1084 | 0.0955 | 0.1647 | 0.1095 | 0.0805 | 0.0880 | 0.0851 | 0.0935 | 0.0801 | 0.0496 | |||
| Rivers | 0.0468 | 0.0403 | 0.0570 | 0.0534 | 0.0416 | 0.1429 | 0.0691 | 0.0279 | 0.0352 | 0.0366 | 0.0819 | 0.0397 | 0.0716 | 0.0012 | ||
| Roads | 0.0596 | 0.0419 | 0.0592 | 0.0492 | 0.0445 | 0.1362 | 0.0769 | 0.0472 | 0.0474 | 0.0477 | 0.0961 | 0.0516 | 0.0941 | 0.0303 | 0.0158 | |
| NDVI | 0.0537 | 0.0442 | 0.0623 | 0.0482 | 0.0452 | 0.1551 | 0.0720 | 0.0476 | 0.0456 | 0.0619 | 0.0913 | 0.0493 | 0.0794 | 0.0206 | 0.0377 | 0.0099 |
| Evaluation Methods | Test Data Set | Results | ||
|---|---|---|---|---|
| OA | Predicted | Actual | 0.722 | |
| Yes | No | |||
| MCC | 54 (TP) | 18 (FN) | Yes | 0.445 |
| 22 (FP) | 50 (TN) | No | ||
| SCAI | Hazard levels | (%) | (%) | |
| Very low | 13.84 | 7.08 | 1.955 | |
| Low | 28.36 | 17.5 | 1.62 | |
| Medium | 30.56 | 22.92 | 1.333 | |
| High | 17.32 | 19.17 | 0.903 | |
| Very high | 9.92 | 33.33 | 0.298 | |
© 2020 by the authors. Licensee MDPI, Basel, Switzerland. This article is an open access article distributed under the terms and conditions of the Creative Commons Attribution (CC BY) license (http://creativecommons.org/licenses/by/4.0/).
Share and Cite
Rong, G.; Li, K.; Han, L.; Alu, S.; Zhang, J.; Zhang, Y. Hazard Mapping of the Rainfall–Landslides Disaster Chain Based on GeoDetector and Bayesian Network Models in Shuicheng County, China. Water 2020, 12, 2572. https://doi.org/10.3390/w12092572
Rong G, Li K, Han L, Alu S, Zhang J, Zhang Y. Hazard Mapping of the Rainfall–Landslides Disaster Chain Based on GeoDetector and Bayesian Network Models in Shuicheng County, China. Water. 2020; 12(9):2572. https://doi.org/10.3390/w12092572
Chicago/Turabian StyleRong, Guangzhi, Kaiwei Li, Lina Han, Si Alu, Jiquan Zhang, and Yichen Zhang. 2020. "Hazard Mapping of the Rainfall–Landslides Disaster Chain Based on GeoDetector and Bayesian Network Models in Shuicheng County, China" Water 12, no. 9: 2572. https://doi.org/10.3390/w12092572
APA StyleRong, G., Li, K., Han, L., Alu, S., Zhang, J., & Zhang, Y. (2020). Hazard Mapping of the Rainfall–Landslides Disaster Chain Based on GeoDetector and Bayesian Network Models in Shuicheng County, China. Water, 12(9), 2572. https://doi.org/10.3390/w12092572