A Nonlinear Creep Damage Model Considering the Effect of Dry-Wet Cycles of Rocks on Reservoir Bank Slopes


Abstract
1. Introduction
2. Triaxial Creep Test to Investigate the Effect of Dry–Wet Cycling on Creep
2.1. Preparation of Test Rock Specimens
2.2. Experimental Procedure
2.3. Test Results
3. Establishment of Creep Model
3.1. One-Dimensional Creep Equations of the NBVP Model
- (1)
- When ,
- (2)
- When , ,
- (3)
- When , ,
3.2. Three-Dimensional Creep Equations of the NBVP Model
3.3. Analysis of the Damage Law under the Effect of Saturation–Dehydration Cycles
3.4. A Nonlinear Creep Damage Model for Rocks Considering the Effect of Saturation–Dehydration Cycles
- (1)
- When ,
- (2)
- When and ,
- (3)
- When and ,
4. Discussion
4.1. Verification of the DNBVP Model
- (1)
- When the deviatoric stress is less than the rock yield strength, the model has four rheological parameters, namely, G1, G2, η1 and η2. First, according to the rheological test data, let t = 0, and the instantaneous shear modulus G1 can be determined according to Equation (9). Then, calculate the other three rheological parameters, G2, η1 and η2, by fitting the rheological test data.
- (2)
- When the deviatoric stress is greater than the rock yield strength, and , there are five corresponding rheological parameters, namely, η1, η2, η3, G1 and G2, which can be calculated by Equation (10) and the fitting of test curves.
- (3)
- When the deviatoric stress is greater than the rock yield strength, and , there are six corresponding rheological parameters, namely, η1, η2, η3, G1, G2 and m. As can be seen in Equation (11), the six rheological parameters should be determined in order to solve the equation. The rheological curves are fitted according to Step (2) when the t value is below tp, and then the corresponding parameters η1, η2, G1 and G2 can be calculated; parameters η3 and m can be given by plugging the above parameters into Equation (11).
4.2. Analysis of Sensitivity of the DNBVP Model
4.3. Implementation of the DNBVP Model in FLAC3D
- (1)
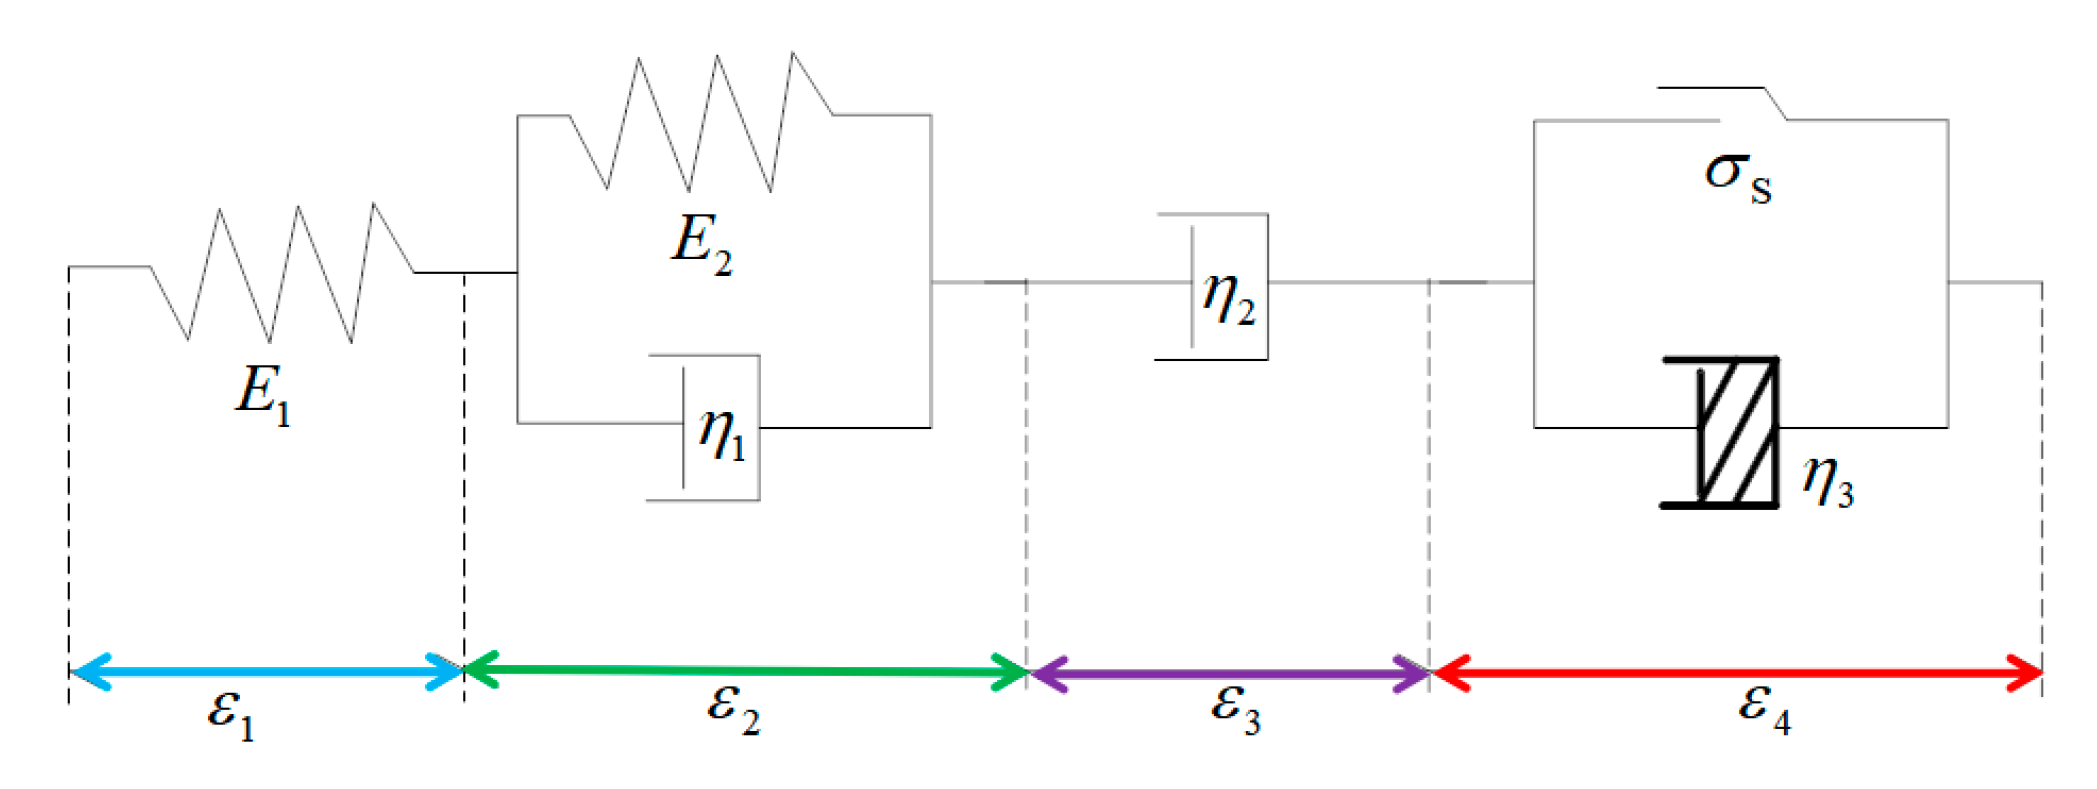
- When , the three-dimensional central difference expression for the new stress deviator iswhereis the new strain deviator of the rheological element of the second part in Figure 5.
- (2)
- When and , the three-dimensional central difference expression for the new stress deviator isAt this moment, the central difference scheme of spherical stress of the model iswhere and are the new and old spherical stresses within a certain time increment, respectively. is the spherical stress increment within the time step .
- (3)
- When and , the three-dimensional central difference expression for the new stress deviator isAt this moment, the central difference scheme of spherical stress of the model is
4.4. Limitations of the DNBVP Model
5. Conclusions
- (i)
- At the same level of deviatoric stress, the strain after stabilization of the creep curve increases as the number of DW cycles increases. When the number of DW cycle is small, e.g., n = 0, 1 or 5, obvious shear failure zones are observed after sample failure, and conjugate shear fractures occur. Moreover, sample fracture surfaces are approximately X-shaped. However, when n = 10, 15 or 20, the macromorphology of the samples after creep failure is very complex, with many tensile cracks and flaws appearing. It is thus clear that the mechanical properties of the samples are degraded as the number of DW cycles increases, resulting in propagation of many micro-fissures inside the samples.
- (ii)
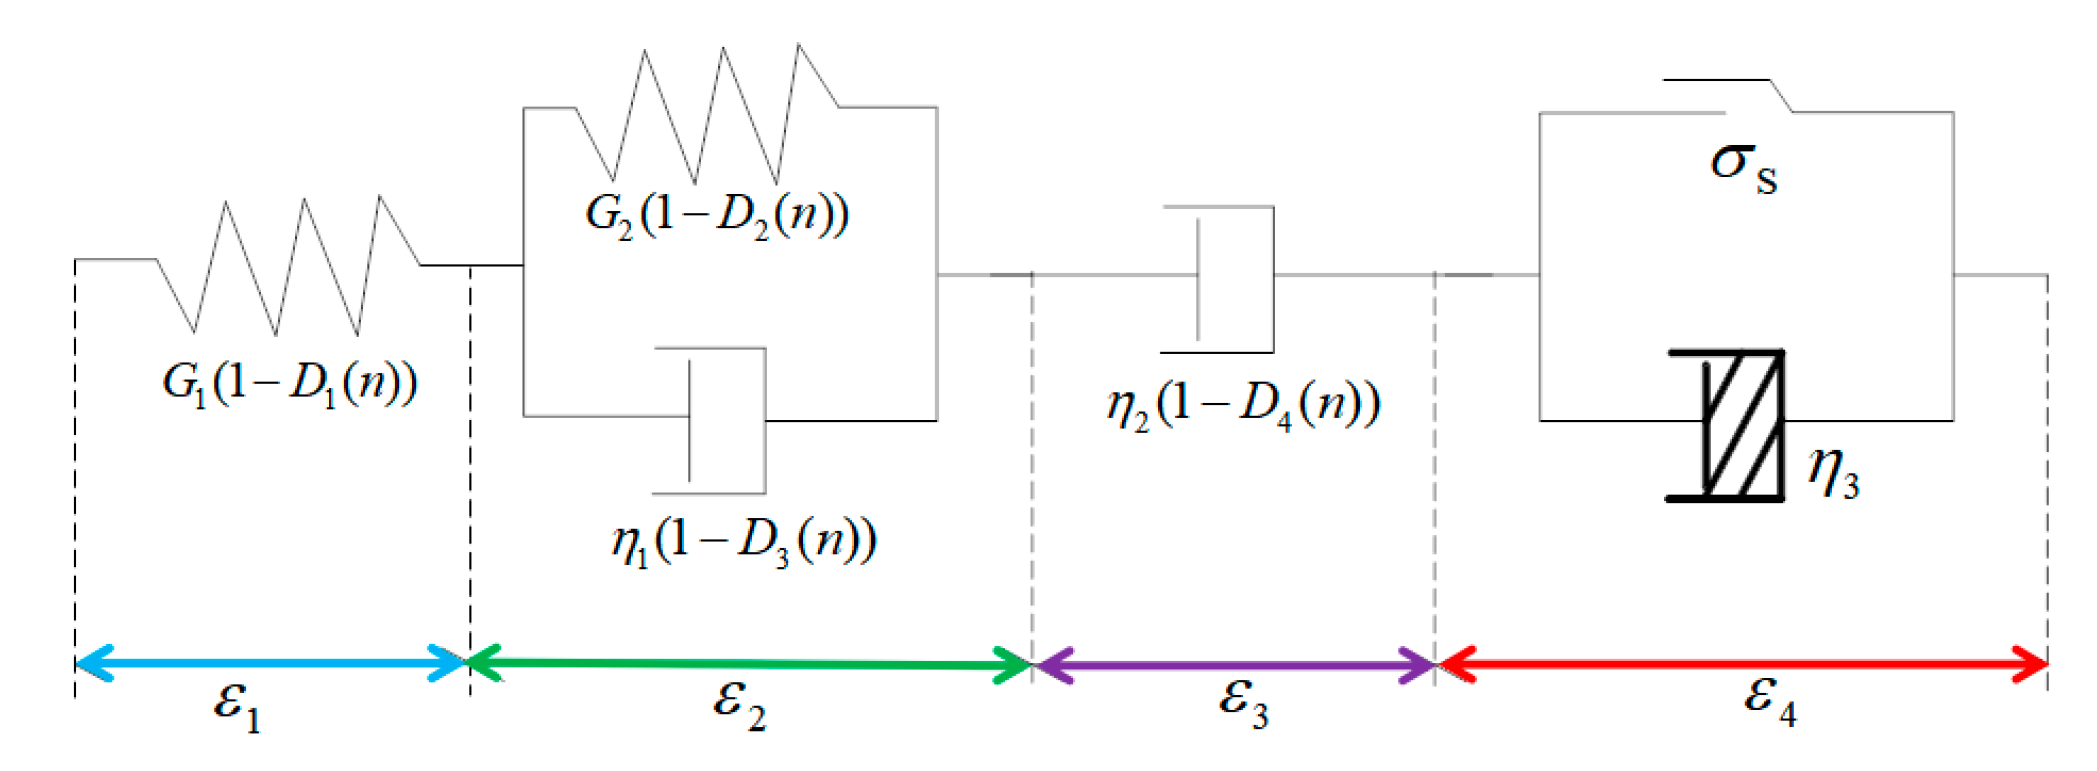
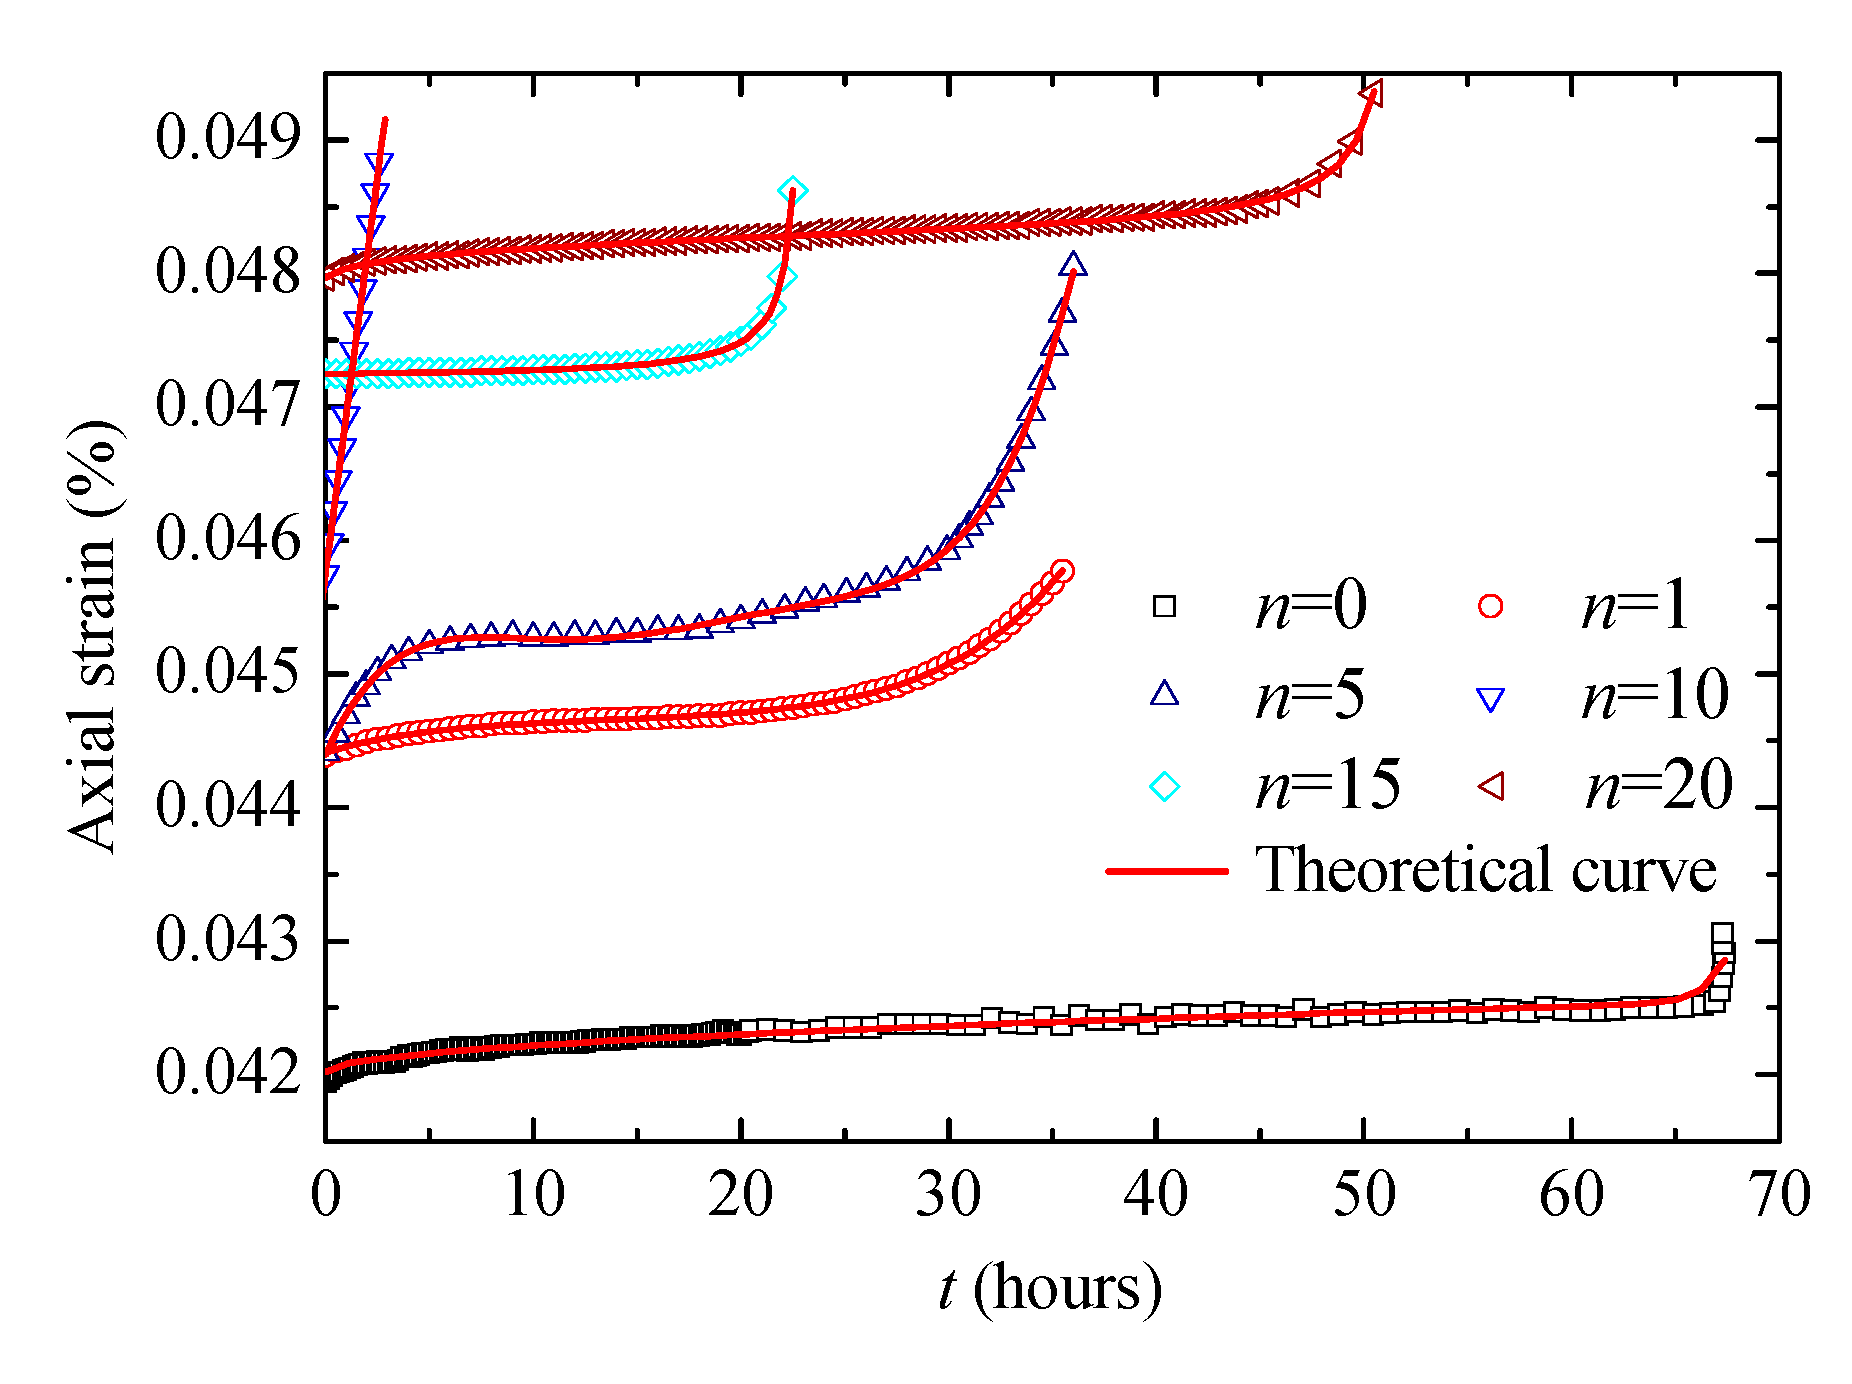
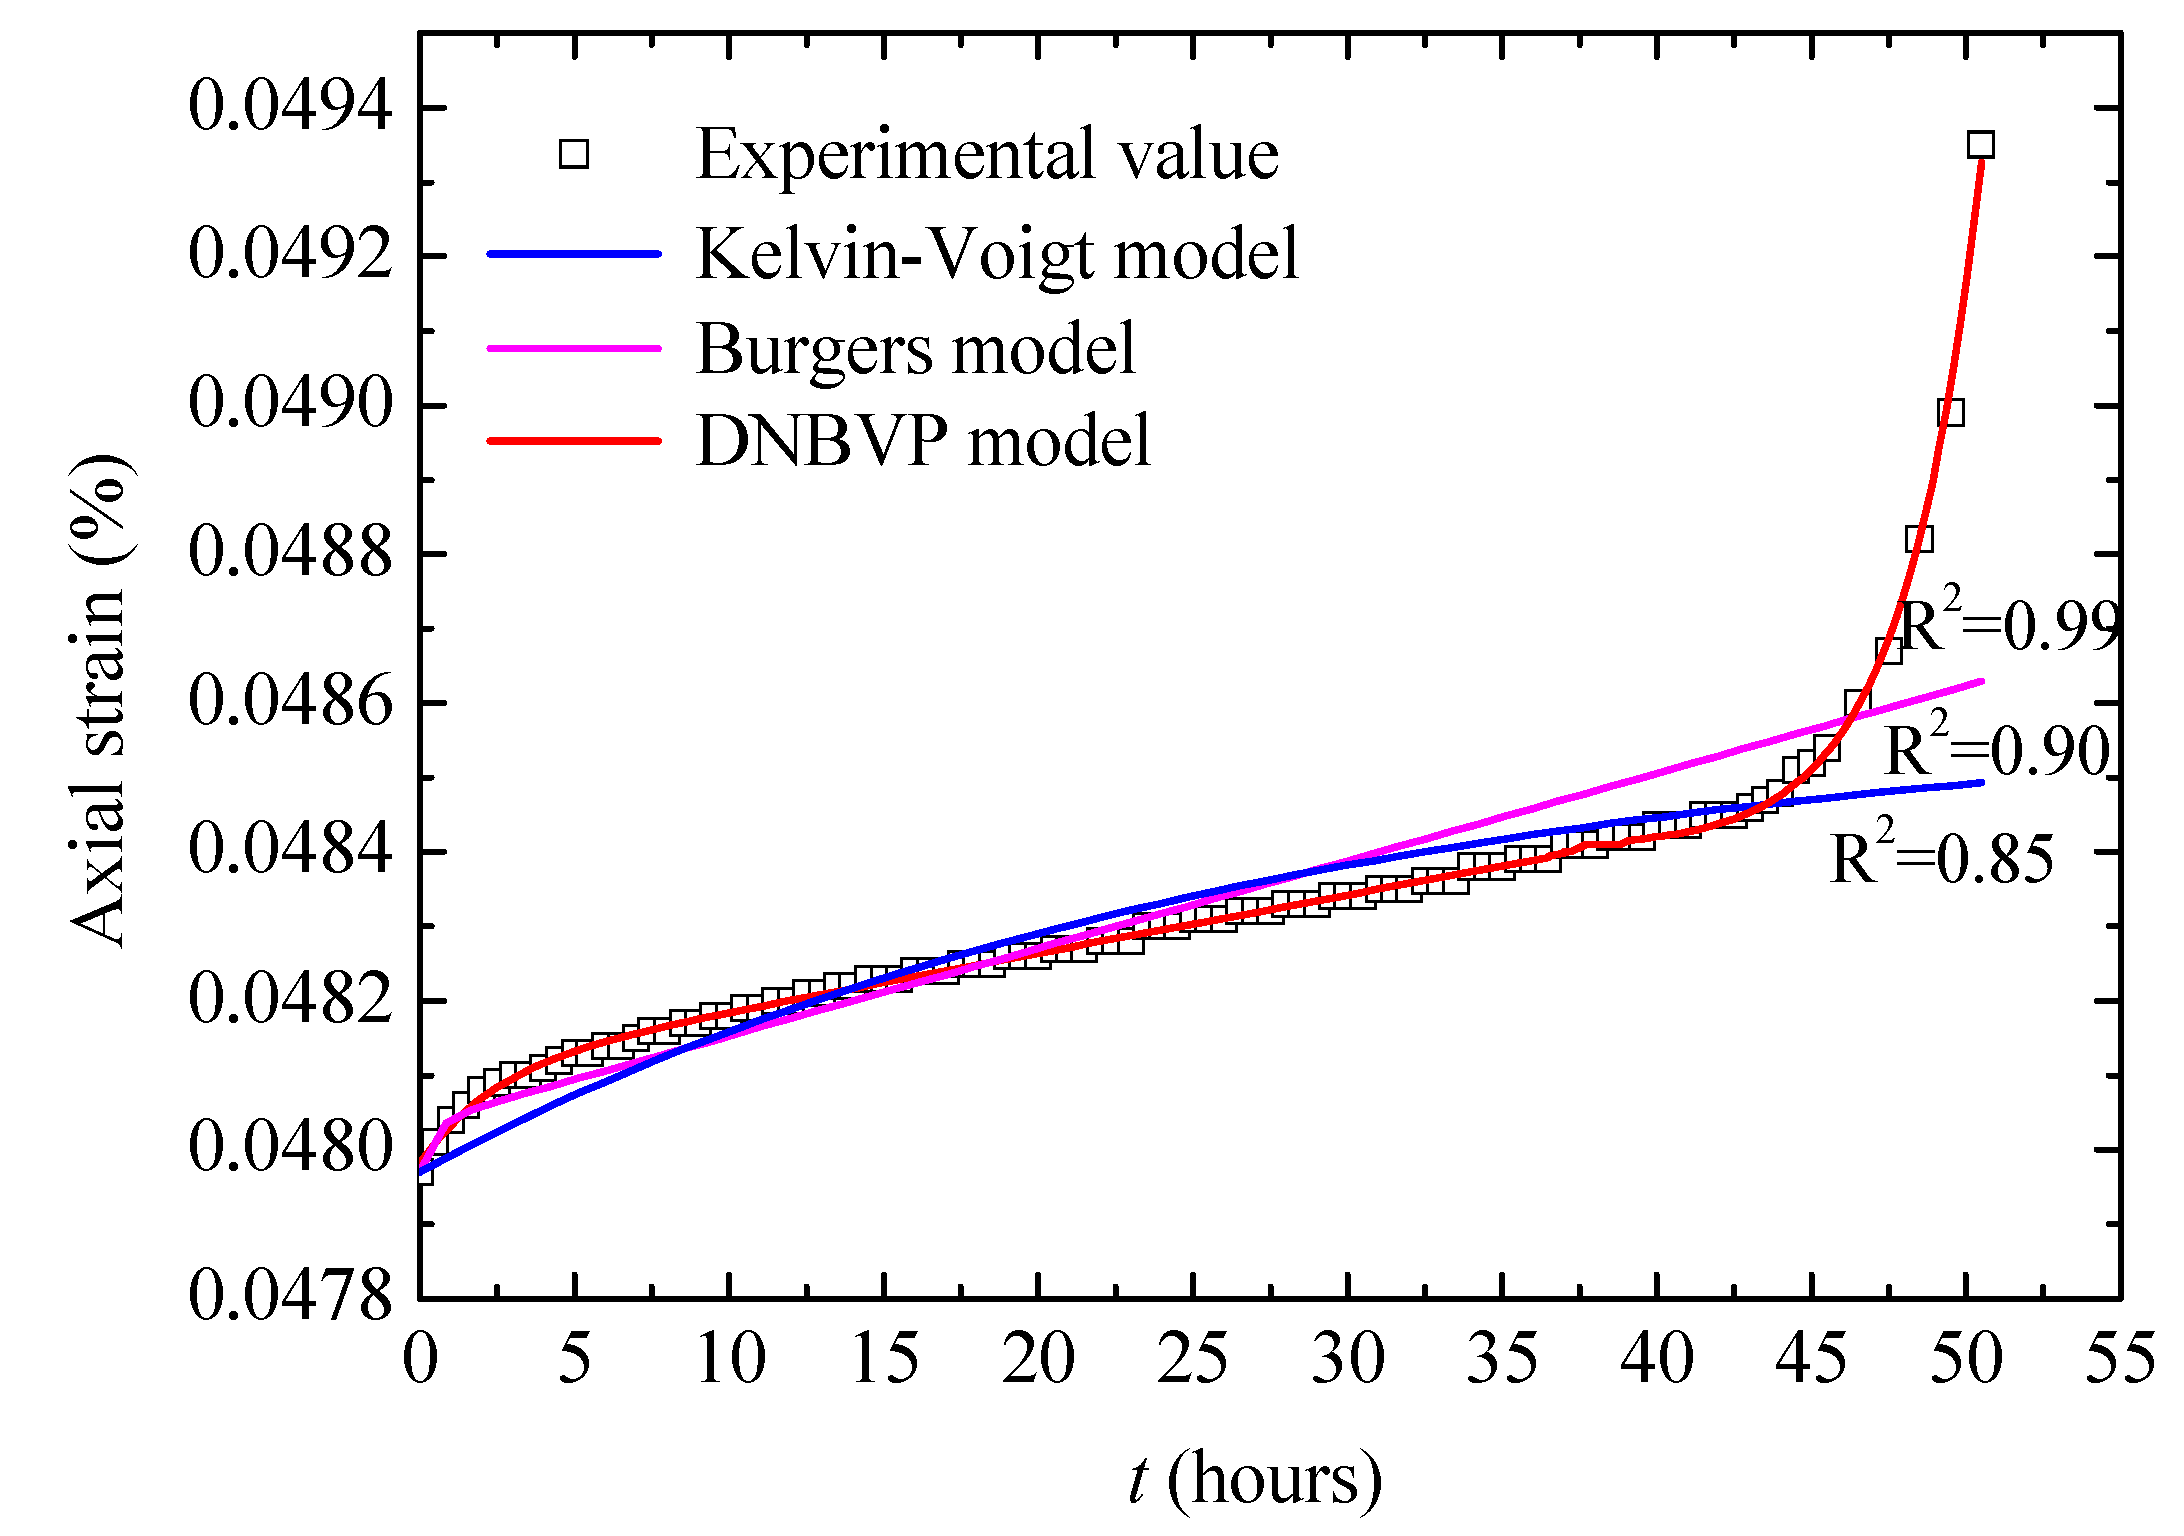
- Based on analysis from laboratory triaxial creep tests of the rock samples, a nonlinear damage model considering the effect of saturation–dehydration cycles (the DNBVP model) was established. The key feature of this model is that it introduced a nonlinear viscoplastic body and a damage variable describing saturation–dehydration cycles. The three-dimensional creep equation of the new model was derived and its creep parameters were identified. Comparison between the theoretical curves and the test results shows that the theoretical curves of the DNBVP model can successfully describe the values of rock creep tests after different saturation–dehydration cycles. By comparing classic creep models with the proposed model, it is found that the DNBVP model can accurately reflect the nonlinear characteristics of rocks at the accelerated creep stage.
- (iii)
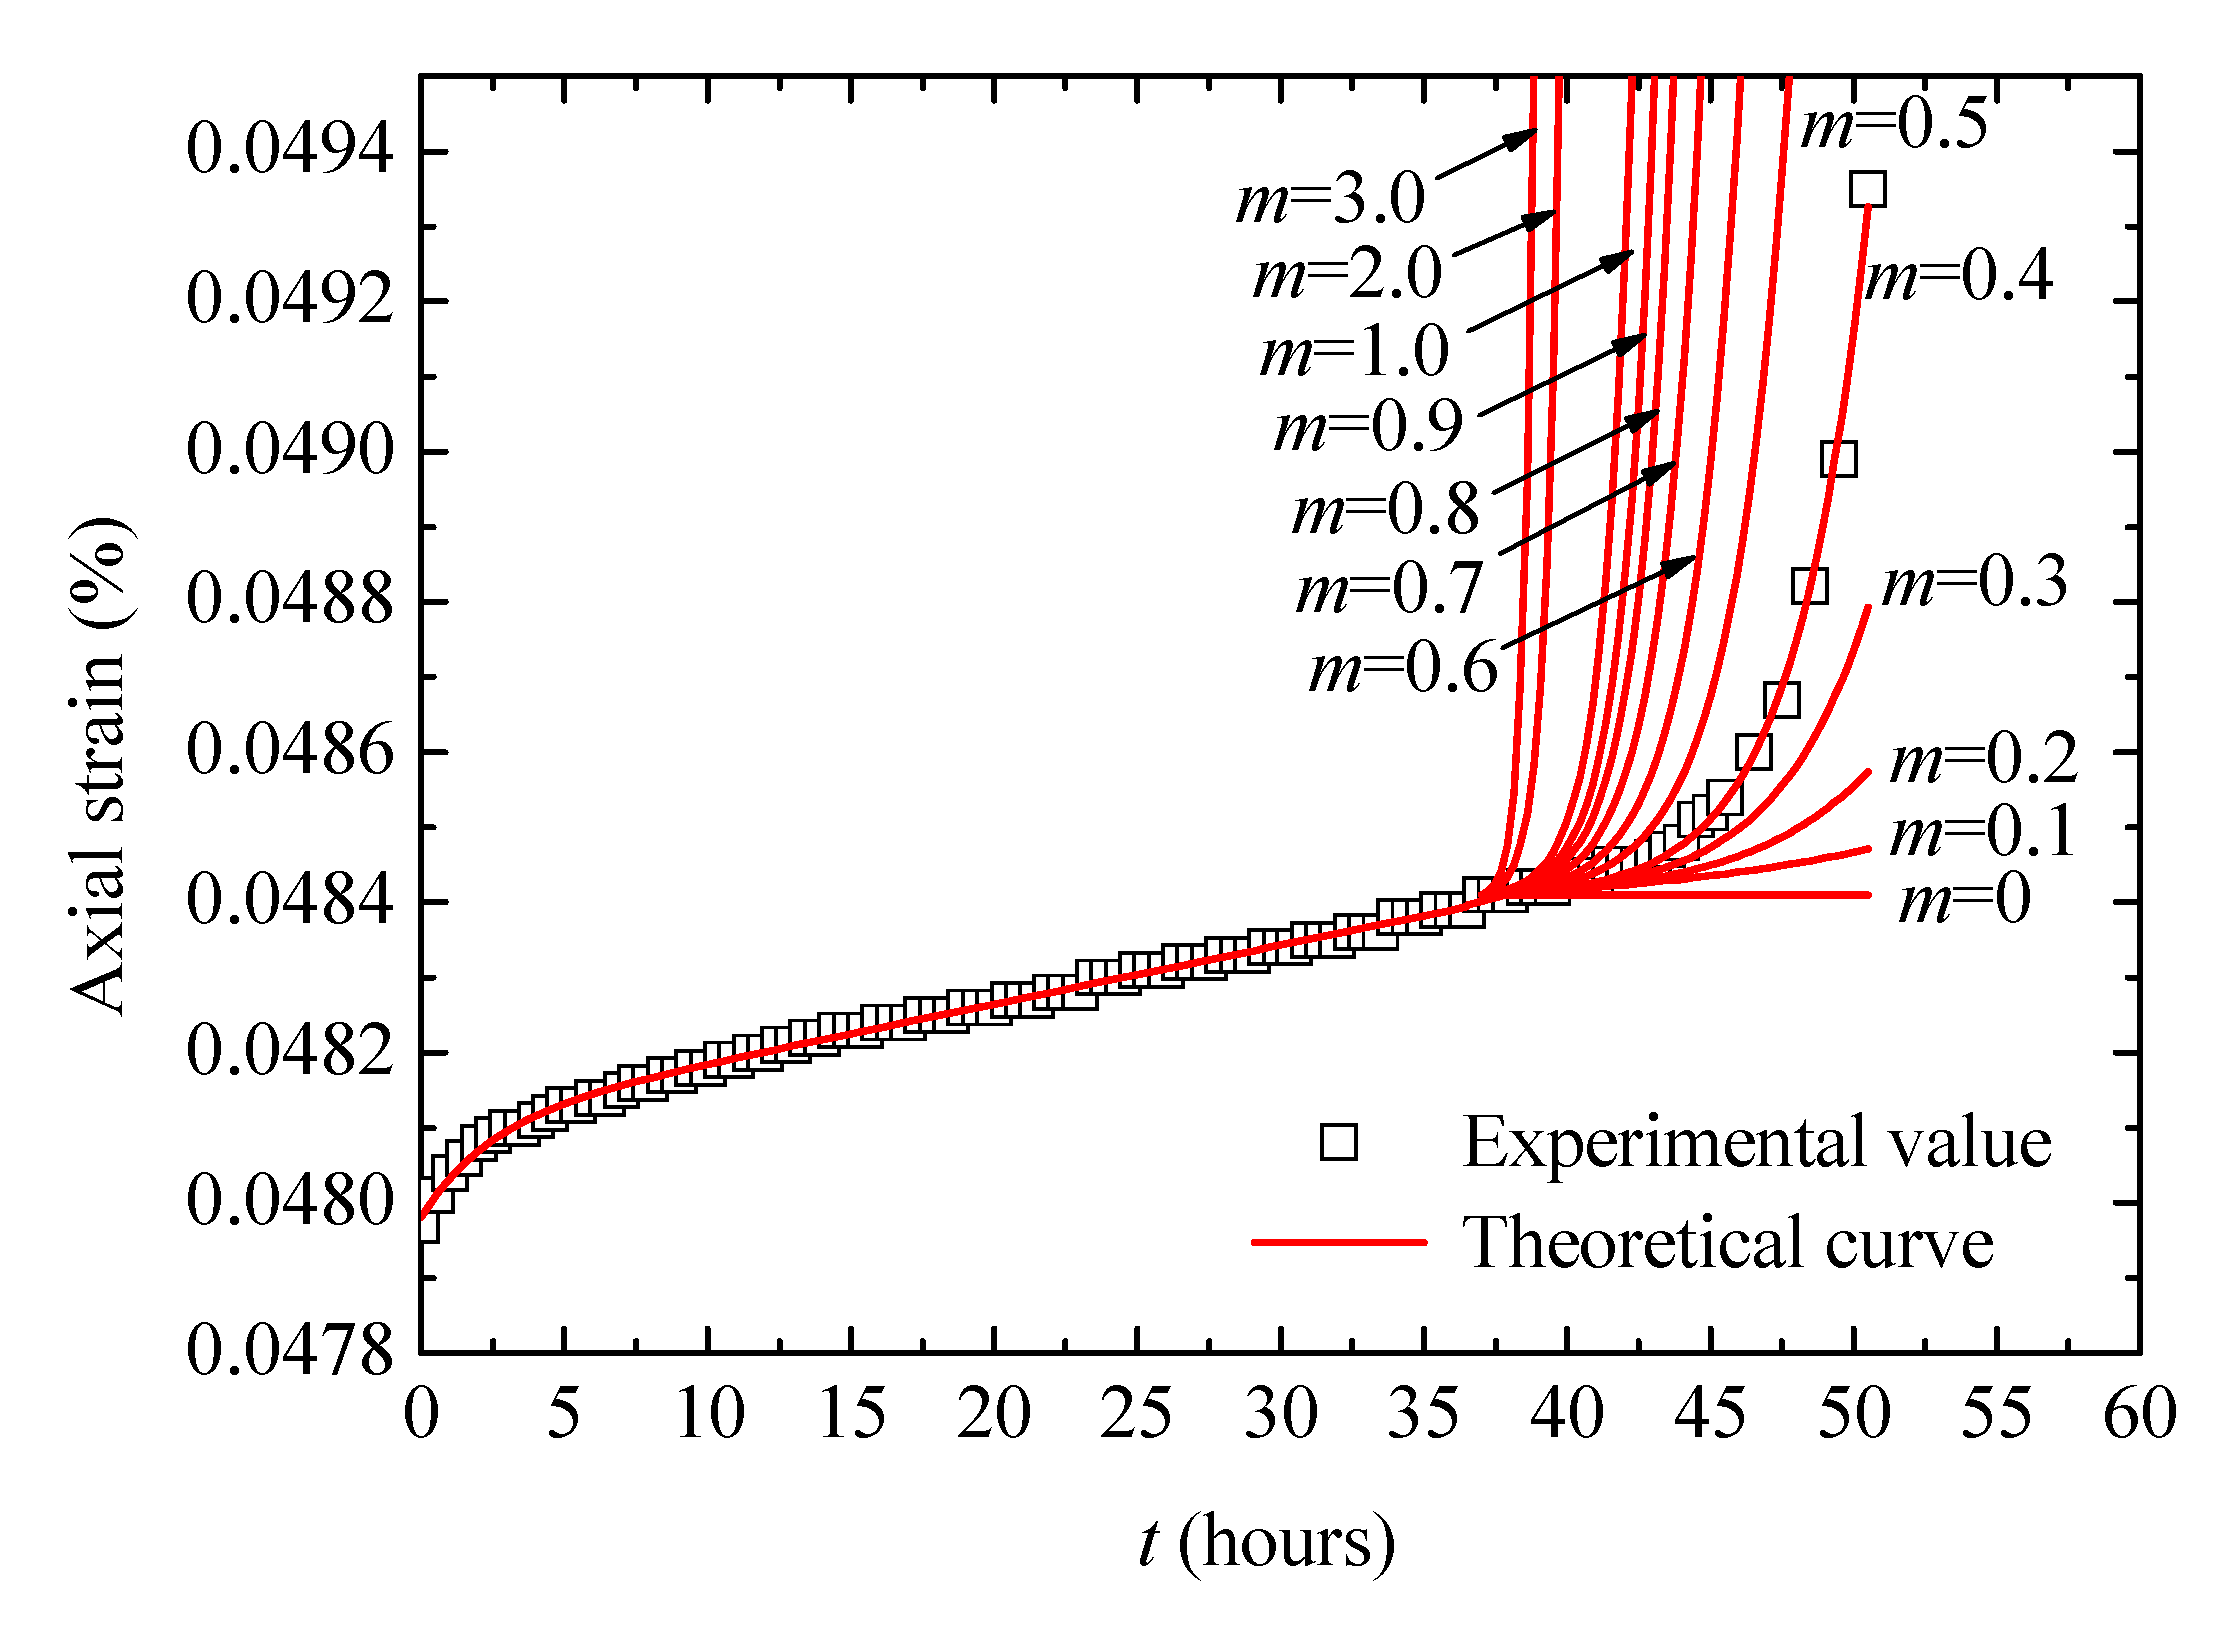
- In the DNBVP model, a series of damage variables about the number of cycles n can reflect the effect of saturation–dehydration cycles. The most critical parameter in the DNBVP model is the nonlinear parameter m, which reflects the characteristics of the rock creep curves. Additionally, the creep rate and the creep curve pattern of the DNBVP model strongly depended on the parameter m, and the variation in m fully reflects the nonlinear accelerated creep property of rocks. This suggests the flexibility of the nonlinear parameter m when describing the DNBVP model.
- (iv)
- To facilitate the implementation of the DNBVP model in FLAC3, three-dimensional central difference expressions necessary for secondary development of the new model were derived in detail. This can provide a reference for the development of other creep models. In addition, the constitutive model developed in this study can improve the geotechnical design of reservoir bank slopes and the control of reservoir bank landslides. It is a challenge for us in the future to analyze practical engineering cases according to field monitoring data using the DNBVP model, in order to further verify the new model we have proposed.
Author Contributions
Funding
Conflicts of Interest
References
- Brantut, N.; Heap, M.J.; Baud, P.; Meredith, P.G. Mechanisms of time-dependent deformation in porous limestone. J. Geophys. Res. Solid Earth 2014, 119, 54445–54463. [Google Scholar] [CrossRef]
- Heap, M.; Baud, P.; Meredith, P.; Bell, A.; Main, I. Time-dependent brittle creep in Darley Dale sandstone. J. Geophys. Res. Solid Earth 2009, 114. [Google Scholar] [CrossRef]
- Fabre, G.; Pellet, F. Creep and time-dependent damage in argillaceous rocks. Int. J. Rock Mech. Min. Sci. 2006, 43, 9509–9560. [Google Scholar] [CrossRef]
- Sun, J. Rheology of Geotechnical Materials and Its Application in Engineering; China Architecture and Building Press: Beijing, China, 1999. [Google Scholar]
- Palmer, J. Creeping earth could hold secret to deadly landslides. Nat. News 2017, 548, 384. [Google Scholar] [CrossRef] [PubMed]
- Wang, X.; Yin, Y.; Wang, J.; Lian, B.; Qiu, H.; Gu, T. A nonstationary parameter model for the sandstone creep tests. Landslides 2018, 15, 1377–1389. [Google Scholar] [CrossRef]
- Ciantia, M.O.; Castellanza, R.; Di Prisco, C. Experimental study on the water-induced weakening of calcarenites. Rock Mech. Rock Eng. 2015, 4848, 441–461. [Google Scholar] [CrossRef]
- Conte, E.; Donato, A.; Pugliese, L.; Troncone, A. Analysis of the Maierato landslide (Calabria, Southern Italy). Landslides 2018, 15, 1935–1950. [Google Scholar] [CrossRef]
- Conte, E.; Pugliese, L.; Troncone, A. Post-failure analysis of the Maierato landslide using the material point method. Eng. Geol. 2020, 277, 105788. [Google Scholar] [CrossRef]
- Grgic, D.; Amitrano, D. Creep of a porous rock and associated acoustic emission under different hydrous conditions. J. Geophys. Res. Solid Earth 2009, 114. [Google Scholar] [CrossRef]
- Hashiba, K.; Fukui, K. Index of loading-rate dependency of rock strength. Rock Mech. Rock Eng. 2015, 48, 859–865. [Google Scholar] [CrossRef]
- Hashiba, K.; Fukui, K.; Kataoka, M.; Chu, S. Effect of water on the strength and creep lifetime of andesite. Int. J. Rock Mech. Min. 2018, 108, 37–42. [Google Scholar] [CrossRef]
- Tang, S.B.; Yu, C.Y.; Heap, M.J.; Chen, P.Z.; Ren, Y.G. The Influence of Water Saturation on the Short- and Long-Term Mechanical Behavior of Red Sandstone. Rock Mech. Rock Eng. 2018, 51, 2669–2687. [Google Scholar] [CrossRef]
- Feng, X.-T.; Hudson, J.A. Specifying the information required for rock mechanics modelling and rock engineering design. Int. J. Rock Mech. Min. 2010, 47, 1791–1794. [Google Scholar] [CrossRef]
- Zhang, B.Y.; Zhang, J.H.; Sun, G.L. Deformation and shear strength of rockfill materials composed of soft siltstones subjected to stress, cyclical drying/wetting and temperature variations. Eng. Geol. 2015, 190, 87–97. [Google Scholar] [CrossRef]
- Deng, H.; Zhou, M.; Li, J.; Sun, X.; Huang, Y. Creep degradation mechanism by water-rock interaction in the red-layer soft rock. Arab. J. Geosci. 2016, 9, 601. [Google Scholar] [CrossRef]
- Liu, X.; Wang, Z.; Fu, Y.; Yuan, W.; Miao, L. Macro/microtesting and damage and degradation of sandstones under dry-wet cycles. Adv. Mater. Sci. Eng. 2016, 1, 1–16. [Google Scholar] [CrossRef]
- Hendron, A., Jr.; Patton, F.D. The Vaiont Slide. A Geotechnical Analysis Based on New Geologic Observations of the Failure Surface. Volume 1. Main Text; Army Engineer Waterways Experiment Station Vicksburg Ms Geotechnical Lab.: Vicksburg, MS, USA, 1985. [Google Scholar]
- Huang, B.; Yin, Y.; Liu, G.; Wang, S.; Chen, X.; Huo, Z. Analysis of waves generated by Gongjiafang landslide in Wu Gorge, three Gorges reservoir, on November 23, 2008. Landslides 2012, 9, 395–405. [Google Scholar] [CrossRef]
- Özbek, A. Investigation of the effects of wetting–drying and freezing–thawing cycles on some physical and mechanical properties of selected ignimbrites. Bull. Eng. Geology. Environ. 2014, 73, 595–609. [Google Scholar] [CrossRef]
- Zhou, Z.; Cai, X.; Chen, L.; Cao, W.; Zhao, Y.; Xiong, C. Influence of cyclic wetting and drying on physical and dynamic compressive properties of sandstone. Eng. Geol. 2017, 220, 11–12. [Google Scholar] [CrossRef]
- Qi, J.; Sui, W.; Liu, Y.; Zhang, D. Slaking Process and Mechanisms Under Static Wetting and Drying Cycles Slaking Tests in a Red Strata Mudstone. Geotech. Geol. Eng. 2015, 33, 959–972. [Google Scholar] [CrossRef]
- Hua, W.; Dong, S.; Li, Y.; Wang, Q. Effect of cyclic wetting and drying on the pure mode II fracture toughness of sandstone. Eng. Fract. Mech. 2016, 153, 1431–1450. [Google Scholar] [CrossRef]
- Torres-Suarez, M.C.; Alarcon-Guzman, A.; Berdugo-De Moya, R. Effects of loading–unloading and wetting–drying cycles on geomechanical behaviors of mudrocks in the Colombian Andes. J. Rock Mech. Geotech. Eng. 2014, 6, 257–268. [Google Scholar] [CrossRef]
- Wang, Z.; Liu, X.; Yang, X.; Fu, Y. An Improved Duncan–Chang Constitutive Model for Sandstone Subjected to Drying–Wetting Cycles and Secondary Development of the Model in FLAC3D. Arab. J. Sci. Eng. 2017, 42, 1265–1282. [Google Scholar] [CrossRef]
- Shao, J.F.; Zhu, Q.Z.; Su, K. Modeling of creep in rock materials in terms of material degradation. Comput. Geotech. 2003, 30, 549–555. [Google Scholar] [CrossRef]
- Xu, W.-Y.; Yang, S.Q.; Chu, W.J. Nonlinear viscoelasto-plastic rheological model (Hohai model) of rock and its engineering application. Chin. J. Rock Mech. Eng. 2006, 2525, 433–447. [Google Scholar]
- Liu, Z.; Shao, J.; Xie, S.; Conil, N.; Zha, W. Effects of relative humidity and mineral compositions on creep deformation and failure of a claystone under compression. Int. J. Rock Mech. Min. 2018, 103, 68–76. [Google Scholar] [CrossRef]
- Hamza, O.; Stace, R. Creep properties of intact and fractured muddy siltstone. Int. J. Rock Mech. Min. 2018, 106, 109–116. [Google Scholar] [CrossRef]
- GB/T502662-013. China Standards Publication Standard Tests Method of Engineering Rock Masses; Standard Press of China: Beijing, China, 2013. [Google Scholar]
- Zhou, Z.; Cai, X.; Cao, W.; Li, X.; Xiong, C. Influence of Water Content on Mechanical Properties of Rock in Both Saturation and Drying Processes. Rock Mech. Rock Eng. 2016, 49, 3009–3025. [Google Scholar] [CrossRef]
- Zhang, Y.; Shao, J.; Xu, W.; Jia, Y.; Zhao, H. Creep behaviour and permeability evolution of cataclastic sandstone in triaxial rheological tests. Eur. J. Environ. Civ. Eng. 2015, 19, 496–519. [Google Scholar] [CrossRef]
- Yang, W.; Zhang, Q.; Li, S.; Wang, S. Time-Dependent Behavior of Diabase and a Nonlinear Creep Model. Rock Mech. Rock Eng. 2014, 47, 12111–12224. [Google Scholar] [CrossRef]
- Zhao, D.; Xu, M.; Liu, G.; Ma, L.; Zhang, S.; Xiao, T.; Peng, G. Effect of vegetation type on microstructure of soil aggregates on the Loess Plateau, China. Agric. Ecosyst. Environ. 2017, 242, 1–8. [Google Scholar] [CrossRef]
- Liu, H.; Xie, H.; He, J.; Xiao, M.; Zhuo, L. Nonlinear creep damage constitutive model for soft rocks. Mech. Time-Depend. Mat. 2017, 21, 73–96. [Google Scholar] [CrossRef]
- Kaiser, P.; Morgenstein, N. Time-dependent deformation of small tunnels—I. Experimental facilities. Int. J. Rock Mech. Min. Sci. Geomech. Abstr. 1981, 18, 129–140. [Google Scholar] [CrossRef]
- Hao, S.W.; Zhang, B.J.; Tian, J.F.; Elsworth, D. Predicting time-to-failure in rock extrapolated from secondary creep. J. Geophys. Res. Solid Earth 2014, 119, 19421–19953. [Google Scholar] [CrossRef]
- Nishihara, M. Creep of shale and sandy-shale. J. Geol. Soc. Jpn. 1952, 58, 3733–3777. [Google Scholar] [CrossRef]
- Bozzano, F.; Martino, S.; Montagna, A.; Prestininzi, A. Back analysis of a rock landslide to infer rheological parameters. Eng. Geol. 2012, 131, 455–456. [Google Scholar] [CrossRef]
- Nomikos, P.; Rahmannejad, R.; Sofianos, A. Supported axisymmetric tunnels within linear viscoelastic Burgers rocks. Rock Mech. Rock Eng. 2011, 44, 5535–5564. [Google Scholar] [CrossRef]
- Sterpi, D.; Gioda, G. Visco-plastic behaviour around advancing tunnels in squeezing rock. Rock Mech. Rock Eng. 2009, 42, 319–339. [Google Scholar] [CrossRef]
- Zhao, Y.; Zhang, L.; Wang, W.; Wan, W.; Ma, W. Separation of Elastoviscoplastic Strains of Rock and a Nonlinear Creep Model. Int. J. Geomech. 2018, 18, 04017129. [Google Scholar] [CrossRef]
- Jiang, Q.; Qi, Y.; Wang, Z.; Zhou, C. An extended Nishihara model for the description of three stages of sandstone creep. Geophys. J. Int. 2013, 193, 8418–8454. [Google Scholar] [CrossRef]
- Xiong, L.X.; Li, T.B.; Yang, L.D.; Yuan, X.W. A study on stationary and nonstationary viscoelastic models of greenschist. Arab. J. Geosci. 2015, 8, 2477–2486. [Google Scholar] [CrossRef]
- Chen, J.; Dai, F.; Xu, L.; Chen, S.; Wang, P.; Long, W.; Shen, N. Properties and microstructure of a natural slip zone in loose deposits of red beds, southwestern China. Eng. Geol. 2014, 183, 53–64. [Google Scholar] [CrossRef]
- Meng, Q.; Zhang, M.; Han, L.; Pu, H.; Chen, Y. Acoustic emission characteristics of red sandstone specimens under uniaxial cyclic loading and unloading compression. Rock Mech. Rock Eng. 2018, 51, 969–988. [Google Scholar] [CrossRef]
- Yang, S.; Hu, B.; Ranjith, P.G.; Xu, P. Multi-Step Loading Creep Behavior of Red Sandstone after Thermal Treatments and a Creep Damage Model. Energies 2018, 11, 212. [Google Scholar] [CrossRef]
- Kachanov, L. The Theory of Creep; National Lending Library for Sciences and Technology: Bostion Spa, Yorkshire, 1967. [Google Scholar]
- Zhou, H.W.; Wang, C.P.; Han, B.B.; Duan, Z.Q. A creep constitutive model for salt rock based on fractional derivatives. Int. J. Rock Mech. Min. 2011, 48, 116–121. [Google Scholar] [CrossRef]
- Yang, S.-Q.; Cheng, L. Non-stationary and nonlinear visco-elastic shear creep model for shale. Int. J. Rock Mech. Min. 2011, 48, 1011–1020. [Google Scholar] [CrossRef]
- Yang, S.-Q.; Jing, H.-W. Evaluation on strength and deformation behavior of red sandstone under simple and complex loading paths. Eng. Geol. 2013, 164, 11–17. [Google Scholar] [CrossRef]
- Ma, L.; Wang, M.; Zhang, N.; Fan, P.; Li, J. A variable-parameter creep damage model incorporating the effects of loading frequency for rock salt and its application in a bedded storage cavern. Rock Mech. Rock Eng. 2017, 50, 2495–2509. [Google Scholar] [CrossRef]
- Schapery, R.A. On the characterization of nonlinear viscoelastic materials. Polym. Eng. Sci. 1969, 9, 295–310. [Google Scholar] [CrossRef]
- Sone, H.; Zoback, M.D. Time-dependent deformation of shale gas reservoir rocks and its long-term effect on the in situ state of stress. Int. J. Rock Mech. Min. 2014, 69, 1201–1232. [Google Scholar] [CrossRef]
- Nedjar, B.; Le Roy, R. An approach to the modeling of viscoelastic damage. Application to the long-term creep of gypsum rock materials. Int. J. Numer. Anal. Met. 2013, 37, 1066–1078. [Google Scholar] [CrossRef]
- Rutter, E.H.; Green, S. Quantifying creep behaviour of clay-bearing rocks below the critical stress state for rapid failure: Mam Tor landslide, Derbyshire, England. J. Geol. Soc. 2011, 168, 359–372. [Google Scholar] [CrossRef]
- Itasca. FLAC 3D (Fast Lagrangian Analysis of Continua in 3 Dimensions) User Manuals; Version 3.0; Itasca Consulting Group: Minneapolis, MN, USA, 2005. [Google Scholar]


| ρ (g/cm3) | ρd (g/cm3) | ρs (g/cm3) | W (%) | Ws (%) | Porosity (%) |
|---|---|---|---|---|---|
| 2.48 | 2.38 | 2.57 | 4.1 | 7.4 | 7.2 |
| Lithology | Load Level (MPa) | Axial Load (MPa) | |||||
|---|---|---|---|---|---|---|---|
| n = 0 | n = 1 | n = 5 | n = 10 | n = 15 | n = 20 | ||
| Argillite | First level | 13.20 | 12.00 | 7.80 | 6.40 | 4.80 | 5.40 |
| Second level | 19.80 | 18.00 | 11.70 | 9.60 | 7.20 | 8.10 | |
| Third level | 29.70 | 27.00 | 17.55 | 14.40 | 10.80 | 10.80 | |
| Fourth level | 39.60 | 36.00 | 23.40 | 19.20 | 14.40 | 13.50 | |
| Fifth level | 49.50 | 45.00 | 29.25 | 24.00 | 18.00 | 15.30 | |
| Lithology | D1 (n) | D2 (n) | D3 (n) | D4 (n) | |||||
|---|---|---|---|---|---|---|---|---|---|
| Argillite | 0 | 15.78 | 0.00 | 1.73 | 0.00 | 10,864.51 | 0.00 | 11.24 | 0.00 |
| 1 | 13.37 | 0.15 | 1.37 | 0.21 | 8896.80 | 0.18 | 8.97 | 0.20 | |
| 5 | 6.41 | 0.59 | 0.75 | 0.57 | 4717.41 | 0.57 | 5.74 | 0.49 | |
| 10 | 2.96 | 0.81 | 0.49 | 0.72 | 3333.74 | 0.69 | 4.05 | 0.64 | |
| 15 | 0.79 | 0.94 | 0.33 | 0.81 | 2400.78 | 0.78 | 3.39 | 0.70 | |
| 20 | 0.72 | 0.95 | 0.24 | 0.86 | 1899.63 | 0.83 | 3.02 | 0.73 |
| P (MPa) | G1 (GPa) | G2 (GPa) | η1 (GPa·h) | η2 (GPa·h) | η3 (GPa·h) | m |
|---|---|---|---|---|---|---|
| 15.3 | 0.77 | 44.26 | 81.18 | 323.82 | 416.48 | NA |
| 15.3 (accelerated stage) | 0.77 | 44.26 | 81.18 | 323.82 | 201.53 | 0.4 |
© 2020 by the authors. Licensee MDPI, Basel, Switzerland. This article is an open access article distributed under the terms and conditions of the Creative Commons Attribution (CC BY) license (http://creativecommons.org/licenses/by/4.0/).
Share and Cite
Wang, X.; Lian, B.; Feng, W. A Nonlinear Creep Damage Model Considering the Effect of Dry-Wet Cycles of Rocks on Reservoir Bank Slopes. Water 2020, 12, 2396. https://doi.org/10.3390/w12092396
Wang X, Lian B, Feng W. A Nonlinear Creep Damage Model Considering the Effect of Dry-Wet Cycles of Rocks on Reservoir Bank Slopes. Water. 2020; 12(9):2396. https://doi.org/10.3390/w12092396
Chicago/Turabian StyleWang, Xingang, Baoqin Lian, and Wenkai Feng. 2020. "A Nonlinear Creep Damage Model Considering the Effect of Dry-Wet Cycles of Rocks on Reservoir Bank Slopes" Water 12, no. 9: 2396. https://doi.org/10.3390/w12092396
APA StyleWang, X., Lian, B., & Feng, W. (2020). A Nonlinear Creep Damage Model Considering the Effect of Dry-Wet Cycles of Rocks on Reservoir Bank Slopes. Water, 12(9), 2396. https://doi.org/10.3390/w12092396