Article

Dynamic Interception Effect of Internal and External Nitrogen and Phosphorus Migration of Ecological Ditches

1
School of Environmental Science and Engineering, Tianjin University, Tianjin 300072, China
2
Department of Water Conservancy Engineering, Tianjin Agriculture University, Tianjin 300384, China
3
State Key Laboratory of Hydraulic Engineering Simulation and Safety, Tianjin University, Tianjin 300072, China
*
Author to whom correspondence should be addressed.
These authors contributed equally to this work and should be considered co-first authors.
Water 2020, 12(9), 2553; https://doi.org/10.3390/w12092553
Submission received: 9 August 2020 / Revised: 6 September 2020 / Accepted: 10 September 2020 / Published: 12 September 2020
(This article belongs to the Section Water Quality and Contamination)

Abstract

:
The “ecological ditch” (eco-ditch) is an effective measure used to alleviate agricultural non-point-source pollution. However, information is lacking about the continuous transport characteristics of internal and external nitrogen and phosphorus in the interstitial water of the bottom mud of these ditches and overlying water under dynamic continuous inflow conditions. Understanding of the effect of matrix dams and microbial communities inside eco-ditches on the continuous transport characteristics of the N and P therein needs to be improved. To determine the interception effects of eco-ditches on the transfer of endogenous and exogenous N and P, an eco-ditch combining plants and a matrix dam was built to explore the transport distribution characteristics of N and P in the intermittent water and overlying water in the bottom of the eco-ditch and in the bottom of the soil ditch. We compared and analyzed the composition characteristics of the microbiological communities along the ecological and soil ditches. The research results showed that: (1) The concentration gradient between the interstitial water and the overlying water in the soil ditch is the main reason for the transport and diffusion of pollutants. However, in eco-ditches, the absorption function of plant roots and the differences between the structures of the microbial communities destroy the correlation of this concentration gradient diffusion, especially the effect on ammonium N; (2) a large number of mycelia adhere to the surface of the matrix dam in an eco-ditch, and are conducive to the adsorption and purification of pollutants in the water; (3) Proteobacteria, Chloroflexi, Actinomycetes, and Acidobacteria were the main bacterial groups in the ditches. The aquatic plants in the eco-ditch changed the microenvironment of the sediment, and both the microbial diversity and abundance along the eco-ditch were higher than in the soil ditch.

1. Introduction

With the improved management of point-source pollution, agricultural non-point-source pollution, characterized by nitrogen and phosphorus, has become the primary source of pollution of water environments [1]. Nitrogen (N) and phosphorus (P) management refers to reduction of both their external input and the N and P in sediments [2,3]. Relevant research indicates that the nutrient exchange is very strong between the N and P in interstitial water and the overlying water of river and lake wetlands [4,5]. Therefore, even though external N and P contents may be under control, eutrophication in farmland drainage ditches continues to occur [6]. This is mainly caused by the continuous release of N and P in the sediment, which is termed endogenous release, for which inhibiting the release of endogenous N and P to the bottom of farmland ditches is important for reducing agricultural non-point-source pollution [7].
The farmland drainage ditch, as a typical linear wetland, provides an exchange function between the N and P in the interstitial water of the sediment and the overlying water [8,9]. The rich N and P in the sediment migrate toward the overlying water, which is the main cause of N and P pollution inside these ditches. Stevo L. et al. [10] conducted relevant research on the concentrations of N and P pollutants in sediments, interstitial water, and overlying water in farmland drainage ditches based on static tests or single-sample monitoring results over a large time span. However, research is lacking on the transport characteristics of N and P pollutants in the interstitial and overlying waters in the bottoms of ditches under dynamic continuous inflow conditions. Ecological transformation of farmland drainage ditches can create ecological ditches [11]. Ecological ditches (eco-ditches) can effectively remove agricultural non-point-source N and P pollution [12]. However, the distribution law of N and P transport between interstitial water and overlying water in eco-ditches is also unclear. The microbes in eco-ditches and matrix dams play an important role in the interception and purification of N and P [13,14]. Collaborative studies on the microscopic morphology of microorganisms and matrix dams in eco-ditches and the microscopic transport characteristics of N and P pollution in the interstitial water and overlying sediments in the ditches have been conducted.
This research has the general goal of understanding the interception effect of eco-ditches on the migration of internal and external N and P pollutants. The specific objectives of the trial are to: (1) study the transport and distribution characteristics of different forms of N and P pollutants between the interstitial water of the sediment and the overlying water in the soil and eco-ditches under the dynamic conditions of continuous and uniform inflow; (2) further reveal the dynamic interception effect in the eco-ditch of the migration of internal and external N and P pollution by examining the micromorphology of the adsorption matrix of the matrix dam in the eco-ditch and microbial community structures of sediments in the ecological and soil ditches; and (3) provide a theoretical basis for the use of eco-ditches to intercept the loss of N and P from farmland and technical support for agricultural non-point-source pollution control.

2. Materials and Methods

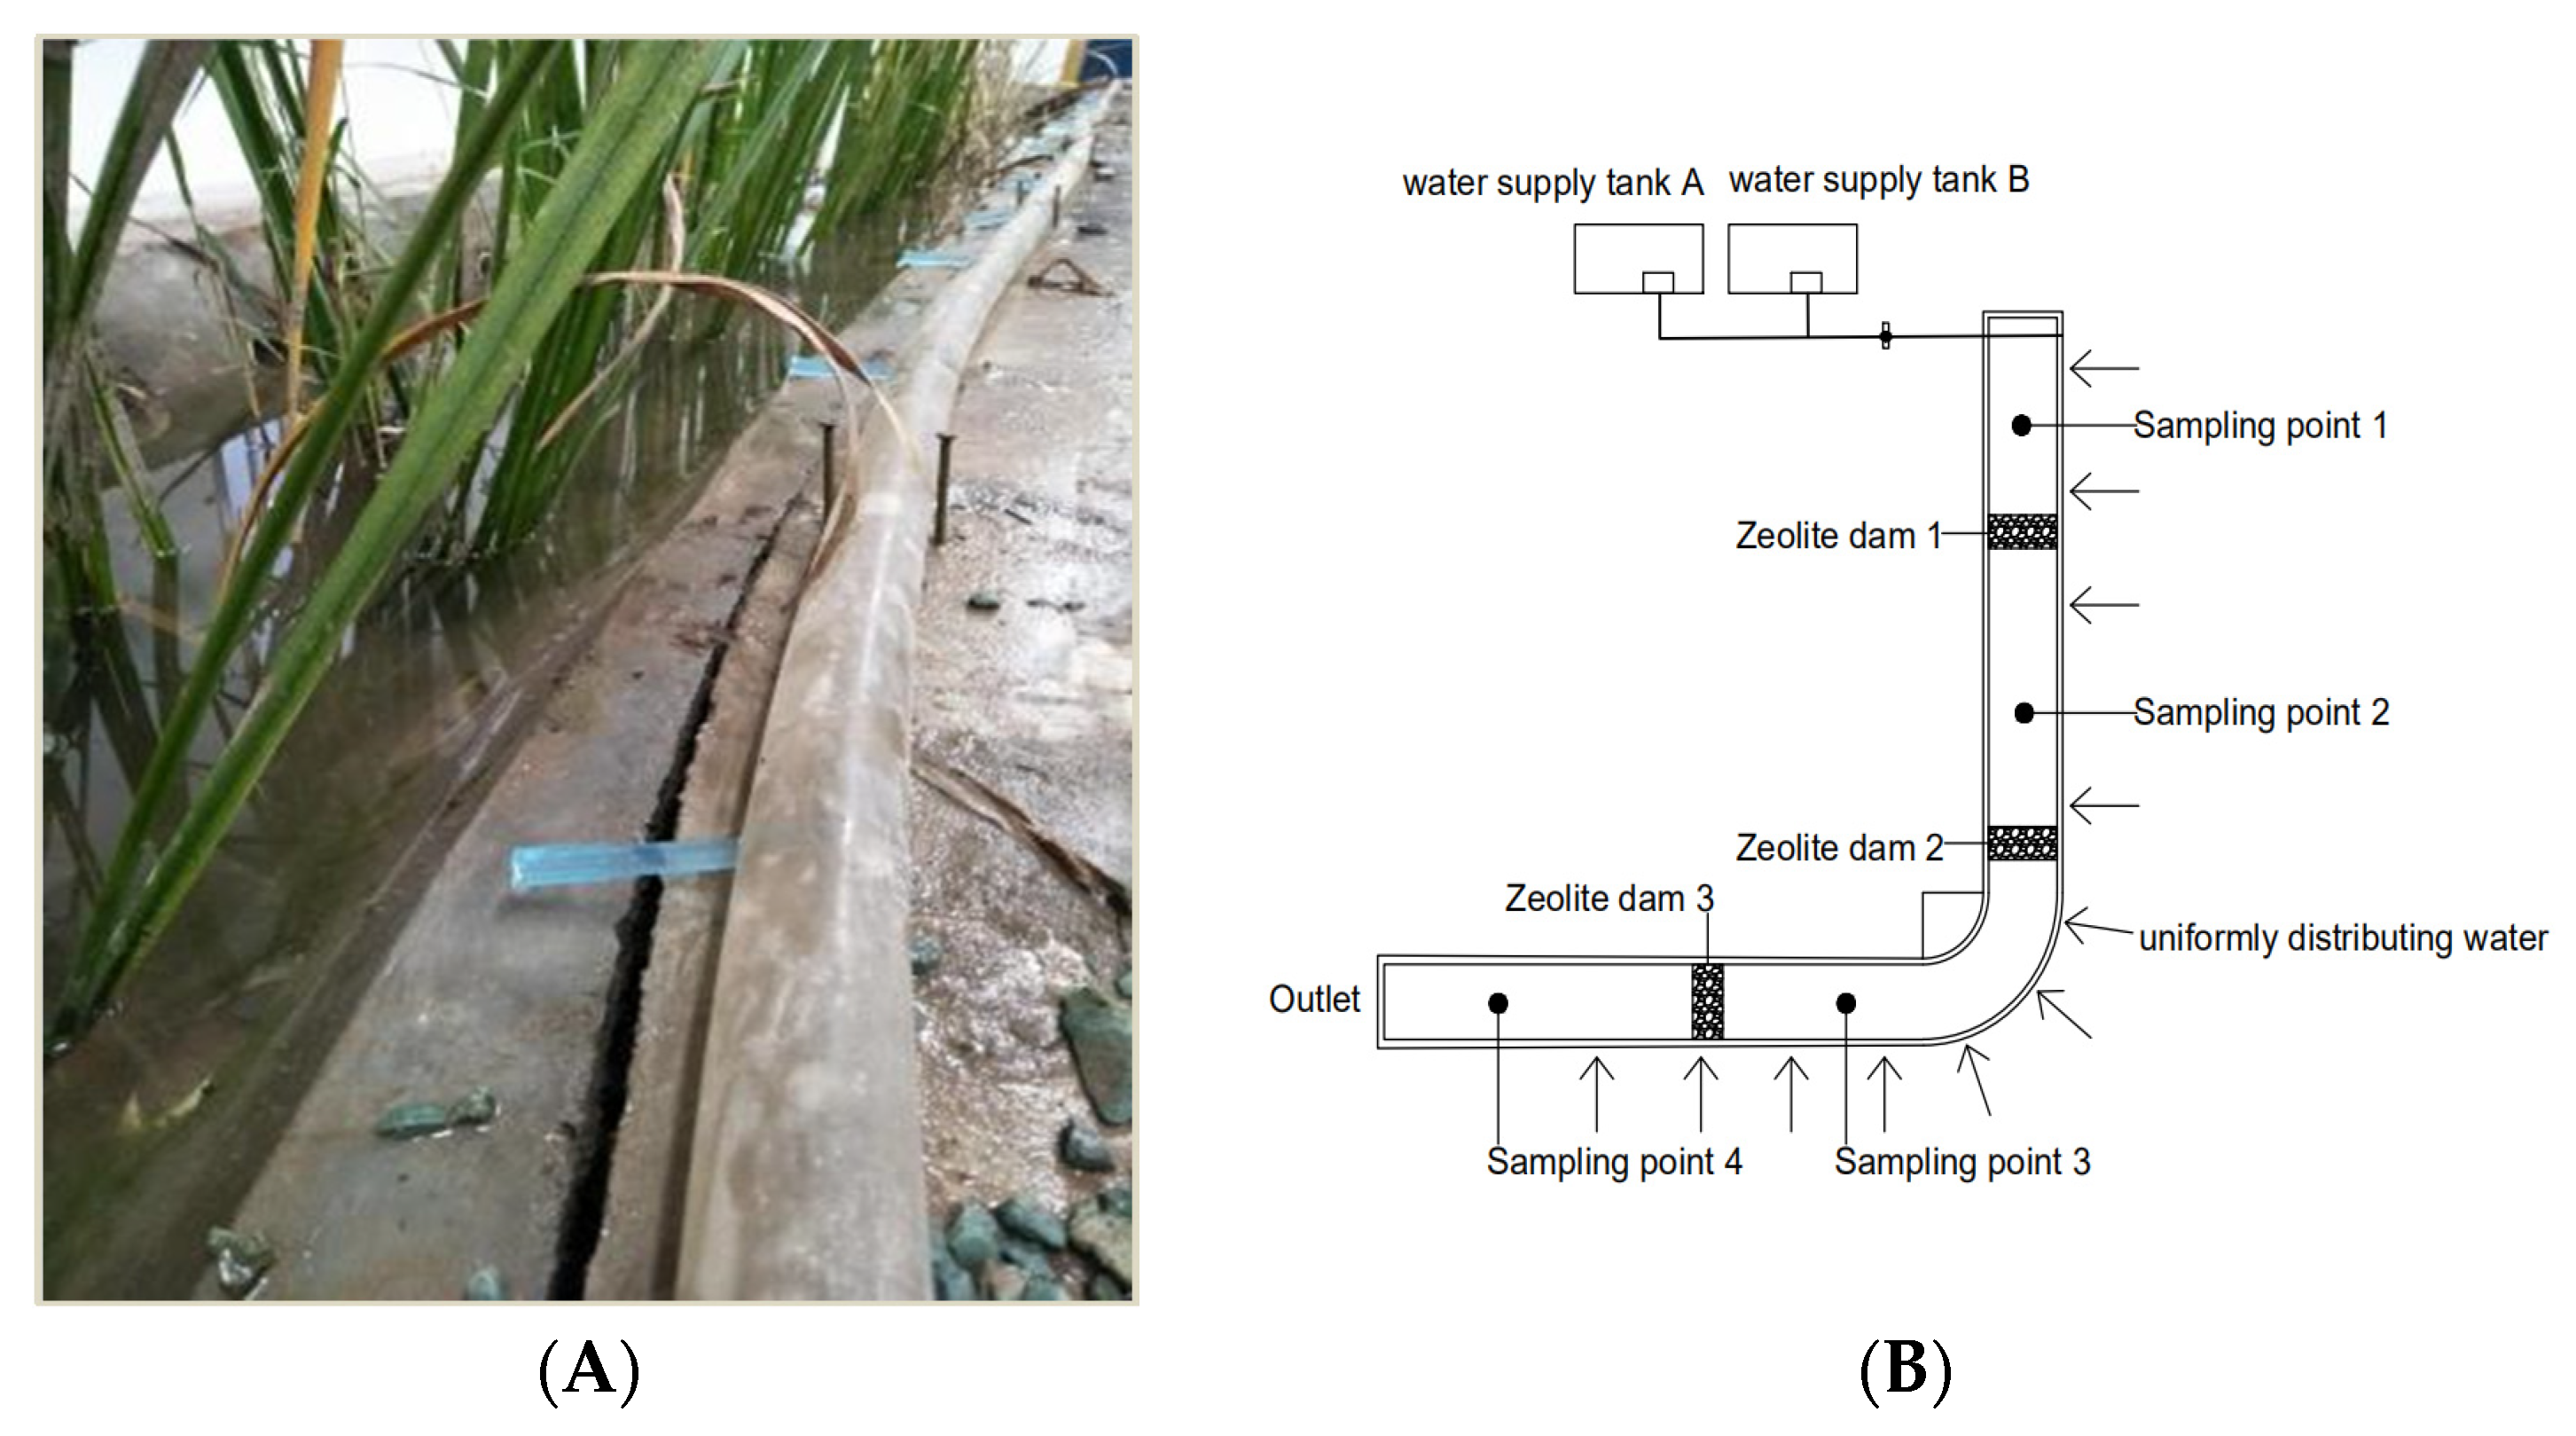
2.1. Ditch Model Construction

Because interception of N and P is affected by different factors, there are relatively huge differences of the natural drainage ditch in intercepting N and P [15,16]. In order to improve the N and P interception and purification effects of the traditional ditch, it is necessary to carry out the ecological transformation, establishing an eco-ditch system including corresponding plants, microorganisms, soil, substrates, etc. We designed a pilot model of a typical ecological drainage ditch combining plant–matrix dams and researched the effects of N and P interception and removal. The drainage ditches of the paddy planting area in the Xiaozhan east side of the Xiaochang River, Machang, Guaigou Village, Jinnan District, Tianjin City was selected as the model prototype (Figure 1). Because the water flow is mainly affected by gravity, we applied Froude’s law to determine the size of the ditch [17], and selected the aquatic plants of calamus, lythrum, cattail, and reed which had better pollutant absorption capacity [18]; we also selected a natural zeolite matrix to establish a combined plant–matrix pilot model of eco-ditch (Figure 2 and Figure 3). The bottom sediment in the ditch was taken from the paddy field drainage ditches in Xiaozhan, Jinnan District. There were three matrix dams located at the junction of different plants in the eco-ditch. During this period, adequate ventilation and light were provided to ensure the plants survived normally. In order to withstand the pressure of water flow and simulate engineering applications, in this experiment, the zeolite used a particle size sieve between 5 and 10 mm purchased directly from the supplier [19,20]. Its chemical composition is provided by the manufacturer as shown in the following: SiO2 = 69.58%, Al2O3 = 12.2%, Fe2O3 = 0.87%, K2O = 1.13%, CaO = 2.59%, MgO = 0.13%, Na2O = 2.59%. At the same time, we designed a blank test model as a comparison.

2.2. Experiment Design

The ditch model adopted two water supply tanks and pumps running alternately and stably to supply water continuously. The inlet water flow was controlled by a glass rotor flowmeter, while the outlet was set with a triangular weir in order to control the water level in the ditch during the test period. The outlet was connected with the drainage pipe to the sewer. Since the on-site ditch of the paddy field was a first-level drainage ditch, the farmland drainage mainly entered into the drainage ditch by way of overflow. Therefore, this eco-ditch model adopted the inflow method of uniformly distributing water along the way. Four sampling points were set at equal intervals along the way, which lied in different plant areas respectively (Figure 4).

2.2.1. Experimental Design of Blank Ditch

The blank ditch referred to a model of a ditch without plants and matrix dams which was only filled with on-site soil (hereinafter referred to as the soil ditch). According to the actual monitoring results of the paddy field, the average concentrations of the NO3-N, NH4+-N, and P in the test water were 1 mg/L, 5 mg/L, and 0.5 mg/L, respectively, and the water flow rate was controlled at 300 L/h. The reagents for configuring N and P pollutants were potassium nitrate, potassium dihydrogen phosphate, and ammonium chloride. In order to restore the actual state of the farmland drainage ditch, the farmland water was soaked for about 20 days before the test. The test period lasted for six days; considering the different growth conditions of plants and some microorganisms during the day and night, samples from the four sampling points along the ditch with overlaying water, interstitial water, and sediment were taken at 9:00 a.m. and 9:00 p.m. to supervise the concentrations of different forms of N and P pollutants, taking three sets of parallel samples each time; we sequenced the microorganisms in the sediment samples taken on the sixth day of the experiment.

2.2.2. Experimental Design of Eco-Ditch

We constructed the test model of eco-ditches combining plants and matrix dams. The water quality, flow and sampling time of the eco-ditch test were the same as the blank test. The microorganisms in the sediment samples taken on the sixth day of the experiment were sequenced. At the same time, the zeolite dam substrate was taken for microscopic morphological observation.

2.3. Sample Collection and Analysis

2.3.1. Collection and Analysis of the Monitoring Samples of N and P in Water and Sediment

At each sampling point, 250 mL of overlying water and 1000 g of sediments were taken at the same time, and the dissolved oxygen content and pH value were measured. We took the overlying water of 250 mL from the undisturbed ditch 5 cm below the water surface, transferred it to a pre-cleaned 250 mL polyethylene bottle, and then placed the already collected ditch bottom mud in a polyethylene bag. We measured the dissolved oxygen content using an Oxi3310 (Xylem, Rye Brook, NY, USA) handheld dissolved oxygen meter, while the pH was measured using a BPH-610CK portable pH meter. The obtained overlying water and sediment were immediately measured in the laboratory for the content of various types of N and P pollutants. The sediment samples are naturally dried and ground; the TN was determined by the Kjeldahl method, and the TP was determined by the acid solution method. Part of the sediment sample was added to a polyethylene centrifuge tube and centrifuged at 3000 r/min for 20 min. The supernatant was filtered through a 0.45 μm filter membrane to obtain interstitial water samples and the water sample monitoring indicators were DTN, DTP, NH4+-N, and NO3-N. The analysis method adopted the fourth edition of “Water and Wastewater Monitoring and Analysis Method” standard method. For DTN, we used alkaline potassium persulfate digestion UV spectrophotometry. For NH4+-N, we used Nessler reagent spectrophotometry to determine content. NO3-N was determined by ultraviolet spectrophotometry. DTP was determined by molybdenum blue colorimetry.

2.3.2. Collection and Analysis of Zeolite Matrix Samples

On the sixth day of the test period, we took 200 g of the zeolite dam substrate and a Nanosem430 scanning electron microscope (FEI Company, Hillsboro, OR, USA) was used to observe the microscopic morphology of the dried zeolite dam samples at different magnifications.

2.3.3. Collection and Analysis of Microbiological Samples

We took the microbiological samples in sediments from each sampling point of the soil ditch and eco-ditch on the sixth day during the test period and used the sterilized bamboo spoon to put samples into the sterile zippered storage bag. The high-throughput sequencing technology of the Illumina platform was used to analyze the microbial community structure characteristics in the bottom of the soil ditch and eco-ditch. Sampling points 1 (yellow calamus planting area), 2 (cattail planting area), 3 (reed planting area), and 4 (lythrum planting area) for the microbiological monitoring of the eco-ditch were designated yellow calamus rhizosphere, cattail rhizosphere, reed rhizosphere, and lythrum rhizosphere bottom mud, respectively; the corresponding four soil microbial monitoring sampling points of the soil ditch were named yellow calamus non-rhizosphere, cattail non-rhizosphere, reed non-rhizosphere, and lythrum non-rhizosphere bottom mud.

3. Results

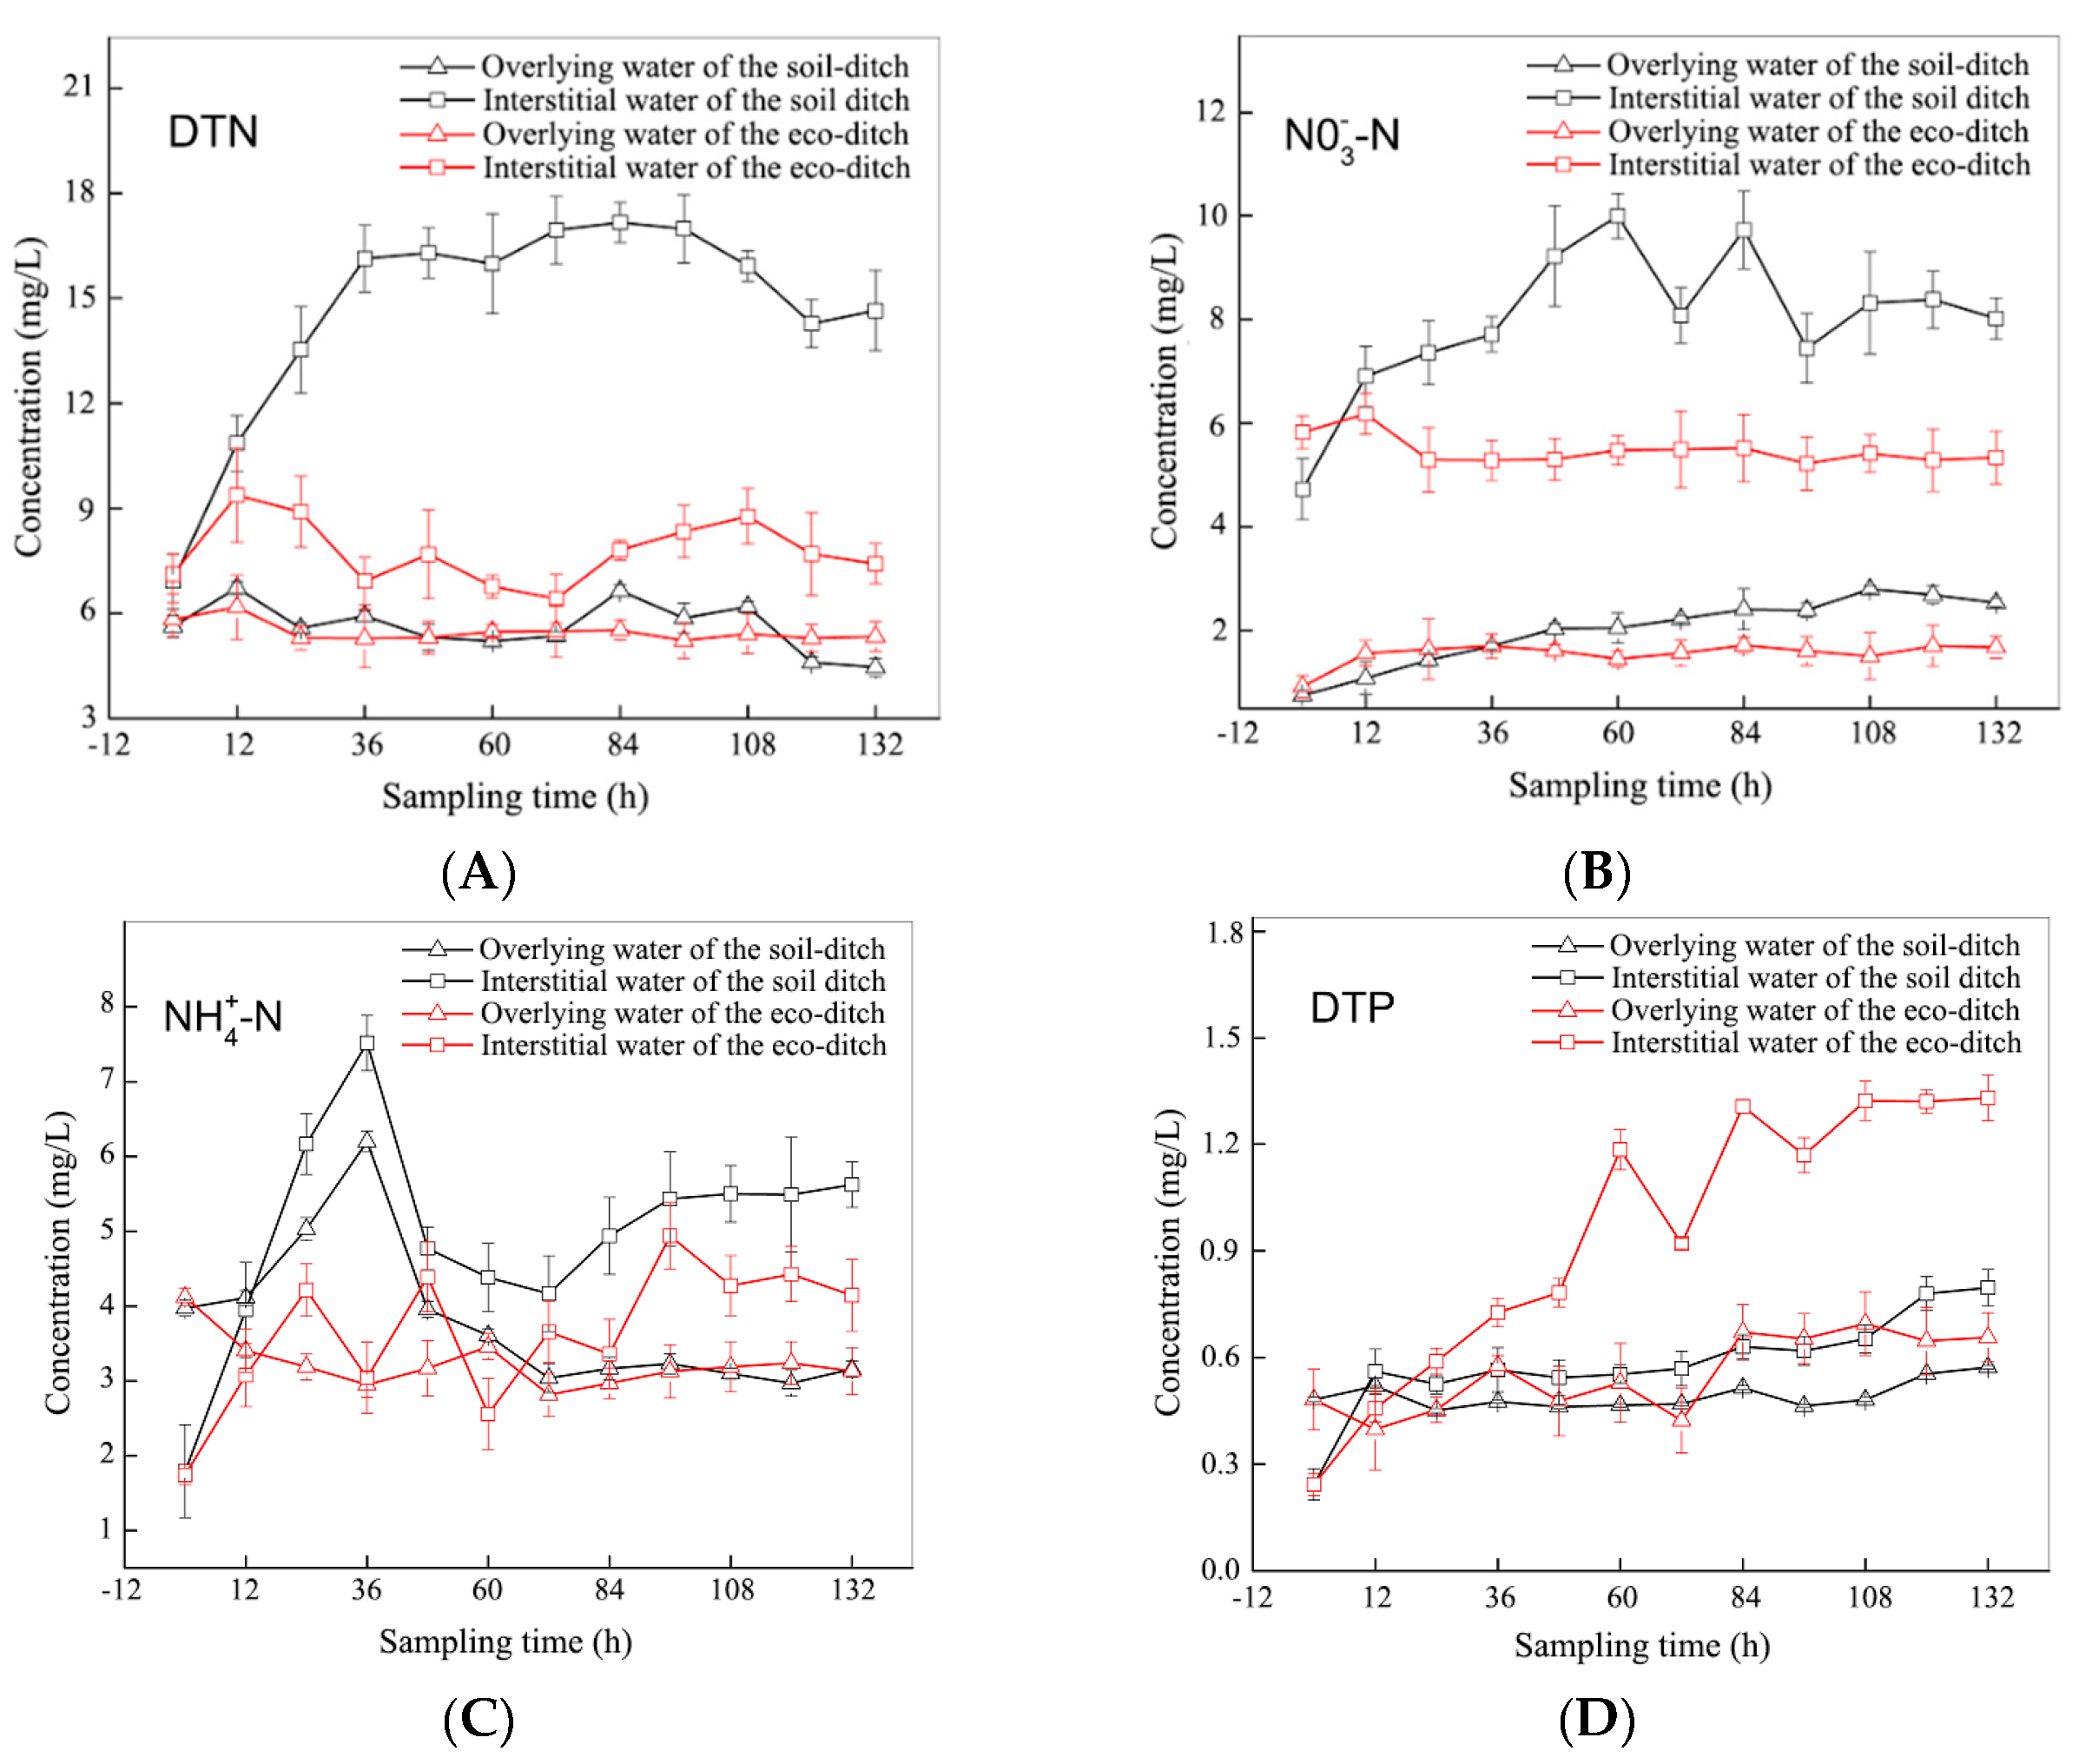
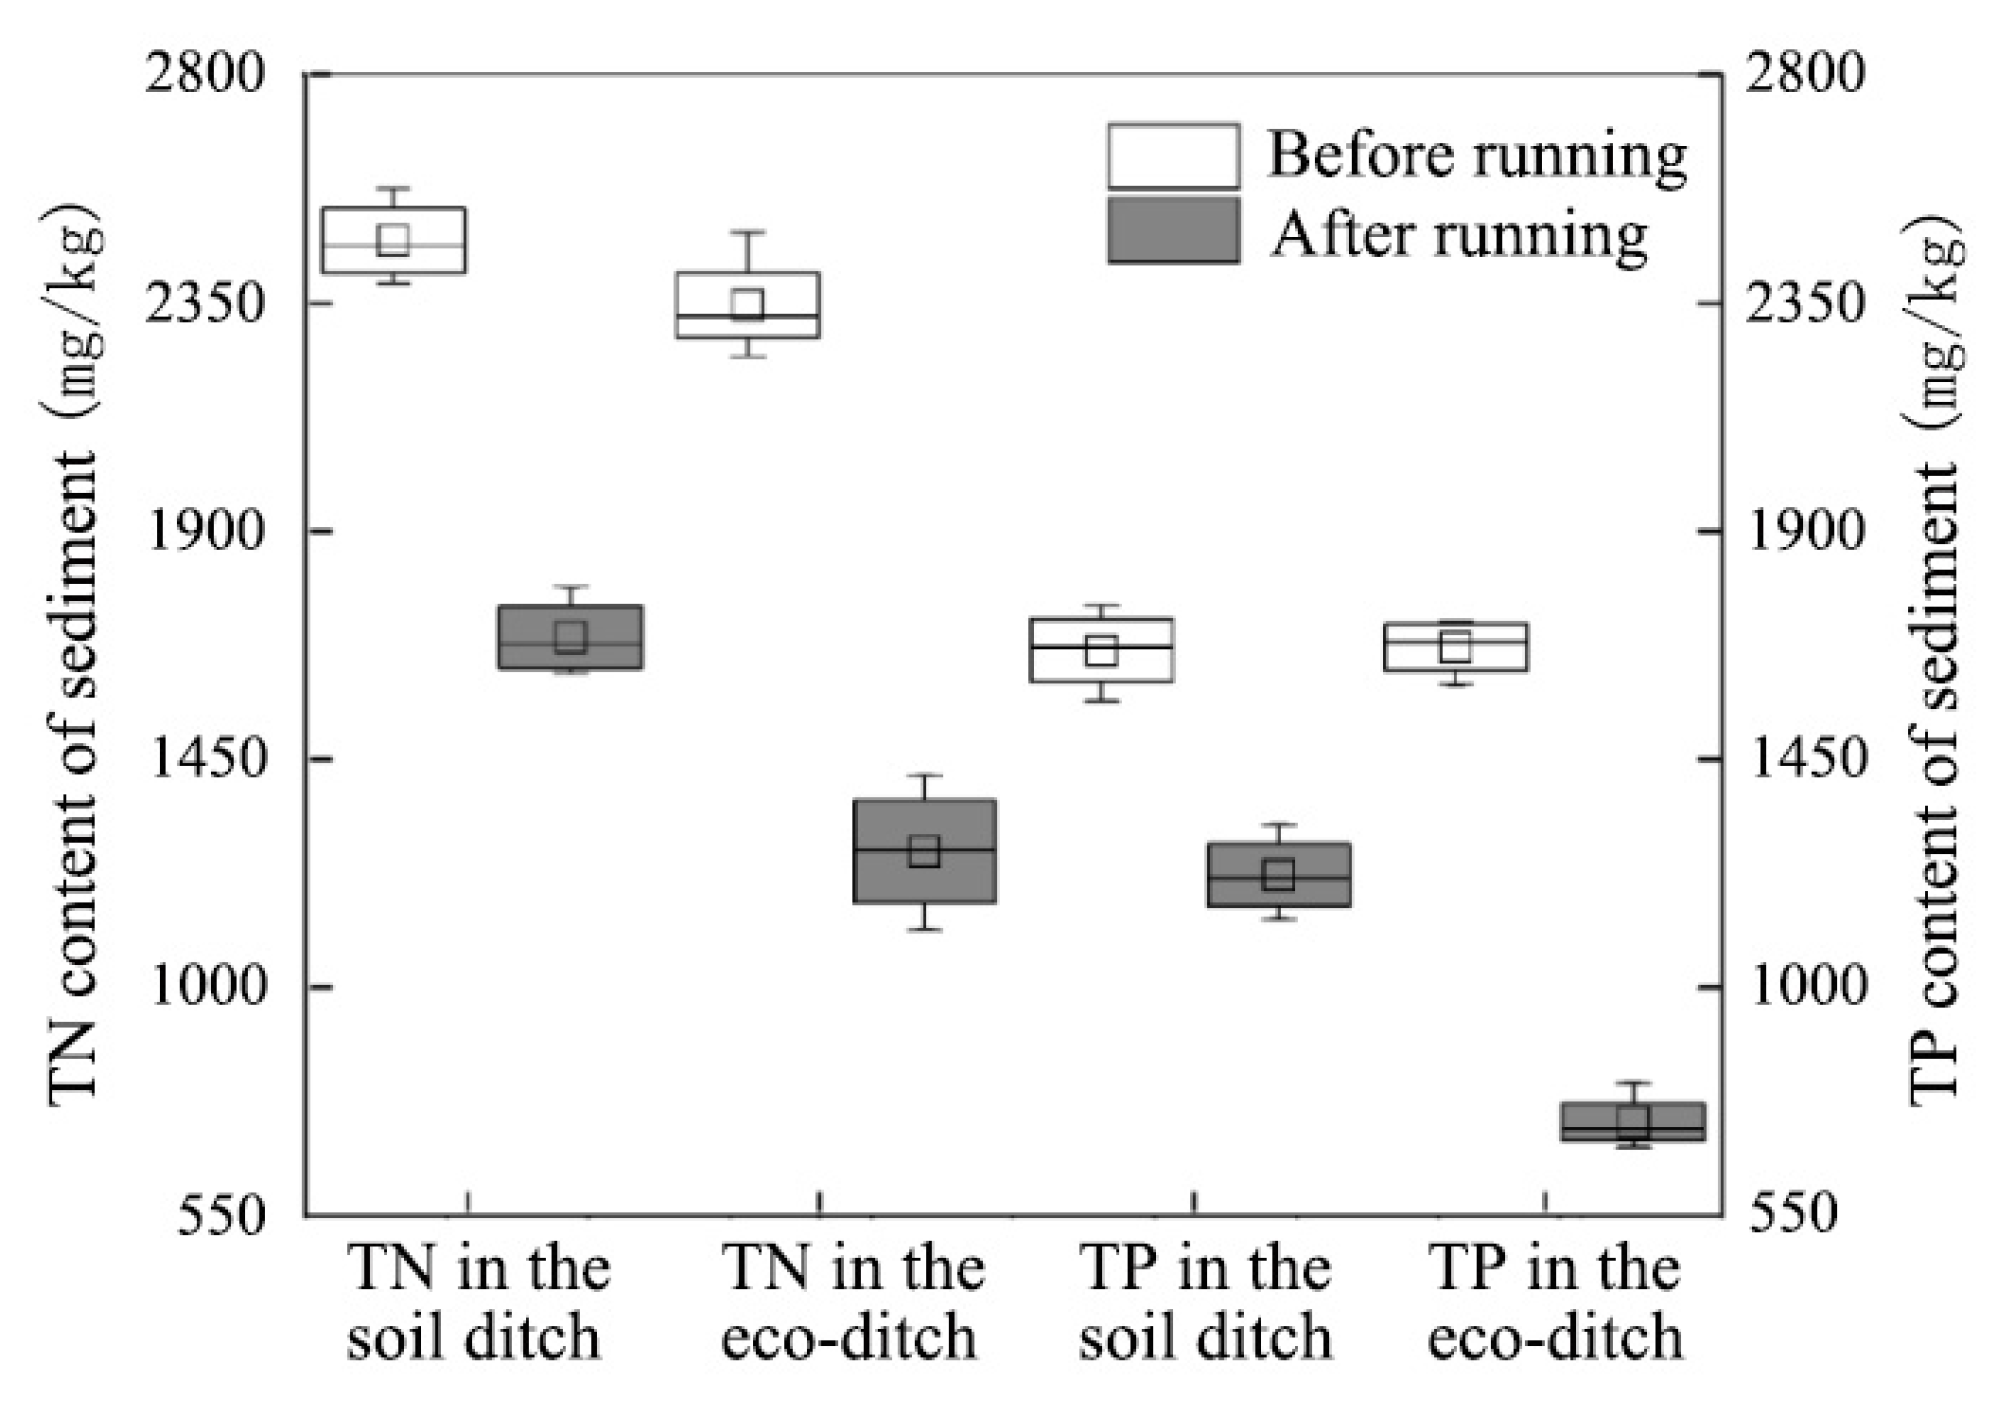
3.1. Distribution Law of N and P in Sediments, Interstitial Water, and Overlying Water in the Ecological and Soil Ditches

Due to the endogenous release of N and P in the bottom mud, the concentrations of different N and P pollutants in the interstitial and overlying waters all increased during the test period, and the main output was NO3-N (Figure 5); for both the soil and eco-ditches, the concentrations of N and P in the interstitial water were higher than in the overlying water (Figure 5), which indicated that the endogenous N and P in the sediment were released fast at first, entering the interstitial water, and were released into the overlying water along the concentration gradient between the interstitial and overlying water. At the same time, the concentrations of ammonium N, nitrate N, and total N in the overlying water of the eco-ditch were slightly lower than the combined concentration of ammonium N, nitrate N, and total N in the overlying water of the soil ditch in the test period after 12 h (Figure 5A–C), but the difference was not large (Table 1). However, the concentrations of ammonium N, nitrate N, and total N in the bottom water of the eco-ditch were much lower than those in the bottom water of the soil ditch (Figure 5A–C, Table 1). This indicated that due to the difference between the absorption of plant roots in the eco-ditch and the microbial community structure, the endogenous release of N in the sediment was effectively suppressed. However, the total P in its dissolved state was higher in the eco-ditch than the soil ditch (Figure 5D, Table 1). The ammonium N concentrations in the bottom water of the soil ditch and the overlying water had almost the same change trend (Figure 5A), but there is no significant correlation between the two (r = 0.400, p = 0.198 > 0.05), whereas the ammonium N concentrations in the interstitial water and the overlying water of the eco-ditch had a significant negative correlation (r = −0.612, p = 0.034 < 0.05). The total dissolved P followed the same change trend in the interstitial and overlying waters of the soil ditch and eco-ditch (Figure 5D), and the total dissolved P concentrations in the interstitial water and the overlying water of the eco-ditch (r = 0.610, p = 0.035 < 0.05) and the soil ditch (r = 0.798, p = 0.002 < 0.01) had a significant positive correlation. This indicated that the concentration gradients of ammonium N and total P in the interstitial and overlying waters in the bottom of the soil ditch were the main causes of pollutant transport and diffusion. The same change trend in the eco-ditch was due to the difference between plant absorption and microbial community structure; the concentration gradient diffusion can thus be destroyed, especially when using plants that are affected by plant absorption and microbial action. Compared with ammonium N and total dissolved P, the correlation between the concentration of nitrate N in the interstitial water of the bottom mud and the overlying water of the soil ditch (r = 0.678, p = 0.065 > 0.05) or the eco-ditch (r = −0.530, p = 0.077 > 0.05) was weak (Figure 5B,C). Similarly, the correlation between the concentration of total dissolved N in the interstitial water of the bottom mud and the overlying water of the soil ditch (r = −0.49, p = 0.88 > 0.05) or the eco-ditch (r = 0.250, p = 0.433 > 0.05) was also not significant (Figure 5B,C). This may have been because the total N was mainly output by nitrate N, and the concentrations of nitrate N and total N in the interstitial water were much higher than those in the overlying water, thus weakening this correlation.
The N and P contents of the sediments in both soil and eco-ditches were higher in the early stage of the experiment than in the later stage (Figure 6). During the experiment, the sediments endogenously released N and P. Simultaneously, due to the penetration of plant roots in the eco-ditch to the bottom mud, the bottom mud and the soil were loosened; due to the absorption of plant roots and strong microbial degradation, the N and P reduction in the mud was higher in the bottom of the eco-ditch than in the soil ditch. The total N content of the bottom of the soil ditch decreased by 32.7% after the test; the figures for the eco-ditch decreased by 44.1% after the test. The total P content in the bottom of the soil ditch decreased by 27.8% after the test; the figures for the eco-ditch decreased by 42.1% after the test.
Since the pollutant concentration tended to be relatively stable in the later stage of the experiment, the average of the three sampling monitoring results after the selection was used to analyze the changes in the pollutant levels in the ecological and soil ditches. The total N tended to decrease obviously in the eco-ditch and in the interstitial water in the soil ditch, while there is no significant change on the total N of overlying water in the soil ditch (Figure 7, Table 2). The average interception rates of total N in the overlying water and interstitial water of the soil ditch were 7.4% and 12.3%, respectively, and 16.9% and 19.5% in the eco-ditch, respectively. The total P did not obviously change in the soil ditch, and in the cover water in the eco-ditch, it changed considerably (Table 2). The interception rate in the soil ditch reached 29.5%, which was related to the fact that plants and dams in eco-ditches play a greater role in the interception of particulate P.
The pH in the eco-ditch was relatively stable between 7.95 and 8.01 (Figure 8, Table 3), whereas the pH in the soil ditch was relatively high, showing a decreasing trend over time from 8.26 at the beginning of the test to 8.05 at the end of the test (Figure 8, Table 3). The dissolved oxygen contents in the soil ditch and the eco-ditch showed obvious decreasing trends, especially in the soil ditch (Figure 8, Table 3); the dissolved oxygen content in the soil ditch decreased gradually, the eco-ditch showed fluctuations of decrease–recovery, and the dissolved oxygen content in the eco-ditch was generally higher than that in the soil ditch (Figure 8). This indicated that the eco-ditch has a strong reoxygenation capacity.

3.2. Analysis of the Surface Morphology of the Adsorption Matrix of the Matrix Dam of the Eco-Ditch

Natural zeolite is a cluster-like structure of hydrous silicate minerals. The most basic structures that constitute its skeleton are the silicon oxide (SiO4) tetrahedron and the aluminum oxide (AlO4) tetrahedron [21,22]. The zeolite framework has well-developed pore and channel structures. Therefore, it has strong adsorption properties. The surface of the zeolite was rough and there were many micropore structures (Figure 9A,B). The diameter of the pores was 0.6–1.5 nm, the diameter of the channels was 0.3–1 nm, and the diameter of NH4+ is 0.286 nm, so zeolite could remove ammonium N from the water via the adsorption of molecular ammonium. A large number of mycelia attached to the surface of the zeolite dam substrate (Figure 9B,C) because the large specific surface area and voids of the zeolite provided a good attachment framework for the microorganisms, and the richer nutrients in the ditch also provided good conditions for the reproduction of a large number of microorganisms on the surface of the zeolite. The attached microorganisms not only produced a certain nutrient absorption effect, but also provided the zeolite dam matrix with a certain in situ regeneration ability. Therefore, an eco-ditch equipped with a zeolite dam can better and more stably intercept pollutants to create a purification effect.

3.3. Analysis of the Characteristics of Microbial Communities in the Sediments of Ecological and Soil Ditches

The Shannon indexes, Chao1 indexes, and coverage indexes [23] of the Alpha diversity analysis of the microbial community in the sediments of the four aquatic plant roots in the eco-ditch and the corresponding sampling points in the soil ditch are shown in Table 4. Diversity is represented by the Shannon index, richness is represented by the Chao1 index, and sequencing coverage is represented by the coverage index. The richness index of the bottom mud of the eco-ditch was higher than that of the soil ditch (Table 4), which showed that the living environment created by aquatic plants increased the microbial abundance of the bottom mud, which is more conducive to the purification of pollutants. The Shannon diversity indexes of the roots of the yellow calamus, cattail, and lythrum of the eco-ditch were greater than those of the soil ditch. However, the Shannon diversity index of the reed roots was lower than the diversity index of the bottom of the soil ditch.
From the point of view of the dilution curve, as the sequencing number increased, the slope of the dilution curve gradually decreased and tended to flatten (Figure 10), indicating that the sampling was reasonable and truly reflected the microbial community of the sample. The coverage rate of each sample was above 0.97, indicating that sequencing the amount of data was more appropriate and the results were reliable.
The four aquatic plant sediment microorganisms and soil ditch sediment microorganisms with an abundance of more than 1% in the eco-ditch spanned 14 categories (Figure 11A). These were mainly Proteobacteria, Chloroflexi, Actinomycetes, and Acidobacteria, which accounted for about 70% to 80% of the total sequencing data. There were eight categories with more than 1% microbial abundance in the bottom of the soil ditch (Figure 11B), which was lower than the microbial diversity of the plant rhizosphere soil. These samples were also mainly made up of Proteobacteria, Chloroflexi, Actinomycetes, and Acidobacteria. These four groups accounted for about 68% to 80% of the total sequencing data.
Although the main dominant bacterial categories of the eco-ditch and the soil ditch were the same, the relative abundance of each category was different. In both ditches, Proteobacteria was the largest category of bacteria (Figure 12). The relative abundance of Proteobacteria in the sediments of the eco-ditch was 30.41% but was only 25.33% in the soil ditch. The number of species in the sediment was much higher than in the soil ditch (Figure 12), which indicated that the growth of aquatic plants changed the microenvironment of the sediment in the ditch.

4. Discussion

Comparing the changes between the concentrations of pollutants in the interstitial and overlying waters in the ecological and soil ditches, and the microbial community structure in the sediment, we found that the main reason that the eco-ditch more effectively inhibited the endogenous release of pollutants compared to the soil ditch was that the root system of plants played a major role. Firstly, due to the absorption of plant roots, it directly absorbs part of the endogenous nitrogen and phosphorus in the interstitial water. Secondly, although the microorganisms in the soil ditch and eco-ditch undergo oxygen-consuming degradation, which resulted in a decrease in the dissolved oxygen content in the water body of the ditch (Figure 8), the presence of plants in the eco-ditch helps the atmosphere to transport oxygen to the ditch through the plants [24], and that is the reason the dissolved oxygen content of the eco-ditch was generally higher than that of the soil ditch. Thirdly, the growth of aquatic plants can change the microenvironment of the sediment in the eco-ditch such that it can meet the survival of more types of microorganisms, resulting in a much higher number of species in the sediment of the ecological ditch than in the soil ditch (Figure 11). In addition, our results showed that bacteria in the phylum Proteobacteria, Chloroflexi, Actinomycetes, and Acidobacteria accounted for about 75% of the total sequencing data. This shows that the dominant species composition of microorganisms in the sediments of the eco-ditch is similar to those in sediments of rivers, lakes, and wetlands, and eco-ditches have the characteristics of linear wetlands [25,26]. The changes in the microenvironment of the sediment can also make ecological ditches more suitable for microbial reproduction. The number of many bacteria has increased significantly, especially the Proteobacteria in which the degradation process of some pollutants, biological denitrification, and P removal play a central role [27]; this makes ecological ditches more conducive to the purification effect of microorganisms on the N and P pollutants in the water [28]. Of course, we also got some unexpected results. However, the TP in its dissolved state was higher in the eco-ditch than the soil ditch since the plant roots produce acidic substances, which will promote the endogenous release of P in sediments with a higher P content, resulting in higher TP content in the ecological ditches than the soil ditch. This result is the same as that of Yu, J. et al. [29]. In addition, we find that the Shannon index of the reed root sediment in the ecological ditch was lower than that of the soil ditch sediment. The reason for this result may be that the reed root sediments increased a relatively large number of new species over a certain period compared with other root sediments, resulting in a dilution effect [30]. Instead, its Shannon community diversity index has declined.

5. Conclusions

The noteworthy results from this study are as follows:
(1)
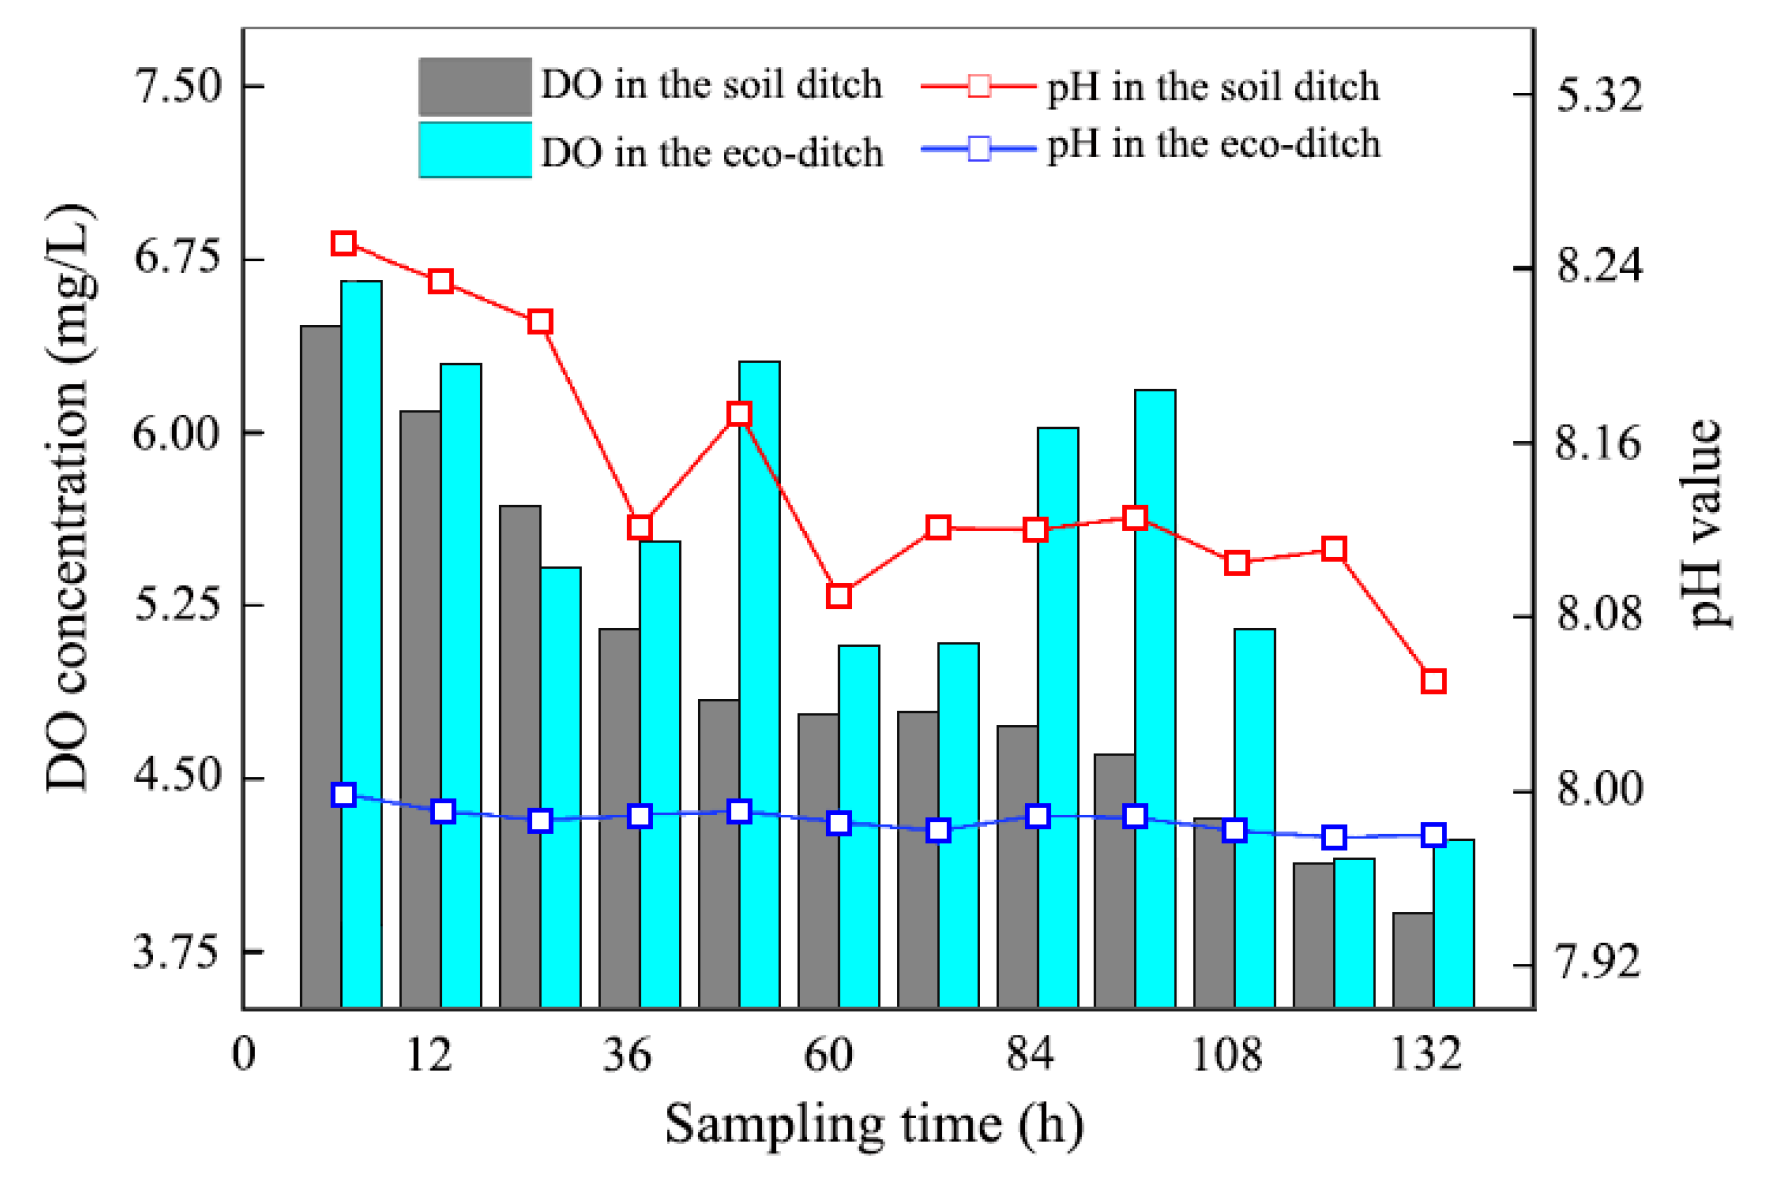
The concentration gradient is the main cause of pollutant transport and diffusion, and the eco-ditch weakens this concentration gradient diffusion via the comprehensive function of plants and abundant microbial activities. The functions of eco-ditch plants and the structure of the microorganism community effectively inhibits the endogenous release of sediment N, which mainly acts on the interstitial water. The total N mainly depends on the nitrate N output, and no obvious correlation exists between the nitrate N and dissolved total N in sediment, interstitial water, and overlying water. Compared with soil ditches, eco-ditches have a stronger reoxygenation capacity and a better pollutant interception effect. The attenuation in N and P in the interstitial water was slightly higher than that in the overlying water.
(2)
A large number of mycelia exist on the surface of the dam substrate of eco-ditches. The large surface area and clearance also provide a good attachment framework for microorganisms; the low-water substrate dam extends the residence time of the water flow, which is beneficial for the eco-ditch’s adsorbing and purification of pollutants in water bodies.
(3)
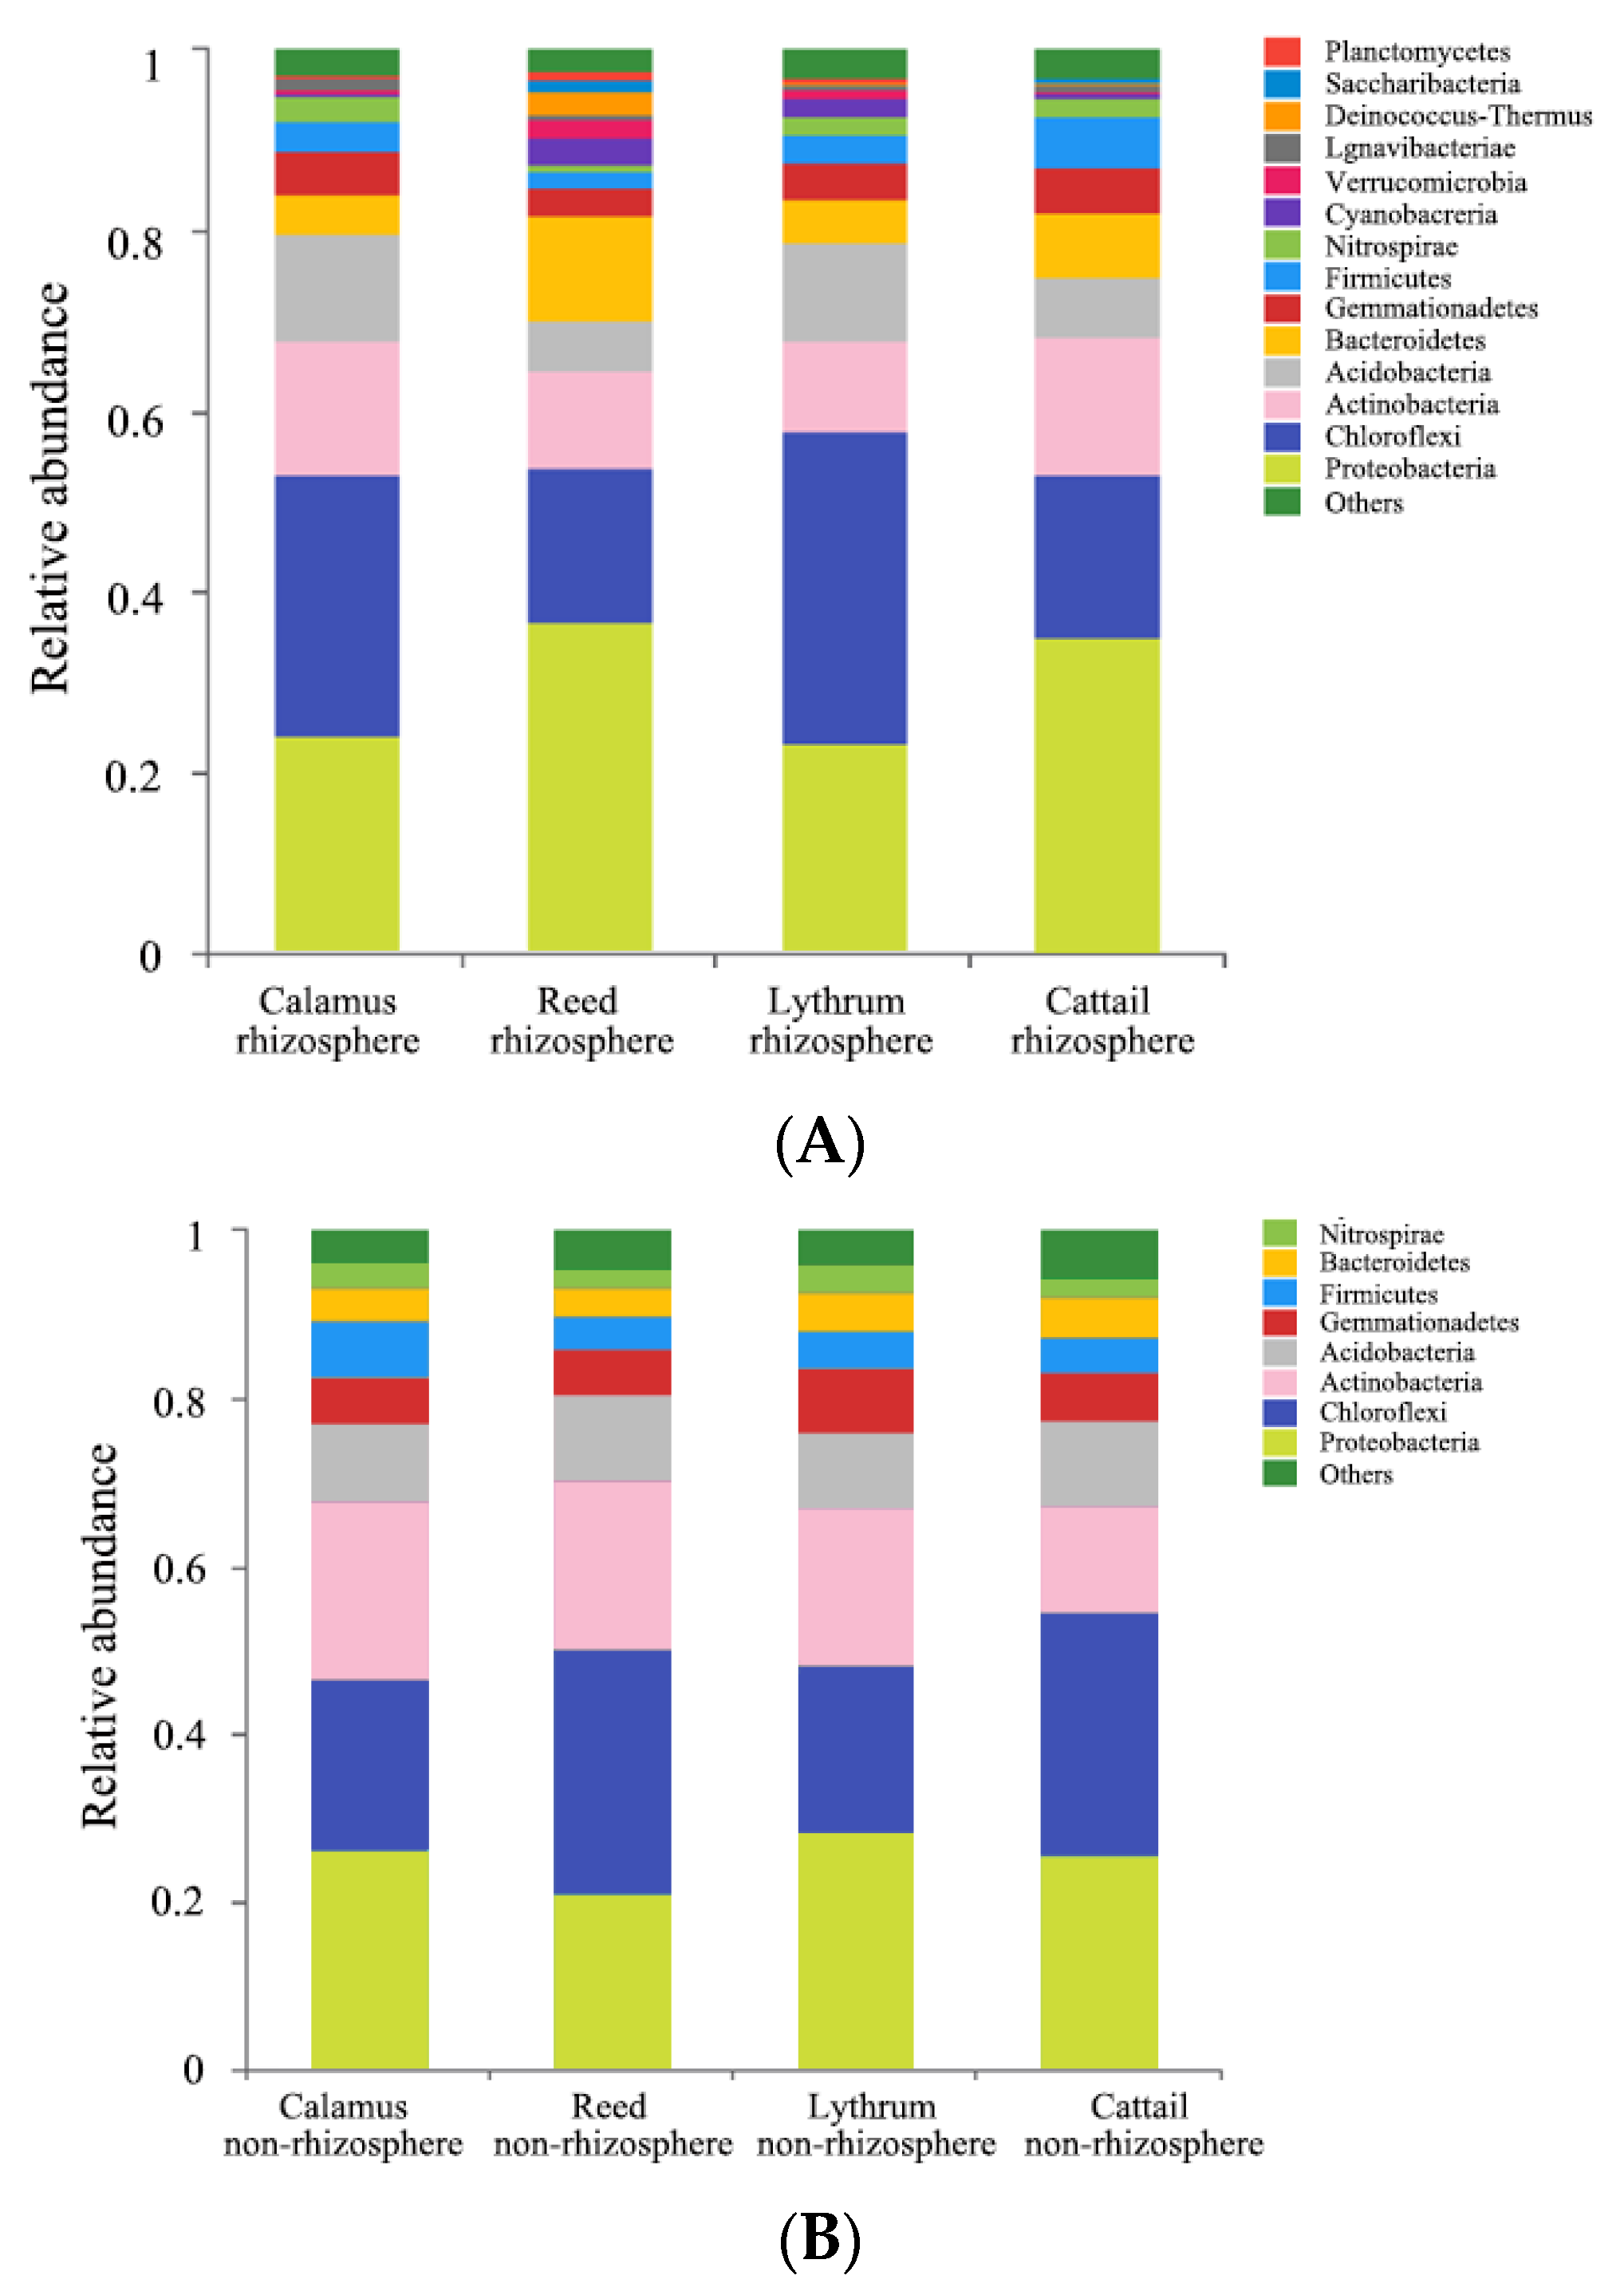
The sediments of ecological and soil ditches are dominated by Proteobacteria, Chloroflexi, Actinomycetes, and Acidobacteria, a species composition resembling that of some rivers, lakes, and wetland sediments. This indicated that the farmland drainage ditches can be characterized as linear wetlands. The microbial diversity and abundance in the eco-ditch were higher than in the soil ditch. Proteobacteria, which play a central role in the degradation of pollutants such as biological N and P, were found in the eco-ditch with a relative abundance in sediment (30.41%) higher than that in the soil ditch (25.33%). The growth of aquatic plants in the eco-ditch changed the microenvironment of the sediment, which was beneficial for the purification effect of microorganisms on N and P pollutants in water.

Author Contributions

Y.L. and S.L. conceived, designed, and wrote the paper; X.W. provided the help of program implementation and funds; Y.A. and R.W. revised the manuscript. All authors have read and agreed to the published version of the manuscript.

Funding

This research was supported by the Water Pollution Control and Management of National Science and Technology Major Projects in China (2017ZX07204-003).

Conflicts of Interest

The authors declare no conflict of interest.

References

  1. Dal Ferro, N.; Ibrahim, H.M.S.; Borin, M. Newly-established free water-surface constructed wetland to treat agricultural waters in the low-lying venetian plain: Performance on nitrogen and phosphorus removal. Sci. Total Environ. 2018, 639, 852–859. [Google Scholar] [CrossRef]
  2. Chen, C.; Yu, Z.B.; Xiang, L.; He, J.J.; Fu, X.L. Effects of rainfall intensity and amount on the transport of total nitrogen and phosphorus in a small agricultural watershed. Appl. Mech. Mater. 2012, 212–213, 268–271. [Google Scholar] [CrossRef]
  3. Han, J.G.; Li, Z.B.; Li, P. Nitrogen and phosphorous concentrations in runoff from a purple soil in an agricultural watershed. Agric. Water Manag. 2010, 97, 757–762. [Google Scholar] [CrossRef]
  4. Hu, Q.H.; Zhu, Y.M.; Song, J.; Li, Z.Y.; Wen, J.J. Effects of Ph and Eh on release of nitrogen and phosphorus from sediments of West Lake. J. Zhejiang Univ. Sci. 2003, 4, 358–362. [Google Scholar] [CrossRef] [PubMed]
  5. Wang, Y.Q.; Xue, P.Y.; Geng, L.P.; Chen, M.M.; Sun, H.X.; Wang, D.W.; Feng, Y.J.; Wang, D.M. Distribution characteristics of nitrogen and phosphorus in sediments-submerged macrophytes-water systems of Baiyangdian Lake. J. Soil Water Conserv. 2017, 31, 304–309. [Google Scholar]
  6. Norris, B.; Laws, E.A. Nutrients and phytoplankton in a shallow, hypereutrophic urban lake: Prospects for restoration. Water 2017, 9, 431. [Google Scholar] [CrossRef] [Green Version]
  7. Li, S.M.; Wang, X.L.; Tu, J.M.; Qiao, B.; Li, J.S. Nitrogen removal in an ecological ditch based on an orthogonal test. Water Air Soil Pollut. 2016, 227, 396. [Google Scholar] [CrossRef]
  8. Kumwimba, M.N.; Zhu, B. Effectiveness of vegetated drainage ditches for domestic sewage effluent mitigation. Bull. Environ. Contam. Toxicol. 2017, 98, 682–689. [Google Scholar] [CrossRef]
  9. Taylor, J.M.; Moore, M.T.; Scott, J.T. Contrasting nutrient mitigation and denitrification potential of agricultural drainage environments with different emergent aquatic macrophytes. J. Environ. Qual. 2015, 44, 1304–1314. [Google Scholar] [CrossRef] [Green Version]
  10. Lavrnic, S.; Braschi, I.; Anconelli, S.; Blasioli, S.; Solimando, D.; Mannini, P. Long-term monitoring of a surface flow constructed wetland treating agricultural drainage water in northern italy. Water 2018, 10, 644. [Google Scholar] [CrossRef] [Green Version]
  11. Kumwimba, M.N.; Zhu, B.; Muyembe, D.K.; Dzakpasu, M. Growth characteristics and nutrient removal capability of eco-ditch plants in mesocosm sediment receiving primary domestic wastewater. Environ. Sci. Pollut. Res. 2017, 24, 23926–23938. [Google Scholar] [CrossRef] [PubMed]
  12. Xiong, Y.; Peng, S.; Luo, Y. A paddy eco-ditch and wetland system to reduce non-point source pollution from rice-based production system while maintaining water use efficiency. Environ. Sci. Pollut. Res. 2015, 22, 4406–4417. [Google Scholar] [CrossRef] [PubMed]
  13. Olli, G.; Amélie, D.; Destouni, G. Field study of phosphorous transport and retention in drainage reaches. J. Hydrol. 2009, 365, 46–55. [Google Scholar] [CrossRef]
  14. Zhou, L.; Bai, C.R.; Cai, J. Bio-cord plays a similar role as submerged macrophytes in harboring bacterial assemblages in an eco-ditch. Environ. Sci. Pollut. Res. 2018, 25, 26550–26561. [Google Scholar] [CrossRef]
  15. Wang, X.L.; Qiao, B.; Li, S.M.; Li, J.S. Using natural Chinese zeolite to remove ammonium from rainfall runoff following urea fertilization of a paddy rice field. Environ. Sci. Pollut. Res. 2016, 23, 5342–5351. [Google Scholar] [CrossRef]
  16. Wang, X.L.; Li, J.S.; Li, S.M.; Zheng, X.T. A study on removing nitrogen from paddy field rainfall runoff by an ecological ditch–zeolite barrier system. Environ. Sci. Pollut. Res. 2017, 24, 27090–27103. [Google Scholar] [CrossRef]
  17. Bangalee, M.Z.I.; Miau, J.J.; Lin, S.Y.; Yang, J.H. Flow visualization, PIV measurement and CFD calculation for fluid-driven natural cross-ventilation in a scale model. Energy Build. 2013, 66, 306–314. [Google Scholar] [CrossRef]
  18. Gao, Y.; Yin, C.; Zhao, Y.; Liu, Z.; Guan, B. Effects of diversity, coverage and biomass of submerged macrophytes on nutrient concentrations, water clarity and phytoplankton biomass in two restored shallow lakes. Water 2020, 12, 1425. [Google Scholar] [CrossRef]
  19. Tian, W.H.; Wen, X.H.; Cui, Y.P.; Q, Y. Influence of filter particle size on nitrification performance of aerated biological filter. CHN. Water Wastewater 2003, 19, 48–50. [Google Scholar]
  20. Yu, J.; Zhong, J.; Chen, Q.; Huang, W.; Fan, C. An investigation of the effects of capping on internal phosphorus release from sediments under rooted macrophytes (Phragmites Australis) revegetation. Environ. Sci. Pollut. Res. 2018, 25, 24682–24694. [Google Scholar] [CrossRef]
  21. Widiastuti, N.; Wu, H.; Ang, H.M.; Zhang, D. Removal of ammonium from greywater using natural zeolite. Desalination 2011, 277, 15–23. [Google Scholar] [CrossRef]
  22. Davis, M.E.; Lobo, R.F. Zeolite and molecular sieve synthesis. Chem. Mater. 1992, 4, 756–768. [Google Scholar] [CrossRef]
  23. Magurran, A.E. Ecological Diversity and Its Measurement; Princeton University Press: Princeton, NJ, USA, 1988; pp. 81–99. ISBN 978-94-015-7360-3. [Google Scholar]
  24. Ayi, Q.L.; Zeng, B.; Liu, J.H.; Li, S.Q.; van Bodegom, P.M.; Cornelissen, J.H.C. Oxygen absorption by adventitious roots promotes the survival of completely submerged terrestrial plants. Ann. Bot. 2016, 118, 675–683. [Google Scholar] [CrossRef] [PubMed]
  25. Ansola, G.; Arroyo, P.; Miera, L.E.S.D. Characterisation of the soil bacterial community structure and composition of natural and constructed wetlands. Sci. Total Environ. 2014, 473, 63–71. [Google Scholar] [CrossRef] [PubMed]
  26. Sharpley, A.N.; Krogstad, T.; Kleinman, P.J.A.; Haggard, B.; Shigaki, F.; Saporito, L.S. Managing natural processes in drainage ditches for nonpoint source phosphorus control. J. Soil Water Conserv. 2007, 62, 197–206. [Google Scholar] [CrossRef]
  27. Li, P.; Bi, X.J.; Wang, J.; Ru, S.G. Microbial diversity in activated sludges of conventional and reversed A~2/O processes. China Environ. Sci. 2017, 37, 1137–1145. [Google Scholar]
  28. Ciccazzo, S.; Esposito, A.; Rolli, E.; Zerbe, S.; Daffonchio, D.; Brusetti, L. Safe-site effects on rhizosphere bacterial communities in a high-altitude alpine environment. Biomed Res. Int. 2014, 2014, 480170. [Google Scholar] [CrossRef] [PubMed]
  29. Jia, X.Y.; Otte, M.L.; Liu, Y.; Qin, L.; Tian, X.; Lu, X.G.; Jiang, M.; Zou, Y.C. Performance of iron plaque of wetland plants for regulating iron, manganese, and phosphorus from agricultural drainage water. Water 2018, 10, 42. [Google Scholar] [CrossRef] [Green Version]
  30. Taylor, J.; Moore, M.; Speir, S.L.; Testa, S. Vegetated ditch habitats provide net nitrogen sink and phosphorus storage capacity in agricultural drainage networks despite senescent plant leaching. Water 2020, 12, 875. [Google Scholar] [CrossRef] [Green Version]
Figure 1. The location of the ditch and its prototype.
Water 12 02553 g001
Figure 2. Top view of eco-ditch model design (A); front view of eco-ditch model design (B).
Water 12 02553 g002
Figure 3. Plant-free soil ditch model (A); eco-ditch with plants and matrix dam (B).
Water 12 02553 g003
Figure 4. Holes of water distribution (A); distribution of sampling points (B).
Water 12 02553 g004
Figure 5. Changes of NH4+-N (A), NO3-N (B), DTN (C), and DTP (D) in sediments and overlying water of the eco-ditch and the soil ditch over time.
Water 12 02553 g005
Figure 6. Changes of N and P concentration of sediments before and after experiments in the eco-ditch and the soil ditch.
Water 12 02553 g006
Figure 7. Changes of TN and TP concentrations along the way in the eco-ditch and the soil ditch.
Water 12 02553 g007
Figure 8. Changes of pH and dissolved oxygen (DO) in the eco-ditch and the soil ditch over time.
Water 12 02553 g008
Figure 9. SEM images of zeolite dam matrix at different magnifications: X500 (A); X2000 (B); X10000 (C).
Water 12 02553 g009
Figure 10. Shannon index dilution curve (A); Chao1 index dilution curve (B).
Water 12 02553 g010
Figure 11. Species structure in the eco-ditch (A) and in the soil ditch (B).
Water 12 02553 g011
Figure 12. Computation of the sample mean of community composition of the eco-ditch (A) and the soil ditch (B).
Water 12 02553 g012
Table 1. Effect of ditch types on water quality parameters of interstitial water and overlying water of ditches.
Ditch TypeInterstitial WaterOverlying Water
NH4+-NNO3-NTNTPNH4+-NNO3-NTNTP
(mg L−1)(mg L−1)(mg L−1)(mg L−1)(mg L−1)(mg L−1)(mg L−1)(mg L−1)
Ecological Ditch3.65 (0.88) a5.47 (0.26) a7.77 (0.88) a0.95 (0.37) a3.23 (0.32) a1.56 (0.21) a5.47 (0.26) a0.56 (0.11) a
Soil Ditch4.98 (1.33) b8.00 (1.34) b14.64 (2.90) b0.59 (0.13) b3.80 (0.93) a2.01 (0.62) a5.63 (0.68) a0.49 (0.04) a
Note: 1. Average value is shown with S.E. in brackets. 2. Values with superscript letters a and b are significantly different within columns (Tukey’s test at 5% level).
Table 2. Effect of sampling locations on water quality parameters of interstitial water and overlying water of the two ditches.
Sampling LocationInterstitial Water in Ecological DitchInterstitial Water in Soil DitchOverlying Water in Ecological DitchOverlying Water in Soil Ditch
TNTPTNTPTNTPTNTP
(mg L−1)(mg L−1)(mg L−1)(mg L−1)(mg L−1)(mg L−1)(mg L−1)(mg L−1)
Entrance8.90 (0.02) a1.38 (0.00) a16.10 (0.10) a0.68 (0.02) a5.89 (0.14) a0.76 (0.01) a5.31 (1.10) a0.53 (0.01) a
1/3 Section8.61 (0.14) b1.37 (0.00) ab15.62 (0.28) b0.73 (0.00) ab5.27 (0.09) b0.72 (0.01) b5.25 (1.08) a0.54 (0.01) a
2/3 Section7.32 (0.02) c1.36 (0.00) b14.12 (0.09) c0.80 (0.00) b5.29 (0.01) b0.59 (0.00) c4.90 (0.34) a0.53 (0.01) a
Export7.16 (0.05) c1.32 (0.01) c14.11 (0.08) c0.76 (0.00) ab4.90 (0.15) c0.52 (0.00) d4.92 (0.88) a0.53 (0.01) a
Note: 1. Average value is shown with S.E. in brackets. 2. Values with superscript letters a, b, and c are significantly different within columns (Tukey’s test at 5% level).
Table 3. Effect of days on DO and pH of overlying water in the two ditches.
DayOverlying Water in Ecological DitchOverlying Water in Soil Ditch
DOpHDOpH
16.41 (0.17) a8.00 (0.01) a6.22 (0.17) a8.24 (0.01) a
25.56 (0.14) b7.99 (0.01) a5.39 (0.22) b8.16 (0.04) b
35.57 (0.53) b7.99 (0.00) a4.81 (0.03) c8.13 (0.03) b
45.66 (0.41) ab7.98 (0.00) a4.73 (0.04) c8.12 (0.00) bc
55.51 (0.47) b7.99 (0.00 a4.43 (0.13) d8.11 (0.01) bc
64.29 (0.15) c7.98 (0.01) a4.03 (0.09) e8.07 (0.03) c
Note: 1. Average value is shown with S.E. in brackets. 2. Values with superscript letters a, b, c, d, and e are significantly different within columns (Tukey’s test at 5% level).
Table 4. Alpha diversity analysis of rhizosphere and non-rhizosphere soil of four aquatic plants.
SampleShannon IndexChao1 IndexCoverage Index
Yellow calamus rhizosphere6.702212137.142860.98013
Yellow calamus non-rhizosphere6.631401997.887030.98195
Cattail rhizosphere6.736782188.340.98190
Cattail non-rhizosphere6.724512088.843330.98099
Reed rhizosphere6.349872169.688170.97526
Reed non-rhizosphere6.635451977.632650.98281
Lythrum rhizosphere6.785602131.417910.98153
Lythrum non-rhizosphere6.732792063.134330.98158

