Treatment of Bio-Treated Coking Wastewater by Catalytic Ozonation with Semi-Batch and Continuous Flow Reactors


Abstract
1. Introduction
2. Experimental
2.1. Catalyst Synthesis and Characterization
2.2. Wastewater Characteristics
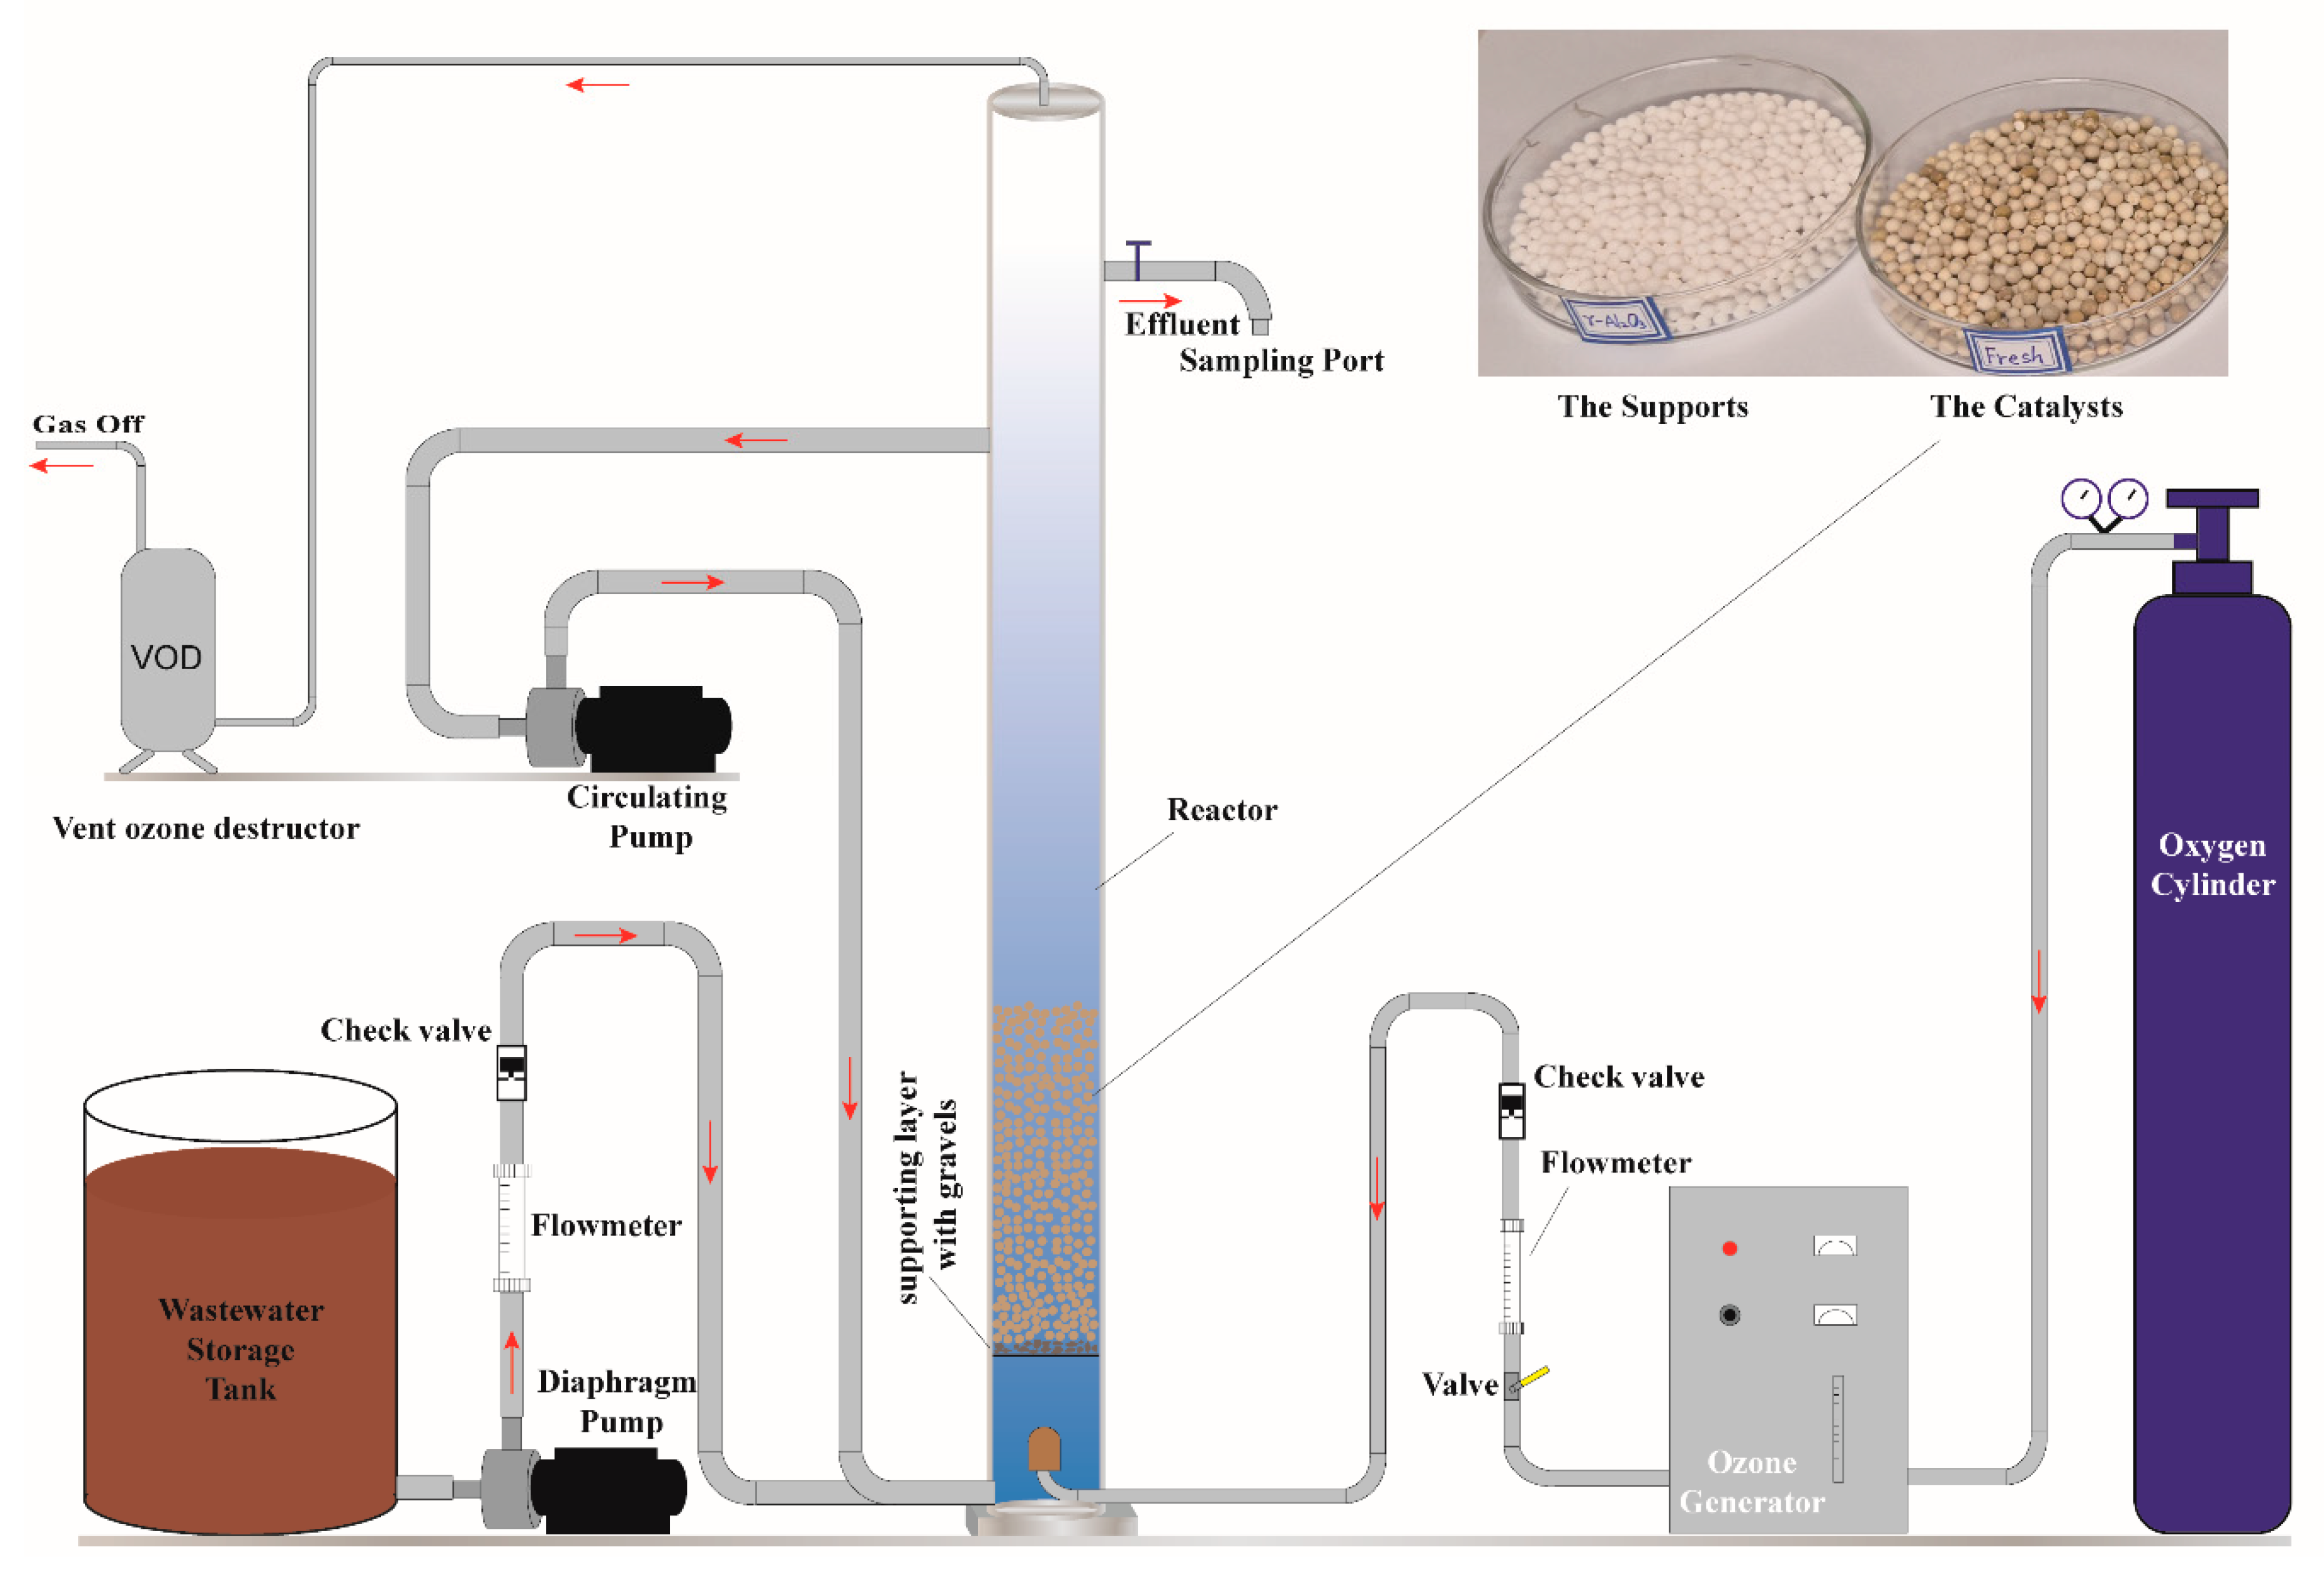
2.3. Experimental Procedure
2.4. Analytic Methods
3. Results and Discussions
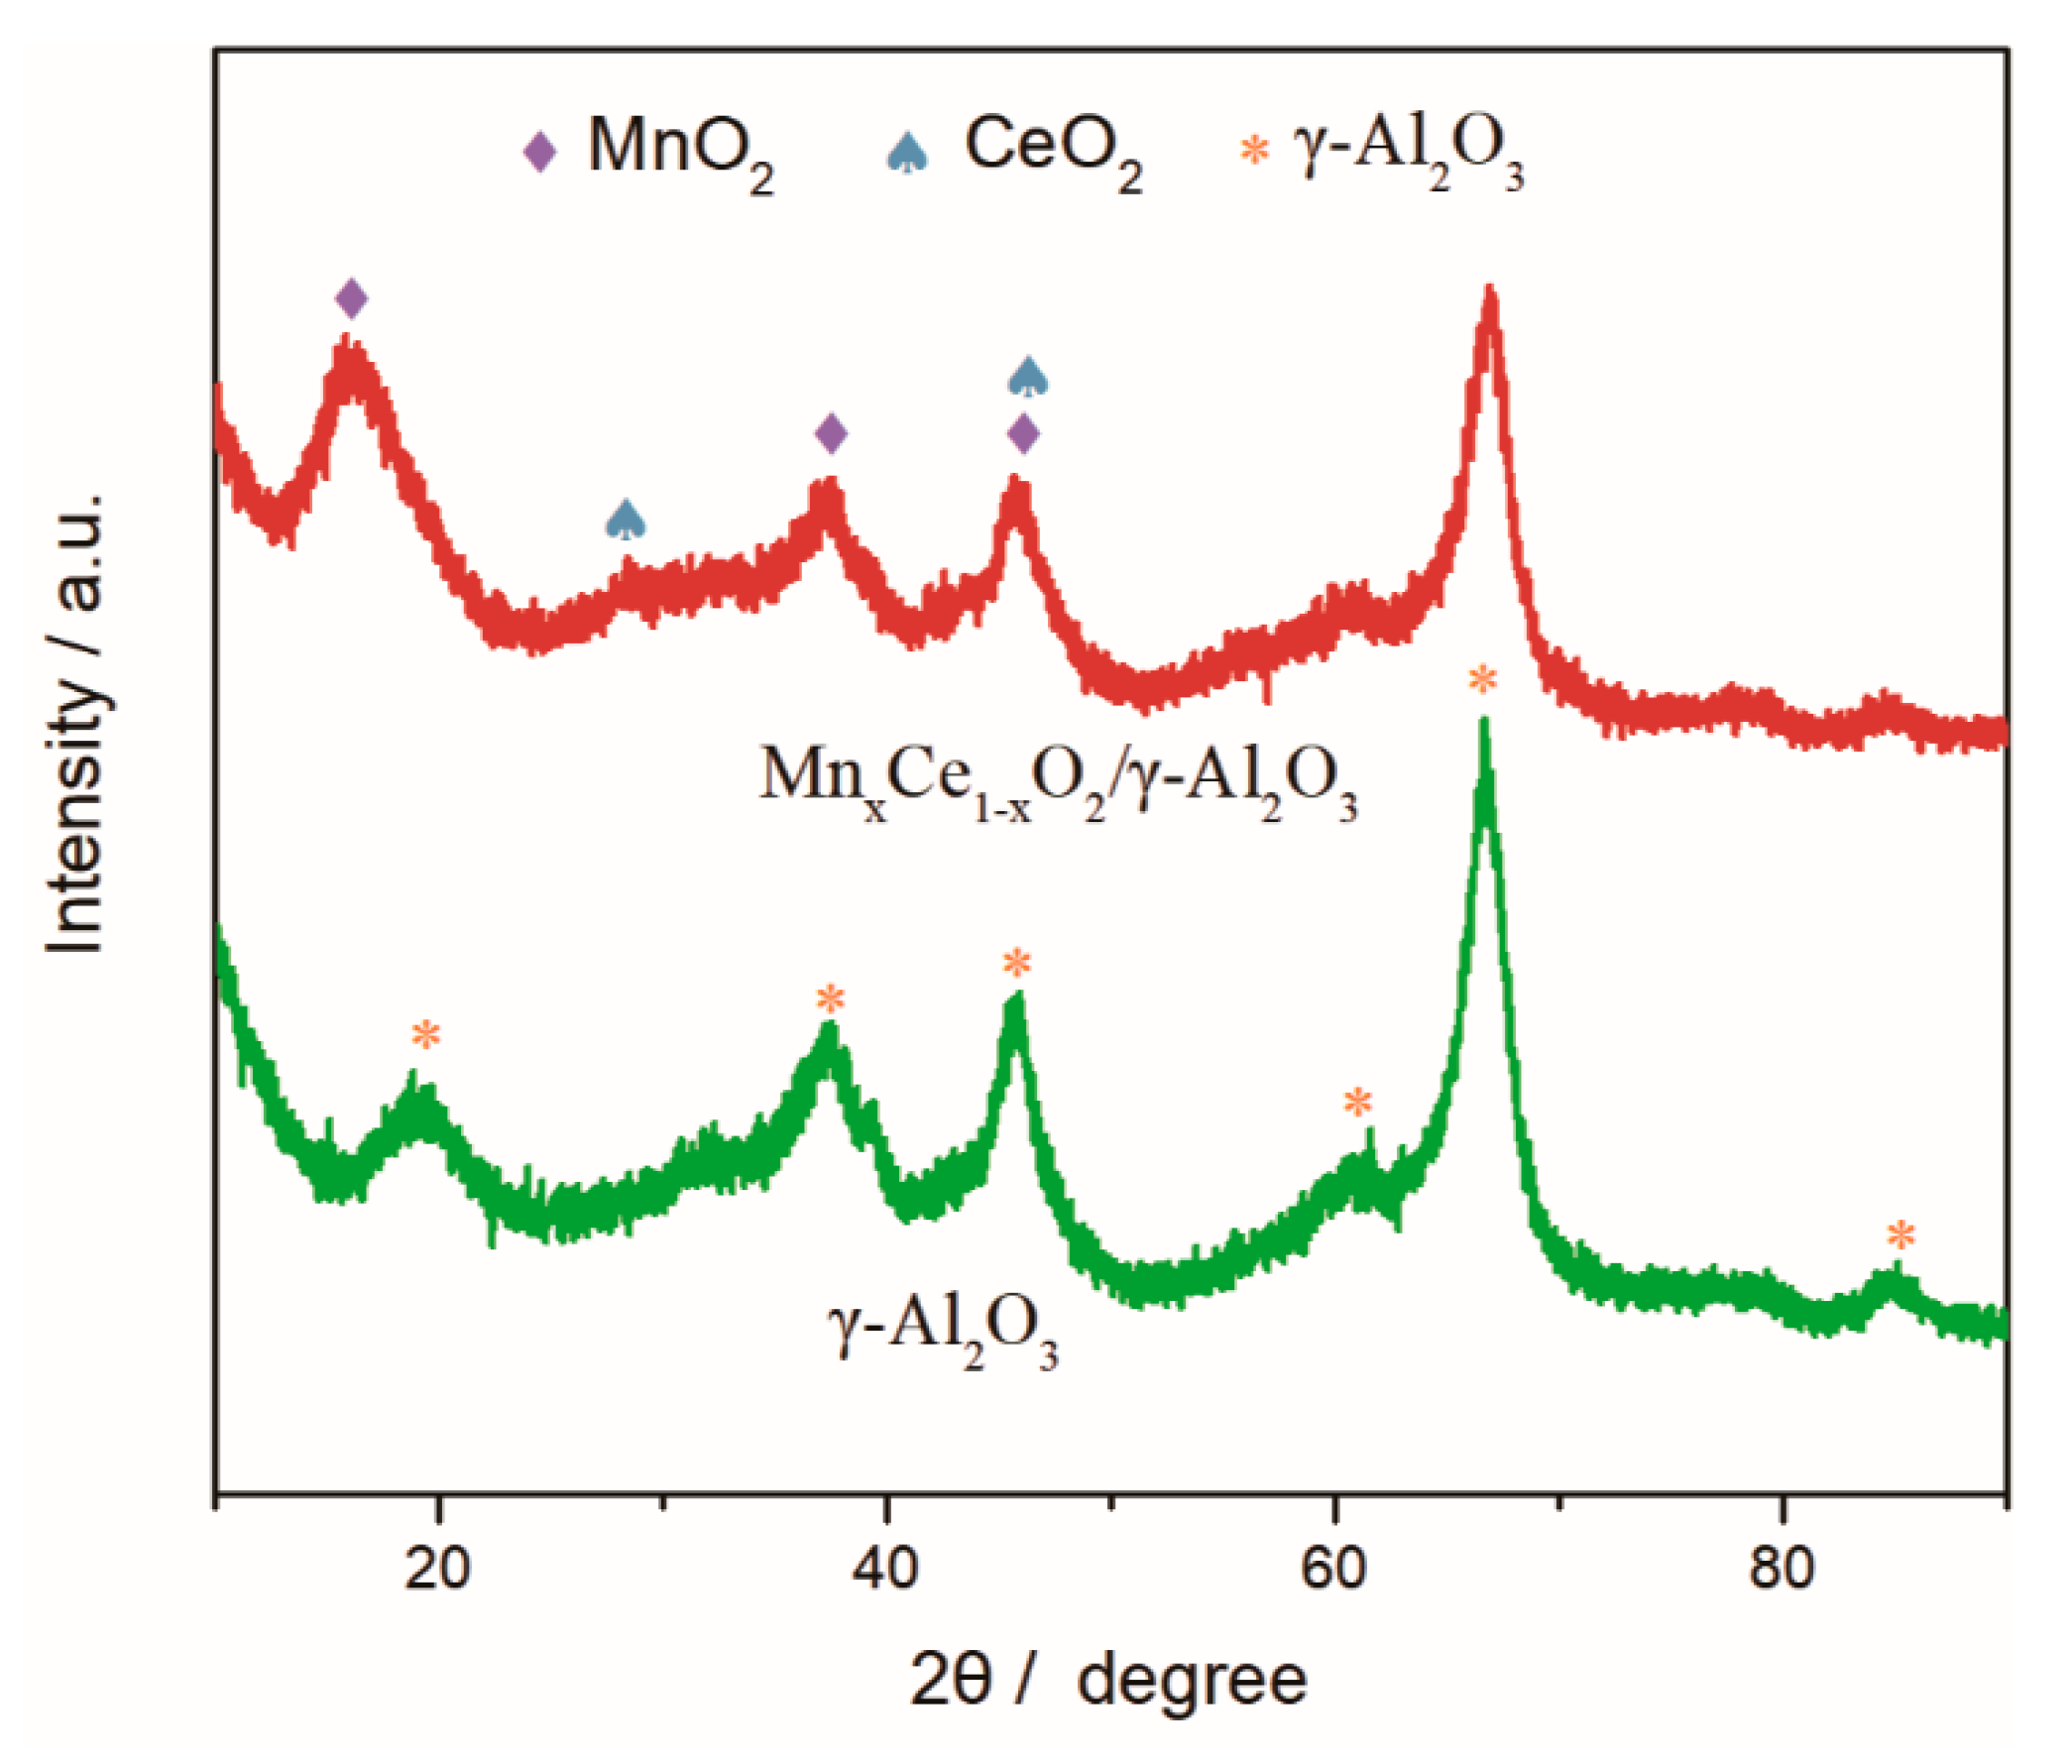
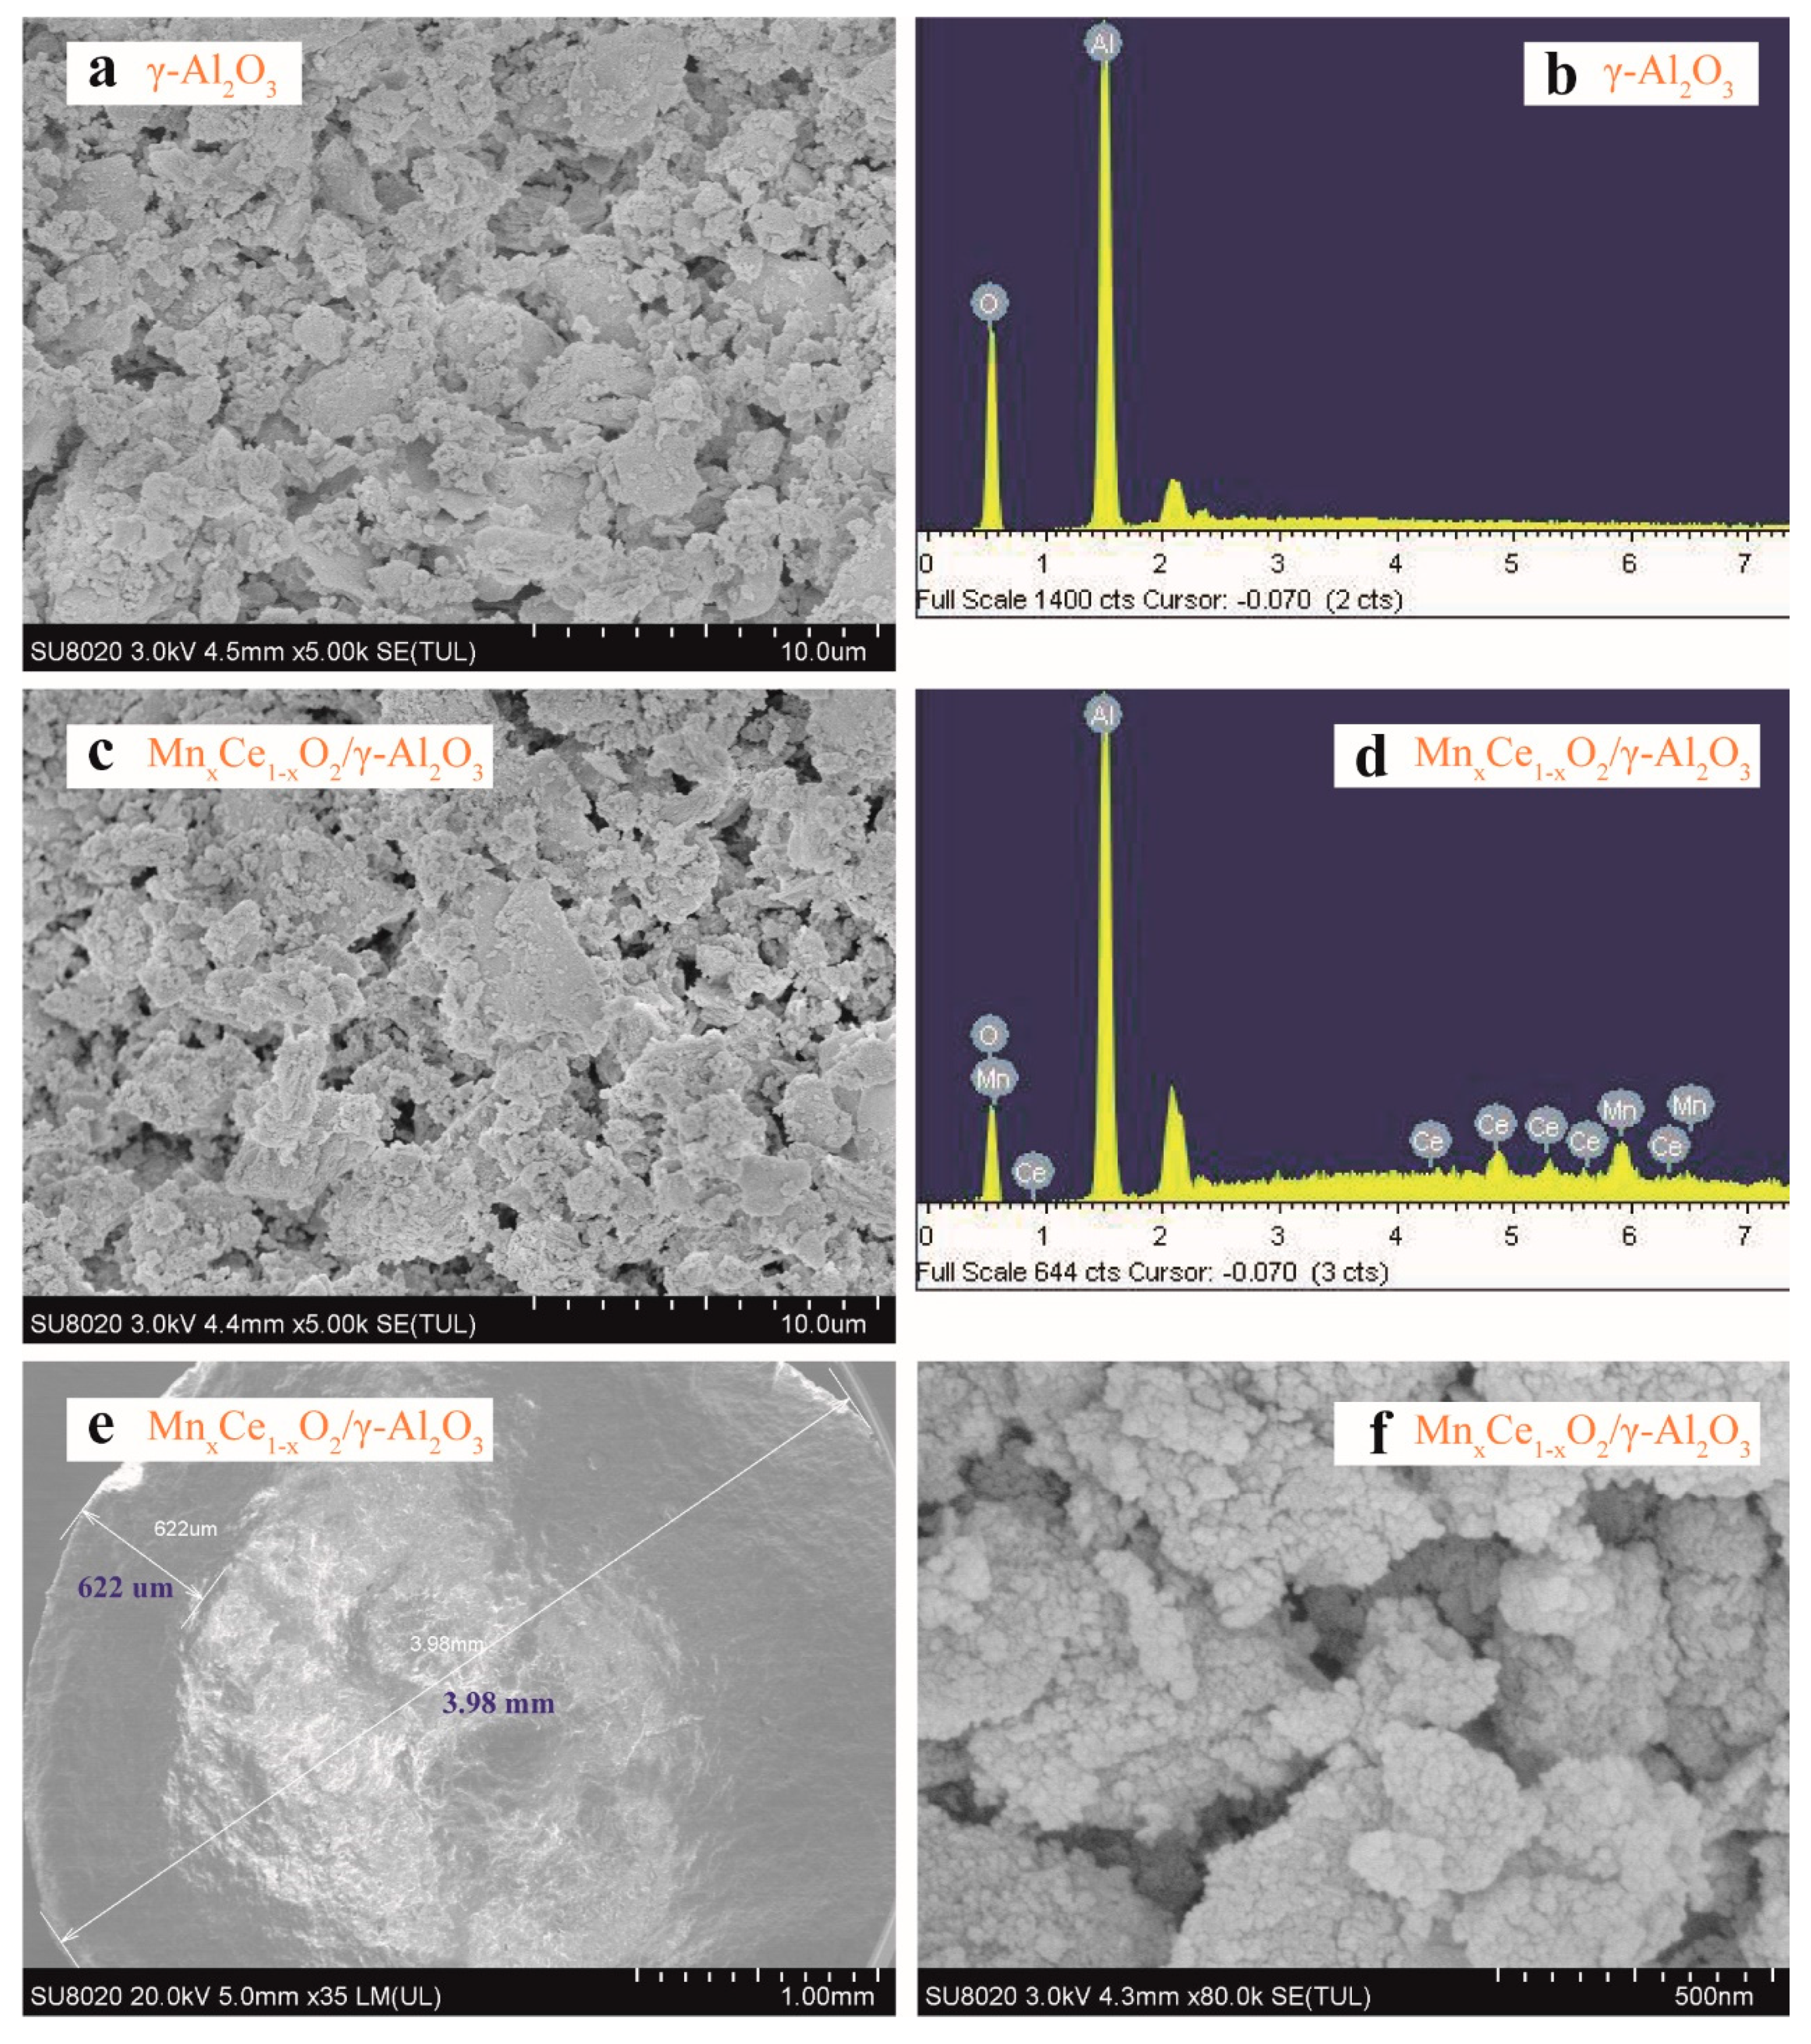
3.1. Catalyst Characterization
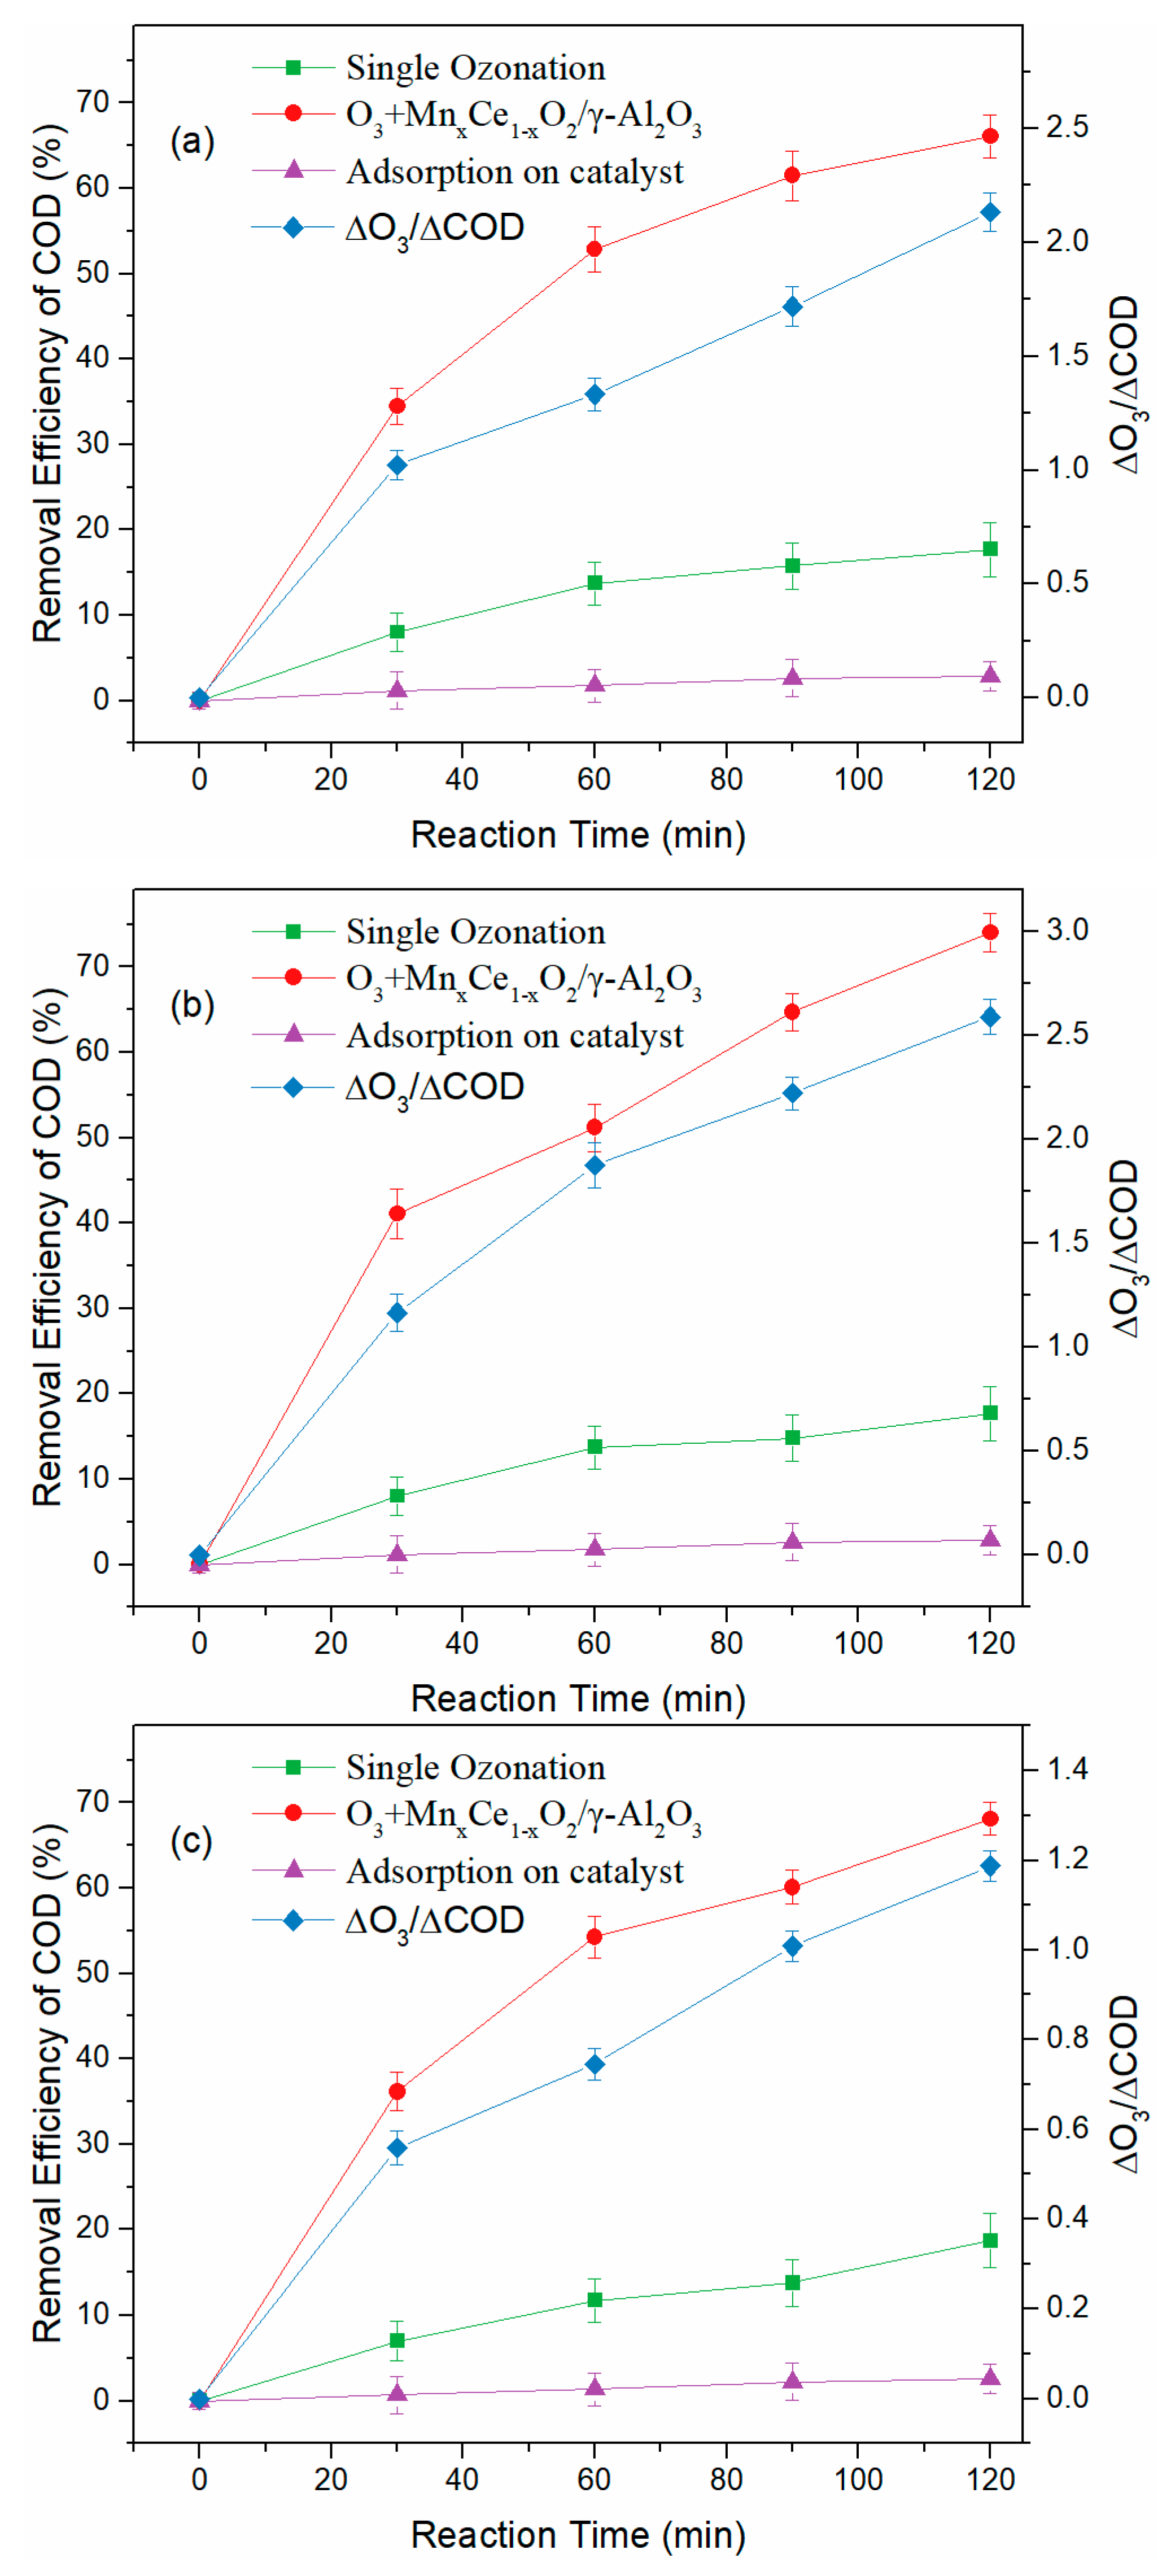
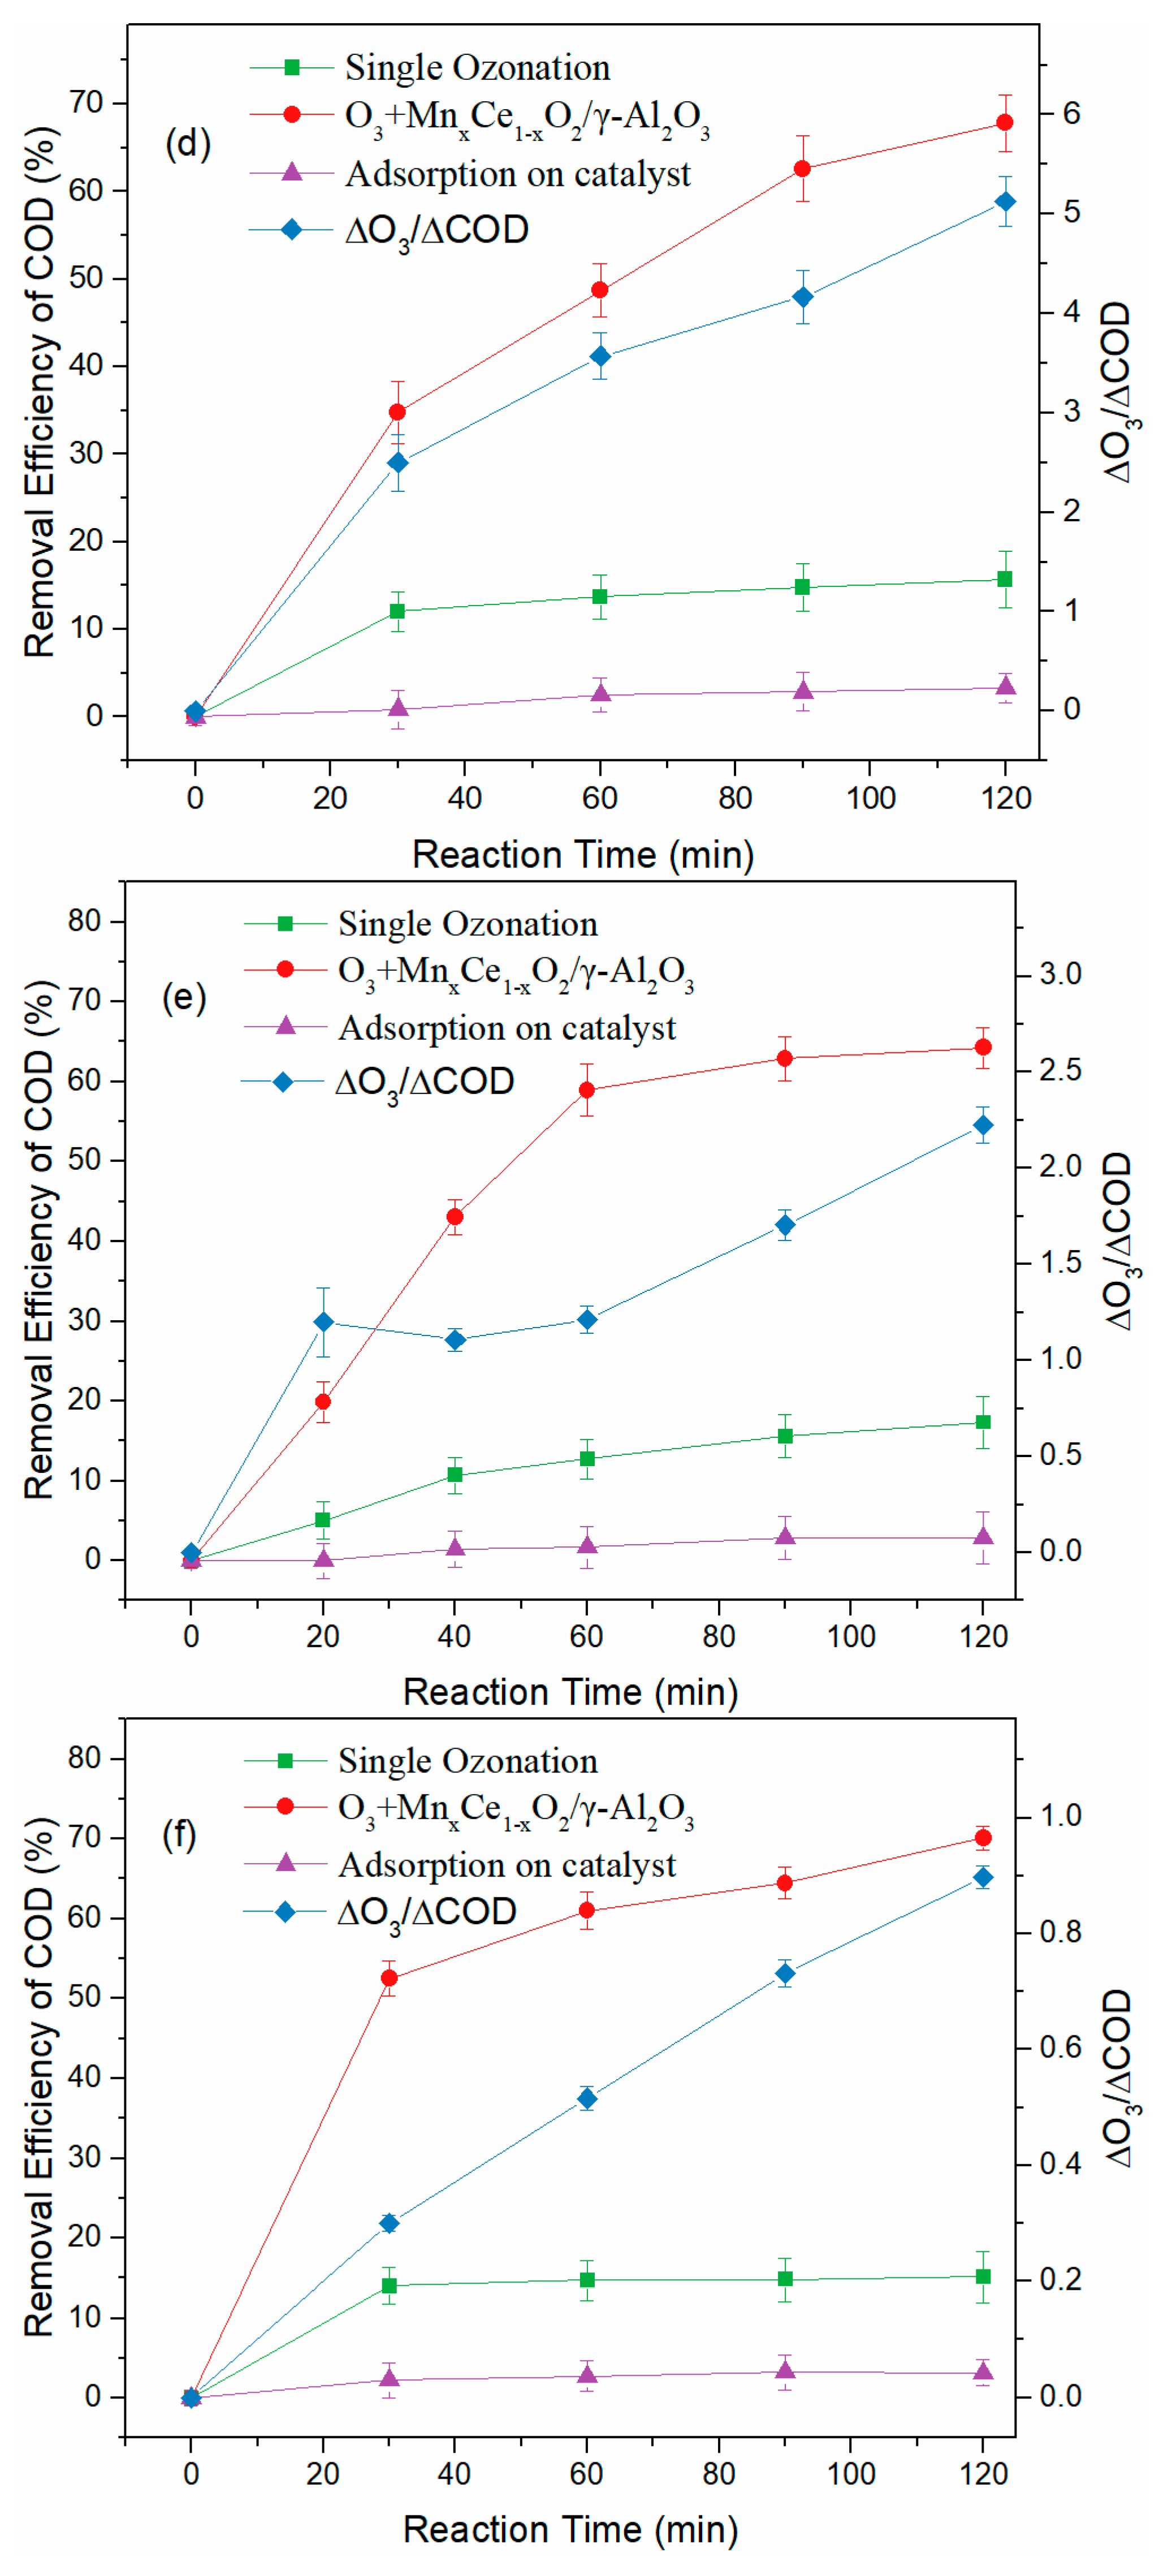
3.2. Treatment of BCW with Semi-Batch Reactor
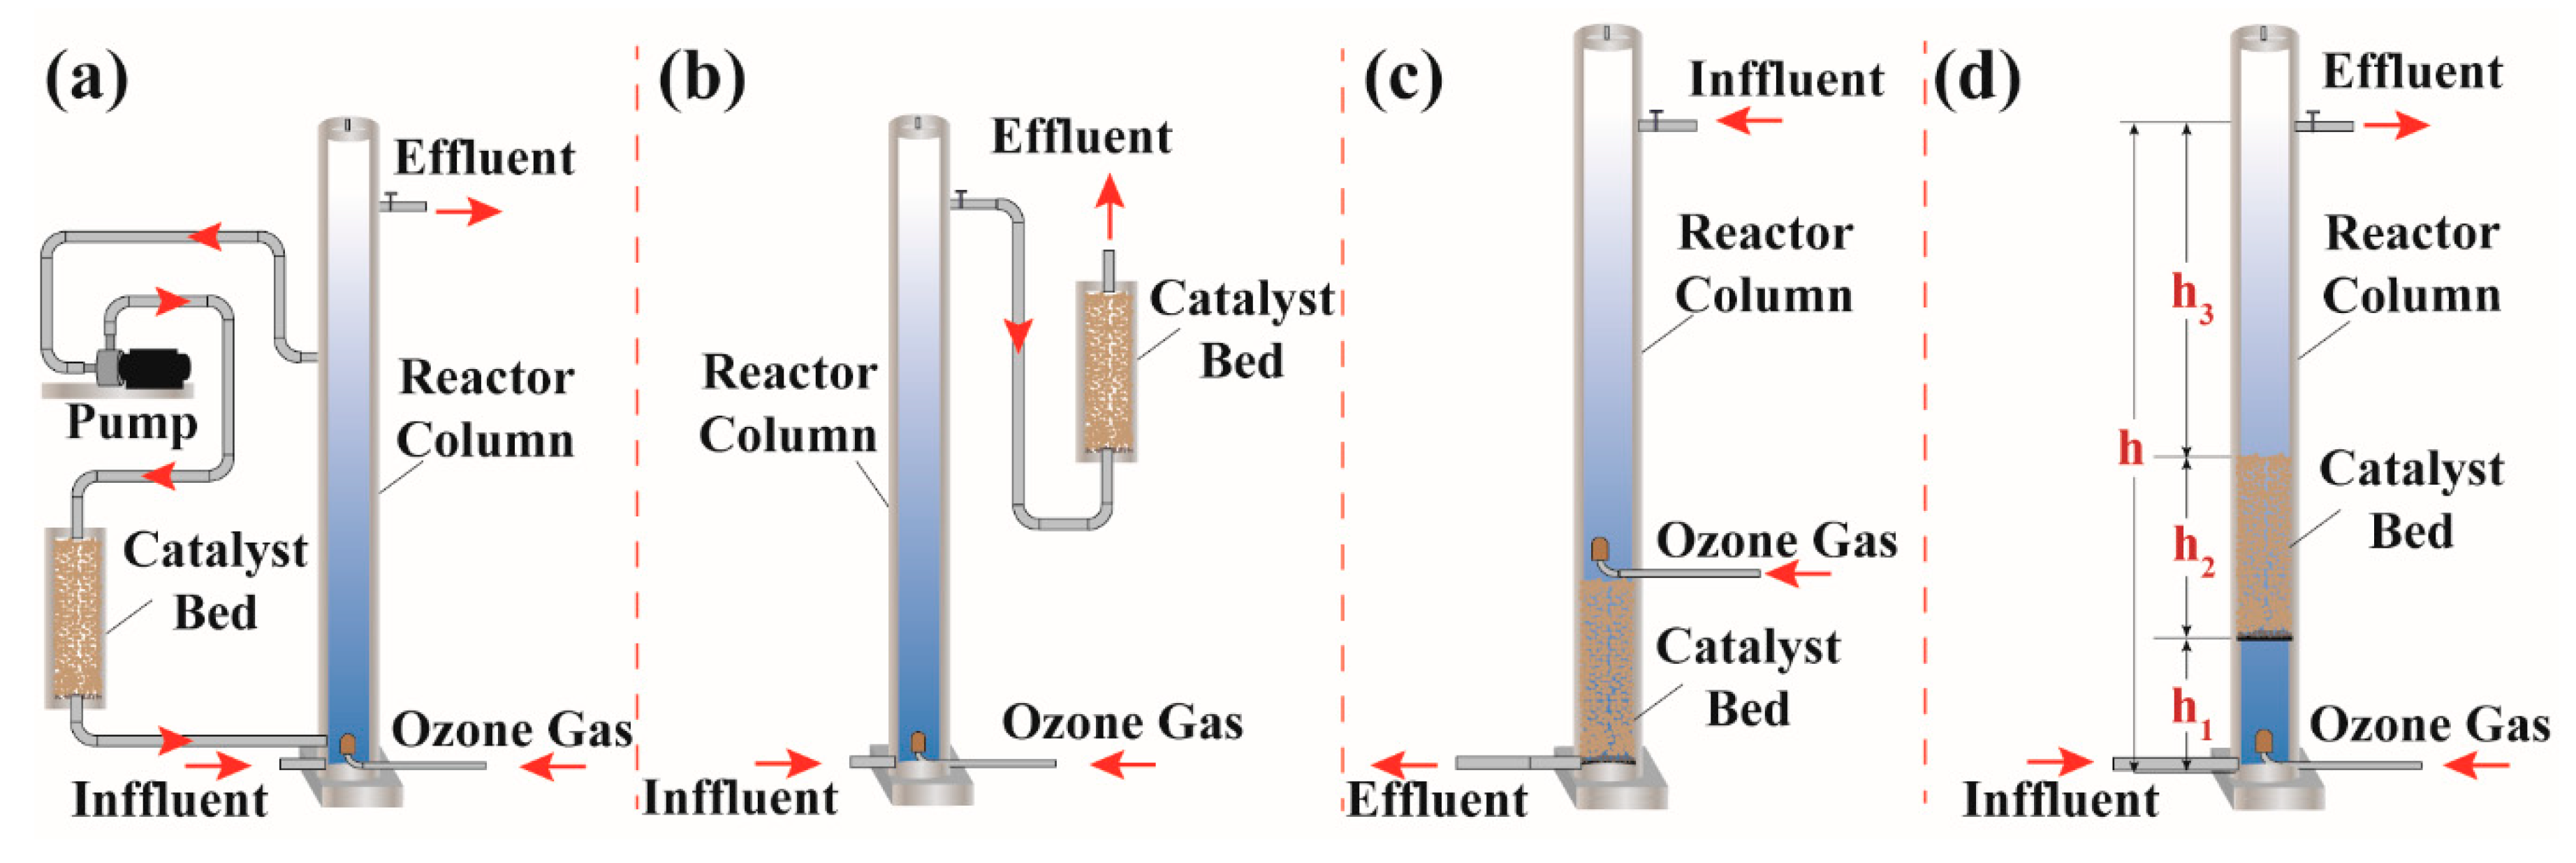
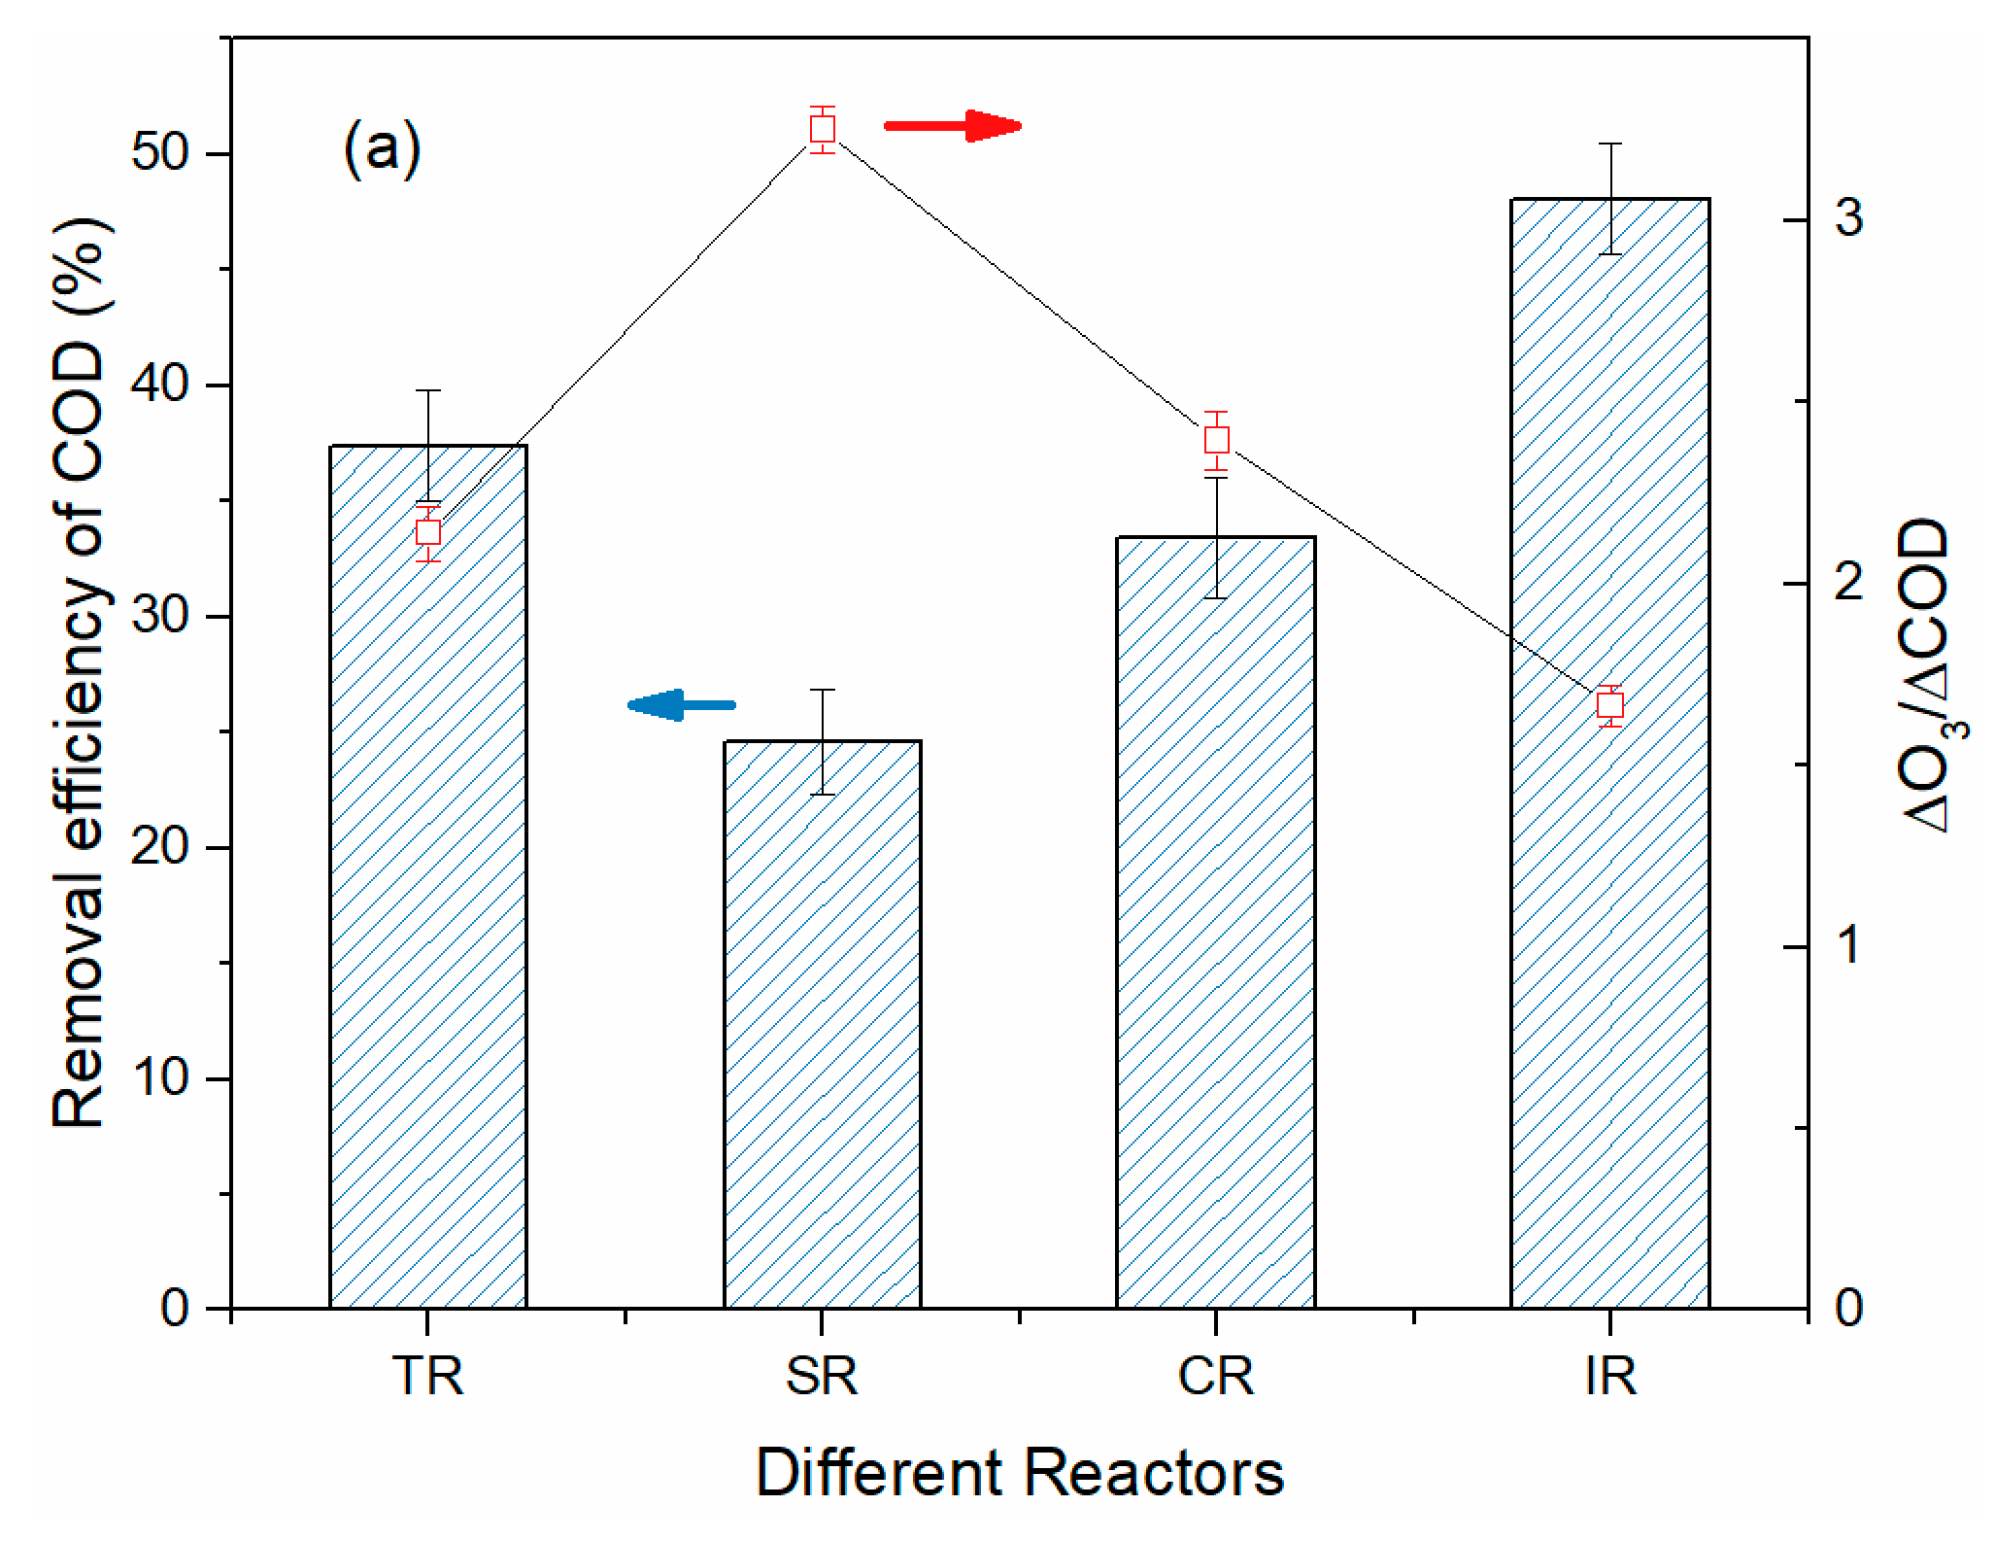
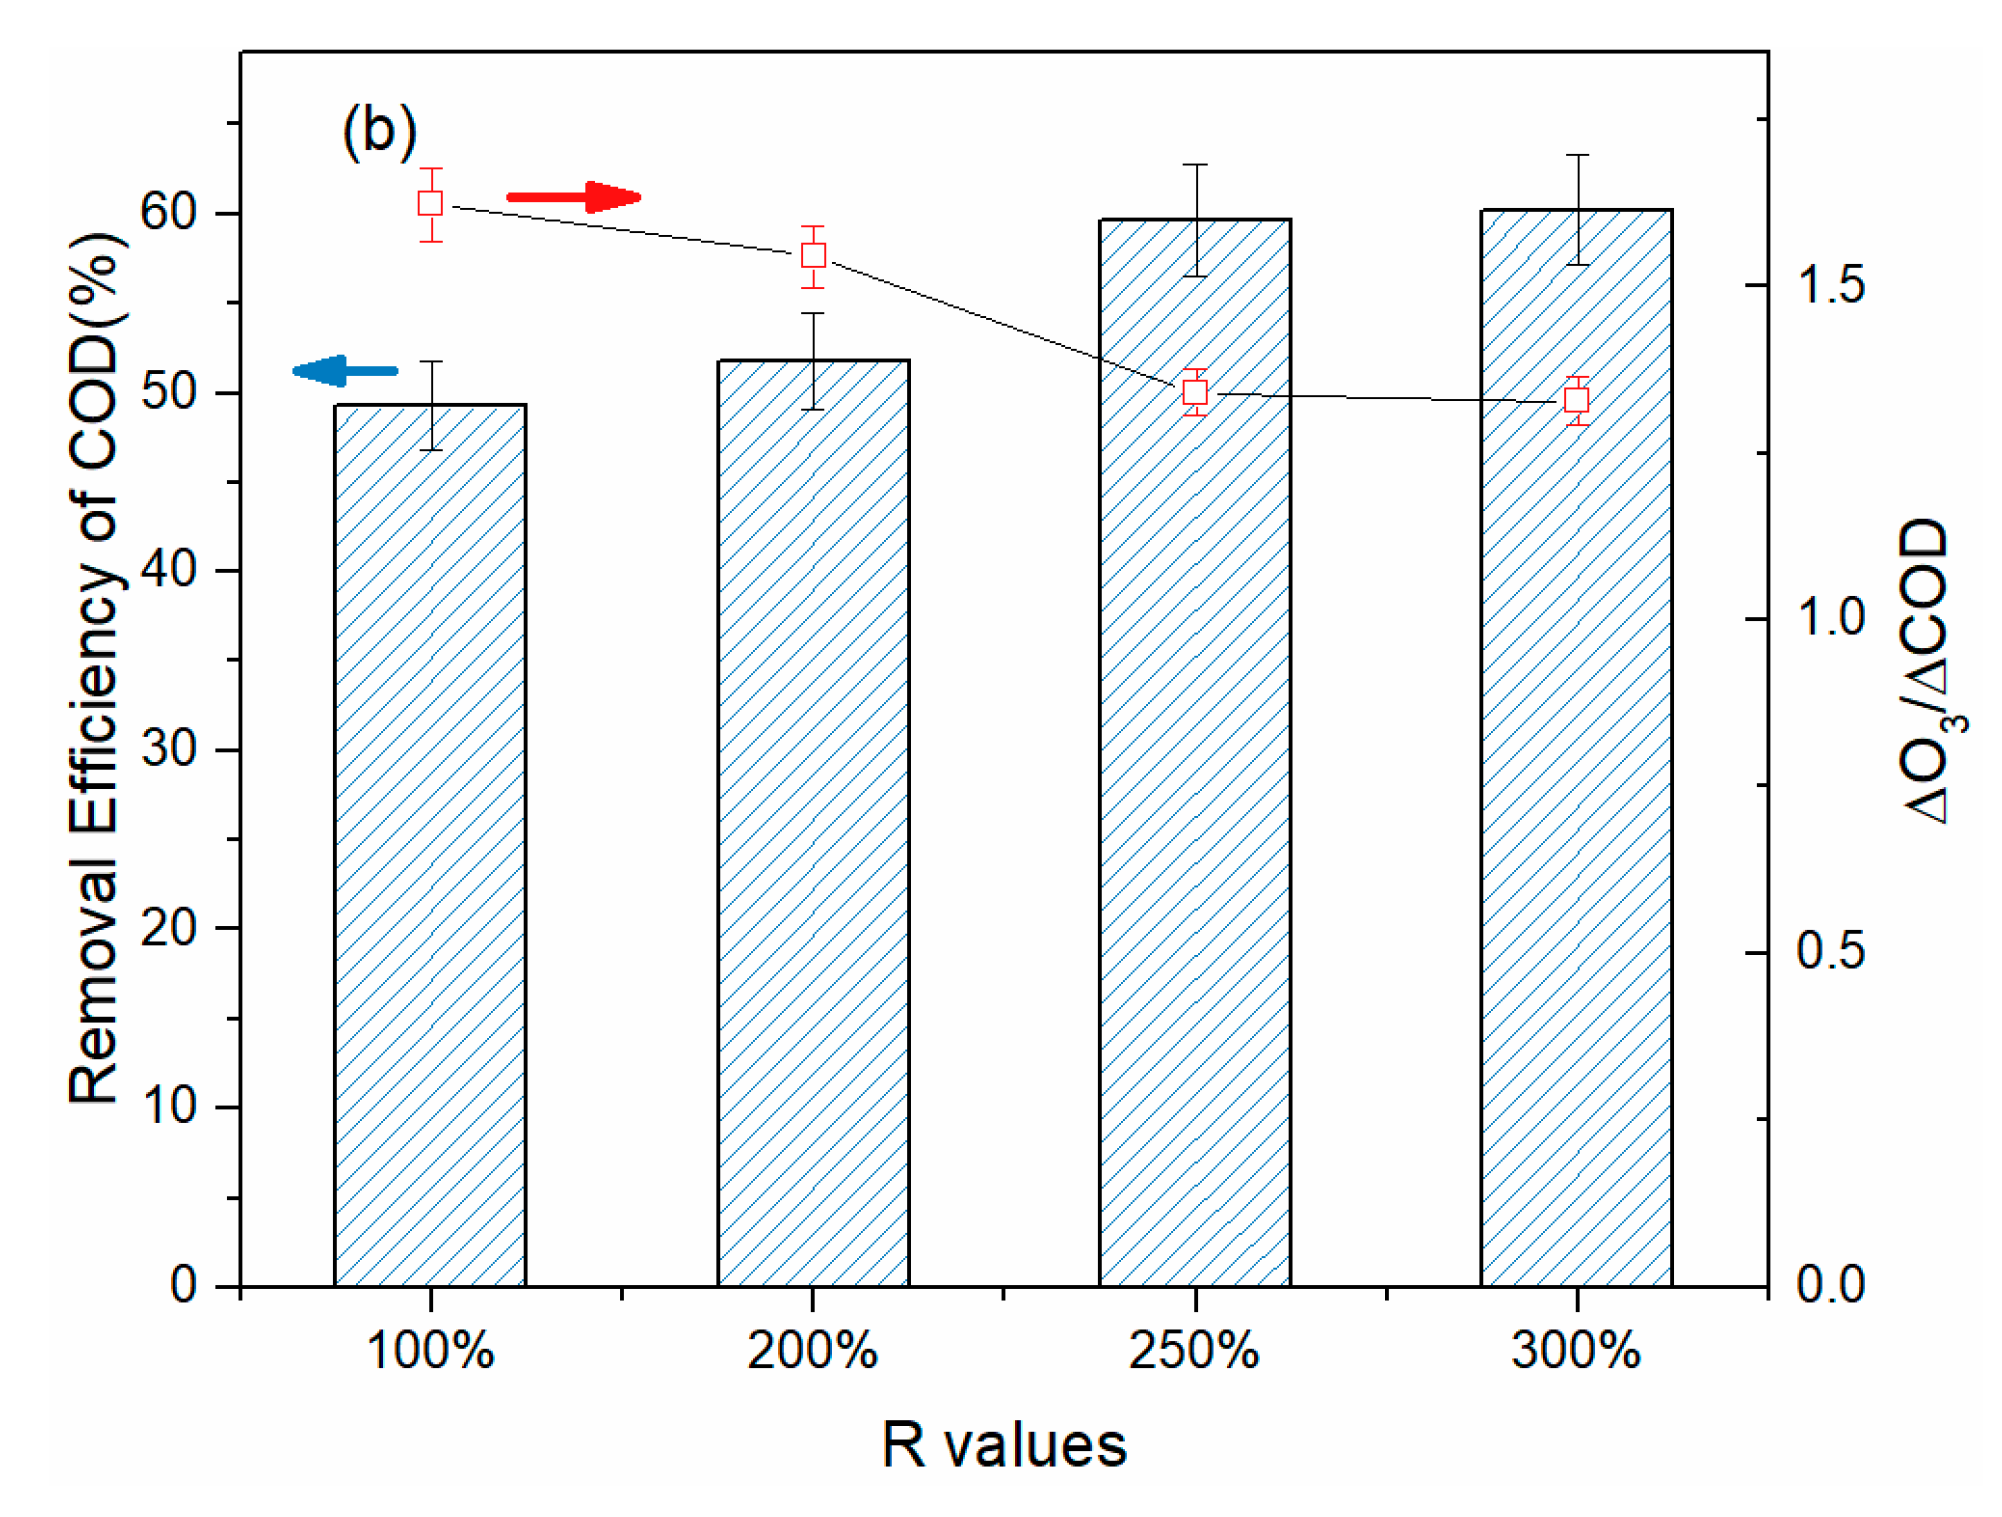
3.3. Treatment of BCW in Various Continuous Flow Reactor
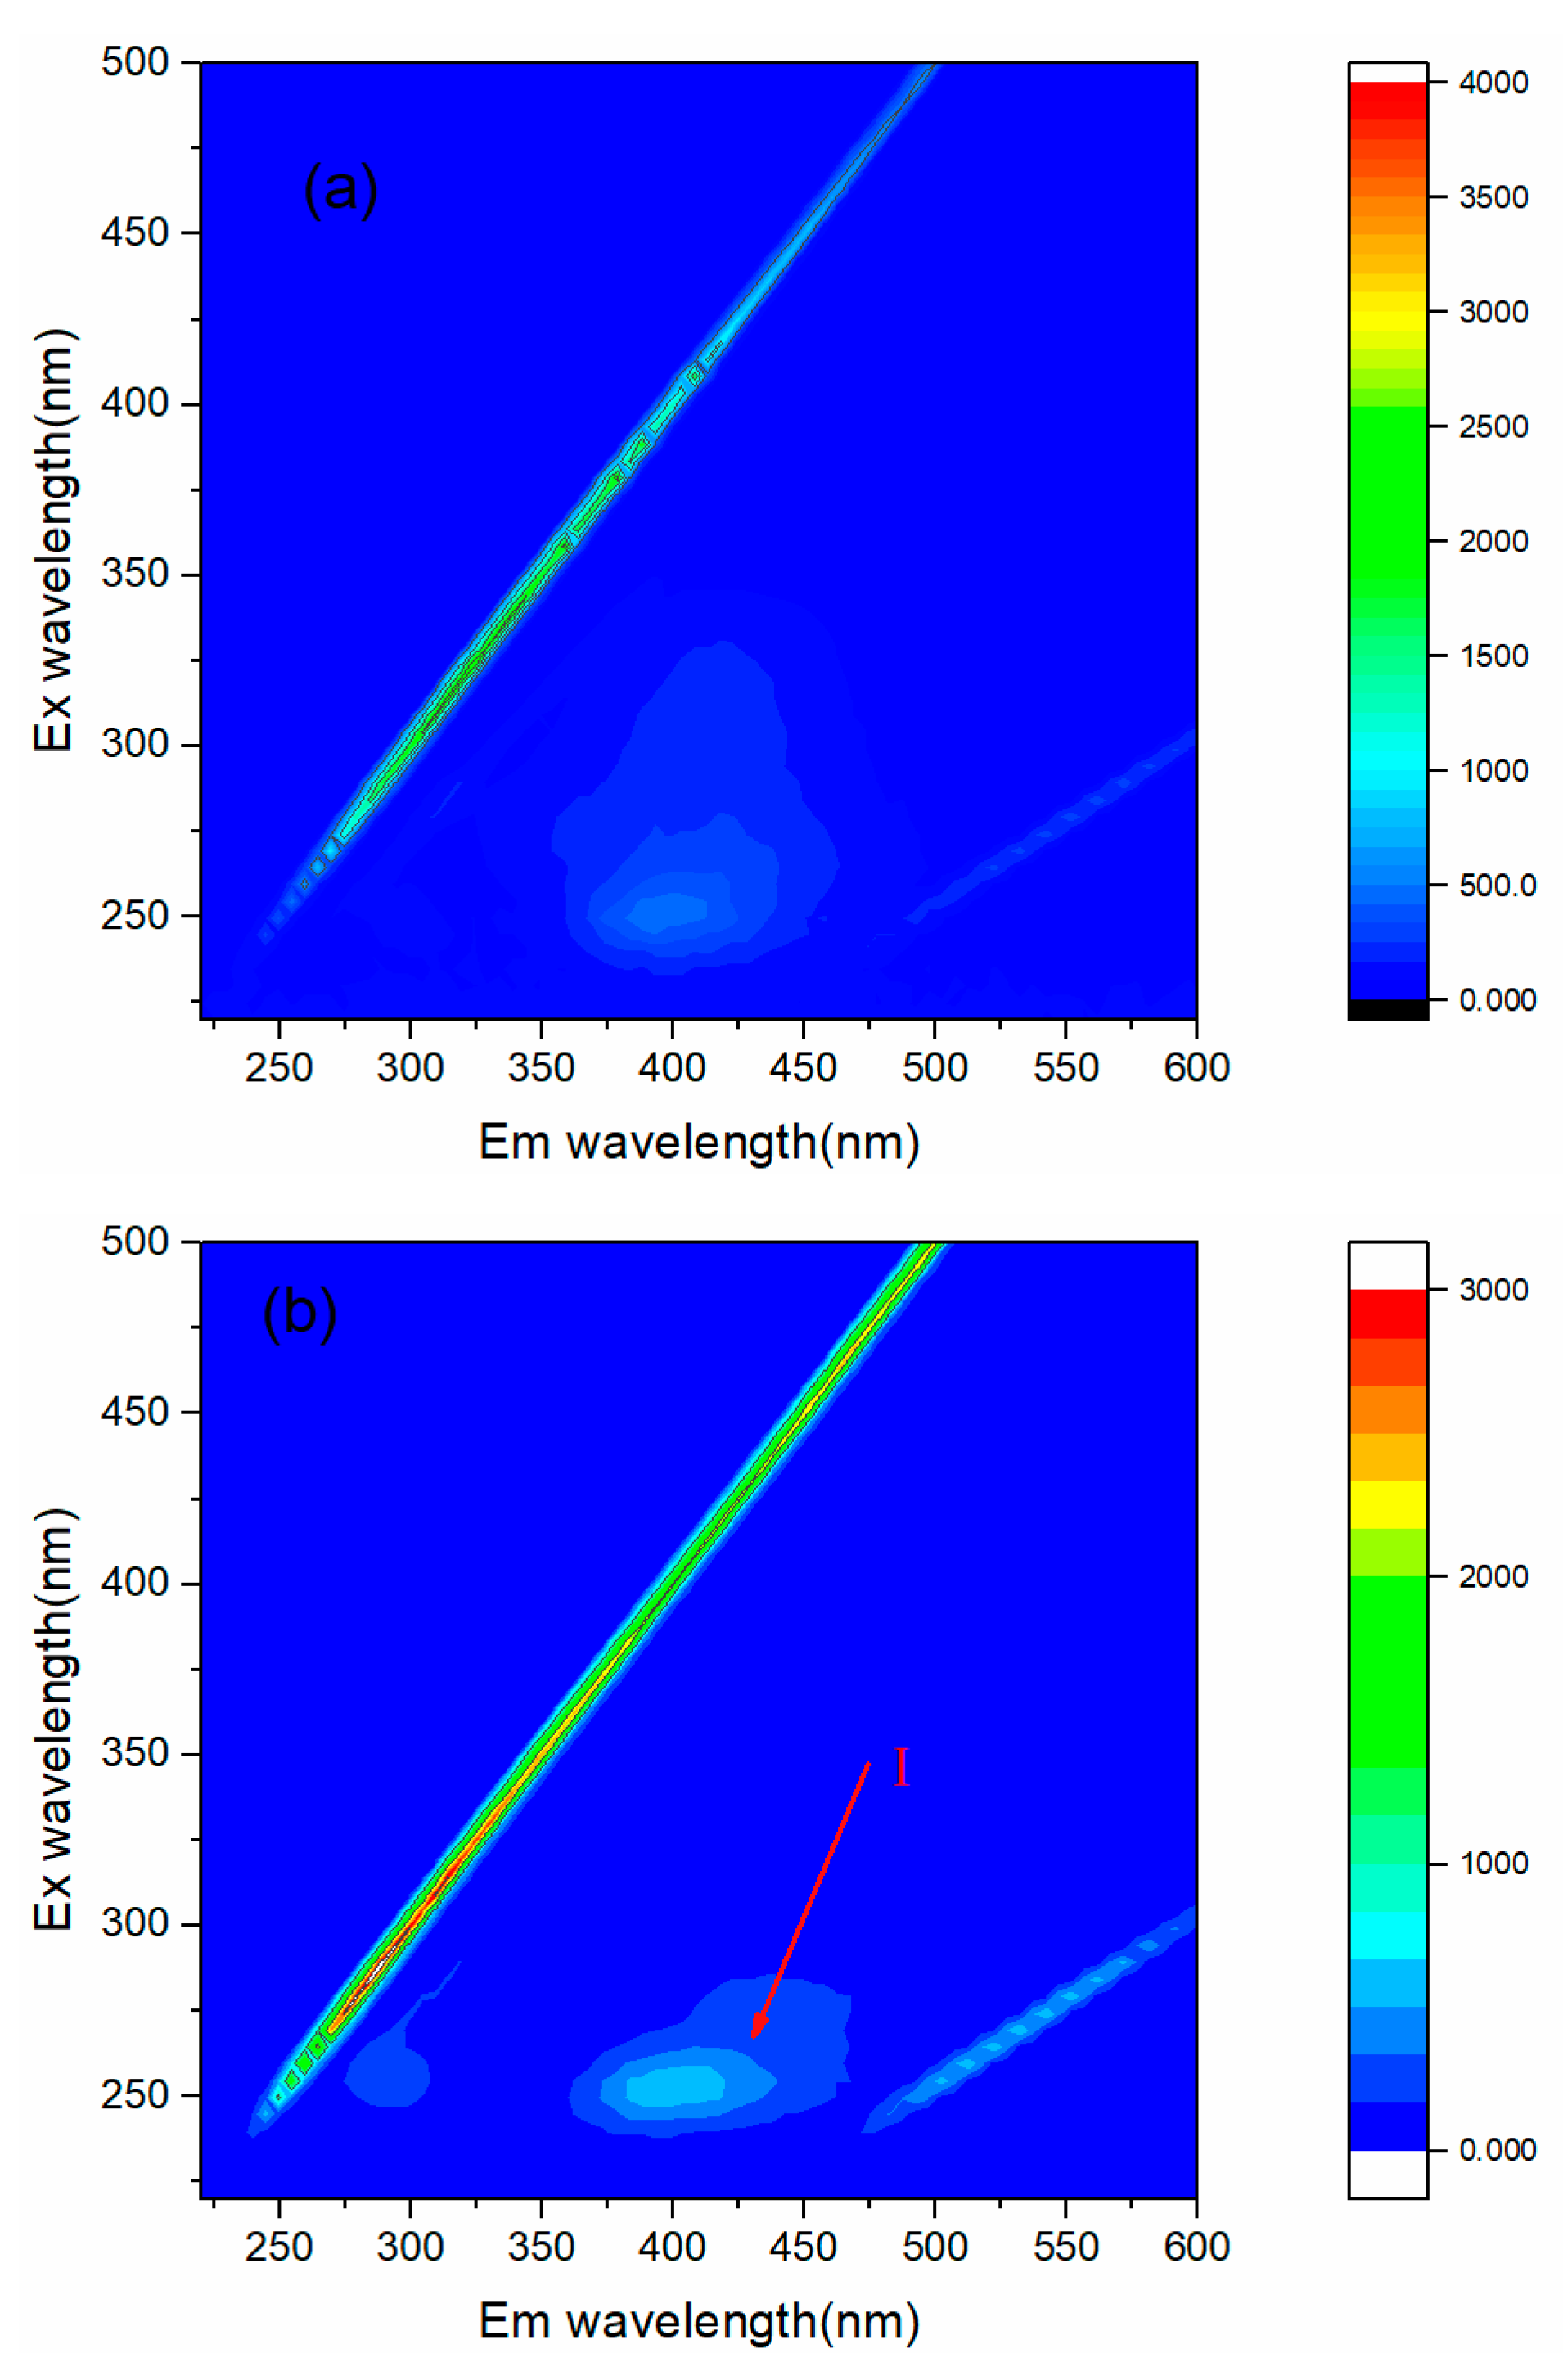
3.4. Removal of Organic Compouds with IR
4. Conclusions
Author Contributions
Funding
Conflicts of Interest
References
- Sharma, N.K.; Philip, L. Combined biological and photocatalytic treatment of real coke oven wastewater. Chem. Eng. J. 2016, 295, 20–28. [Google Scholar] [CrossRef]
- Lai, P.; Zhao, H.-Z.; Zeng, M.; Ni, J.-R. Study on treatment of coking wastewater by biofilm reactors combined with zero-valent iron process. J. Hazard. Mater. 2009, 162, 1423–1429. [Google Scholar] [CrossRef] [PubMed]
- Zhu, X.; Ni, J.; Lai, P. Advanced treatment of biologically pretreated coking wastewater by electrochemical oxidation using boron-doped diamond electrodes. Water Res. 2009, 43, 4347–4355. [Google Scholar] [CrossRef] [PubMed]
- Sun, G.; Zhang, Y.; Gao, Y.; Han, X.; Yang, M. Removal of hard COD from biological effluent of coking wastewater using synchronized oxidation-adsorption technology: Performance, mechanism, and full-scale application. Water Res. 2020, 173. [Google Scholar] [CrossRef] [PubMed]
- Ghuge, S.P.; Saroha, A.K. Catalytic ozonation for the treatment of synthetic and industrial effluents—Application of mesoporous materials: A review. J. Environ. Manag. 2018, 211, 83–102. [Google Scholar] [CrossRef]
- Li, X.; Zhang, W.; Lai, S.; Gan, Y.; Li, J.; Ye, T.; You, J.; Wang, S.; Chen, H.; Deng, W.; et al. Efficient organic pollutants removal from industrial paint wastewater plant employing Fenton with integration of oxic/hydrolysis acidification/oxic. Chem. Eng. J. 2018, 332, 440–448. [Google Scholar] [CrossRef]
- Li, K.; Yediler, A.; Yang, M.; Schulte-Hostede, S.; Wong, M.H. Ozonation of oxytetracycline and toxicological assessment of its oxidation by-products. Chemosphere 2008, 72, 473–478. [Google Scholar] [CrossRef]
- Nawrocki, J.; Kasprzyk-Hordern, B. The efficiency and mechanisms of catalytic ozonation. Appl. Catal. B Environ. 2010, 99, 27–42. [Google Scholar] [CrossRef]
- Dar, A.A.; Wang, X.; Wang, S.; Ge, J.; Shad, A.; Ai, F.; Wang, Z. Ozonation of pentabromophenol in aqueous basic medium: Kinetics, pathways, mechanism, dimerization and toxicity assessment. Chemosphere 2019, 220, 546–555. [Google Scholar] [CrossRef]
- Zhang, T.; Croué, J.-P. Catalytic ozonation not relying on hydroxyl radical oxidation: A selective and competitive reaction process related to metal–carboxylate complexes. Appl. Catal. B Environ. 2014, 144, 831–839. [Google Scholar] [CrossRef]
- Li, S.; Tang, Y.; Zhang, J.; Hao, W.; Chen, W.; Gu, F.; Hu, Z.; Li, L. Advanced and green ozonation process for removal of clofibric acid in water system: Preparation and mechanism analysis of efficient copper-substituted MCM-48. Sep. Purif. Technol. 2019, 211, 684–696. [Google Scholar] [CrossRef]
- Yuan, L.; Shen, J.; Yan, P.; Zhang, J.; Wang, Z.; Zhao, S.; Chen, Z. Catalytic ozonation of 4-chloronitrobenzene by goethite and Fe2+-modified goethite with low defects: A comparative study. J. Hazard. Mater. 2019, 365, 744–750. [Google Scholar] [CrossRef] [PubMed]
- Chen, W.; Bao, Y.; Li, X.; Huang, J.; Tang, Y.; Li, L. Mineralization of salicylic acid via catalytic ozonation with Fe-Cu@SiO2 core-shell catalyst: A two-stage first order reaction. Chemosphere 2019, 235, 470–480. [Google Scholar] [CrossRef] [PubMed]
- Gomes, J.; Frasson, D.; Quinta-Ferreira, R.M.; Matos, A.; Martins, R.C. Removal of Enteric Pathogens from Real Wastewater Using Single and Catalytic Ozonation. Water 2019, 11, 127. [Google Scholar] [CrossRef]
- Wu, J.; Ma, L.; Chen, Y.; Cheng, Y.; Liu, Y.; Zha, X. Catalytic ozonation of organic pollutants from bio-treated dyeing and finishing wastewater using recycled waste iron shavings as a catalyst: Removal and pathways. Water Res. 2016, 92, 140–148. [Google Scholar] [CrossRef] [PubMed]
- Zhuang, H.; Han, H.; Hou, B.; Jia, S.; Zhao, Q. Heterogeneous catalytic ozonation of biologically pretreated Lurgi coal gasification wastewater using sewage sludge based activated carbon supported manganese and ferric oxides as catalysts. Bioresour. Technol. 2014, 166, 178–186. [Google Scholar] [CrossRef]
- Li, C.; Jiang, F.; Sun, D.; Qiu, B. Catalytic ozonation for advanced treatment of incineration leachate using (MnO2-Co3O4)/AC as a catalyst. Chem. Eng. J. 2017, 325, 624–631. [Google Scholar] [CrossRef]
- Wang, J.; Bai, Z. Fe-based catalysts for heterogeneous catalytic ozonation of emerging contaminants in water and wastewater. Chem. Eng. J. 2017, 312, 79–98. [Google Scholar] [CrossRef]
- Nawrocki, J. Catalytic ozonation in water: Controversies and questions. Discussion paper. Appl. Catal. B Environ. 2013, 142, 465–471. [Google Scholar] [CrossRef]
- Martins, R.C.; Quinta-Ferreira, R.M. Catalytic ozonation of phenolic acids over a Mn–Ce–O catalyst. Appl. Catal. B Environ. 2009, 90, 268–277. [Google Scholar] [CrossRef]
- Martins, R.C.; Quinta-Ferreira, R.M. Screening of Ceria-Based and Commercial Ceramic Catalysts for Catalytic Ozonation of Simulated Olive Mill Wastewaters. Ind. Eng. Chem. Res. 2009, 48, 1196–1202. [Google Scholar] [CrossRef]
- Faria, P.C.; Monteiro, D.C.; Orfao, J.J.; Pereira, M.F. Cerium, manganese and cobalt oxides as catalysts for the ozonation of selected organic compounds. Chemosphere 2009, 74, 818–824. [Google Scholar] [CrossRef] [PubMed]
- Zhang, T.; Chen, W.; Ma, J.; Qiang, Z. Minimizing bromate formation with cerium dioxide during ozonation of bromide-containing water. Water Res. 2008, 42, 3651–3658. [Google Scholar] [CrossRef]
- Li, W.; Lu, X.; Xu, K.; Qu, J.; Qiang, Z. Cerium incorporated MCM-48 (Ce-MCM-48) as a catalyst to inhibit bromate formation during ozonation of bromide-containing water: Efficacy and mechanism. Water Res. 2015, 86, 2–8. [Google Scholar] [CrossRef] [PubMed]
- Shan, C.; Xu, Y.; Hua, M.; Gu, M.; Yang, Z.; Wang, P.; Lu, Z.; Zhang, W.; Pan, B. Mesoporous Ce-Ti-Zr ternary oxide millispheres for efficient catalytic ozonation in bubble column. Chem. Eng. J. 2018, 338, 261–270. [Google Scholar] [CrossRef]
- Wei, K.; Cao, X.; Gu, W.; Liang, P.; Huang, X.; Zhang, X. Ni-Induced C-Al2O3-Framework (NiCAF) Supported Core-Multishell Catalysts for Efficient Catalytic Ozonation: A Structure-to-Performance Study. Environ. Sci. Technol. 2019, 53, 6917–6926. [Google Scholar] [CrossRef] [PubMed]
- He, C.; Wang, J.; Wang, C.; Zhang, C.; Hou, P.; Xu, X. Catalytic ozonation of bio-treated coking wastewater in continuous pilot- and full-scale system: Efficiency, catalyst deactivation and in-situ regeneration. Water Res. 2020, 183, 116090. [Google Scholar] [CrossRef] [PubMed]
- Rakness, K.; Gordon, G.; Langlais, B.; Masschelein, W.; Matsumoto, N.; Richard, Y.; Robson, C.M.; Somiya, I. Guideline for Measurement of Ozone Concentration in the Process Gas from an Ozone Generator. Ozone Sci. Eng. 1996, 18, 209–229. [Google Scholar] [CrossRef]
- Bader, H.; Hoigné, J. Determination of ozone in water by the indigo method. Water Res. 1981, 15, 449–456. [Google Scholar] [CrossRef]
- Mahlaba, S.V.L.; Valand, J.; Mahomed, A.S.; Friedrich, H.B. A study on the deactivation and reactivation of a Ni/Al2O3 aldehyde hydrogenation catalyst: Effects of regeneration on the activity and properties of the catalyst. Appl. Catal. B Environ. 2018, 224, 295–304. [Google Scholar] [CrossRef]
- Liu, Y.; Feng, Y.; Yao, J. Recent advances in the direct fabrication of millimeter-sized hierarchical porous materials. RSC Adv. 2016, 6, 80840–80846. [Google Scholar] [CrossRef]
- Purwajanti, S.; Zhang, H.; Huang, X.; Song, H.; Yang, Y.; Zhang, J.; Niu, Y.; Meka, A.K.; Noonan, O.; Yu, C. Mesoporous Magnesium Oxide Hollow Spheres as Superior Arsenite Adsorbent: Synthesis and Adsorption Behavior. ACS Appl. Mater. Inter. 2016, 8, 25306–25312. [Google Scholar] [CrossRef] [PubMed]
- Bing, J.; Hu, C.; Zhang, L. Enhanced mineralization of pharmaceuticals by surface oxidation over mesoporous γ-Ti-Al2O3 suspension with ozone. Appl. Catal. B Environ. 2017, 202, 118–126. [Google Scholar] [CrossRef]
- Chen, H.; Sayari, A.; Adnot, A.; Larachi, F.L. Composition-activity effects of Mn–Ce–O composites on phenol wet oxidation. Appl. Catal. B Environ. 2001, 32, 195–204. [Google Scholar] [CrossRef]
- Cargnello, M.; Delgado Jaen, J.J.; Hernandez Garrido, J.C.; Bakhmutsky, K.; Montini, T.; Calvino Gamez, J.J.; Gorte, R.J.; Fornasiero, P. Exceptional activity for methane combustion over modular Pd@CeO2 subunits on functionalized Al2O3. Science 2012, 337, 713–717. [Google Scholar] [CrossRef] [PubMed]
- Wang, J.; Xia, Z.; Cao, Z.; Yang, S.; Zhu, W. Mathematical model involving chemical reaction and mass transfer for the ozonation of dimethyl phthalate in water in a bubble column reactor. J. Adv. Oxid. Technol. 2017, 20. [Google Scholar] [CrossRef]
- Huang, G.; Pan, F.; Fan, G.; Liu, G. Application of heterogeneous catalytic ozonation as a tertiary treatment of effluent of biologically treated tannery wastewater. J Environ. Sci. Heal. A 2016, 51, 626–633. [Google Scholar] [CrossRef]
- Kasprzyk-Hordern, B.; Ziolek, M.; Nawrocki, J. Catalytic ozonation and methods of enhancing molecular ozone reactions in water treatment. Appl. Catal. B Environ. 2003, 46, 639–669. [Google Scholar] [CrossRef]
- Maddila, S.; Dasireddy, V.D.B.C.; Jonnalagadda, S.B. Dechlorination of tetrachloro-o-benzoquinone by ozonation catalyzed by cesium loaded metal oxides. Appl. Catal. B Environ. 2013, 138, 149–160. [Google Scholar] [CrossRef]
- Yang, W.; Li, X.; Pan, B.; Lv, L.; Zhang, W. Effective removal of effluent organic matter (EfOM) from bio-treated coking wastewater by a recyclable aminated hyper-cross-linked polymer. Water Res. 2013, 47, 4730–4738. [Google Scholar] [CrossRef]


| Plant ‡ | Biological Pre-Treatment | Characteristics of BCW | |||
|---|---|---|---|---|---|
| Process | Scale (m3·h−1) | COD (mg·L−1) | PH | ORP ♀ (mV) | |
| B-A | A/O | 200 | 172–188 | 7.87–8.11 | 153–229 |
| B-M | A/O/MBR pilot | 10 | 196–258 | 7.87–8.11 | 211–229 |
| F | A/A/O | 380 | 140–195 | 7.15–8.35 | 71.6–194.3 |
| A | A/A/O | 50 | 104–137 | 7.0–9.0 | 160–210 |
| J | A/A/O/MBBR | 80 | 114–160 | 8.47–9.47 | 155–273 |
| X | A/A/O | 100 | 260–319 | 7.0–8.0 | 220–250 |
| Sample | BET Area (SBET/m2·g−1) | Mesopore Volume (Vmes/cm3·g−1) | Total Pore Volume (V0.995/cm3·g−1) | Average Pore Diameter (nm) |
|---|---|---|---|---|
| γ-Al2O3 | 214.2 | 0.373 | 0.385 | 7.2 |
| MnxCe1-xO2/γ-Al2O3 | 195.0 | 0.363 | 0.364 | 7.5 |
| Catalytic Ozonation | Single Ozonation | ||||||
|---|---|---|---|---|---|---|---|
| B-A | B-M | F | J | A | X | ||
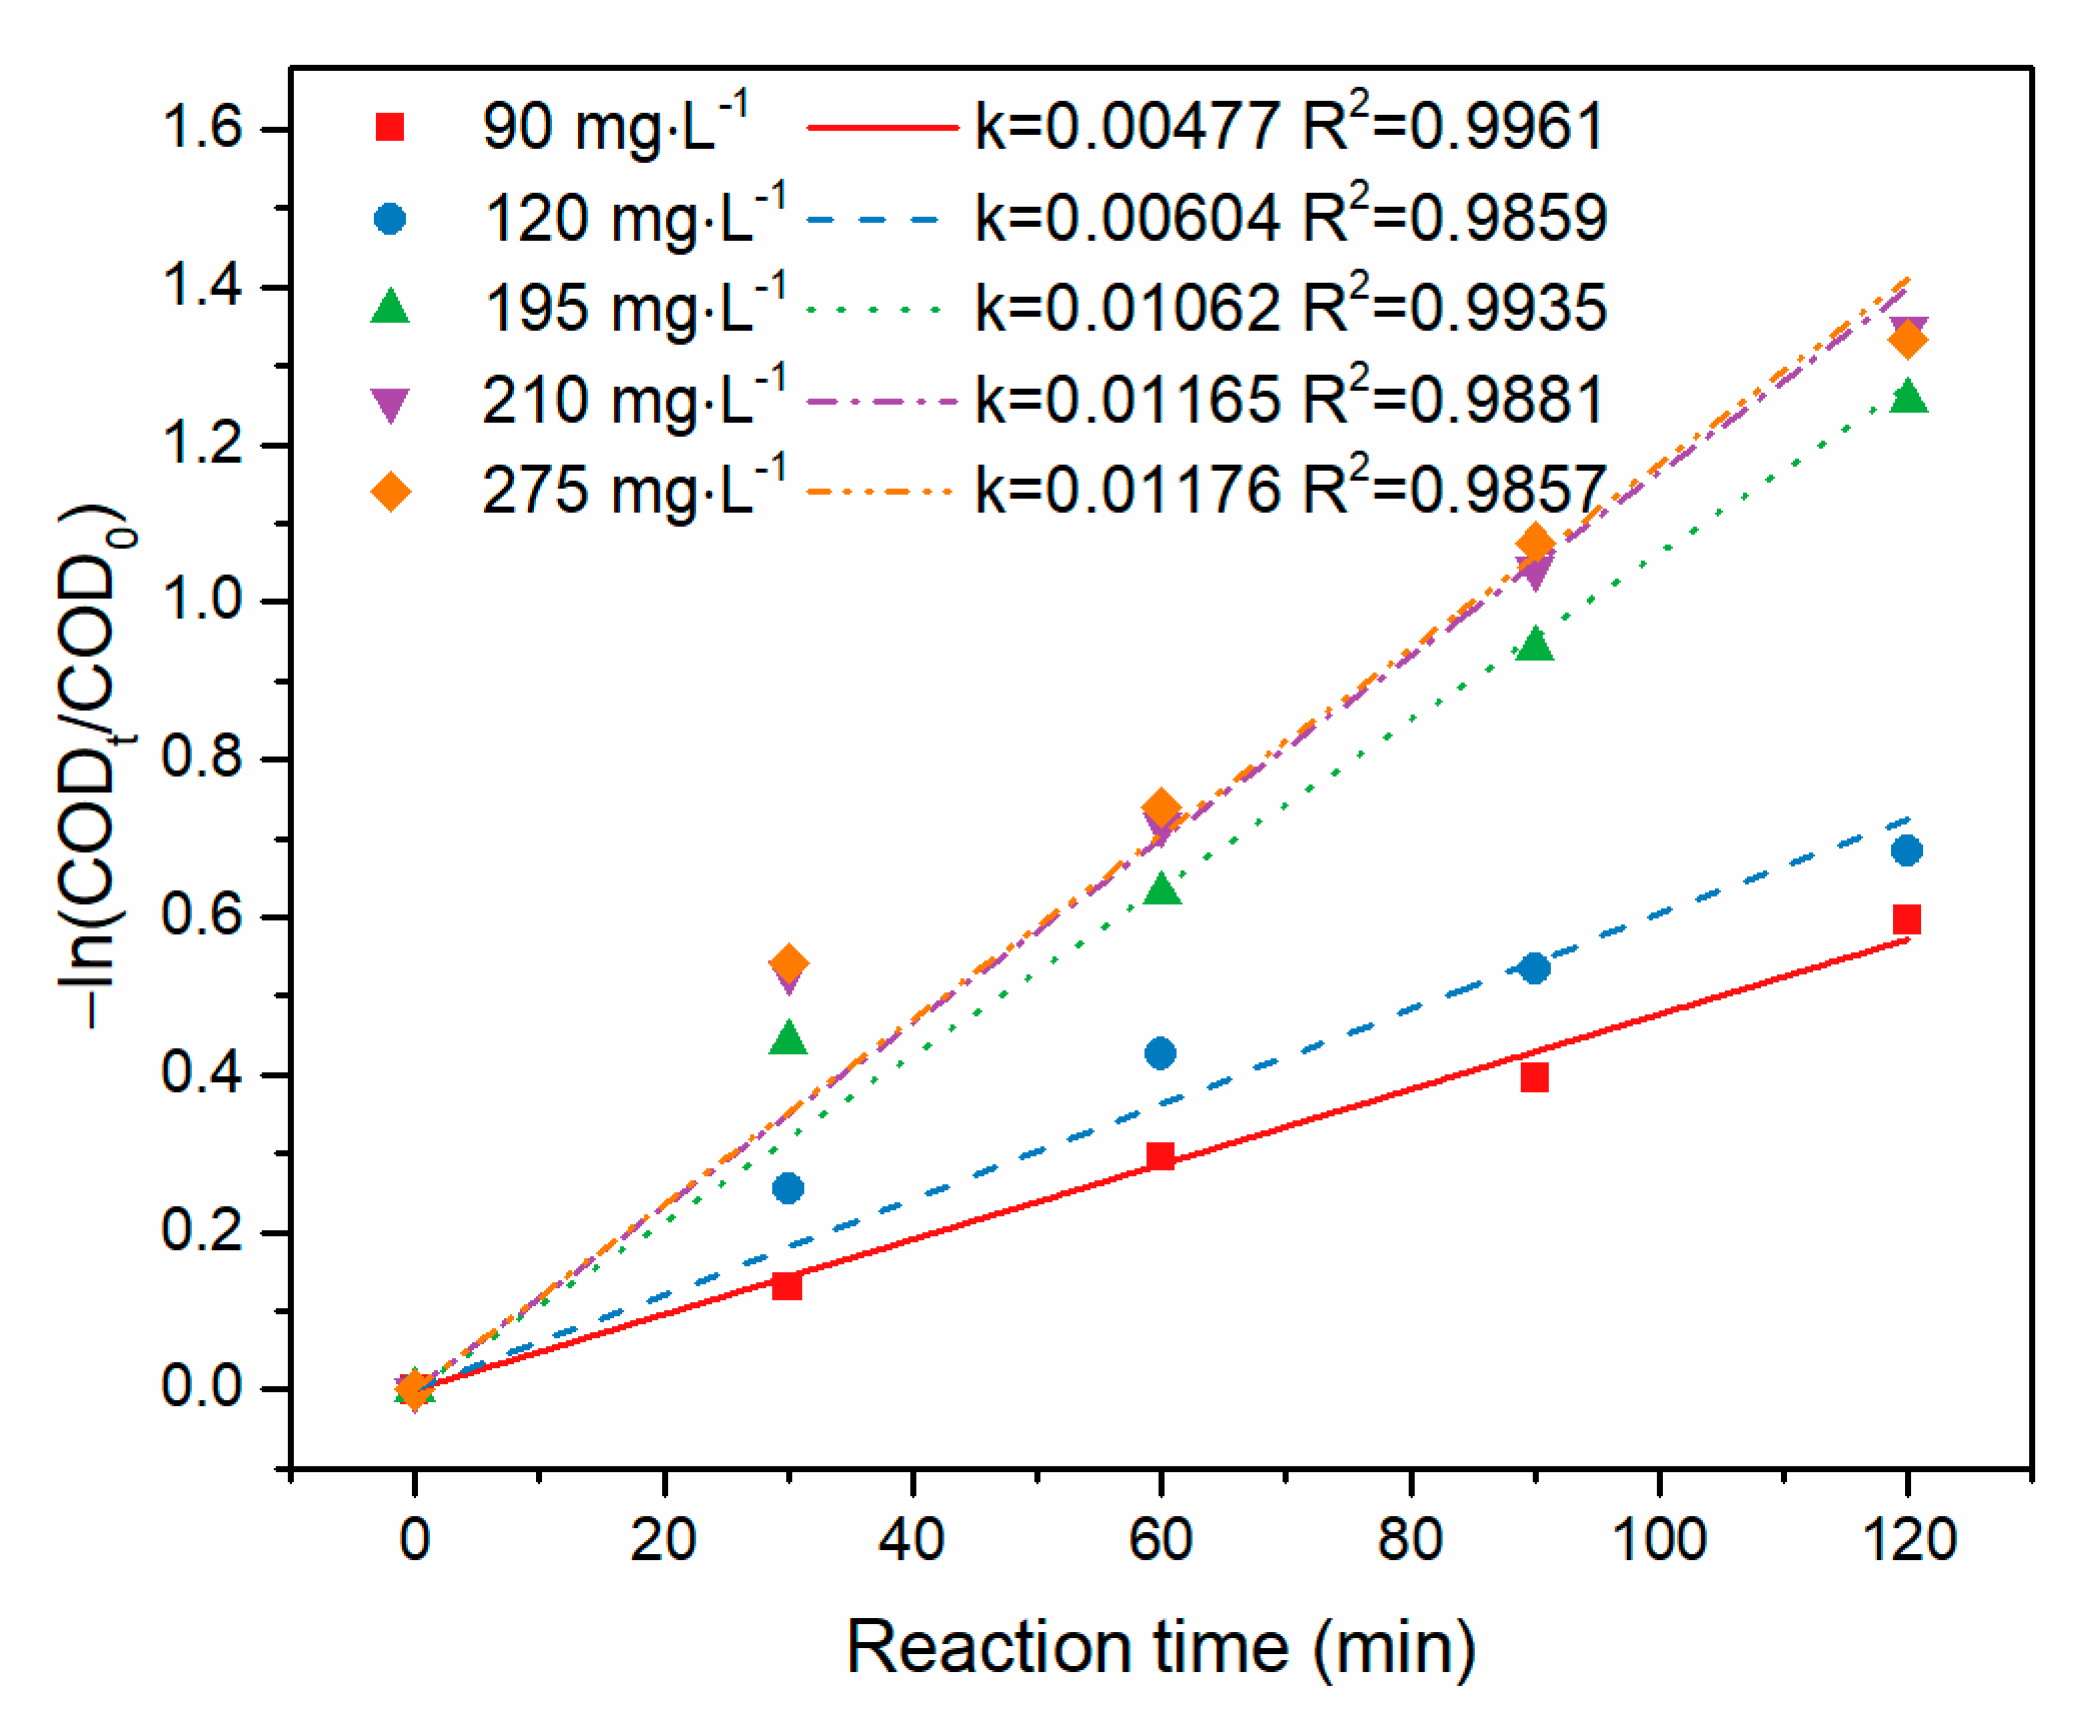
| k (×10−3min−1) | 10.13 | 11.65 | 10.30 | 10.40 | 10.20 | 11.65 | 3.4 |
| Correlation coefficient (R2) | 0.9757 | 0.9881 | 0.9767 | 0.9460 | 0.9870 | 0.9210 | 0.9860 |
| Structural Parameters | h1, 0.30 m | h1, 0.40 m | h1, 0.80 m | h1, 1.69 m |
|---|---|---|---|---|
| h3, 1.39 m | h3, 1.29 m | h3, 0.89 m | h3, 0 m | |
| COD removal efficiency | 45.6% | 48.2% | 47.5% | 26.3% |
| 15 Day | 487 Day | |||||
|---|---|---|---|---|---|---|
| Influent (ug·L−1) | Efflunent (ug·L−1) | Removal (%) | Influent (ug·L−1) | Efflunent (ug·L−1) | Removal (%) | |
| Naphthalene | 0.5405 | 0.211 | 60.96 | 0.5523 | 0.2358 | 57.31 |
| Acenaphthylene | 0.3937 | Not detected | 0.3896 | Not detected | ||
| Acenaphthene | 0.4125 | 0.0638 | 84.53 | 0.4345 | 0.0791 | 81.80 |
| Fluorene | 1.2784 | 0.1401 | 89.04 | 1.2788 | 0.1453 | 88.64 |
| Phenanthrene | 3.1121 | 0.3985 | 87.20 | 3.2136 | 0.4605 | 85.67 |
| Anthracene | 0.6121 | 0.1197 | 80.44 | 0.7089 | 0.1414 | 80.05 |
| Fluoranthene | 1.4787 | 0.2371 | 83.97 | 1.8129 | 0.3088 | 82.97 |
| Pyrene | 1.0649 | 0.1904 | 82.12 | 1.0742 | 0.1961 | 81.74 |
| Benz[a]anthracene | 0.2715 | 0.1218 | 55.14 | 0.2856 | 0.1314 | 53.99 |
| Chrysene | 0.1983 | 0.0751 | 62.13 | 0.2017 | 0.0778 | 61.43 |
| Benzo[b]fluoranthene | 0.3123 | 0.1358 | 56.52 | 0.3357 | 0.1488 | 55.67 |
| Benzo[k]fluoranthene | 0.2015 | 0.0944 | 53.15 | 0.2145 | 0.1022 | 52.35 |
| Benzo[a]pyrene | 0.0313 | 0.0133 | 57.51 | 0.0405 | 0.0179 | 55.80 |
| Indeno[1,2,3-cd]pyrene | 1.1235 | 0.1656 | 85.26 | 1.3257 | 0.2023 | 84.74 |
| Dibenz[a.h]anthracene | 1.9065 | 0.3752 | 80.32 | 2.0178 | 0.4395 | 78.22 |
| Benzo[g,h,i]perylene | 2.1321 | 0.2758 | 87.06 | 2.2456 | 0.3083 | 86.27 |
© 2020 by the authors. Licensee MDPI, Basel, Switzerland. This article is an open access article distributed under the terms and conditions of the Creative Commons Attribution (CC BY) license (http://creativecommons.org/licenses/by/4.0/).
Share and Cite
He, C.; Wang, J.; Xu, H.; Ji, X.; Wang, W.; Xu, X. Treatment of Bio-Treated Coking Wastewater by Catalytic Ozonation with Semi-Batch and Continuous Flow Reactors. Water 2020, 12, 2532. https://doi.org/10.3390/w12092532
He C, Wang J, Xu H, Ji X, Wang W, Xu X. Treatment of Bio-Treated Coking Wastewater by Catalytic Ozonation with Semi-Batch and Continuous Flow Reactors. Water. 2020; 12(9):2532. https://doi.org/10.3390/w12092532
Chicago/Turabian StyleHe, Can, Jianbing Wang, Heng Xu, Xiangyu Ji, Weiyi Wang, and Xieyang Xu. 2020. "Treatment of Bio-Treated Coking Wastewater by Catalytic Ozonation with Semi-Batch and Continuous Flow Reactors" Water 12, no. 9: 2532. https://doi.org/10.3390/w12092532
APA StyleHe, C., Wang, J., Xu, H., Ji, X., Wang, W., & Xu, X. (2020). Treatment of Bio-Treated Coking Wastewater by Catalytic Ozonation with Semi-Batch and Continuous Flow Reactors. Water, 12(9), 2532. https://doi.org/10.3390/w12092532