Abstract
The photocatalytic degradation of potassium hexacyanoferrate (III) was assessed in a bench-scale compound parabolic collectors (CPC) reactor assisted with a light-emitting diode (LED) UV-A source emitting at 365 nm, and using a modified TiO2 as a catalyst via the hydrothermal treatment of commercial Aeroxide P25. The experiments were performed under oxic and anoxic conditions in order to observe a possible reduction of the iron. The modified TiO2 showed a specific surface area 2.5 times greater than the original Aeroxide P25 and its isotherm and hysteresis indicated that the modified catalyst is mesoporous. The bandgap energy (Eg) of the modified TiO2 increased (3.34 eV) compared to the P25 TiO2 band gap (3.20 eV). A specific reaction rate constant of 0.1977 min−1 and an electrical oxidation efficiency of 7.77 kWh/m3 were obtained in the photocatalytic degradation. Although the TiO2 P25 yields a photocatalytic degradation 9.5% higher than that obtained one with the modified catalyst (hydrothermal), this catalyst showed better performance in terms of free cyanide release. This last aspect is a significant benefit since this can help to avoid the pollution of fresh water by reusing the treated wastewater for gold extraction. A photocatalytic degradation of the cyanocomplex of 93% was achieved when the process occurred under oxic conditions, which favored the removal. Summarizing, the hydrothermal method could be a promising treatment to obtain TiO2-based catalysts with larger specific areas.
1. Introduction
Small and medium industries of gold extraction use the leaching process with sodium cyanide for mining the gold contained in the extracted ore, before precipitation of the metallic gold in the presence of zinc. During the process, the cyanide extracts undesired metals and thus forms several types of cyano complexes. The produced wastewater is rich in metallic complexes that are formed when the free cyanide interacts with the different metals present in the ores such as Ni, Fe, Co, Au, Ag, etc. These cyano complexes are very stable and recalcitrant compounds, which are hard to remove by natural remediation, resulting in the pollution of rivers, lakes and groundwater sources. Besides, solar photolysis releases free cyanide, which is highly harmful to ecosystems [1]. Advanced oxidation processes (AOPs), such as ozone-based treatments, alkaline chlorination, hydrogen peroxide-based processes, biological and photocatalytic processes, can be used as alternative treatment technologies for these mining wastewaters [2].
The heterogeneous photocatalysis is an AOP where a solid semiconductor, assisted by UV radiation, promotes the generation of free hydroxyl radicals (•OH) and the degradation of diverse pollutants. The most commonly used semiconductor is the titanium dioxide (TiO2), and it can be used as a base oxide for the synthesis of other photoactive catalysts as well. The TiO2 is preferred because of its low cost, easy handling, and low toxicity. In general, when the photocatalyst is irradiated with photons with energy greater than the bandgap (Eg) of the semiconductor, the excited electrons are promoted from the valence band to the conduction band of the semiconductor, leading to the formation of electron–hole pairs. The strong oxidative potential of the holes (h+) oxidizes the hydroxyl anions of water for generating •OH, whereas the electrons of the conduction band can react with oxygen for generating superoxide ions (O2•—) or promote other reduction reactions. Those radicals are the main species responsible for the oxidation reactions in the photocatalytic process [3,4].
To improve the semiconductors’ •OH-generating performance, several studies have been focused on the preparation of semiconductors with enhanced radiation absorption. Different methods of preparation have been reported, namely hydrothermal [5], sol-gel [6], anodic oxidation, template method, and chemical vapor deposition (CVD) [7,8]. TiO2 catalysts doped with rare earth and transition metals have been modified to improve their •OH electron transfer properties. Some modifications on their morphology have also been made to produce structures such as nanorods, nanotubes, nanospheres, nanoflowers, among others [9,10,11,12].
The hydrothermal method has been widely used for the nanomaterial synthesis of TiO2 with diverse morphologies. This methodology is controlled by different variables, namely the precursors used, pH, temperature and reaction time [13]. Nowadays, TiO2-based nanowires, TiO2 nanotubes [14], carbon nanotubes [15], nanofibers, nanoflowers, and others have been successfully modified by hydrothermal treatment [16]. This method has become a very important tool for obtaining advanced materials due to its advantages, such as low cost, low operating temperatures, energy saving and lower impact to the environment (according to the principles of green chemistry) [10,12,17], in comparison to anodic oxidation and CVD methods. The hydrothermal treatment has been applied to the synthesis of nitrogen and carbon co-doped TiO2 [18], Sn-doped TiO2 nanoparticles composites [19], silica-titania combination of sol-gel-hydrothermal TiO2 nanoparticles [20], and both anatase and rutile TiO2 [21]. Moreover, several applications of TiO2 nanoparticles synthesized by the hydrothermal method have been reported such as hydrogen production via CO2 reduction, degradation of emergent pollutants and selective oxidation [22].
Huang and Chien [23] showed that the degradation of methylene blue increases from 65% to 95% with titania nanotubes compared to the powder. Camposeco et al. [24] compared the degradation between nanotubes and Evonik P25, showing that the catalytic activity was improved from 54 to 93% for methylene blue degradation and from 37% to 60% for the elimination of methylene orange. However, there is a lack of specific information about the use of titania modified via hydrothermal process for treating gold mining wastewater under UV/LED radiation.
In this work, the degradation of potassium hexacyanoferrate, which is a complex occurring as a by-product in gold mining wastewaters, via photocatalysis with hydrothermally treated TiO2, was studied. The mechanism proposed by Grieken et al. 2005 [25] or the hexacyanoferrate (III) reduction to hexacyanoferrate (II) and the subsequent degradation by heterogeneous photocatalysis is depicted in Figure 1. After the progressive abatement of the CN− groups in the molecule, the free cyanide can remain stable in solution due to the high pH of treatment or to produce cyanate by photocatalytic degradation, which is less toxic than the free cyanide. Nonetheless, the free cyanide is an advantage if the treated wastewater can be reused for the gold extraction. This would reduce the fresh water and cyanide consumptions and a consequent diminution of cyanide presence in water bodies.
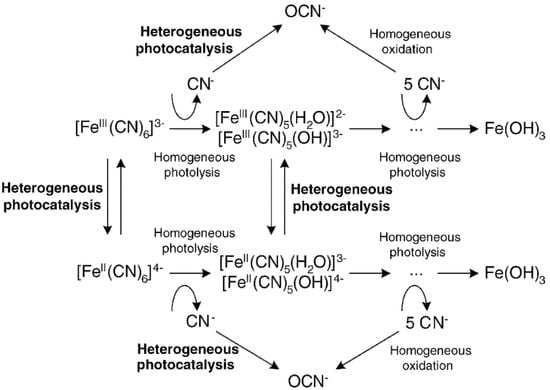
Figure 1.
Mechanism of the heterogeneous photocatalytic degradation of Hexacyanoferrate [25]. Reprinted from Applied Catalysis B: Environmental, 55, Rafael van Grieken *, José Aguado, María-José López-Muñoz, Javier Marugán, Photocatalytic degradation of iron–cyanocomplexes by TiO2 based catalysts, 201–211, Copyright (2005), with permission from Elsevier.
The mechanism of free cyanide release is congruent with the reported literature [26,27,28,29]. The oxic conditions were analyzed in order to compare these results with the obtained ones in our previous work [27]. A further contribution respect to the reported literature is the use of the modified P25 via hydrothermal treatment and its potential improvement for the potassium hexacyanoferrate removal.
The photocatalytic performance of the obtained titania was evaluated by analyzing the effect of the catalyst load on the overall efficiency of the photodegradation under both oxic and anoxic conditions. In addition, the impact of the variation of the power supplied by the UV source and of the initial concentration of the cyanocomplex, was assessed. All the experiments were carried out in a bench-scale compound parabolic collector (CPC) photoreactor with artificial UV/LED radiation.
2. Materials and Methods
2.1. Catalyst Treatment
The catalyst was modified by using the hydrothermal treatment [30,31,32,33,34]. Six grames of Aeroxide P25 (Evonik®, Essen, Germany) were mixed with 100 mL of a 10-M solution of NaOH (Merck, Darmstadt, Germany). The solution was stirred to avoid the formation of agglomerates and then it was decanted into a 120-mL beaker. Subsequently, it was transferred to a stainless-steel sealed reactor. The reactor temperature increased up to 120 or 180 °C during 24 or 72 h, according to the 23 experimental design described in Table 1. The white precipitate was washed with a 0.1-M HCl (Merck, Darmstadt, Germany) solution under stirring. The solid was recovered by centrifugation followed by a series of washing cycles with deionized water until the pH of the supernatant was 7.4. After drying the solid at 100 °C for 24 h, it was calcinated at 400 or 500 °C during four hours, with a heating gradient of 10 °C/min. Figure 2 shows the detailed procedure for the synthesis of photocatalysts.

Table 1.
Experimental runs of the 23 factorial design.
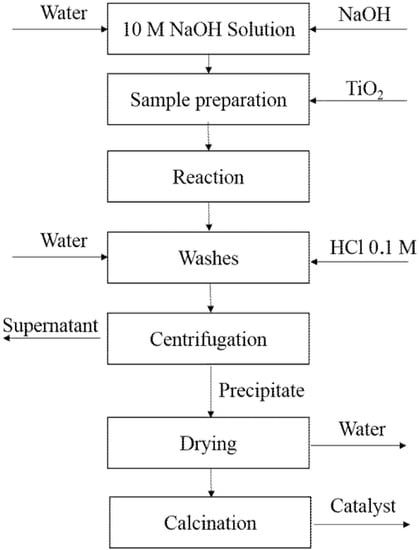
Figure 2.
Schematic diagram of the hydrothermal synthesis method used.
Table 1 shows the different conditions of reaction time, reaction temperature and calcination temperature used to prepare each of the eight catalysts. For the statistical analysis, an analysis of variance (ANOVA) was carried out, considering a significance level of 0.05.
2.2. Catalyst Evaluation
The evaluation of the performance of the modified catalysts was carried out in a bench-scale CPC reactor assisted by a UV/LED radiation source [27,35]. The reactor consisted of four Pyrex tubes with an outside diameter of 2 cm and a length of 11 cm, which were connected to a 750-mL container through a centrifugal pump. The input power of the centrifugal pump was 50 W. The container was sealed at the top with a stopper, which had openings for sampling and oxygen/nitrogen inlet to the gas diffuser [27].
Four 30 W LEDs (TaoYuan Electron Ltd. TY-365 nm, Hong Kong, China) connected in parallel, were used as the artificial light source. The light output was set up with a tilt angle of 115–125° and of 900–1200 mW of radiation intensity per LED [27,35]. Each LED (model GW GPS-3030D, GWINSTEK, Veldhoven, Netherlands) was equipped with a cooling system consisting of heat sinks and a 12-V fan. The UVA radiation intensity was measured with a UV radiometer (DELTA OHM model HD2102.2, Deltha Ohm S.r.l., Padova, Italy) and it was varied by adjusting the current intensity supplied to the LEDs at a constant voltage of 30 V. The reactor had a reactive volume and a total irradiated area of 138.23 cm3 and 276.4 cm2, respectively. The ratio of the illuminated volume to the total volume was 0.23. This ratio is useful to characterize the reactive system volume used with respect to those used by other authors and thus be able to compare its performance.
Once the system was loaded with the matrix to be degraded, the LEDs were placed above the tubes at approximately 3 cm of height, whereas the parabolic collectors were placed below the reactor. The use of these reflective surfaces provides a more homogeneous distribution of the radiation reflected to reactor walls since the bottom of the tubes could be illuminated evenly [36].
The hexacyanoferrate III (K3[Fe(CN)6], CAS 13746-66-2, (Panreac AppliChem, Darmstadt, Germany) was selected as the model cyanocomplex of the gold mining wastewaters. The control experiments (physical adsorption, i.e., without light; or photolysis, i.e., without catalyst) were carried out with 60 mL of solutions of 100 ppm of the pollutant. For the physical adsorption experiment, the solution was kept under continuous stirring in a 500-mL beaker, under darkness conditions. For the photolysis experiment, the power of the UV-LEDs was set at 30 W that supplies the maximum intensity of UV radiation. For both experiments, an aliquot of 5 mL was taken every 10 min during two hours (time set for the reaction).
The results obtained for the removal were estimated with the Equation (1):
where C is the final concentration and C0 the initial concentration
For each optimization step, 500 mL of a solution of 100 ppm of hexacyanoferrate was prepared. For keeping the solution pH above 12, 1 mL of a 10 M solution of NaOH was previously added to 500 mL of hexacyanoferrate solution. After an adsorption stage carried out under darkness conditions for 20 min, the LEDs were turned on to perform the photocatalytic runs. The experiments were carried out at room temperature (20 °C) and 10 mL aliquots (less than 10% of the total volume) were taken at different time intervals. For oxic and anoxic experiments, air or nitrogen was sparged, according to the case, into the solution at a constant flow rate of 0.5 L/min. The optimization study was executed in four stages:
- (1)
- Variation of the catalyst dose (0.1, 0.3, 0.5 and 0.7 g/L) to determine the best performing catalyst dose, at oxic conditions for an hour.
- (2)
- Comparison of reactions (during two hours) under anoxic and oxic conditions, using the best performing catalyst dose selected in the previous stage to select the best conditions for the following experiments: oxic (air) or anoxic (nitrogen).
- (3)
- Variation of the radiation intensity, by testing the power supplied by the LEDs (10, 20 and 30 W) during 3 h of reaction.
- (4)
- Variation of the initial concentration of the contaminant (50–100 ppm) during three hours of reaction.
The hexacyanoferrate (III) concentration was followed by UV-VIS (JASCO V-730 spectrophotometer, Easton, MD, USA) at 303 nm, corresponding to its maximum absorbance wavelength in the UV spectrum. The measurement of total dissolved iron was performed using atomic absorption spectrometry (Thermo Scientific iCE 3000, Waltham, MA, USA) and the measurement of CN− by titration with AgNO3 according to the Standard Methods 4500 [37].
A kinetic law with a two-step reaction was used to describe the degradation of hexacyanoferrate (III). The first step (faster) corresponds to the adsorption of Fe(CN)63− onto the surface of TiO2 and degradation of the iron modified, whereas the second step (slower) corresponds to the reduction of the iron present in the cyano-metallic complex (that corresponds to the removal of dissolved iron) [38].
For the kinetic analysis of the photo reductive process of the iron cyanocomplex, a pseudo first-order reaction rate equation was proposed (Equations (2) and (3)), as suggested by previous studies [39,40,41]:
where k′ is the pseudo first-order rate constant (min−1), C0 and C are the initial and final concentrations of the iron complex in solution, respectively. The ln (C0/C) was plotted versus time for obtaining the k′ value, which is the slope of the equation of the line.
2.3. Characterization
The crystalline phases of the resulting solid from the hydrothermal synthesis were characterized using X-ray diffraction (XRD) on a X’per PRO-PANalytical diffractometer with CuKα radiation (0.1542 nm) with a 2θ sweep between 0° and 90°. The surface area was determined by the Brunauer–Emmett–Teller method (BET) by adsorption–desorption of nitrogen (N2) at 77 K and the volume and size of the pore were determined by the Barrett–Joyner–Halenda method (BJH) in a Micromeritics equipment ASAP 2020 V4.01 (Micromeritics, Norcross, GA, USA).
The morphology was analyzed by scanning electron microscopy (SEM) and X-ray energy dispersion spectrometry (EDS) was used for the analysis of elemental composition of the catalyst in a JEOL JSM 6490 LV brand equipment. The semiconductor bandgap (Eg) was estimated by measuring the material transmittance with UV-vis diffuse reflectance spectroscopy (UV DRS) in a Thermo Scientific Evolution 300 PC series EVOP068001 spectrophotometer. Finally, the Fourier-transform infrared spectroscopy (FT-IR) was used to identify the functional groups of the inorganic and organic substances (FT/IR-4100 type-A).
2.4. Estimation of the Electric Oxidation Efficiency (EEo)
The IUPAC has proposed methods to calculate the electrical consumption of an AOP, depending on the type of reactor and the amount of contaminant to be treated. For low concentrations, it is proposed to use the electric energy per order (EEo). This parameter consists of the electrical energy (kWh) required to remove the pollutant up to 90% of its initial concentration per volume unit. The EEo can be calculated using the Equation (4), following the methodology proposed by Shirzad-Siboni et al. [41] and Daneshvar et al. [40]:
where P is the power supplied to the system (kW) and it is defined as the product of electric potential and the current intensity (A); V is the total reactive volume (L), and t is time (h). From Equations (3) and (4), the EEo can be calculated as follows:
3. Results and Discussion
3.1. Photolysis and Adsorption
The control tests in 3-h experiments showed that the photolysis contributes moderately to the removal of contaminants and the release of free cyanide. A 17% of photolytic removal of hexacyanoferrate and a 12% of cyanide release were achieved, which is in agreement with the results reported in this literature review [26]. On the contrary, the adsorption had a minor effect both in the elimination of contaminants and in the release of cyanide, respectively, 10% and less than 5% after three hours of experimentation. It was observed that 8% of the initial hexacyanoferrate concentration was adsorbed during the first 20 min of the experiment and therefore the dark period for the photocatalytic runs was set at 20 min.
3.2. Evaluation of Synthesized Materials
3.2.1. Catalyst Load
This behavior observed in the Figure 3 is explained by the lower flow of photons into the reactive system resulting from the higher turbidity (catalyst loads higher than 0.5 g/L) of the slurry to treat [42]. This screening effect limits the effectiveness of the treatment by decreasing the local volumetric rate of photon absorption for tubular photoreactors, which has been analyzed by Colina-Marquez et al. in 2010 [43] and Mueses et al. in 2013 [44]. Those studies reported an optimal catalyst load of 0.3 g/L for CPC reactors, approximately. In turn, Osathaphan et al. [45] used catalyst loads between 0.1 and 4 g/L without affecting the reductive treatment considerably. Given the best results when using 0.5 g/L of both SL400 and SL500, both catalysts were promising to degrade the cyanocomplex. To select the best performing catalysts modified, photocatalytic experiments were performed using 0.5 g/L of each catalyst to degrade the pollutant during 2 h of reaction. For the further experiments, 0.5 g/L of SL400 was selected, due to the better performance and also in order to save energy in the calcination process.
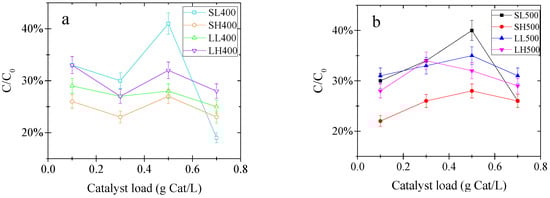
Figure 3.
Evaluation of the best catalyst load to remove the cyanocomplex (hexacyanoferrate III) after 1 h of reaction (a) Catalysts calcined at 400 °C; (b) Catalysts calcined at 500 °C. Operating conditions: Initial pollutant concentration of 100 ppm, 20 min of adsorption, LED power supply of 20 W, air flow of 0.5 L/min.
Table 2 shows the results of the degradation obtained at different synthesis temperatures, calcination temperature and synthesis times.
Table 2.
Degradation percentage of K3[Fe(CN)6] after 2 h of reaction, using a catalyst load of 0.5 g/L.
A statistical analysis (see Table 3) of the information reported in Table 2 was carried out by using Statgraphics® Centurion XVI (version 16.2.04, Statpoint Technologies Inc., The Plains, VA, USA) and it was found that the calcination temperature was the most significant effect on the response variable within the evaluated intervals (see Figure 4), obtaining better results with 400 °C. The second most significant effect was the synthesis temperature and the best results were obtained at 120 °C; however, it is not statistically significant. Comparing the information of the table with the Pareto chart (Figure 4), it can be observed that the calcination temperature has a negative effect; that means that an increase of this variable represents a degradation decrease. This behavior can be attributed to the reduction of the surface area of the catalyst or material sintering at higher temperatures [6].
Table 3.
ANOVA for degradation percentage of K3[Fe(CN)6].
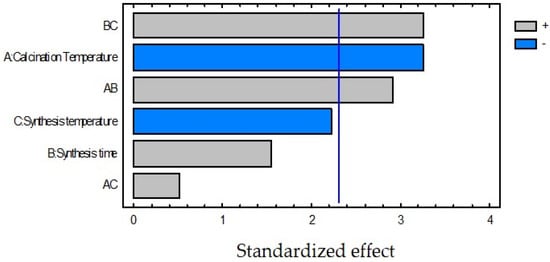
Figure 4.
Standardized Pareto Chart for degradation percentage of K3[Fe(CN)6].
On the other hand, although the synthesis time was not significant, its interactions with the other variables were meaningful and synergistic. This behavior is interesting because it means that a simultaneous increase of the calcination and synthesis temperatures with the synthesis time represents an improvement on the pollutant removal. In fact, the interaction between the synthesis time and the synthesis temperature (BC) is as significant as the effect of the calcination temperature. In addition, it was found that the best results for the degradation of the cyanocomplex were obtained for the catalyst modified at 24 h—120 °C to 400 °C (SL400). Considering all these facts, the following stages were carried out using SL400.
3.2.2. Tests Under Oxic and Anoxic Conditions
The degradation of the cyanocomplex by photocatalysis using SL400 was evaluated under oxic and anoxic conditions, to evaluate the importance of the presence of oxygen (Figure 5).
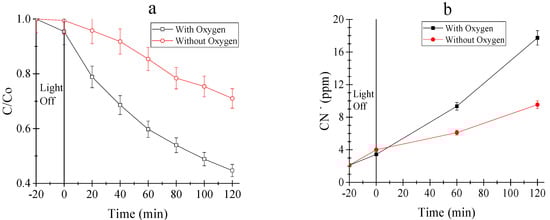
Figure 5.
(a) Cyanocomplex (hexacyanoferrate III) degradation; and (b) release of free cyanide. Operating conditions: Initial concentration of K3[Fe(CN)6] of 100 ppm, catalyst load of 0.5 g/L, 20 min of adsorption, Power supply: 20 W, air or nitrogen flow of 0.5 L/min, reaction time of 2 h.
After two hours of reaction, 56% of the cyanocomplex was degraded in the presence of oxygen, whereas it was only 29% when air was replaced by nitrogen. In turn, the cyanide release was two times higher when air containing oxygen was used (18 ppm in the presence of oxygen and 9 ppm using nitrogen). Finally, for the total removal of iron, a removal of 40% was achieved in the presence of oxygen and only 15% under an inert atmosphere. The higher degradation of the cyanocomplex and release of free cyanide in the presence of oxygen can be ascribed to the, electrons directly reducing iron and the oxidation of the complex by holes, hydroxyl radicals and superoxide anions. In contrast to our results that showed that the presence of oxygen during the reaction increases the degradation of the complex, Yang et al. [46] and Ku and Jung [47] reported a better performance of the P25 TiO2 for the removal of the studied contaminants under anoxic conditions. In these reports, the authors observed that the presence of oxygen did not have a significant effect on the contaminant removal, whereas a higher reduction was showed with nitrogen.
3.2.3. Effect of the Radiation Intensity
The availability of UV photons directly affects the generation of electron–hole pairs. By comparing the results obtained at 10, 20 and 30 W (Figure 6a), it can be observed that the radiation intensity higher effect when increasing from 10 to 20 W than after a further increase to 30 W. Regarding to the degradation of the cyanocomplex, removals of 55, 73 and 79% were obtained with 10, 20 and 30 W, respectively. Additionally, iron removals of 30, 48 and 60% were achieved for 10, 20, and 30 W, respectively. The dissolved iron concentration was analyzed to corroborate its removal from the solution and its deposition onto the catalyst surface (Figure 6b).
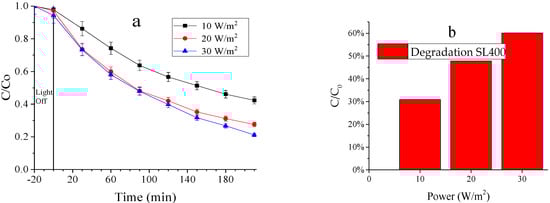
Figure 6.
(a) Degradation of the cyanocomplex (hexacyanoferrate III) at 10 W, 20 W and 30 W; (b) Total removal of dissolved iron. Operating conditions: Initial concentration of K3[Fe(CN)6] of 100 ppm, catalyst load of 0.5 g/L, 20 min of adsorption, air flow of 0.5 L/min, reaction time of 3.5 h.
The degradation values obtained with 20 and 30 W exhibited similar behaviors. An energy increase of 33% (20 to 30 W) yielded just an increase of 8.12% for the cyanocomplex degradation. This means that this energy increase is not enough to significantly affect the degradation performance. Therefore, the radiation intensity of 20 W was selected as the best condition due to the less energy consumption. Similar results were obtained by Rodriguez and Ossa [27], reporting a better but not significant performance when working at 30 than 20 W, and thus the selection of an inferior power supply to avoid an additional electrical consumption.
3.2.4. Comparison between Modified TiO2 and the Raw P25
By comparing the raw and treated TiO2, the degradation efficiency obtained with SL400 was 70%, whereas TiO2 P25 led to a photocatalytic removal of 80% (Figure 7a). In turn, 20 ppm of cyanide are released by SL400 and less 10% is observed for TiO2 P25, with 18 ppm of cyanide released (Figure 7b). Although for the complex degradation, the TiO2 P25 showed better results; regarding to the free cyanide release, the SL400 showed a performance 10% higher. As the initial concentration of contaminant increases, the degradation decreases, as it was documented in the studies of Yang et al. [46] and Samarghandi et al. [39]. The cyanide release can be beneficial since it can be reused in the mining processes where such cyanide can be returned for the mineral (gold) re-extraction process. This feature would make the use of the synthesized material economically and environmentally attractive and also attenuate its weakness against P25 in terms of degradation of the hexacyanoferrate complex.
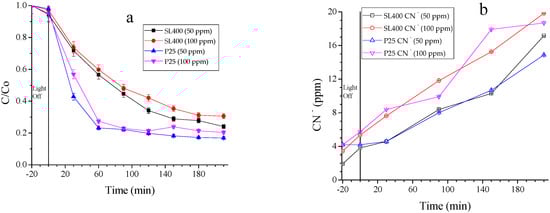
Figure 7.
(a) Cyanocomplex degradation; (b) Free cyanide released. Operating conditions: 0.5 L/min of air bubbled, 0.5 g cat/L solution, 3.5 h of reaction with 30 min of adsorption and power supply of 20 W.
Van Grieken et al. [25] reported that the oxidative degradation of hexacyanoferrate (100 ppm of initial concentration) releases around 20 ppm of CN− in 240 min of irradiation by using mercury lamps. In this study, the same amount of cyanide ion was released in 210 min by using a UVA/LED photon source.
Table 4 shows the values found for the pseudo first-order speed constant (min−1) for a reaction time of 210 min. As it can be seen, the P25 TiO2 rate constants are higher than the SL400 ones for both initial concentrations of the pollutant. This can be explained because of the differences in superficial area, particle size distribution, semiconductor purity and other features in electronic properties.
Table 4.
Pseudo first order rate constants.
3.2.5. Electric Oxidation Efficiency
Table 5 shows the EEo values obtained for the P25 and the SL400 sample with two different concentrations of hexacyanoferrate.
Table 5.
Electrical oxidation efficiency for the catalysts used.
The P25 still exhibits better performance regarding to the energy consumption. This behavior is related to the higher activity of the commercial standard, which was discussed previously. The obtained results are similar to the reported ones by Daneshvar et al. [40], which did not exceed 10 kWh/m3. On the other hand, when the value obtained is compared with the study of Rodriguez and Ossa [27], it was found that the EEo is 40 and 20 times lower, respectively, than the presented ones in Table 5. In these works, it was reported the same concentration of Fe(CN)6 but with the use of different catalysts.
3.3. Characterization of the Photocatalyst
3.3.1. Fourier-Transform Infrared Spectroscopy (FT-IR)
The Figure 8 shows the IR spectra of the SL400 before and after usage in the photocatalytic experiments. Four bands are highlighted that are common in both spectra. As described by Thennarasu et al. [48], the peaks observed around 3300–3400 cm−1 correspond to the stretching vibrations (stress) of the •OH and around 1600 cm−1 arises from the water bending mode that can be associated with water absorbed by the catalyst due to the presence of moisture in the materials by contact with air. The main bands below 1000 cm–1 were attributed to the Ti-O and Ti-O-Ti bending vibrations. The band around 1300 cm−1 is attributed to the C-H bending vibrations.
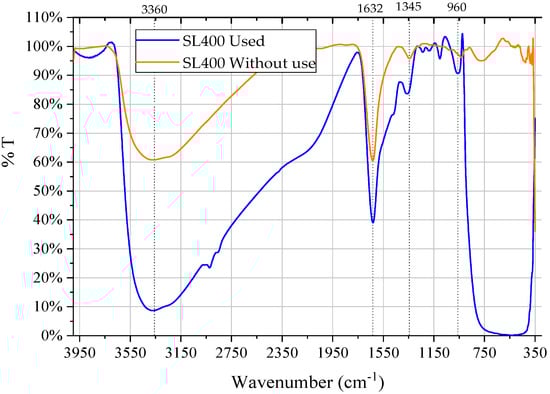
Figure 8.
FTIR spectra of SL400 before and after the photocatalytic reaction.
3.3.2. XRD Results
According to Mozia et al. [33], the peaks found at 2θ of 24°, 28° and 48° as those observed for SL400 (Figure 9) correspond to titanates of the form A2Ti2O5·H2O and A2Ti3O7. The sodium titanates (Ti12O36Na4 or Ti3O9Na) exhibit peaks at 10°, 24°, 28°, 48° and 62°, which evidence the presence of the anatase phase of TiO2 at 25°, 62°, and 82°. The analysis showed no significant amount of rutile since may be found at calcination temperatures over 600 °C.
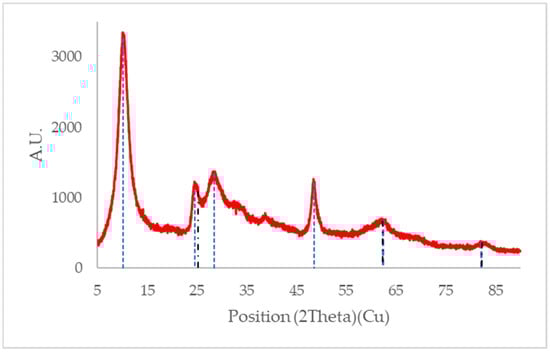
Figure 9.
XRD pattern for SL400 without use. The blue dotted lines represent the peaks associated with titanates and the black dotted line represents the peaks associated with the anatase phase of TiO2.
The most significant difference between the SL400 diffractogram (Figure 9) and that of P25 (Figure 10) without modifications [49], is the sharper peaks obtained by XRD for the commercial P25. This means a more crystalline structure for the unmodified P25 and some amorphous characteristics for the modified material (SL400). This modification affected the overall performance of the modified material regarding to the activity and, therefore, the pollutant removal. In addition, the XRD of SL400 does not have characteristic peaks of rutile phase as P25, which are known to improve the photocatalytic activity thanks to its synergistic effect with the anatase.
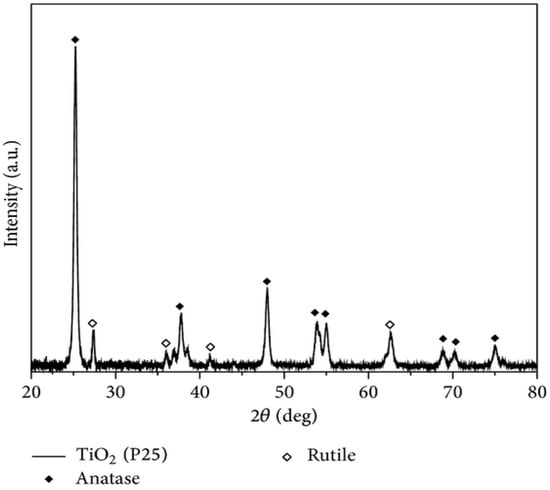
Figure 10.
XRD pattern for TiO2 P25 [49].
3.3.3. EDS Results
The Figure 11 shows a micrograph obtained from SL400. Additionally, an energy-dispersive X-ray spectroscopy analysis (EDS) was performed for elemental detection of the modified catalyst (see Figure 11). This analysis shows the type of elements present in different analyzed areas of the catalyst, where the presence of Carbon (C), Oxygen (O), Sodium (Na) and Titanium (Ti) were exhibited, with their respective composition, as shown in Table 6.
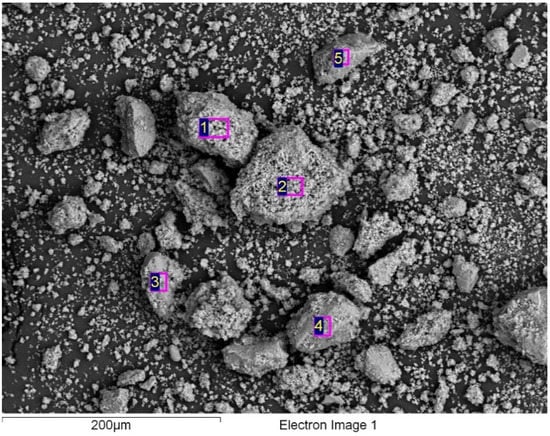
Figure 11.
EDS analysis of the modified catalyst SL400.
Table 6.
EDS results in % weight in the modified catalyst.
According to the EDS results, the presence of carbon in the material (3–6%), probably from impurities in the precursors used for the synthesis, can affect negatively the photocatalytic performance because of the number of active sites on the semiconductor surface decreases as the carbon occupies them.
3.3.4. Surface Area Results
The surface area was 127.84 m2/g, which is greater than the surface area of the precursor material (50 m2/g). The pore volume of the total amount absorbed was 0.197 cm3/g and the pore size distribution analyzed by the BJH method was approximately 58 Å (5.8 nm) for an average particle size of 469 Å (46.9 nm). An isotherm of type IV was observed (Figure 12) with a hysteresis type III, which suggests that this catalyst is a mesoporous solid (2–50 nm).
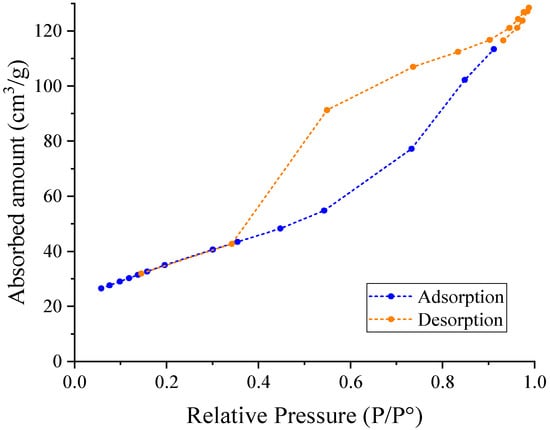
Figure 12.
Isotherm absorption-desorption of the modified catalyst SL400.
Although the sample SL400 has a surface area higher than the P25’s one, the number of active sites could not exceed the amount of sites of the TiO2 P25, since the modified catalyst did not exceed the photocatalytic activity of the precursor. In addition, the absence of rutile phase affects the overall activity of the TiO2, since this phase in the P25 acts synergistically with the anatase to improve the activity of the catalyst. The surface area is similar to those obtained by Turki et al. [50], Sikhwivhilu et al. [51] and Fen et al. [52]. On the other hand, some studies have obtained values higher than 200 m2/g as is the case of Thennarasu et al. [48] and Camposeco et al. [53] with important photocatalytic activity.
3.3.5. Bandgap Energy Estimation by DRS
The bandgap energy (Eg) is one of the most important parameters in the photocatalytic activity of TiO2 since it determines the effective wavelength interval for photon absorption. This parameter was estimated with the Kubelka-Munk theory according to the methodology reported by López and Gómez [54] (see Figure 13). It has to be considered that the crystal size, the particle size, the aggregation state of the particles, and the impurities present in the solid and the method of synthesis, can significantly affect the Eg.
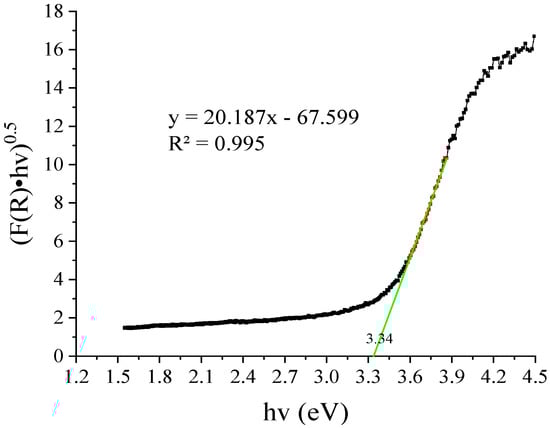
Figure 13.
Estimation of bandgap energy (Eg) of the catalyst SL400 using the Kubelka-Munk function, the red points represent those used to obtain the slope of the line and obtain the intercept on the x axis.
The energy of the bandgap obtained was 3.34 eV and the wavelength (estimated with Equation (6)) at which the catalyst is activated is 370 nm.
If these values are compared with those reported for TiO2 P25 (Eg = 3.20 eV; λ = 385 nm), it is expected that the modified catalyst underperform respect to the commercial standard, regarding the UV photons absorption. This can be a significant drawback when it is intended to use a wide spectrum photons source.
4. Conclusions
The modified TiO2 P25, via the hydrothermal method, did not improve the Fe(CN)6 removal with respect to the obtained one with the original P25. This could be attributed to the loss of both the rutile phase and the material crystallinity. In addition, the increase of the bandgap energy for the modified P25 is another drawback since it affects the photon absorption by the semiconductor. Although the higher free cyanide release achieved with the modified material can be considered as a shortcoming regarding to the environmental potential of this material, in this particular case, this can be beneficial since this free cyanide could be reused for the gold extraction process and so, obtain a closed cycle for the water use. Furthermore, the increase of the specific surface area can be a promising result, in terms of physical adsorption of the studied pollutant or metallic cations.
While at a first sight the hydrothermal method did not improve the activity of the P25, further studies should be carried out to obtain more information about the structural modifications of the catalyst and potential advantages for photocatalytic applications.
Author Contributions
Conceptualization, A.A.-S. and L.A.B.-B.; methodology, A.A.-S. and L.A.B.-B.; software, L.A.B.-B. and A.A.-S.; validation, A.A.-S., L.A.B.-B., F.M.-M. and J.Á.C.-M.; formal analysis, K.M.A.-V. and A.A.-S.; investigation, K.M.A.-V., A.A.-S. and L.A.B.-B.; resources, F.M.-M.; data curation, K.M.A.-V. and L.A.B.-B.; writing—original draft preparation, K.M.A.-V.; writing—review and editing, M.A.M. and J.Á.C.-M.; visualization, M.A.M.; supervision, A.A.-S.; project administration, A.A.-S.; funding acquisition, F.M.-M. and M.A.M. All authors have read and agreed to the published version of the manuscript.
Funding
This research received external funding from “Departamento Administrativo de Ciencia, Tecnología e Innovación (COLCIENCIAS) through GRANT 1106-669-45250 “Recuperación de oro y tratamiento de aguas residuales cianuradas en la industria aurífera de la región pacífico colombiana” and the Universidad del Valle.
Acknowledgments
The authors are grateful to Universidad del Valle and the COLCIENCIAS for the Ph.D. scholarship 567-2012. Also, the authors thank the Biotechnology and Nanotechnology Laboratory of Tecnoparque (Nodo Cali) for the support with the analytical techniques. Colina-Márquez and Mueses thank the University of Cartagena. All authors send thanks to Ana Rita Lado Ribeiro from the University of Porto for the much-appreciated writing revisions of this manuscript.
Conflicts of Interest
The authors declare no conflict of interest.
References
- Moran, R. El Cianuro en la Minería: Algunas Observaciones sobre la Química, Toxicidad y Análisis de las Aguas Asociadas con la Minería. Ecología 1999, 99, 23. [Google Scholar]
- Kuyucak, N.; Akcil, A. Cyanide and Removal Options from Effluents in Gold Mining and Metallurgical Processes. Miner. Eng. 2013, 50–51, 13–29. [Google Scholar] [CrossRef]
- López-Vásquez, A.F.; Colina-Márquez, J.A.; Machuca-Martínez, F. Multivariable analysis of 2,4-d herbicide photocatalytic degradation. DYNA 2011, 78, 119–125. [Google Scholar]
- Pichat, P. A brief survey of the practicality of using photocatalysis to purify the ambient air (indoors or outdoors) or air effluents. Appl. Catal. B 2019, 245, 770–776. [Google Scholar] [CrossRef]
- Lozano-Morales, S.; Morales, G.; Lopez Zavala, M.; Arce, A.; Machuca, F. Photocatalytic Treatment of Paracetamol Using TiO2 Nanotubes: Effect of pH. Processes 2019, 7, 319. [Google Scholar] [CrossRef]
- Arce-Sarria, A.; Machuca-Martínez, F.; Bustillo-Lecompte, C.; Hernández-Ramírez, A.; Colina-Márquez, J. Degradation and Loss of Antibacterial Activity of Commercial Amoxicillin with TiO2/WO3-Assisted Solar Photocatalysis. Catalysts 2018, 8, 222. [Google Scholar] [CrossRef]
- Sulka, G.D.; Brzózka, A.; Liu, L. Fabrication of diameter-modulated and ultrathin porous nanowires in anodic aluminum oxide templates. Electrochim. Acta 2011, 56, 4972–4979. [Google Scholar] [CrossRef]
- Soto Rodriguez, P.E.D.; Olivares, F.; Gómez-Ruiz, S.; Cabrera, G.; Villalonga, R.; Segura del Río, R. Functionalized carbon nanotubes decorated with fluorine-doped titanium dioxide nanoparticles on silicon substrate as template for titanium dioxide film photo-anode grown by chemical vapour deposition. Thin Solid Film. 2018, 656, 30–36. [Google Scholar] [CrossRef]
- Wang, H.; Guo, Z.; Wang, S.; Liu, W. One-dimensional titania nanostructures: Synthesis and applications in dye-sensitized solar cells. Thin Solid Film. 2014, 558, 1–19. [Google Scholar] [CrossRef]
- Byrappa, K.; Adschiri, T. Hydrothermal technology for nanotechnology. Prog. Cryst. Growth Charact. Mater. 2007, 53, 117–166. [Google Scholar] [CrossRef]
- Wang, Y.; He, Y.; Lai, Q.; Fan, M. Review of the progress in preparing nano TiO2: An important environmental engineering material. J. Environ. Sci. 2014, 26, 2139–2177. [Google Scholar] [CrossRef] [PubMed]
- Pang, Y.L.; Lim, S.; Ong, H.C.; Chong, W.T. A critical review on the recent progress of synthesizing techniques and fabrication of TiO2-based nanotubes photocatalysts. Appl. Catal. A 2014, 481, 127–142. [Google Scholar] [CrossRef]
- Kasuga, T.; Hiramatsu, M.; Hoson, A.; Sekino, T.; Niihara, K. Titania Nanotubes Prepared by Chemical Processing. Adv. Mater. 1999, 11, 1307–1311. [Google Scholar] [CrossRef]
- Suzuki, Y.; Yoshikawa, S. Synthesis and Thermal Analyses of TiO2-Derived Nanotubes Prepared by the Hydrothermal Method. J. Mater. Res. 2004, 19, 982–985. [Google Scholar] [CrossRef]
- Gogotsi, Y.; Libera, J.A.; Yoshimura, M. Hydrothermal synthesis of multiwall carbon nanotubes. J. Mater. Res. 2000, 15, 2591–2594. [Google Scholar] [CrossRef]
- Nguyen Phan, T.-D.; Pham, H.-D.; Viet Cuong, T.; Jung Kim, E.; Kim, S.; Woo Shin, E. A simple hydrothermal preparation of TiO2 nanomaterials using concentrated hydrochloric acid. J. Cryst. Growth 2009, 312, 79–85. [Google Scholar] [CrossRef]
- Yoshimura, M.; Byrappa, K. Hydrothermal Processing of Materials: Past, Present and Future. J. Mater. Sci. 2007, 43, 2085–2103. [Google Scholar] [CrossRef]
- Dolat, D.; Quici, N.; Kusiak-Nejman, E.; Morawski, A.W.; Li Puma, G. One-step, hydrothermal synthesis of nitrogen, carbon co-doped titanium dioxide (N,CTiO2) photocatalysts. Effect of alcohol degree and chain length as carbon dopant precursors on photocatalytic activity and catalyst deactivation. Appl. Catal. B 2012, 115–116, 81–89. [Google Scholar] [CrossRef]
- Nguyen-Phan, T.-D.; Pham, V.H.; Chung, J.S.; Chhowalla, M.; Asefa, T.; Kim, W.-J.; Shin, E.W. Photocatalytic performance of Sn-doped TiO2/reduced graphene oxide composite materials. Appl. Catal. A 2014, 473, 21–30. [Google Scholar] [CrossRef]
- Li, Z.; Hou, B.; Xu, Y.; Wu, D.; Sun, Y.; Hu, W.; Deng, F. Comparative study of sol–gel-hydrothermal and sol–gel synthesis of titania–silica composite nanoparticles. J. Solid State Chem. 2005, 178, 1395–1405. [Google Scholar] [CrossRef]
- Andersson, M.; Österlund, L.; Ljungström, S.; Palmqvist, A. Preparation of Nanosize Anatase and Rutile TiO2 by Hydrothermal Treatment of Microemulsions and Their Activity for Photocatalytic Wet Oxidation of Phenol. J. Phys. Chem. B 2002, 106, 10674–10679. [Google Scholar] [CrossRef]
- Liu, N.; Chen, X.; Zhang, J.; Schwank, J.W. A review on TiO2-based nanotubes synthesized via hydrothermal method: Formation mechanism, structure modification, and photocatalytic applications. Catal. Today 2014, 225, 34–51. [Google Scholar] [CrossRef]
- Huang, K.-C.; Chien, S.-H. Improved visible-light-driven photocatalytic activity of rutile/titania-nanotube composites prepared by microwave-assisted hydrothermal process. Appl. Catal. B 2013, 140–141, 283–288. [Google Scholar] [CrossRef]
- Camposeco, R.; Castillo, S.; Mejía-Centeno, I.; Navarrete, J.; Gomez, R. Effect of the Ti/Na molar ratio on the acidity and the structure of TiO2 nanostructures: Nanotubes, nanofibers and nanowires. Mater. Charact. 2014, 90, 113–120. [Google Scholar] [CrossRef]
- Van Grieken, R.; Aguado, J.; López-Muñoz, M.-J.; Marugán, J. Photocatalytic degradation of iron–cyanocomplexes by TiO2 based catalysts. Appl. Catal. B 2005, 55, 201–211. [Google Scholar] [CrossRef]
- Betancourt-Buitrago, L.A.; Hernandez-Ramirez, A.; Colina-Marquez, J.A.; Bustillo-Lecompte, C.F.; Rehmann, L.; Machuca-Martinez, F. Recent Developments in the Photocatalytic Treatment of Cyanide Wastewater: An Approach to Remediation and Recovery of Metals. Processes 2019, 7, 225. [Google Scholar] [CrossRef]
- Betancourt-Buitrago, L.A.; Ossa-Echeverry, O.E.; Rodriguez-Vallejo, J.C.; Barraza, J.M.; Marriaga, N.; Machuca-Martínez, F. Anoxic photocatalytic treatment of synthetic mining wastewater using TiO2 and scavengers for complexed cyanide recovery. Photochem. Photobiol. Sci. 2019, 18, 853–862. [Google Scholar] [CrossRef]
- Caicedo, D.F.; Brum, I.A.S.; Buitrago, L.A.B. Photocatalytic degradation of ferricyanide as synthetic gold mining wastewater using TiO2 assisted by H2O2. REM-Int. Eng. J. 2020, 73, 99–107. [Google Scholar] [CrossRef]
- Kim, S.H.; Lee, S.W.; Lee, G.M.; Lee, B.-T.; Yun, S.-T.; Kim, S.-O. Monitoring of TiO2-catalytic UV-LED photo-oxidation of cyanide contained in mine wastewater and leachate. Chemosphere 2016, 143, 106–114. [Google Scholar] [CrossRef]
- Liu, C.; Zhang, L.; Liu, R.; Gao, Z.; Yang, X.; Tu, Z.; Yang, F.; Ye, Z.; Cui, L.; Xu, C.; et al. Hydrothermal synthesis of N-doped TiO2 nanowires and N-doped graphene heterostructures with enhanced photocatalytic properties. J. Alloy. Compd. 2016, 656, 24–32. [Google Scholar] [CrossRef]
- Procek, M.; Stolarczyk, A.; Pustelny, T.; Maciak, E. A Study of a QCM Sensor Based on TiO₂ Nanostructures for the Detection of NO₂ and Explosives Vapours in Air. Sensors 2015, 15, 9563–9581. [Google Scholar] [CrossRef] [PubMed]
- Chang, G.; Cheng, Z.; Warren, R.; Song, G.; Shen, J.; Lin, L. Highly Efficient Photocatalysts for Surface Hybridization of TiO2 Nanofibers with Carbon Films. ChemPlusChem 2015, 80, 827–831. [Google Scholar] [CrossRef] [PubMed]
- Mozia, S.; Borowiak-Paleń, E.; Przepiórski, J.; Grzmil, B.; Tsumura, T.; Toyoda, M.; Grzechulska-Damszel, J.; Morawski, A.W. Physico-chemical properties and possible photocatalytic applications of titanate nanotubes synthesized via hydrothermal method. J. Phys. Chem. Solids 2010, 71, 263–272. [Google Scholar] [CrossRef]
- Mozia, S. Application of temperature modified titanate nanotubes for removal of an azo dye from water in a hybrid photocatalysis-MD process. Catal. Today 2010, 156, 198–207. [Google Scholar] [CrossRef]
- Betancourt-Buitrago, L.A.; Vásquez, C.; Veitia, L.; Ossa-Echeverry, O.; Rodriguez-Vallejo, J.; Barraza-Burgos, J.; Marriaga-Cabrales, N.; Machuca-Martínez, F. An approach to utilize the artificial high power LED UV-A radiation in photoreactors for the degradation of methylene blue. Photochem. Photobiol. Sci. 2017, 16, 79–85. [Google Scholar] [CrossRef]
- Blanco, J.; Malato, S.; Peral, J.; Sánchez, B.; Cardona, I. Diseño de reactores para fotocatálisis: Evaluación comparativa de las distintas opciones. In Eliminación de Contaminantes por Fotocatálisis Heterogénea; Blesa, M., Ed.; CYTED: Buenos Aires, Argentina, 2001; p. 253. [Google Scholar]
- Rice, E.W.; Bridgewater, L.; American Public Health; American Water Works; Water Environment. Standard Methods for the Examination of Water and Wastewater; American Public Health Association: Washington, DC, USA, 2012. [Google Scholar]
- Osathaphan, K.; Ruengruehan, K.; Yngard, R.; Sharma, V. Photocatalytic degradation of Ni(II)-Cyano and Co(III)-cyano complexes. Water Air Soil Pollut. 2013, 224, 1647. [Google Scholar] [CrossRef]
- Samarghandi, M.; Yang, J.-K.; Giahi, O.; Shirzad-Siboni, M. Photocatalytic reduction of hexavalent chromium with illuminated amorphous FeOOH. Environ. Technol. 2014, 36, 1–30. [Google Scholar] [CrossRef]
- Daneshvar, N.; Aleboyeh, A.; Khataee, A.R. The evaluation of electrical energy per order (EEo) for photooxidative decolorization of four textile dye solutions by the kinetic model. Chemosphere 2005, 59, 761–767. [Google Scholar] [CrossRef]
- Shirzad-Siboni, M.; Farrokhi, M.; Darvishi Cheshmeh Soltani, R.; Khataee, A.; Tajassosi, S. Photocatalytic Reduction of Hexavalent Chromium over ZnO Nanorods Immobilized on Kaolin. Ind. Eng. Chem. Res. 2014, 53, 1079–1087. [Google Scholar] [CrossRef]
- Barakat, M.; Chen, Y.T.; Huang, C.P. Removal of toxic cyanide and Cu(II) Ions from water by illuminated TiO. Appl. Catal. B 2004, 53, 13–20. [Google Scholar] [CrossRef]
- Colina-Márquez, J.; Machuca, F.; Li Puma, G. Radiation Absorption and Optimization of Solar Photocatalytic Reactors for Environmental Applications. Environ. Sci. Technol. 2010, 44, 5112–5120. [Google Scholar] [CrossRef] [PubMed]
- Mueses, M.A.; Machuca-Martinez, F.; Li Puma, G. Effective quantum yield and reaction rate model for evaluation of photocatalytic degradation of water contaminants in heterogeneous pilot-scale solar photoreactors. Chem. Eng. J. 2013, 215–216, 937–947. [Google Scholar] [CrossRef]
- Osathaphan, K.; Chucherdwatanasak, B.; Rachdawong, P.; Sharma, V.K. Photocatalytic oxidation of cyanide in aqueous titanium dioxide suspensions: Effect of ethylenediaminetetraacetate. Sol. Energy 2008, 82, 1031–1036. [Google Scholar] [CrossRef]
- Yang, J.-K.; Lee, S.-M.; Farrokhi, M.; Giahi, O.; Shirzad-Siboni, M. Photocatalytic removal of Cr(VI) with illuminated TiO2. Desalin. Water Treat. 2012, 46, 1–6. [Google Scholar] [CrossRef]
- Ku, Y.; Jung, I.-L. Photocatalytic reduction of Cr(VI) in aqueous solutions by UV irradiation with the presence of titanium dioxide. Water Res. 2001, 35, 135–142. [Google Scholar] [CrossRef]
- Thennarasu, S.; Rajasekar, K.; Balkis Ameen, K. Hydrothermal temperature as a morphological control factor: Preparation, characterization and photocatalytic activity of titanate nanotubes and nanoribbons. J. Mol. Struct. 2013, 1049, 446–457. [Google Scholar] [CrossRef]
- White, L.; Koo, Y.; Yun, Y.; Sankar, J. TiO2 Deposition on AZ31 Magnesium Alloy Using Plasma Electrolytic Oxidation. J. Nanomater. 2013, 2013, 319437. [Google Scholar] [CrossRef]
- Turki, A.; Kochkar, H.; Guillard, C.; Berhault, G.; Ghorbel, A. Effect of Na content and thermal treatment of titanate nanotubes on the photocatalytic degradation of formic acid. Appl. Catal. B 2013, 138–139, 401–415. [Google Scholar] [CrossRef]
- Sikhwivhilu, L.; Sinha Ray, S.; Coville, N. Influence of bases on hydrothermal synthesis of titanate nanostructures. Appl. Phys. A 2009, 94, 963–973. [Google Scholar] [CrossRef]
- Fen, L.B.; Han, T.K.; Nee, N.M.; Ang, B.C.; Johan, M.R. Physico-chemical properties of titania nanotubes synthesized via hydrothermal and annealing treatment. Appl. Surf. Sci. 2011, 258, 431–435. [Google Scholar] [CrossRef]
- Camposeco, R.; Castillo, S.; Navarrete, J.; Gomez, R. Synthesis, characterization and photocatalytic activity of TiO2 nanostructures: Nanotubes, nanofibers, nanowires and nanoparticles. Catal. Today 2016, 266, 90–101. [Google Scholar] [CrossRef]
- López, R.; Gomez, R. Band-Gap Energy Estimation from Diffuse Reflectance Measurements on Sol–Gel and Commercial TiO2: A Comparative Study. J. Sol-Gel Sci. Technol. 2011, 61, 1–7. [Google Scholar] [CrossRef]
© 2020 by the authors. Licensee MDPI, Basel, Switzerland. This article is an open access article distributed under the terms and conditions of the Creative Commons Attribution (CC BY) license (http://creativecommons.org/licenses/by/4.0/).