Article

The Fate of Anthropogenic Nanoparticles, nTiO2 and nCeO2, in Waste Water Treatment

1
AUD Analytik- und Umweltdienstleistungs GmbH, Jagdschänkenstr. 52, D-09117 Chemnitz, Germany
2
Department Water, Environment, Civil Engineering and Safety, Magdeburg-Stendal University of Applied Sciences, Breitscheidstrasse. 2, D-39114 Magdeburg, Germany
3
Helmholtz-Zentrum Dresden-Rossendorf e.V., Institut für Ressourcenökologie, Forschungsstelle Leipzig, Permoserstrasse 15, D-04318 Leipzig, Germany
*
Author to whom correspondence should be addressed.
Water 2020, 12(9), 2509; https://doi.org/10.3390/w12092509
Submission received: 13 July 2020 / Revised: 20 August 2020 / Accepted: 3 September 2020 / Published: 9 September 2020
(This article belongs to the Special Issue Water Quality Engineering and Wastewater Treatment)

Abstract

:
Wastewater treatment is one of the main end-of-life scenarios, as well as a possible reentry point into the environment, for anthropogenic nanoparticles (NP). These can be released from consumer products such as sunscreen or antibacterial clothing, from health-related applications or from manufacturing processes such as the use of polishing materials (nCeO2) or paints (nTiO2). The use of NP has dramatically increased over recent years and initial studies have examined the possibility of toxic or environmentally hazardous effects of these particles, as well as their behavior when released. This study focuses on the fate of nTiO2 and nCeO2 during the wastewater treatment process using lab scale wastewater treatment systems to simulate the NP mass flow in the wastewater treatment process. The feasibility of single particle mass spectroscopy (sp-ICP-MS) was tested to determine the NP load. The results show that nTiO2 and nCeO2 are adsorbed to at least 90 percent of the sludge. Furthermore, the results indicate that there are processes during the passage of the treatment system that lead to a modification of the NP shape in the effluent, as NP are observed to be partially smaller in effluent than in the added solution. This observation was made particularly for nCeO2 and might be due to dissolution processes or sedimentation of larger particles during the passage of the treatment system.

1. Introduction

Recent global challenges, such as climate change adaptation and the transition to green energy, can only be overcome using innovative new technologies such as nanotechnology. At the same time, research on risks of these new materials for humans and the environment must be promoted. The advancing development of synthetic nanoparticles (NP) continuously produces new types of materials. NP are materials in which 50 percent or more of the particles have one or more dimensions between 1 nm and 100 nm, often exhibiting vastly different properties than bulk materials. These NPs can be divided into various groups according to their origin and respective properties. For example, there are carbon NPs (fullerenes, carbon nanotubes), metal NPs (Ag, Au), metal oxide NPs (TiO2, CeO2), and polymeric NPs [1]. Because of their special antibacterial, photocatalytic, mechanical, electronic and biological properties, NPs made of silver (nAg), titanium dioxide (nTiO2), zinc oxide (nZnO) and cerium oxide (nCeO2) are used as substantial components of personal care products, pharmaceuticals, paints, electronic devices, energy storage, coatings and new environmental engineering technologies [2,3,4]. The widespread use of such NPs leads to their inevitable arrival in domestic sewage treatment plants [5]. It is predicted that wastewater treatment (WWT) serves as an important sink for NPs released from consumer products. Therefore, wastewater treatment plants (WWTPs) are key factors controlling entry paths of NPs into the environment and the food chain. The distribution of NPs between the WWTP effluents, sludge and cleared water, determines the NP mass flow and thus controls the expected dose to the environment and humans. The need for the investigation of NP behavior and properties in sewage sludge lead to various research efforts on the topic. For example, Brar et al. [6] investigated NP behavior in different WWTP process stages and ultimately also in sewage sludge, but at the same time, found that no methodological studies were carried out to determine the NP presence and removal during various WWT processes or their presence in wastewater at all. Furthermore, DiSalvo et al. [7] addressed the knowledge gap on NP behavior in the sewer network and in wastewater treatment. Brar et al. [6] and Yamaguchi [8] gave a general overview of the origin of various NP types and their source products. More recent studies went beyond just looking at the source products and were related to the NM life cycle [5]. Some authors go further and, in addition to the manufacturing mechanism, consider the regeneration and reusability of NM in wastewater treatment [9,10] to exploit their positive effects during treatment [11,12]. However, other authors also describe cumulative and/or combination effects of NP in the wastewater-sewage sludge pathway [13]. The impairment of COD and ammonium degradation by stabilized silver NP in sewage treatment plants was investigated by Hou et al. [14] and Jarvie et al. [15], for example, with silicon NP in waste water. Kim et al. [16,17] and Gartiser et al. [18] considered nTiO2. Limbach et al. [19] and Yang et al. [20] dealt with the degradation of oxidic NP in model sewage treatment plants. Oleszczuk et al. [21] focused on the effects of applied sewage sludge on different types of plants. Soils and sediments act as a NM sink in the environment [22,23], whereby an essential NM entry path consists of the agricultural use of sewage sludge [18,24,25,26,27,28]. Fundamental for the understanding of the interaction of NM are reactivity and bioavailability [29,30,31,32,33,34]. Various experimental approaches attempt to determine key parameters such as surface charge, degradation, geochemical milieu, interaction with natural colloids, parameters influencing hydrodynamic conditions (e.g., pore size, roughness, flow velocity), and to derive statements on mobility and bioavailability [23,35,36,37,38,39,40,41,42,43,44,45].
Besides the emerging risks of NPs released through WWTP effluents, the effects of NPs on the WWT itself are reason for concern. Most municipal WWTPs depend on an activated sludge process that degrades waste water components with the help of microorganisms [46]. Activated sludge contains microbial eukaryotes, including protozoa, fungi and metazoans, and various types of bacteria that are responsible for metabolic functions, e.g., the oxidation of organic compounds, the removal of nitrogenous pollutants and phosphates. Several authors refer to toxic effects of different NPs on different microorganisms which may pose potential environmental hazards and effect the effectiveness of WWT. It was shown that Ag-NPs penetrate the membrane wall of Escherichia coli and other gram-negative bacteria. In addition, growth experiments with nitrifying bacteria showed a strong inhibition caused by Ag-NPs [47,48,49]. NPs show toxicity to many species, including bacteria, algae, invertebrates and vertebrates [22,50,51,52,53,54,55]. While studies have shown that NPs are toxic to single species, the complexity of an activated sludge community might not respond to NPs in the same way as single species systems. Therefore, little is known about the impact of NPs on complex microbial communities that are effective in degrading waste in the activated sludge, or if microorganisms are able to remove them [56]. A sudden increase in the NP concentration in the feed water (shock load) poses a toxicity risk even for the beneficial microorganisms contained in the sludge, and it might take months to recover the performance of the treatment plant [56,57]. Furthermore, the availability of the organic substances to microorganisms can decrease due to competitive adsorption, and thus organic substances might remain untreated by the microorganisms [58,59]. This might lead to a reduced treatment efficiency of the sewage treatment plant, which consequently poses the risk of potentially pathogenic microbes remaining in the treated water.
The ecological risks that are expected with increasing NP use cannot yet be adequately assessed in many areas [60,61]. Although previous research shows that initial fears that NM are an inherent risk to humans and the environment have not been confirmed, long-term, low-dose and interaction effects have not yet been adequately investigated. The low expected environmental NP concentrations ranging from ng/L to µg/L (water) or µg/kg (soils) [26] make the investigation of the consequences of an environmental impact considerably more difficult, because of the challenge of sensitive detection. Furthermore, the complexity of the matrices involved leads to a considerable experimental effort [62], leading, for example, to a considerable uncertainty regarding NP behavior in soils, although soil is one of the main sinks for released NP [63]. A resulting trend towards studies with high concentrations and a lack of characterization can actually lead to a significant reduction in the informative value of this work up to the complete meaninglessness of the results [64]. The main entry path for the control of the entry of synthetic NM in soils is the waste water purification process, which is considered a preliminary NM sink, and at the same time represents their release into the environment via sewage sludge from sewage treatment plants [26]. While the water clarification process is the main entry path for such NM into the environment, the subsequent main exposure path for humans is the potential NP absorption introduced into the soil through their absorption in plants and thus their entry into the food chain [60]. So far, there is no country yet that has comprehensive legislation to deal with NM, particularly in wastewater treatment processes.
Here, we report on our studies concerning the fate nTiO2 and nCeO2, both widely used in consumer products, in WWT. In light of the studies referenced above, the main goal was to investigate the influence of the NP on the effectiveness of the WWT process, to gain valuable information on the distribution of the NP between the WWTP effluents, and to establish single-particle mass spectroscopy (ICP-MS) [65] as a measurement modality to gain a detailed insight in the fate of the NP. Only few studies exist that applied sp-ICP-MS as determination approach for NP in water or wastewater treatment samples, particularly for nCeO2 [66], nTiO2 [67,68], and nAg NP, that are indicators for medical NP residues in wastewater samples [67,68,69,70]. Thus, the scope of the present study was to further investigate the feasibility of the sp-ICP-MS for the determination of nCe and nTi in wastewater, and to suggest recommendations for the monitoring of municipal wastewater samples.

2. Materials and Methods

2.1. NM Measuring Technique

Conventional ICP-MS can be used to determine element concentrations with very high sensitivity. In general, samples are digested and transformed into a homogenous solution. This solution is injected into an inductively coupled plasma that ionizes the dissolved species which are then analyzed by the mass spectrometry. The uniform distribution of ions in the analyzed solution results in a constant MS signal, which is recorded at specified intervals (“dwell times”) at a specified frequency. In contrast to that, in sp-ICP-MS, the solution is diluted to such a degree and the dwell time of the measurements is reduced, such that only a single particle is measured at each step. NP enter the MS individually as a cluster of ions from the plasma. This results in a time-resolved accumulation of detected ions giving rise to peaks, which provide information about the concentration (peak frequency), size (peak height) and the type of nanoparticles (mass-charge ratio). Ions which originated from non-NP-species still reach the detector when these transient signals are recorded and contribute to the background signal. The height of this element characteristic background signal has a significant influence on the detection limit for the nanoparticles. The relevant factor for detecting single particles is the speed: for sp-ICP-MS analysis, continuous data acquisition at a dwell time is substantially smaller than for conventional ICP-MC, and the fundamental instrumental requirement for NP counting and sizing. For the NP measurements in the present investigation, we used an Elan DRCII ICP-MS (PerkinElmer, Waltham, MA, USA). The assessment of the ICP-MS results was done through the Single Particle Calculation tool (SPC) that was developed by the Food Safety Research group from Wageningen, The Netherlands [71,72].

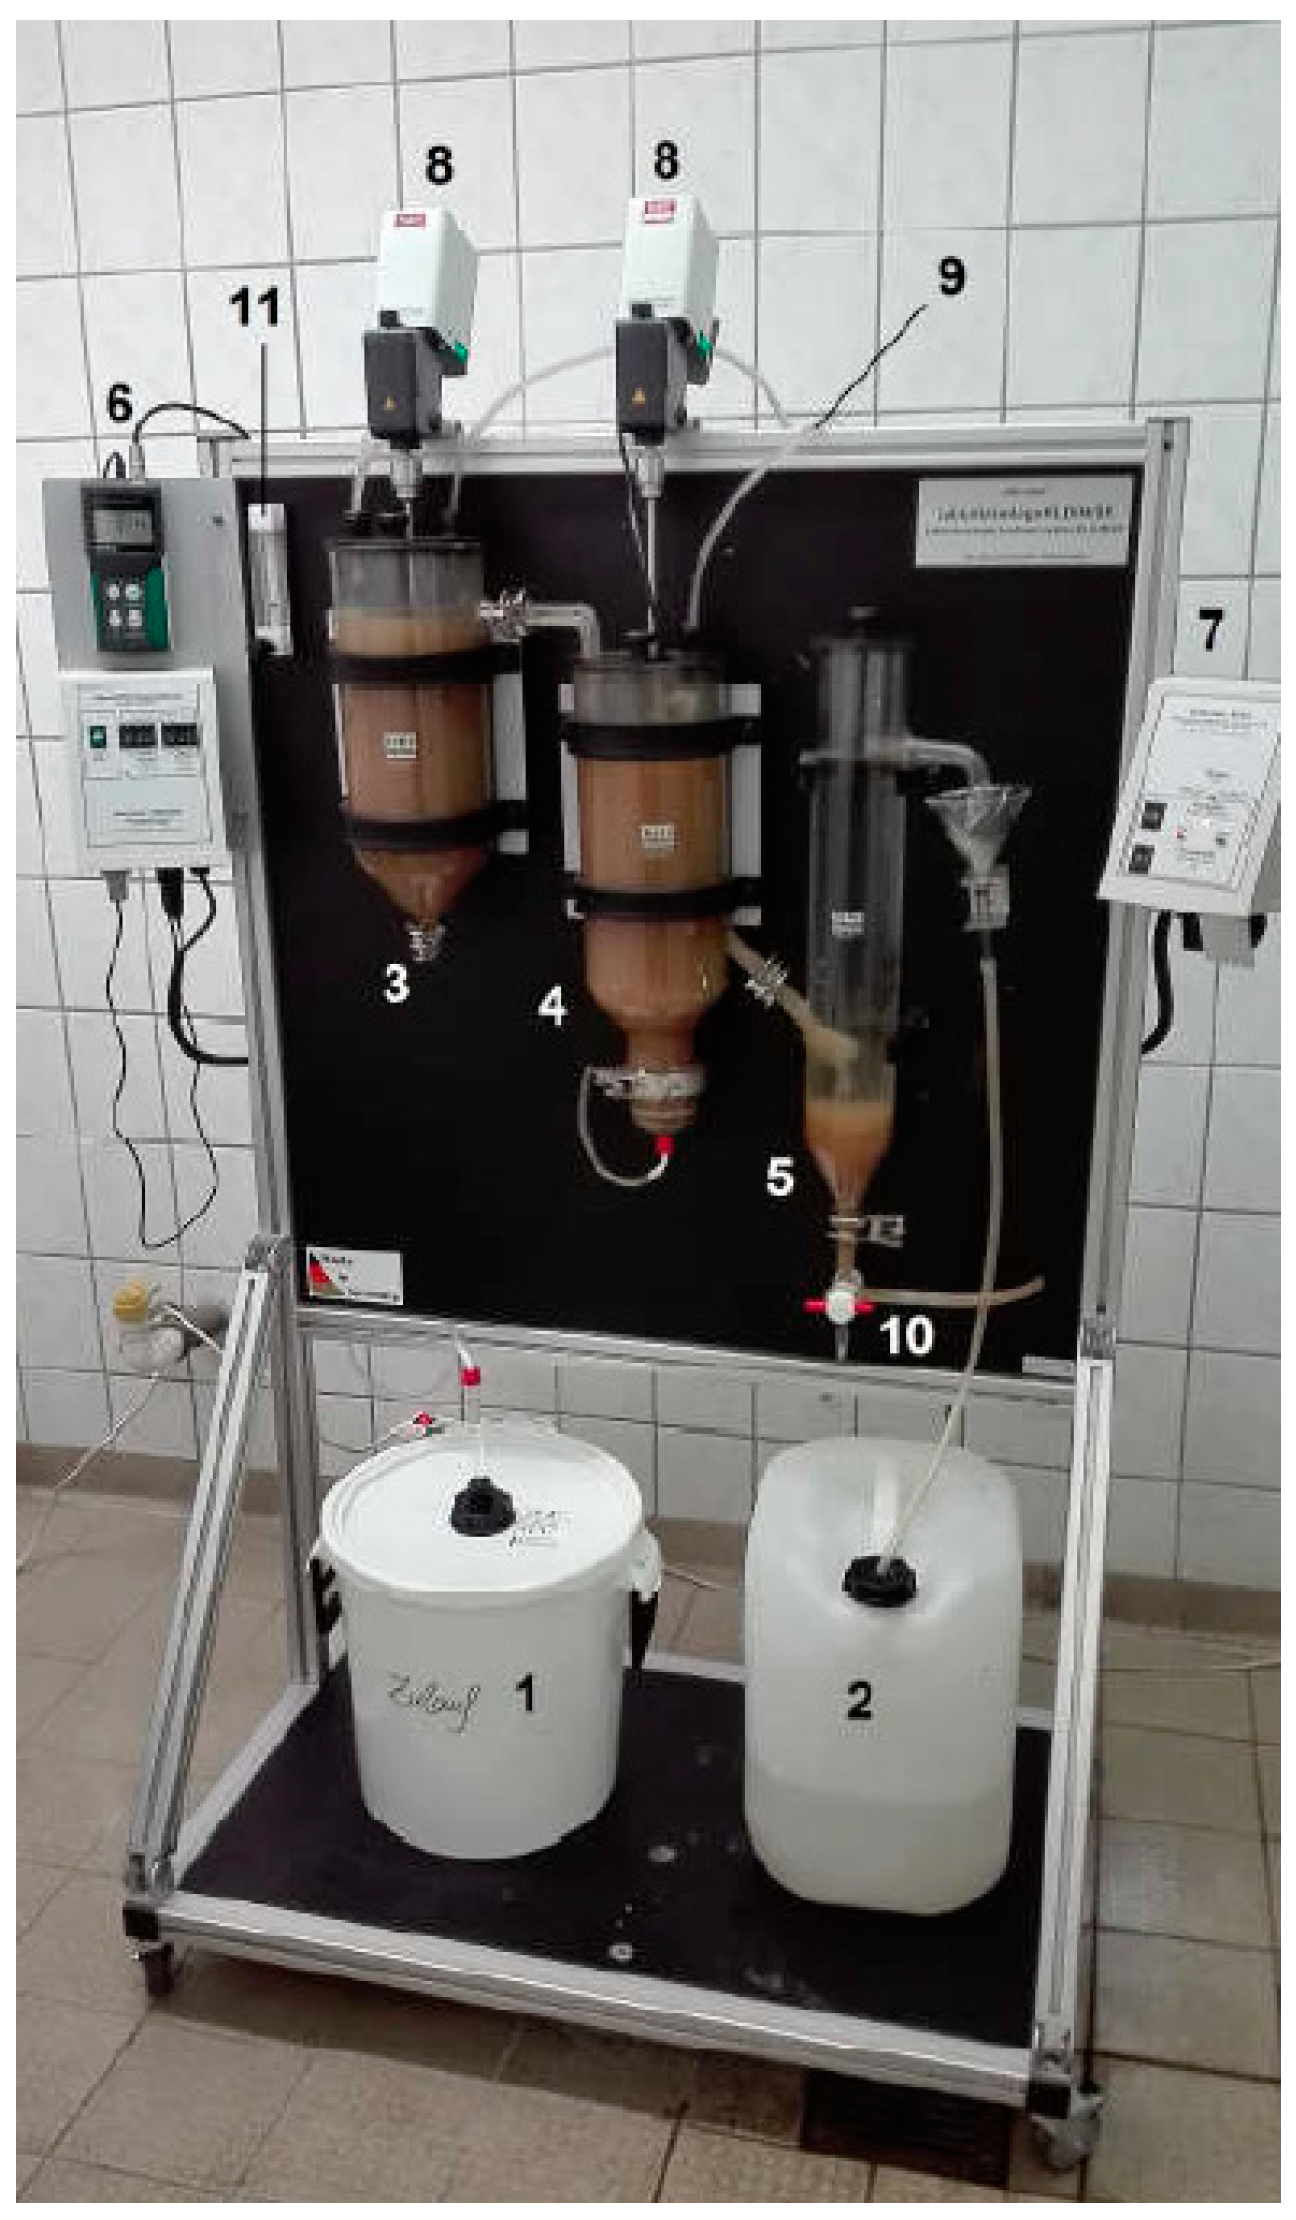
2.2. Experimental Setup

The investigation workflow is illustrated in Figure 1. Two behrotest® KLD4N/SR (behr Labor-Technik GmbH, Düsseldorf, Germany) two-stage lab-scale wastewater treatment systems (three tanks: denitrification, activation and post-treatment, see Figure 2) were operated according to OECD TG 312 [23]. Both were inoculated with activated sludge from a municipal sewage treatment plant in Chemnitz-Heinersdorf (Chemnitz, Germany) and fed with standardized, synthetic wastewater. Synthetic wastewater was generated according to OECD Test 303A. The system has a total volume of 10.5 L. The operating parameters were set to hydraulic retention time between 4 to 5 h and a sludge age of around 12 days. The oxygen content in the aeration tank was controlled in real time between 1.5 and 2.0 mg/L. The feed was pumped from the feed tank (1) into the denitrification vessel (3) by a peristaltic pump. From there, the sludge reached the activation tank (2) via an overflow, which was aerated by an air pump and a frit at the bottom of the tank (4). The activated sludge reached the clarifier via a settling pipe (5). The sludge recirculation pumped the sludge back into the denitrification vessel. Clarified water flowed into the drain tank via an overflow. Fresh sludge from the Chemnitz sewage treatment plant was used for each inoculation, and background concentrations of the relevant elements, and the media used (activated sludge, wastewater, cleared water) were determined. The mass-charge ratio m/z = 48 was used for titanium dioxide and m/z = 139 for cerium dioxide.
The monitoring of the performance included the daily measurement of the pH value in the aeration tank and the acid capacity in the secondary clarifier. With each change of feed, the parameters electrical conductivity, pH, carbon, nitrogen and phosphorus content in the inlet and outlet were determined. The dry matter content in the aeration and secondary clarification was monitored every working day. Two NP experiments were carried out with different concentrations using a single NP addition and one experiment using continuous particle addition, was performed. Cerium dioxide was added at 3 mg or 380 µg once and 3.95 µg/day continuously. Titanium dioxide was added at 50 mg or 63 mg once and 1 mg/day continuously. The sludge and drainage samples were taken on a weekly basis, digested using acid-assisted microwaves, and then measured using ICP-MS on the m/z 48 for titanium and 139 for cerium. The measurement results were converted into daily loads and summed up. In addition, selected run-off samples were analyzed without digestion using sp-ICP-MS to compare the particle size and number with the initial suspension.

2.3. Operational Setting of the Lab-Scale Wastewater Treatment System

To establish the optimal operational setting and to enhance the treatment efficiency of the lab-scale wastewater treatment system, the first test runs were performed using the wastewater of the Chemnitz-Heinersdorf municipal WWTP. Chemnitz has approx. 246,000 inhabitants. The sewage treatment plant has a total size of 400,000 population equivalents. The daily wastewater volume averages 71,400 m3/day. The canal system has a length of around 1000 km; more than 600 km are mixed wastewater and rain water, more than 190 km are wastewater and approximately 160 km are rainwater. The connection to the sewage treatment plant is 96.6 percent. Beside residential areas, commercial centers are also connected to the treatment plant. The plant is operated as anaerobic sludge stabilization and the biological cleaning as denitrification with subsequent nitrification. The inlet to the sewage treatment plant is characterized by an average COD content of around 398 mg/L, an average BOD5 of 196 mg/L, and a total Kjeldahl nitrogen of 38 mg/L. In the outlet, there is an average of only 21 mg/L COD. Fresh sludge from the Chemnitz sewage treatment plant was used for the inoculation of the lab-scale wastewater treatment system. On the 9th (system 1) and 3rd trial day (system 2), the performance of both recirculation pumps was increased to 100 percent, in order to improve the denitrification performance and thus raise the pH in the activation vessel. The final operating settings and sludge retention times are shown in Table 1.
The return pumps (7) were operated in batch mode (8 min on, 32 min off). This setting was made together with the increase in performance of the pumps (previously 8 min on, 22 min off). Less sludge with a low pH should be pumped back in order to prevent a further drop in the pH in the aeration. A sludge age of 12 days was targeted for both systems. For this purpose, excess sludge was removed daily via the return pump. In both systems, an oxygen content of approx. 1.5–2 mg/L was set up in the aeration tank. The lower limit of the automatic oxygen control (6) was set to 1.3 mg/L, the upper limit to 1.4 mg/L. The diaphragm pump flow rate was set to approx. 20 L/h (11). The performance of the stirrer motors (8) was reduced to 10 percent in the denitrification and in the activation vessel. With this setting, the targeted carbon removal rate on average of minimum 90 percent for dissolved organic carbon (DOC) and total organic carbon (TOC) was achieved in both lab-scale wastewater treatment systems. The obtained optimized operational setting was used for the further operation of the lab-scale wastewater treatment system with synthetic wastewater, based on the OECD guideline 303.

2.4. Input: Synthetic Wastewater

Synthetic wastewater based on the OECD guideline 303 served as the inlet into the lab-scale systems. Moreover, 8 g peptone from casein, 5.5 g meat extract, 1.5 g urea, 1.4 g dipotassium hydrogen phosphate, 0.35 g sodium chloride, 2 g CaCl2·2 H2O and 0.1 g MgSO4·7 H2O were used. The components were dissolved in 1 L of ultrapure water (≥18.2 MΩ/cm, Evoqua Water Technologies). This concentrate was divided into two fillings, since 500 mL of concentrate were diluted with 25 L of deionized water in the feed tank. 10 mL of methanol were added to each replenishment. The feed tank was emptied, cleaned and refilled after two days. The dry matter was determined daily from activated sludge and excess sludge from day 1. The sample of the old feed (rest of the two-day-old feed) and the sample of the new feed were withdrawn via the feed hose. The drain sample was withdrawn using a pipette on the water surface of the secondary clarifier. Furthermore, the pH value in the aeration tank was determined every day according to DIN EN 38404-5:2009-07, and the acid capacity in the drain according to DIN 38409-7:2005-12. 50 mL of sample were used to measure the acid capacity. With each change of inlet, the parameters pH value, TOC/DOC/TNb according to DIN EN 1484:1997-08 and total phosphorus according to DIN EN ISO 6878:2004-09 were determined for the inlet and outlet. These series of measurements started with the first change of inflow on the second day.

2.5. NM Investigation Methodology

Endurance tests were then carried out with nTiO2 and nCeO2 from ready-to-use suspensions (US Research Nanoparticles Inc., Houston, TX, USA, each 30–50 nm). Two types of particle addition were used:
Single NP addition: To determine the blank value levels, the inoculum was sampled twice and the system (sludge and drain) 7 times in 4 days and averaged. On the fifth day after test start, 62.7 mg of titanium dioxide (anatase, 15 wt%, particle size 30 to 50 nm; US Research Nanomaterials Inc., Houston, TX, USA) and 380 μg of the cerium dioxide NP (NM-212, particle size 28.4 ± 10.4 nm, Joint Research Center, Institute for Health and Consumer Protection, Ispra, Italy) were added as a pure water suspension in the denitrification basin. The suspensions were ultrasonicated with ice cooling for 30 min and shaken vigorously before the addition in order to destroy agglomerates.
Continuous NP addition: To determine the blank value level, the inoculum was sampled twice and the system (sludge and drain) 11 times in 10 days. From day 13 after commissioning the system, approx. 1 mg/day nTiO2 was added to the denitrification basin as a pure water suspension. This was achieved by adding approximately 1.9 mg of nTiO2 suspension to each new feed. The suspension was ultrasonicated with ice cooling before the addition, in order to destroy agglomerates. A sample of the stock solution was taken once a week immediately after the addition to check the concentration. At the same time, two solutions for two future inlets were taken.

2.6. Sampling and Analysis

To determine the titanium load in the sludge, 10 mL of excess sludge was removed every week via return pump. The sludge was dried in a ceramic dish at 105 °C and then acidified with 5 mL of nitric acid (67 percent, suprapur; Merck KGaA, Darmstadt, Germany). This solution was transferred to a microwave vessel and mixed with 5 mL of nitric acid and 2 mL of hydrochloric acid. For sampling, 50 mL of sample were removed from the water surface of the secondary clarifier every week. From the digestion, 10 mL of sample with 3 mL of nitric acid and 2 mL of hydrogen peroxide (30 percent, e.g., Merck KGaA) were subjected to a microwave treatment. The isotope Titan 48 (47.948 amu) was examined. Rhodium (10 μg/L; 102.905 amu) was used as the internal standard. The device settings of the Elan DRC II (PerkinElmer) used can be found in Table 2.
Data evaluation: the measured values were converted into a solid concentration through the dry substance weight. The activated sludge mass was calculated using the dry substance and the total volume of the activated sludge and denitrification vessel. The secondary clarifier sludge mass was calculated using the dry matter of the excess sludge and the sludge volume of the secondary clarifier. The titanium load was calculated using those figures and the solids concentration. The accumulated masses of NP in aeration, recirculation, clarifier and sludge return resulted in the daily NP load (mg).

3. Results

3.1. Operational Monitoring of the Lab-Scale Sewage Treatment Systems

The structure of the sludge changed from coarse-flaky dark brown to fine-flaky ocher in the course of the experiments. As this change was observed with every system run, it can be assumed that the sludge adapted to the changed composition of the standardized wastewater. Organic carbon degradation was always higher than 90 percent. The removal of nitrogen fluctuated in the range of 40 to 80 percent. Since the experimental set-up did not contain phosphorous removal processes, phosphorus degradation was only possible biochemically.

3.2. Discharge Loads of Titanium NP-Spike Particle Addition

The series of measurements of the singe particle addition of nTiO2 began five days after the system was commissioned. The mean blank level before addition was 635.8 mg/kg in the sludge and 36.6 μg/L in the aqueous phase. The blank value of the deionized water was 0.6 μg/L. The experiment was terminated after 37 days because the titanium concentration in the excess sludge fell below the blank value level (618.0 mg/kg). In Figure 3, the titanium loads are plotted against the test days. The first vertical line marks the day of the NP addition; the second vertical line marks the day of the undershoot. Until the NP addition, the titanium load in the sludge steadily dropped to 12.9 mg, while the load in the aqueous phase remained almost constant. After the particle addition, the load in the excess sludge increased to a maximum of 71.6 mg on the 7th day of the experiment. An increase in the titanium load in the aqueous phase was also observed, but a maximum of 4.5 mg was reached on the 6th day of the experiment. In the following test days, the titanium load in the excess sludge fell continuously until day 14 and then fluctuated between 40.5 mg and 17.9 mg by the 28th test day. Until the test end, the values decreased continuously to 6.8 mg. After the maximum load in the aqueous phase, the values decreased to 0.4 mg by the 19th day of the experiment, and fluctuated between 0.2 mg and 1.3 mg by the last day of the experiment. The titanium load in the aqueous phase was almost constant. From the first to the 33rd day of the trial, 74.0 mg of titanium left the system via excess sludge and drainage. As expected, the load in the sludge and in the aqueous phase reached its maximum after the addition. The load in the sludge sank as the trial days progressed, as titanium was removed from the system by removing excess sludge. The load in the aqueous phase decreased faster when the water retention time was shorter than that of the sludge. This load consequently left the system faster. The small fluctuations in the aqueous phase are due to an almost homogeneous particle distribution in the water. The NPs are not homogeneously distributed in the sludge.
Compared to Gartiser et al. [18] with R2 = 0.84, there was a lower correlation of R2 = 0.68. The adsorption was determined with 90 percent in the sludge and 9 to 10 percent in the aqueous phase, compared to 95 percent in the sludge and 3 to 4 percent in the aqueous phase in Gartiser et al. [18]. The reason for the lower correlation were the different test procedures. Gartiser et al. [18] metered constant titanium dioxide into the system (similar to system 2), and the loads increased in the course of the experiment. With the single particle addition, the loads decreased steadily due to washing, which brought the sludge load closer to the water load. Calculating the adsorption ratio from the absolute mass gave a ratio of 96 percent in the sludge and 4 percent in the aqueous phase. In principle, this experiment confirms the fractionation processes observed in the literature.

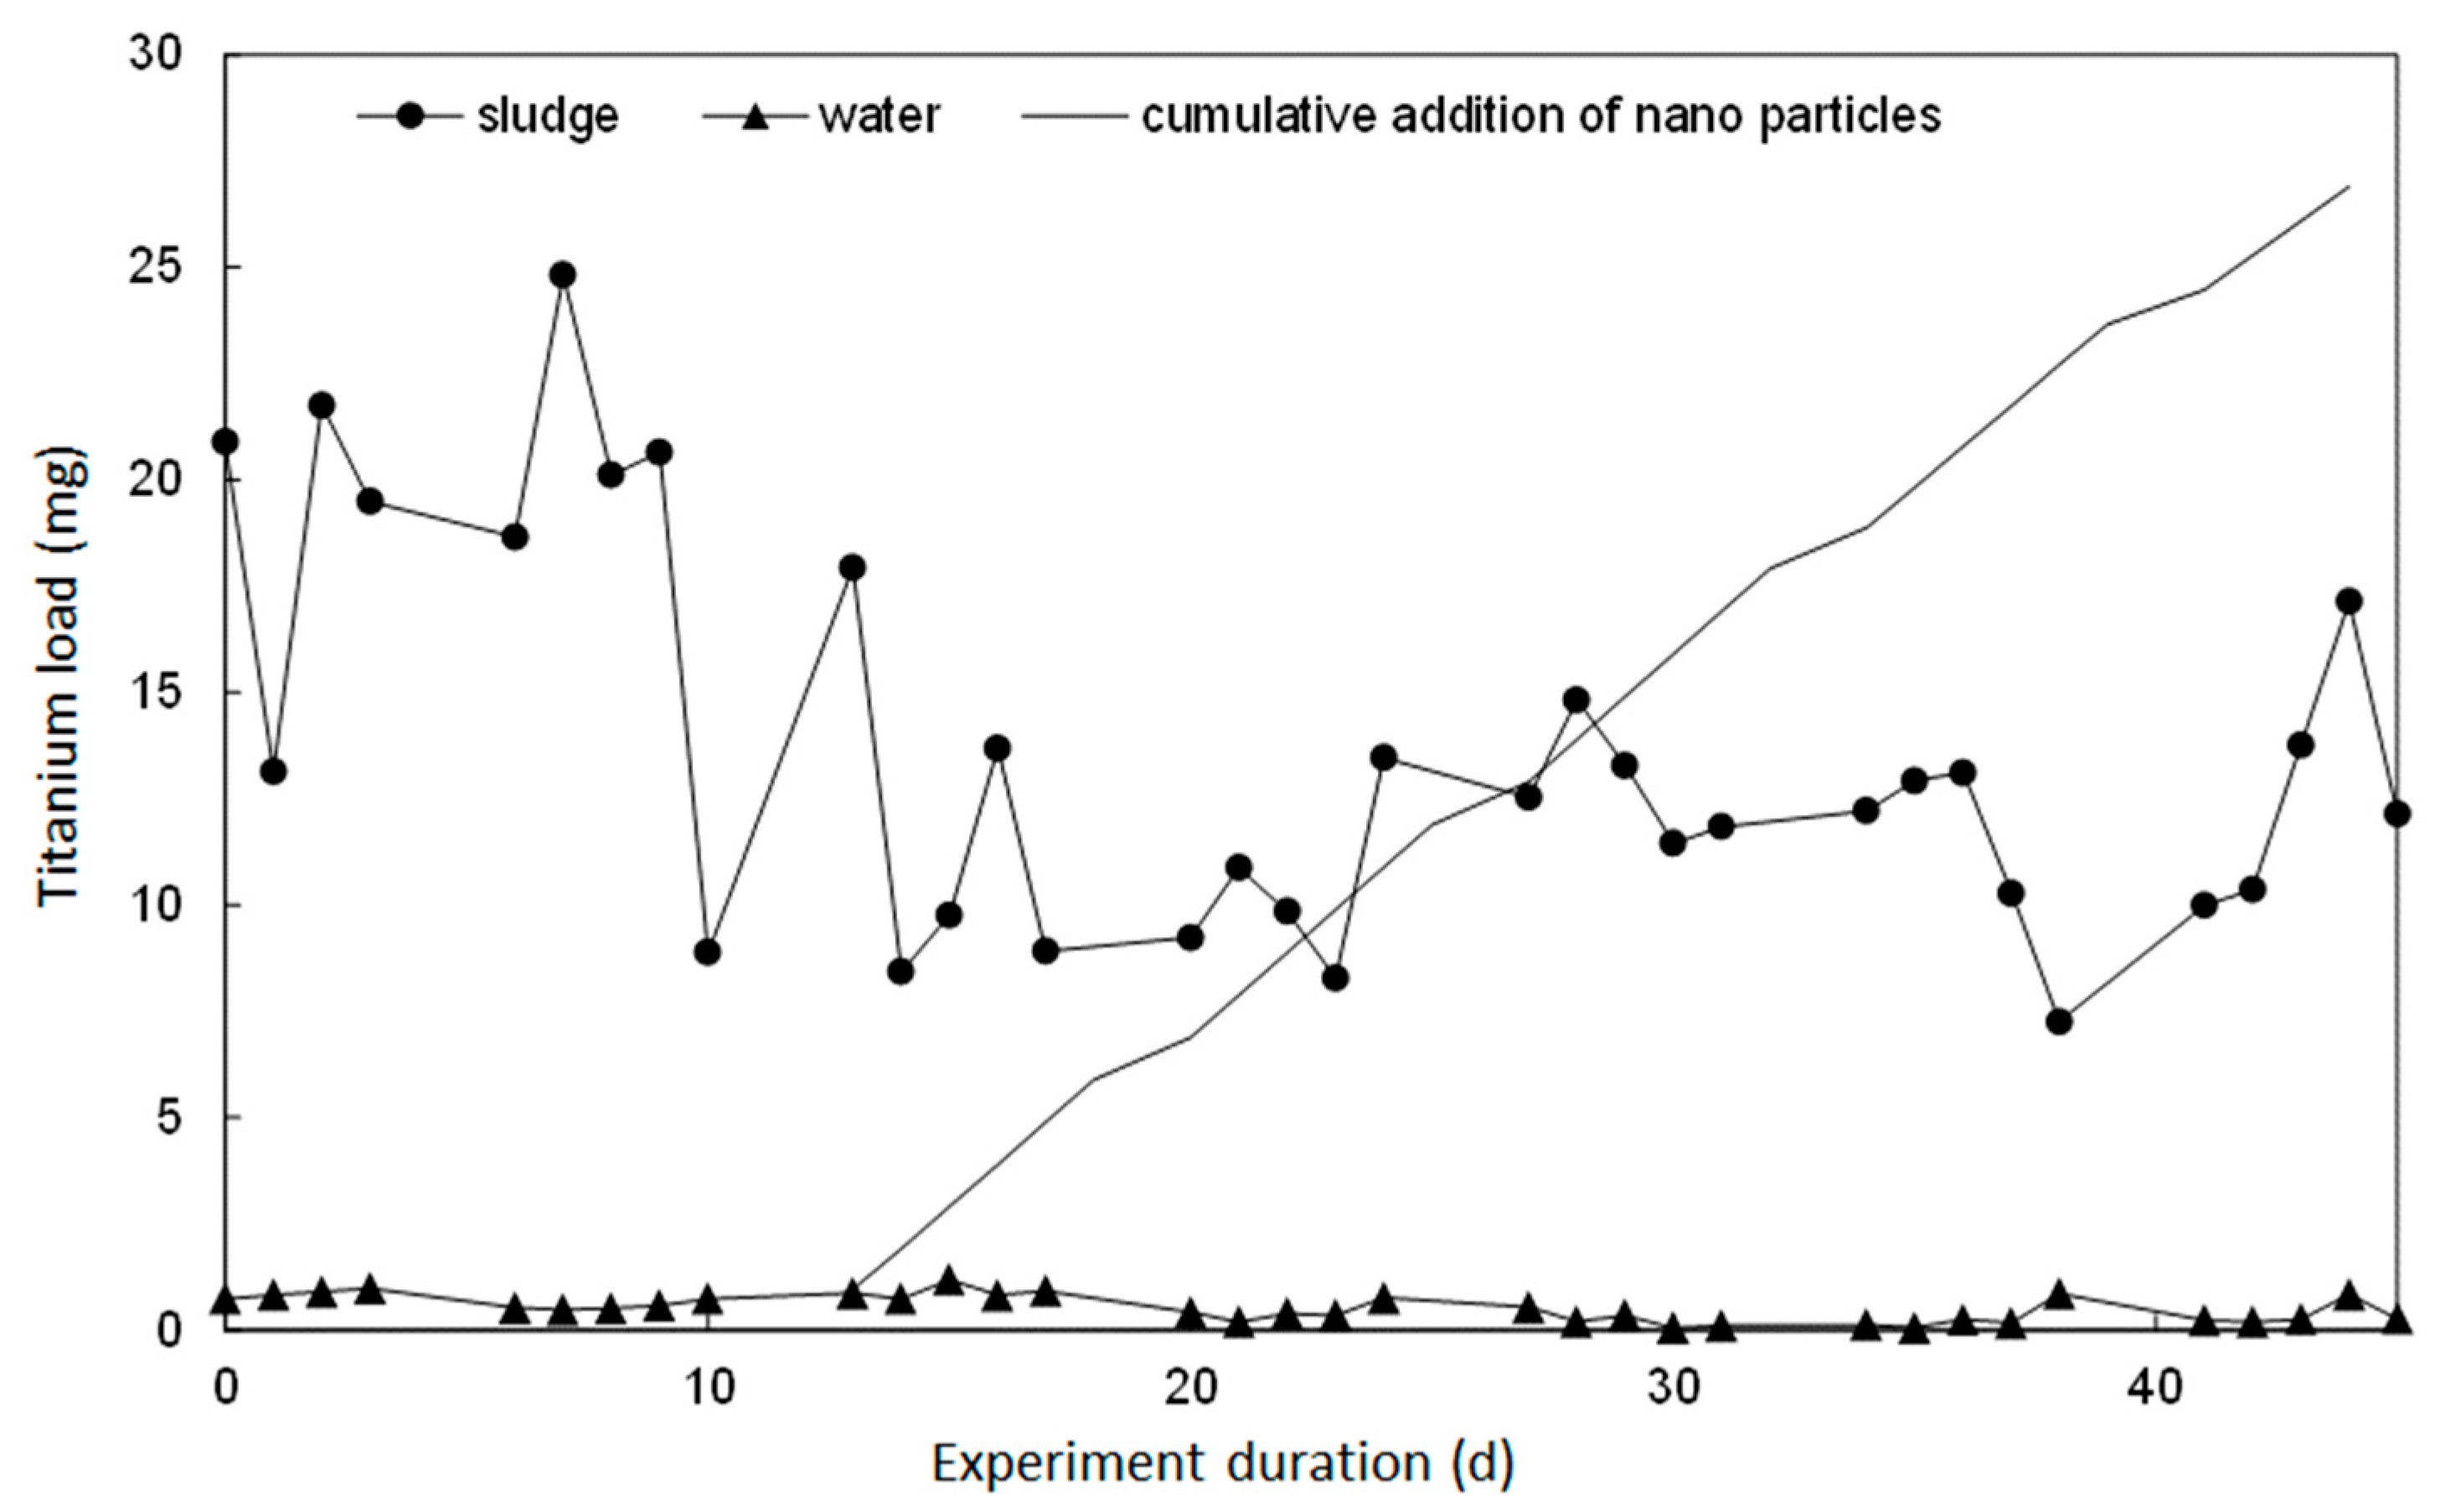
3.3. Discharge Loads of Titanium NP-Continuous Particle Addition

The titanium load in the excess sludge and in the aqueous phase are shown in Figure 4, as well as the cumulative NP addition. The vertical line marks the beginning of the continuous NP addition. Before the particle addition, the sludge loads fluctuated between 8.9 mg and 24.8 mg (σ = 5.9 mg), while the loads in the aqueous phase remained almost constant. After the addition, there were minor fluctuations in the sludge, from 7.3 mg to 17.1 mg (σ = 2.4 mg). The constancy in the aqueous phase remained. Up to the last day of the test, approximately 26 mg of nTiO2 was added to the system.

3.4. nTiO2 Characteristics of Added NP Suspension and Effluent

Furthermore, we analyzed the nTiO2 scan of the added NP suspension and the effluent. The height of the peaks corresponds to the size of the particles and the frequency to the quantity. Even if a direct comparison is not possible due to different dilutions, it can be concluded that the particles are both smaller and fewer in the effluent. The background level of the ionic non-NP-species value is in the range from 0 to approx. 30,000 cps. Most of the individual peaks end in a range from 100,000 cps to 280,000 cps. Two peaks exceeded this range. This observation is an indication of processes during wastewater treatment that contribute to the partial or complete dissolution of the NP.

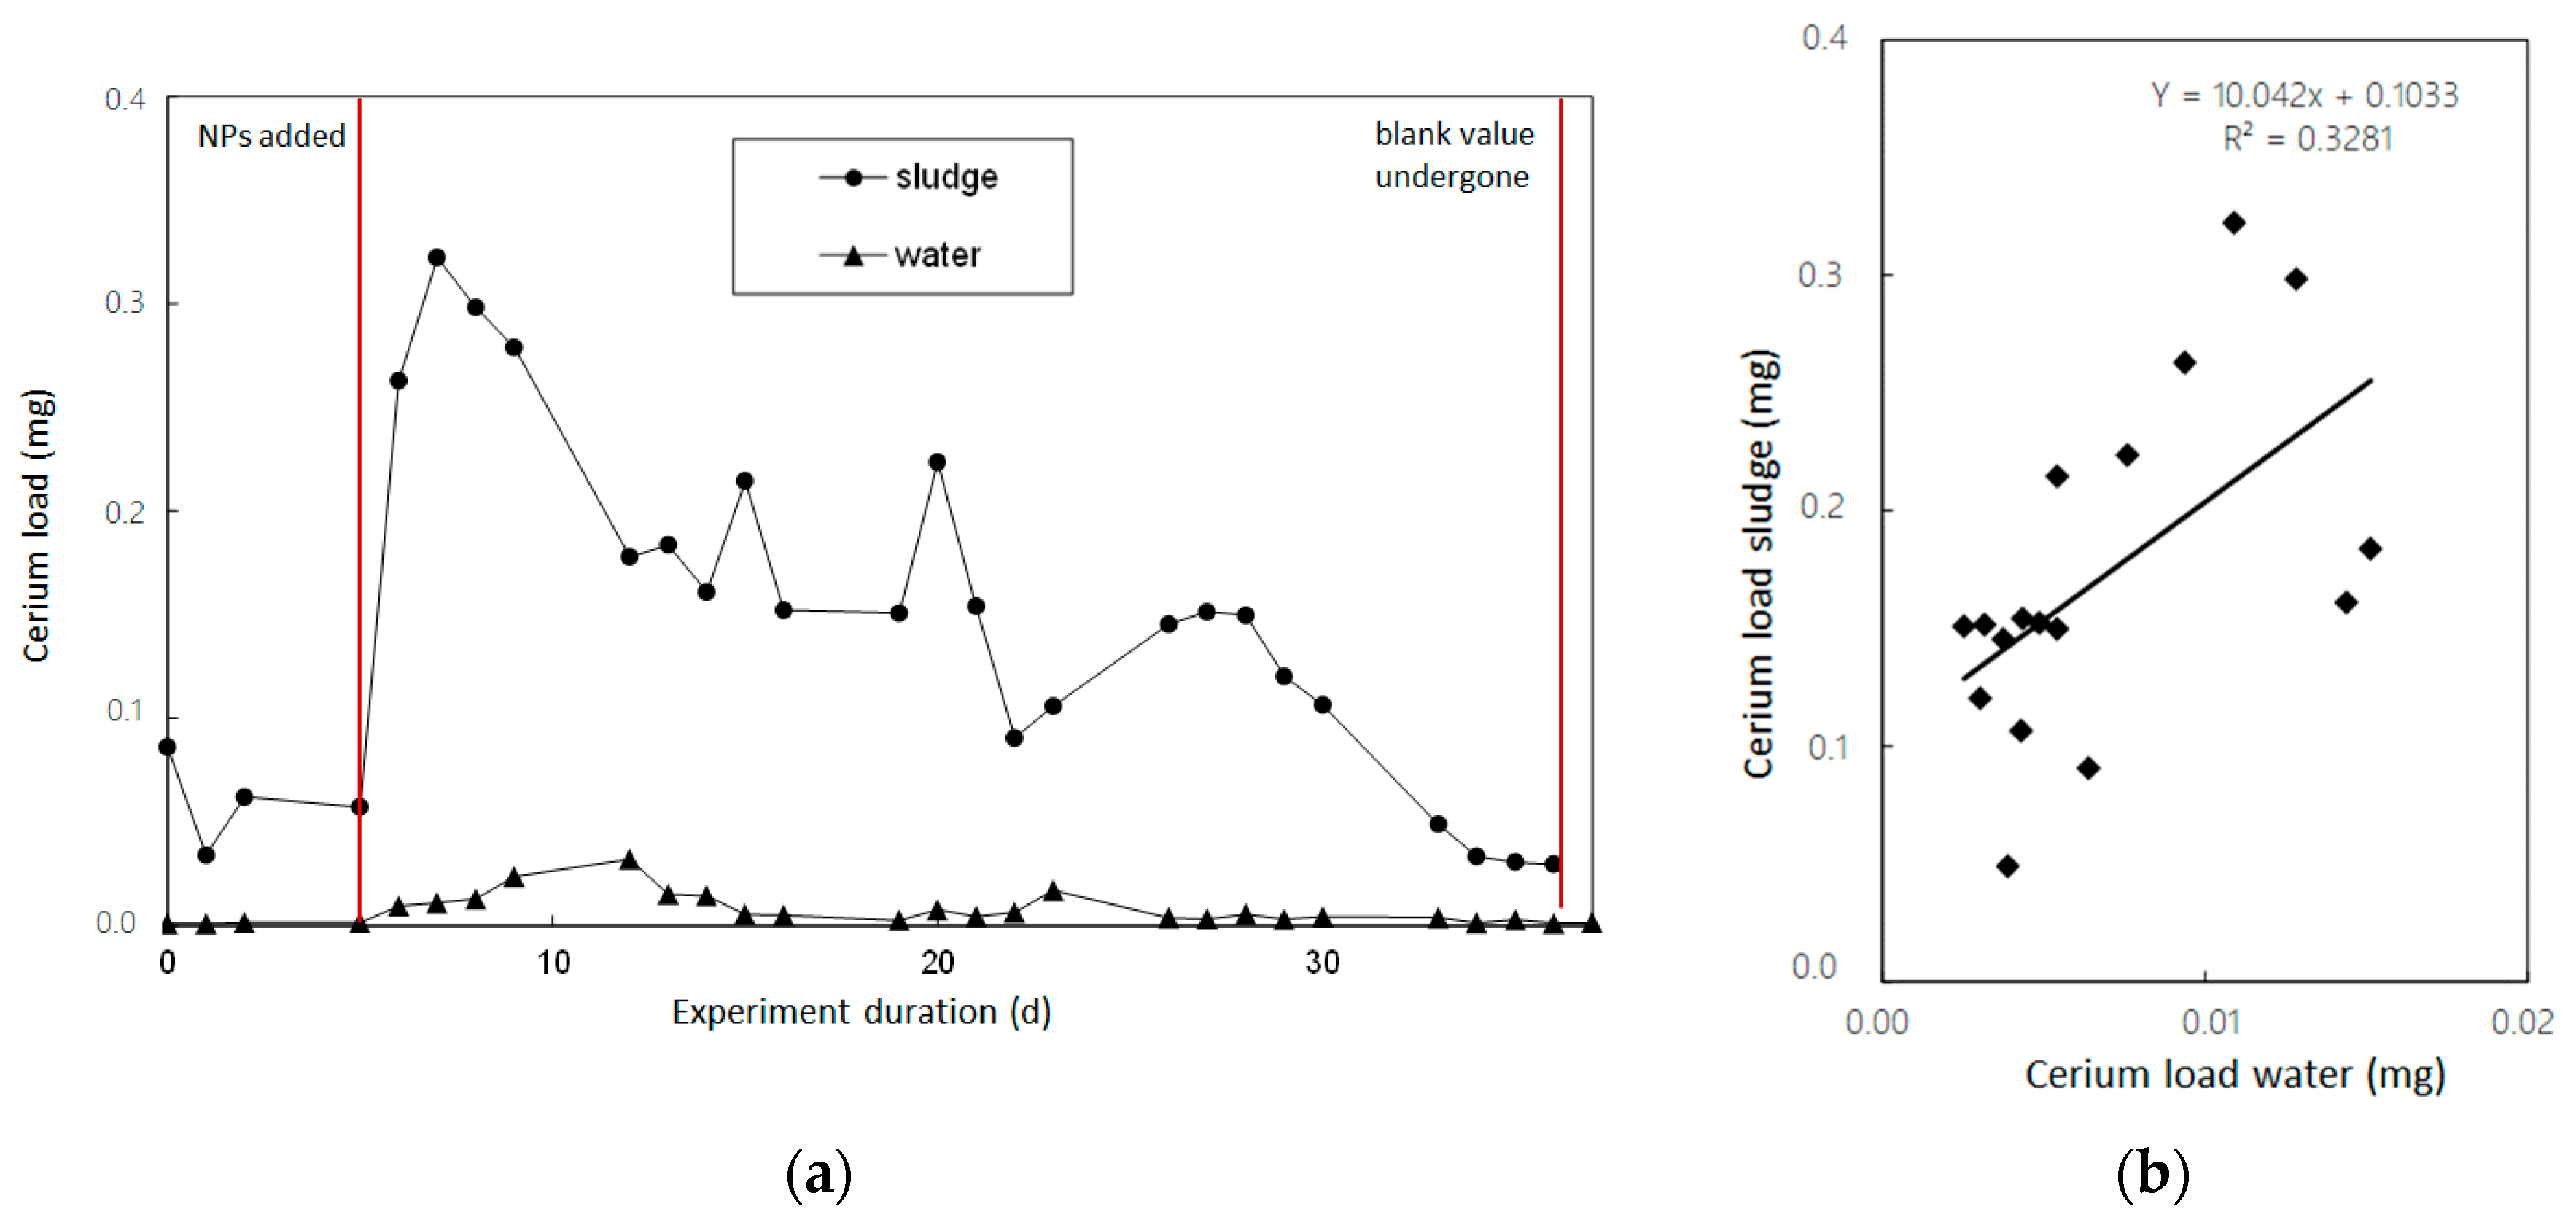
3.5. Discharge Loads of Cerium NP-Spike Particle Addition

Figure 5 shows the cerium load in the sludge and the outlet within the test period. The cerium load of sludge increases at the 5th day of the experiment. A short-term increase in cerium load to over 300 μg was found at day 6 and 7. The loads then fell until day 12. The loads fluctuated between 90 and 220 μg between day 13 and day 27. From trial day 28, the loads dropped continuously to a value of 30 μg. The discharge loads are approximately constant between 1 and 35 μg over the test period. All loads are well below 50 μg. The discharge loads were always lower than the mud loads. The concentration of the sludge blank value is 1.79 mg/kg; the blank value of the drain was 0.15 μg/L.
The maximum concentration was reached immediately after the NP addition, since at this point, all the particles were in the system and hardly any sludge has been removed. In the following test days, the nCeO2 load in the sludge decreased more and more. This was done by taking daily samples to determine the dry matter of the excess sludge and by withdrawing excess sludge to maintain the sludge age. The significant drop in sludge loads from test day 7 to 12 could be due to the fact that excess sludge was withdrawn on test days 7, 8 and 9. This relationship was also observed from day 20 to 22. The blank level was reached both in the sludge and in the effluent at day 34. It can be concluded that the cerium dioxide NP were removed from the system by daily sampling, the removal of excess sludge and by the water running off. As a result, it was found that 5 percent of the nCeO2 was in the effluent and thus 95 percent was accumulated in the sludge. When comparing the results with other studies carried out, it was found that similar results were achieved.

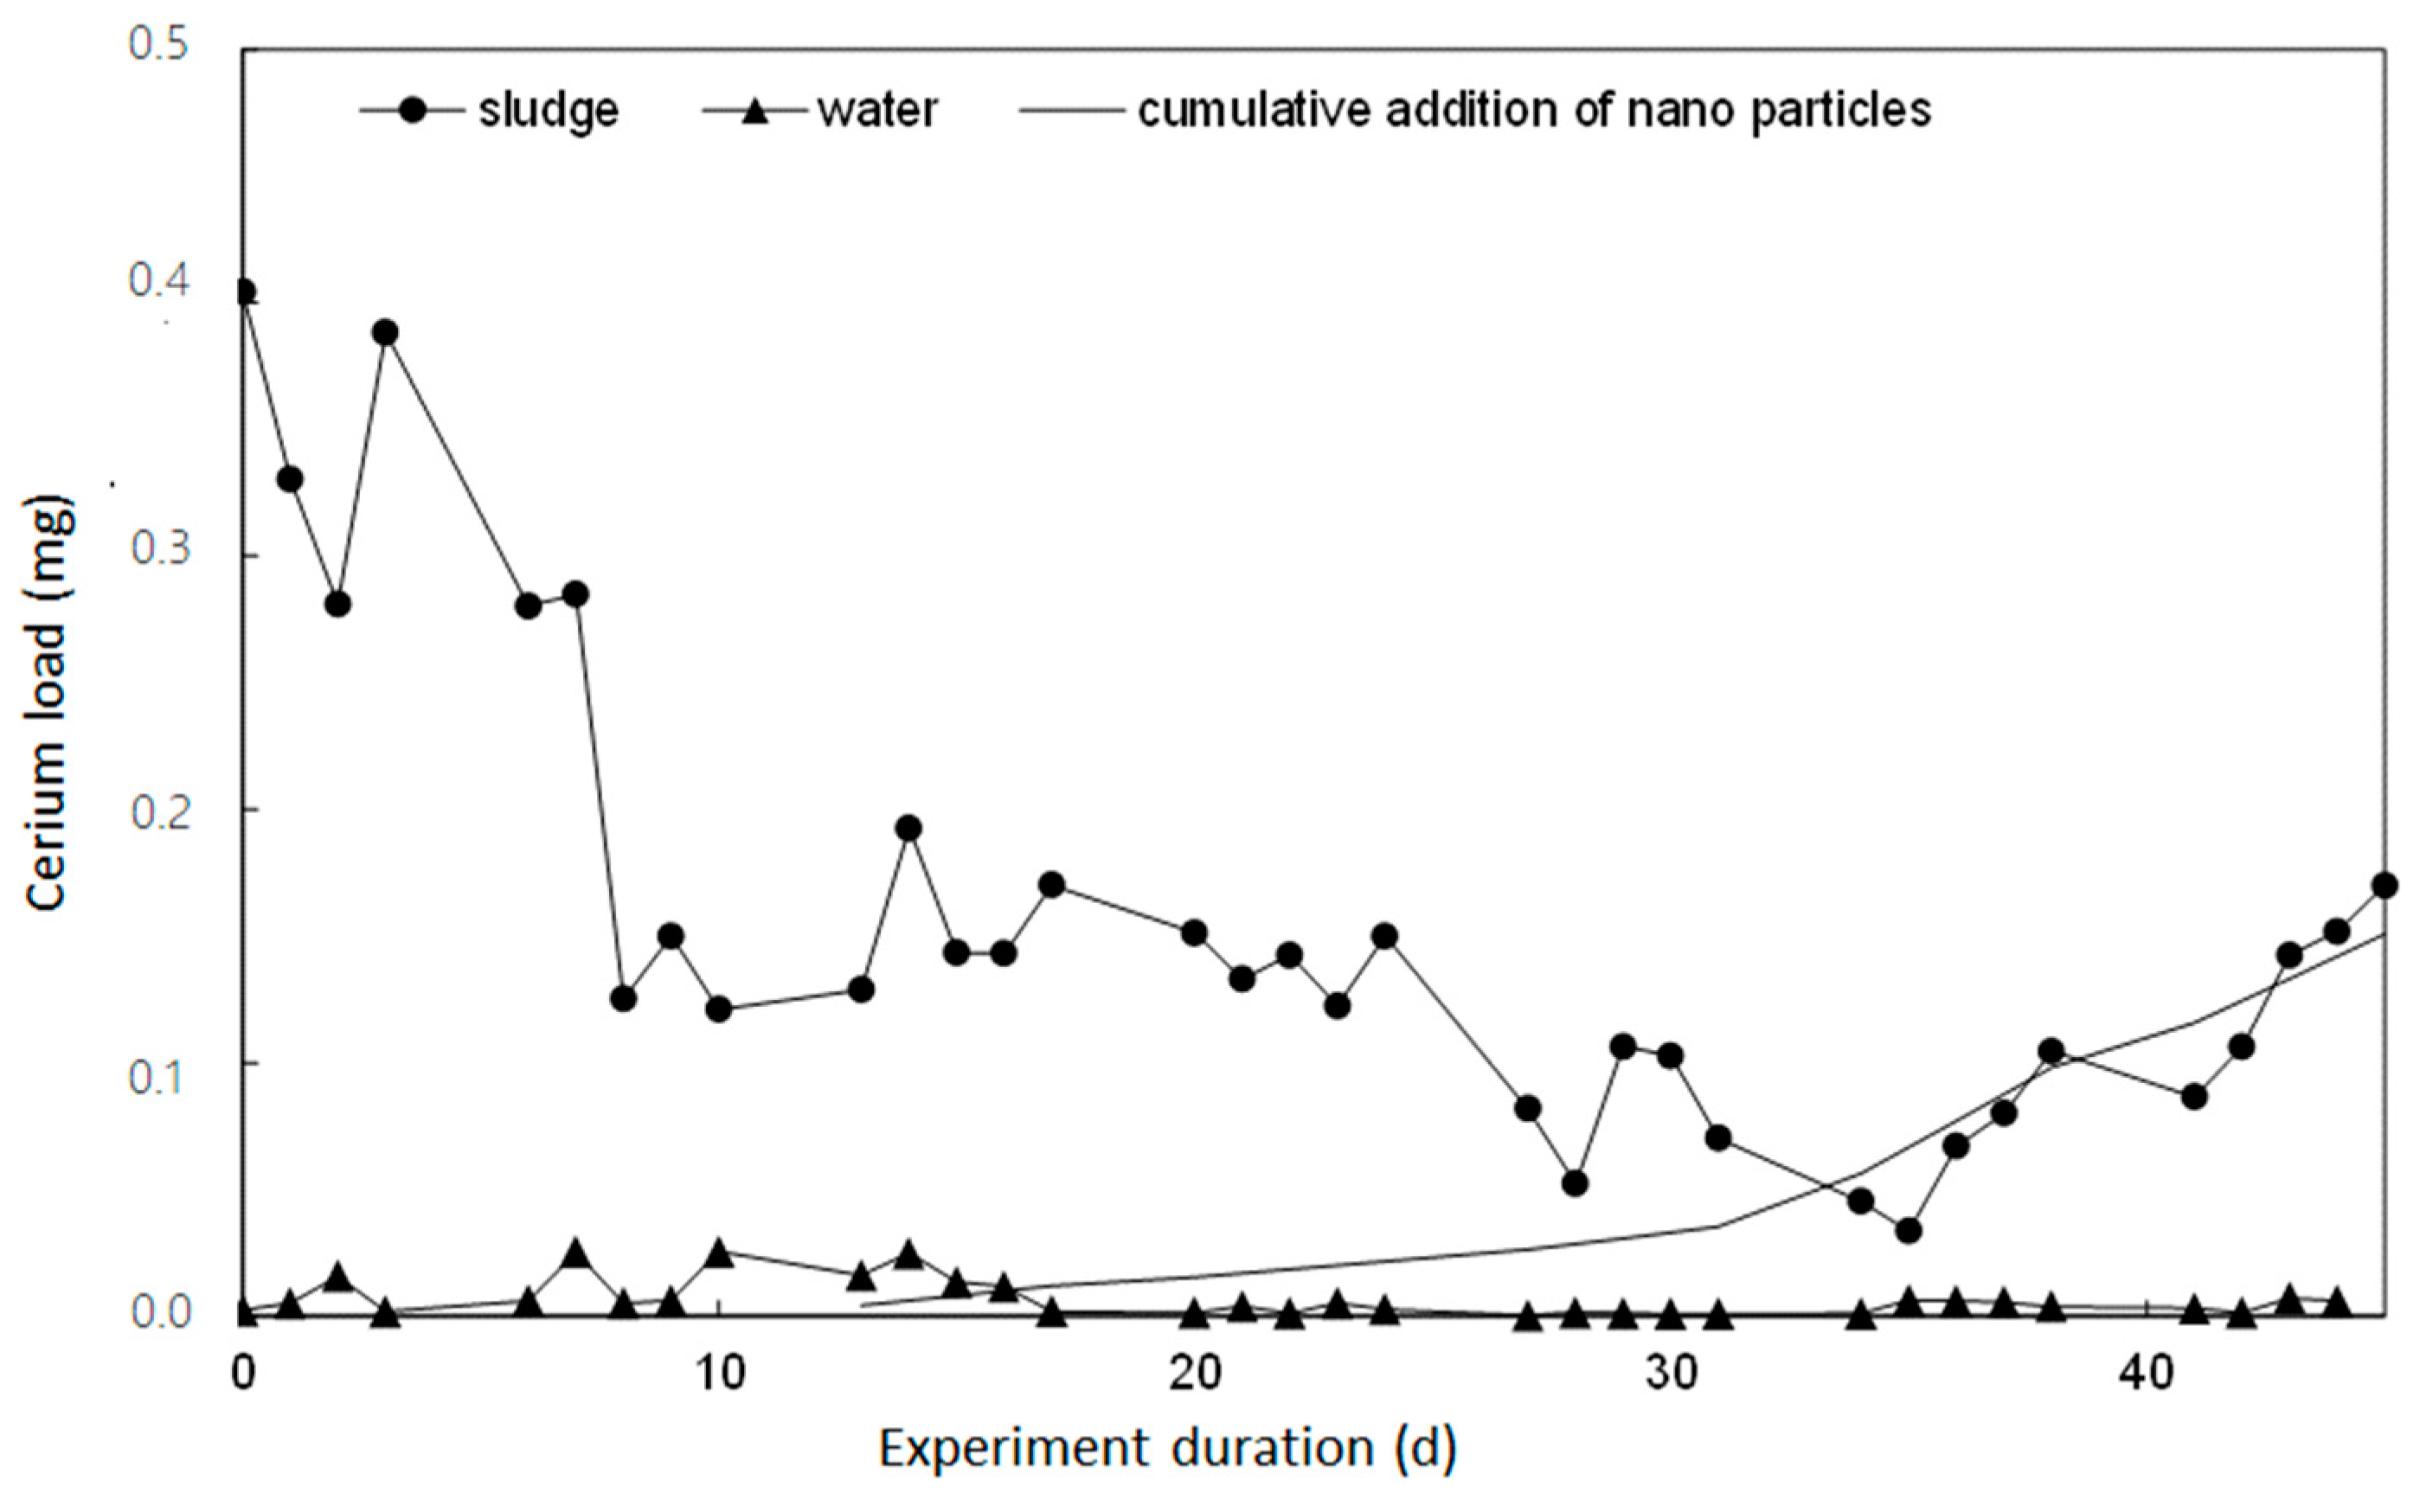
3.6. Discharge Loads of Cerium NP-Continuous Particle Addition

Figure 6 shows both the cerium load in the sludge and in the effluent. It is noticeable that the cerium load in sludge fluctuated between 280 and 410 μg by the seventh day of the experiment. Then, there was a drop to 125 μg. No trend can be seen between days 8 and 34; the loads fluctuated between 45 and 200 μg. An increase in cerium load can be observed after day 35 with one exception. The loads in the effluent fluctuated between 1 and 30 μg up to day 17. The discharge loads were almost constant between 0.5 and 7 μg after day 20.
The concentration of the sludge blank value was 8.81 mg/kg, the blank value of the drain is 1.02 μg/L. The sludge loads decreased despite the addition of the nanoparticles by the 35th day of the experiment. The reason for this is that the cerium load that leaves the lab-scale wastewater treatment system via the effluent, by removing excess sludge and taking daily samples, is higher than the 3.95 μg added per day. The fluctuations between test days 0 and 13 are more pronounced than the fluctuations between test days 14 and 35. As a result, it was found that 4 percent of the nCeO2 remained in the effluent and thus 96 percent in the sludge.

3.7. nCeO2 Characteristics of Added NP Suspension and Effluent, Particle Size Distribution

The NP characteristic is shown in Figure 7 as the nCeO2 scan of the added NP suspension and the effluent. Figure 7a shows the intensity of the stock solution of the nCeO2 before they are added to the lab-scale sewage treatment systems. The time used is given in seconds and the intensity in cps. The background contributes to the intensity range 0 to 80,000 cps. The majority of the particles are detected between 100,000 and 300,000 cps. Four peaks have an intensity in the range of 350,000 to 600,000 cps. Figure 7b shows the intensity of the nCeO2 in the course of experiment day 33. The time is again given in seconds and the intensity in cps. Signals in the range 0 to 2000 cps are formed by the non-NP-background. The majority of the particles are between 3000 and 10,000 cps. Six peaks are above an intensity of 20,000 cps. The nCeO2 used for the test can be detected in the effluent after addition. As is visible from Figure 7, from left (stock solution) to right (effluent), the particle number concentration decreases (expressed through the decreased number of peaks), and the particle size decreases (expressed through a significantly smaller scale of intensity). This leads to the conclusion that after the addition to the system, the NPs are observed to be significantly smaller than in the stock solution (before the addition of Figure 7). The implications for dissolution processes in the course of wastewater treatment are even clearer than for nTiO2.
Since the background level of cerium is negligible in contrast to that of titanium, this comparison points to dissolution processes during the passage through the system leading to an increase in the baseline.

4. Discussion and Conclusions

Scope of the investigation was to investigate the fate of synthetic NP on the pathway wastewater-sewage sludge exemplified by nTiO2 and nCeO2. Furthermore, the feasibility of sp-ICP-MS as standard operation procedure for NP tracking in wastewater was investigated. Even though there is still room for further development, as was stated by Mozhayeva and Engelhardt [73], the present study confirmed the feasibility of the procedure. In this context, the investigation approach is of fundamental and application-oriented importance for research and industry, since the results provide fundamental knowledge for consulting in wastewater disposal. Particularly in the area of municipal wastewater treatment, the topic is met with great interest. This applies to both information on the operating modes of the wastewater treatment systems that contain NPs and the possibilities of verifying NPs in wastewater. In addition, the results obtained can be used to draw conclusions about expected procedural adjustments to WWTPs.
The investigation results show that both nTiO2 and nCeO2, are adsorbed, to a substantial extent, in the sludge. For both NM, the experiments resulted in an adsorption ratio of at least 90 percent in the sludge. The results for nTiO2 show that the adsorption ratio in the sludge during a single particle addition is even higher; up to 96 percent. Thus, 4 percent of the NP remained in the aqueous phase. In case of continuous particle additions, 90 percent of the added nTiO2 were adsorbed to the sludge, while 9 to 10 percent remained in the aqueous phase. The adsorption process mechanism of the different application procedures is subject to future investigations. For example, it might be assumed that the adsorption efficiency is higher during a single particle application. Thus, the available adsorption capacity might be used more comprehensively. The results also indicate that during a continuous particle addition, the maximum adsorption capacity is reached sooner. For the practical wastewater treatment, it can be concluded that a permanent nTiO2 presence in the wastewater might reduce the NP adsorption capacity over time. In such a case, the remaining nTiO2 could pass the wastewater treatment process. However, for nCeO2 NP, a difference in the adsorption capacity during single or continuous application was not observed. This may be due to the much lower concentration used in the CeO2 experiments. Independently from the type of nCeO2 addition, 4 to 5 percent of the nCeO2 remained mobile in the effluent, while 96 percent were accumulated in the sludge. In case of the application of such sludge in agriculture, agglomerated metal concentrations might accumulate in crops. Investigations by the Bavarian State Office for the Environment (LfU) [74] and by the ETH Zurich [75] gave comparable results using a Hitachi S300N scanning electron microscope and X-ray diffraction and IR diffuse reflectance spectrum as NP detection methodology, respectively. Both studies can be considered as validation for the applicability of the sp-ICP-MS approach for NP detection in wastewater. Even though the scope of the respective studies was similar, the investigation approach for NP detection was different. Generally speaking, if sp-ICP-MS is further developed and comprehensively applied, it could become a standard method for NP monitoring in communal wastewater systems, particularly as the majority of monitoring labs are usually already equipped with ICP-MS technology. The further development of the sp-ICP-MS methodology might enable them to perform NP monitoring in wastewater with an acceptable affordability, once real wastewater samples can be determined in a reliable way. The lab-scale investigations with synthetic wastewater are a first step in that direction. Future investigations will have to look also on radio-labelled NPs to identify the process behavior of NPs in real wastewater. A further question in the beginning of the investigations was if nTiO2 and nCeO2 might have a negative impact on the microbial community and lead to disturbances of the wastewater treatment performance. Even though microbiological measurements were not performed during the lab-scale tests, it can be implicitly concluded that this is not the case, as a decrease of the degradation of organic carbon or the removal of nitrogen was not observed during the experiments. No negative effects on the microbial sludge degradation behavior due to nTiO2 and nCeO2 presence were observed. This confirms literature observations [64,74], which refers to the photocatalytic activity of nTiO2 only to UV light [76]. They are not toxic in the opaque sludge dispersion of the lab-scale sewage treatment systems. However, due to the lower pH value, the constantly higher temperature and the synthetic wastewater, there are different conditions in the lab-scale sewage treatment systems than in the Chemnitz WWTP. The study of the Bavarian State Office for the Environment (LfU) [74] also showed that NP (nAg, nZnO, nCuO, nTiO2) have no significant influence on the performance of microbiology in activated sludge.
Furthermore, the results indicate that there are processes that lead to a modification of the NP shape in the effluent, as NP are observed to be significantly smaller than in the stock solution before the addition. Two mechanisms can be assumed to play a role in the shift towards smaller particle size distributions during WWT. First, a slow dissolution of the particles, which should be more pronounced for CeO2 than for the relatively inert TiO2, and second, a preferential sedimentation of larger particles in the final clarifier. This has further implications for the risk assessment of consequent NP release, considering that smaller size NP (which pose the highest risks) might not be cleared from waste water to the same extent as larger particles.

Author Contributions

Conceptualization, P.S. and T.L.; methodology, P.S. and T.L.; validation, T.L., formal analysis, P.S., S.S. and K.F.; investigation, T.L.; writing—original draft preparation, P.S.; writing—review and editing, T.L., S.S. and K.F.; visualization, T.L.; supervision, K.F.; project administration, T.L.; funding acquisition, P.S. and T.L. All authors have read and agreed to the published version of the manuscript.

Funding

This research was funded by the National Ministry of Education and Research of Germany under the project “NanoSuppe-Behavior of engineered nanoparticles in the pathway wastewater-sewage sludge-plant, using the examples TiO2, CeO2, MWCNT and quantum dots”, grant number 03X0144C.

Acknowledgments

Thanks to Marcel Neugebauer for conducting the sp-ICP-MS lab experiments.

Conflicts of Interest

The authors declare no conflict of interest.

References

  1. Khan, I.; Saeed, K.; Khan, I. Nanoparticles: Properties, applications and toxicities. Arab. J. Chem. 2019, 12, 908–931. [Google Scholar] [CrossRef]
  2. Mei, H.Y.; Man, C.; Bo, H.Z. Effective removal of Cu(II) ions from aqueous solution by amino-functionalized magnetic nanoparticles. J. Hazard. Mater. 2010, 184, 392–399. [Google Scholar]
  3. Colvin, V.L. The potential environmental impact of engineered nanomaterials. Nat. Biotechnol. 2003, 21, 1166–1170. [Google Scholar] [CrossRef]
  4. Wager, S.; Gondikas, A.; Neubauer, E.; Hofmann, T.; von der Kammer, F. Spot the Difference: Engineered and Natural Nanoparticles in the Environment—Release, Behavior, and Fate. Angew. Chem. Int. Ed. 2014, 53, 12398–12419. [Google Scholar]
  5. Weber, C.H.M.; Chiche, A.; Krausch, G.; Rosenfeldt, R.; Ballauff, M.; Harnau, L.; Göttker-Schnetmann, I.; Tong, Q.; Mecking, S. Single Lamella Nanoparticles of Polyethylene. Nano Lett. 2007, 7, 2024–2029. [Google Scholar] [CrossRef] [Green Version]
  6. Brar, S.K.; Verma, M.; Tyagi, R.D.; Surampalli, R.Y. Engineered nanoparticles in wastewater and wastewater sludge—Evidence and impacts. Waste Manag. 2010, 30, 504–520. [Google Scholar] [CrossRef]
  7. DiSalvo, R.M., Jr.; McCollum, G.R. Evaluating the Impact of Nanoparticles on Wastewater Collection and Treatment Systems in Virginia. In Proceedings of the Water JAM 2008, Virginia Beach, VA, USA, 7–11 September 2008. [Google Scholar]
  8. Yamaguchi, A.; Mashima, Y.; Iyoda, T. Reversible Size Control of Liquid-Metal Nanoparticles under Ultrasonication. Angew. Chem. 2015, 127, 13000–13004. [Google Scholar] [CrossRef]
  9. Hendren, C.O.; Badireddy, A.R.; Casman, E.; Wiesner, M.R. Modeling nanomaterial fate in wastewater treatment: Monte Carlo simulation of silver nanoparticles (nano-Ag). Sci. Total Environ. 2013, 449, 418–425. [Google Scholar] [CrossRef]
  10. Ali, I.; Naz, I.; Khan, Z.M.; Sultan, M.; Isalm, T.; Abbasi, I.A. Phytogenic magnetic nanoparticles for wastewater treatment: A review. RSC Adv. 2017, 7, 40158–40178. [Google Scholar] [CrossRef] [Green Version]
  11. Lu, H.; Wang, J.; Stoller, M.; Wang, T.; Bao, Y.; Hao, H. An Overview of Nanomaterials for Water and Wastewater Treatment. Adv. Mater. Sci. Eng. 2016, 2016, 1687–8434. [Google Scholar] [CrossRef] [Green Version]
  12. Samanta, H.S.; Das, R.; Bhattachajee, C. Influence of Nanoparticles for Wastewater Treatment—A Short Review. Austin Chem. Eng. 2016, 3, 1036. [Google Scholar]
  13. Sheng, Z.; Van Nostrand, J.D.; Zhou, J.; Liu, Y. Contradictory effects of silver nanoparticles on activated sludge wastewater treatment. J. Hazard. Mater. 2018, 341, 448–456. [Google Scholar] [CrossRef] [PubMed] [Green Version]
  14. Hou, L.; Li, K.; Ding, Y.; Li, Y.; Chen, J.; Wu, X.; Li, X. Removal of silver nanoparticles in simulated wastewater treatment processes and its impact on COD and NH4 reduction. Chemosphere 2012, 87, 248–252. [Google Scholar] [CrossRef] [PubMed]
  15. Jarvie, H.P.; Al-Obaidi, H.; King, S.M. Fate of Silica Nanoparticle in Simulated Primary Wastewater Treastment. Environ. Sci. Technol. 2009, 43, 8622–8628. [Google Scholar] [CrossRef] [PubMed] [Green Version]
  16. Kim, J.Y.; Choi, S.B.; Noh, J.H.; Hunyoon, S.; Lee, S.; Noh, T.H.; Frank, A.J.; Hong, K.S. Synthesis of CdSe-TiO2 nanocomposites and their applications to TiO2 sensitized solar cells. Langmuir 2009, 25, 5348–5351. [Google Scholar] [CrossRef]
  17. Kim, B.; Murayama, M.; Colmane, B.P.; Hochella, M.F., Jr. Characterization and environmental implications of nano- and larger TiO2 particles in sewage sludge, and soils amended with sewage sludge. J. Environ. Monit. 2012, 14, 1129–1137. [Google Scholar] [CrossRef] [PubMed]
  18. Gartiser, S.; Flach, F.; Nickel, C.; Stintz, M.; Damme, S.; Schaeffer, A.; Erdinger, L.; Kuhlbusch, T.J.A. Behavior of nanoscale titanium dioxide in laboratory wastewatertreatment plants according to OECD 303 A. Chemosphere 2014, 104, 197–204. [Google Scholar] [CrossRef]
  19. Limbach, L.K.; Bereiter, R.; Müller, E.; Krebs, R.; Gälli, R.; Stark, W.J. Removal of Oxide Nanoparticles in a Model Wastewater Treatment Plant: Influence of Agglomeration and Surfactants on Clearing Efficiency. Environ. Sci. Technol. 2008, 42, 5828–5833. [Google Scholar] [CrossRef]
  20. Yang, Y.; Zhang, C.; Hu, Z. Impact of metallic and metal oxide nanoparticles on wastewater treatment and anaerobic digestion. Environ. Sci. Process. Impacts 2013, 15, 39–48. [Google Scholar] [CrossRef]
  21. Oleszczuk, P.; Hollert, H. Comparison of sewage sludge toxicity to plants and invertebrates in three different soils. Chemosphere 2011, 83, 502–509. [Google Scholar] [CrossRef]
  22. Johansen, A.; Pedersen, A.L.; Jensen, K.A. Effects of C60 fullerene nanoparticles on soil bacteria and protozoans. Environ. Toxicol. Chem. 2008, 27, 1895–1903. [Google Scholar] [CrossRef] [PubMed]
  23. Nickel, C.; Gabsch, S.; Hellack, B.; Nogowski, A.; Babick, F.; Stintz, M.; Kuhlbusch, T.A.J. Mobility of coated and uncoated TiO2 nanomaterials in soil columns–Applicability of the tests methods of OECD TG 312 and 106 for nanomaterials. J. Environ. Manag. 2015, 157, 230–237. [Google Scholar] [CrossRef] [PubMed]
  24. Ganzleben, C.; Hansen, S.F. Environmental Exposure to Nanomaterials—Data Scoping Study: Final Report; Milieu: Brussels, Belgium, 2012. [Google Scholar]
  25. Gladkova, M.M.; Terekhova, V.A. Engineered nanomaterials in soil: Sources of entry and migration pathways. Mosc. Univ. Soil Sci. Bull. 2013, 68, 129–134. [Google Scholar] [CrossRef]
  26. Gottschalk, F.; Sonderer, T.; Scholz, R.W.; Nowack, B. Modeled environmental concentrations of engineered nanomaterials (TiO2, ZnO, Ag, CNT, fullerenes) for different regions Environ. Sci. Technol. 2009, 43, 9216–9222. [Google Scholar] [CrossRef] [PubMed]
  27. Johnson, A.C.; Bowes, M.J.; Crossley, A.; Jarvie, H.P.; Jurkschat, K.; Jürgens, M.D.; Lawlor, A.J.; Park, B.; Rowland, P.; Spurgeon, D.; et al. An assessment of the fate, behaviour and environmental risk associated with sunscreen TiO2 nanoparticles in UK field scenarios. Sci. Total Environ. 2011, 409, 2503–2510. [Google Scholar] [CrossRef] [PubMed]
  28. Yang, X.; Gondikas, A.P.; Marinakos, S.M.; Auffan, M.; Liu, J.; Hsu-Kim, H.; Meyer, J.N. Mechanism of Silver Nanoparticle Toxicity Is Dependent on Dissolved Silver and Surface Coating in Caenorhabditis elegans. Environ. Sci. Technol. 2012, 46, 1119–1127. [Google Scholar] [CrossRef]
  29. Barton, L.E.; Therezien, M.; Auffan, M.; Bottero, J.-Y.; Wiesner, M.R. Theory and Methodology for Determining Nanoparticle Affinityfor Heteroaggregation in Environmental Matrices UsingBatch Measurements. Environ. Eng. Sci. 2014, 31, 421–427. [Google Scholar] [CrossRef]
  30. Cornelis, G.; Hund-Rinke, K.; Van den Brink, N.W.; Nickel, C. Fate and Bioavailability of Engineered Nanoparticles in Soils: A Review. Rev. Environ. Sci. Technol. 2014, 44, 2720–2764. [Google Scholar] [CrossRef]
  31. Dunphy Guzmán, K.A.; Taylor, M.R.; Banfield, J.F. Environmental Risks of Nanotechnology:  National Nanotechnology Initiative Funding, 2000–2004. Environ. Sci. Technol. 2006, 40, 1401–1407. [Google Scholar] [CrossRef] [Green Version]
  32. Hotze, E.M.; Phenrat, T.; Lowry, G.V. Nanoparticles aggregation: Challanges to understanding transport and reactivity in the envioenment. J. Environ. Qual. 2010, 39, 1909–1924. [Google Scholar] [CrossRef] [Green Version]
  33. Jiang, J.; Oberdörster, G.; Biswas, P. Characterization of size, surface charge, and agglomerationstate of nanoparticle dispersions for toxicological studies. J. Nanopart. Res. 2008, 11, 77–89. [Google Scholar] [CrossRef]
  34. De Santiago-Martín, A.; Constantin, B.; Guesdon, G.; Kagambega, N.; Raymond, S.; Galvez Cloutier, R. Bioavailability of engineered nanoparticles in soil systems. J. Hazard. Toxic. Radioact. Waste 2016, 20, B4015001. [Google Scholar] [CrossRef]
  35. Bayat, A.E.; Junin, R.; Shamshirband, S.; Chong, W.T. Transport and retention of engineered Al2O3, TiO2 and SiO2 nanoparticles through various sedimentary rocks. Sci. Rep. 2015, 5, 14264. [Google Scholar] [CrossRef] [PubMed] [Green Version]
  36. Cornelis, G.; Thomas, C.D.M.; McLaughlin, M.J.; Kirby, J.K.; Beak, D.G.; Chittleborough, D. Retention and Dissolution of Engineered Silver Nanoparticles in Natural Soils. Soil Sci. Soc. Am. J. 2012, 76, 891–902. [Google Scholar] [CrossRef]
  37. Fang, J.; Shan, X.; Wen, B.; Lin, J.; Owens, G. Stability of titania nanoparticles in soil suspensions and transport in saturated homogeneous soil columns. Environ. Pollut. 2009, 157, 1101–1109. [Google Scholar] [CrossRef]
  38. French, R.A.; Jacobson, A.R.; Kim, B.; Isley, S.L.; Penn, R.L.; Baveye, P.C. Influence of Ionic Strength, pH, and Cation Valence on Aggregation Kinetics of Titanium Dioxide Nanoparticles. Environ. Sci. Technol. 2009, 43, 1354–1359. [Google Scholar] [CrossRef]
  39. Gogos, A.; Knauer, K.; Bucheli, T.D. Nanomaterials in plant protection and fertilization: Current state, foreseen applications, and research priorities. J. Agric. Food Chem. 2012, 60, 9781–9792. [Google Scholar] [CrossRef]
  40. Al-Salim, N.; Barraclough, E.; Burgess, E. Quantum dots transport in soil, plants and insects. Sci. Total Environ. 2011, 409, 3237–3248. [Google Scholar] [CrossRef]
  41. Simonin, M.; Martins, J.M.F.; Uzu, G.; Vince, E.; Richaume, A. Combined Study of Titanium Dioxide Nanoparticle Transport and Toxicity on Microbial Nitrifying Communities under Single and Repeated Exposures in Soil Columns. Environ. Sci. Technol. 2016, 50, 10693–10699. [Google Scholar] [CrossRef]
  42. Sun, P.; Zhang, K.; Fang, J.; Lin, D.; Wang, M.; Han, J. Transport of TiO2 nanoparticles in soil in the presence of surfactants. Sci. Total Environ. 2015, 527–528, 420–428. [Google Scholar] [CrossRef]
  43. Sun, P.; Shijirbaatar, A.; Fang, J.; Owen, G.; Lin, D.; Zhang, K. Distinguishable Transport Behavior of Zinc Oxide Nanoparticles in Silica Sand and Soil Columns. Sci. Total Environ. 2015, 505, 189–198. [Google Scholar] [CrossRef]
  44. Tourinho, P.S.; Cornelis, A.; Van Gestel, M.; Lofts, S.; Svendsen, C.; Soares, A.M.V.M.; Lourero, S. Metal-based Nanoparticles in Soil: Fate, Baheviour, and Effects on Soil. Environ. Toxicol. Chem. 2012, 31, 1679–1692. [Google Scholar] [CrossRef] [PubMed]
  45. Zhao, L.; Peralta-Videa, J.R.; Varela-Ramirez, A.; Castillo-Michel, H.; Li, C.; Zhang, J.; Aguilera, R.J.; Keller, A.A.; Gardea-Torresdey, J.L. Effect of surface coating and organic matter on the uptake of CeO2 NPs by corn plants grown in soil: Insight into the uptake mechanism. J. Hazard. Mater. 2012, 225–226, 131–138. [Google Scholar] [CrossRef] [PubMed] [Green Version]
  46. Kaegi, R.; Voegelin, A.; Sinnet, B.; Zuleeg, Z.; Hagendorfer, H.; Burkhardt, M.; Siegrist, H. Behavior of metallic silver nanoparticles in a pilot wastewater treatment plant. Environ. Sci. Technol. 2011, 45, 3902–3908. [Google Scholar] [CrossRef] [PubMed]
  47. Sondi, I.; Salopek-Sondi, B. Silver nanoparticles as antimicrobial agent: A case study on E. coli as a model for Gram-negative bacteria. J. Colloid Interface Sci. 2004, 275, 177–182. [Google Scholar] [CrossRef] [PubMed]
  48. Morones, J.R.; Elechiguerra, J.L.; Camacho, A.; Holt, K.; Kouri, J.B.; Tapia Ramirez, J.; Yacaman, M.J. The bactericidal effect of silvernanoparticles. Nanotechnology 2005, 16, 2346–2353. [Google Scholar] [CrossRef] [PubMed] [Green Version]
  49. Adams, L.K.; Lyon, D.Y.; McIntosh, A.; Alvarez, P.J.J. Comparative toxicity of nano-scale TiO2, SiO2 and ZnO water suspensions. Water Sci. Technol. 2006, 54, 327–334. [Google Scholar] [CrossRef]
  50. Huang, Y.; Liang, Y.; Rao, Y.; Zhu, D.; Cao, J.; Shen, Z.; Ho, W.; Lee, S.C. Environment-Friendly Carbon Quantum Dots/ZnFe2O4 Photocatalysts: Characterization, Biocompatibility, and Mechanisms for NO Removal. Environ. Sci. Technol. 2017, 51, 2924–2933. [Google Scholar] [CrossRef]
  51. Wang, B.; Feng, W.-Y.; Wang, T.-C.; Jia, G.; Wang, M.; Shi, J.-W.; Zhang, F.; Zhaoa, Y.-L.; Chai, Z.-F. Acute toxicity of nano- and micro-scale zinc powder in healthy adult mice. Toxicol. Lett. 2006, 161, 115–123. [Google Scholar] [CrossRef]
  52. Exbrayat, J.-M.; Moudilou, E.N.; Lapied, E. Harmful Effects of Nanoparticles on Animals. J. Nanotechnol. 2015, 2015, 861092. [Google Scholar] [CrossRef] [Green Version]
  53. Heinlaan, M.; Ivask, A.; Blinova, I.; Dubourguier, H.C.; Kahru, A. Toxicity of nanosized and bulk ZnO, CuO and TiO2 to bacteria Vibrio fischeri and crustaceans Daphnia magna and Thamnocephalus platyurus. Chemosphere 2008, 71, 1308–1316. [Google Scholar] [CrossRef]
  54. Kasemets, K.; Ivask, A.; Dubourguier, H.-C.; Kahru, A. Toxicity of nanoparticles of ZnO, CuO and TiO2 to yeast Saccharomyces cerevisiae. Toxicol. In Vitro 2009, 23, 1116–1122. [Google Scholar] [CrossRef] [PubMed]
  55. Wu, F.; Harper, B.J.; Harper, S.L. Comparative dissolution, uptake, and toxicity of zinc oxide particles in individual aquatic species and mixed populations. Environ. Toxicol. Chem. 2019, 38, 591–602. [Google Scholar] [CrossRef] [PubMed] [Green Version]
  56. Goyal, D.; Zhang, X.J.; Rooney-Varga, J.N. Impacts of single-walled carbon nanotubes on microbial community structure in activated sludge. Lett. Appl. Microbiol. 2010, 51, 428–435. [Google Scholar] [CrossRef] [PubMed]
  57. Boon, N.; Top, E.M.; Verstraete, W.; Siciliano, S.D. Bioaugmentation as a tool to protect the structure and function of an activated-sludge microbial community against a 3-chloroaniline shock load. Appl. Environ. Microbiol. 2003, 69, 1511–1520. [Google Scholar] [CrossRef] [Green Version]
  58. Henriques, I.D.S.; Love, N.G. The role of extracellular polymeric substances in the toxicity response of activated sludge bacteria to chemical toxins. Water Res. 2007, 41, 4177–4185. [Google Scholar] [CrossRef]
  59. Roco, M.C. The long view of nanotechnology development: The National Nanotechnology Initiative at 10 years. J. Nanopart. Res. 2001, 13, 427–445. [Google Scholar] [CrossRef] [Green Version]
  60. Yang, J.; Cao, W.; Rui, Y. Interactions between nanoparticles and plants: Phytotoxicity and defense mechanisms. J. Plant Interact. 2017, 12, 158–169. [Google Scholar] [CrossRef]
  61. Von der Kammer, F.; Ferguson, P.L.; Holden, P.A.; Masion, A.; Rogers, K.R.; Klaine, S.J.; Koelmans, A.A.; Horne, N.; Unrine, J.M. Analysis of engineered nanomaterials in complex matrices (environment and biota): General considerations and conceptual case studies. Environ. Toxicol. Chem. 2012, 31, 32–49. [Google Scholar] [CrossRef]
  62. Pan, B.; Xing, B. Applications and implications of manufactured nanoparticles in soils: A review. Soil Sci. 2012, 63, 437–456. [Google Scholar] [CrossRef]
  63. Krug, H. Nanosicherheitsforschung–sind wir auf dem richtigenWeg? Angew. Chem. 2014, 126, 12502–12518. [Google Scholar] [CrossRef] [Green Version]
  64. Durenkamp, M.; Pawlett, M.; Ritz, K.; Harris, J.A.; Neal, A.L.; McGrath, S.P. Nanoparticles within WWTP sludges have minimal impact on leachate quality and soil microbial community structure and function. Environ. Pollut. 2016, 211, 399–405. [Google Scholar] [CrossRef]
  65. Thomas, R.; Stephan, C. Single-Particle ICP-MS: A Key Analytical Technique for Characterizing Nanoparticles. Spectroscopy 2017, 32, 12–25. [Google Scholar]
  66. Donovan, A.R.; Adams, C.D.; Ma, Y.; Stephan, C.; Eichholz, T.; Shi, H. Detection of zinc oxide and cerium dioxide nanoparticles during drinking water treatment by rapid single particle ICP-MS methods. Anal. Bioanal. Chem. 2016, 408, 5137–5145. [Google Scholar] [CrossRef]
  67. Georgantzopoulou, A.; Almeida Carvalho, P.; Vogelsang, C.; Tilahun, M.; Ndungu, K.; Booth, A.M.; Thomas, K.; Macken, A. Ecotoxicological Effects of Transformed Silver and Titanium Dioxide Nanoparticles in the Effluent from a Lab-Scale Wastewater Treatment System. Environ. Sci. Technol. 2018, 52, 9431–9441. [Google Scholar] [CrossRef] [Green Version]
  68. Donovan, A.R.; Adams, C.D.; Ma, Y.; Stephan, C.; Eichholz, T.; Shi, H. Single particle ICP-MS characterization of titanium dioxide, silver, and gold nanoparticles during drinking water treatment. Chemosphere 2016, 144, 148–153. [Google Scholar] [CrossRef]
  69. Chang, Y.J.; Shih, Y.H.; Su, C.H.; Ho, H.C. Comparison of three analytical methods to measure the size of silver nanoparticles in real environmental water and wastewater samples. J. Hazard. Mater. 2017, 322, 95–104. [Google Scholar] [CrossRef]
  70. Théoret, T.; Wilkinson, K.J. Evaluation of enhanced darkfield microscopy and hyperspectral analysis to analyse the fate of silver nanoparticles in wastewaters. Anal. Methods 2017, 9, 3920–3928. [Google Scholar] [CrossRef]
  71. Pace, H.E.; Rogers, N.J.; Jarolimek, C.; Coleman, V.A.; Higgins, C.P.; Ranville, J.F. Determining transport efficiency for the purpose of counting and sizing nanoparticles via single particle inductively coupled plasma mass spectrometry. Anal. Chem. 2011, 83, 9361–9369. [Google Scholar] [CrossRef] [Green Version]
  72. Mitrano, D.M.; Lesher, K.; Bednar, A.; Monserud, J.; Higgins, C.P.; Ranville, J.F. Detecting nanoparticulate silver using single-particle inductively coupled plasma–mass spectrometry. Environ. Toxicol. Chem. 2012, 31, 115–121. [Google Scholar] [CrossRef]
  73. Mozhayeva, D.; Engelhard, C. A critical review of single particle inductively coupled plasma mass spectrometry—A step towards an ideal method for nanomaterial characterization. J. Anal. At. Spectrom. 2020. [Google Scholar] [CrossRef] [Green Version]
  74. Bayerisches Landesamt für Umwelt (LfU). Umweltrelevante Eigenschaften Synthetischer Nanopartikel–Abschlussbericht, Analysis of Engineered Nanomaterials in Complex Matrices (Environment and Biota): General Considerations and Conceptual Case Studies Investigation on Likely Effects of Ag, TiO2, and ZnO Nanoparticles on Sewage Treatment. 2013. Available online: https://www.lfu.bayern.de/analytik_stoffe/nanopartikel/doc/abschlussbericht_nanoprojekt.pdf (accessed on 1 June 2020).
  75. Burkhardt, M.; Zuleeg, S.; Kägi, R.; Sinnet, B.; Eugster, J.; Bollen, M.; Siegrist, H. Verhalten von nanosilber in Kläranlagen und dessen Einfluss auf die Nitrifikationsleistung in Belebtschlamm. Umweltwiss. Schadst. Forsch. 2010, 22, 529–540. [Google Scholar] [CrossRef]
  76. Wang, S.; Liu, Z.; Wang, W.; Youa, H. Fate and transformation of nanoparticles (NPs) in municipal wastewater treatment systems and effects of NPs on the biological treatment of wastewater: A review. RSC Adv. 2017, 7, 37065–37075. [Google Scholar] [CrossRef]
Figure 1. Investigation strategy for nCeO2 and nTiO2 on the pathway wastewater-sewage sludge.
Water 12 02509 g001
Figure 2. Lab-scale wastewater treatment systems: 1—storage tank for feed water, 2—storage tank for clarified drain water, 3—denitrification tank, 4—activation tank, 5—secondary clarification tank, 6—oxygen meter and control panel oxygen entry control, 7—control panel sludge return, 8—agitators, 9—sludge recirculation, 10—sludge recirculation, 11—volume flow measurement.
Water 12 02509 g002
Figure 3. Discharge loads of titanium nanoparticles (NP) after single particle addition on test day 5. (a) Titanium load over experiment duration, (b) correlation between titanium load in water and sludge.
Water 12 02509 g003
Figure 4. Discharge loads of titanium NP after continuous particle addition.
Water 12 02509 g004
Figure 5. Discharge loads of cerium NP after single particle addition on test day 5. (a) Cerium load over experiment duration, (b) correlation between cerium load in water and sludge.
Water 12 02509 g005
Figure 6. Discharge loads of cerium NP after continuous particle addition.
Water 12 02509 g006
Figure 7. nCeO2 scan of the added NP stock solution (a) and the effluent (b).
Water 12 02509 g007
Table 1. Operational parameters of the lab-scale sewage treatment systems.
Operational ParameterSystem 1System 2
Hydraulic retention time3.0 h2.4 h
Volume flow inlet pump0.5 L/h0.5 L/h
Volume flow recirculation pump1.7 L/h2.4 L/h
Volume flow draw-back pump0.5 L/h0.4 L/h
Table 2. Mass spectroscopy (ICP-MS) settings.
ParameterSetting
Injection tube2 mm, quartz
Sprayerconcentric
Sprayer chamber typecyclone
Scan modePeak hopping
Dwell time150 ms
Sweeps20
Readings1
Replicates3
Detector modePulse
Nebulizer Gas Flow0.76 L/min Ar
Auxiliary Gas Flow1.2 L/min Ar
Plasma Gas Flow16 L/min Ar

