1. Introduction
Flooding is one of the most frequently mentioned impacts of climate change and is also the natural disaster with the most significant economic influence in the world (e.g., [
1,
2,
3,
4,
5]). Flood risk in metropolises is increased by urban development due to changes in hydrological conditions [
6]. Because of the increasing urban concentration, the exposure and vulnerability of cities are increasing, ultimately resulting in higher flood risk. In recent years, climate adaptation strategies in developing countries have not only been paid attention but have also provided useful information for decision making [
7,
8]. Consequently, a comprehensive assessment of flood risk with suitable climate adaptation strategies is desired.
Effective adaptation options and plenty of risk assessment methodologies by comprehending climate risk have become more and more important. Conceptual topics associated with climate risk and vulnerability have also been studied, as well as climate adaptation strategies (e.g., [
9,
10]). Several previous studies had investigated the effect of flood hazard on different targets. Milanesi et al. [
11] developed a simplified model for a physically based evaluation of the vulnerability to flash floods for traditional masonry buildings in alpine areas. Costabile et al. [
12] evaluated the performances of three different approaches to two-dimensional flood modeling (i.e., fully dynamic, diffusive, and porosity approaches), not only considering the hydrodynamic variables, water depths and velocities, but also focusing the attention on their product. Furthermore, several previous studies focused on the effect of flood disasters on pedestrians as well as vehicles (e.g., [
13,
14]). Arrighi et al. [
13] presented a three-dimensional numerical model describing the detailed geometry of a human body and replicating a selection of critical pairs of water depth and velocity. Martínez-Gomariz et al. [
14] indicated that the knowledge of vehicles’ stability as they are exposed to floods is critical for flood risk management in urban areas because the vehicles float and may be flushed away after losing stability. In addition to the effect of floods, climate risk maps in flood disasters enable strategic land-use planning in floodplain areas, and these are mostly developed by governmental organizations and mainly used for emergency planning and spatial planning [
15,
16].
Some previous research also studied the effect of flood vulnerability on various targets. Balica et al. [
17] developed a flood vulnerability index for coastal cities based on exposure (such as infrastructure, goods, cultural heritage, agricultural fields and people), susceptibility and resilience to coastal flooding. Mansur et al. [
18] applied a multi criterion index to separate urban vulnerability into three dimensions, i.e., flood exposure, socio-economic sensitivity and infrastructure, meaning that flood risk exposure, household income, population age groups, location, sanitation services and housing conditions are considered as indicator groups. Nasiri et al. [
19] described the importance of the improvement in assessment methods for promoted decision-making processes, and analyzed the selection of the most significant indicators of the district flood vulnerability index construction. According to their study, the flood vulnerability index is classified into four components, namely social, economic, physical and environmental. Adelekan [
20] presented the result of a vulnerability assessment of urban dwellers to a significant flood hazard in southwestern Nigeria in 2007. In addition to the hazard and exposure caused by urban flooding and the distance of a dwelling to a river, respectively, the article also discussed numerous options, such as adaptive capacity. Moreover, most of the previous research investigated the effect of flood hazard on buildings, emergency management, critical infrastructure, and cities [
17,
21,
22].
In spite of the fact that various flood vulnerability indices, indicators, or methods have been developed in different fields, as seen in the previously mentioned studies, little research has been carried out on (1) evaluating flood risk in a comprehensive assessment structure that can assist decision makers to systematically understand possible causes, (2) evaluating different levels of hazard, exposure, and vulnerability in an efficient and quantitative manner, and (3) mapping the spatial and temporal presentation of climate risk to present the possible risk with suitable strategies under various vulnerability and adaptation scenarios. The establishment of an easily comprehensible relationship between the theoretical concepts of flood hazard, exposure and vulnerability and decision-making procedures and the construction of climate risk maps to efficiently present the spatial distribution of flood risk are the significant tasks in flood risk assessment. Moreover, recently, the Climate Change Adaptation Six Steps (CCA6Steps) including the climate risk template, regarded as an efficient assessment tool, was developed by Tung et al. [
23] to assist decision makers in progressively realizing the relationship between different factors of hazard, exposure, and vulnerability in climate risk assessment. However, the research work merely focused on the discussion of qualitative analysis on each step of CCA6Steps, and preliminarily demonstrated an ideal spatial information of risk maps based on the different scenarios of inundation extents. The future exposure and vulnerability were assumed to be the same as the current ones, even though the actual situation of current and future exposure and vulnerability should be different. Therefore, the justification prompts us to develop a generalized framework integrating an applicable approach of quantitative analysis based on the application of the climate risk template under various vulnerability and adaptation scenarios to thoroughly analyze the possible causes in flood disaster and adaptive strategies. The objective of this study is to assess climate risk in flood disasters under various vulnerability and potential climate adaptation strategies. To reach this objective, the generalized framework considering a core concept of climate risk and presenting spatial-temporal relationship of climate risk by the quantified analysis and result visualization is proposed. An application of a case study for residents in Kyoto City, Japan was successfully carried out to explore the effect of the adaptation strategies on reducing climate risk. Various potential climate adaptation strategies were clearly defined by the climate risk maps. In addition, the climate risk maps with possible situations of exposure and vulnerability for different periods were established and mutually compared to present the severe extent of climate risk. The results of the potential adaptation strategies for a metropolitan city were properly discussed as well.
2. Materials
2.1. Location of the Study Area
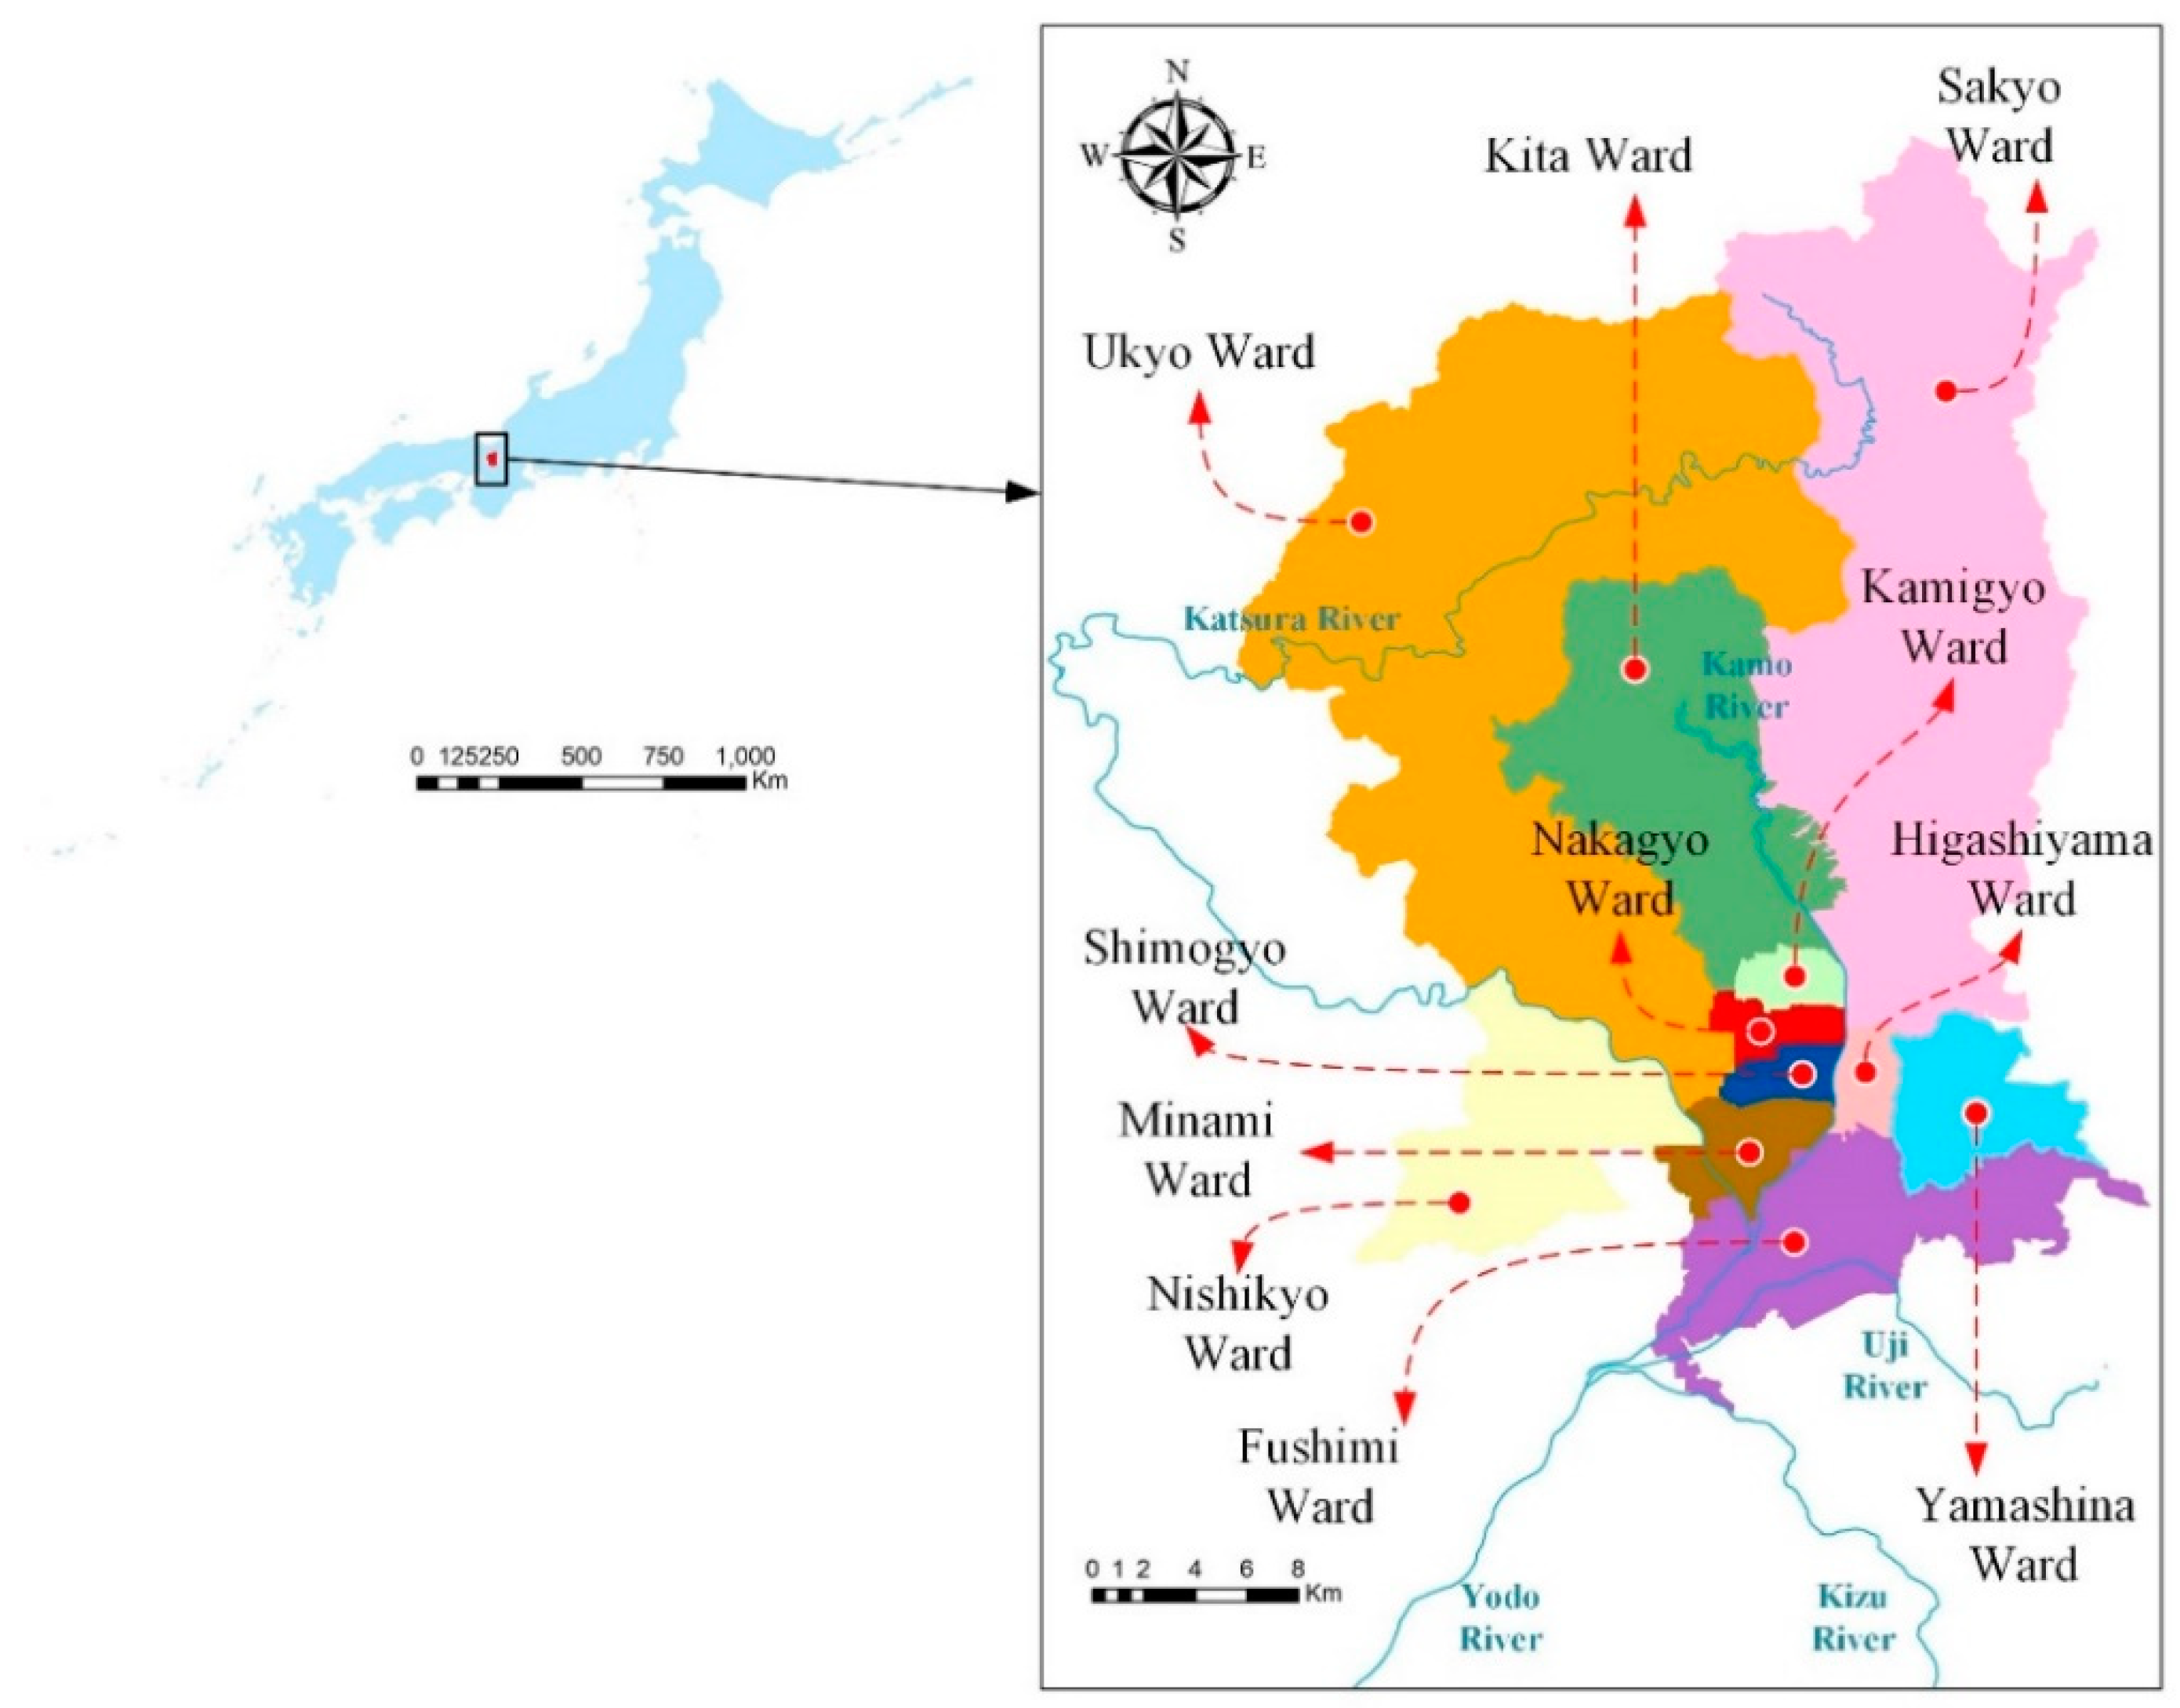
Kyoto City, the capital city of Kyoto Prefecture with eleven wards in Japan and a major tourist destination, is applied as the study area in this paper because of the important cultural assets. Numerous Buddhist temples, Shinto shrines, tourist palaces and gardens, most of which are listed collectively by United Nations Educational, Scientific and Cultural Organization (UNESCO) as World Heritage Sites, are located in Kyoto City. In addition, Kyoto City is a center of higher learning, with Kyoto University being an internationally renowned institution. The location of Kyoto City and its rivers is shown in
Figure 1.
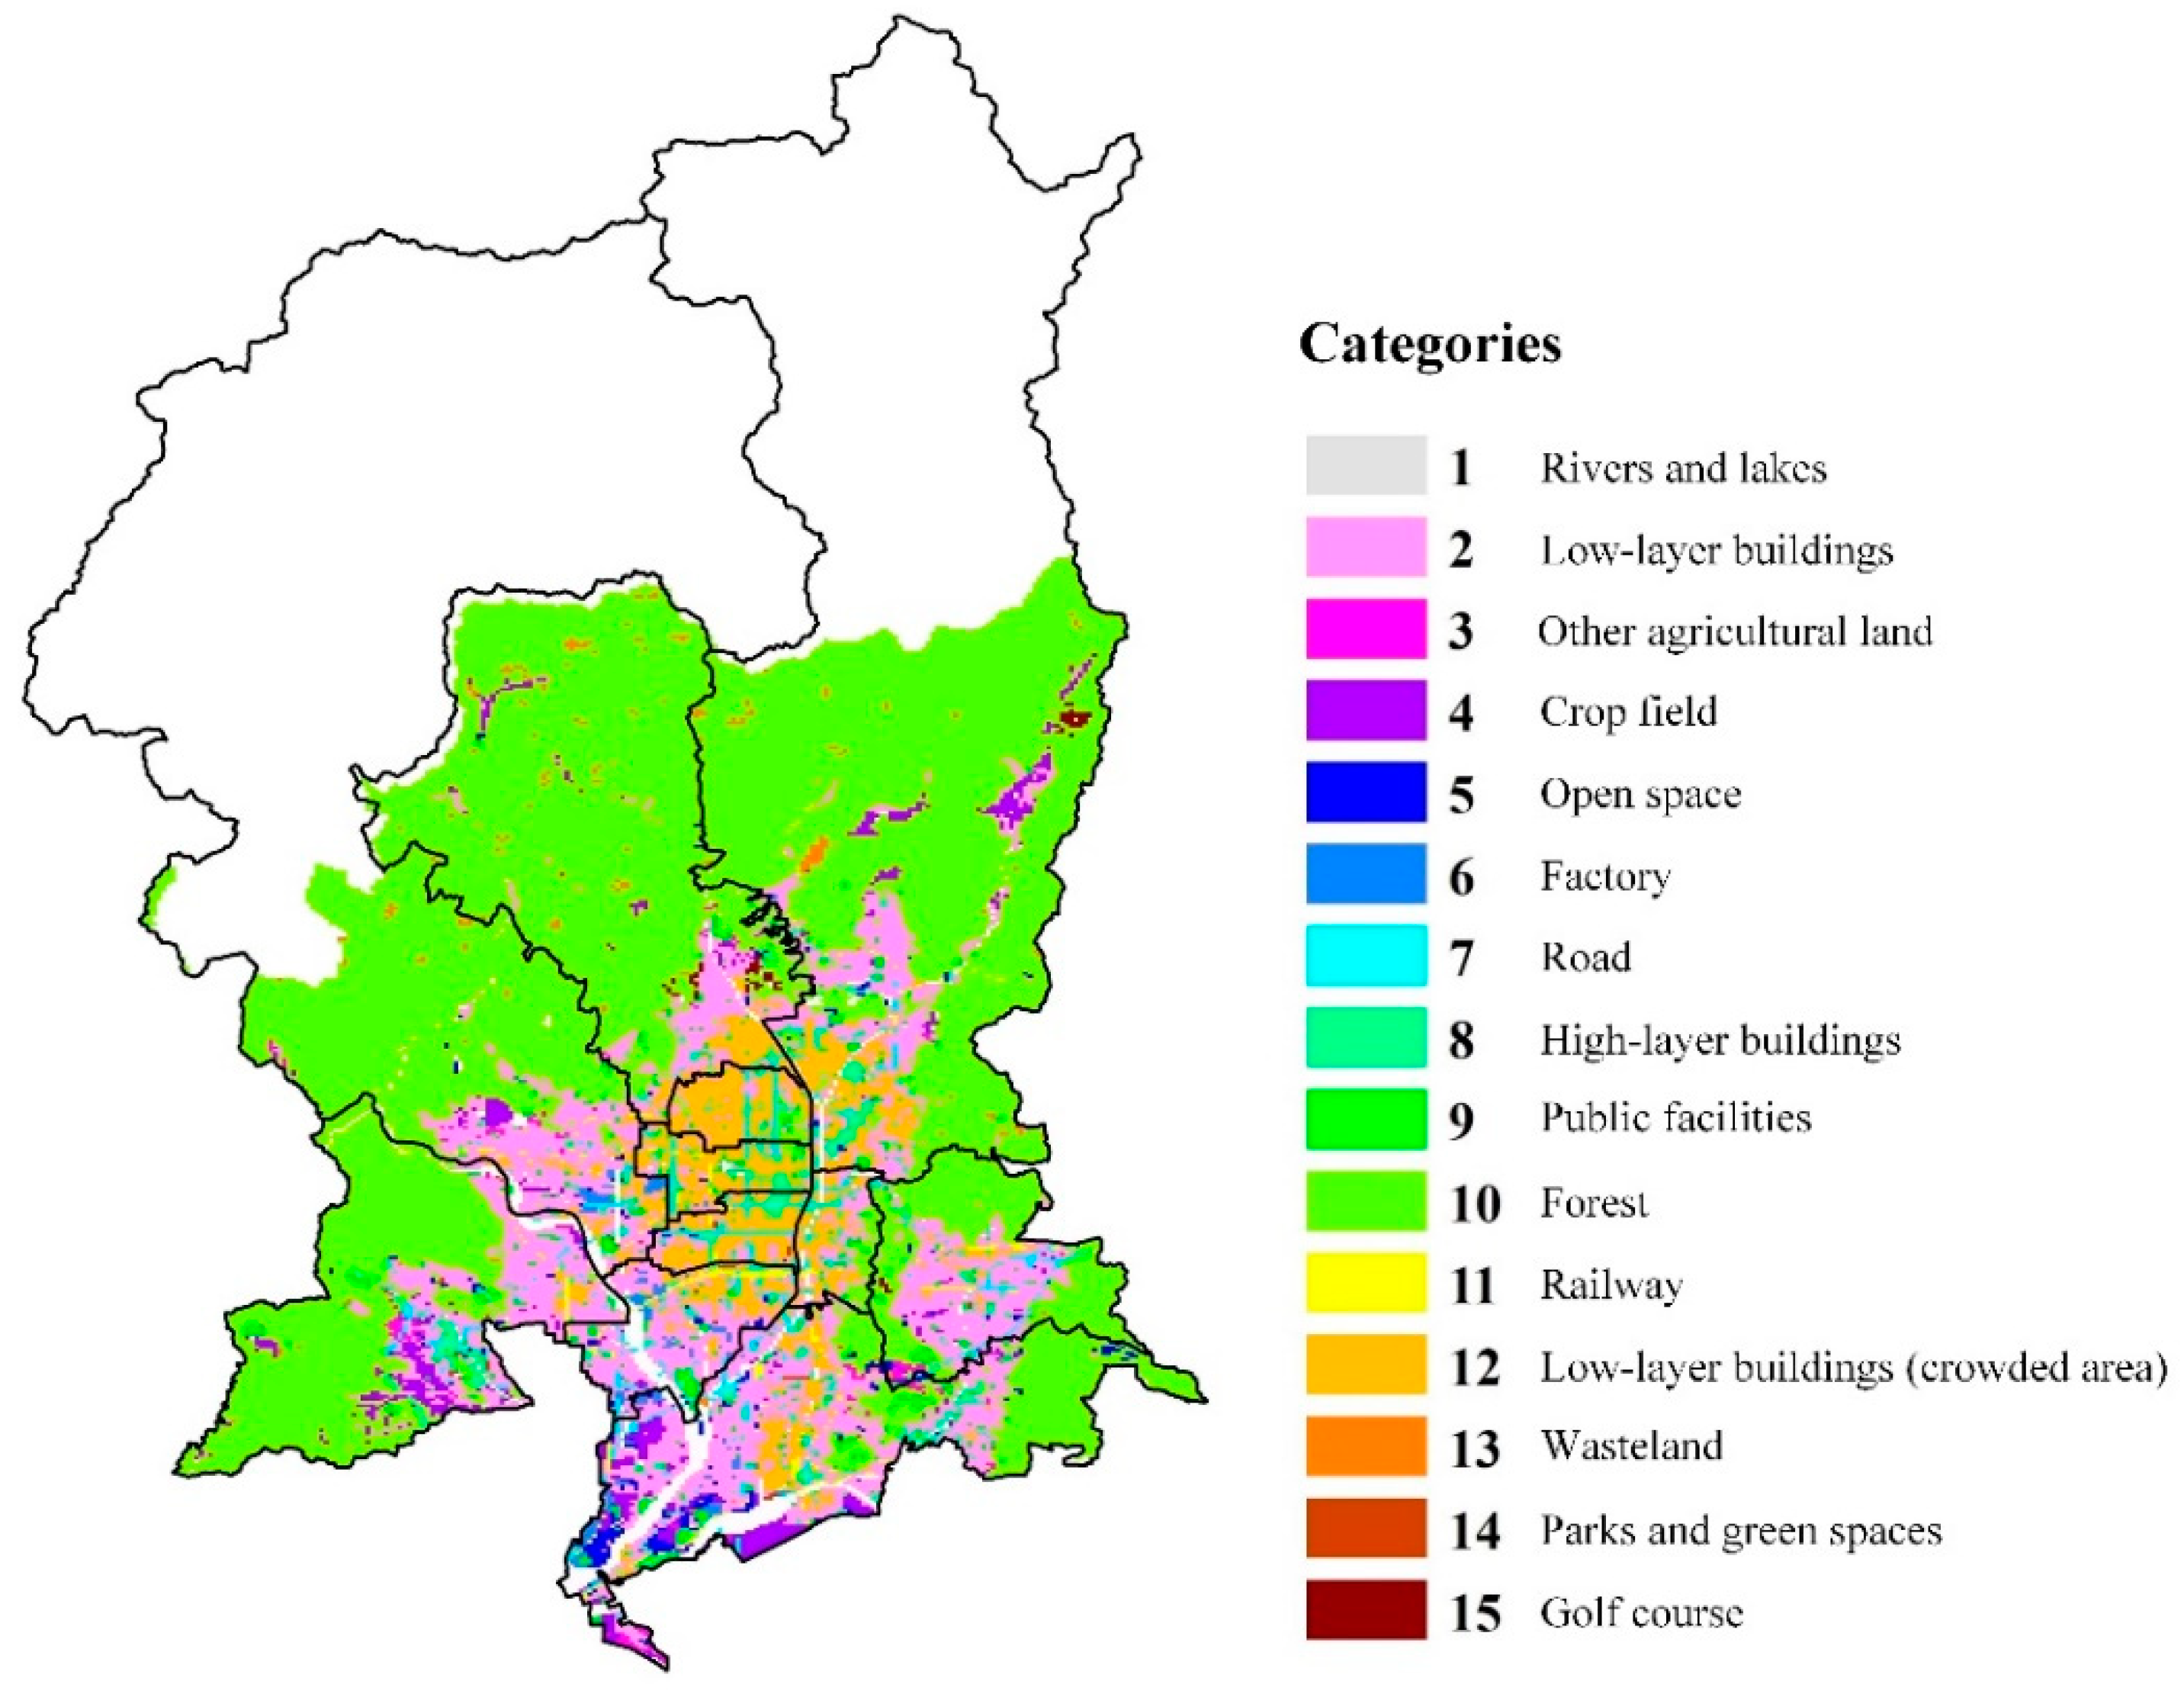
Figure 2 presents the land use map of Kyoto City. As shown in
Figure 2, most of various types of buildings are located near the south of Kyoto City, such as Kamigyo, Nakagyo, and Shimogyo Ward. The categories and definition of land use data are listed in
Table 1, representing the detailed difference of the definition of land use data (e.g., high-layer buildings, low-layer buildings, and so forth).
The Yodo River basin (7280 km2) consists of three tributary river basins, including Katsura, Uji, and Kizu River basins. After the confluence of Katsura River, Kizu River, and Uji River, Yodo River starts near the southern side of Kyoto City, and it flows into the Osaka Bay. The average annual rainfall in the Katsura River and the Kizu River basins is approximately 1640 and 1590 mm, respectively. The average annual rainfall in the Yodo River was about 1387.8 mm between 1976 and 2000. The Kamo River basin (KRB) (210 km2), situated at Kyoto city, is a sub-basin of the Katsura River basin in Yodo River Basin. Flood prevention activities at the KRB have already been paid attention to by the Japanese government because the KRB usually floods during heavy precipitation and typhoons.
From 15 to 16 September 2013, Kyoto City experienced extreme rainfall during Typhoon No. 18. During the first 6 h at the beginning of the event, water levels reached threatening flood situations in Katsura River and Uji River. The Arashiyama area near the Katsura River was also flooded. It should be realized that the analysis of rainfall conditions which might cause higher peak discharge and the influence of land-use change which might lead to more severe flood disasters is relatively crucial for flood prevention. Therefore, Kyoto City, situated near the basins in Japan, is adopted as the study area in this paper.
2.2. Database of Hazard Map
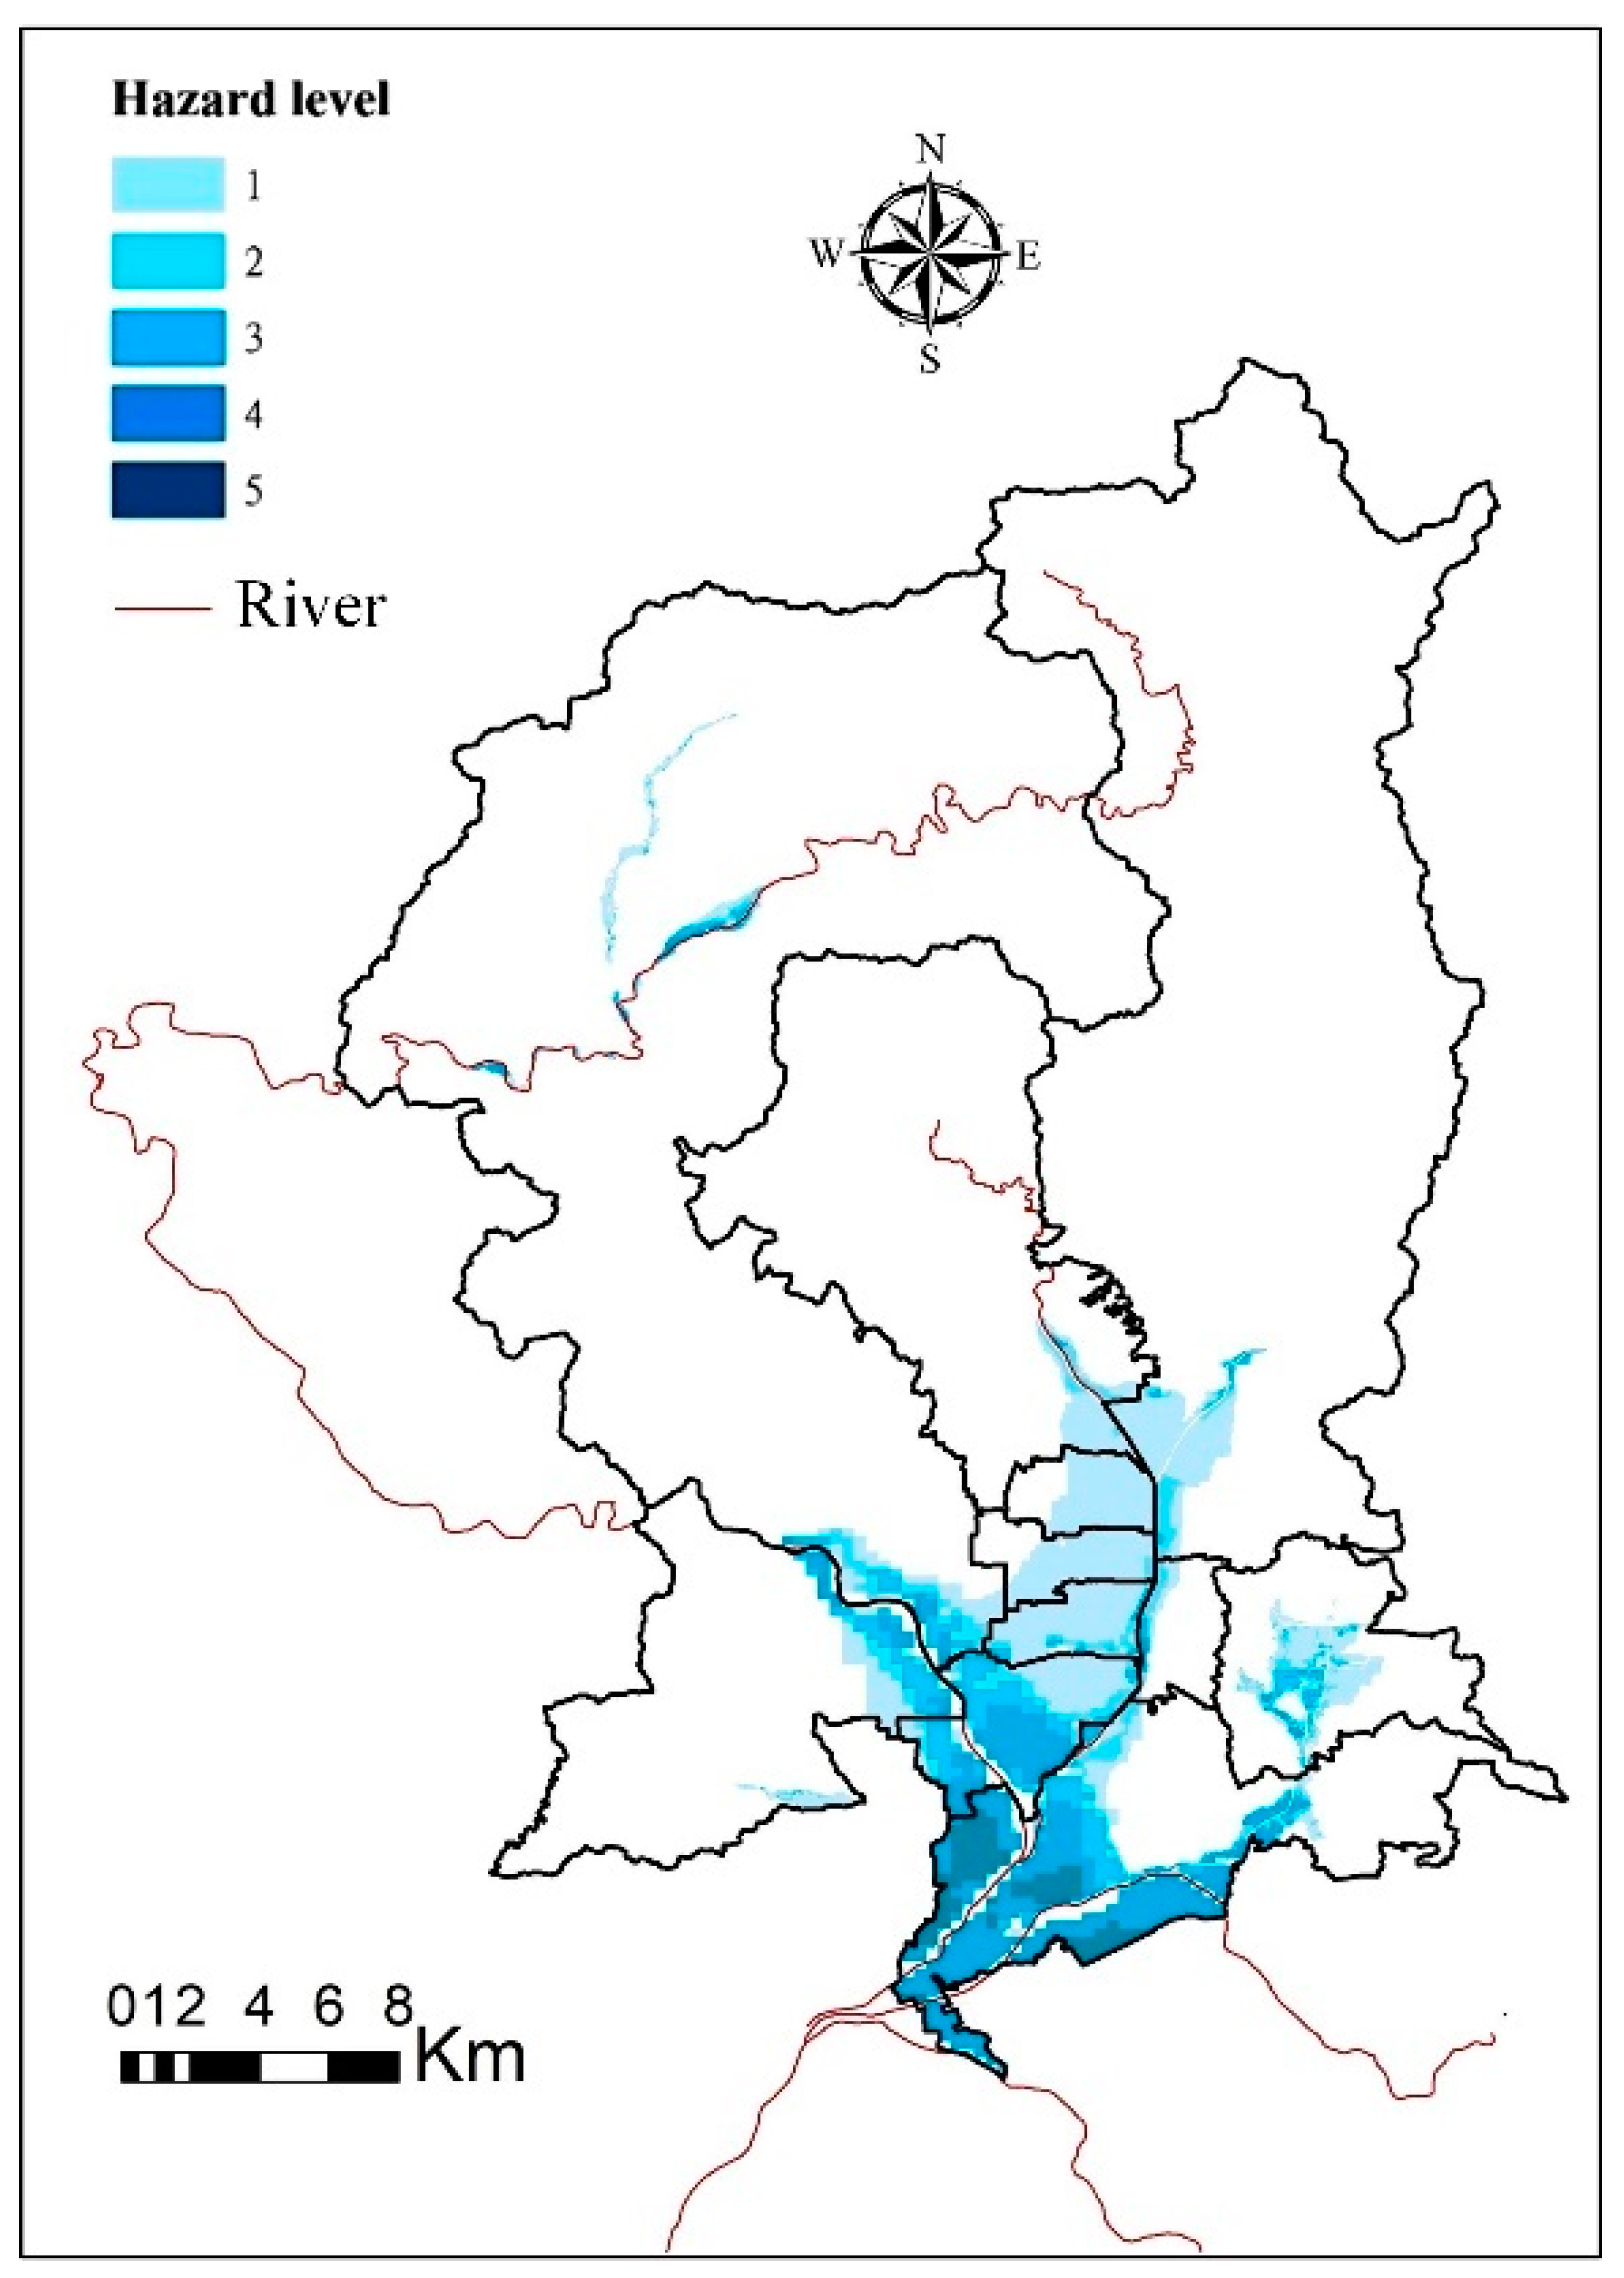
The river flooding hazard map can be downloaded from the open data website, National Land Numerical Information Download Service (NLNIDS) sponsored by National Land Information Division, National Spatial Planning and Regional Policy Bureau, Ministry of Land, Infrastructure, Transport and Tourism (MLIT) of Japan. The hypothetical potential river flooding situation specified by the national or prefectural river manager or rivers with known water levels was provided from the NLNIDS website, as shown in
Figure 3. According to different ranges of inundation depths, the hazard levels were defined, and their definitions and reasonable descriptions are presented in
Table 2. As shown in
Figure 3, the flood inundation occurred in the upstream region of Katsura River, and apparently in the downstream regions of Katsura River, Kamo River, Uji River, and Kizu River, especially in Fushimi and Minami wards with hazard levels 4 or 5. Secondly, most of the areas in Yamashina, Kamigyo, Nakagyo, and Shimogyo wards have hazard levels 1 and 2, yet some areas in those wards have hazard level 3. It should be noticed that most of the aforementioned regions have a relatively high population density.
2.3. Demographics for Exposure
The historical data of population density in 2015 were collected from the product of the annual national population survey, Esri Japan Data Content. Compared to the primary indicators, more detailed statistical indicators such as marital status and foreign population were included in the product. Statistical analysis can be performed immediately with ArcGIS because the polygons such as towns and statistical tables are combined and recorded in advance. National and regional versions are available. In addition, the future data of population density for the years 2020, 2025, and 2030 are collected from the product of the expected future population, Esri Japan Data Content. The future population data every five years estimated based on the gender, the age-specific survival rate, and the net migration rate. The population changes in the future can be visually demonstrated for users. All of the estimates are based on the census and the National Institute of Population and Social Security Research (NIPSSR). Polygons and estimation indicators are also provided in a file geodatabase format, so they can be used immediately for analysis in ArcGIS.
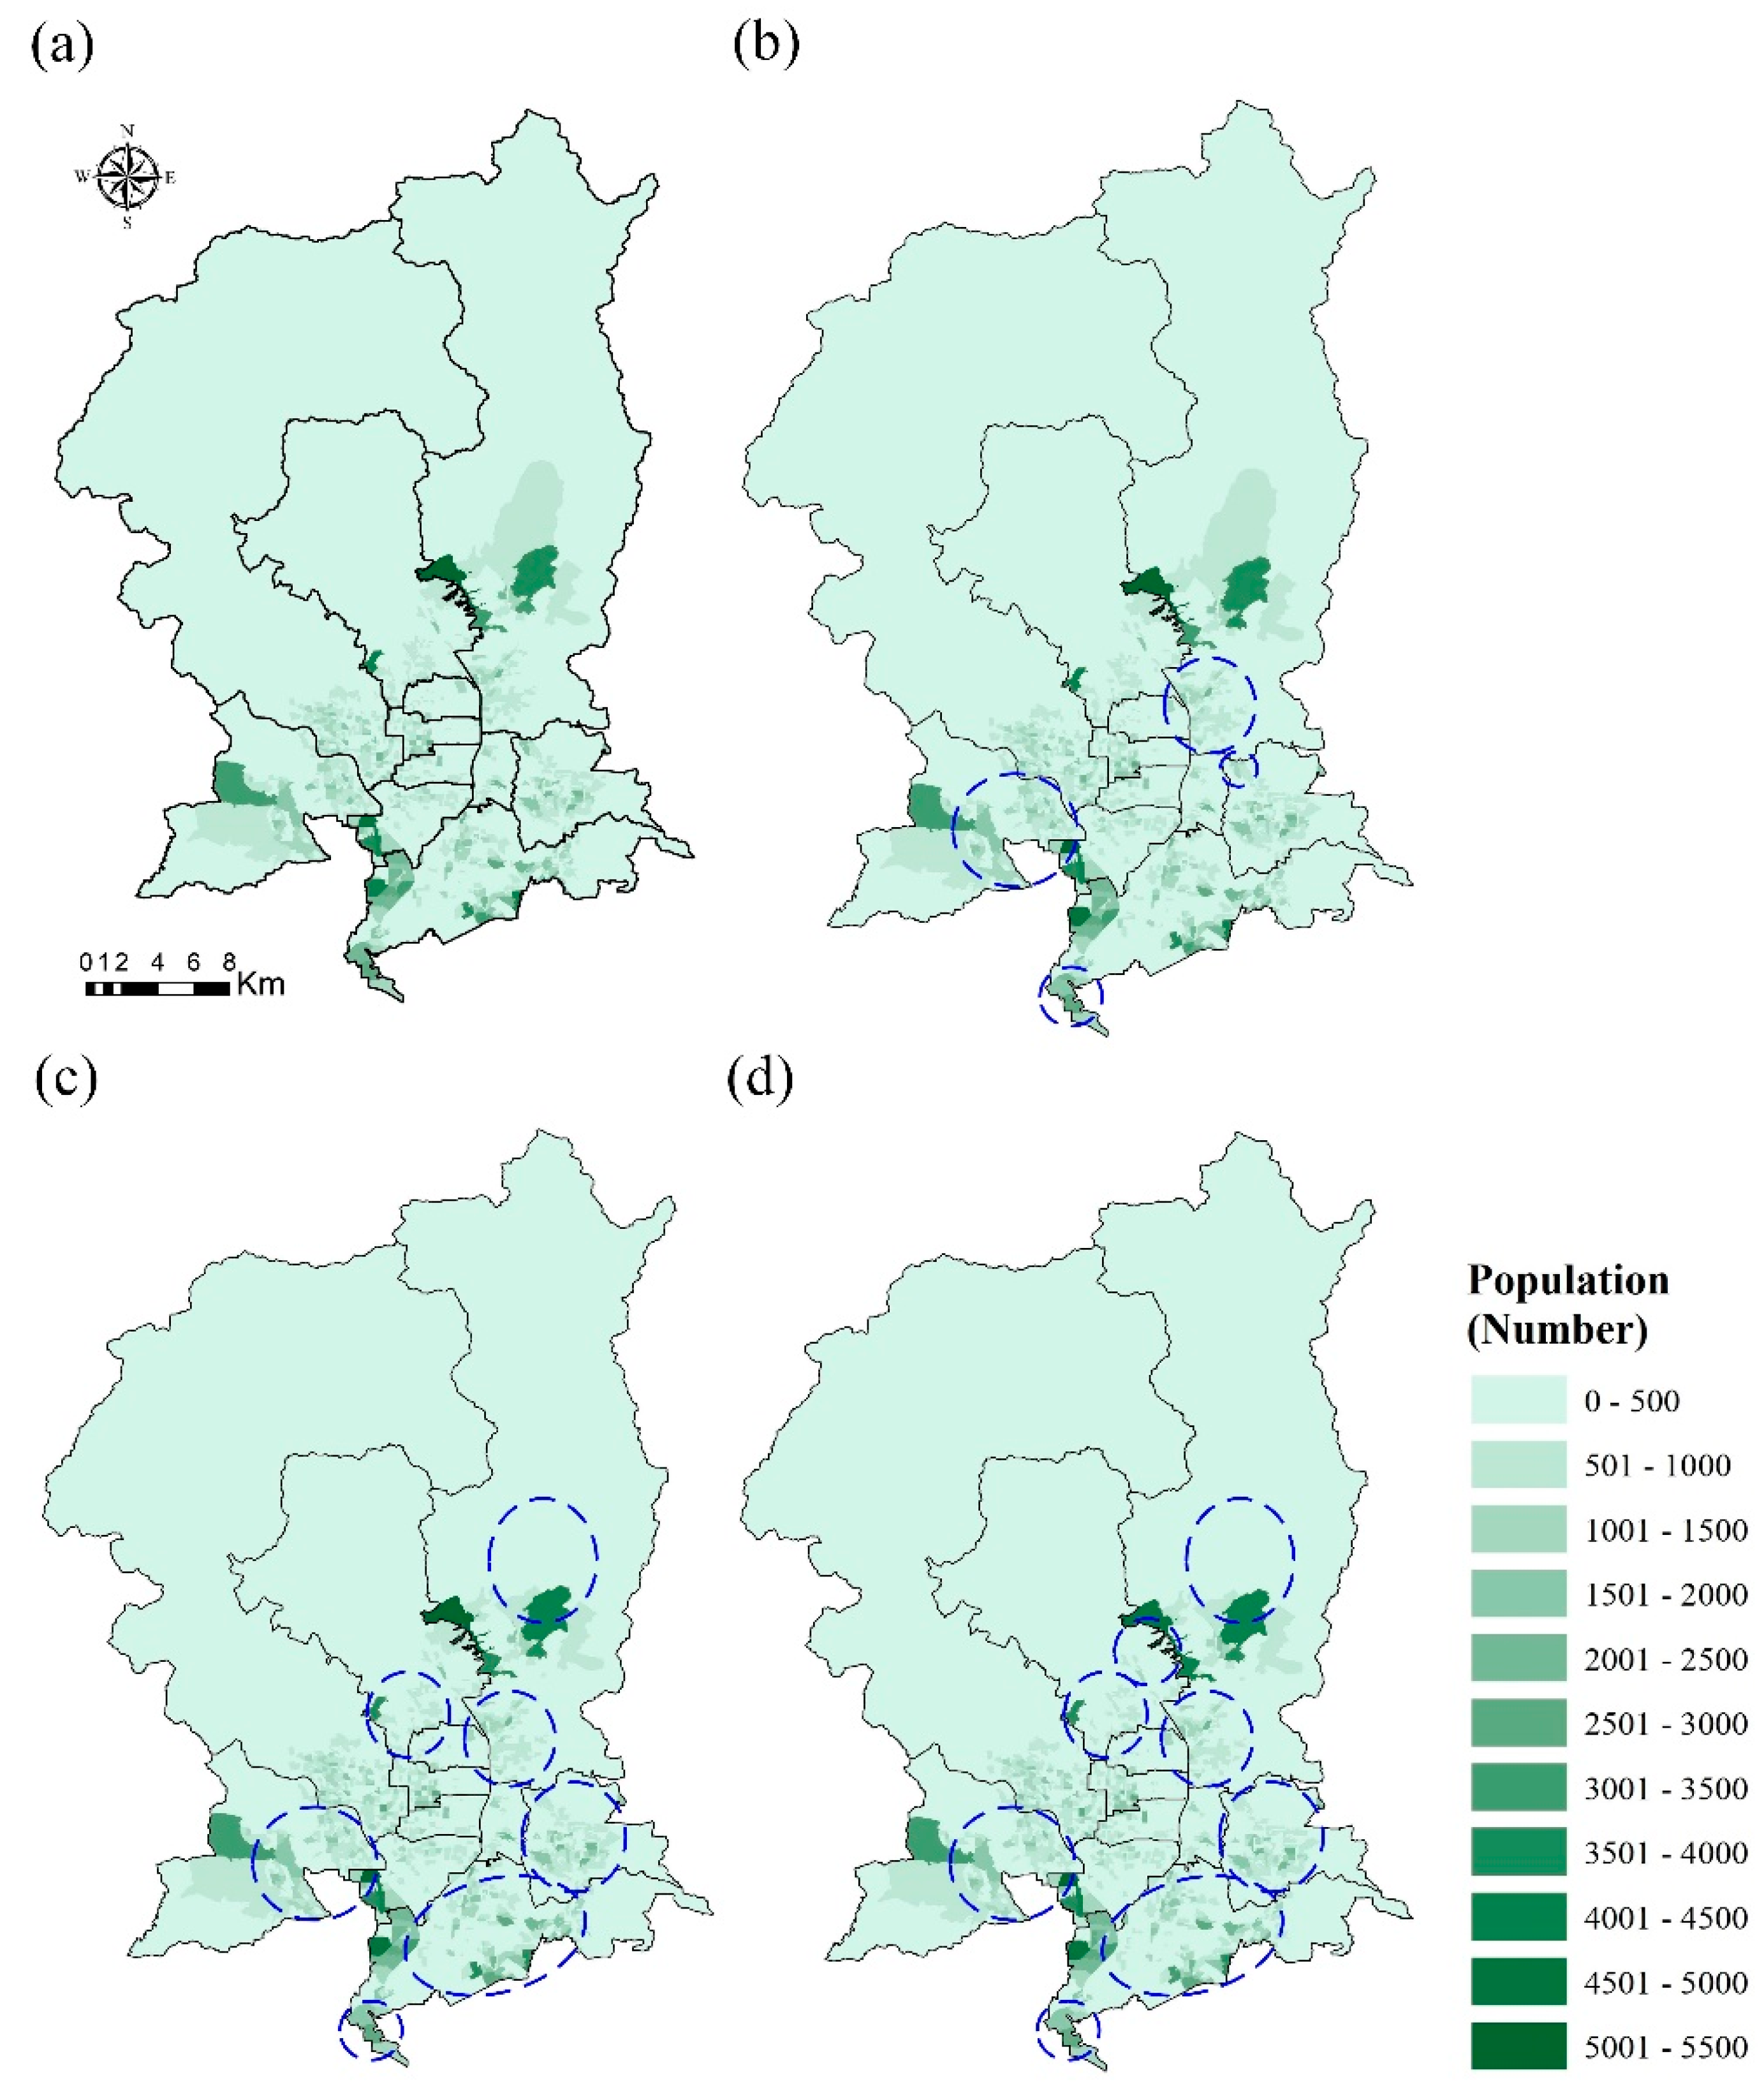
Historical and future data of population density for the exposure component during 2015, 2020, 2025, and 2030 at towns in Kyoto City are shown in
Figure 4. As shown in
Figure 4, compared to the population density data in 2015, the area with lower population density will gradually increase from 2020 to 2030. In 2020, the population density will slightly decrease in some regions of Yamashina, Sakyo, Nishikyo, and Fushimi wards. In 2025 and 2030, the population density will additionally decrease in some regions of Kita and Fushimi wards. Apparently, the decreasing trend of the population will happen in the next decade. In this paper, residents are the protected target, and the spatial distribution of population density is defined as the exposure.
2.4. Vulnerability Indicators
The assessment of vulnerability and climate risk may cause confusion as vulnerability is one of the components for assessing climate risk [
24]. Tung et al. [
23] proposed that vulnerability is primarily defined as the integration of sensitivity and adaptive capacity (AC) of the protected target. Sensitivity is defined as the characteristics of the protected target, meaning that the sensitivity would be relatively high if climate hazard events easily affect the protected target. On the other hand, the options of governments for mitigating the impact of the hazard on the target are considered as adaptive capacity.
To adapt to climate change, the identification of suitable adaptive capacities is a crucial step. As shown in
Table 3, six categories of adaptive capacity were primarily listed. The insurance industry has been increasingly paid attention to assisting societies to be more resilient [
25,
26]. The arrangement of awareness programs, evacuation drills and evacuation shelters is a disaster response strategy for disaster prevention [
27]. Moreover, understanding the production of local knowledge of flood forecasting and providing real-time notification of flooding alerting system are beneficial for decreasing the impact of flood disaster on the lives of people [
28]. Meng et al. [
29] indicated that the integration of flood risk in spatial planning is another approach for improving the resilience of cities against the increasing intensity of flood hazards, even though its implementation is still challenging. In addition, hydraulic engineering and low-impact development (LID) for preventing flood risk are also seen as essential processes for flood risk mitigation [
30,
31].
As to the sensitivity of vulnerability, the five suitable categories of sensitivity are used herein. The population of young children below 15 years and older people over 65 years falls under the category of sensitivity because of the height of young children and the slow action of elders [
23,
32]. Crichton [
26] mentioned that between 1975 and 2001, 99 percent of deaths (over 250,000 people) due to floods were people from low-income groups. Additionally, total economic losses due to disasters in poorer countries are close to 14 percent of gross domestic product (GDP), yet the losses in more prosperous countries are usually less than 2 percent of GDP. Furthermore, the population of people with a physical disability and the female to male ratio are also considered. To comprehensively discuss the potential adaptation strategies, these five categories of sensitivity in
Table 3 are therefore taken into account as indicators in this paper.
2.5. Future Scenarios of Sensitivity
For flood prevention and mitigation, useful information about future risk and the difference between current and future risks are quite important for decision makers. Because of the collection of future data of population density (see
Section 3.3), the future data of the population of young children and older people and female to male ratio were provided as well. However, the categories of poverty level and population for people with physical disability lack future data, which should be reasonably assumed and estimated. In this study, linear regression (LR) analysis was used to capture the trend of the two variables by using historical data points for each administrative ward of the city. Then, we assumed that the future data of these two variables are the data points located at the linear extrapolation of the trend analyzed by LR, which means that the assumption was based on the historical trend poverty level and population for people with a physical disability.
Table 4 shows the statistics of the poverty level and population for people with a physical disability based on the historical data covering seven years (2009–2015) and 15 years (2004–2018) in each ward, respectively. As shown in
Table 4, compared to minimum and maximum values, the standard deviation is relatively smaller, indicating that the dramatic change in these two variables in each ward is not extremely obvious and relatively smooth. It is a reasonable explanation of why to use this method herein.
3. Generalized Assessment Framework
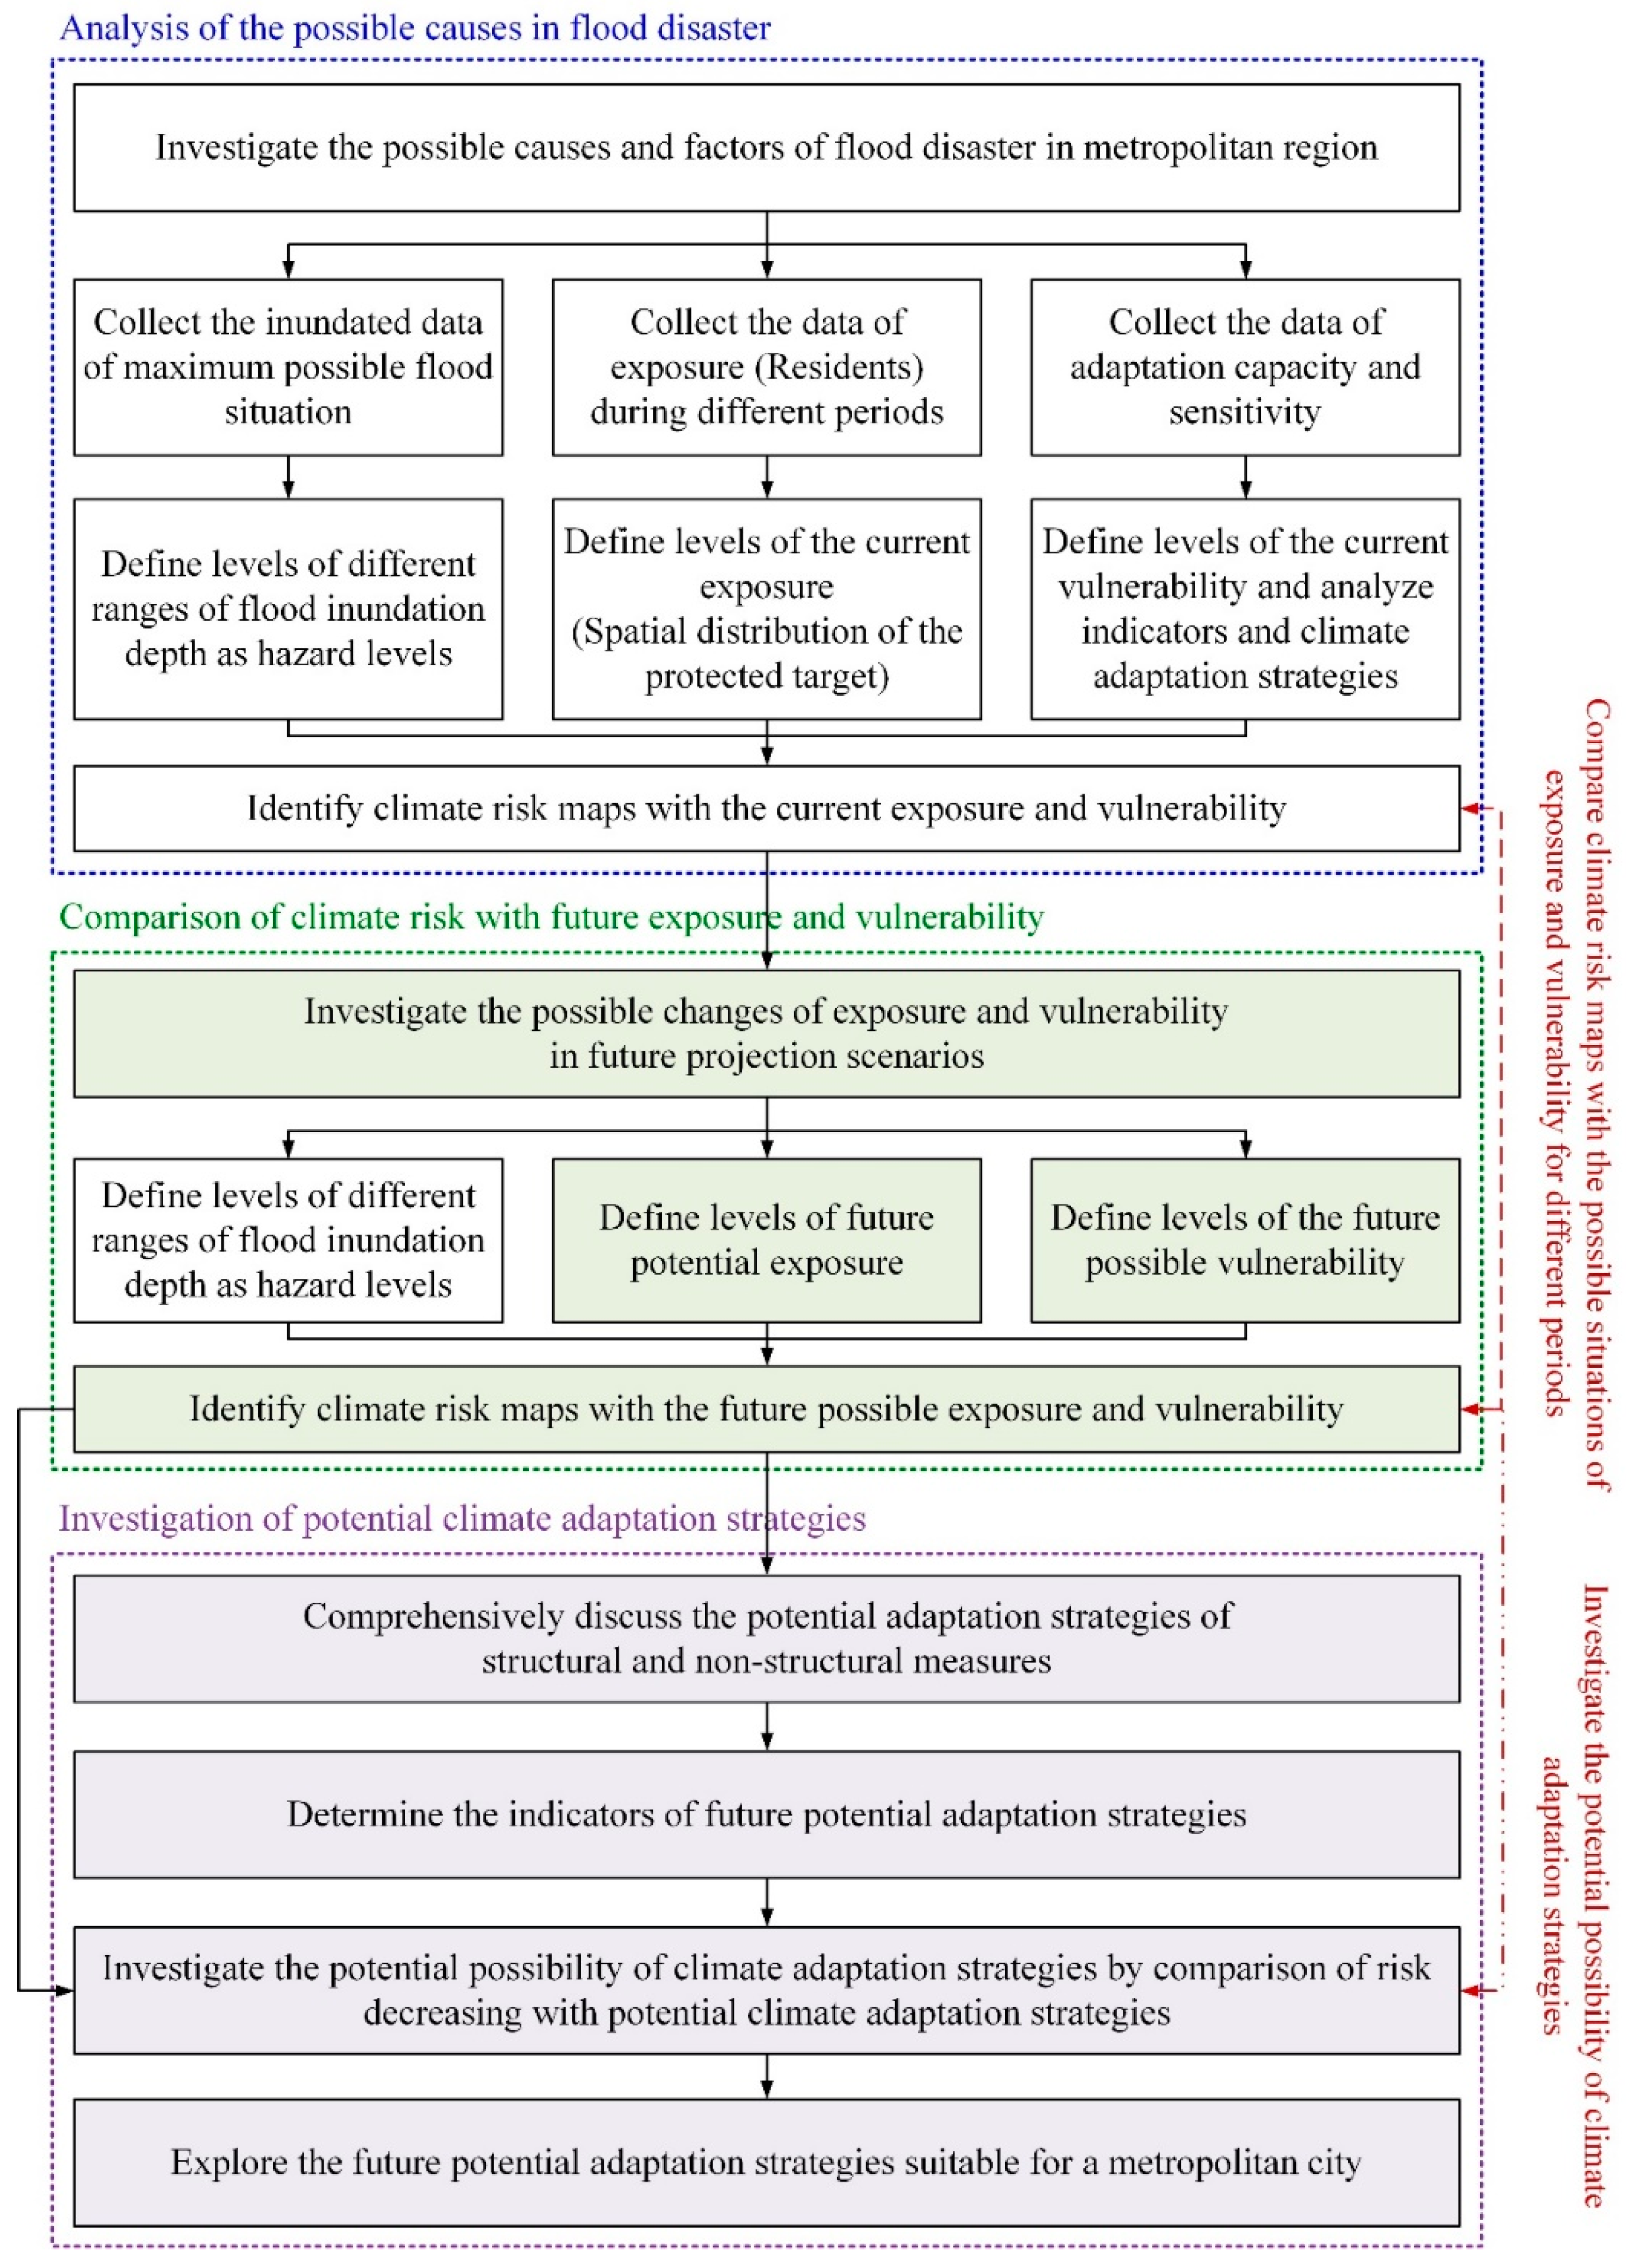
The flowchart of the proposed approach for assessing climate risk and potential climate adaptation strategies is presented in
Figure 5. Several reasonable explanations for using the proposed approach include the proposed approach being able to: (1) assist decision-makers (e.g., different governance levels) to comprehensively understand the causes of climate risk, (2) produce rational climate risk maps with the current exposure and vulnerability by the quantitative analysis approach, (3) primarily focus on the investigation of the possible change of climate risk resulted from various exposure and vulnerability based on the assumption of the same hazard, and (4) analyze the effect of different potential climate adaptation strategies on climate risk.
As shown in
Figure 5, the possible causes and factors of flood disaster are firstly investigated by systematical integration. The inundated map with maximum possible flood situation, the exposure data, and the data of adaptive capacity and sensitivity shall be collected for the identification of climate risk maps with the current exposure and vulnerability. Second, the possible changes in exposure and vulnerability in future projection scenarios are also analyzed to generate climate risk maps with the future possible exposure and vulnerability for comparison of the maps with the current situation. Third, the potential adaptation strategies of structural and non-structural measures are identified and comprehensively discussed to determine the indicators. Finally, the climate adaptation strategies are investigated by comparison of a decrease in risk with potential strategies.
The proposed approach has several advantages for assessing flood risk and suitable strategies, such as: (1) the generalized framework is proposed based on the core concept of climate risk template in order to help readers to clearly understand the components of hazard, exposure and vulnerability; (2) in addition to the qualification analysis, the quantification approach for reasonably and efficiently determining different levels of hazard, exposure and vulnerability is also integrated in the framework; (3) the results of climate risk maps are visually presented to assess the spatial-temporal relationship of climate risk with simultaneously considering vulnerability and adaptive capacity.
3.1. Identification of Possible Causes in Flood Disaster
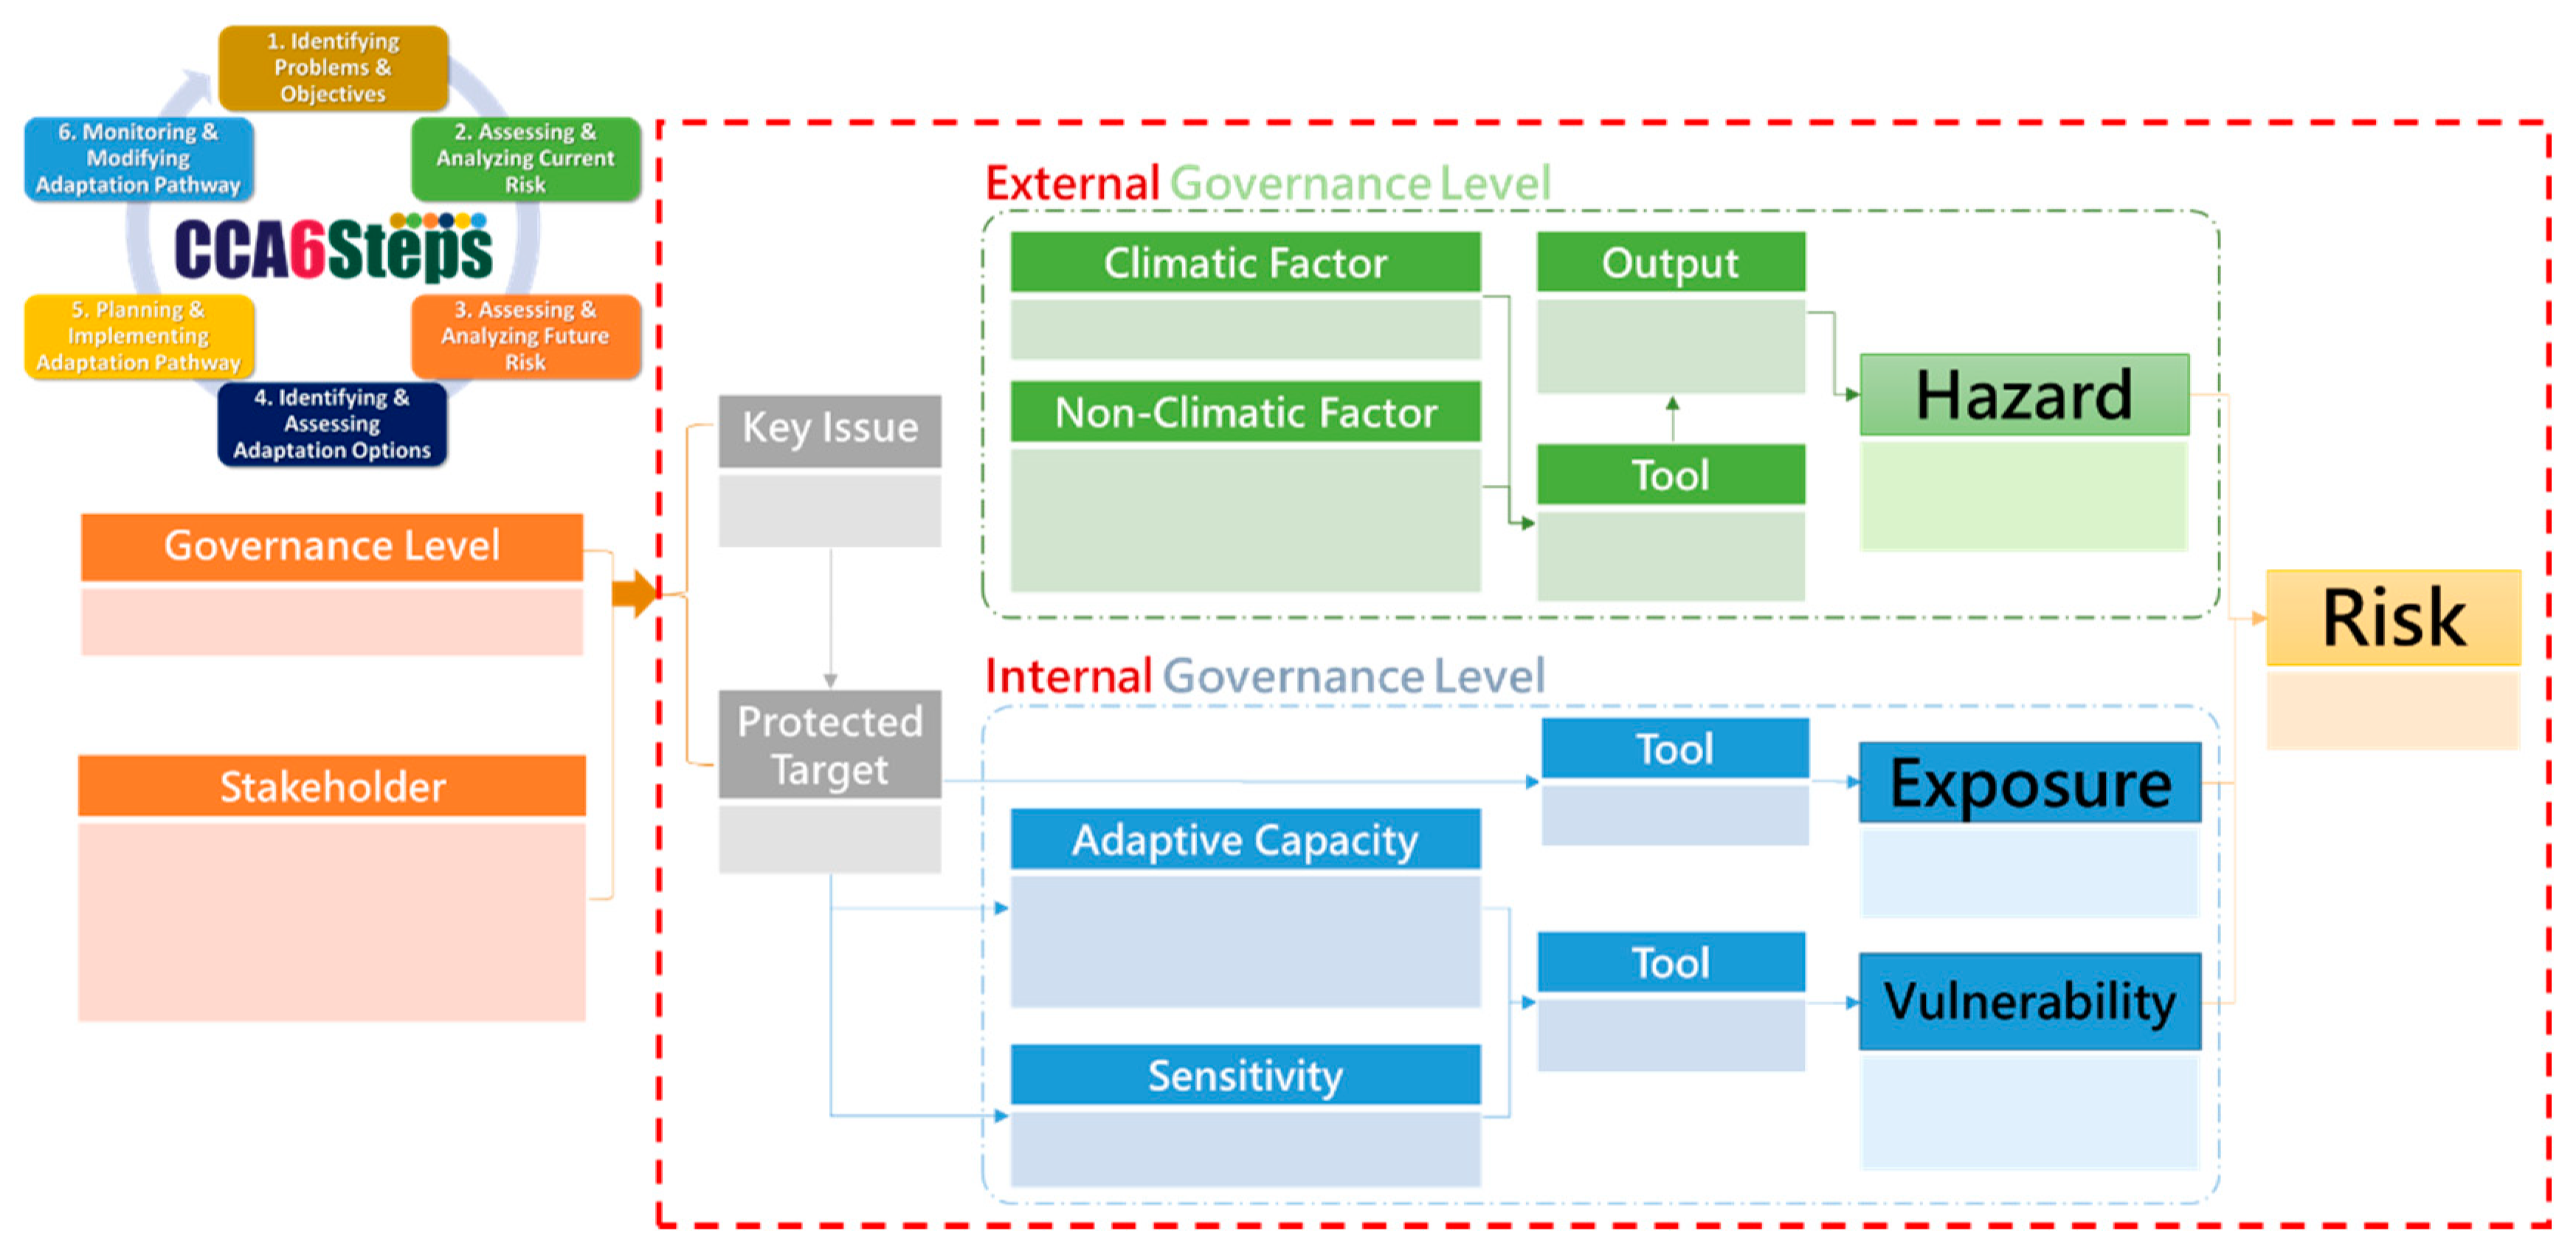
Climate risk is defined by [
33] as the interaction of hazard, exposure, and vulnerability. Risk is also the potential adverse consequences on lives, livelihoods, health, ecosystems, economic, social and cultural assets, and infrastructure as the outcome is uncertain. The climate risk template, initially developed by Tung et al. [
23], assists users to identify the factors of climate risk for various research fields based on the definition of climate risk proposed by [
33]. The template is utilized as a climate risk assessment tool to analyze all possible causes of flood disasters, as shown in
Figure 6.
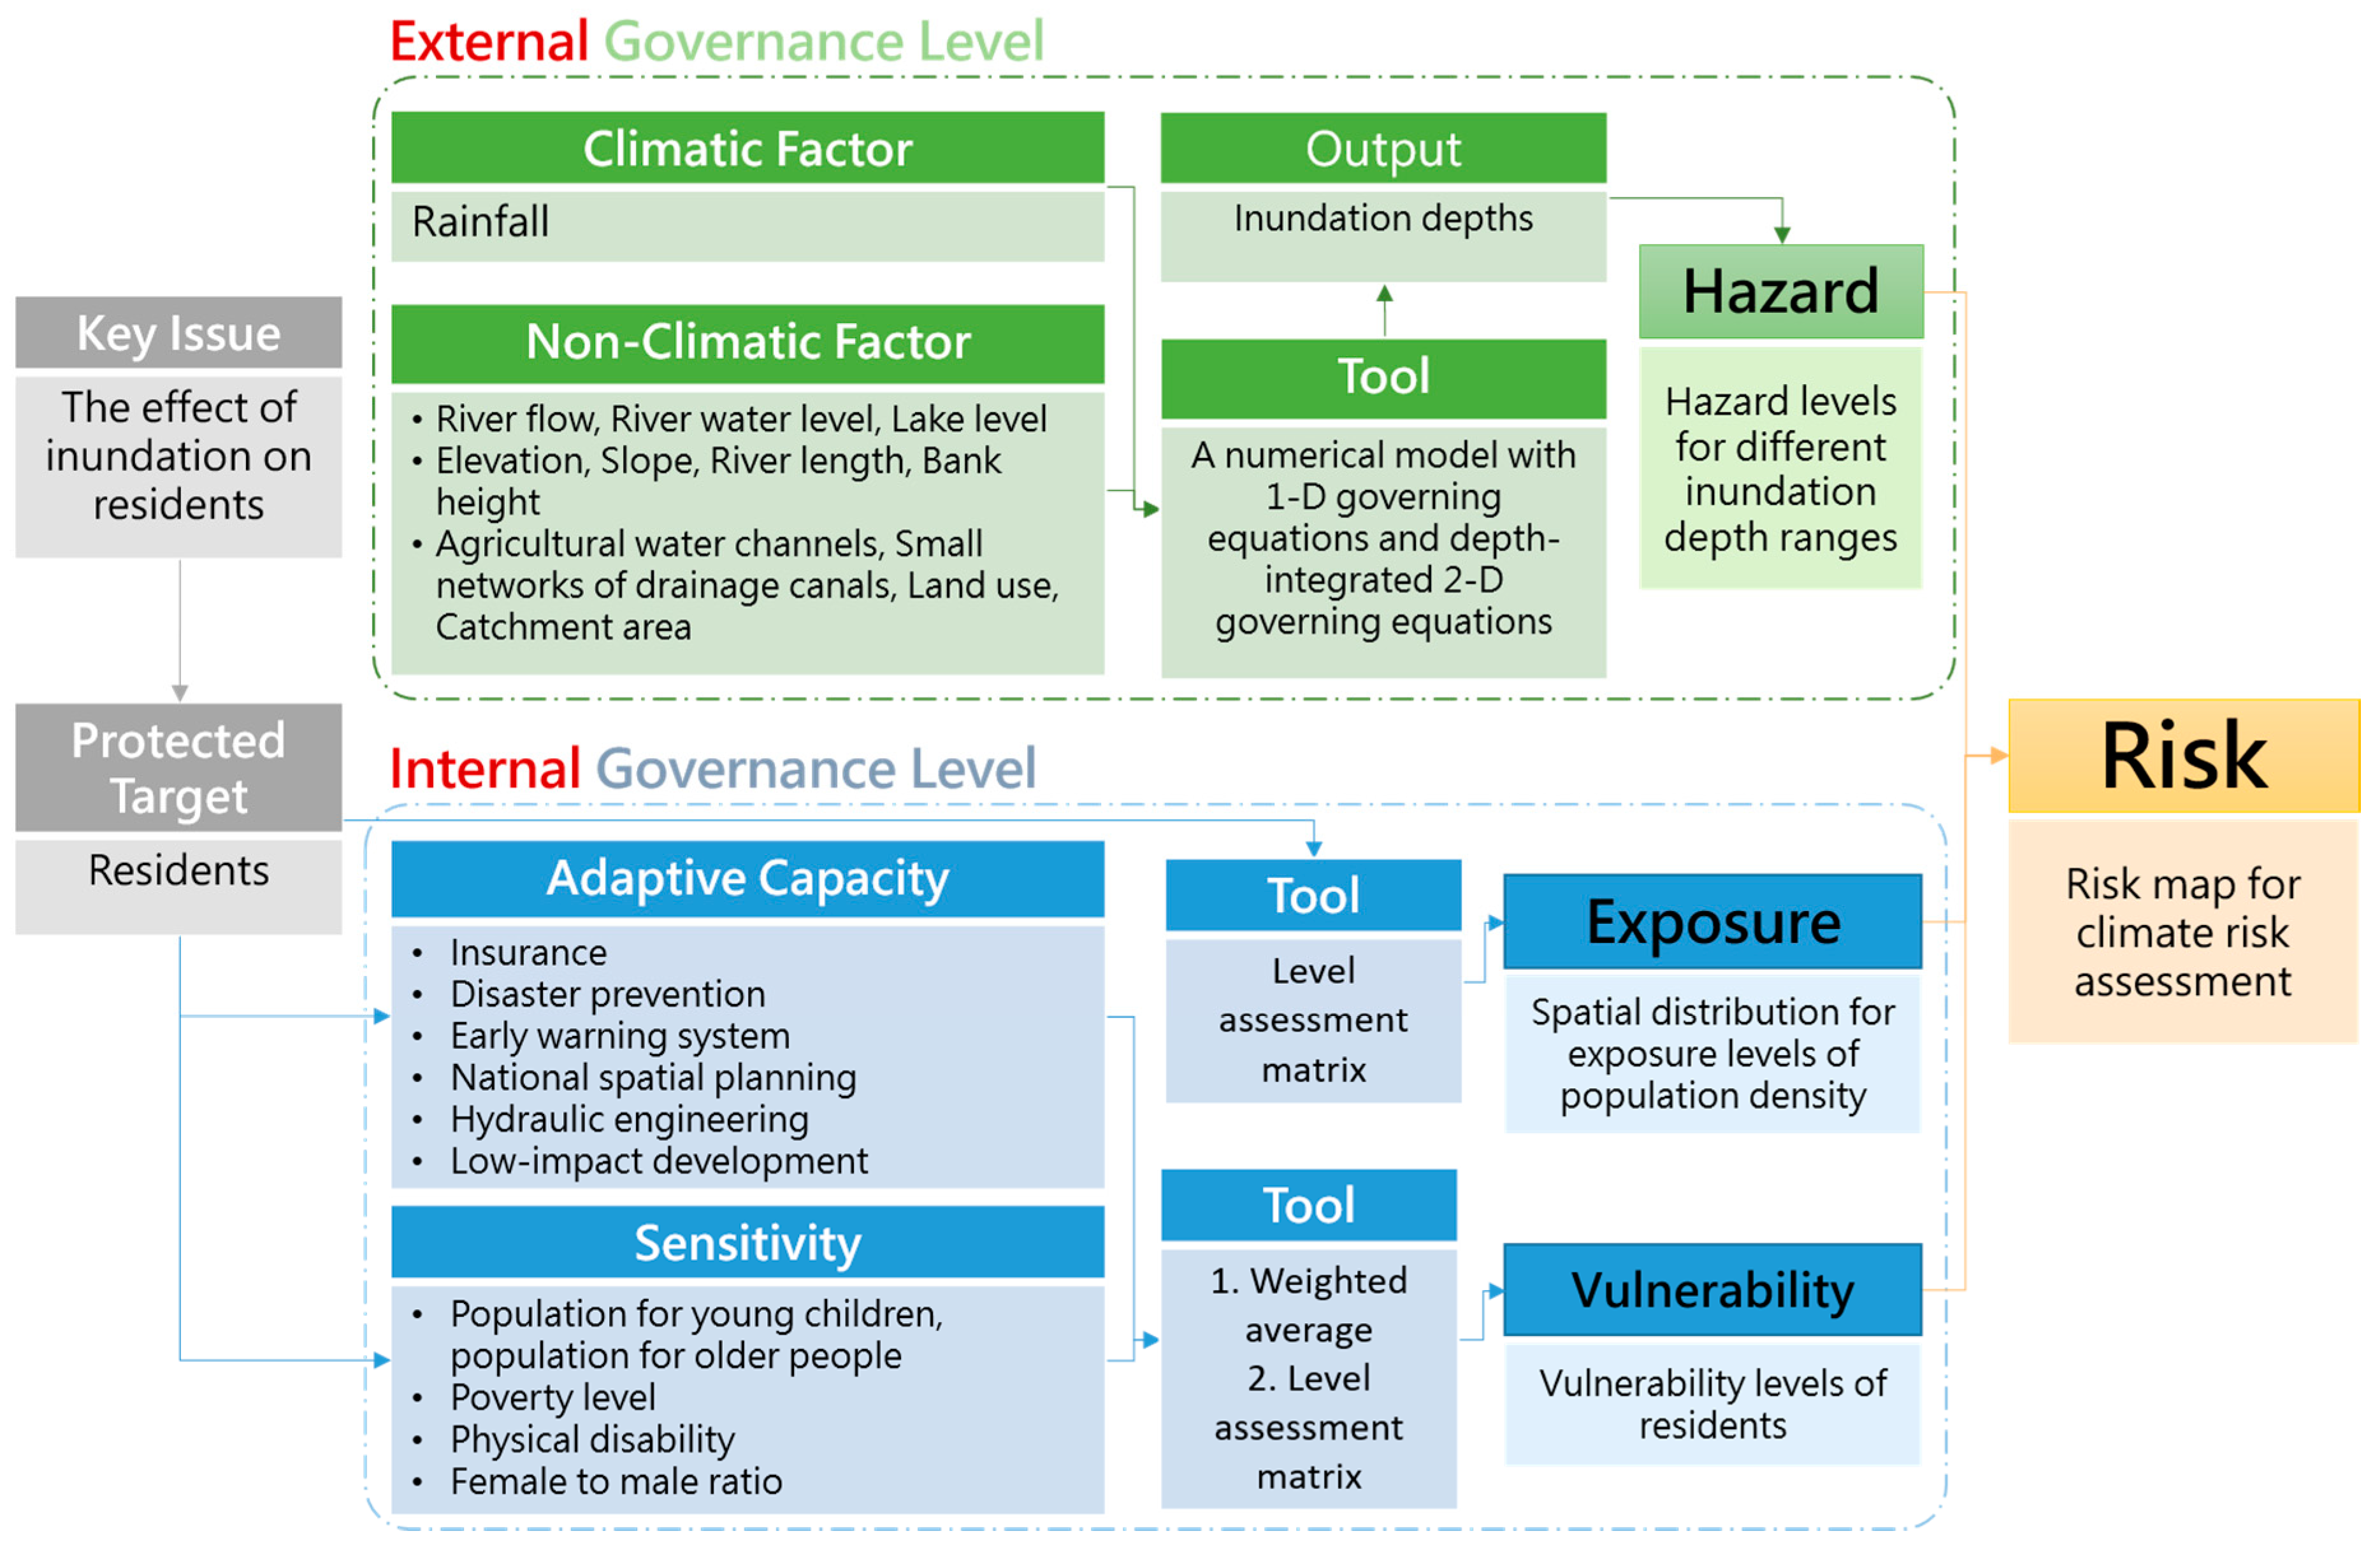
Table 5 is the list of the explanations of each item in the climate risk template. In this paper, we primarily focus on the discussion of the possible causes of a flood disaster by utilizing the items in the red dotted box.
As shown in
Figure 6, the key issue and the target on which we focus should be evidently determined. Moreover, not only the climatic factors are considered, but also the non-climatic factors should be clearly taken into account for assessing hazard in the outer system. In the inner system, the exposure is defined as a spatial distribution of the protected target. The vulnerability is composed of adaptive capacity, adaptation options of the protected target and governance level, sensitivity, and the features/characteristics of the protected target. In addition to the relationship between factors, the tools used to quantify hazard, exposure, and vulnerability are also essential and should be listed for users. In this study, the possible causes of flood disasters in a case study are comprehensively highlighted.
3.2. Assessment of Climate Adaptation Strategies
To investigate the potential effect of climate adaptation strategies on climate risk, the potential climate adaptation strategies should be reasonably assessed and compared to climate risk maps without adaptation options. The adaptive capacity to which the government can adopt is diverse, such as insurance, disaster prevention, early warning systems, national spatial planning, hydraulic engineering, and low-impact development, as shown in
Table 3. However, the results might have higher uncertainty by the assumption of assessing all climate adaptation strategies because of the difficulty in data collection (e.g., long-term insurance data), different types of data format, and different spatial-temporal data scales, etc. Therefore, to assess reasonable climate adaptation strategies, the LID techniques, such as rainwater storage, green roofs, permeable pavements, and detention ponds, were adopted as the potential adaptation capacity in this study. The LID has been increasingly focused on stormwater management. This study considered the following four options as the LID: (1) rainwater storage; (2) green roof units; (3) permeable pavement; (4) detention pond.
Rainwater storage and green roof units are frequently used to collect roof runoff during nonwinter seasons in green building designs [
34,
35]. The installation of permeable pavement facilities would be effective for urban runoff mitigation because the facilities are easily able to adapt for road and public facilities [
36,
37]. In addition, detention ponds can combine stormwater with parks and open spaces [
38]. Hence, these four countermeasures corresponding to the categories of land use in a section of a ward were selected and four adaptation strategies, AS1, AS2, AS3, and AS4, applying the above four measures with different prioritization (ranking), were considered for Kyoto City, as shown in
Table 6. In this paper, the score values of different adaptation strategies were calculated as the AC value for quantitatively evaluating the vulnerability level. The ratio of land-use area for each section of a village can be written as
where
RA means the ratio of land use area;
Ai is the area for the category
i of land use;
Atotal denotes the entire area in the section; and
NLU means the number of the land use categories. The
NLU used in this study is equal to 7, based on
Table 6. Then the score value of an adaption strategy could be written as
where
means the score value of the
jth adaptation strategy;
Rk is the ranking of
kth measure;
denotes the number of measures considered (four in this study);
denotes the number of land use types applied with the
kth measure;
is the
kth weight; and
denotes the number of adaptation strategies. The weights of the different rankings for each year are shown in
Table 7.
It is worth mentioning that the interval of weight in 2015, 2020, 2025, and 2030 is equally set as the same for each ranking. In the final year (2030), the weights for all ranking are set from 0.2 to 0.8 because of the assumption that the government would not be able to totally implement the adaptation strategies with the first and the last priorities. We also assume that all adaptation strategies with their priority should be executed rather than implementing only one strategy at a time to reduce climate risk.
3.3. Quantification Analysis for Spatial Risk Assessment
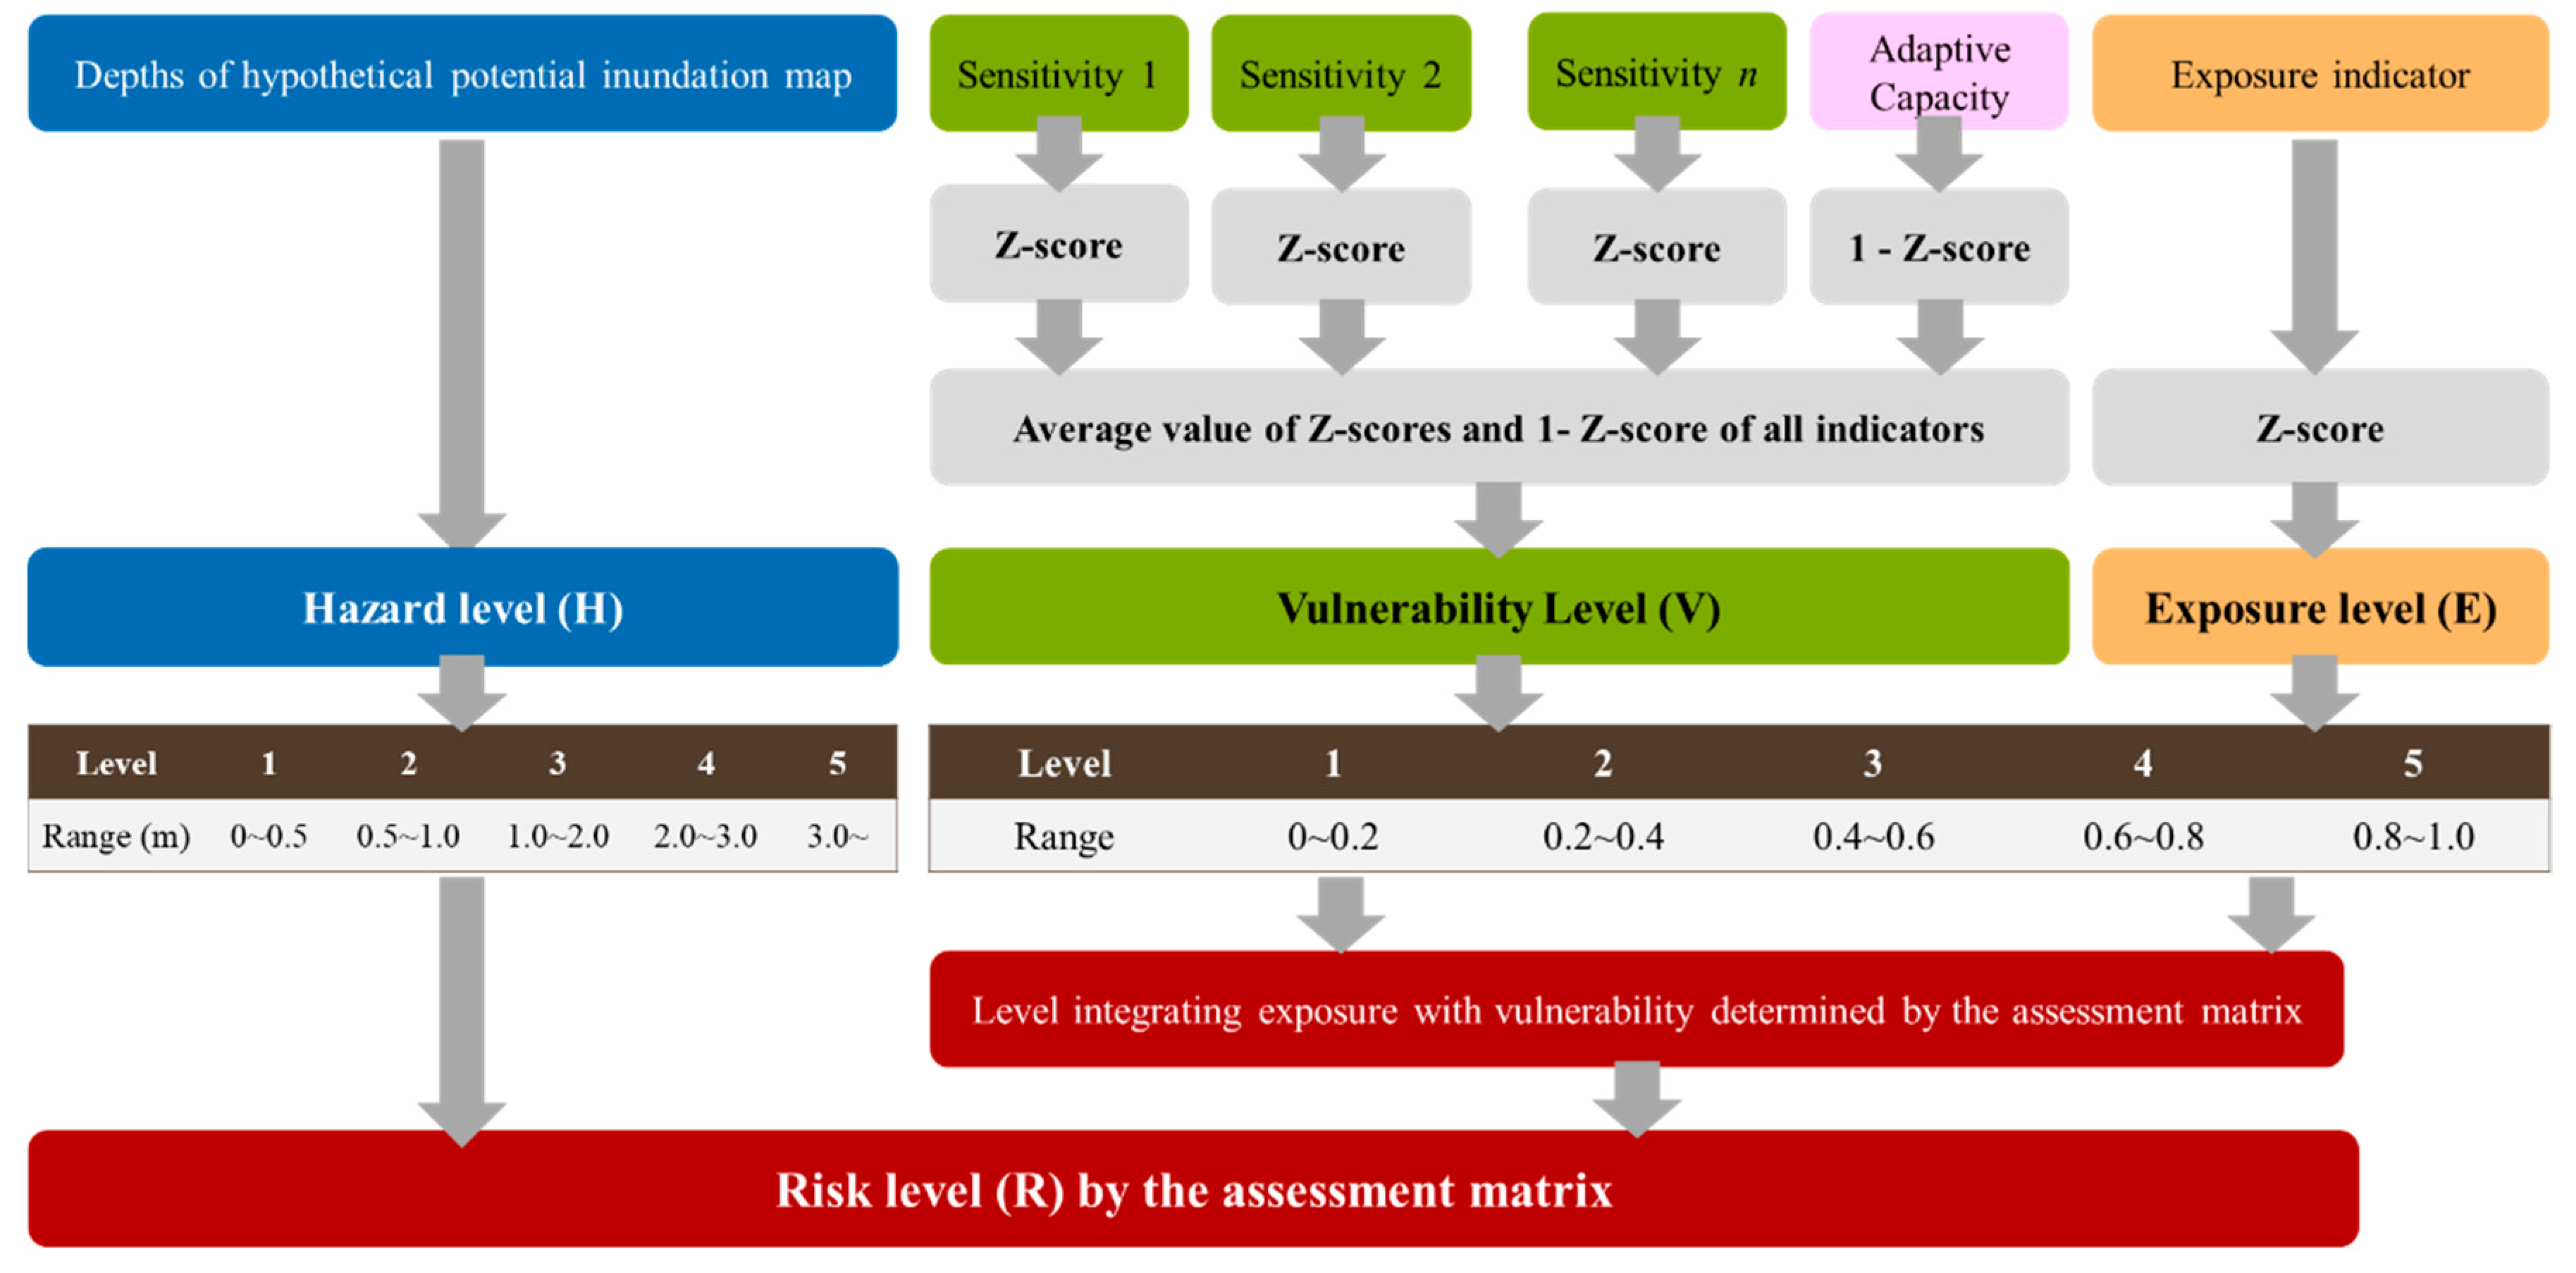
To visually assess the spatial-temporal relationship of climate risk, the development of a reasonable quantification approach for demonstrating spatial climate risk in different regions by using climate risk maps is a crucial step. The illustration of the quantification approach used in this paper for hazard (H), exposure (E), vulnerability (V), and climate risk (R) levels is shown in
Figure 7. Hazard levels are defined within different ranges of inundation depths in
Table 2. The standard score, calculated by subtracting the mean from an individual raw score and then dividing the difference by the standard deviation, is used to standardize all indicators of exposure and vulnerability. The Z-score can be written as
where
denotes Z-score;
is the value of an indicator in a region;
is the mean of the indicator value;
S is the standard deviation of the indicator value; and
is the number of regions in a map.
It is worth mentioning that the indicators of sensitivity have a positive relationship with vulnerability, and the adaptive capacity has an inverse relationship with vulnerability. In other words, the vulnerability level would be higher if the extent of sensitivity is higher, but it would be lower if the value of adaptive capacity was higher. Therefore, the new score is calculated as (
Z-score). Then the average value of Z-scores and
Z-score of all indicators is computed and the cumulative distribution function (CDF) of the average value is used to determine the different levels of vulnerability. The CDF of Z-score of exposure indicator is also used to define different exposure levels. For determining the climate risk level, the risk assessment matrices (RAMs) developed by Jhong et al. [
26] are adopted as a tool to transform the levels of hazard, exposure, and vulnerability to climate risk level. RAM determines the first new level integrating the levels of exposure and vulnerability, and the second new level (integrating the first new level) and hazard level are then decided by RAM again, which is defined as the climate risk level in this study.
5. Discussion
5.1. Future Potential Adaptation Strategies and Recommended Suggestions for a Metropolitan City
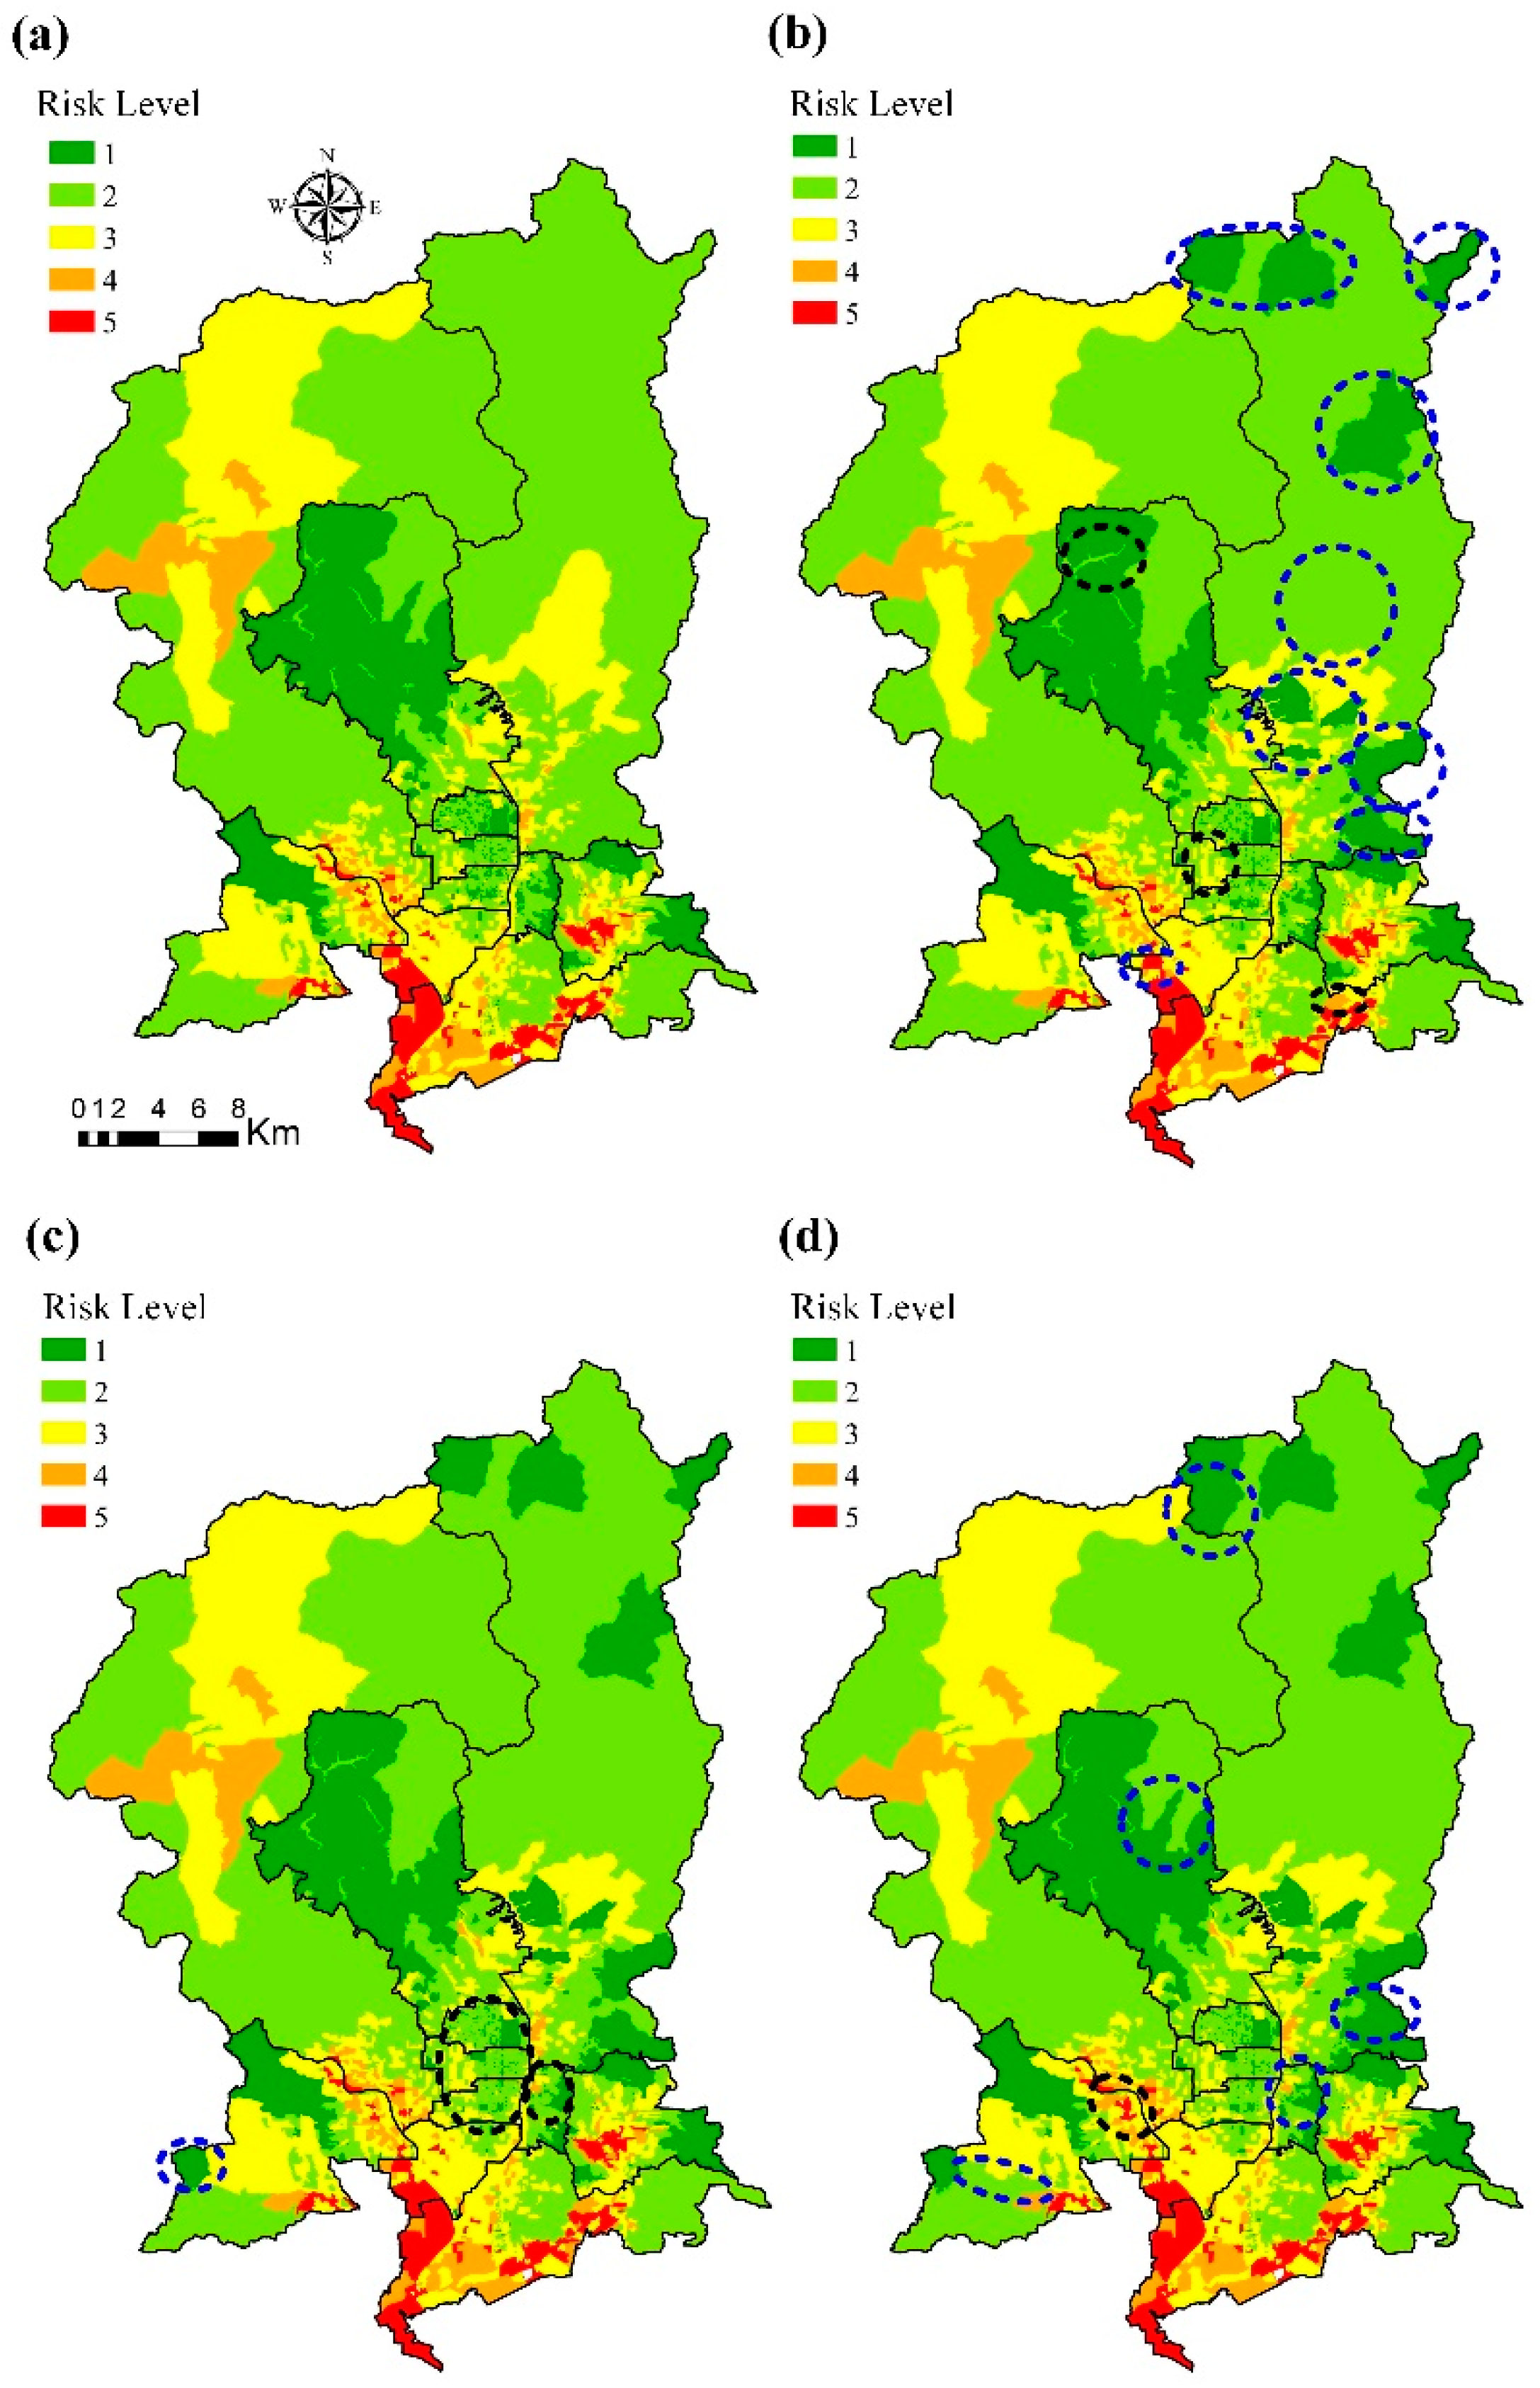
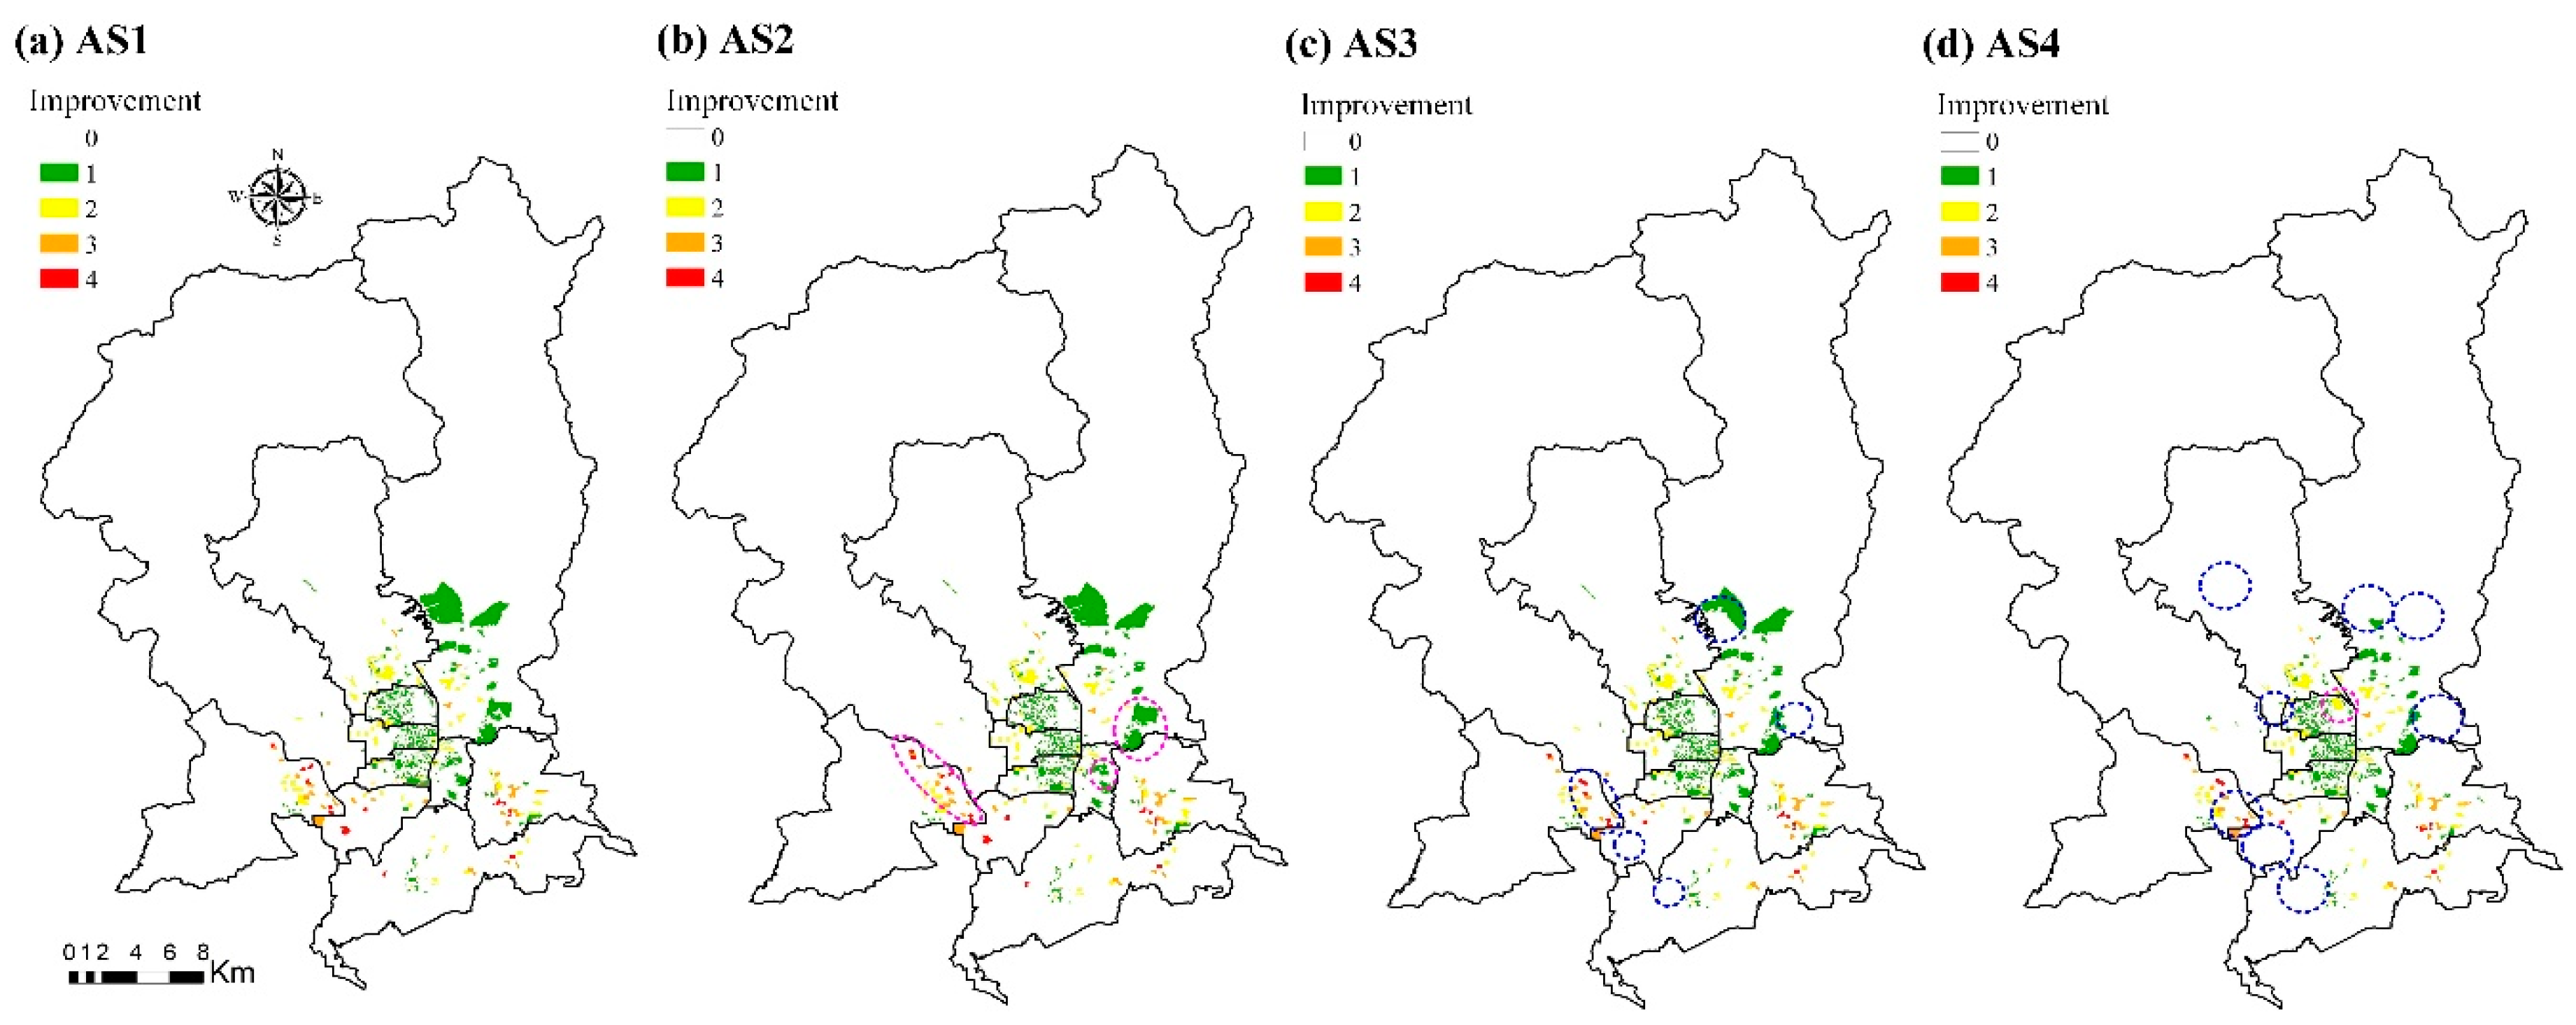
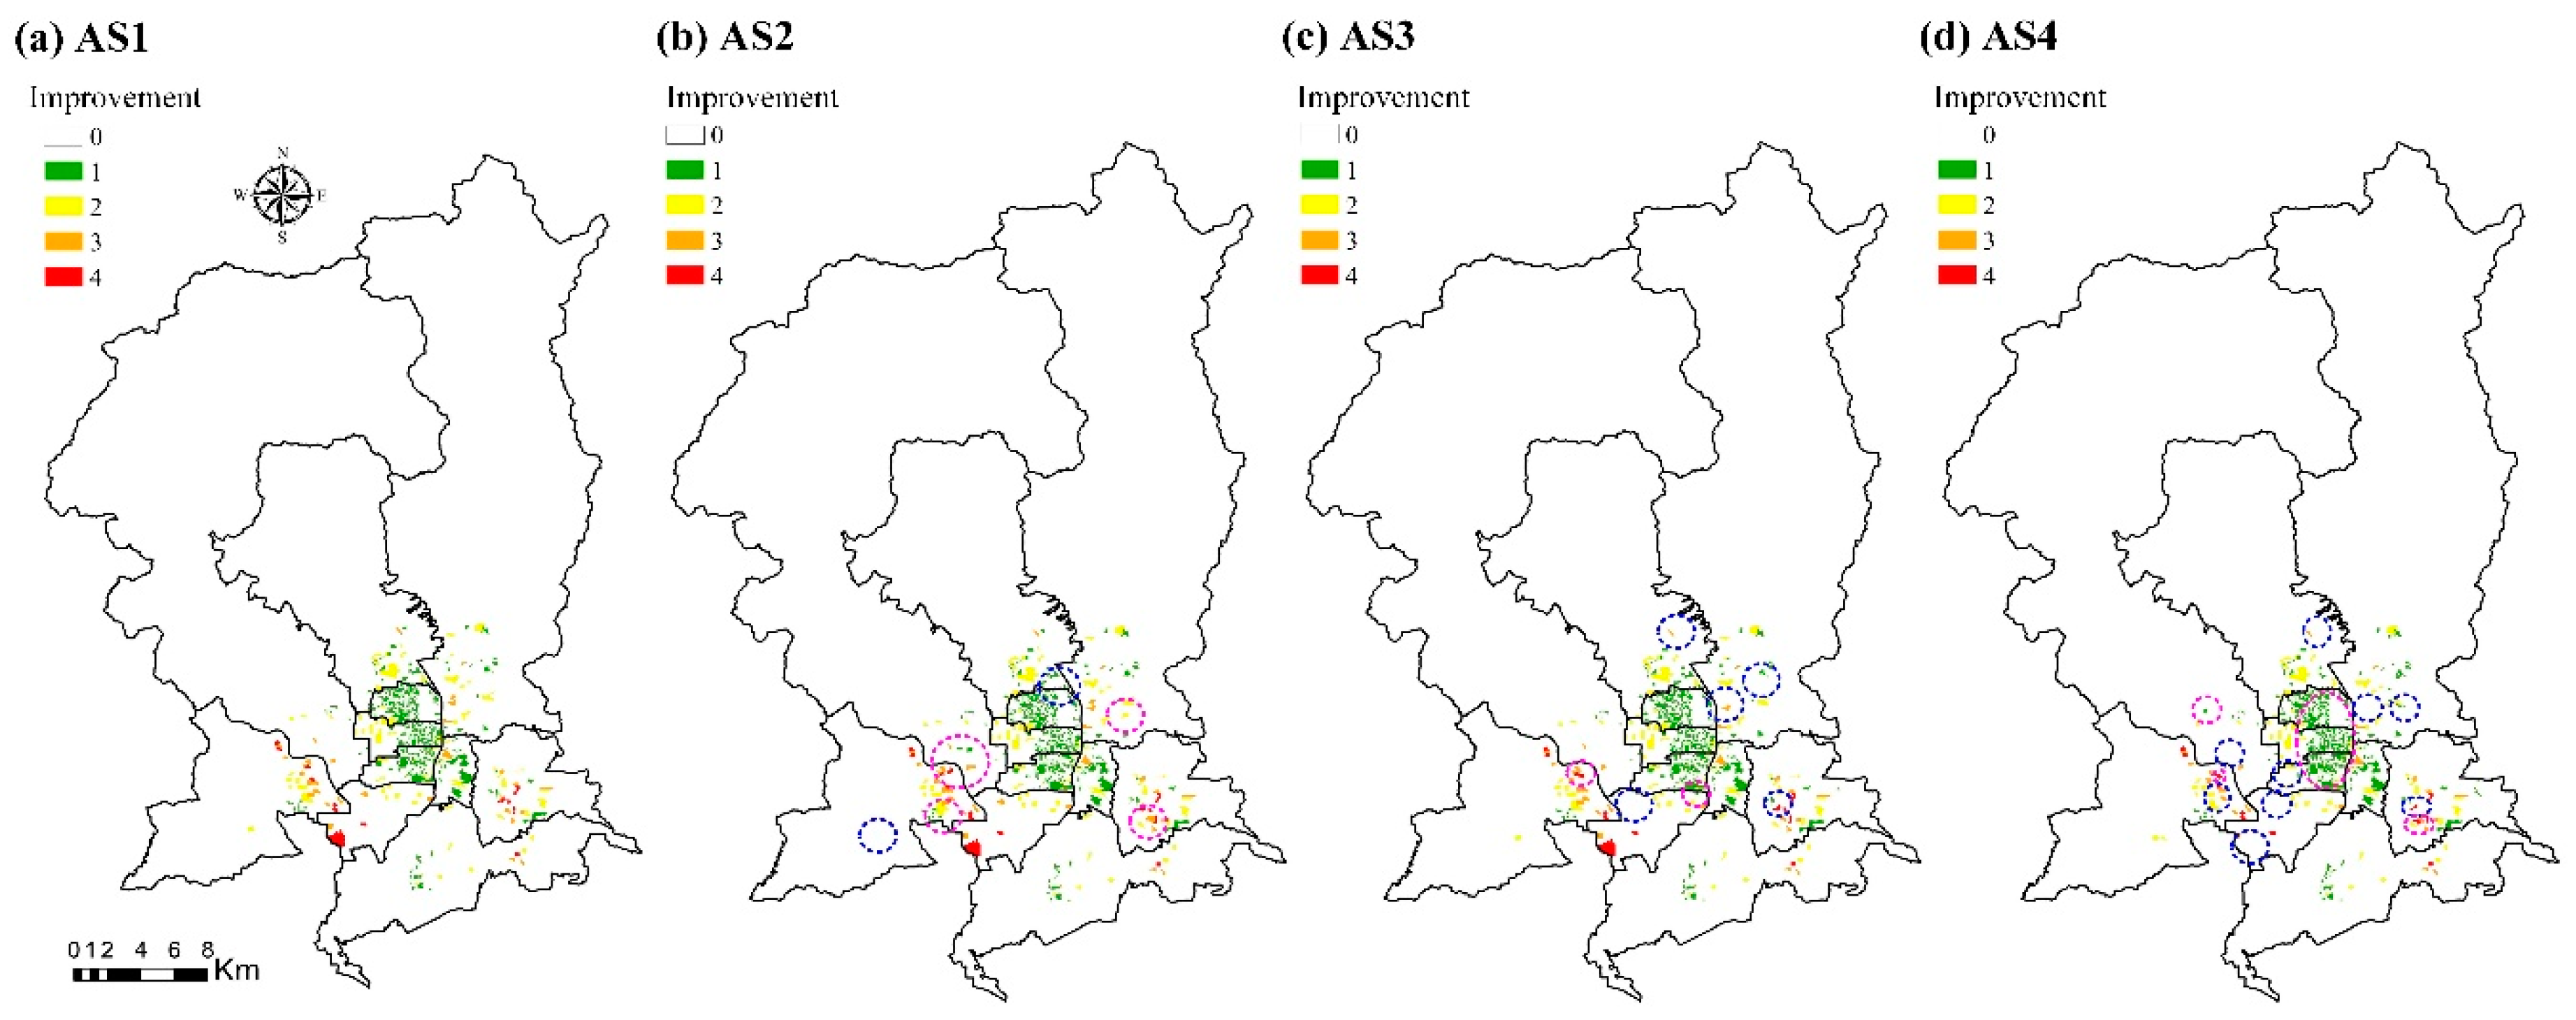
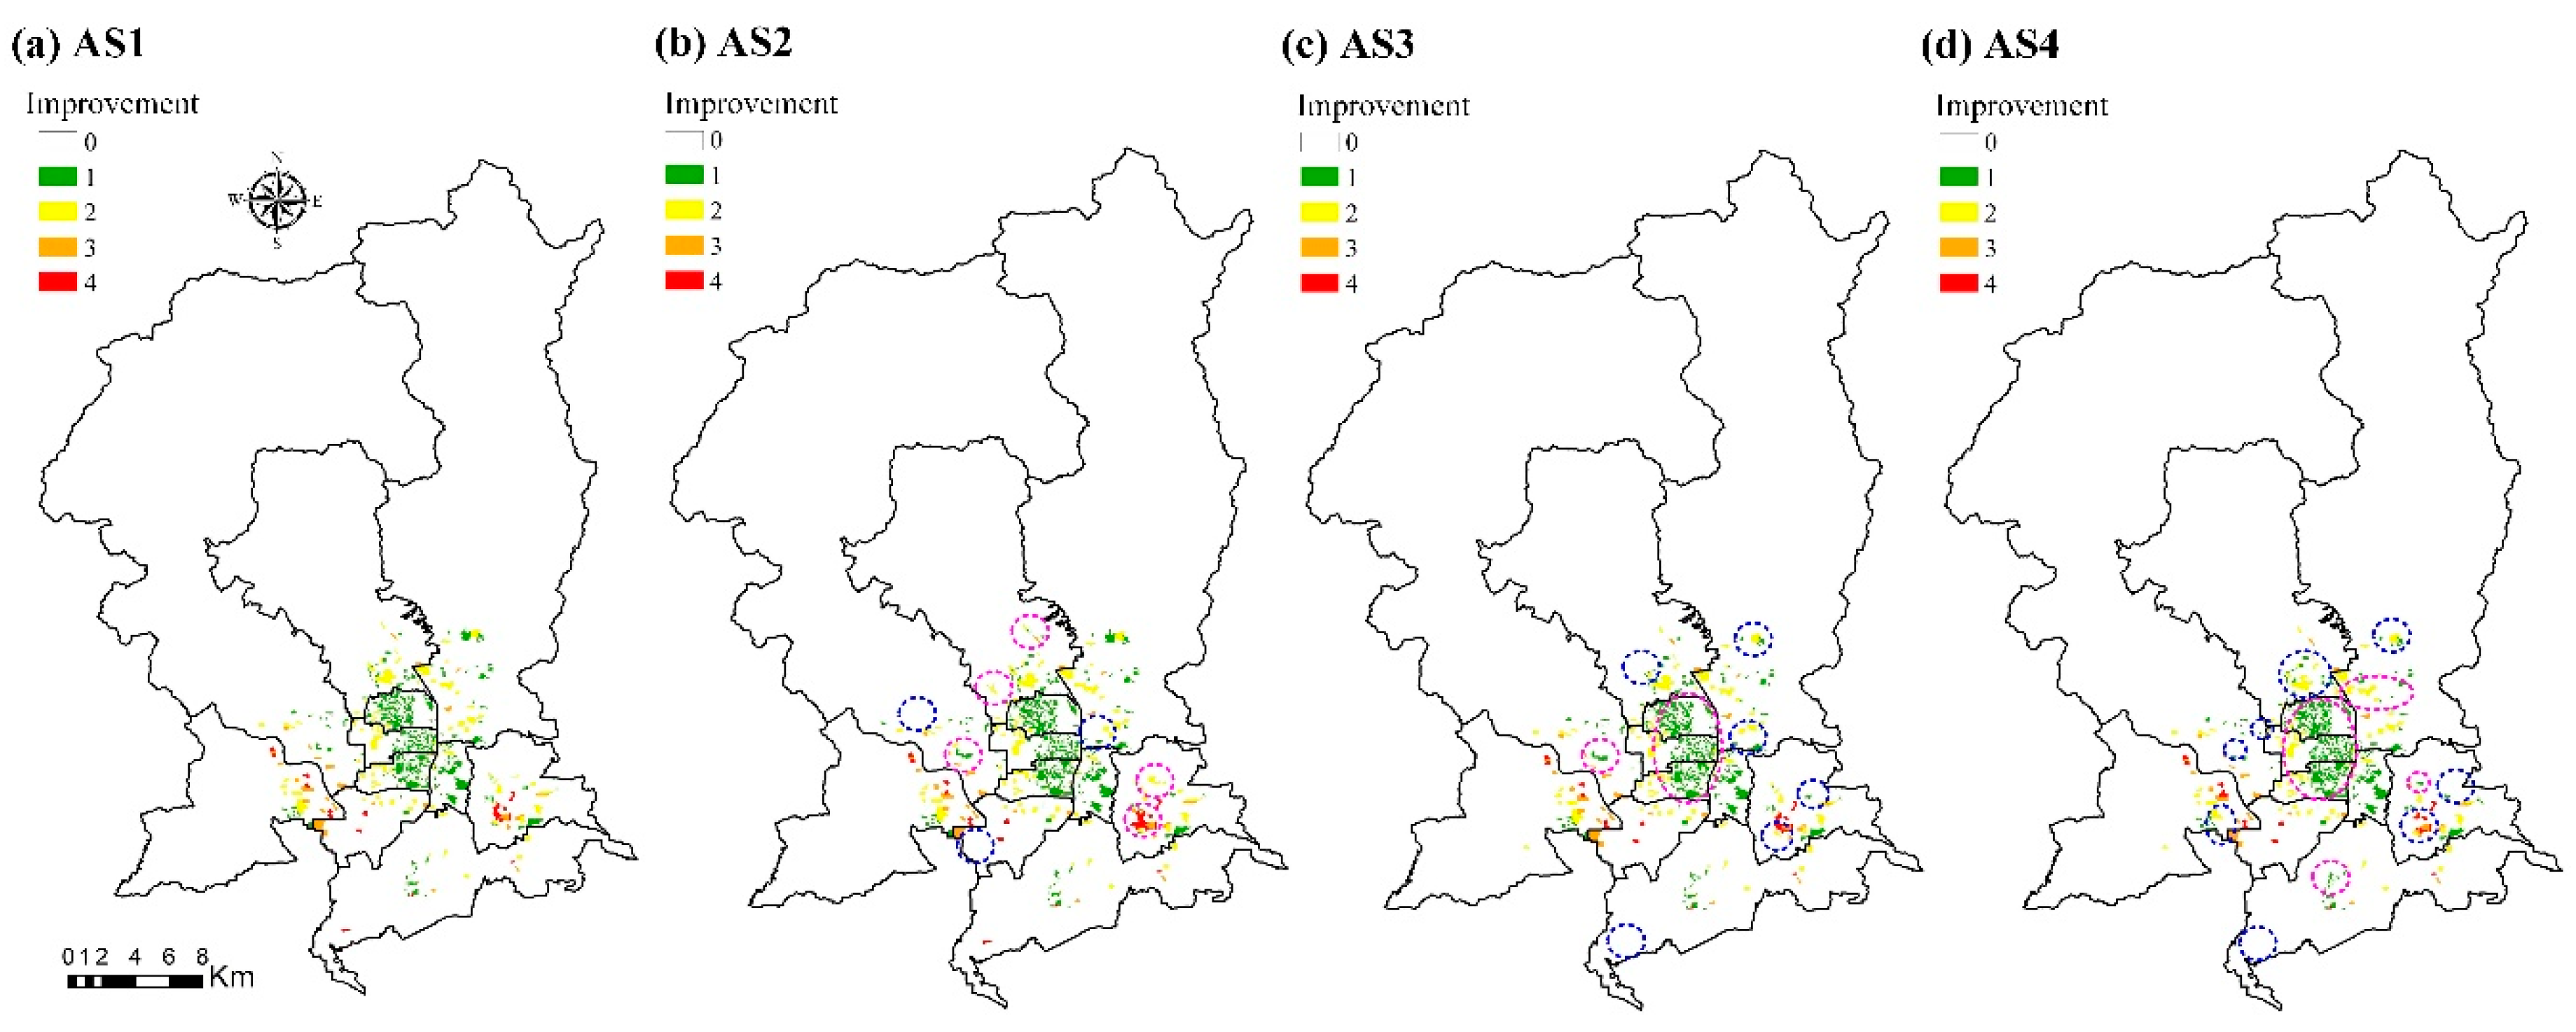
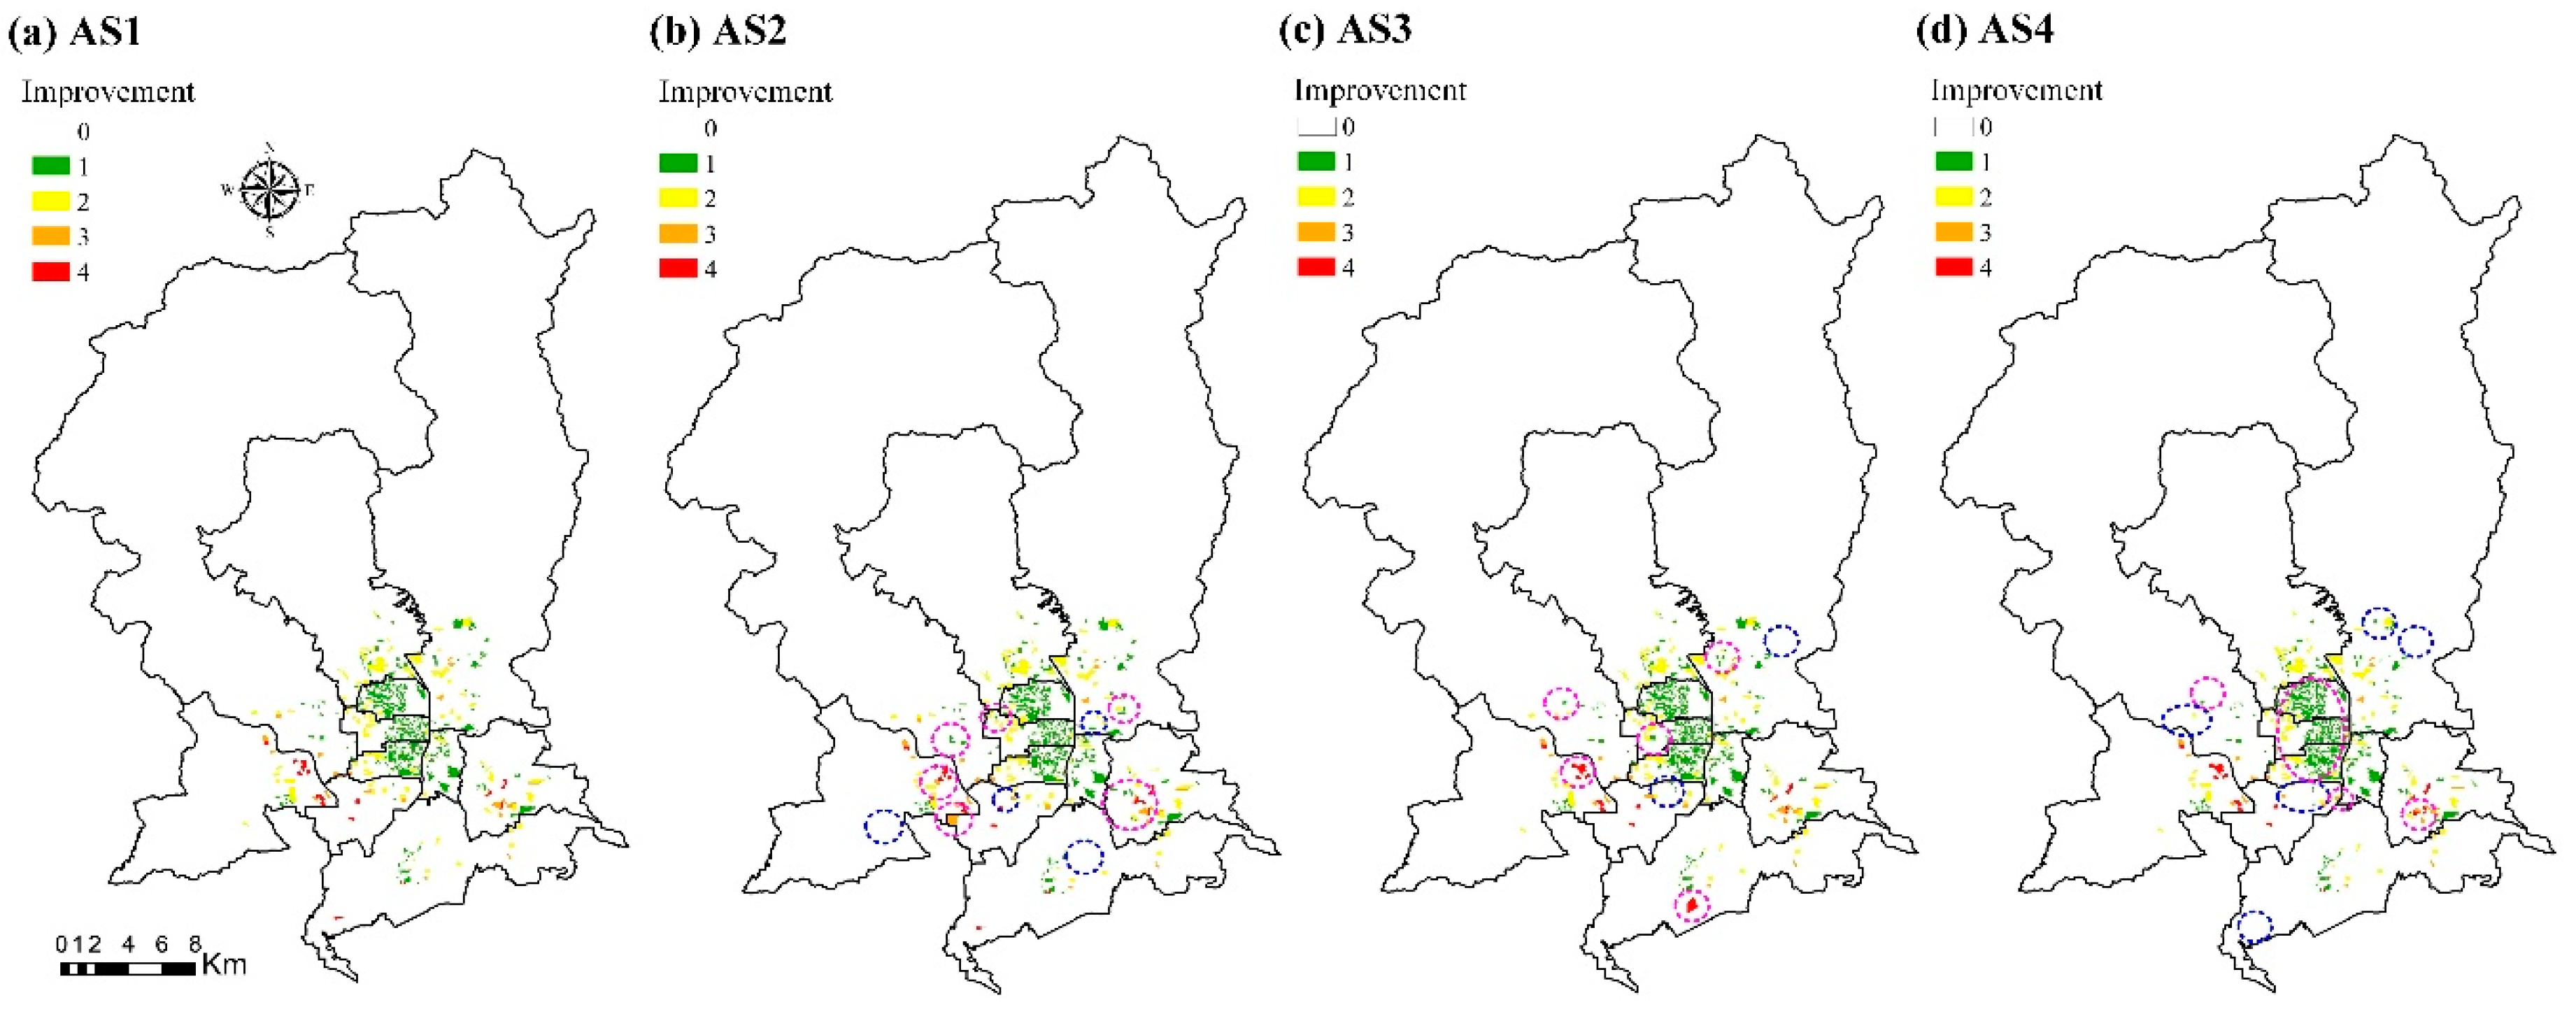
With regard to the results of comparing climate risk maps with the possible situations of exposure and vulnerability, it is evident that the spatial area of improvement of climate risk in 2015 is more than those in other years, especially for AS2 strategies. In 2020, even though the spatial area of improvement of climate risk is relatively less, the climate risk in the several regions is improved from level 3 to 2, and AS2 also performs better than other strategies. However, the difference in the improvements of all climate adaptation strategies for decreasing climate risk in 2025 and 2030 are not apparent. AS4 indeed improves the climate risk in the central part of Kyoto City.
As per the assumption for the setting of climate adaptation strategies in this study, the decreased extents of climate risk in 2025 and 2030 are similar, although the weights of the different rankings for the adaptation strategies increase as the year increases. This is because the population density decreases in those years, so the number of children and elders also relatively decreases. Therefore, it is certainly not easy to have an extensive spatial area of the improvement of climate risk. The government should pay attention to reducing the population in flood-prone areas. For investigating the potential climate adaptation strategies, the diverse strategies play a vital role. The improvement of AS2 in 2015 and 2020 is effective, but AS3 and AS4 in 2030 are relatively better performing than the others. This clearly shows that rainwater storage and green roofs have been strongly encouraged as one of the potential adaptation strategies for short-term planning. For long-term planning, the construction of detention ponds has been suggested for flood prevention. It is recommended that all adaptation strategies should be explored with their priority settings rather than implementing only one strategy at a time for reducing climate risk in the metropolitan city.
5.2. Can We Apply This Approach to Another Different Case Studies? What Kinds of the Assumptions and the Uncertainty Should We Notice?
To focus on the assessment of flood risk and the investigation of suitable strategies under various vulnerability and adaptation scenarios, one of the main assumptions in this study is that the future hazard level is supposed as the same with the current one. The future exposure and vulnerability, however, was appropriately evaluated by the reasonable quantitative analysis. Another of the main assumptions is the setting of weights of the different rankings for each year. In this study, the weights were set in a linearly increasing way to assume that the decision makers would have gradually adopted different adaptation strategies. The higher weights indicate that measurements were valued by the decision makers than the lower weights. Hence, the decision makers/users can decide the weights depending on their judgment and determination.
In addition, the hazard map database was utilized from the open data website, National Land Numerical Information Download Service (NLNIDS) sponsored by National Land Information Division, National Spatial Planning and Regional Policy Bureau, Ministry of Land, Infrastructure, Transport and Tourism (MLIT) of Japan. The provided data were rigorously simulated by physics-based numerical model to further produce the hypothetical potential river flooding map. Hence, in the process of the evaluation of inundation depths, the numerical model must take into account water levels and velocities. The approach proposed in this study is mainly to allow decision makers/users to efficiently apply the existing information to assess climate risk based on the climate risk template. Because of the reliable open data from NLNIDS, the downloaded official data which are available in other regions were adopted in this study. Moreover, decision makers/users can also apply the results of self-developed flooding numerical models including water levels and velocities, and integrate the proposed approach in this study to analyze and assess the climate risk. Therefore, the flexibility and adaptability of the proposed approach are also some of its advantages.
In short, this study provides, as a matter of fact, an alternative approach for assessing climate risk in floods. Therefore, the proposed approach can be applied to other different case studies, especially for metropolitan cities.
6. Conclusions
The purpose of this paper is to quantify the flood hazard, exposure and vulnerability of a target to focus on (residents), and the evaluation of potential adaptation strategies essential for climate risk reduction. For this purpose, a generalized flood risk assessment framework is proposed. First, the possible causes of flood disaster are identified by using the climate risk template, and the potential climate adaptation strategies were discussed. The framework is applied in the Kyoto City of Japan to investigate the suitable adaptation strategies under various vulnerability and adaptation scenarios. The results indicate that the climate risk in some regions in Kyoto City would decrease because of the decreasing population density, but some areas within the river’s vicinity have a relatively high climate risk regarding flooding. The results also show that strategies, such as rainwater storage and green roofs, are helpful to reduce the flood risk and are recommended as a climate adaptation strategy as a part of the short-term planning process in the metropolitan city.
One of the limitations of the present study is that the hazard extents for different years are assumed to be the same, and the climate risks in different periods are quantitatively discussed with the variability in the exposure and vulnerability. Nevertheless, the extent of hazards could also possibly be more severe in the future than the present. It is also possible that climate risk in the future will increase. Therefore, the future work can focus on the discussion based on the different scenario settings of structural measures and the simulation of hazards caused by different rainfall situations to obtain more reasonable hazard levels.

 ,
, 


