1. Introduction
It is necessary to develop more and more advanced wastewater treatment methods. Novel possibilities of environment monitoring are constantly advancing, which leads to the improvement of toxicant monitoring methods in threatened water. As a relevant approach for the evaluation of the impact of this water on ecosystems, ecotoxicological tests are used. Pollution in wastewater treatment plants is not always removed perfectly, it is only lowered to acceptable levels. It must be judged thoroughly whether treated water has a sufficiently low level of ecotoxicity and if there will be any effect on the organisms in it [
1,
2].
The
Lemna minor (lesser duckweed—Angiospermae, Lemnaceae) is one of the water organisms used to measure ecotoxicity. It is a freshwater plant which can be found in most countries all over the world, mainly in lowlands and foothill areas in stagnant and slow-flowing waters. The plant’s body consists of a relatively long root and 2 to 5 mm oval shape leaves which can float on the water surface. Mostly, the plant occurs in colonies of two to five leaves. A small single plant can itself reproduce every three days under ideal conditions in nutrient-rich waters [
3].
Lemna minor bioassays are quite common and easy to perform. The test takes 7 days, where the plant is in the tested samples and by evaluation of the growth inhibition, the effects of substances on vegetation growth are quantified.
During the test of ecotoxicity, the biostimulation or the inhibition of plant growth in the tested samples is monitored for seven days. The objective of the test is to measure the effects of the tested substance on the growth of the
Lemna minor plant. The basic measured indicator is the number of insoles (leaves). In addition, a second indicator must be measured—either the area overgrown with insoles, dry matter, or chlorophyll. For the legitimacy of the tests, the average increase of the number of leaves has to increase seven times in reference samples. For a standard substance, the level of EC50 (effective concentration causing a 50% inhibition) must be from 5.5 to 10 g·L
−1 and the pH should not change by more than 1.5 unit [
4].
The expansion of image analysis algorithms has allowed semi-automatic or fully automatic measurements. Computer systems can evaluate the changes and describe their nature, both qualitatively and quantitatively. It is important to develop a method to extract data encoded in a graphical form, usually created on the features of predefined characteristics. To acquire information from living organisms in the form of digital images, various progressive evaluation tools are used [
5,
6,
7], including plant species classification using a deep convolutional neural network [
8].
Computer vision includes methods for acquiring, analyzing, and understanding images. Applications of computer vision range from computers or robots that can comprehend the world around them through artificial intelligence up to industrial machine vision. Computer vision covers the core technology of automated image analysis which is used in many fields. Machine vision represents a process of combining automated image analysis with other methods and technologies to provide automated inspection or robot guidance in industrial environments and applications [
9,
10,
11,
12].
In classical bioassays using the
Lemna minor, dry biomass of plants from the control and the tested samples is compared. However, this is an invasive approach that does not allow one to continue the experiment because the plants are dried for biomass measurements. A non-invasive approach is based on manually counting the number of leaves. The leaf size is not taken into account in this approach. A more accurate and reliable approach to defining the biomass growth rate can be comparison of the area occupied by the leaves in the experimental and control samples. This non-invasive approach allows one to continue the experiment. Computer image analysis, algorithms, and methods improve the objectivity of data collection and evaluation [
13,
14].
The visual evaluation of the number of leaves is done manually by laboratory workers. This process can be long and loaded with human error. There are devices with a partially automated process for Lemna minor experiment evaluation that are owned by big scientific institutions dealing with wastewater management. These devices are often not available for smaller institutions or scientific teams because of the high price.
In the work [
15], authors deal with using computer vision in the
Lemna minor bioassay. Calibration of their method showed a strong correlation between the frond area and the fresh biomass weight. Based on it, several experiments on the reaction of the
Lemna minor to various detergent solutions (Brij 59 and Brij 38) were performed. Experiments have shown that non-ionic detergents changed the plant surfaces. However, in the ISO 20079:2005 standard [
4], the dry biomass weight is considered, whereas in [
15], the fresh biomass is used as an indicator for assay evaluation.
In this article, we focus on testing a low-cost method for a Lemna minor bioassay evaluation based on computer and machine vision, realizable by a research worker using reliable tools. The objective is to design a methodology for image analysis using a digital camera and a framework software tool. This method was based on the ISO 20079 standard as a 168 h growth inhibition test with the aim to quantify the effects on vegetative growth in terms of the number of leaves compared to leaves-occupied area. The number of leaves is considered as the basic indicator, however this is old and inaccurate according to current modern technological possibilities; growth reaction of the Lemna minor can be evaluated more accurately by the leaves-occupied area using computer vision algorithms.
2. Experiment
A test with the
Lemna minor was performed according to the ISO 20079 standard (Water quality—Determination of the toxic effect of water constituents and waste water on duckweed (
Lemna minor)—Duckweed growth inhibition test) as a 168 h growth inhibition test [
4]. The observed endpoint was growth inhibition by the effect of the samples during a 7-day exposure (168 h). The aim of the test was to quantify the negative effects on vegetative growth in two parameters—the number of leaves and the leaves-occupied area. Then, it was possible to compare these two evaluation approaches.
The potassium dichromate K2Cr2O7 was used as the reference substance for experiments; the concentrations used were: 5, 10, 20, 40, 80, and 160 mg·L−1. Tests on reference substances serve to verify the quality and sensitivity of organisms and thus, their usability for the test. For K2Cr2O7, the EC50 reference value is in the range of 5.5 to 10.0 mg·L−1.
For the purpose of testing, the modified Steinberg medium was used. This medium provides all the necessary nutrients for the
Lemna minor growth. The Steinberg medium composition was according to [
4] and can be seen in
Table 1.
For 1 L of medium, 20 mL of each solution of macronutrients (I–III) and 1 mL of each solution of micronutrients (IV–VIII) were pipetted. The remaining volume was distilled water. At the beginning of the test, approximately 9 beads were placed into each beaker with 100 mL of sample (3 parallel assays for each K2Cr2O7 concentration and 6 assays with a clean modified Steinberg medium as a control) and the beakers were covered with a transparent foil and kept under constant light for 7 days. After a week, the test was evaluated and an EC50 value was determined from both the number of leaves and the area occupied by the leaves.
The growth rate was calculated as follows:
Where xtn is the final number of leaves (or the final area), xt1 is the initial number of leaves (or the initial area), tn is the duration of the test.
The growth inhibition was calculated as follows:
where
is the growth rate of the reference sample,
is growth rate of tested sample.
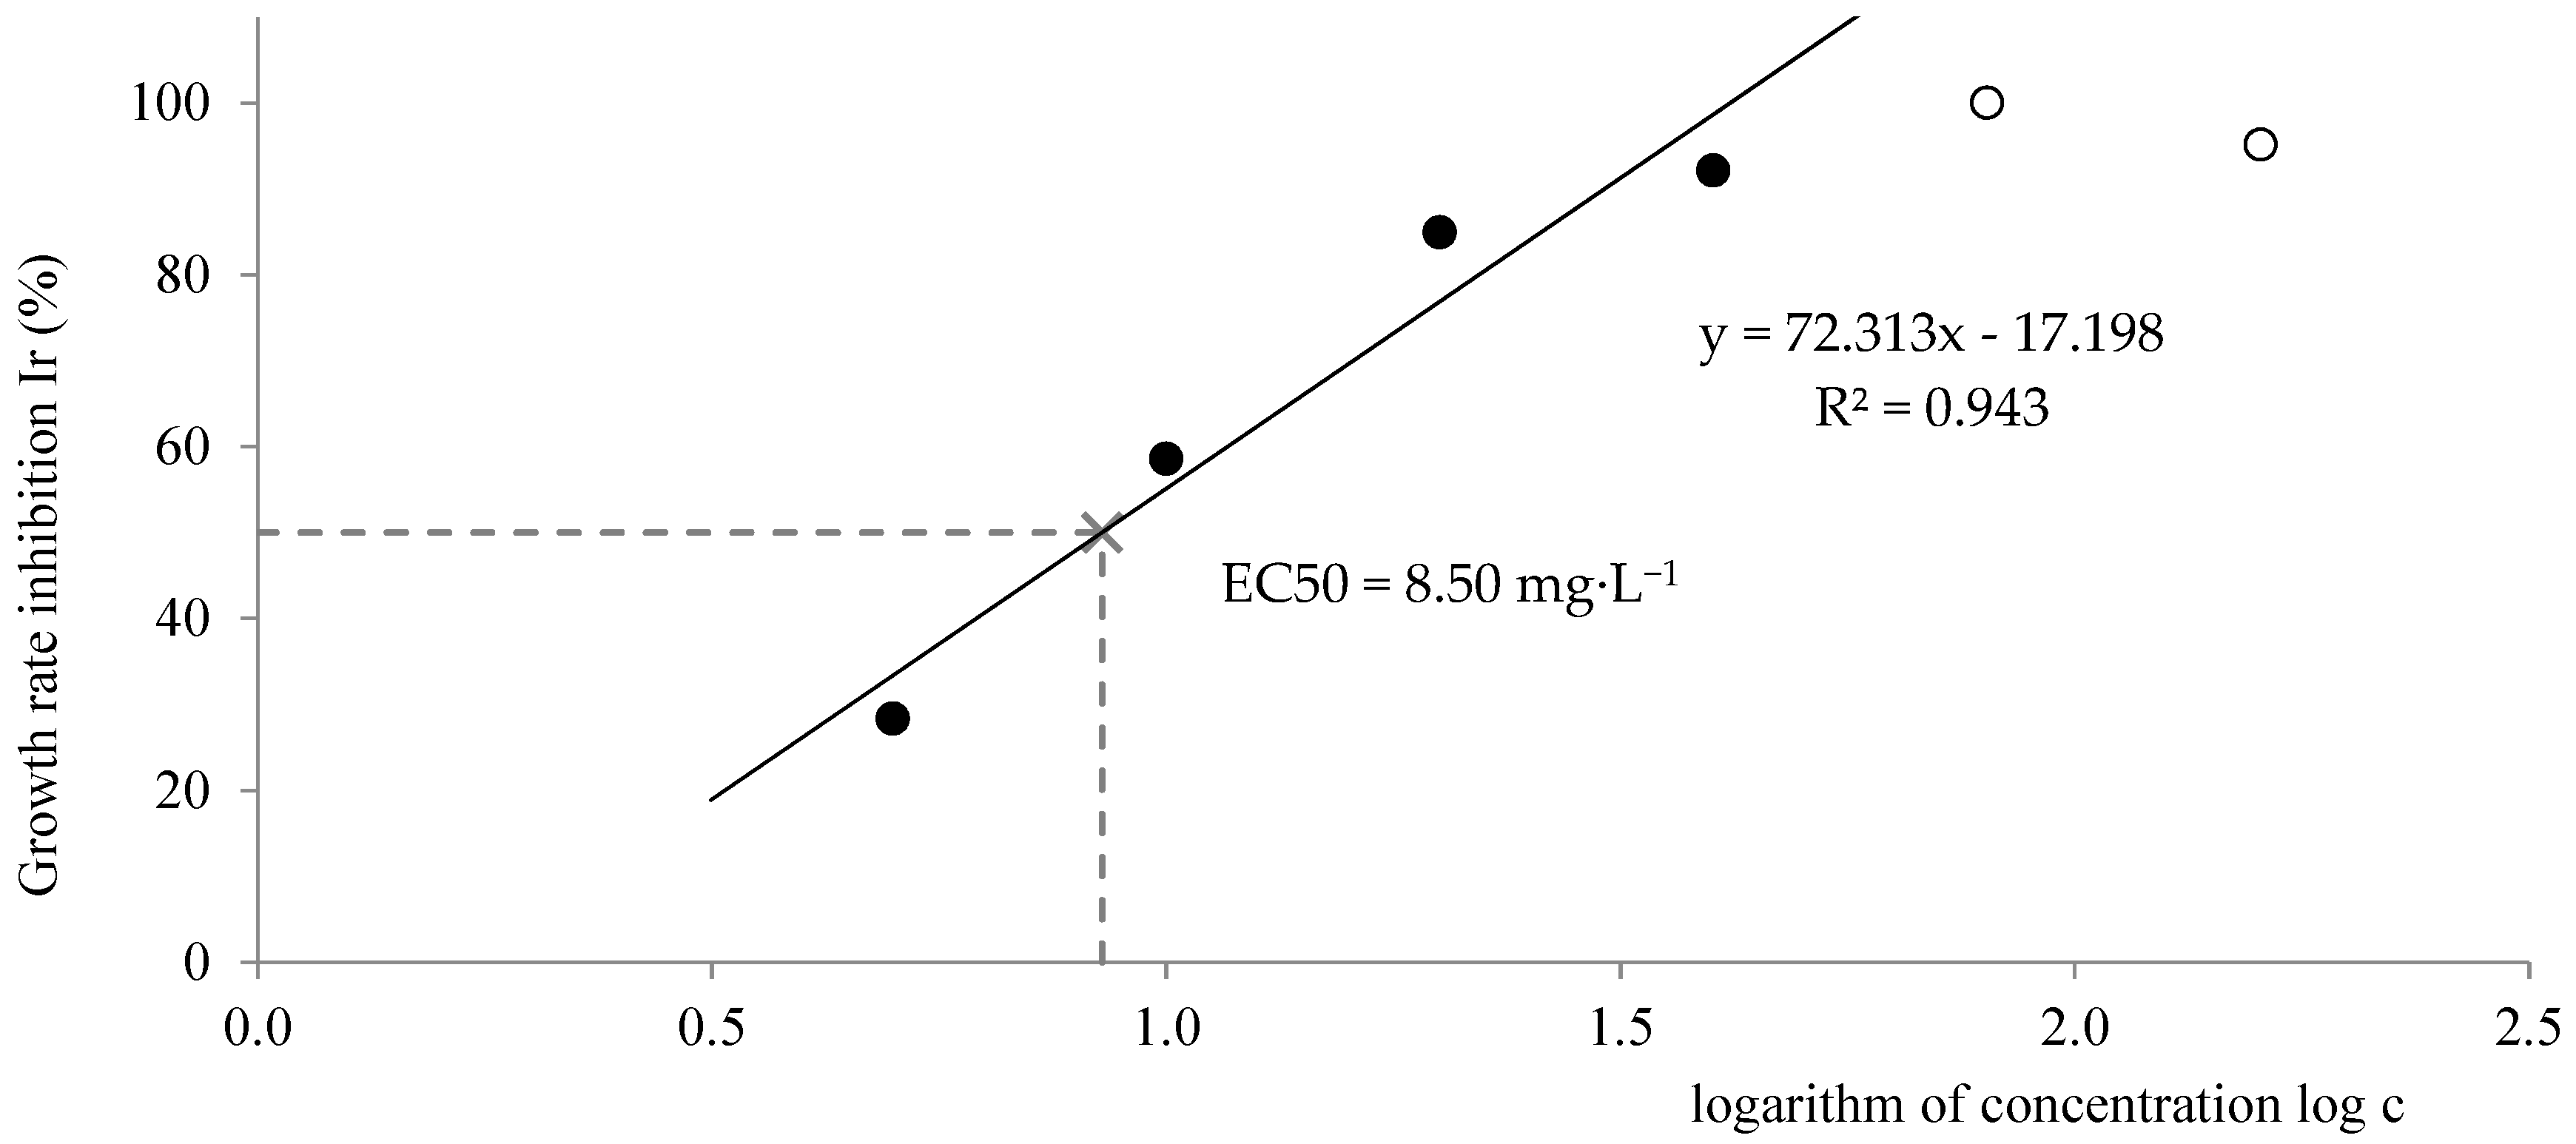
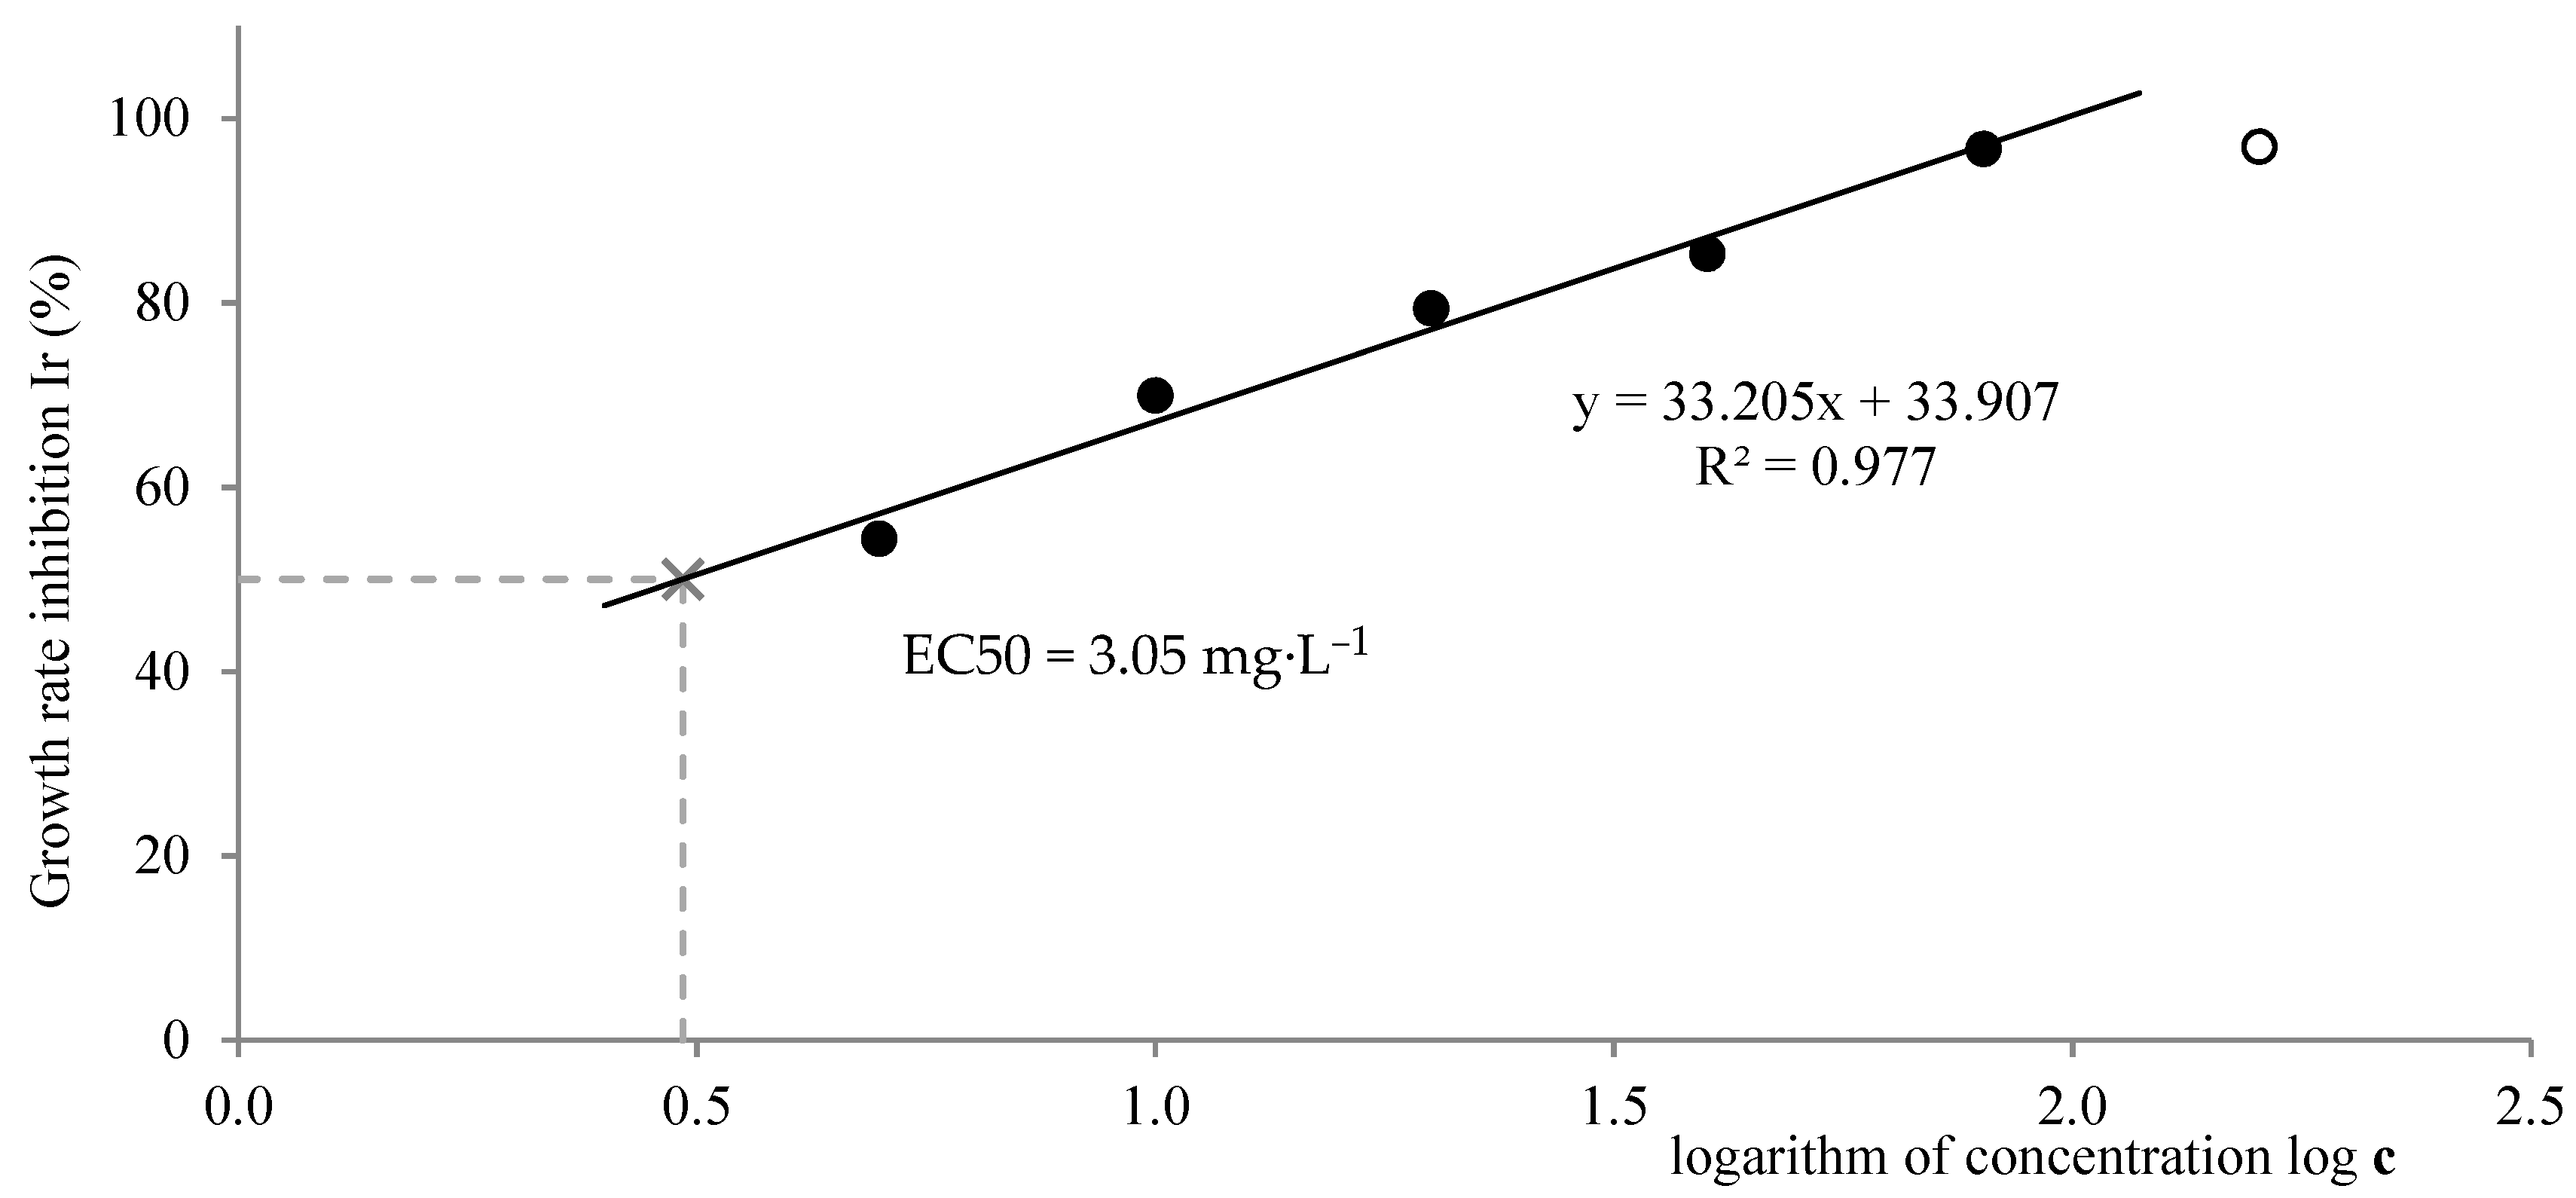
In order to evaluate the assay and determine the EC, the dependence of percentual growth inhibition on the sample concentration logarithm was plotted. From the regression line equation, the EC50 value was calculated.
3. Visual System for the Lemna minor Bioassay Evaluation
The main idea for using a visual system was the low-cost solution. Our proposed visual system consists of a camera holder, a light holder, a camera, a light, a voltage source, and a computer with image acquisition software. The whole visual system can be seen in
Figure 1.
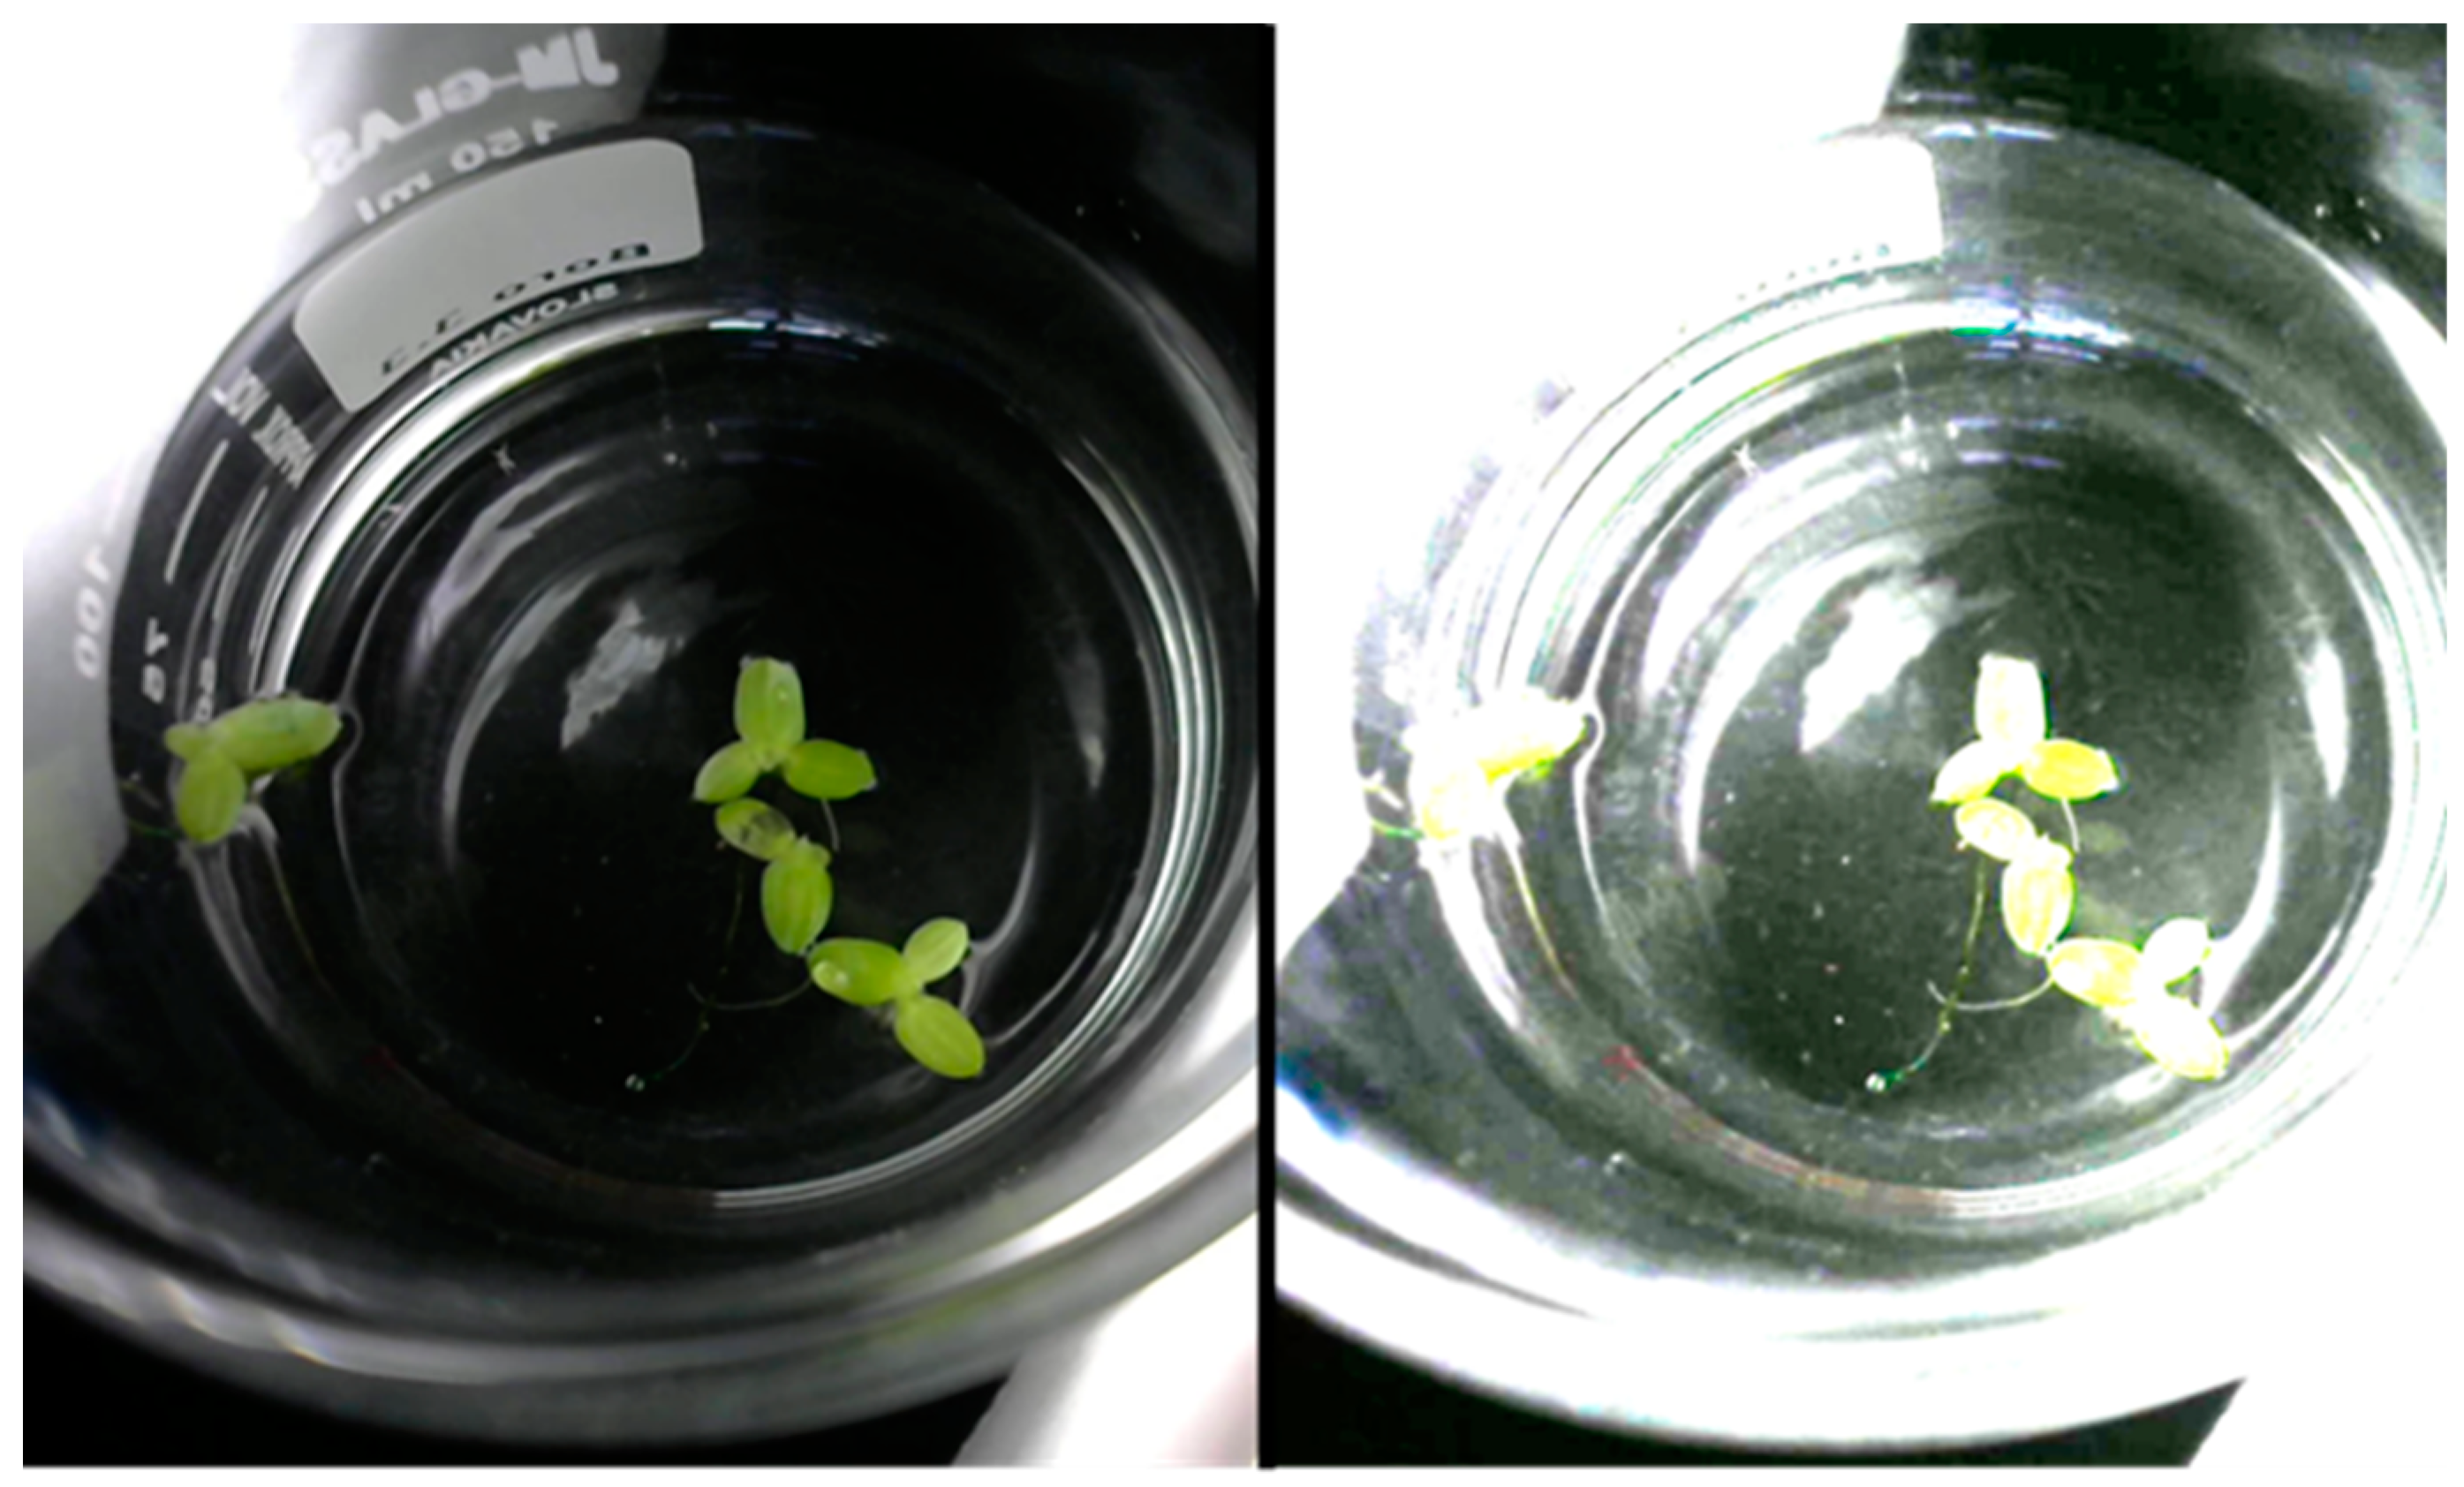
The holders are built using the building kit Merkur (Merkurtoys Ltd., Hradec Králové, Czechia). The lights are cheap LED spot lights (Vakesun Industrial Co., Ltd., Shenzhen, China) with constant luminosity and light diffusors made of paper. The camera used in the experiment is Logitech HD Webcam C270 (Logitech Inc., California, CA, USA), with its own image acquisition software Logitech Webcam Software (Logitech Inc., California, CA, USA). The sensing parameters of the camera were set manually to receive focused and well-exposed images (neither under- nor over-exposed), see
Figure 2.
4. Image Processing
The experiment images have to be processed after image acquisition. In this article, we compare the conventional evaluation method based on leaves counting and the new method based on the leaves-occupied area measurement. To measure the leaves-occupied area, we used the number of pixels representing the leaves. At first, we had to check whether the leaves overlap. If so, it was necessary to detach them from each other. Then, we had to select the area occupied by the leaves. This can be done automatically using sophisticated computer vision algorithms.
In our previous work [
16], we proposed the system for visual evaluation of the
Lemna minor bioassays. In this paper, we will just describe the main algorithm of the proposed system. The block diagram of the algorithm is depicted in
Figure 3.
After the image acquisition, the image was converted from the RGB (red, green, blue) image color space to the HSL (hue, saturation, value) color space. In the HSL color space, it is easy to determine which pixels of the image have a green hue (the leaves), thus the HSL color segmentation can be done. After the color segmentation, we can see the white mask in the image, which determines the area occupied by the leaves (
Figure 4).
The result obtained from the selected area is a new binary image where the background is black and the leaves are white (
Figure 4c). It is then very easy to count the number of pixels (the white ones) from the binary image using the ready-to-use tool in the image analysis framework. The algorithm was implemented in the NI Vision Assistant software which offers various pre-prepared machine vision algorithms. We used the simple area counting using a module called Particle Analysis.
5. Results
The numerical results of the tests after 168 h exposure are shown in
Table 2 and
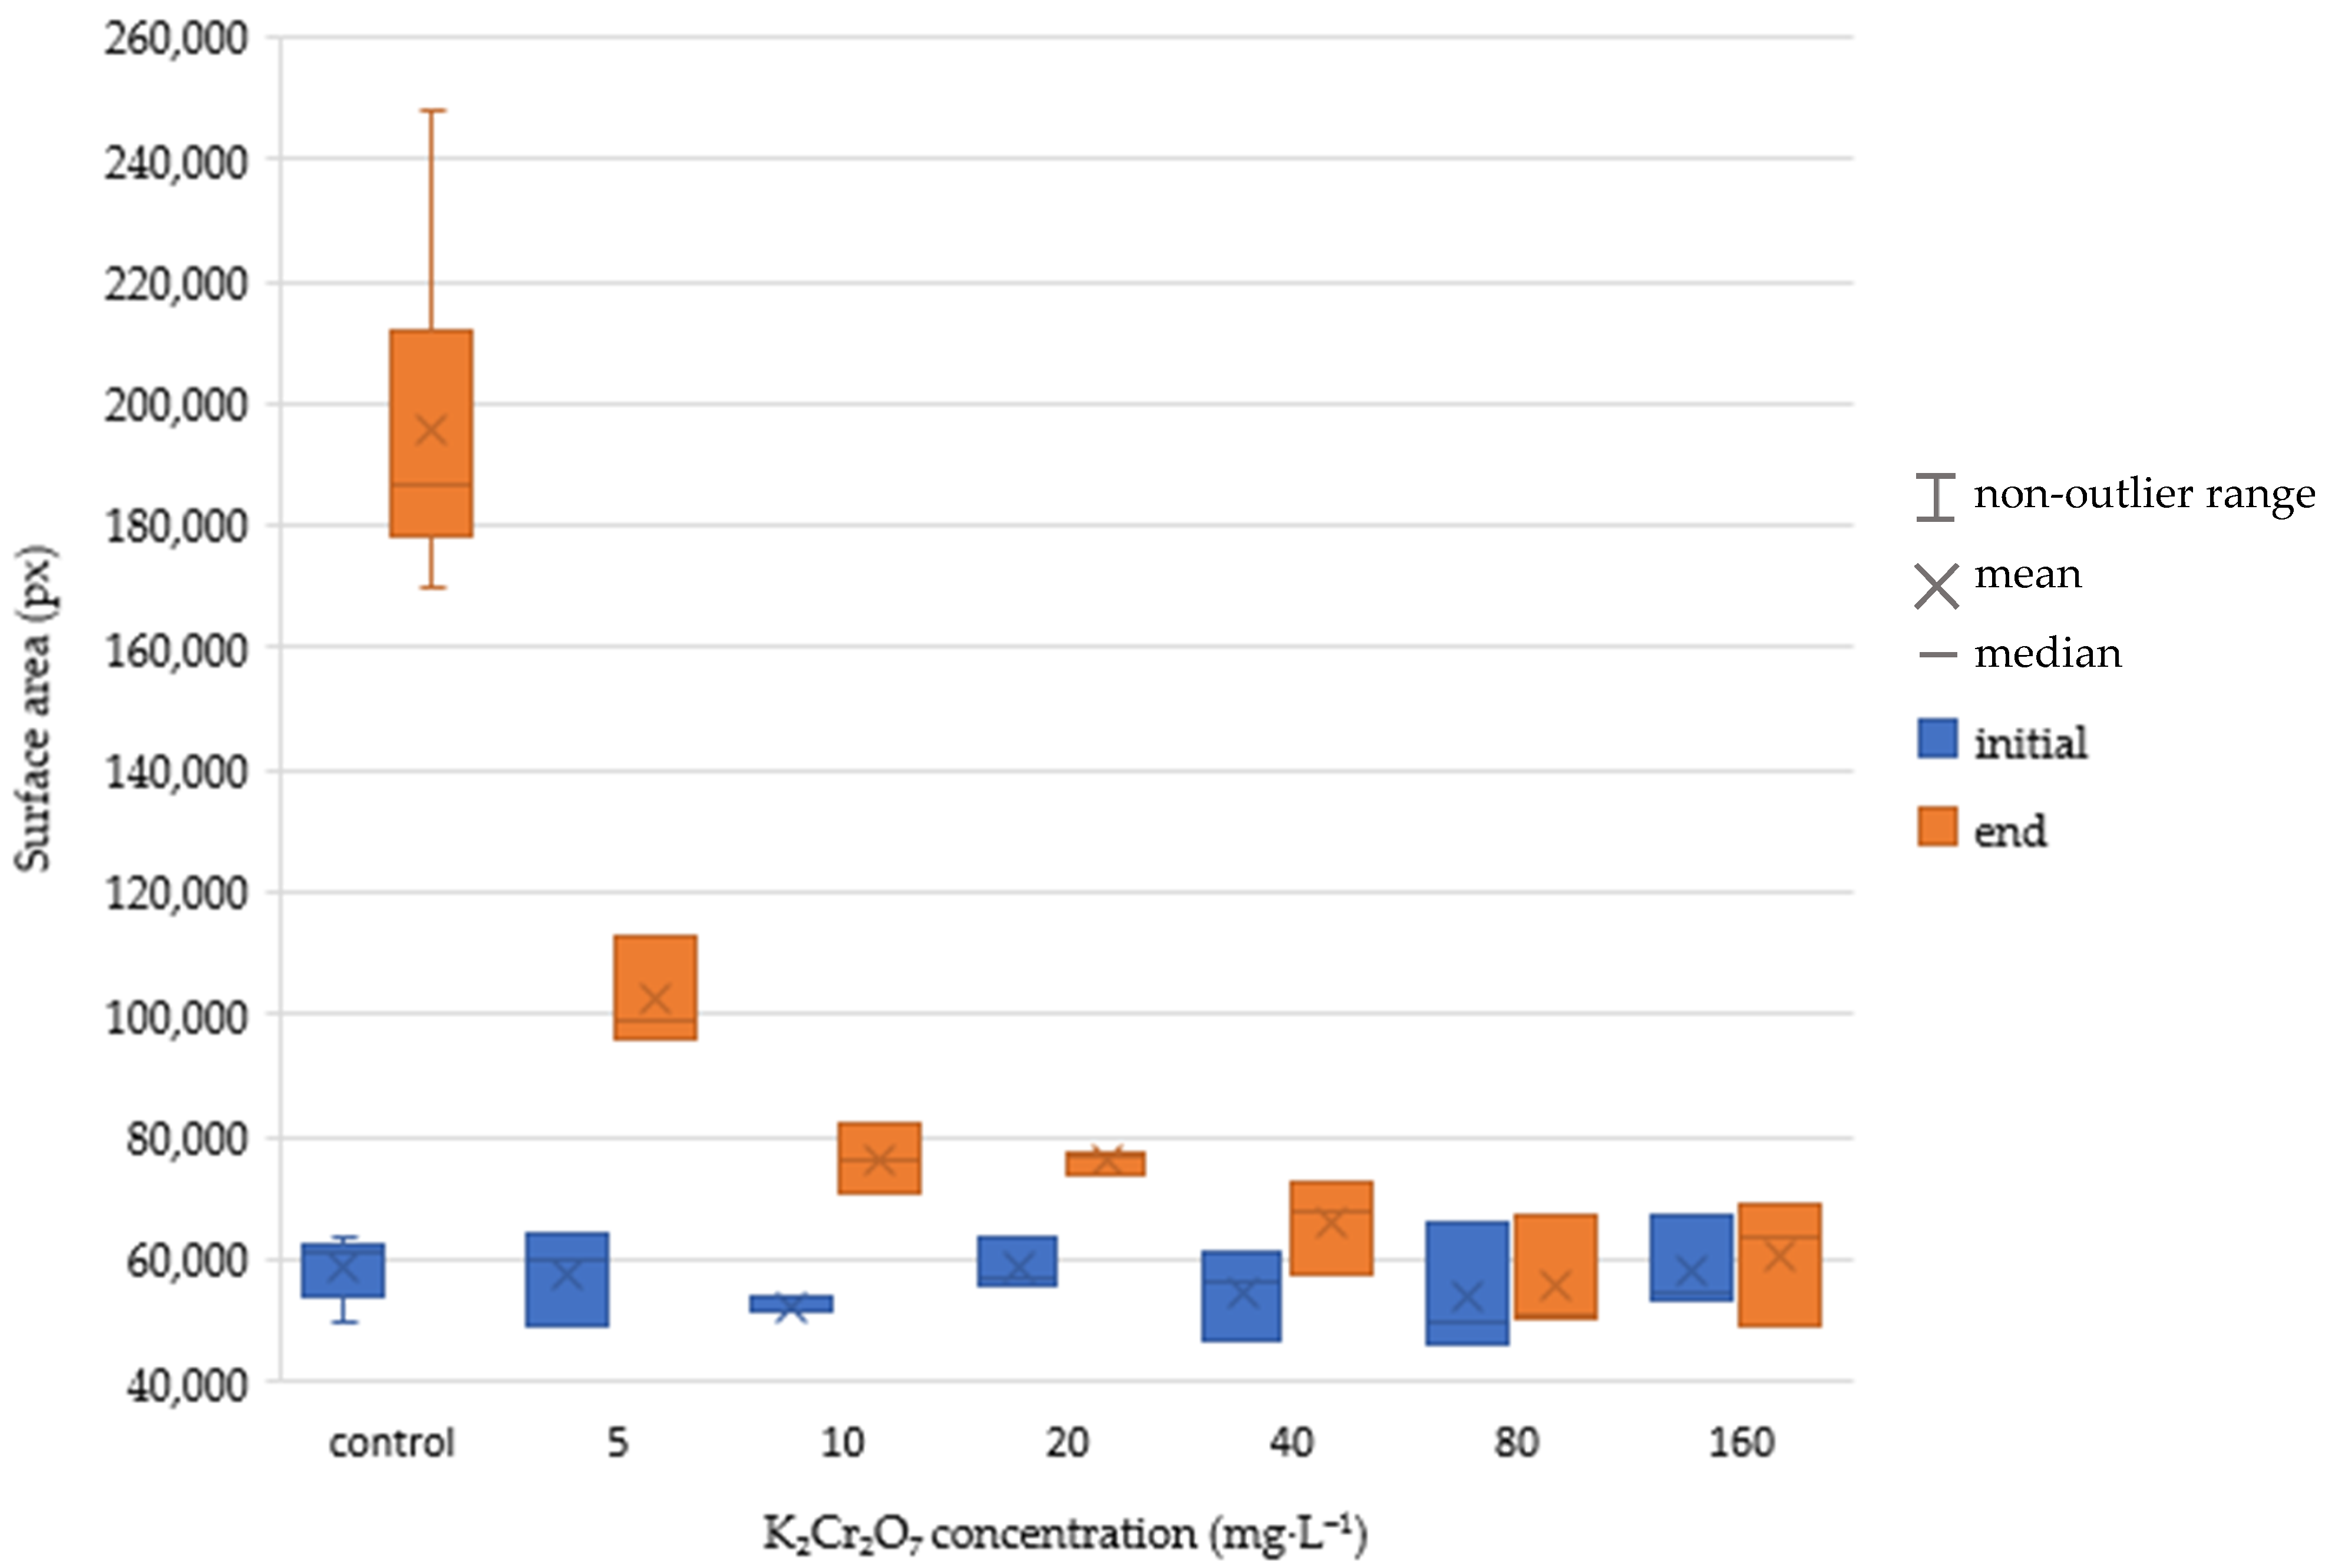
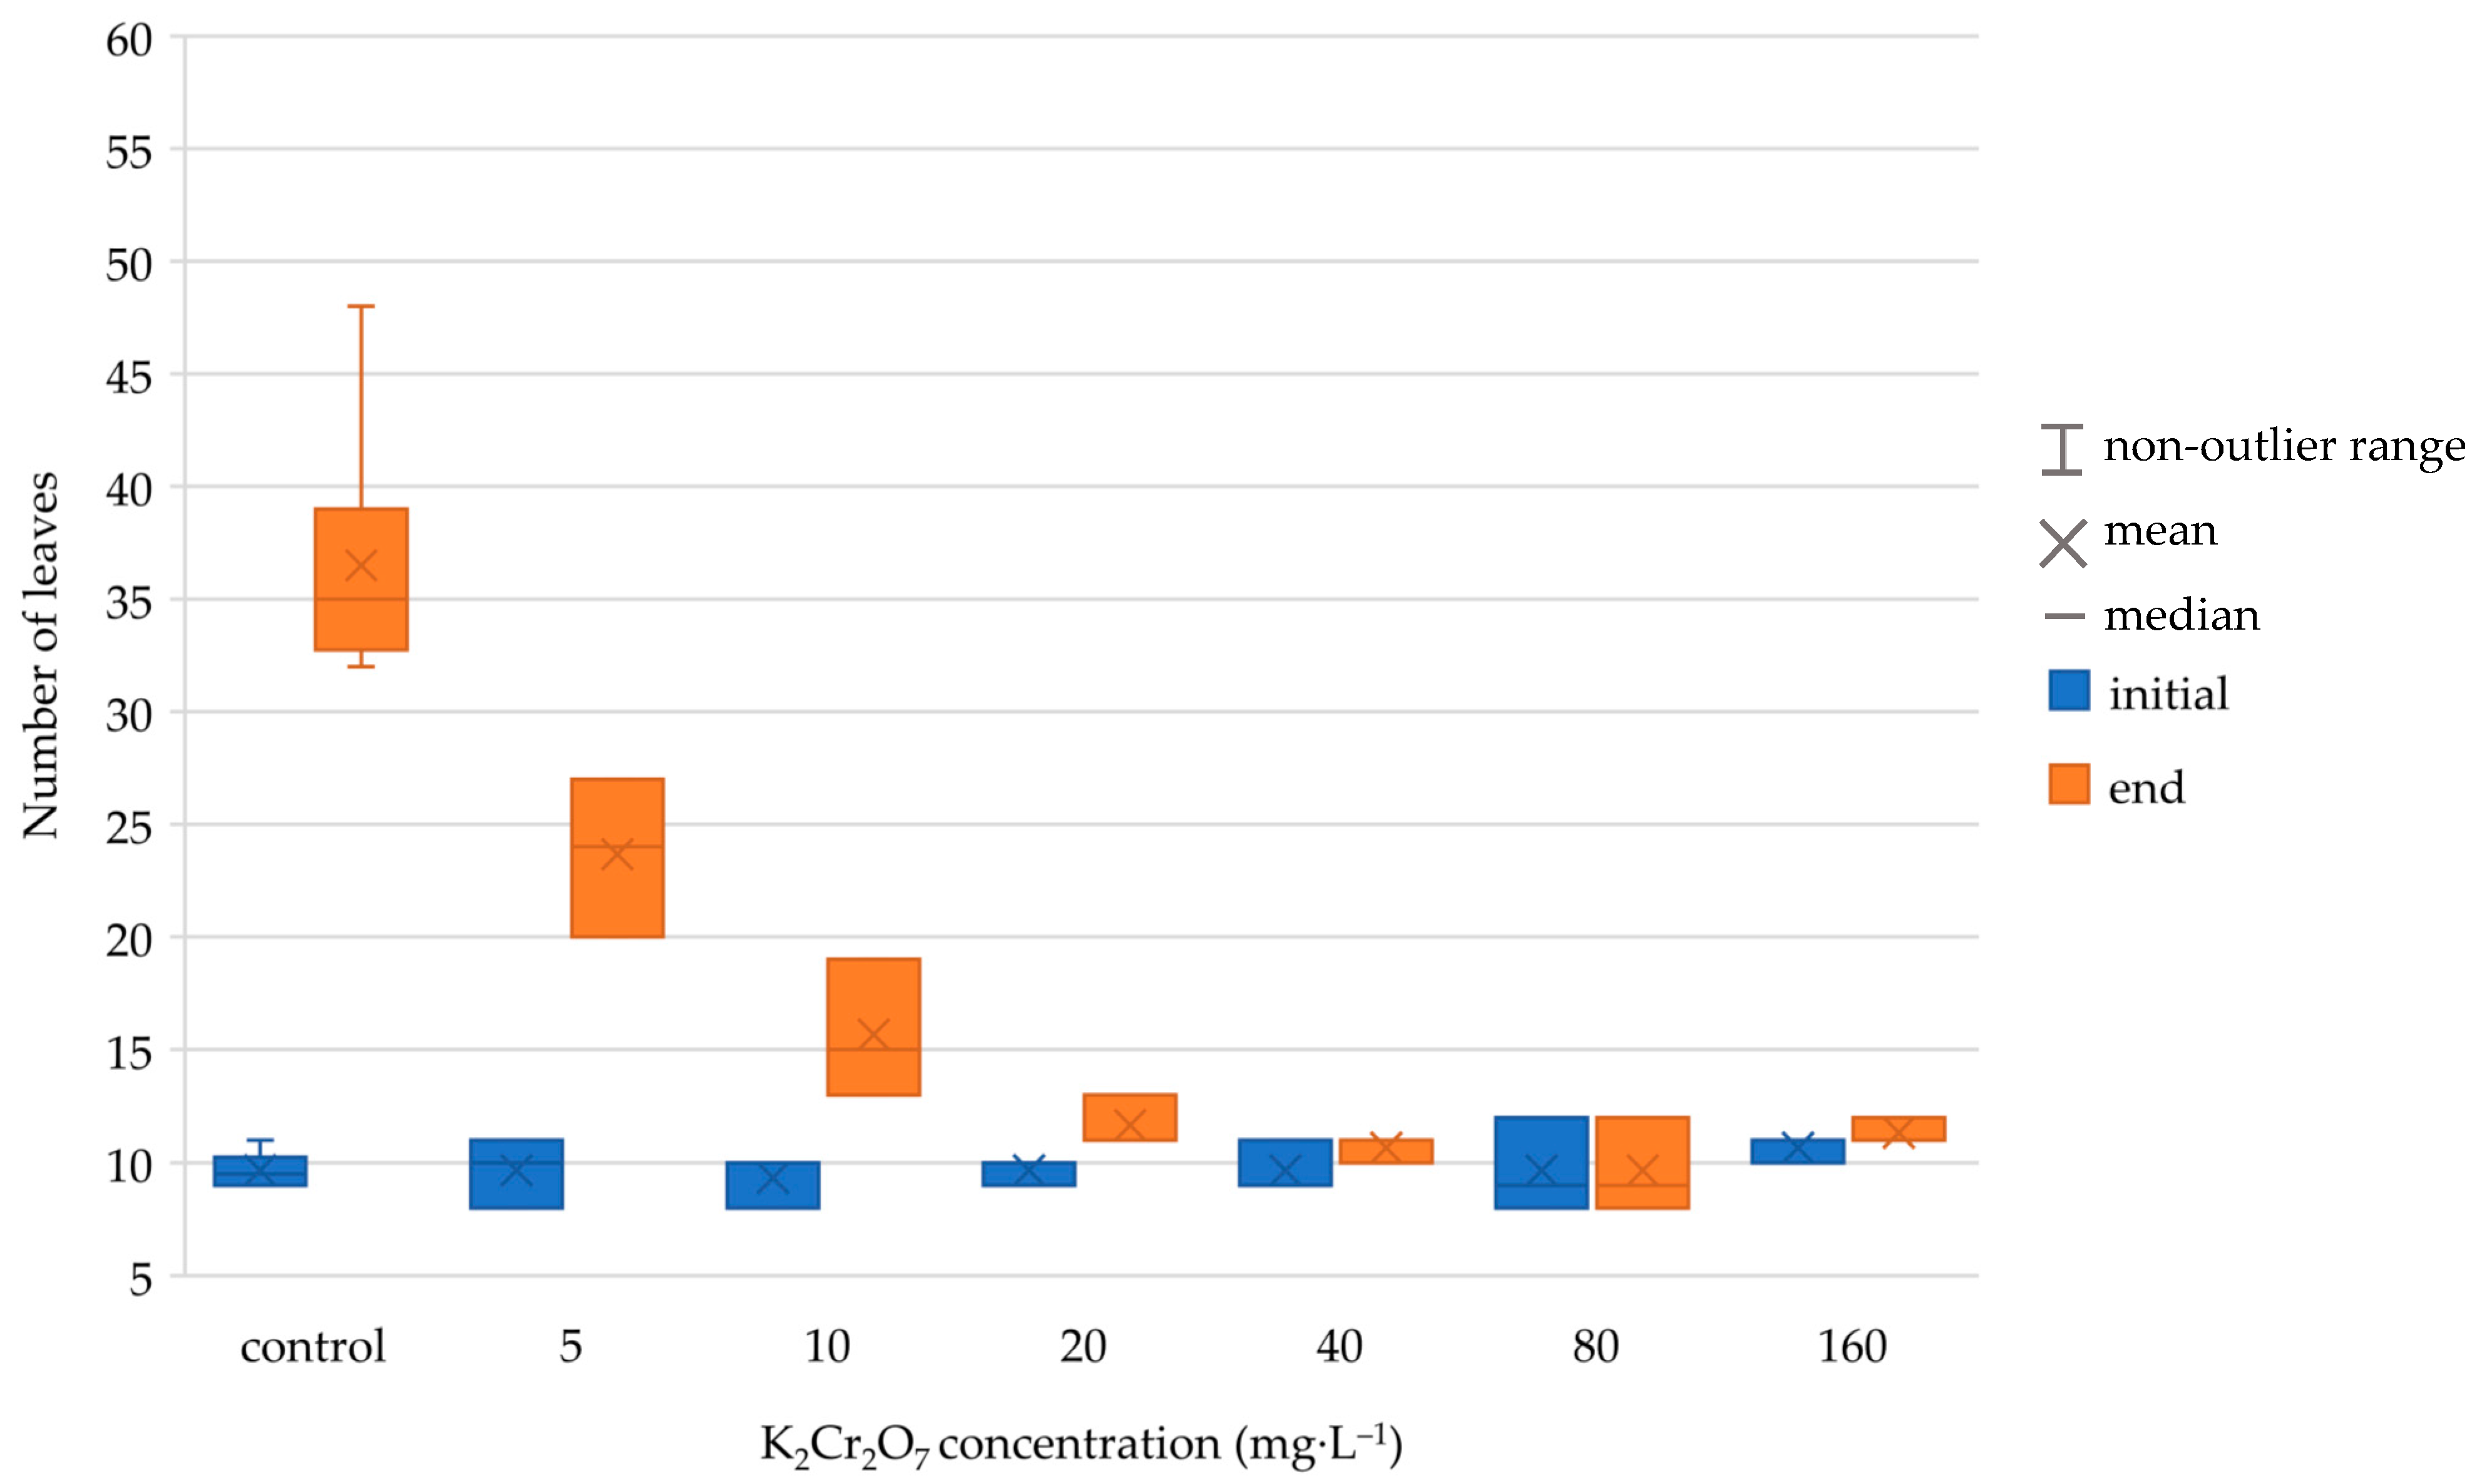
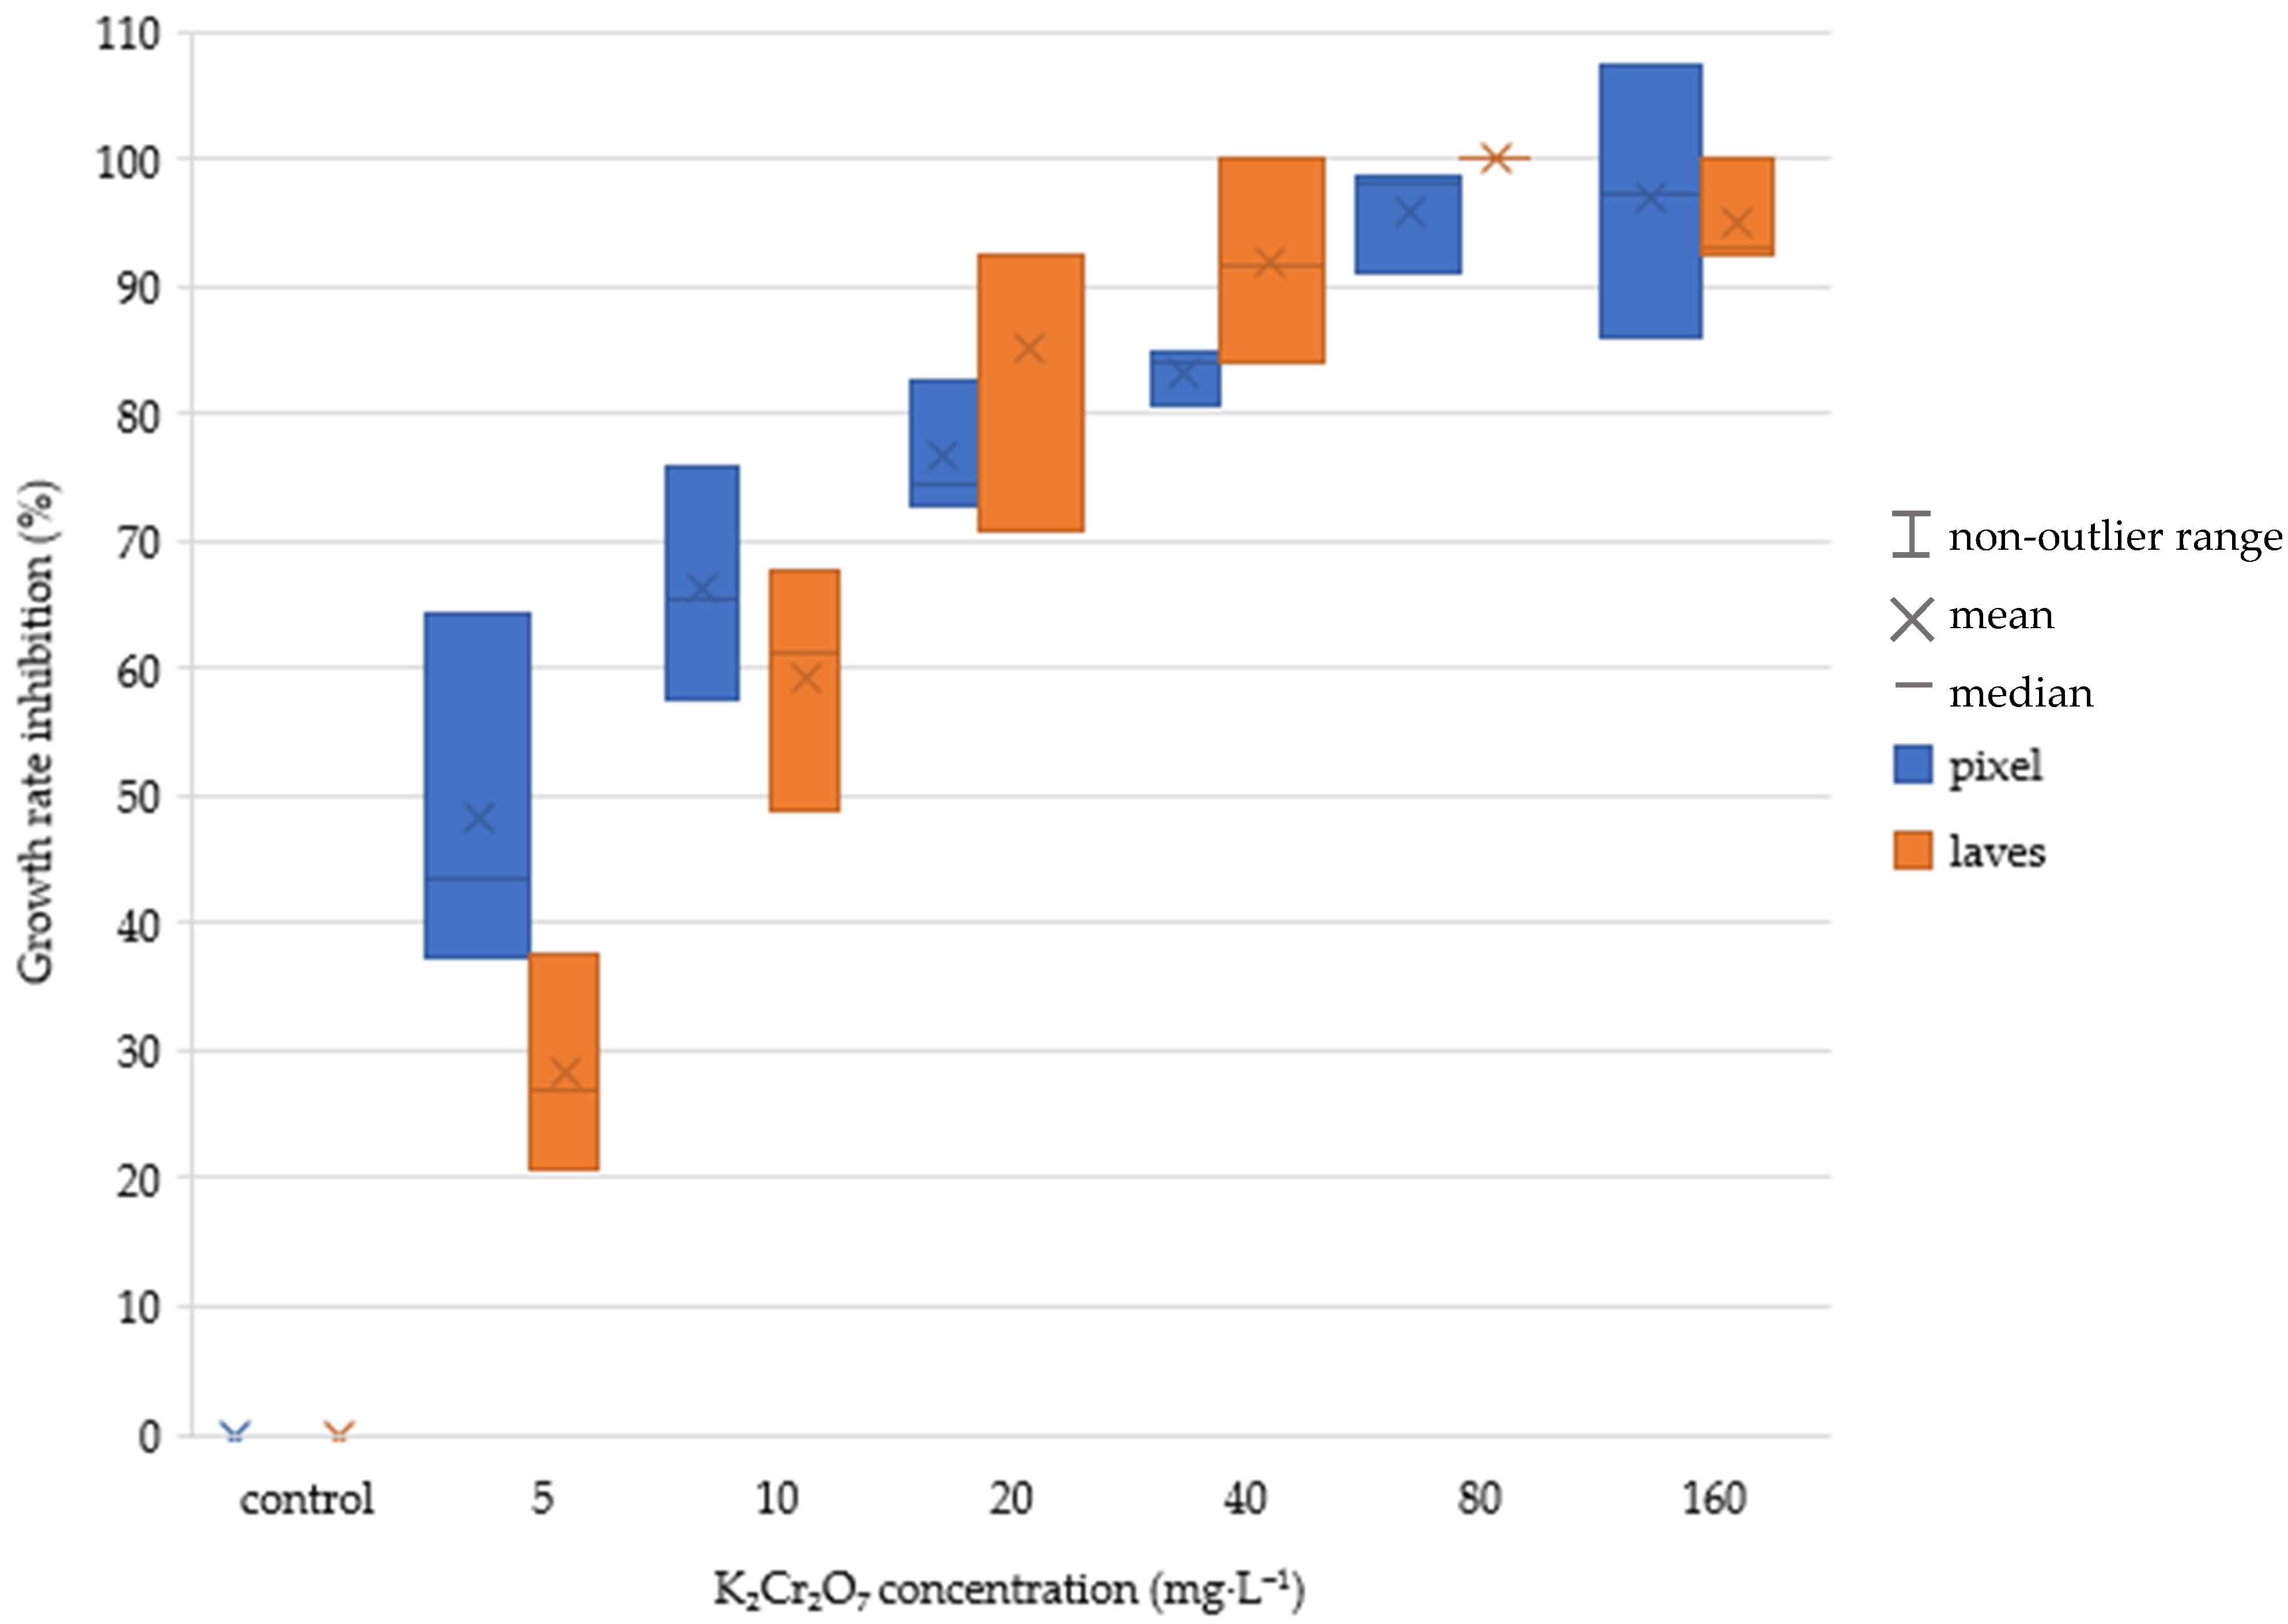
Table 3. Unfortunately, we were not able to maintain the recommended temperature of 24 °C during the test, which caused lower growth rate values in the control than required by the ISO standard. However, it was still possible to compare the two methods of evaluation. The method using image processing showed significantly higher values of growth inhibition, especially at the lowest tested concentrations. A box and whisker plot representation of the result is in
Figure 5,
Figure 6,
Figure 7 and
Figure 8. There are significant differences in growth rate and growth rate inhibition, especially at concentration values 5 and 10 mg·L
−1. This could be attributed to the fact that low concentration of the toxic substance did not yet have much impact on the number of leaves grown but rather on their size. The differences in concentrations between 20–160 mg·L
−1 were not so significant. In both evaluation methods, higher K
2Cr
2O
7 concentrations caused higher growth rate inhibition (number of leaves and pixels). In case of lower toxic concentrations, using the area counting method may lead to more accurate measurements.
Figure 9 and
Figure 10 depict the evaluation of EC50 by both methods. Only the values of growth rate inhibition that are lower than 100% have to be used for the calculation, therefore the regression line consists only of these values (black points on the graph). According to the leaves counting method, the EC50 had a value of 8.50 mg·L
−1, which lies within the expected range. According to the image processing method, the EC50 was 3.05 mg·L
−1, which is slightly below the mentioned range. A lower value of EC50 means higher toxicity. It can be concluded that the toxic effect was more significant in the case of the leaves-occupied area than in the case of the number of leaves.
6. Discussion
In this study, the image processing-based method was used for the
Lemna minor bioassay evaluation. According to the ISO 20079: “Water quality—Determination of the toxic effect of water constituents and waste water on duckweed (
Lemna minor)—Duckweed growth inhibition test” [
4], the main indicator of the assay evaluation is the number of leaves. However, our study shows that the number of leaves is not as precise an indicator as the leaves-occupied area and can cause significant differences mainly for lower toxic concentrations.
The image processing approach was faster and more precise since it enabled us to detect the negative effect of the tested substance on the size of the leaves, not just on their number. Also, the errors caused by the human factor during the leaves counting were eliminated when using the image processing. On the other hand, overlapping leaves can cause a false negative result (smaller occupied area) if overlooked. Therefore, it is necessary to carefully check and detach the overlapping leaves before processing. More details of our proposed and used low-cost, reliable method and algorithm can be found in previous works [
16,
17,
18].
In the work [
15], authors showed a strong correlation between frond area and fresh biomass weight of the
Lemna minor. Based on this, computer image analysis was used to measure the plant surface area. It was confirmed that the
Lemna minor reacts to a toxic environment (pollution by detergents) by changing the surface area, thus modern techniques such as computer image analysis can be used to evaluate assays. A small disadvantage of the study [
15] is that the weight of the fresh biomass is not considered as a second indicator, but the dry biomass weight as required in the ISO 20079 standard [
15]. However, results of experiments confirm that computer image analysis can provide important support in the bioassays. Technical details of the proposed method are not described in depth.
Both our results and the results of [
15] confirm that the application of modern technologies, such as computer image processing, and in combination with reliable low-cost hardware for bioassays evaluation, may lead to new standards for quantified and more objective evaluation of the negative influence of toxins on bioindicators. This also leads to the need to perform similar experiments and confirm the need for new, more accurate metrics. However, such experiments require the cooperation of seemingly different scientific disciplines. The synergy of such disciplines is rare, resulting in a low number of similar research works.
In the following research, our aim is to also include color evaluation (hue) in the image processing, which can further improve the sensitivity of the test since many toxic substances cause color changes of the leaves (e.g., a white color is caused by necrosis and a yellowish color by chlorosis). This effect is hard to quantify when using the standard method of counting leaves and can be easily overlooked, especially if the leaves growth has not yet been affected by the toxic substance.
7. Patents
The system for visual evaluation of the
Lemna minor bioassays mentioned in
Section 4 and in our previous work [
16] is protected by the utility model number 8230 by the Industrial Property Office of the Slovak Republic [
18].
Author Contributions
Conceptualization, O.H. and B.U.; methodology, O.H.; software, E.K.; validation, E.K., J.C., and B.U.; formal analysis, B.U.; resources, B.U.; data curation, J.C.; writing—original draft preparation, B.U.; writing—review and editing, O.H. and A.K.; visualization, J.C.; supervision, P.D. and A.K.; project administration, E.K.; funding acquisition, P.D. and A.K. All authors have read and agreed to the published version of the manuscript.
Funding
This work has been supported by the Cultural and Educational Grant Agency of the Ministry of Education, Science, Research and Sport of the Slovak Republic, KEGA 038STU-4/2018 and KEGA 016STU-4/2020, by the Slovak Research and Development Agency APVV-17-0190.
Conflicts of Interest
The authors declare no conflict of interest.
References
- Mendonça, E.; Picado, A.; Paixão, S.; Silva, L.; Barbosa, M.; Cunha, M. The Role of Ecotoxicological Evaluation in Changing the Environmental Paradigm of Wastewater Treatment Management. In Proceedings of the 6th Dubrovnik Conference on Sustainable Development of Energy, Water and Environment Systems (SDEWES 2011), Dubrovnik, Croatia, 25–29 September 2011; pp. 7–11. [Google Scholar] [CrossRef]
- Bundschuh, M. The Challenge: Chemical and ecotoxicological characterization of wastewater treatment plant effluents. Environ. Toxicol. Chem. 2014, 33, 2407. [Google Scholar] [CrossRef]
- Kuznetsova, T.; Politaeva, N.; Smyatskaya, Y.; Ivanova, A. Lemna Minor Cultivation for Biofuel Production. IOP Conf. Ser. Earth Environ. Sci. 2019, 272, 022058. [Google Scholar] [CrossRef]
- ISO 20079:2005. Water Quality—Determination of the Toxic Effect of Water Constituents and Wastewater on Duckweed (Lemna Minor)—Duckweed Growth Inhibition Test; ISO: Geneva, Switzerland, 2005. [Google Scholar]
- Nowakowski, K.; Boniecki, P.; Tomczak, R.J.; Raba, B. Identification process of corn and barley kernel damages using neural image analysis. In Proceedings of the Third International Conference on Digital Image Processing (ICDIP 2011), Chengdu, China, 15–17 April 2011. [Google Scholar]
- Sozzani, R.; Busch, W.; Spalding, E.P.; Benfey, P.N. Advanced imaging techniques for the study of plant growth and development. Trends Plant Sci. 2014, 19, 304–310. [Google Scholar] [CrossRef] [PubMed]
- Nowakowski, K.; Boniecki, P.; Dach, J. The identification of mechanical damages of kernels basis on neural image analysis. In Proceedings of the 2009 International Conference on Digital Image Processing, Bangkok, Thailand, 7–9 March 2009. [Google Scholar]
- Dyrmann, M.; Karstoft, H.; Midtiby, H.S. Plant species classification using deep convolutional neural network. Biosyst. Eng. 2016, 151, 72–80. [Google Scholar] [CrossRef]
- Rodrigues, M.; Kormann, M.; Schuhler, C.; Tomek, P. An intelligent real time 3D vision system for robotic welding tasks. In Proceedings of the 2013 9th International Symposium on Mechatronics and its Applications (ISMA), Amman, Jordan, 9–11 April 2013; pp. 1–6. [Google Scholar]
- Laganieère, R. Over 50 recipes to master this library of programming functions for real-time computer vision. In OpenCV 2 Computer Vision Application Programming Cookbook; Packt Publishing: Birmingham, UK, 2011; ISBN 9781849513241. [Google Scholar]
- Neves, A.C.; González, I.; Leander, J.; Karoumi, R. A new approach to damage detection in bridges using machine learning. In Lecture Notes in Civil Engineering; Springer International Publishing: Cham, Switzerland, 2018. [Google Scholar]
- Wierzbicki, D. Calibration Low-Cost Cameras with Wide-Angle Lenses for Measurements. J. Autom. Mob. Robot. Intell. Syst. 2018, 12, 45–51. [Google Scholar] [CrossRef]
- Vaverková, M.D.; Elbl, J.; Koda, E.; Adamcová, D.; Bilgin, A.; Lukas, V.; Podlasek, A.; Kintl, A.; Wdowska, M.; Brtnický, M.; et al. Chemical Composition and Hazardous Effects of Leachate from the Active Municipal Solid Waste Landfill Surrounded by Farmlands. Sustainability 2020, 12, 4531. [Google Scholar] [CrossRef]
- Rahaman, M.M.; Chen, D.; Gillani, Z.; Klukas, C.; Chen, M. Advanced phenotyping and phenotype data analysis for the study of plant growth and development. Front. Plant Sci. 2015, 6. [Google Scholar] [CrossRef] [PubMed]
- Mazur, R.; Szoszkiewicz, K.; Lewicki, P.; Bedla, D. The use of computer image analysis in a Lemna minor L. bioassay. Hydrobiologia 2018, 812, 193–201. [Google Scholar] [CrossRef]
- Haffner, O.; Kucera, E.; Urminska, B.; Kozak, S. Proposal of system for visual evaluation of lemna minor bioassays. In Proceedings of the 29th International Conference on Cybernetics and Informatics, K and I 2018, Lazy pod Makytou, Slovakia, 31 January–3 February 2018. [Google Scholar]
- Haffner, O.; Kucera, E.; Kozak, S.; Urminska, B. Application of Information Technologies for Visual Evaluation of Lemna. Int. J. Inf. Technol. Appl. 2018, 7, 85–97. [Google Scholar]
- Haffner, O.; Kučera, E.; Urminska, B. System for Visual Evaluation of Lemna Minor Growth Inhibition in Ecotoxicity Tests: Utility Model (in Slovak). Available online: https://wbr.indprop.gov.sk/WebRegistre/UzitkovyVzor/Detail/145-2017 (accessed on 16 June 2020).
© 2020 by the authors. Licensee MDPI, Basel, Switzerland. This article is an open access article distributed under the terms and conditions of the Creative Commons Attribution (CC BY) license (http://creativecommons.org/licenses/by/4.0/).

