1. Introduction
Iran is a country with an arid-to-semiarid climate and an average precipitation of 250 mm/year, the exception being the northern parts which receive up to 2000 mm of precipitation per year. Scarcity of surface water resources in across large parts of the country has led to overexploitation of groundwater resources in alluvial plains as well as in karst aquifers. As heterogeneity is the main characteristic of karst, its hydrological behavior can be characterized by temporally and spatially changeable processes of recharge, storage, and flow type [
1,
2]. Underground water resources in the karst terrain are more vulnerable to negative effects than non-karst underground water resources. One of the reasons for that is the variability of thickness and composition of soil cover. In cases where the overlying soil cover is shallow or absent, there is little or no enhancement of water quality before surface water enters the aquifer system. Pollutants can also spread quickly in karst, on the order of kilometers per day, in contrast to meters per year in most non-karst aquifers. In order to ensure reliable supply of water for consumers, a detailed understanding of the extent of the aquifer recharge area, hydraulic characteristics, and inherent vulnerabilities of the aquifer is needed, as well as an understanding of how pollutants move through the analyzed system [
3].
More than 50 exploration wells have been drilled in two karstic anticlines in the surroundings of Kazeroon City since mid-1980s. The majority of the wells are pumped and exploited for drinking and agricultural usages. A rapid increase in the number of drilled wells caused a significant decrease of the water table. In addition, the karstic spring Sasan is a vital source of water for Bushehr, a coastal city in the Persian Gulf. Population growth and shortages of high quality drinking water in the area created a need for a detailed study and recognition of karst resources in the Kazeroon County [
4].
The appropriate selection of the research method is the most important factor in achieving the reliable evaluation of the problem at hand. The best way to develop a comprehensive understanding of groundwater is the use of direct data instead of data acquired from indirect methods [
5]. For the needs of this research, two methods have been chosen—stable isotope analysis and multiple tracer test.
Stable and radioactive environmental isotopes have been known for several decades as an effective tool in studying groundwater and understanding complex, heterogeneous hydrological systems like karst catchments [
6,
7,
8,
9]. Isotopes are cost-efficient, accurate, and easy-to-use [
7] and provide a direct insight into the movement and distribution processes within aquifers [
5]. Isotopes present a valuable tool in determining aquifer–aquifer interconnection, relations between surface waters and groundwaters, source and area of recharge, and muchmore crucial information in understanding movement and distribution processes within hydrological systems [
10].
Oxygen-18 and deuterium are the most common isotopes employed in hydrology and hydrogeology used for a variety of purposes. Water isotopes are naturally “injected” in a diffuse way during rainfalls over the whole catchment and can be used as excellent conservative tracers [
11]. Since oxygen and hydrogen isotopes are part of the water molecule itself, they are perfect tracers for hydrological applications. At the same time, they are not chemically reactive within the environment at ambient temperatures [
12]. The isotopic composition of natural waters is reported as a deviation (δ) fromreference Standard Mean Ocean Water (SMOW):
Naturally occurring range of deviations vary from −450 to +100‰ for δD and −60 to +10‰ for δ
18O. In Iran, as in other developing countries, the use of isotopes in hydrological and hydrogeological research is of recent date. The first hydrology study of this kind was conducted by Zak and Gat in 1975 where isotopes were used to identify the source of water salinity and residual brines in Shiraz, southern Iran [
13]. Climate change in Tehran was analyzed in [
6] by studying the concentration of
18O and deuterium in precipitation water. The effect of temperature, quantity, and elevation on the deuterium and
18O concentrations of precipitation in Tehran and Kabul has been estimated by [
14]. Study in [
15] provides the composition of
18O and
2H isotopes in precipitation of the West Zagros area. Researchers in [
16] define a local meteoric water line (LMWL) for Shahrood in the northeastern part of Iran. The paper [
17] studied the relationship between meteoric and groundwater isotope compositions in the Mashhad County in northeastern Iran.
However, better insight and more information can be obtained if isotopes are used in combination with other hydrogeological methods, such as hydrological tracing. Hydrological tracer testing is a trustworthy diagnostic method available for determining flow trajectories and hydrologic networks and for determining fundamental hydraulic and geometric parameters [
18]. Inkarst, artificial tracers are typically injected into sinkholes or boreholes andprovide information primarily on preferential flow paths along subsurface conduits [
1]. The dye tracing test can be used to define the recharge areas of karst aquifer and to identify connections between potential recharge and discharge points of aquifers. The results of the tracing test can also be used as a predictive technique in case of presence of contaminants in a karst aquifer.
The groundwater tracing test with the use of conservative, artificial tracers has a long history of use in the exploration of subsurface transport characteristics in karst aquifers [
19]. The extensive use of sodium uranine as an artificial tracer started as early as the 19th century with a tracer test whose purpose was to prove the connection between the seepage of the Danube River in its riverbed and the Aach spring, a Rhine tributary [
20,
21]. In the beginning, the tracing method was typically used to determine connections between sinking rivers and springs. Later, the method advanced and allowed obtaining comprehensive information on the characteristics of the groundwater flow and the transfer of substances in different parts of the karst system [
22]. Various chemical compounds or even sediment particles can act as tracers [
23]. In the dry periods, water flows along preferential paths in soil and rocks of the vadose zone. The bulk of infiltrated precipitation and different substances carried in the water are stored in less permeable parts and flush out during events of intensive precipitation [
24]. Despite widespread belief, karst aquifers are not always “fast-flushing” systems. Tracers or contaminants can sometimes be deposited in immobile fluid regions of the aquifer or epikarst and be slowly discharged intoactive conduits, causing long-lasting tracer breakthrough or contamination [
25]. A similar behavior can be seen in shallow, unconfined alpine karst aquifers where water and tracer can infiltrate into previously unsaturated parts of the aquifer and/or into the fissured limestone matrix and from which it then can be gradually released during a recession period [
26]. Results of tracing test can also be used as input information for a variety of other investigations like determination of conduit network geometry, degree of karstification, etc. [
27]. The tracer test has a practical application in environmental studies because it helps to identify the most vulnerable points and areas of an aquifer and to delineate water protection zones. An exact determination of the catchment area is the starting point for all hydrological analysis and calculations. The size of the catchment area is important for establishing monitoring networks and management of water resources in the context of regional planning and protection of groundwater quality.
The aim of the conducted research was to contribute to a better understanding of hydrological relations around thekarst aquifer vital to the water supply sustainability of Kazeroon. According to water balance calculation, the catchment basin of the investigated karst springs is not limited to Dashtak anticline only [
28]. The goal of the tracer test was to determine whether the recharge area of the Sasan spring and the springs important for water supply of Kazeroon extends beyond the Dashtak North aquifer and to confirm thehydraulic connection between Dashtak North and Asmari Shahneshin aquifer. Another purpose of tracing was to determine a possible infiltration of tracer and water through the riverbed and whetherthe tracer from the river occurs in the springs immediately adjacent to the Shahpour River. Since the Shahpour River is considered to be a hydraulic barrier between the Dashtak North and South aquifer, Renjan spring was added to the sampling points to see whether there is any hydraulic connection between Asmari Shahneshin, Dashtak North and South.
2. Climatic, Geological, and Hydrogeological Setting of Study Area
Kazeroon County is located in southwestern Iran (Zagros Mountains) and the study area is in the northeast of Kazeroon (
Figure 1). From a geological point of view, the study area is a part of the Zagros folded zone which is characterized by long and regular anticline and syncline folds. The Zagros Fold-Thrust Belt, which lies on the northeastern margin of the Arabian Plate, is part of the Alpine-Himalayan orogenic belt [
29]. The Zagros Mountains were formed by a collision of the Eurasian and Arabian tectonic plates. Today, they are an essential source of surface water and groundwater in Iran. The groundwaters incarbonate aquifers can emerge at karst springs, discharge to the adjoining alluvial aquifer, or flow into traversing rivers such as the Shahpour River [
30].
Three important anticlines in this area are Dashtak, Shahneshin, and Salbiz (
Figure 2). Dashtak anticline has a northwest-southeast orientation and is about 40 km long. Dashtak anticline consists of 3 different formations: Sarvak, Pabdeh-Gurpi, and Asmari-Jahrum formation. Upper Cretaceous Sarvak Formation (Sv) consists of Orbitolina massive limestones with cherts and rudist limestones [
32]. Pabdeh-Gurpi Formation (Pd-Gu) is the upper Cretaceous to Eocene–Palaeocene age and contains marls, bluish grey shales, and layers of limestone with clay intercalations. Asmari-Jahrum Formation (As-J) is of the Oligocene-Miocene ages and is well-known as a major hydrocarbon reservoir in the Zagros Basin. It is dominantly formed of limestone and dolomitic limestone [
33]. The Shahneshin anticline is parallel to the Dashtak anticline and consists of Kazhdumi, Sarvak, Pabdeh-Gurpi, Asmari, and Gachsaran Formation. Miocene Gachsaran Formation (Gs) contains rock salt, anhydrite, colorful marls, limestone, and bituminous shale [
32]. Kazhdumi Formation (Kz) is one of the Bangestan Group formations aging late early Cretaceous. It consists of tarry dark grey shales and layers of dark clay limestones and marls [
34]. The third anticline, Salbiz, lies in the northeast and is divided from the Dashtak anticline by Qatar-Kazerun fault. It consists of the Asmari-Jahrum formation which is surrounded by Gachsaran and Pabdeh-Gurpi formations.
One of the significant and influential geological features of the study area is definitively the Kazeroon fault. The regional strike-slip fault of Qatar–Kazerun passes in the vicinity of the northwest plunge of the Dashtak anticline and continues to the south in the Kazeroon plain. In the west part of the anticline, the branches of the Kazeroon fault havecrushed, resulting in the formation of quite a few small sections of the carbonate aquifers [
35]. Using the water budgeting, the catchment area for Sasan spring was calculated including adjacent karstic aquifers. The results have shown negative water balance of 70 million m
3in the Dashtak North aquifer, meaning that the main catchment of Sasan spring could be supplied from the three other aquifers (Northern Shahneshin (ShN), Northern Asmari Shahneshin (ShN(As), and Salbiz (S)) via the Qatar-Kazeroon fault). In this way, it has an active role in the supply of the Sasan spring water [
28].
The most significant water resources in the Zagros Mountains area are karstic aquifers, which outcrop over 20 percent of the Zagros surface. The Kazeroon County is a large, complex hydrogeological unit which can be divided into seven karst and five alluvial subaquifers. The high altitude karst subaquifers are the Renjan and the Sasan aquifers. They both discharge at the surface of the Tange Chugan area and form the Shapour River. The remaining karst subaquifers are Dashtak, Sarvak, Parishan, Sarbalesh, and Dadin. Five alluvial subaquifers (Shapur, Kazerun, Famour-Parishan, and Chenar Shahijan) have developed in syncline valleys.
The karst aquifers of Zagros have been the subject of numerous research studies with the aim of a better understanding of the complex geological and hydrogeological relationships that prevail in the area [
30,
36,
37,
38]. Kazeroon County consists of several karst zones which developed mainly due to the dissolution of carbonate rocks—Bushigan, Sarbalesh, Salbiz, Dashtak, and Naser Abad karst zones [
39]. There are six zones in the surroundings of Kazeroon—Dashtak North aquifer (DN), Dashtak South aquifer (DS), North Shahneshin aquifer (ShN), North-Shahneshin aquifer in the Asmari formation (ShN-As), South Shahneshin aquifer (ShS), and Salbiz aquifer(S) [
28].
Other karst features that have developed in this area include karst springs (Seyed Hossain and Sasan spring in the Dashtak karst area), and karst valleys like Tange Chogan. Important morphological phenomena in Kazeroon County are the caves such as Marmar, Shahpour, and Sasan caves [
28]. The Shahpour cave with its length of 300 m and the width of 30 m is another important karst feature 15 km away from the Kazeroon.
The most important sediments from the hydrogeological point of view are the thick massive limestones with medium-bedded dolomite of the Oligocene-Miocene Asmari Formation and the evaporites of the Miocene Gachsaran Formation. The retention capacity of karst subaquifers is relatively good with a somewhat long residence period [
39]. Aquifers formed in the Asmari Formation vary in hydraulic characteristics and behavior and have been an object of interest of many scientific studies [
28,
30,
37]. Asmari and Sarvak are crucial karst formations and create the largest karst aquifers and reservoirs with numerous spring discharges. The most important spring in the Dashtak anticline is Sasan spring, but one cannot overlook several smaller adjacent springs. The Asmari karst formation has a higher infiltration rate than the Sarvak karst formation [
4].
The deep Chugan Valley formed by the action of the Shapour River divides the Dashtak anticline near its northeastern plunge apex into two hydrogeological units—Shapour mountain in the north and Davan mountain in the south. Although Shapour River drains both parts, they are considered as two separate aquifers—Dashtak North aquifer and Dashtak South aquifer.
The Sasan and Seyed Hossain springs, with an annual discharge of approximately 40 million and 33 million L of water, respectively, are the largest springs located in the Dashtak North aquifer. Sasan spring is an important source of water for Kazeroon, as well as Bushehr, an important harbor city located on the coast of the Persian Gulf. The Sasan spring main outlet is at 813.56 m a.s.l. with an average discharge of Q = 6.3 m
3/s [
36,
39,
40]. The karst springs of Dashtak play an important role in the hydrology of the Shapour River. According to water balance calculation, the catchment basin of those springs is not limited to the Dashtak anticline only. This applies especially to the Sasan spring [
28]. Average discharge rates of theSasan spring is 2700L/s, Seyed Hossain 1630L/s, and Ghale Naranji 360 L/s [
4]. Another important spring in the area is the Arjan spring. It is a perennial spring with a discharge rate fluctuating between 750 and 100 L/s. The Arjan spring discharges the Shahneshin anticline (Asmari Formation) and plays a significant role in the hydrology of the Dasht-e Arjan wetland, a Wetland of international importance. Dasht-e Arjan Lake is a moderately saline lake located in a polje in the northern part of Kazeroon. The Arjan polje is a graben created by two normal faults and contains more than 50 sinkholes. The lake has a changing area varying from less than 0.5 to an almost 5 km
2 and serves as a collector of the snow waters from the high elevations in the area. During a wet season, the waters of Dasht-e Arjan Lake sink through a single ponor in the southwest corner of the lake into a karst subterraneous system with possible hydrological connection to the springs in the vicinity of Lake Parishan [
39,
40,
41,
42].
Since the Zagros Mountain range spans for over 1600 km, it includes various climatic zones, southern parts being dry and hot while northern parts are humid and cold. With heights up to 4000m and a very complex relief, the Zagros Mountain range affects the quantities and distribution of precipitation [
43]. Even the neighboring Dashtak and Shahneshin anticlines have somewhat different quantities of precipitation. The average annual rainfall for Dashtak anticline is about 732 mm/year and for Shahneshin anticline is 845.5 mm/year. The Kazeroon County has an evaporation rate of 3883 mm/year with the maximum in July–August and the minimum rates inJanuary–February [
28]. The potential evapotranspiration estimated for the Kazeroon station is 1939 mm. The Kazeroon lies at 855m above sea level and is influenced by the local steppe climate. The average temperatures vary from 9.3 °C in January to 34.3 °C in August. The average annual relative humidity of the study area is about 58.5%. This location is classified as BSh by Köppen and Geiger climate classification concept [
44]. The main sources of humidity during thewet period of the year (November to April) are four air masses—Maritime polar, Mediterranean, continental polar, and continental tropical. Mediterranean air mass is the most active one and it influences the whole of Iran during March and April. The study area is under dominant influence of the Mediterranean, continental tropical and maritime polar air masses [
45]. The majority of the springs is highly dependent on precipitation, with the highest discharge rates during the wet season. This is also a good indicator of the progress of the karstification of the area. The Sasan spring, for example, shows three regimes of high discharges which indicates a well-developed karstification process with sizeable conduits that conduct waters in the spring as soon as it rains, followed by a second regime through small channels. It is obvious that the groundwater level increases rapidly during the wet season. According to the volume of the pores and the openings of the rocks and according to the calculations, the infiltration rates for the Sarvak and Asmari formations are 36.5% and 39.6%, respectively [
29]. Sasan spring is dominated by a quick-flow response and in high karst development based on the high ratio of α1 to α2 [
37].
Geochemically speaking, the waters of Sasan spring are of Ca-Na-HCO
3-Cl type, those of the Chenar Shahijan and Renjan springs are ofCa-HCO
3 type, whilethe waters from the Salbiz spring belong to Ca-SO
4 type. This indicates that marly and gypsum formations such as Gachsaran play an important role in the water geochemistry of the local springs [
28,
38]
. 4. Results and Discussion
4.1. Results of Stable Isotopes Analysis and Groundwater Tracing
The results of the stable isotope analysis are shown in
Table 1. The tableshowsthe values of δD, δ
18O, and d-excess in the spring waters sampled along with the elevations of the four springs sampled.
The dye-recovery curve begins at the time of injection (t
0) and is set to zero. The measured dye concentration at the time of the injection becomes the background concentration. No fluorescent dye could be detected in the samples from the selected sampling points prior to the injection of the tracers. The observation time was approximately 45–50 days depending on the locations. The obtained results of the fluorometric analyses of the collected samples were plotted as a dye-recovery (time-concentration) curve for each of the sampling points.
Figure 6 shows the concentration of uranine in the samples taken from the Chenar Shahijan spring.
Figure 7 and
Figure 8 show concentrations of eosine and uranine in the samples taken from the Seyed Hossein spring.
4.2. Stable Isotope Data Interpretation
The alues of δ
18O and δD from the sampled groundwaters range from −5.86 to −4.12‰ and −24.4 to −14.0‰, respectively (
Table 1). The isotope ratios of δ
18O and δD are plotted in relation to GMWL and LMWL for the south area of the Zagros Mountains. Global meteoric water line is drawn from the expression [
51]:
Since Iran is under influence of different air masses and moisture sources, it is not possible to develop a single meteoric line that would fit the whole of the country. There are several local meteoric lines, instead. Local meteoric water line (LMWL) is plotted using the data from the local sampling station [
45]. The deviations from the meteoric lines are associated with higher evaporation experienced during moisture transfer in air masses and are linked to low humidity conditions which lead to kinetic fractionation [
52]. The composition of the stable isotopes experiences spatial and temporal modifications during their transition from the ocean surface to the atmosphere and eventually to groundwater aquifers [
53]. During the evaporation process, lighter hydrogen and oxygen isotopes go into vapor readily than heavier ones. The process is opposite during condensation when heavier isotopes condense preferentially. There are several factors that influence the isotopic composition of natural waters: temperature, season, latitude, altitude, amount of precipitation, and distance from the coast [
10]. The altitude effect is a result of the lower temperatures at higher altitudes which causes isotopic depletion of precipitation in comparison to the lower altitudes and is useful in determining the recharge area. Isotopes can be used as environmental tracers and are sometimes referred as the water cycle’s ‘fingerprints’ because they are unaffected by geological interaction as long as there is no fractionation or phase change along the flow path in hydrological systems [
54,
55,
56].
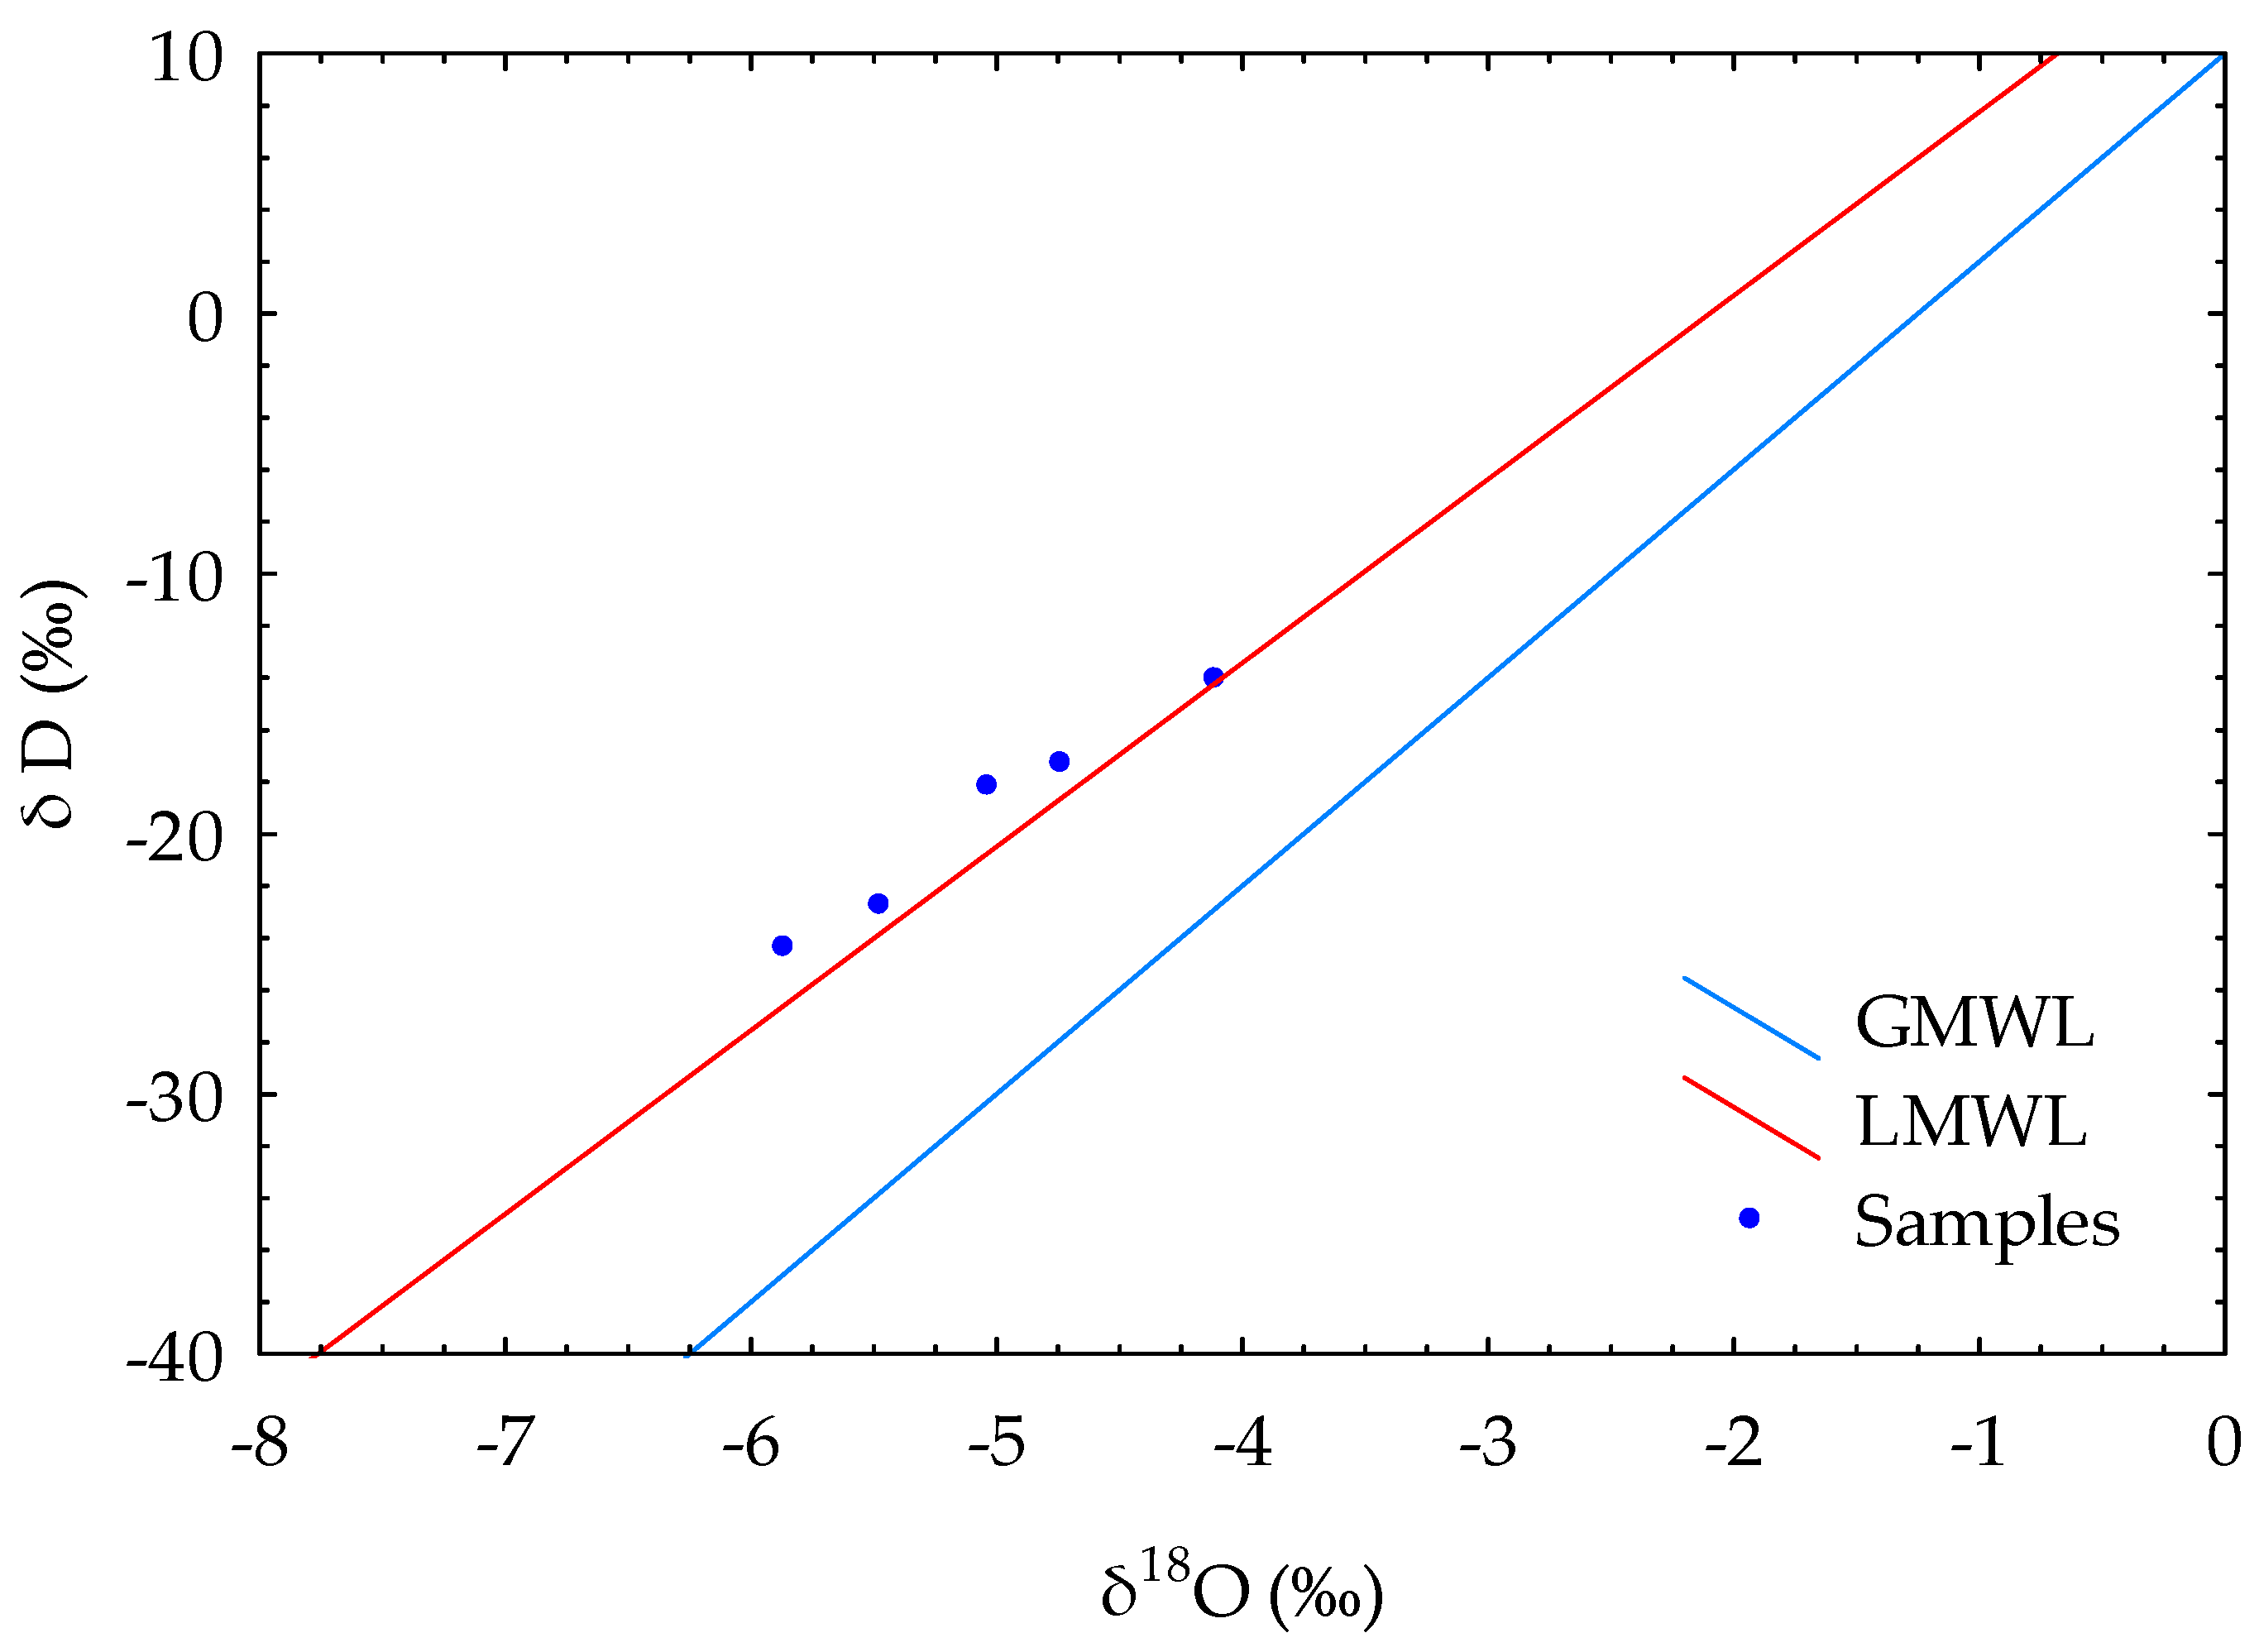
The plot of δ
18O versus δD (
Figure 9) shows that all groundwater samples follow a similar trend to the LMWL, showing the strong meteoric origin of water. Evaporation of water causes enrichment of heavy stable isotopes in the water phase during rainfall. The different magnitudes of fractionation on the oxygen and hydrogen atoms cause the slope to be smaller than 8 (see Equation (1)) [
50,
57]. This is the case in the study areawhere samples follow the LMWL with the expression δD=6.99 δ
18O+12, meaning that the evaporation affected the isotope composition [
45].
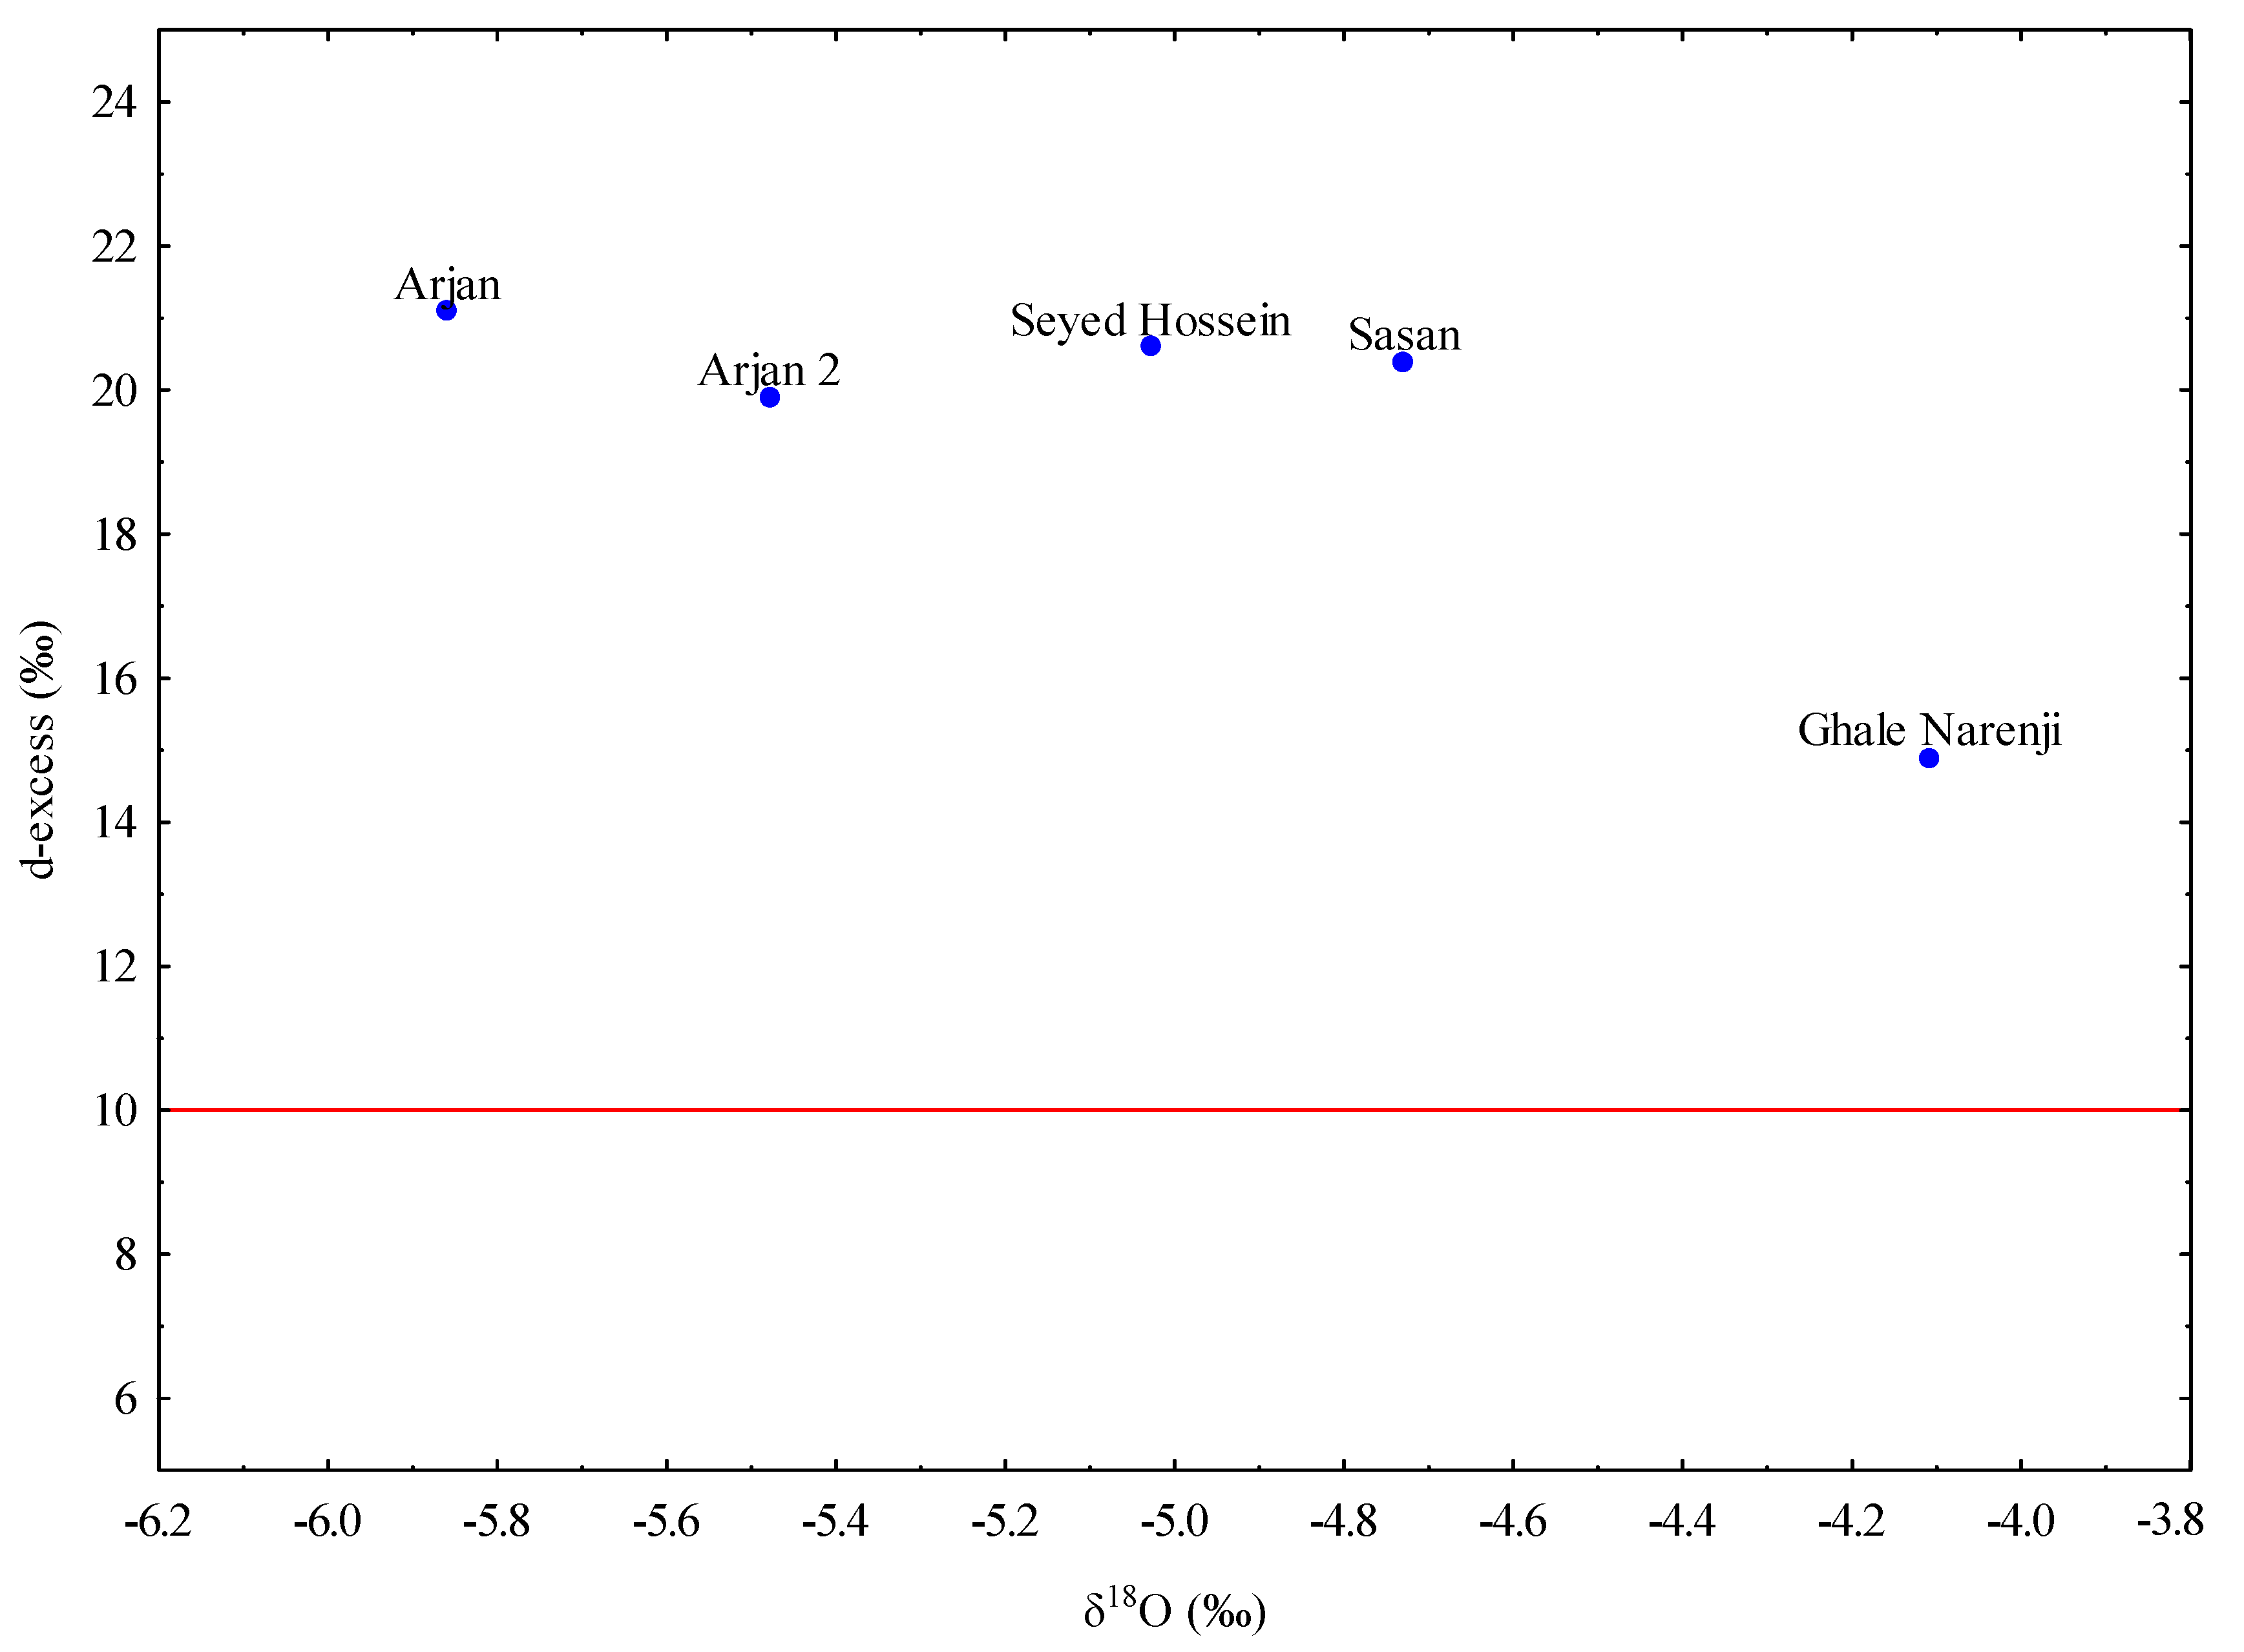
Deuterium excess is a function of the isotopic composition of hydrogen (δD) and oxygen (δ
18O) in water according to the relationd-excess = δD − 8 × δ
18O [
58]. Diffusion of water molecules across a density gradient during evaporation causes the so called “excess of deuterium” relative to
18O in vapor. A water molecule that contains one atom of deuterium has a molecular mass of 19 gmol
−1, while a molecule that contains one atom of
18O has a molecular mass of 20 gmol
−1. The difference in weights causes more diffusive fractionation of heavy oxygen during evaporation, causing higher deuterium excess in vapor. In cases where moisture is released from water bodies with high surface temperatures and low relative humidity, d-excess has higher values. Deuterium excess reflects the source and evolution of rainfall during vapor transportation and interaction or mixing of air masses on their way to the precipitation site [
59]. Higher d-excess values usually indicate that a higher content of evaporated moisture has been added to the atmosphere; and lower values are related to thewater samples fractionated by evaporation [
60]. The values for selected springs vary from 14.9 to 21.1‰ and are significantly higher than the mean global average forthe d-excess which is 10‰ (
Figure 10). The obtained values are consistent with the average values of d-excess in precipitation (>20‰) for the wider area of Iran. This also shows that Kazeroon County is under the influence of the Mediterranean air mass because the precipitation that originates inthe eastern Mediterranean Sea and falls later in winter and spring has a higher d-excess (~20‰)in comparison to the global average (~10‰) [
43,
61,
62,
63]. Evaporation during the infiltration processes also affects the d-excess value. In case of greater evaporation, the d-excess values will be depleted. Similar values of the d-excess in precipitation and the spring waters sampled show that the influence of evaporation is small and the infiltration was fast. This is often the case in karst areas with poorly developed vegetation.
The values of the stable isotopes for rains were presented in the study of the Kazeroon karst water resources. The values of δ
18O in rainwater vary between −9.71‰ and −1.41‰ according to [
28], and from −5.42‰ to 3.31‰ in the study conducted by [
43]. The values for δD in rainwater vary from −57.2‰ to 11.8‰ [
28].
The altitude effect is a temperature related feature and presents depletion of isotopic values with increasing elevation. It can be a useful tool in determining altitude of the recharge areas [
46]. During orographic uplift, the air masses cool and heavier isotopes precipitate the former, resulting in precipitation depleted in
18O. The altitude effect on
18O can range anywhere between 1.7 and 5.0‰/km. The global average of the gradient with elevation for precipitation δ
18O is 2.8‰/km [
64].
The Arjan spring discharges from Shahneshin anticline at approximately 2008 ma.s.l. Shahneshin anticline (up to 2800 m a.s.l.) is higher than Dashtak anticline (up to 1500 ma.s.l.), especially its northern part which forms the Dashtak North aquifer. Shahneshin and Dashtak anticlines, like most of the the Zagros anticlines, are cylindrical in form, and dip down under younger sediments. The younger sediments form a thick cover over the syncline forms. The tops of the anticlines are most often bare and present a recharge area of aquifers. The main source of the recharge in that area is precipitation. Once precipitation enters the underground, a system of fractures and conduits directs the flow down the slopes of the anticlines toward the foot of the anticlines. The sediments underlying karst layers are impermeable and block further vertical groundwater flow.
The δ18O values for the samples taken from Arjan spring are −5.86 and −5.48‰. Sasan, Seyed Hossein, and Ghale Narenji discharge from Dashtak North and Shahneshin (Asmari) aquifers at much lower altitudes (825, 808, and 877 m.a.s.l, respectively) and have higher values of δ18O (−4.73, −5.03, and −4.11‰, respectively). By looking at those values, it can be concluded that the recharge area of the observed karst springs (Sasan, Seyed Hossein, and Ghale Narenji) is positioned lower than the recharge area of the Arjan spring which is over 2000m in the area of the Shahneshin anticline. Based on the geometry and the output, it also confirms that there is no connection between Shahneshin South and Dashtak North zones.
4.3. Tracing Test Results Interpretation
The water tracing test is a very useful investigation method, especially in karst aquifers. It reveals information about aquifer properties underground connections, groundwater velocities, and flow directions. Water tracing simply involves ‘tagging’ water as it enters the karst system and monitoring possible exits to see where it re-emerges. The time taken for the water, and hence the tracer, to get from one point to the other is usually recorded.
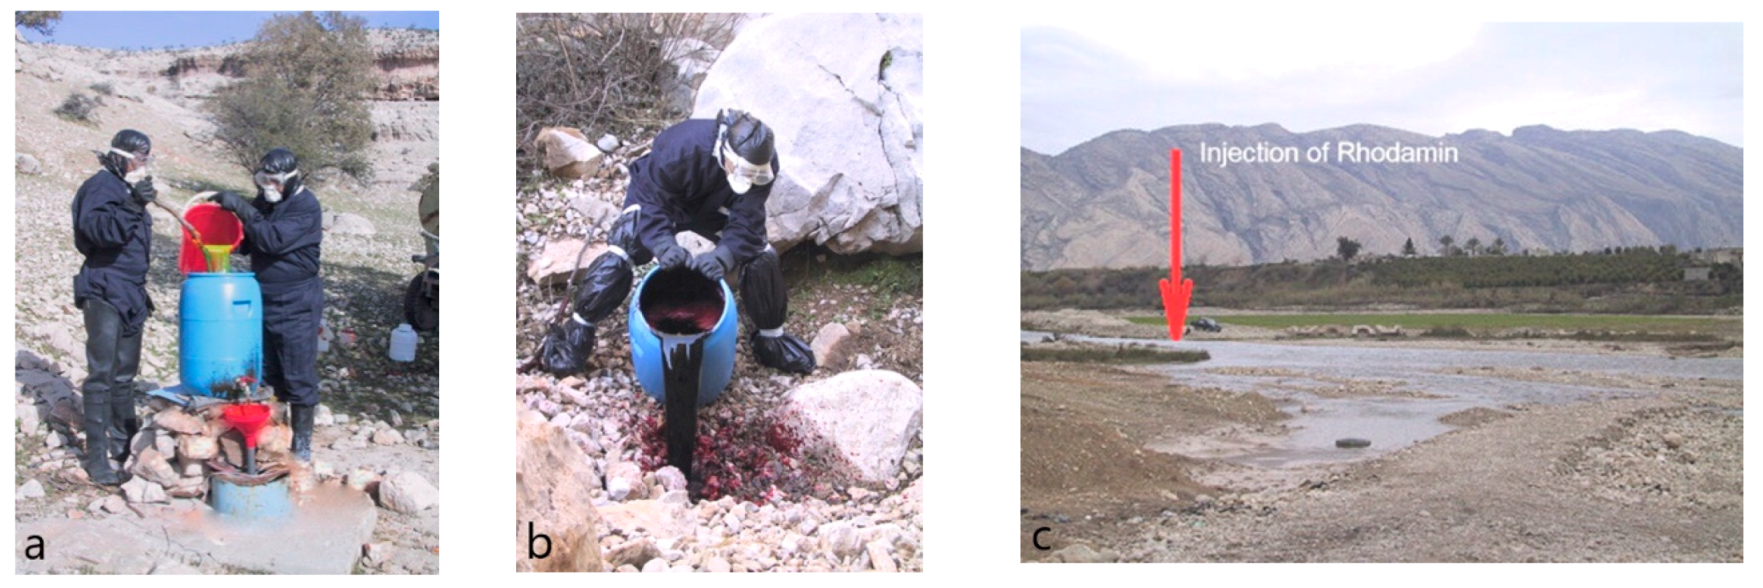
The goal of the multiple tracer test conducted in January 2015 during a dry season of the year was to establish hydraulic connections between the assumed area of recharge and the investigated springs, and also to determine apparent groundwater flow velocities. The apparent flow rate is a measure of the rate of tracer migration as a function of initial tracer breakthrough and is always smaller than the actual flow rates. This is due to the calculation taking into account the air distance from the tracer injection point to the sampling point. In reality, water passes longer, meandering flow path in most karst aquifers. However, the obtained value gives a general idea about groundwater velocity.
Since three tracers were used, it was essential to resolve overlapping peaks in order to establish the exact concentration of each tracer. The success of this test depended on the choice of the tracers based on their optical properties such as the wavelength of the excitation and emission bands. Uranine and rhodamine are an example of two tracers that are very suitable for the multiple tracer test because of good spectral distance of about 60–70 nm. On the other hand, eosine is not so easy to separate from uranine since its spectrum displays intermediate wavelengths and has a spectral distance to uranine of about 25–48 nm [
65]. This is the reason why the eosine was injected at the location that is closest to the Sayed Hossein spring. As seen from the dye-recovery curves (
Figure 7 and
Figure 8), eosine left the underground system before uranine appeared in the spring.
The analysis of the dye-recovery curves gave insight into the flow characteristics of the aquifer: like the effective time of travel between the injection point and sampling points and the apparent velocity of the ground-water flow. The curves are bell-shaped and skewed to the right, meaning that the rising limb is steeper than the falling one, or the recession limb of the curve. Time to peak concentration (t
peak) is the time of travel from the dye injection to the peak of the dye-recovery curve. Time needed for dye to exit the underground system and for concentrations to decrease to the background level is called elapsed time for dye passage or time to trailing edge [
3].
The uranine dye injected at Tale Milek 1 borehole was detected in the Chenar shahijan spring in less than 2 days, and after 6 days in the Seyed Hossein spring (
Figure 6 and
Figure 8). This shows a high apparent flow velocity (approximately 1750–2000 m/day). Equally so, small amounts of uranine were detected in the Sasan and Pirsabz springs. In case of the Chenar Shahijan spring, the uranine dye reached the peak concentration 8 days upon the injection of the tracer. Unlike the curve for eosine at Seyed Hosein, the uranine curves at Chenar Shahijan and Seyed Hosein springs show significant oscillations, which are most likely caused by pumping of water from the wells. Pumping increases inflow of water without the tracer dye from adjacent parts of the aquifer. Mixing that water with the water containing the dye causes dilution and lower concentrations of the tracers. Another possible reason for the oscillations can be a complex geometry of the channels through which water passes on its way from the point of the injection and the point of sampling. Longer paths can cause a delay in the arrival of a part of a dye-cloud. The concentration of uranine at Chenar Shahijan did not return to background values after 44 days and the sampling was stopped. A similar situation was at Seyed Hossein spring where sampling finished after 50 days.
The eosine injected at the cave located 1.5 km in the west of Seyed Hossein spring was detected after 2 days, which gives apparent flow velocities of 750m/day. In the case of Seyed Hossein spring, the eosine dye reached peak concentration (tpeak) on the third day after the injection. After 13 days, the dye passed completely through the underground system and the concentrations of eosine returned to background levels. Rhodamine did not show in any of the spring samples downstream from the injection point.
Previous studies have assumed a groundwater flow from ShN zone toward DN zone on account of the differences in piezometric heads between the Tale Milek 1 exploratory well located in the Shahneshin zone and the water level in the kars agricultural well in the Dashtak North zone. In addition, well logging and geoelectrical soundings data from the karst agricultural well located in the northern part of a Dashtak North aquifer confirmed the existence of a dissolution in the phreatic zone between depths of 140 to 160 m. Since the plain between the North Shahneshin and Dashtak North zones has an average altitude of 900 ma.s.l. with 120 m thick alluvial deposits, it is logical to assume a hydraulic connection between the North Shahneshin (Asmari) and Dashtak North zones [
28]. The conducted tracer test confirmed their connection because the dye injected in the Northern Asmari Shahneshin anticline appeared at the springs in the Dashtak North zone. The flow direction in Shahneshin Asmari is southward from the vicinity of the Aboul Hayat Valley towards Seyed Hossein and Sasan springs (
Figure 5).
Since the movement of tracer dye in the karst underground is similar to the majority of conservative soluble contaminants, the results of the tracer tests can also be used as a prediction tool for transportation characteristics of non-reactive contaminants [
3]. It is also important to emphasize that the data from a single dye trace generally reflect the conditions for that specific test as well as that particular discharge. It is necessary to repeat the quantitative tracer test under different flow conditions between the same injection and recovery points to fully understand the characteristics of the aquifer.


