Article

Entropy-Based Research on Precipitation Variability in the Source Region of China’s Yellow River

1
State Key Laboratory of Hydrology-Water Resources and Hydraulic Engineering, Hohai University, Nanjing 210098, China
2
College of Hydrology and water resources, Hohai University, Nanjing 210098, China
3
Fujian Provincial Investigation, Design & Research Institute of Water Conservancy & Hydropower, Fuzhou 350001, China
4
College of Civil Engineering, Fuzhou University, Fuzhou 350116, China
*
Authors to whom correspondence should be addressed.
Water 2020, 12(9), 2486; https://doi.org/10.3390/w12092486
Submission received: 15 August 2020 / Revised: 25 August 2020 / Accepted: 3 September 2020 / Published: 5 September 2020
(This article belongs to the Section Hydrology)

Abstract

:
The headwater regions in the Tibetan Plateau play an essential role in the hydrological cycle, however the variation characteristics in the long-term precipitation and throughout-the-year apportionment remain ambiguous. To investigate the spatio-temporal variability of precipitation in the source region of the Yellow River (SRYR), different time scale data during 1979–2015 were studied based on Shannon entropy theory. Long-term marginal disorder index (LMDI) was defined to evaluate the inter-annual hydrologic budget for annual (AP) and monthly precipitation (MP), and annual marginal disorder index (AMDI) to measure intra-annual moisture supply disorderliness for daily precipitation (DP). Results reveal that the AP over the SRYR exhibits remarkable variation, with an inclination rate of 2.7 mm/year, and a significant increasing trend. The climatic trend reversed from warm–dry to warm–wet around the turn of this century. The start of the wet season has advanced from May instead of June, supported by the proportion of MP in AP and the LMDI for May are both comparable with the values during June–September. May contributes the main changes in AP, as it is the only month in the wet season which shows a significant increasing trend during 1979–2015, and has a value in the LMDI that divides the basin in half spatially, the same as AP, with a high value in the northwest and low in the southeast. The AMDI roughly rises with latitude in spatial distribution, with wetlands and glaciers disturbing the continuity of the pattern for a relatively perennial moisture supply. AP has increased on northwest high-altitude areas first and then the southern corner since the beginning of this century. Wetting is mainly attributed to the enhanced southwest monsoon and the warming-induced freeze-thaw process. Meanwhile, AMDI variation concentrated on the Zoige Plateau Wetland, the headwater corner, the summit and part of the North Slope in the Bayan Har Mountain, as a result of a single or combined effect of global climate change and human protection.

1. Introduction

The analysis of the long-term time series of hydro-meteorological variables is vital to assess potential water resources and to study environmental changes. Precipitation is one of the principal factors in terrestrial water cycles, and its spatial-temporal distribution is as important as the amount, if not more, since the type of water demands vary with time and location [1]. Besides, global climate change has intensified the hydrological cycle with increasing evidence supporting the continued occurrence of temporal and spatial variations in precipitation around the world, which would affect the availability of water resources and accelerate the ongoing competitions. Therefore, further study into the mechanisms responsible for the variability in precipitation has become quite essential. The distribution of precipitation at multi spatio-temporal scales and its effects on ecosystems has been popular in hydrology and ecology, as a hot issue, for some time. Some methods have been developed, including the Shannon entropy method [2], principal component analysis [3], harmonic analysis techniques [4], etc. Entropy-based measures contain more information about the probability distribution among diversified statistics that generally delineate variability [5], and they also have advantages in flexibility, by which the dispersion of precipitation could be measured at multi-scales, such as annual, seasonal, or monthly. Disorder index serves as the standardized information entropy in this study to evaluate the spatial and temporal characteristics of rainfall.
Although precipitation distribution is a continuous concern in the field of water science, very little research has been conducted in mountainous areas, much less the plateau mountainous area in cold regions. Complex terrain and sparse observation stations are major difficulties for such studies [6]. Weather stations tend to be built on flat terrain or in places that are easy to access and record, and that leaves a lingering problem in mountainous areas with measuring the orographic precipitation, which causes different rainfall on two sides. High elevation worsens the situation as the measurement conditions are much harsher for people to install equipment and record data. Therefore, except for the observation records, datasets from other sources should be employed for a better representation of the natural precipitation process. The application of the remote sensing product with fine resolution also enables the research on the spatial distribution of temporal variation in precipitation.
The entropy-based marginal disorder index is applied to quantify the variability of the precipitation spatiotemporal distribution in the source region of the Yellow River (SRYR). Datasets employed for the entire study period between 1979–2015 are time series with an annual, monthly, and daily resolution from an assimilation precipitation product. Annual and monthly precipitation series are used in the investigation of long-term inter-annual variability, and daily series are applied to analyze the over-a-year precipitation apportionment within each year. The following aspects of temporal trends and their spatial distribution patterns of precipitation are addressed in the study: to investigate the spatio-temporal distribution of the variability of long-term precipitation over the SRYR and to determine the possible monthly series dominating the disorder of annual series, based on annual and monthly precipitation datasets; to probe the intra-annual distribution of precipitation series with daily resolution within each year and to find the time and location with a high value; to detect the stationarity and trend in long-term precipitation and its variability using the Pettitt and M–K tests, and divide the study period into stages according to typical characteristics; to evaluate the features and changes in the spatial distribution of precipitation and its variability on a decadal scale and to compare disorderliness within each decade. The specific flow is shown in Figure 1.

2. Materials

2.1. Study Basin

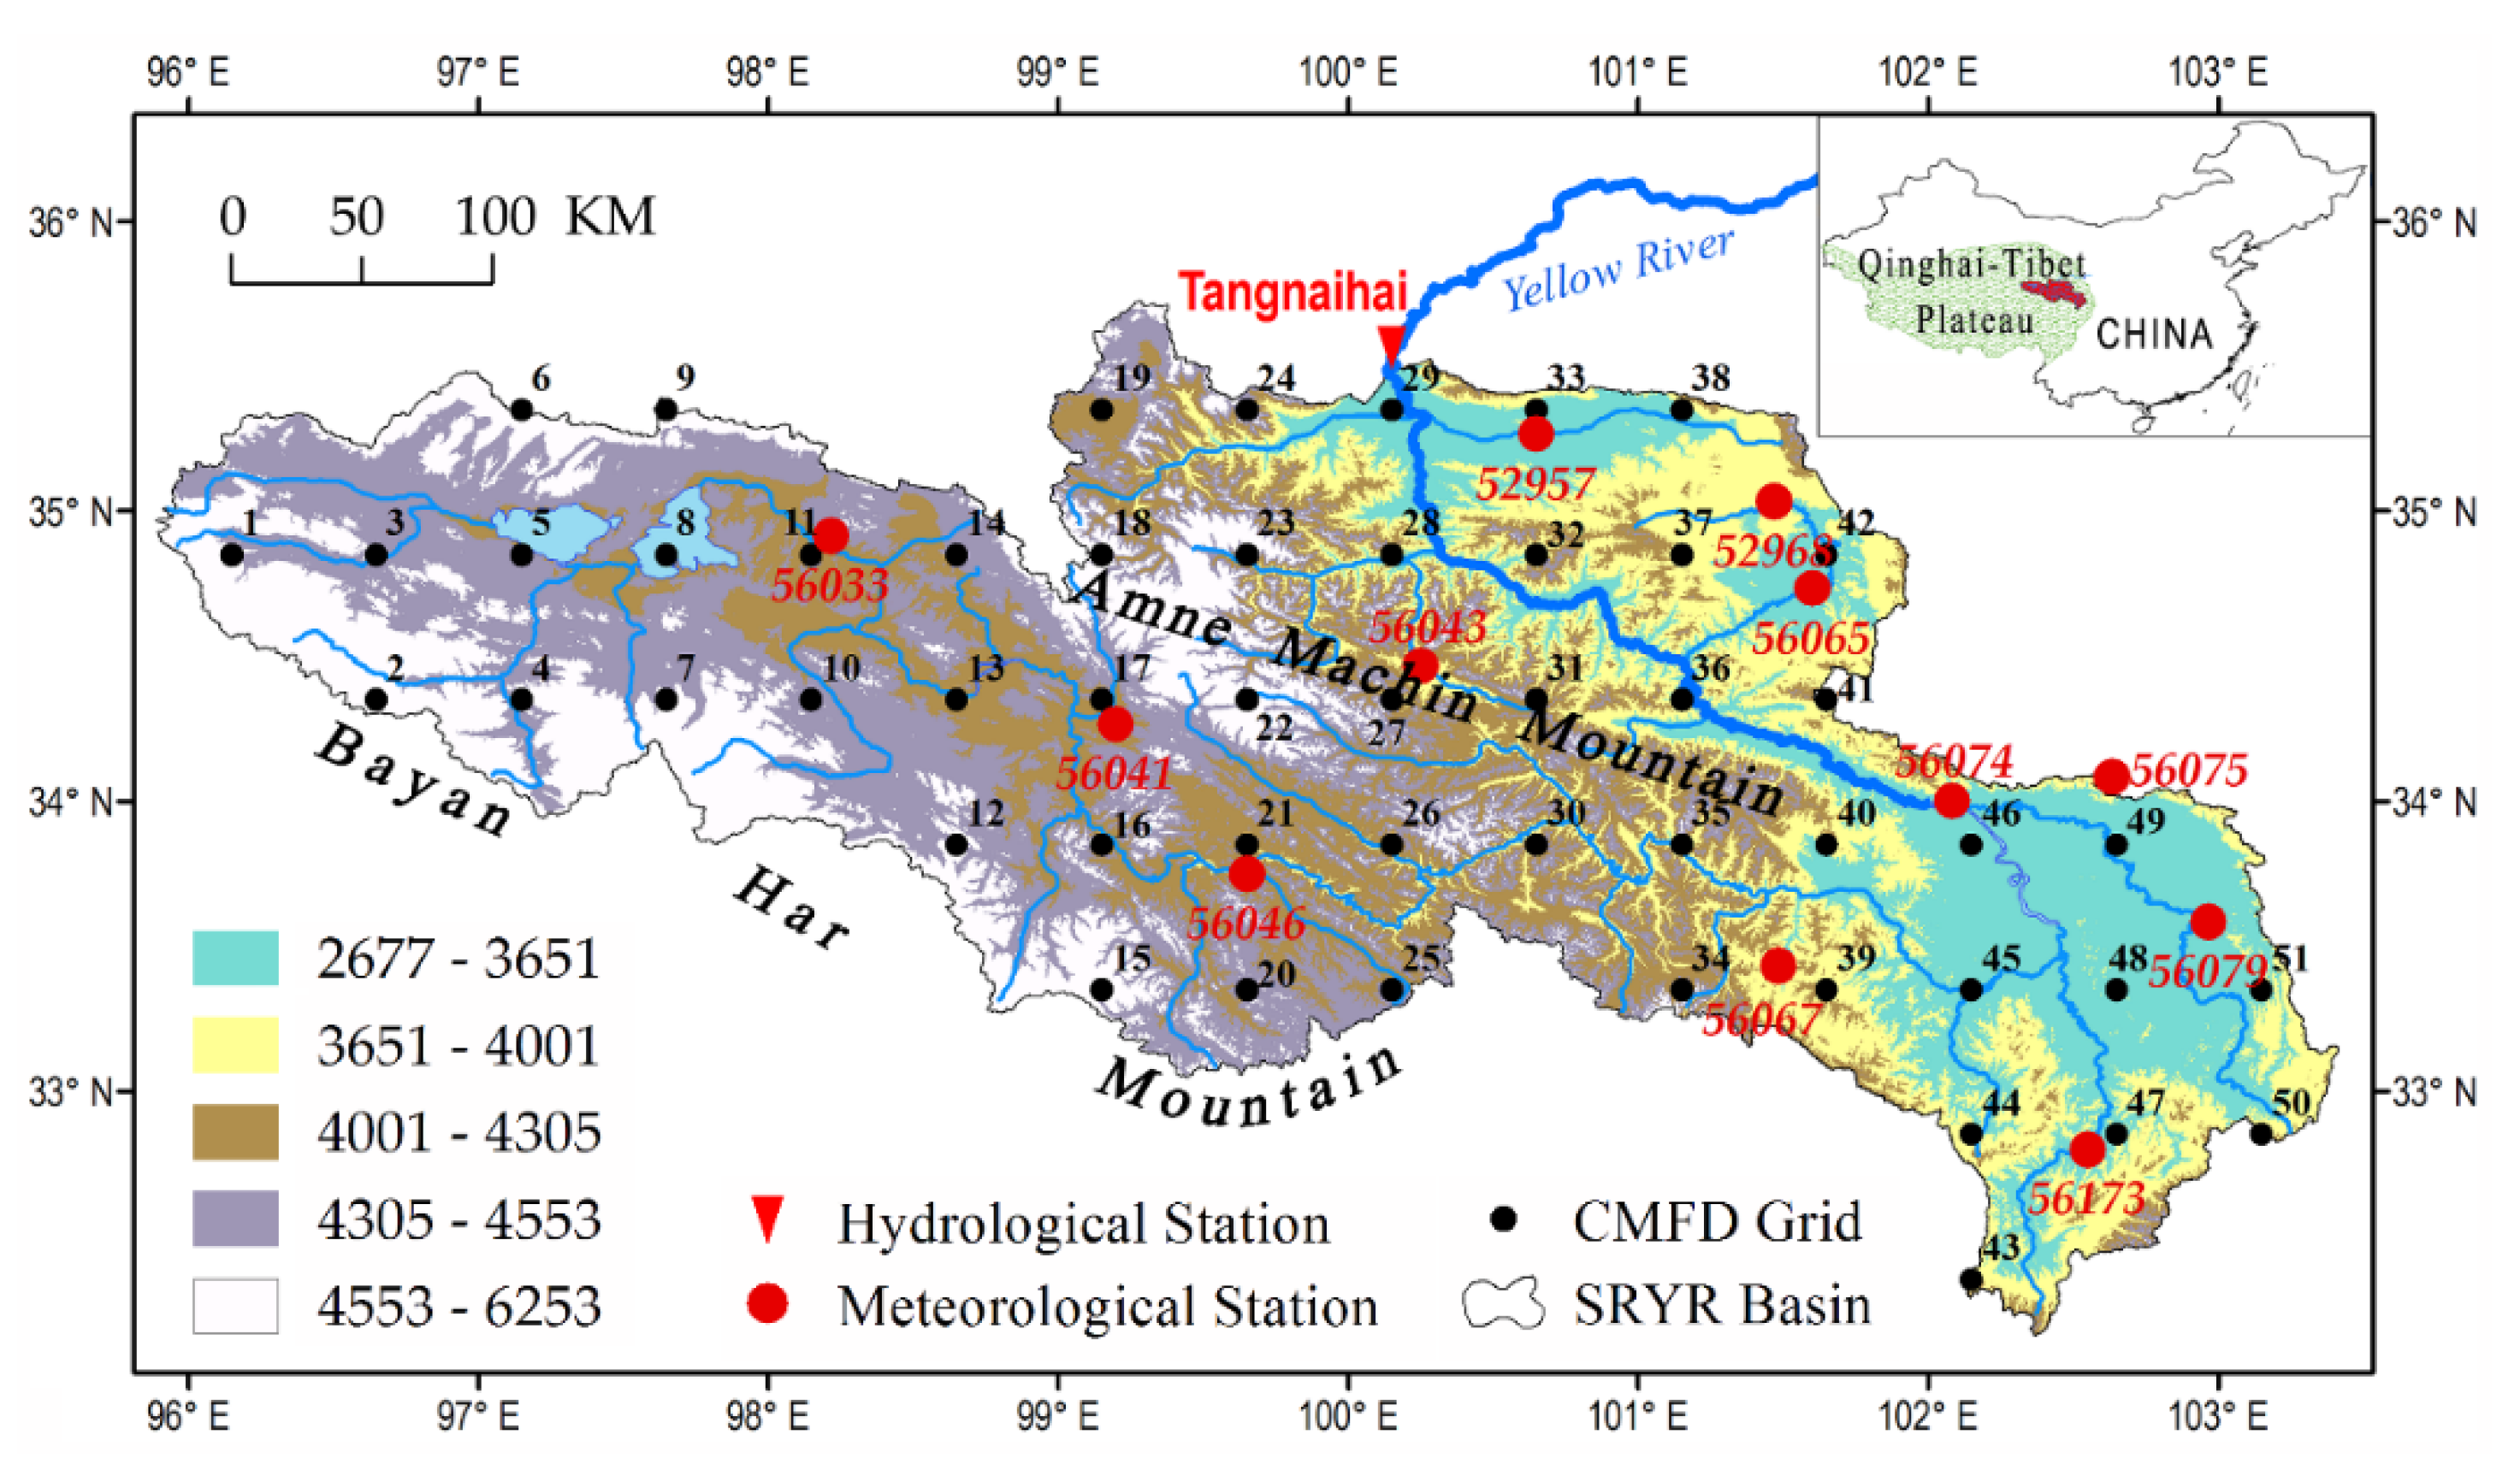
The Tibetan Plateau (TP) is the world’s highest and largest plateau, termed “the Third Pole of the earth”, with an average elevation exceeding 4500 m and an area of 2.5 × 10⁶ km2. It is also known as the Asia’s “water tower”, for it is covered with a remarkable number of glaciers, snow, permafrost and lakes, which contain the mountainous headwaters of the Yangtze, Salween, Mekong, Indus, Brahmaputra and Yellow rivers. The TP is one of the most vulnerable areas to environmental changes for its typical hydrological, geographical and ecological features [7]. The source region of the Yellow River (SRYR) spreads most alpine meadow grassland and wetland of the TP and thus its ecosystem is strongly related to the variation in precipitation, and it is selected as a case to study the changing features of precipitation. The SRYR in the study refers to the basin above the Tangnaihai hydrological station (100.15° E, 35.5° N), which controls a drainage area of 121,972 km2 between 95.88° E–103.42° E and 32.15° N–35.73° N in the northeastern TP (Figure 2). The SRYR generates 34.5% of the total annual runoff and accounts for only 16% of the basin area of the Yellow River. The Yellow River originates in the Mt. Bayan Har and flows eastward in general, with its altitude decreasing from 6253 m to 2677 m. The highest elevation is found at the summit of Mt. Amne Machin, Machin Kangri (summit M), which is covered with permanent snow and contributes about 98% of total glacier areas (164 km2) over the basin [8]. The SRYR contains 5300 lakes with a total area of 2000 km2 [9]. SRYR covers with the typical alpine meadow steppe, covering 80% of the area, and is part of the Four Major Pastoral Areas in China. However the degradation in its ecosystem has been prevailing [10]. Because of no large dams and a low population density, the impact of human activities is relatively low in the area [11].
There are roughly two climate seasons in the SRYR, the wet season and dry the season, and about 75–90% precipitation falls in June–September as a result of the southwest monsoon from the Bay of Bengal [12]. The regional average AP over the SRYR is about 540 mm, and the amount decreases from southeast (SE) to northeast (NW). The annual mean air temperature is about −2.5 °C over the SRYR, and is negatively related with the altitude in spatial distribution.

2.2. Precipitation Datasets

Traditionally, the characteristics of rainfall are investigated based on the meteorological observation datasets [7]. Over the SRYR, there are twelve national rain gauges, among which four were removed from the China Meteorological Administration (CMA) station list gradually before 1998. The geographical information of the meteorological stations is listed in Table 1. Moreover, the eight weather stations with long-term datasets are in the elevation range from 3440 m to 4272 m, while the elevation of SRYR stretches from 2677 m to 6253 m, with an average elevation of 4126 m. That is to say, only an 833 m range out of the altitude difference of 3576 m was observed, with one station located above the mean height. Besides, weather stations tend to be built on flat terrain for easy access by recorders. Therefore, the datasets of sparse meteorological stations over the SRYR are not adequate replacements for the natural precipitation process in the basin.
To overcome the defects by only adopting observation datasets, an assimilation precipitation product CMFD (China Meteorological Forcing Dataset) [13] is applied in the research, which is derived from CMA station data and remote sensing datasets, and is available from the National Tibetan Plateau Data Center. The remote sensing data sources include TRMM (Tropical Rainfall Measuring Mission) satellite precipitation analysis data (3B42), GLDAS (Global Land Data Assimilation System) data, GEWEX (Global Energy and Water cycle Experiment)-SRB (Surface Radiation Budget) downward shortwave radiation data, and Princeton forcing data [14]. It currently covers the period from 1979 to 2015, with spatial resolution 0.1 × 0.1° and temporal resolution 3 h., containing seven variables such as air temperature, surface pressure, relative humidity, wind, downward shortwave radiation, downward longwave radiation and precipitation rate. The effectiveness of CMFD was demonstrated with its high performance in the study of the spatiotemporal characteristics of climate-related factors, like surface temperature, precipitation and radiation [15,16,17].
Fifty one grids at 0.5 × 0.5° intervals were selected as feature objects out of the 1200 grids covering the SRYR. According to the Natural Breaks (Jenks) classification system and the ASTER (Advanced Spaceborne Thermal Emission and Reflection Radiometer)-GDEM (Global Digital Elevation Model) [13], 10 grids each located in the area with the elevation ranges of 2677–3651 m, 4001–4305 m, 4305–4553 m, 4553–6253 m, and 11 fall in the 3651–4001 m elevation range. In other words, the selected grids are evenly distributed both horizontally and vertically (see Figure 2). Daily, monthly and annual precipitation series are employed, abbreviated as DP, MP and AP respectively in the study. The basic statistical properties for the selected AP series during 1979–2015 are displayed in Table 2, as mean annual precipitation (Mean), maximum annual precipitation (Max), minimum annual precipitation (Min) and coefficient of variation (CV). The grids with a high CV are mainly concentrated in the western mountainous area and on the northern edge, where AP is generally low. The range of mean, maximum and minimum AP is 270–839 mm, 482–1076 mm and 153–591 mm, respectively. The mean and minimum AP share a similar distribution; both have 28 girds lower than the average and only two do not overlap in Figure 2. While 27 maximum AP series are higher than average, among them 20 are located at low altitude regions where the mean and minimum are also high, and the other numbers are 7, 10, 13, 23, 32, 33 and 37, concentrated in a small range of two latitudes.

2.3. Land Cover Map

The land cover type is crucial to estimate water and carbon cycles, ecosystem dynamics and climate change. The Multi-source Integrated Chinese Land Cover (MICLCover) map is adopted in the study for its high accuracy in China [18]. The MICLCover map was derived from multi-local-source land cover and land use classification datasets including a 1:1,000,000 vegetation map, a 1:100,000 land use map for the year 2000, a 1:1,000,000 swamp-wetland map, a glacier map, and a Moderate-Resolution Imaging Spectroradiometer land cover map for China in 2001 (MODIS2001), which were integrated through the practical evidence generation scheme. The map uses the widely applied International Geosphere-Biosphere Programme (IGBP) land cover classification system, with 1 km resolution. The MICLCover map provides more spatial details at the local scale compared with other popular products, e.g., IGBP DISCover and MODIS2001, particularly for cropland, urban, glacier, wetland and water body.

3. Methods

3.1. Calculation of Variability

3.1.1. Entropy

Shannon introduced entropy as a measure of information, dispersion, uncertainty and disorder. The simplified expression of the discrete form of informational entropy, termed as Shannon entropy [19], is:
H ( X ) = k = 1 n p ( x k ) l o g 2 [ p ( x k ) ]
where n is the number of possible events, k represents a discrete temporal interval, x k is its corresponding result, p ( x k ) denotes the probability of x k , and H ( X ) is the entropy expressed in bits as the base of logarithm takes 2.
Shannon entropy reflects the uncertainty information about a certain distribution. For a variable X, H reaches its maxima log 2 n if all outcomes are equiprobable with p ( x k ) = 1/n, while quite the opposite, H equals its minima zero if every p ( x k ) but one is zero. The value of entropy varies within the range of zero to log 2 n , according to the pattern of the distribution.
There are other measures of dispersion degree of a random variable, among them variance is the most well-known one. The equation of variance is as below [20]:
σ 2 =   ( X μ ) N
where σ 2 represents the population variance, X represents the random variable, μ represents population expectation and N is population size.
According to the equation, variation measures the deviation extent of the random variable compared with the population expectation or the mean, thus variation reflects the uncertainty related to the expectation. The same goes for the measures based on variation, like standard deviation and CV. While the entropy reflects the overall uncertainty, as it neither relies on the expectation nor on the sample of the population, but only on its probability. Thus entropy has obvious advantages in measuring the uncertainty of a certain distribution.

3.1.2. Entropy Application in Precipitation Analysis

Shannon entropy can be served as a functional estimate of the uncertainties in a long-term time series of rainfall. In statistics, variability is the extent to which a distribution is stretched or squeezed, whose measure is a nonnegative real number that is zero if all the data are the same and increases as the data become more diverse [21]. From this aspect, the variability of precipitation can be quantitatively measured by using an entropy concept. In its previous application, precipitation time series at different temporal scales, like annual, seasonal and monthly, were considered individually, to better understand the uncertainty or variability within each scale and to make a comparison among them.
Take a daily series of an entire year at a fixed location, for example, to explain the application of entropy concept in precipitation time series. Daily precipitation could be viewed as a discrete equal-interval random variable. Let the discrete temporal interval be the number of days in a year (nd), e.g., 365, and its corresponding outcome is daily precipitation apportionment, and then the probability of each event is the daily precipitation (DP) divided by the aggregate precipitation during the year (AP). Hence the uncertainty degree can be determined by entropy in terms of the probability density of precipitation randomly apportioned over fragmented times. This entropy is also called marginal entropy (ME) with the annual expression as follows:
ME   =   k = 1 n d ( D P k / A P ) l o g 2 ( D P k / A P )
where A P   =   k = 1 n d D P k .
If the scale changes, DPk refers to the data on that scale, and the total number (nd) and the sum (AP) change accordingly.

3.1.3. Disorder Index

Entropy evaluates the uncertainty degree of time series at certain points. A quantitative measure of variability should be comparable among temporal and spatial results. The Disorder index (DI) serves as a standardized measure based on entropy, which is defined as the difference between the possible entropy maxima and the actual entropy calculated from a certain series. The maximum possible entropy refers to the value from the uniform distribution. For example, the maximum possible marginal entropy is log 2 n , for a daily precipitation series with size n. DI measures the degree away from the hypothetic most-scattered distribution, the distribution with low DI is dispersive, on the contrary, the high DI distribution is non-uniformed. That is to say, the value of DI is in accordance with the degree of variation of a series.
Mishra, et al. [2] defined the marginal disorder index (MDI) as the disorder index for marginal entropy. And the mean disorder index is formed as the arithmetic average of the values of DI within a given period. There are several kinds of MDI involved in the study, long-term MDI (LMDI), based on long-term annual or monthly precipitation series; annual MDI (AMDI), based on the daily precipitation series within each year; and the decadal averaged annual MDI (DAMDI). Among the derived MDI, AMDI is a series with the same length as the study years, which refers to the MDI of each year, based on daily precipitation, specifically used for revealing the throughout-the-year precipitation apportionment. And DAMDI is its decadal average value to uncover the intra- and inter-decadal variations of precipitation apportionment on a yearly basis. The equations related to the description above is listed below:
MDI = l o g 2 n d ME
where nd is the total number, and ME can be calculated by Equation (3);
LMDI   = l o g 2 n y + k = 1 n y ( P k L S P ) l o g 2 ( P k L S P )
where ny is number of years during the entire study period, LSP represents the long-term sum of precipitation, and Pk is a certain precipitation data with a given resolution, e.g., if analyzing the disorderliness in the long-term AP, Pk is APk, an AP data during the period, else if the aim is an individual month, then Pk is MPk, a monthly data of the target month within the period. Thus, the LMDI always appears with an explanation.

3.2. Statistical Test

The monotonic trend and the abrupt change of precipitation time series were detected by non-parametric tests, the Mann–Kendall (M–K) test [22,23] and the Pettitt test [24], respectively. The M–K test and the Pettitt test, with a rejection rate of 5%, were applied in the study. If U M K > 1.96 or U M K < −1.96, a significant increased or decreased trend of the targeted time series could be accepted. When p p e t t i t t ≤ 0.05, the stationarity hypothesis would be rejected and the change-point would be determined correspondingly. Because the Pettitt test checks the stationarity assumption among populations and a population should contain at least ten elements, the detected abrupt change-points are taken between the elevenths from the head and the end.

4. Results and Discussion

4.1. Variability of Precipitation

4.1.1. Inter-Annual Variation of Annual and Monthly Precipitation

The LMDI mainly indicates the variation of local precipitation in a fixed time interval during a period, and it takes a longer interval to achieve a detectable level of changes. If a fixed day was selected, for example, the first day of each year, and the changes of daily rainfall happened on that day every year were examined for a period, the high randomness would make the results meaningless. In the study, monthly and annual datasets are selected in the long-term variability of precipitation analysis. The LMDI is calculated for the selected 51 annual and monthly series during 1979–2015, and the statistics of results are displayed in Figure 3. It is obvious that the LMDI on an annual timescale is lower than those of each month. The uncertainty of precipitation distribution in the dry season (October to next April) is much higher, and contributes to the main variability within a year; we take May as the start of the wet season in this study. The average LMDIs in the wet season are all about 0.1. November to next February have the highest LMDIs, the averages of which are above 0.3. The rest three months, March, April and October, have similar mean LMDIs of about 0.2. The dry season has a more nonuniform precipitation distribution than the wet season, which applies to spatial distribution as well, as the range of the LMDI in the dry season is wider.
To better delineate the spatial distribution of the LMDI for AP, the method is generalized to all 1200 series and the mean values are drawn in Figure 4. High LMDI clusters are on the NW side of the basin, with the highest LMDI in red appearing mainly in the northern highest attitude area in the SRYR, which basically matches with the white color on north part in Figure 2; to be exact, the NW edge and the summit M. Figure 4 have also exhibited the distribution of regions with significant trends in long-term AP series during 1979–2015, detected by the M–K test with a rejection rate of 5%. The regions covered by plus signs (+), most of the NW part, have significant increasing trends in the amount of AP, and the regions with slashes (\), covering a small area on the north edge of the SE corner, have significant decreasing trends.
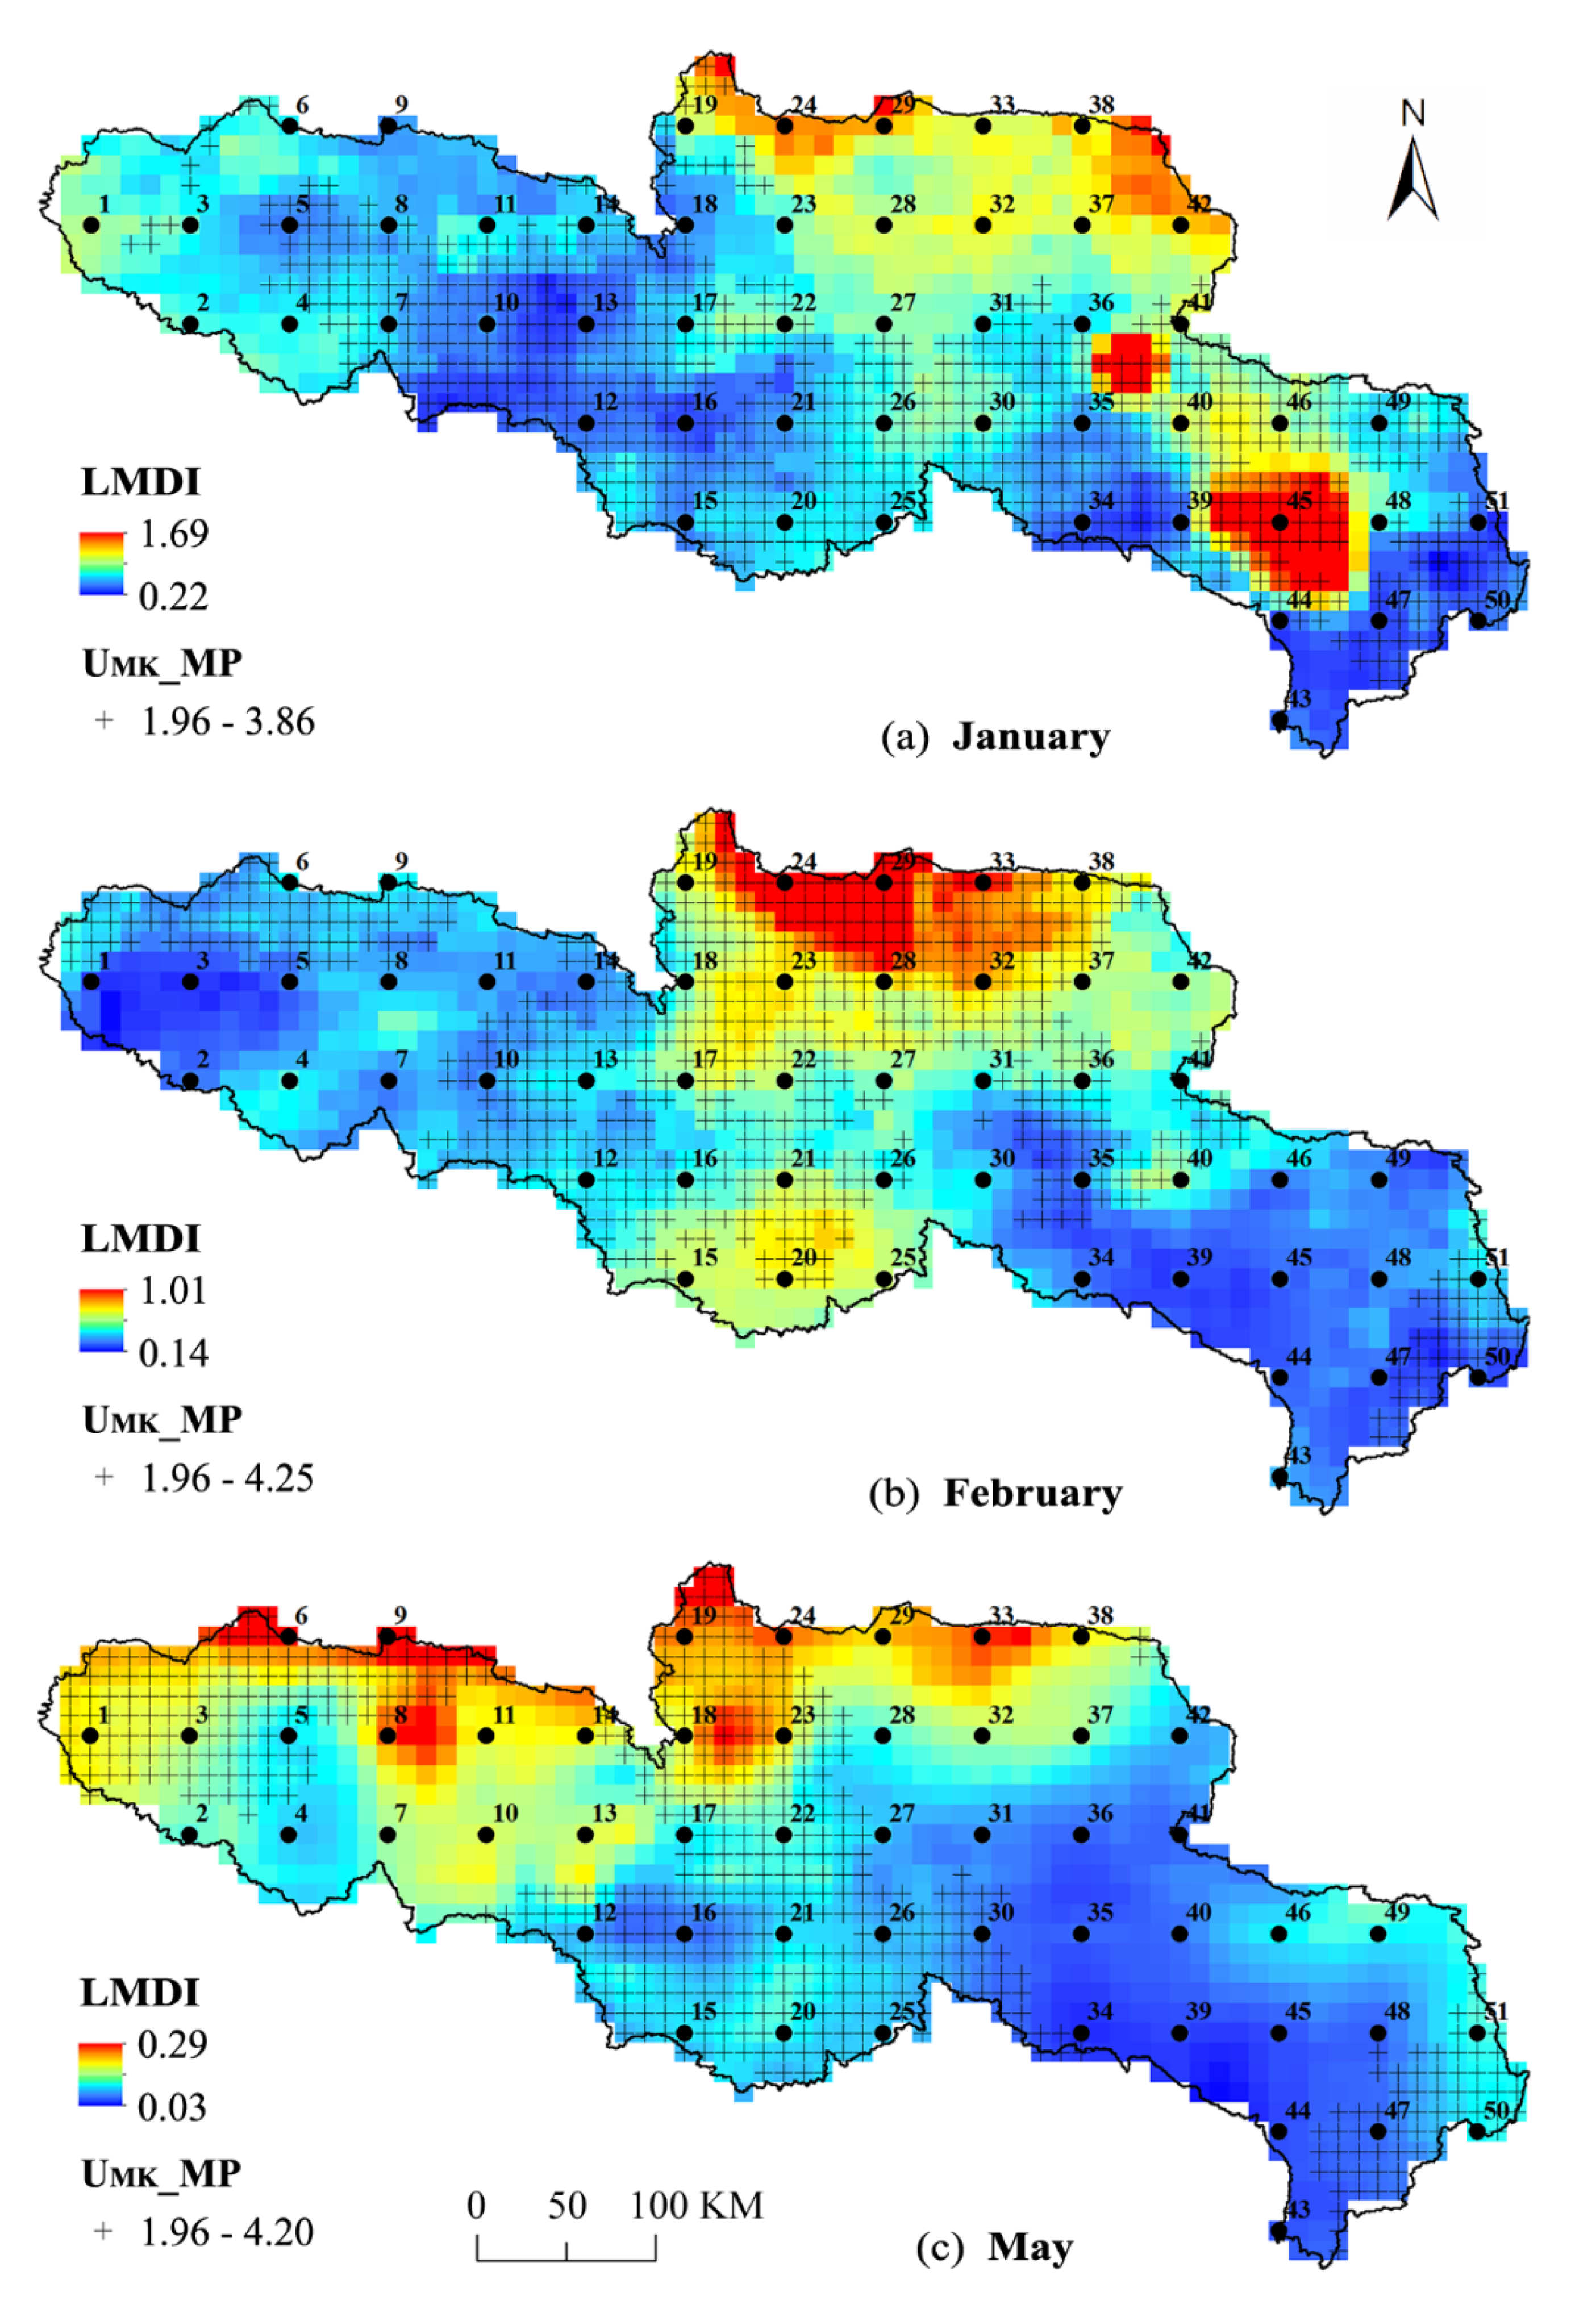
The M–K test is also applied to detect the trends of the MP series individually for the 1200 grid during 1979–2015 in the SRYR; the regional mean statistic results as well as the multi-year average of each month are shown in Figure 5. About 83% annual precipitation falls in the wet season, the range of MP in May–September is from 62 mm to 111 mm, and from June–July is above 100 mm. The seven MPs in the dry season range from 3 mm to 35 mm, the highest month is October, and the value of November to next February is not higher than 6 mm. Every month shows an increasing trend in precipitation, among which the trends of three months are statistically significant: January, February and May. The disorderliness and trends of the MP series in these three month are detailed in Figure 6. Comparing the LMDI of the months from different perspectives, from the magnitude, May has the lowest LMDI, ranging from 0.03 to 0.29, and the LMDI of January and February is much higher, the maximum is both over 1.0; from the spatial distribution, May gradually increases from SE to NW, while the other two months have more than one high value region. All three months show an increasing trend over the SRYR, and the significant regions are marked in Figure 6 with plus signs (+), and the area with marks in May shows much less than the other months. The precipitation almost increases all over the SRYR in January, except in the Northern Amne Machin Mountain. The area in February with a significantly increased trend, covers the whole middle region. There are three marked parts in May, the Summit M neighborhood, and the NW, SW corner. Compared to Figure 4, the high LMDI for AP clusters in the north edge on both annual and monthly scales, and the LMDI in May has a similar pattern.

4.1.2. Intra-Annual Distribution of Daily Precipitation

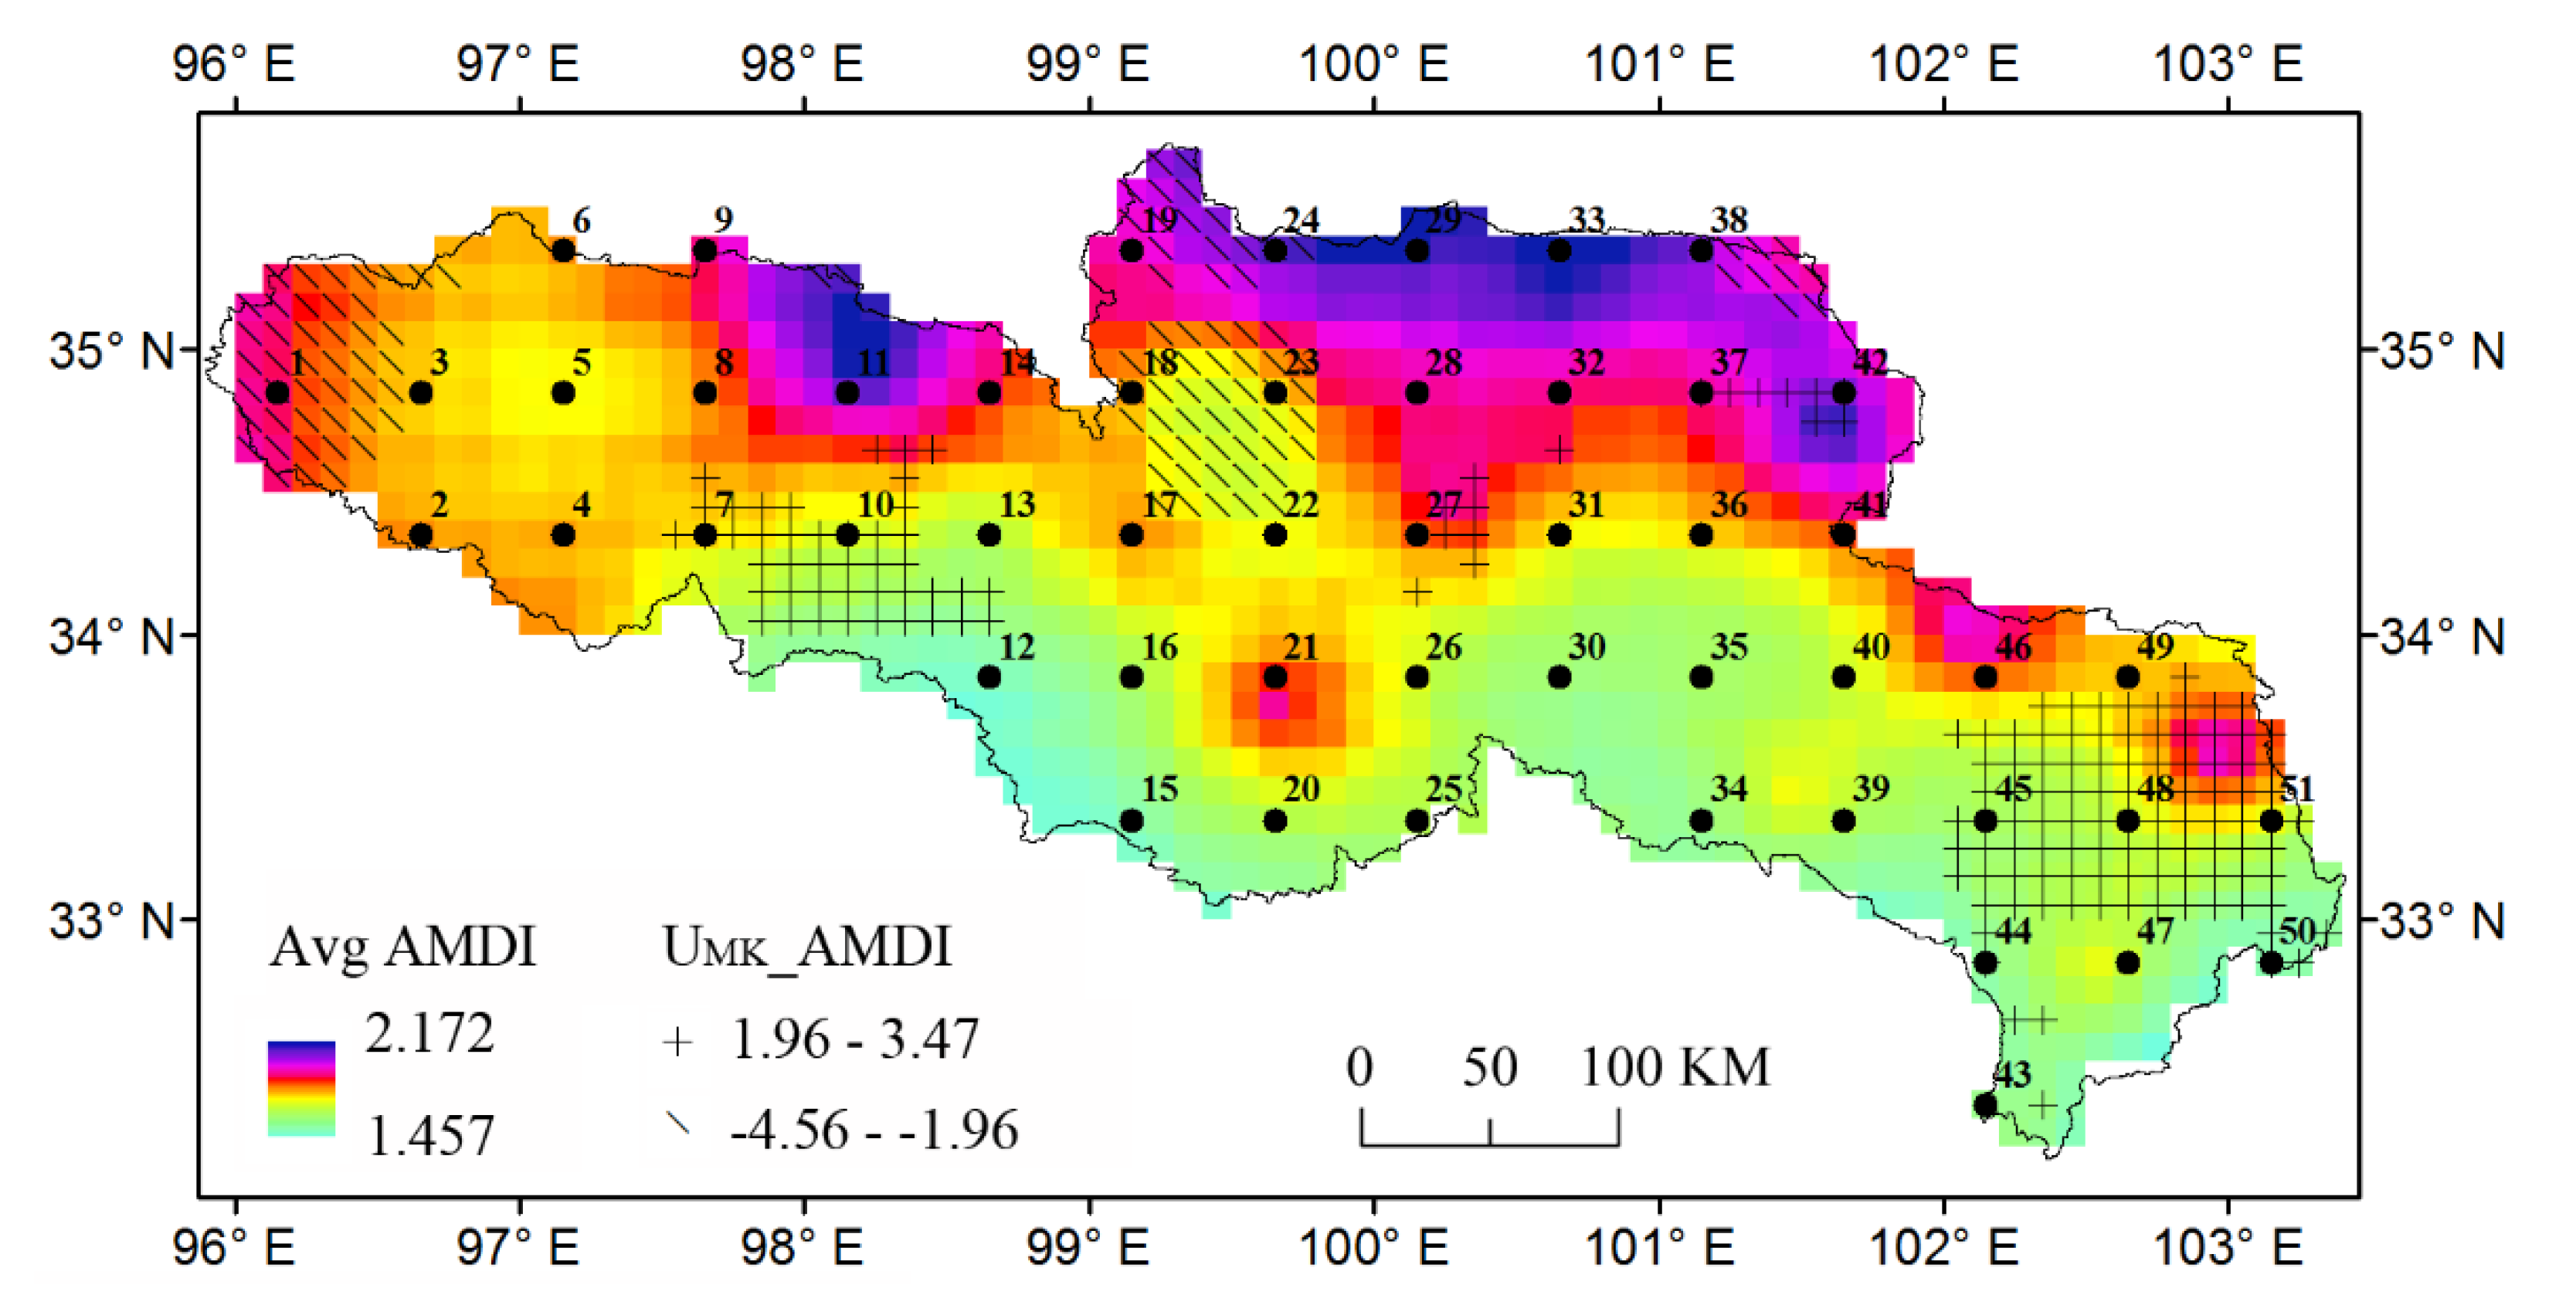
The daily precipitation time series is employed in the calculation of the annual marginal disorder index (AMDI). A similar approach in inter-annual analysis is applied to investigate the long-term AMDI series, while different from LMDI, AMDI is a series instead of a single value. The AMDI series ranges from 1.52–1.93 during 1979–2015, with the minimum and maximum in 1989 and 2002, respectively. There is an insignificant trend in the AMDI on the basin scale during study period, with a statistic as 0.6 according to the M–K test. The spatial distribution of the multi-year average AMDI over the SRYR during 1979–2015 is displayed in Figure 7. The multi-year mean AMDI ranges from 1.46 to 2.17, with the mean and standard deviation at 1.75 and 0.15, respectively. The value roughly increases with latitude, with wetlands and glaciers disturbing the continuity of the pattern by about −0.1 in AMDI. Moreover, the southern edge and the summit M have the lowest AMDI, and the northern edge has the highest AMDI, especially in regions around the Tangnaihai station (Grid 29). Figure 8 serves as a profile chart interpreting the feature of the long-term AMDI series in each grid, and wide ranges exist in most selected series. The variance tendency of AMDI would help in the understanding of the temporal distribution, and thus the trends at each grid were computed and the significant ones were also displayed in Figure 7.

4.2. Variation of Precipitation Distribution

4.2.1. Abrupt Change Analysis and Stages Division

The Pettitt test with a rejection rate of 5% is applied to the selected 51 AP and AMDI series from 1979 to 2015, and valid results are listed in Table 3. Thirty nine AP series show abrupt changes, from which 59% was detected in 2002 and 2003, 14 and 9 grids respectively, and no abrupt change occurred from 1990 to 1996 and after 2005. While 32 AMDI series showed abrupt changes, and 53% in 1997 and 1998, 12 and 5 grids respectively, no abrupt change was detected in the years before 1991, 1993, 1994 and after 2003. That is to say, the breaks in the stationarity of AP and the AMDI series is mainly concentrated during 1997–2004 and 1995–2002 respectively, and the AMDI series varied generally earlier. Moreover, the spatial distribution of the abrupt changes of precipitation amount and variability is also asynchronous. Examining the means for clustered grids numbered 1–4, for example, the AP series all demonstrated strong increases in 2003, while the means of the AMDI at Grids 1 and 3 changed abruptly in 1995. For Grid 4, the AMDI mean changed abruptly in 2001, but no abrupt changes were noted in Grid 2.
Abrupt changes of the amount and variability of precipitation occurred gradually over the SRYR, and it is necessary to divide the whole study period (37 years). According to the results in Table 3, four equal stages were adopted, 1979–1988, 1988–1997, 1997–2006 and 2006–2015, by duplicating the breakpoints in the previous decade to the following. The first decade, 1979–1988, with scarce sudden changes, represents a “natural decade”; the second, 1988–1997, is a stage with little changes before the end, making it a “pre-change decade” when environmental changes were conceived; the third, 1997–2006, is a “changing decade”, when the effects of climate change emerged and abrupt change was concentrated; and the last, 2006–2015, during which most statistic characteristics transformed to a new population due to a changing environment, is taken as “impact decade”.

4.2.2. Annual Precipitation and Intra-Annual Variability Distribution in Stages

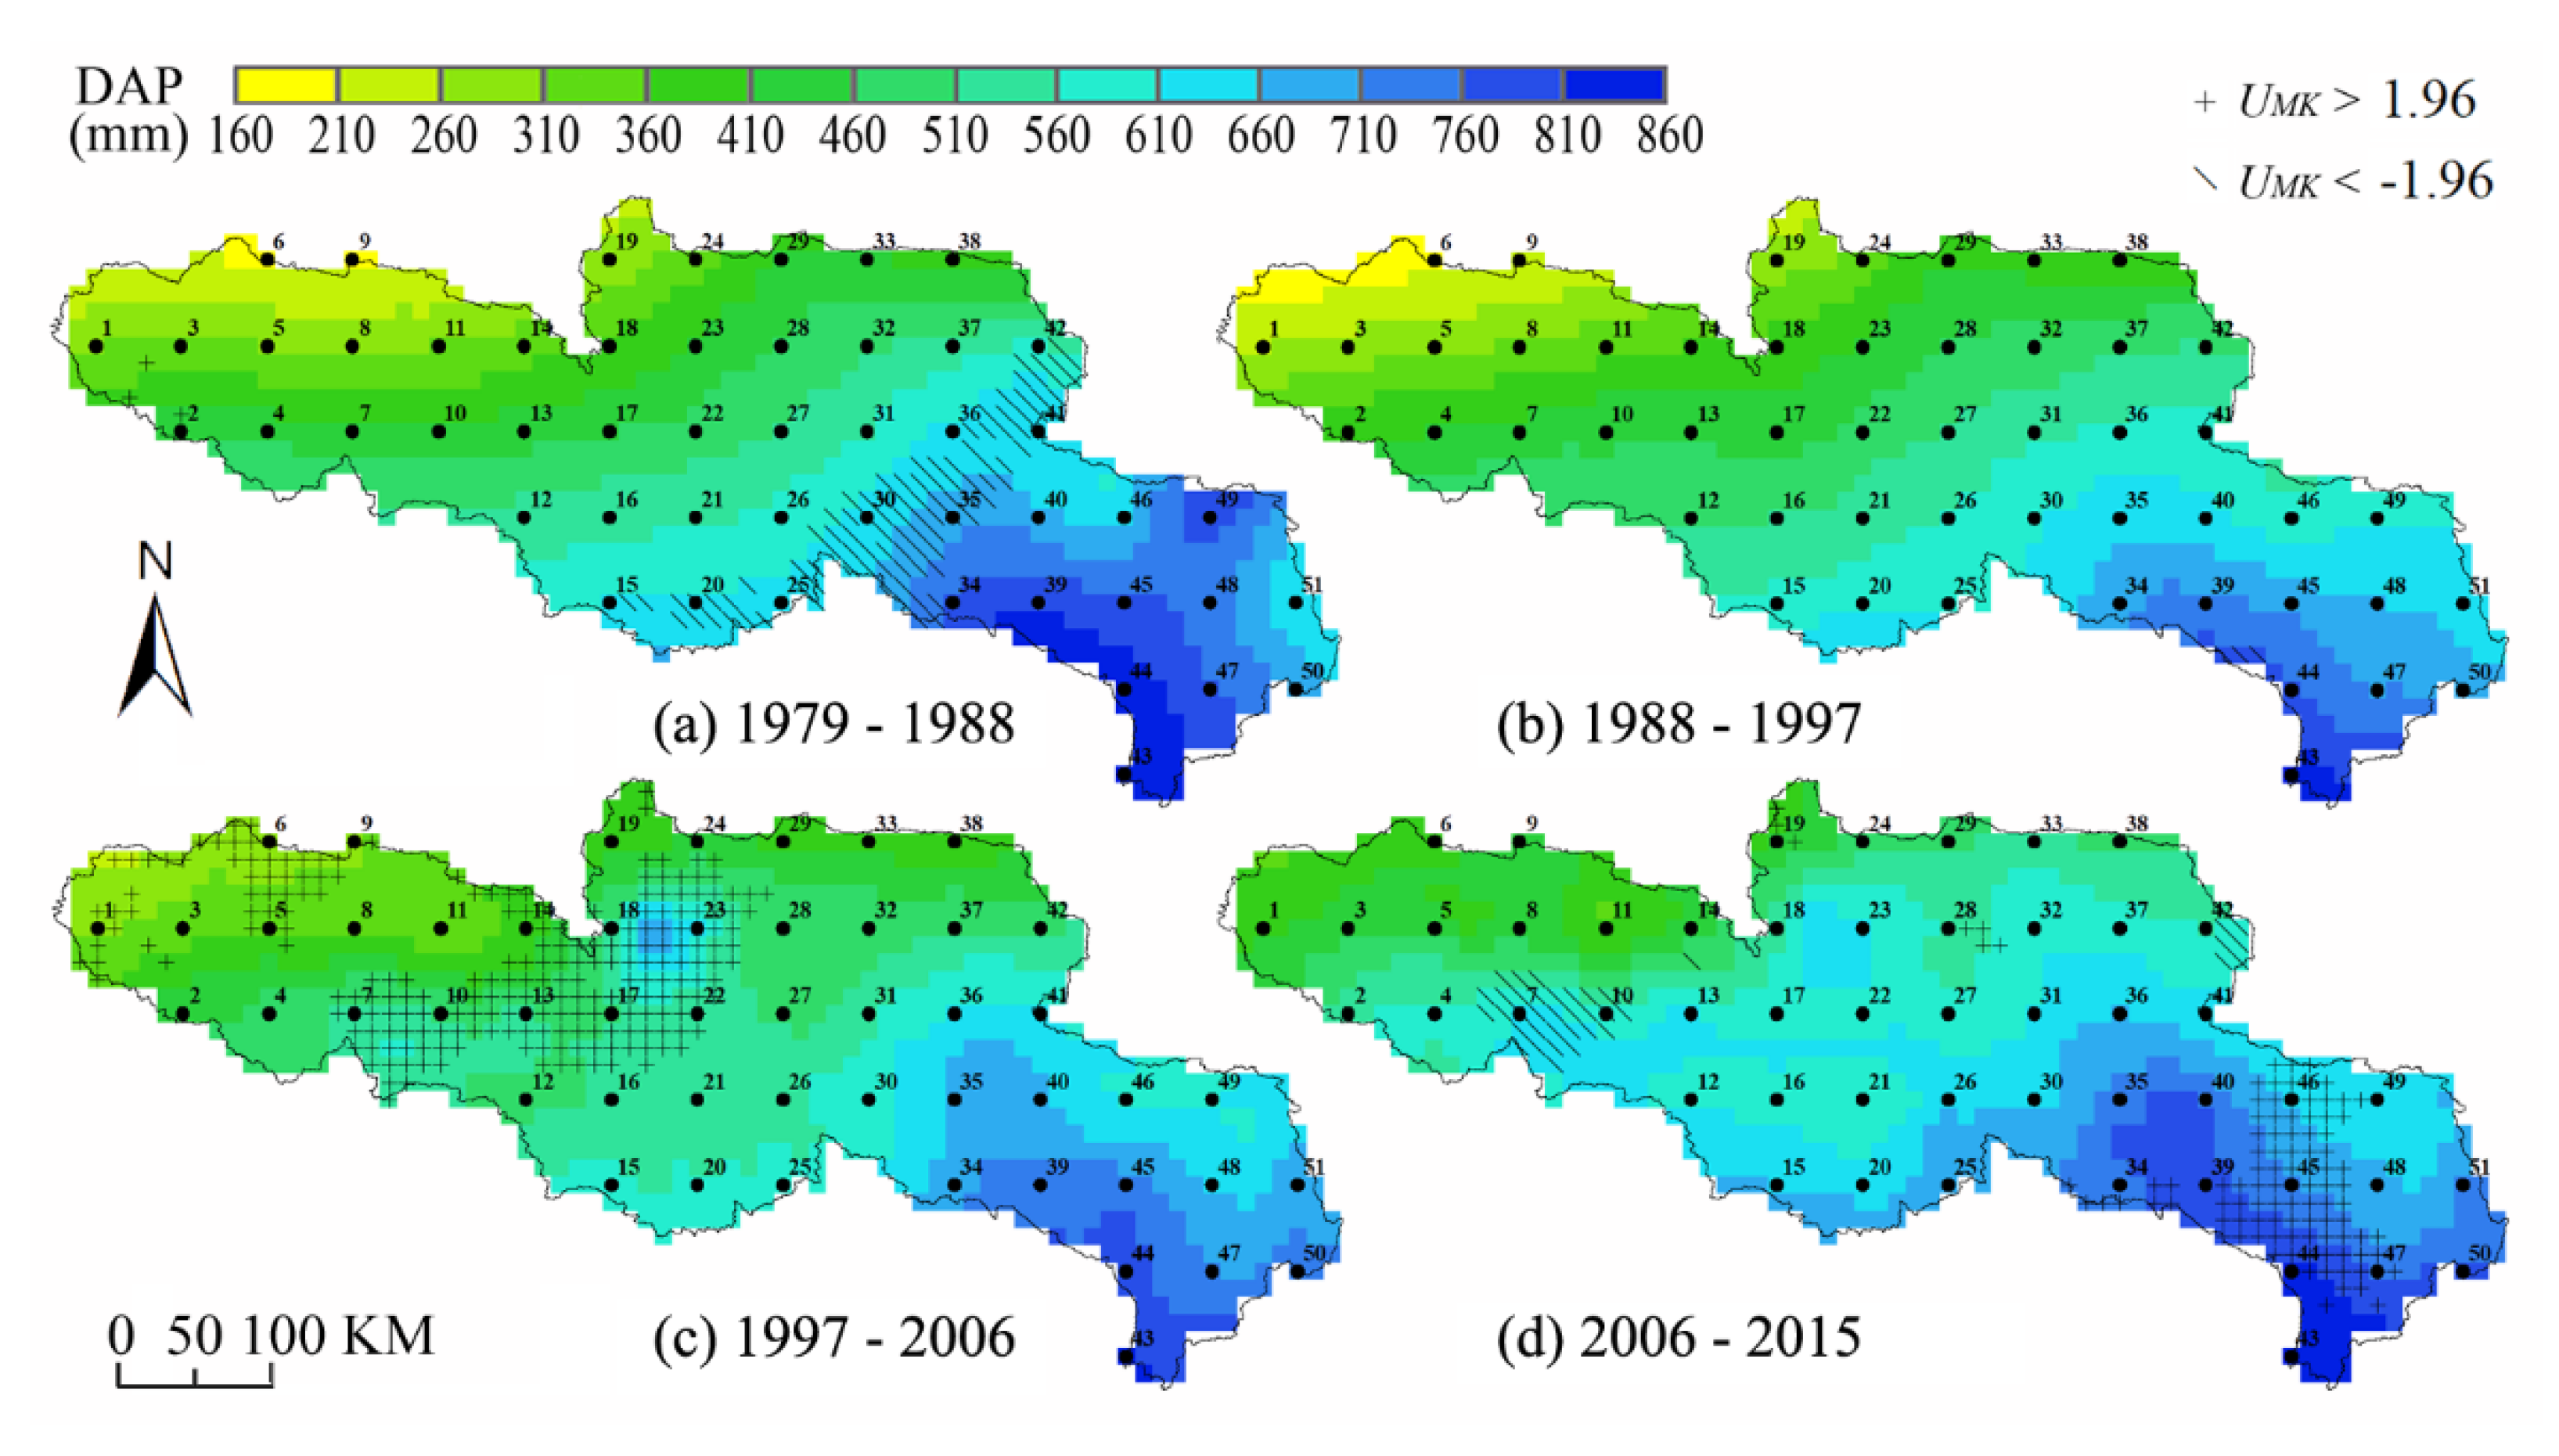
There are widespread changes in the distribution of the decadal averaged annual precipitation (DAP). The regional mean and extremes of DAP and its inclination rate are listed in Table 4. The range of AP during each decade is 186–890 mm, 166–844 mm, 237–896 mm and 314–920 mm successively. The value shows that the DAP decreases before 1997 and then increases, and the maximum value is the most sensitive statistic according to the inclination rate over each decade. The M–K test, with a rejection rate of 5% only detected an insignificant trend during each decade on the basin scale, with the statistic as −1.25, 0.36, 1.43 and 0 in sequence. The distribution patterns of DAP over each decade are shown in Figure 9. It is observed that the average of AP over the first and second decade roughly trend in the NW direction as bandings, with the highest value at the SE corner and decreasing forward. The pattern became more and more unorganized ever since 1997, and the precipitation over the summit M changed more dramatically than that of the rest of the central and upper basin. The regions with significant trends detected by the M–K test are also displayed in Figure 9. In the first decade, the precipitation weakened at the range from 600 mm to 700 mm. The second decade scarcely has areas with significant trends. Most of the dry west region experienced an increased period over the third decade, and the wet southern corner increases afterwards over the most recent decade. AP increased on the NW high-altitude areas first and then in the southern corner, the summit M changed from 390 mm to the 680 mm level, and the southern corner was raised by about 50 mm.
Extensive changes exist among the distribution patterns of the decadal averaged annual marginal disorder index (DAMDI), which are displayed in Figure 10. The DAMDI roughly increased with latitude before 1997, and the pattern has been broken by the summit M neighborhood afterwards. It is a remarkable fact that the highest DAMDI gathers around the basin export (Grid 29). The range of DAMDI during each decade over the SRYR is 1.41–2.27, 1.32–2.27, 1.30–2.41 and 1.34–2.37 successively, and the regional mean first decreases and then increases then decreases again, however the change is slight, with the inclination rate of −0.10 (10·a−1), 0.08 (10·a−1), 0.08 (10·a−1) and −0.04 (10·a−1) in sequence, according to the statistic in Table 4. The maximum is the most sensitive value, and the rate of the mean DAMDI is 0.01 over the study period. The M–K test, with a rejection rate of 5%, did not detect any significant trend during each decade on the basin scale, the statistics are −0.72, 0.36, 0.54 and −0.18 in sequence, while certain parts show significant trends within a small area during one decade. For the first decade, the Grid 11 neighborhood shows decreasing trends with vertical strip shape; the second decade has a circle shape increasing trend around Grids 27–28; there were two spots with trends in the third decade, one decreasing at the WN origin corner, the other increasing around the SE Grid 45; the most recent decade has multiple small areas with trends, two decreasing ones are noticeable, the Summit Grid 18 and Grid 46 near the Zoige wetland.
The evolution of annual precipitation and its variability was studied above through four single continuous decades. The regional average DAP and DAMDI generally reduced first and increased later, and patterns varied towards the irregular mainly due to interference from the shift in values over the summit and NW regions. The DAMDI has a barely changed mean, a slightly decreased minimum, and an increased maximum. The statistics all increase in the DAP, and the greatest rate in the mean of DAP emerged in the last decade, later than the extremes of 1997–2006. The distribution is distinguishable, which means that the nature of precipitation is different from its variability.

4.3. Implication of Precipitation and Its Variability

4.3.1. Long-Term Precipitation Variation Characteristics

The AP series shows a significantly increased trend during 1979–2015, and the monotonic trends of AP reversed from downwards to upwards gradually over the SRYR from the end of the last century to the beginning of this century. The increase in the MP in May contributes the main changes in AP, and May should be the start of the wet season, instead of the traditional season between June–September. May has a great share of AP, it accounts for about 11.6%, while the other months in the dry season accounted for no more than 6.5%; during 1979–2015, the proportion of MP in May is comparable to that of MP during June–September, which ranges from 15.3% to 20.6% (see Figure 5). Moreover, the magnitude of LMDI in May is much less than that in other months in the dry season, the value is around 0.1 during May–September, and in the other months, all are above 0.2 (see Figure 3). That is to say that, during the study period, the MP in May, as well as its variability, is close to the value of the traditional wet season, thus May should be classified as a wet season. MP in May is the only month in the wet season in sync with AP and the significantly increasing trend during 1979–2015 on the basin scale, according to the M–K test (see Figure 5). Additionally, the spatial distribution of LMDI in May is conformed to that of AP, dividing the basin into two halves based on a value, which for MP in May is 0.1m within the range 0.03–0.29 and for AP is 0.02, within 0.01–0.10, with NW over the value and SE under it (see Figure 11). Overall, the wet season begins from May to September over the SRYR during 1979–2015, and the changes in AP series mainly attributes to the variation in May.
LMDI of the AP series indicated an unevenly distributed hydrologic budget over the SRYR, and the changes in the Northern edge and the summit M are more concentrated and prominent on an annual basis, see Figure 4. There are high LMDI regions covering with a significantly increasing trend. The overlap region means on the one hand that it has a non-uniformed moisture supply annually, and on the other, the casual input of precipitation generally became abundant in amount. That is to say, the long-term precipitation in the most NW area is both scarce in amount and sparse in distribution on an annual time scale. The summit M neighborhood is a typical overlap area, which is involved in the water circle during the last two decades, by disturbing the original stair-step shape in Figure 9.
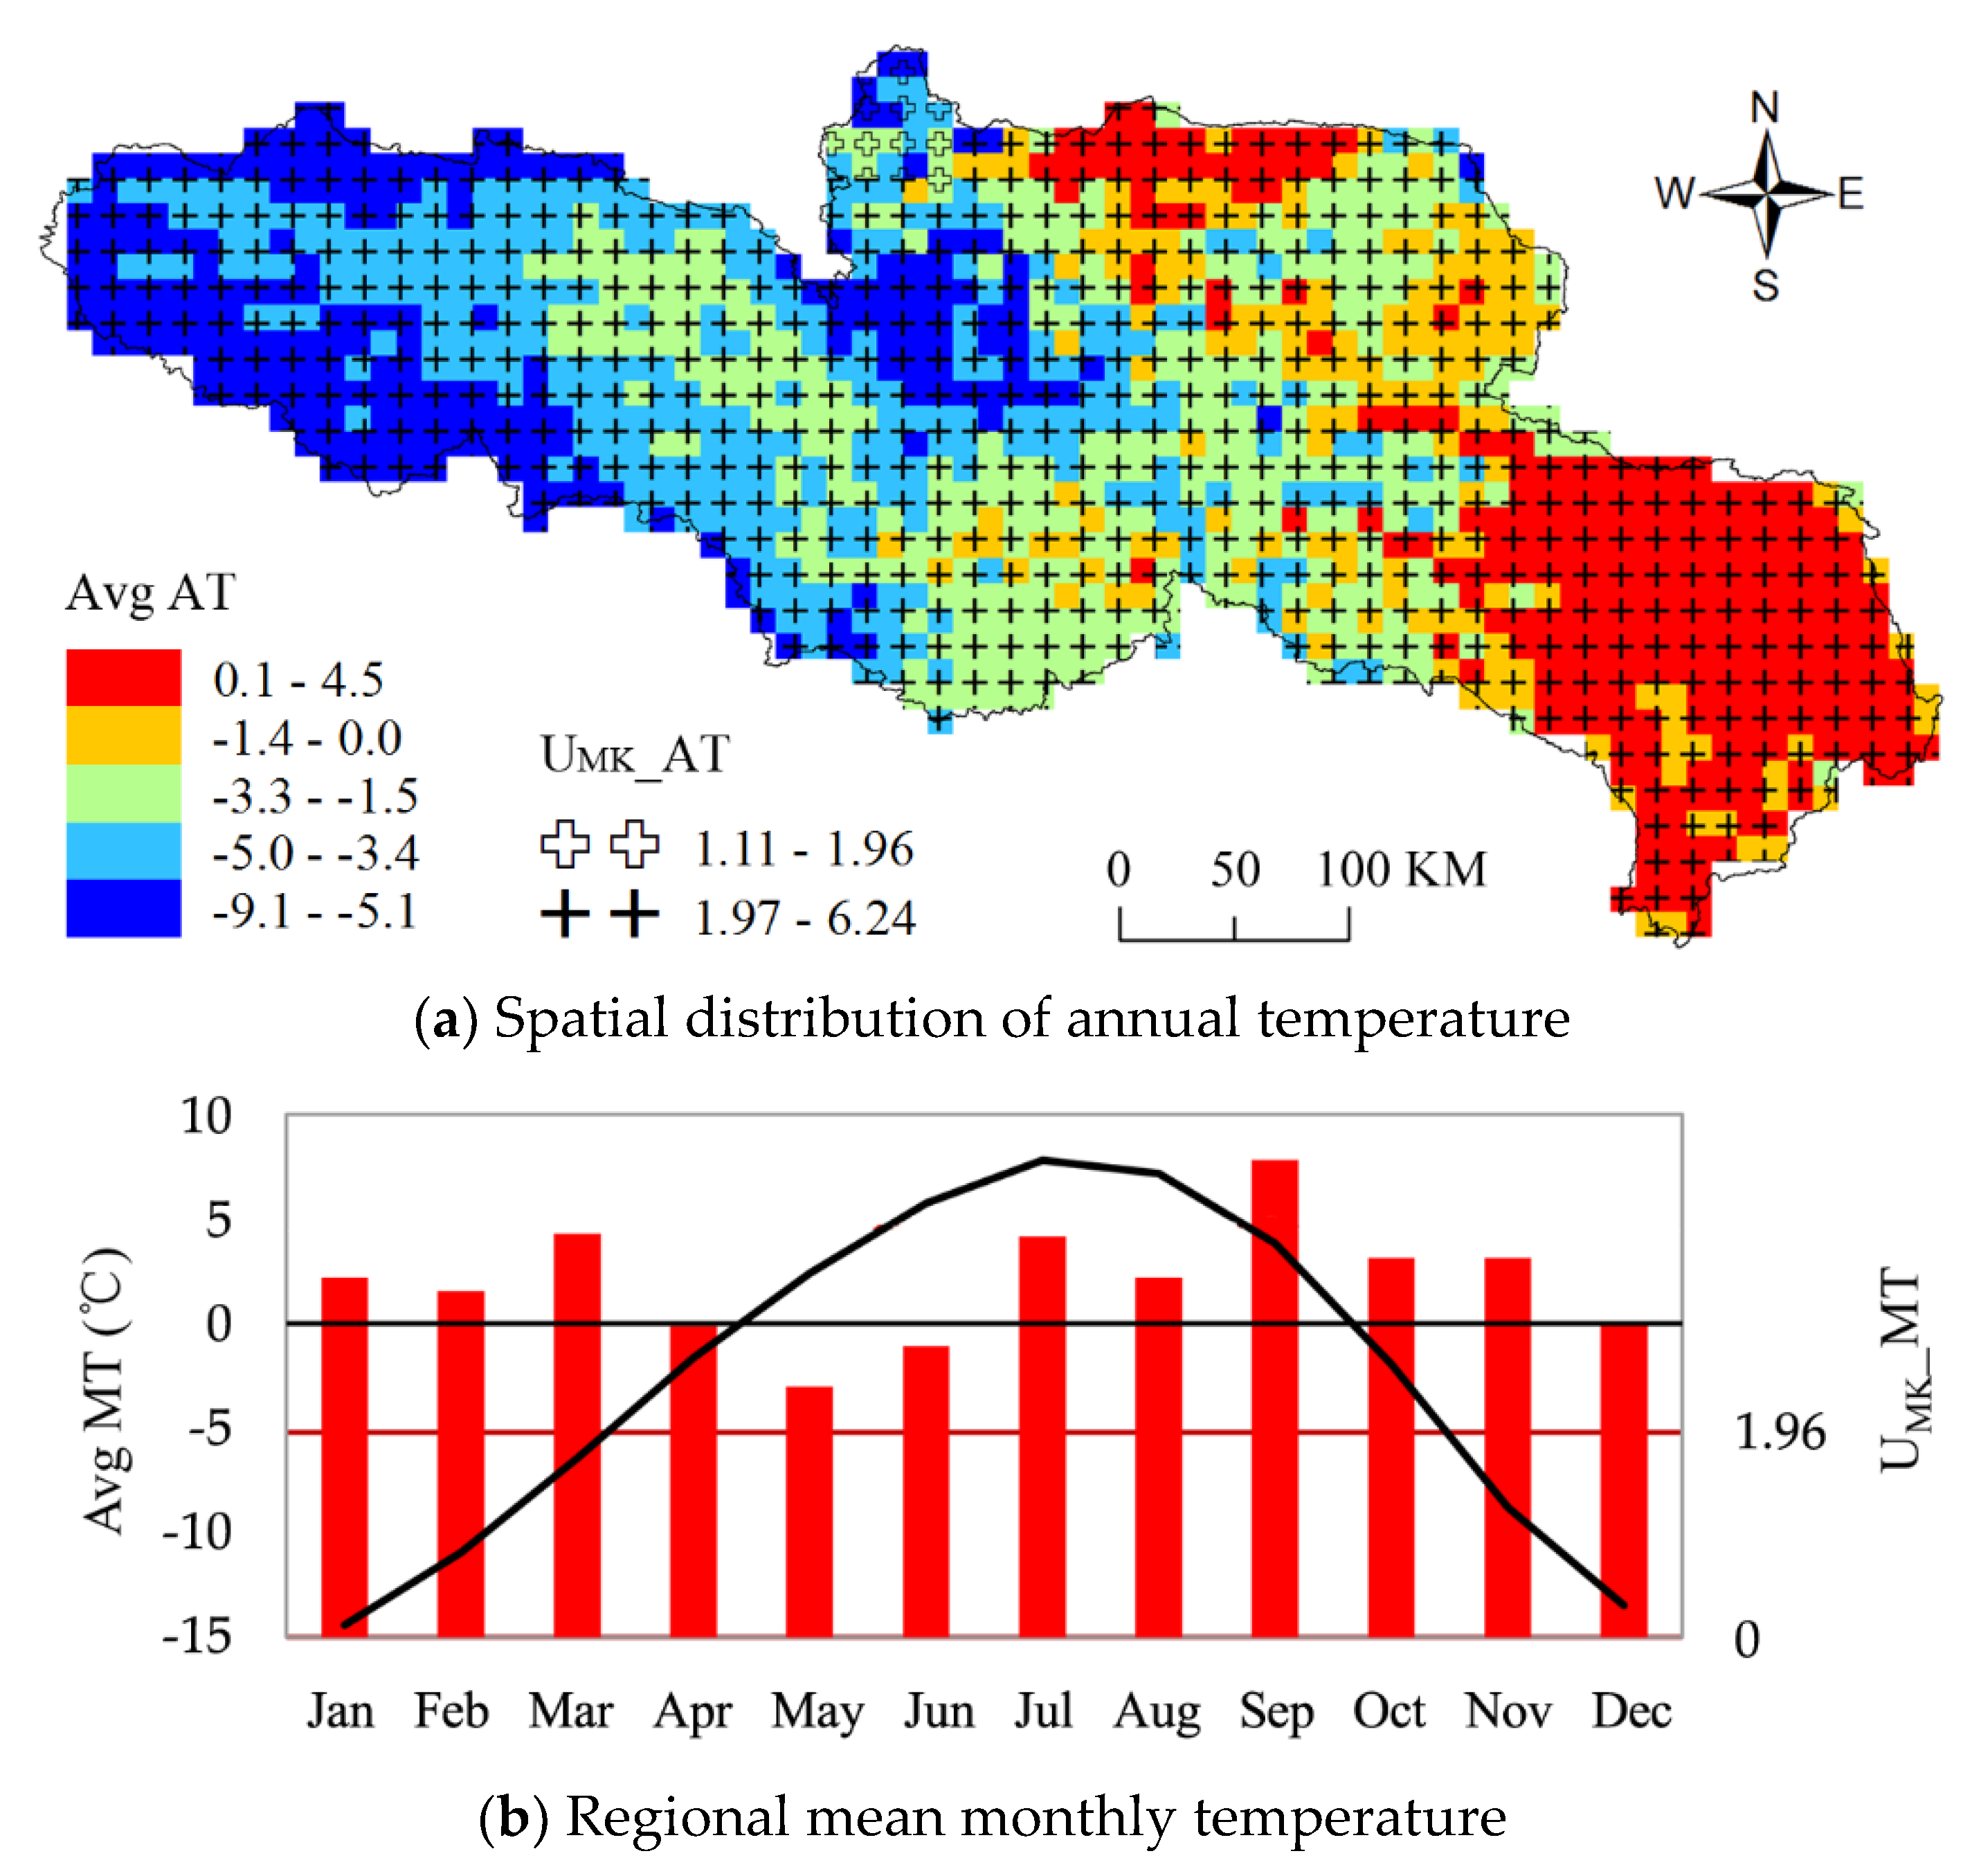
The variation of DAP among decades indicates that the nature of precipitation has been disturbed and affected by global climate change during the study period. Warming is a key feature of the global climate change in the Tibetan Plateau. For the unique permafrost ecosystem in the SRYR, soil freezing and thawing is highly depend on temperature, thus the region is very vulnerable to warming. The freeze-thaw process in the SRYR has drawn lots of attention worldwide [25]. Thawing of soil is accompanied with moisture transfer and heat exchange, therefore releasing water into the dynamic hydrologic cycle. The regional mean temperature of the SRYR is −2.5 °C, and the climate inclination rate was 6.7 °C (100a)−1 during 1979–2015. The whole region shows a temperature-raising trend, and except for the small area in the NW corner, it is significant during this period, which is shown in Figure 12a. The regional mean temperature is above 0 °C during May–September, according to the distribution of the average value of monthly temperatures in Figure 12b, and the raising trend is significant every month during the period. Warming and human construction is threatening the glaciers and permafrost, the water used to be on hold in ice was thought to be now releasing gradually into the local hydrological cycle. Another impact of rising temperatures lies in the precipitation transformation. Due to the low temperature and dramatic daily temperature differences, precipitation is mostly in the form of hailstorms, and warming helps in solid-to-liquid changes. Thus physical state changes related to warming is another reason for the high LMDI.
The reason for the variation in precipitation could also be drawn from the spatial and temporal distribution of inter-annual amounts and variability. Given that the main moisture source of precipitation is the summer monsoon, the big leap in minimum DAP of 71 mm at the headwater NW corner between the decades before and after 1997 in Figure 9 implies that moisture was further transmitted. There were three regions concentrated with a significant increasing trend over the SRYR at two stages after 1997, the central and upper regions during 1997–2006 in Figure 9c, and the lower SE region around the inlet of the summer monsoon during the last decade in Figure 9d. From the perspective of a summer monsoon, the increasing trend in the central and upper regions supported the monsoon enhancement first and then the increase in the lower region forecasts the enhancement persistence. From the perspective of the freeze-thaw process, the central and upper regions including the summit M are the permafrost areas, and the lower region is the seasonal frozen area, both concentrated with the effects of thaws. Thus the water vapor could be from the release of the freeze-thaw process. May contributes the main changes in the increase of AP. Zhang, et al. [26] uncovered that the wetting trend over the TP in May has resulted directly from the earlier onset of the South Asian summer monsoon since the late 1970s and is associated with the phase transition of Inter decadal Pacific Oscillation around the late 1990s, and that the South Asian summer monsoon explains 95% of the increase in the total amount of precipitation in May. The results in this study support this conclusion. High LMDI for MP in May is in the NW part, and May has three regions with significant increasing trends—the SE corner, the Middle region and NW corner, in Figure 6c. According to the route of the summer monsoon in the SRYR, these regions could represent the inlet, barriers and hard-to-reach destinations. As is well-known, summer monsoons have a lower entrance in the SE corner, and mainly travel along the south edge before the rising high altitude block their way, and then climb up and spread out while losing moisture [27]. That is to say, the increasing precipitation in May could hint at the early onset of a summer monsoon.

4.3.2. Throughout-the-Year Moisture Supply

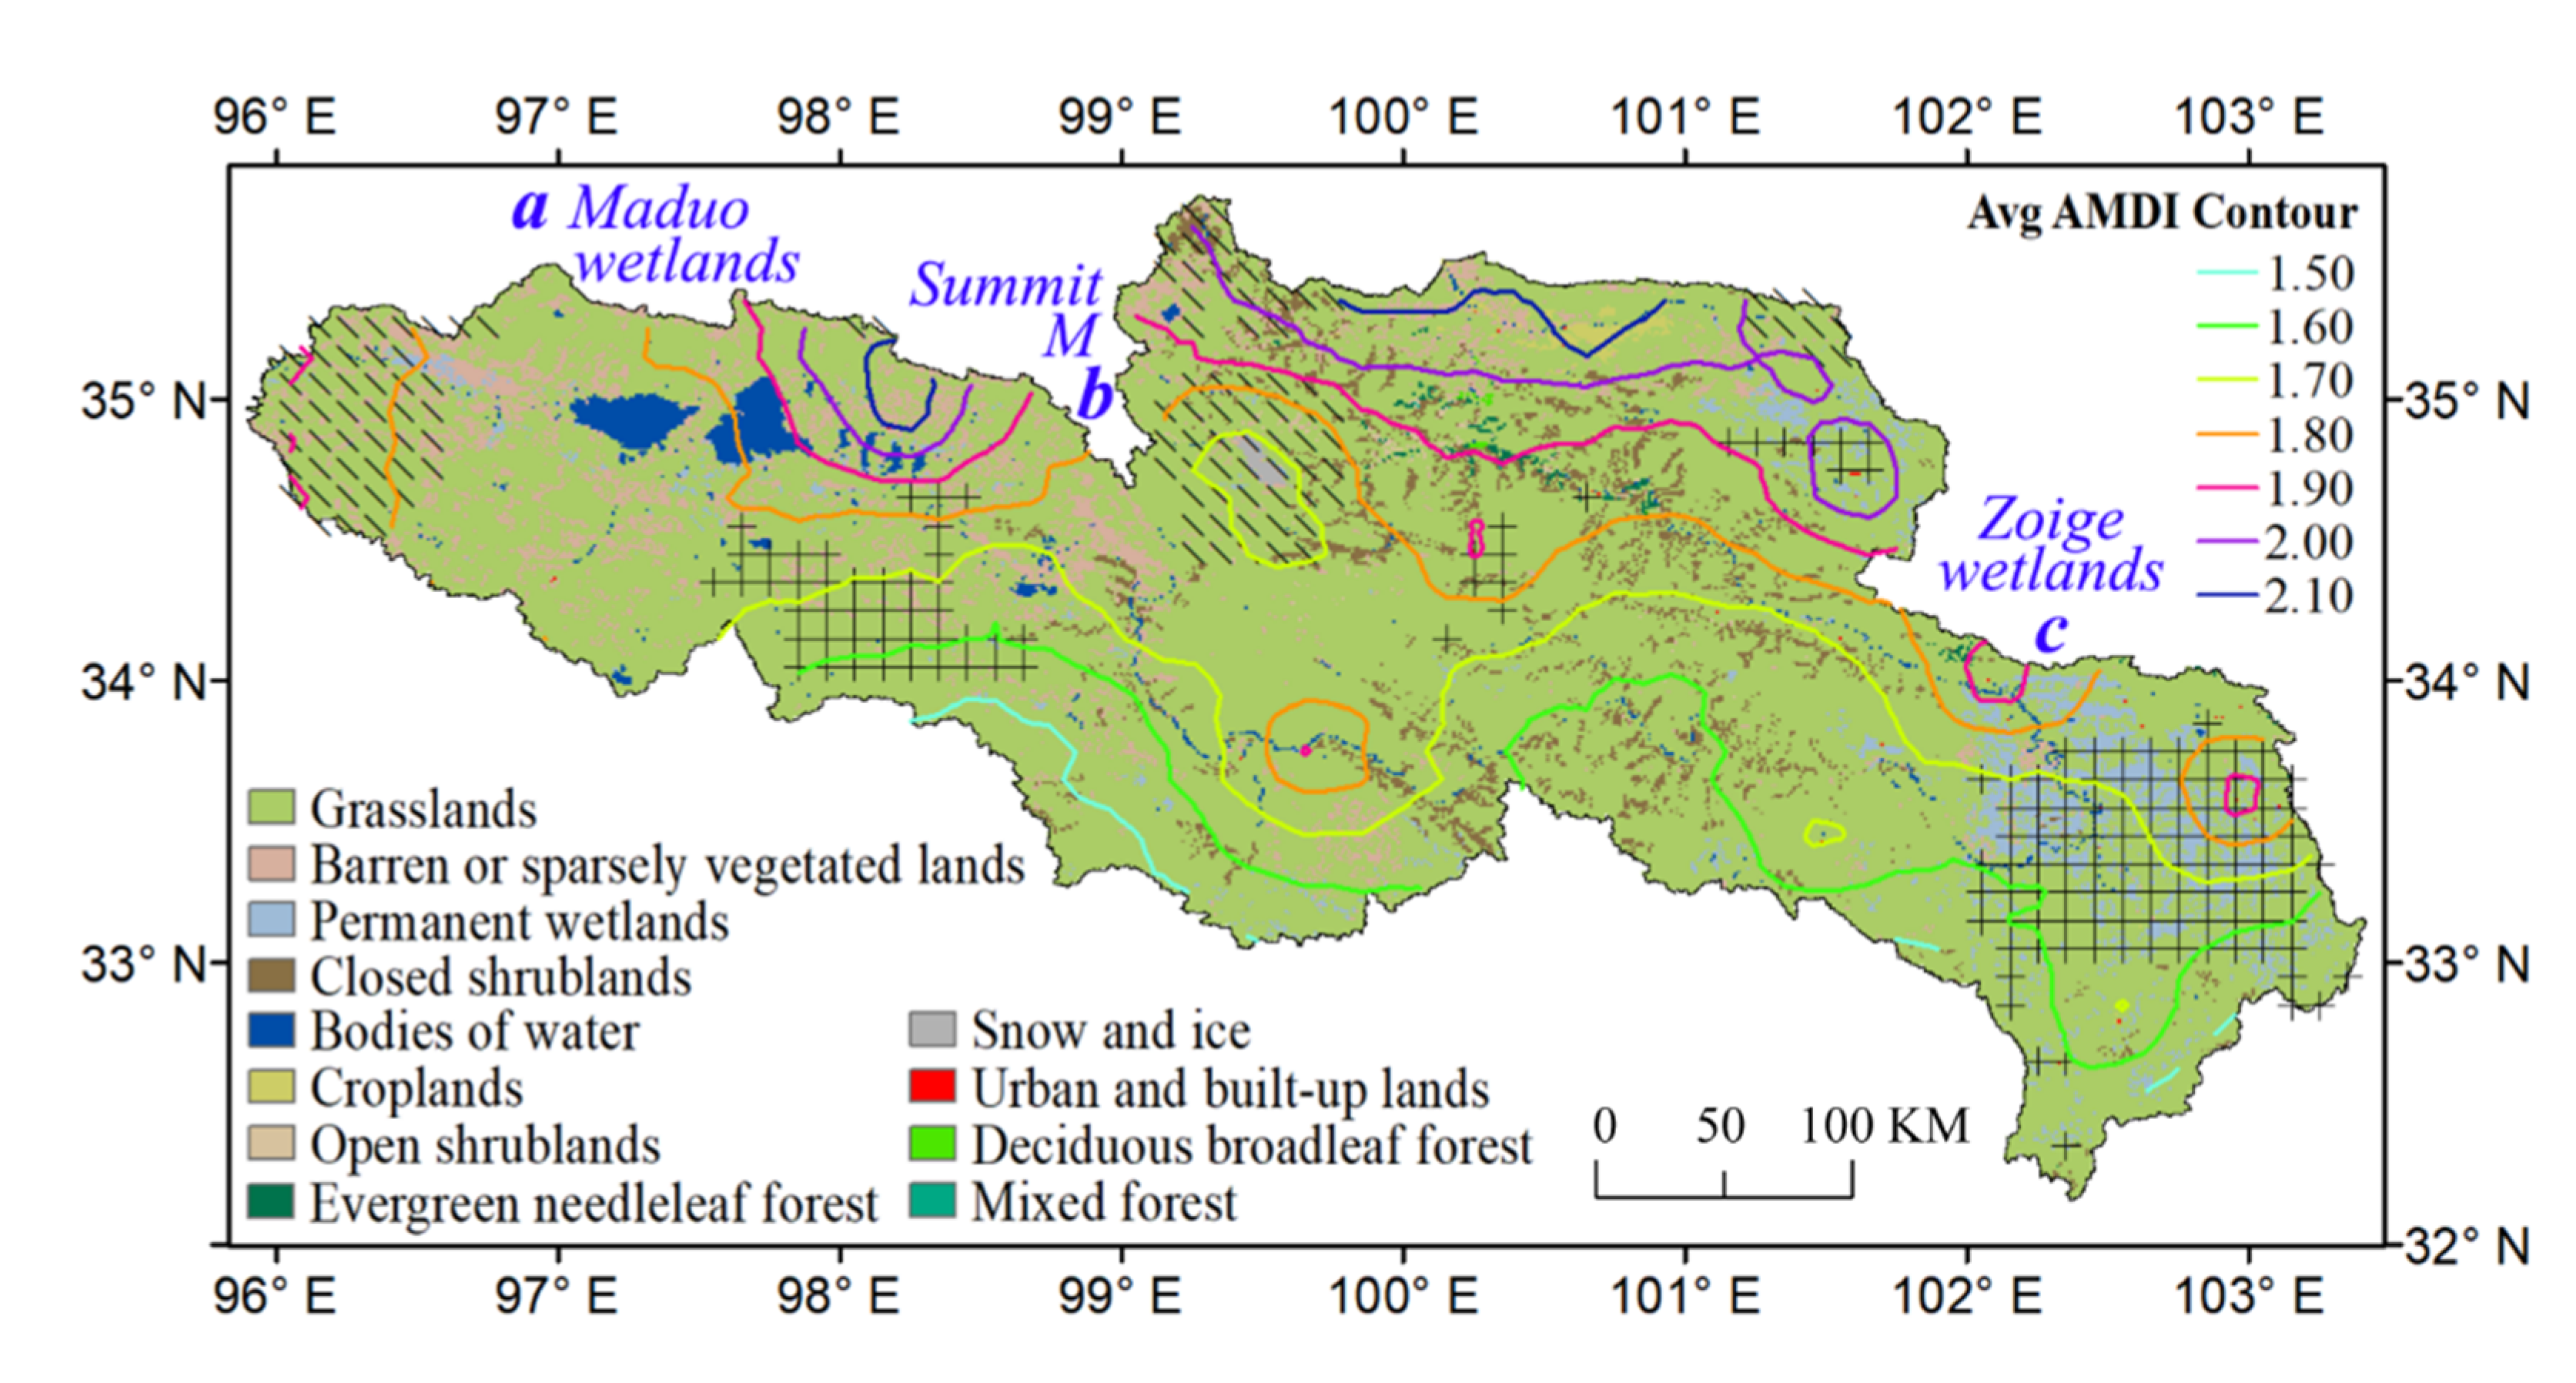
The AMDI calculates the uniformity of the apportionment of AP and reflects the moisture persistence within a year at a fixed location. High AMDI indicates an unsustainable water supply, while low AMDI indicates a relatively more stable moisture supply. The origin of precipitation could be water vapor transportation and local evapotranspiration, and thus the supply could be from outside or from a local cycle. Figure 7 displays the distribution of AMDI and the variation trend; for easy interpretation, the information is combined with a land cover map in Figure 13. Extensive differences exist among the distinctive underlying surfaces, and three regions disturb the continuity of contour lines, due to a relatively low AMDI compared with the neighborhood, marked with a, b and c. Region a is in the Maduo country [28], which has the nickname “thousand-lakes country”, with one third of the area being wetland; Region b is around the summit M, the highest point in the basin, covered with permanent snow and glaciers; Region c is the Zoige Plateau Wetland, the main grazing place. Region a and Region c are both covered with wetland; abundant water reserves and evaporation helps in the supply and offers a low AMDI. Region b used to be scarcely involved in the local exchange of water and energy, but it was slightly interrupted by the active hydrological cycle, which could be the explanation for its low AMDI.
To better understand the variation of AMDI, especially the four regions with significant trends during 1979–2015, local environment should be involved. Firstly, the Zoige Plateau Wetland is the only region located in the SE part, with the largest increasing area among the four. It is the most famous grazing place over the SRYR, since its lower altitude makes it easier to access and warmer to protect the animals in the cold dry season. However, it is suffering from a continuous shrinking problem related to over-grazing and rodent damage, as well as climate change [29]. The degradation could be the reason that there is damage in the sustainable water supply, which is supported by Figure 9c and Figure 10c during 1997–2006, when the DAP did not significantly vary and the DAMDI had an increasing trend. Secondly, the summit M neighborhood has a decreasing trend, which means that the supply tends to be perennial. Considering the altitude, a monsoon could barely disturb the water income in this region. The water transformed from a solid state is more likely to be the main source of the local cycle, and the low and raising temperature could guarantee that the supply would be slow and stable. DAP increases during 1997–2006 in Figure 9c, and the decreasing trend in DAMDI, appears afterwards in Figure 10d, when temperatures are higher. Thirdly, the decreasing trend in the headwater NW corner could be a mixed result of more water transfer from the summer monsoon and snow and permafrost thaws, together with warming, giving a more perennial supply. This deduction could be supported with the increasing DAP in Figure 9c and the decreasing DAMDI in Figure 10c during 1997–2006 over the corner. Lastly, the region between the headwater NW corner and the summit M is part of the North Slope in the Bayan Har Mountain, which could most easily be influenced by the enhanced southwest monsoon, thus resulting in a more concentrated supply. The scale jumps in DAP between Figure 9c,d, meanwhile DAMDI generally remainsing over the region could serve as a proof.
Another noticeable point in the DAP and DAMDI from the last decade is the SE wetlands at the neighborhood of Grid 46, where DAP increases and DAMDI decreases. This means that the local water supply tends to be perennial under the condition of wetting. This could be the joint effect of global climate change and ecological and environmental protection directed by the government. It is near the inlet of a summer monsoon, and is downstream of the mountainous regions, and thus more water vapor would be from enhanced monsoon and runoff due to the freeze-thaw process. If the increase is mainly contributed by monsoon, there would be a bigger DAMDI for temporal supply. Runoff could offer a relatively long-lasting supply of water only if the underlying surface has the storage capacity. Due to long-term over-grazing, the wetlands in the SRYR have experienced a severe shrinking period, as herd livestock is the dominating economic activity for local residents. The number of sheep has reduced by 71.7% since 1990 in the Maduo country, and large-scale ecological immigration has been implemented by the government [30]. This fact offers us some inspiration for how to deal with the impact of global environmental change.

5. Conclusions

In order to investigate the spatio-temporal distribution of variability of long-term and intra-annual precipitation, the marginal disorder index based on entropy theory was calculated respectively for annual, monthly and daily series. The reasons for variation of precipitation and its apportionment variability were analyzed, and the main conclusion were as follows:
(1)
The AP series shows a significantly increasing trend during 1979–2015 measured by the M–K test and the inclination rate is 2.7 mm·a−1, with a reverse in climate trend from warm-dry to warm-wet. Wetting is mainly attributed to the growing impact of global climate change, in particular the enhanced southwest monsoon and a warming-induced freeze-thaw process, with summer monsoons making the biggest contribution.
(2)
The arrival of the summer monsoon was advanced, which makes May the beginning of the wet season, and the increase in the MP in May contributes to the main changes in AP. There are four quantitative pieces of evidence to support this view. The proportion of MP in AP during May–September ranges between 11.6–20.6%, while in the other months it is no higher than 6.5%; the average LMDI during May–September is about 0.1, the other months are all above 0.2; the MP in May is the only month during May–September in sync with the significantly incrasing AP trend during 1979–2015; the spatial distribution of LMDI in May is conformed with that of the AP, dividing the basin in half based on a value, which for MP in May is 0.1 within the range 0.03–0.29 and for AP is 0.02 within 0.01–0.10, with NW over the value and SE under it.
(3)
The variability of the throughout-the-year precipitation apportionment based on daily precipitation is measured by AMDI. The long-term AMDI time series ranges between 1.52–1.93 during 1979–2015, and no significant trend was detected during 1979–2006. The multi-year average AMDI roughly increased with latitude in space, with a range of 1.46–2.17. The Zoige Plateau Wetland (wetlands on the SE), the Maduo country (wetlands on the West) and the summit M (peak of the SRYR) is more uniform than the neighborhood by about 0.1 in AMDI, as a result of a relatively perennial local water supply.
(4)
The increase in precipitation amounts were concentrated in the period after 1997, especially in the decade of 1997–2006, according to a segmented study. During 1979–2006, the mean, minimum and maximum regional averages of AP reached their biggest rising rate, as 9.8 mm·a−1, 12.0 mm·a−1 and 15.3 mm·a−1, respectively. The big increase in the minimum is a remarkable feature in wetting. Meanwhile, the intra-annual apportionment variability slightly increased in the mean and the maximum, and decreased in the minimum, the rate is 0.008 a−1, 0.009 a−1 and -0.003 a−1, successively.
(5)
From a spatial distribution perspective, the increase in AP after 1997 was concentrated on the NW high-altitude areas first and then the lower southern corner. AP in the summit M changed from 390 mm to 680 mm during 1997–2006, and the southern corner was raised by about 50 mm in AP during the last decade. The degradation problem drove the moisture supply on the Zoige Plateau Wetland towards non-uniformity mainly during 1997–2006, when its AMDI raised from 1.4 to 1.7; the supply on the summit M and the headwater NW corner varied towards perennial with the AMDI dropping from 1.8/2.0 to 1.5/1.8, respectively, and part of the North Slope in the Bayan Har Mountain towards temporary, as the AMDI increased from 1.4 to 1.6, due to the single or combined effect of enhanced monsoon and/or a freeze-thaw process after 1997.

Author Contributions

Conceptualization, H.G.; data curation, H.G., Z.Y. and J.L.; formal analysis, H.G.; funding acquisition, Z.Y., G.L. and X.F.; investigation, H.G. and Q.J.; methodology, H.G.; project administration, Z.Y.; resources, Z.Y., Q.J. and Y.H.; software, H.G. and J.L.; supervision, G.L.; validation, Y.H.; visualization, H.G.; writing—review and editing, H.G. All authors have read and agreed to the published version of the manuscript.

Funding

This work was supported by the National Key R&D Program of China (Grant Nos. 2018YFC1508205, 2016YFC0402710, 2018YFC1508001); the National Natural Science Foundation of China (Grant Nos. 51479061, 51539003, 41761134090, 51709046); National Science Funds for Creative Research Groups of China (No. 51421006) and the Special Fund of State Key Laboratory of Hydrology-Water Resources and Hydraulic Engineering (Grant No. 20185043812, 20185044012).

Conflicts of Interest

The authors declare no conflict of interest.

References

  1. Barros, A.P.; Lettenmaier, D.P. Dynamic Modeling of the Spatial Distribution of Precipitation in Remote Mountainous Areas. Mon. Weather. Rev. 1993, 121, 1195–1214. [Google Scholar] [CrossRef]
  2. Mishra, A.K.; Özger, M.; Singh, V.P. An entropy-based investigation into the variability of precipitation. J. Hydrol. 2009, 370, 139–154. [Google Scholar] [CrossRef]
  3. Yuan, F.; Berndtsson, R.; Uvo, C.B.; Zhang, L.; Jiang, P. Summer precipitation prediction in the source region of the Yellow River using climate indices. Hidrol. Res. 2016, 47, 847–856. [Google Scholar] [CrossRef] [Green Version]
  4. Pohl, E.; Gloaguen, R.; Seiler, R. Remote Sensing-Based Assessment of the Variability of Winter and Summer Precipitation in the Pamirs and Their Effects on Hydrology and Hazards Using Harmonic Time Series Analysis. Remote Sens. 2015, 7, 9727–9752. [Google Scholar] [CrossRef] [Green Version]
  5. Clark, P.U.; Alley, R.B.; Pollard, D. Northern Hemisphere Ice-Sheet Influences on Global Climate Change. Science 1999, 286, 1104–1111. [Google Scholar] [CrossRef]
  6. Li, B.; Yu, Z.; Liang, Z.; Acharya, K. Hydrologic response of a high altitude glacierized basin in the central Tibetan Plateau. Glob. Planet. Chang. 2014, 118, 69–84. [Google Scholar] [CrossRef]
  7. Li, Q.; Yang, M.; Wan, G.; Wang, X. Spatial and temporal precipitation variability in the source region of the Yellow River. Environ. Earth Sci. 2016, 75, 594. [Google Scholar] [CrossRef]
  8. Ran, Y.H.; Li, X.; Lu, L.; Li, Z.Y. Large-scale land cover mapping with the integration of multi-source information based on the Dempster–Shafer theory. Int. J. Geogr. Inf. Sci. 2012, 26, 169–191. [Google Scholar] [CrossRef]
  9. Hu, Y.; Maskey, S.; Uhlenbrook, S.; Zhao, H. Streamflow trends and climate linkages in the source region of the Yellow River, China. Hydrol. Process. 2011, 25, 3399–3411. [Google Scholar] [CrossRef]
  10. Yi, X.S.; Li, G.S.; Yin, Y.Y. The impacts of grassland vegetation degradation on soil hydrological and ecological effects in the source region of the Yellow River—A case study in Junmuchang region of Maqin country. Procedia Environ. Sci. 2012, 13, 967–981. [Google Scholar] [CrossRef] [Green Version]
  11. Meng, F.; Su, F.; Yang, D.; Tong, K.; Hao, Z. Impacts of recent climate change on the hydrology in the source region of the Yellow River basin. J. Hydrol. Reg. Stud. 2016, 6, 66–81. [Google Scholar] [CrossRef] [Green Version]
  12. Zheng, H.X.; Zhang, L.; Zhu, R.R.; Liu, C.M.; Sato, Y.; Fukushima, Y. Responses of streamflow to climate and land surface change in the headwaters of the Yellow River Basin. Water Resour. Res. 2009, 45, 641–648. [Google Scholar] [CrossRef]
  13. ASTER Global Digital Elevation Model. Version 2. Available online: https://lpdaac.usgs.gov/documents/220/Summary_GDEM2_validation_report_final.pdf (accessed on 17 October 2011).
  14. Jie, H.E.; Kun, Y. China meteorological forcing dataset (1979–2015). Available online: http://westdc.westgis.ac.cn/en/data/7a35329c-c53f-4267-aa07-e0037d913a21/ (accessed on 1 May 2016).
  15. Chen, Y.; Yang, K.; Jie, H.; Qin, J.; Shi, J.; Du, J.; He, Q. Improving land surface temperature modeling for dry land of China. J. Geophys. Res. Atmos. 2011, 116. [Google Scholar] [CrossRef]
  16. Fang, Y.H.; Zhang, X.; Corbari, C.; Mancini, M.; Zeng, W. Improving the Xin’anjiang hydrological model based on mass–energy balance. Hydrol. Earth Syst. Sc. 2017, 21, 3359–3375. [Google Scholar] [CrossRef] [Green Version]
  17. Yang, K.; He, J.; Tang, W.; Qin, J.; Cheng, C.C.K. On downward shortwave and longwave radiations over high altitude regions: Observation and modeling in the Tibetan Plateau. Agric. For. Meteorol. 2010, 150, 38–46. [Google Scholar] [CrossRef]
  18. Ran, Y.; Li, X. Multi-source Integrated Chinese Land Cover Map. Available online: http://data.tpdc.ac.cn/zh-hans/data/7e61387b-d3f2-40cb-bc05-8d16e01ea72b/ (accessed on 9 August 2019).
  19. Shannon, C.E. A mathematical theory of communication. Bell Syst. Tech. J. 1948, 27, 379–423, 623–656, Reprited in C.E. Shannon and W. Weaver The Mathematical Theory of Communication; University Illinois Press: Champaign, IL, USA, 1949. [Google Scholar] [CrossRef] [Green Version]
  20. Fisher, R.A. XV.—The Correlation between Relatives on the Supposition of Mendelian Inheritance. Trans. R. Soc. Edinb. 1918, 52, 399–433. [Google Scholar] [CrossRef] [Green Version]
  21. NIST/SEMATECH e-Handbook of Statistical Methods."1.3.6.4. Location and Scale Parameters". 2013. Available online: https://www.itl.nist.gov/div898/handbook/eda/section3/eda364.htm (accessed on 30 October 2013).
  22. Kendall, M.G. Rank Correlation Methods; Griffin: Oxford, UK, 1948; Volume 34, p. 108. [Google Scholar]
  23. Mann, H.B. Nonparametric Tests Against Trend. Econometrica 1945, 13, 245–259. [Google Scholar] [CrossRef]
  24. Pettitt, A.N. A Non-Parametric Approach to the Change-Point Problem. J. Royal Stat. Soc. 1979, 28, 126–135. [Google Scholar] [CrossRef]
  25. Wang, G.; Qian, J.; Cheng, G.; Lai, Y. Eco-environmental degradation and causal analysis in the source region of the Yellow River. Environ. Geol. 2001, 40, 884–890. [Google Scholar] [CrossRef]
  26. Zhang, W.; Zhou, T.; Zhang, L. Wetting and greening Tibetan Plateau in early summer in recent decades: Wetting and Greening Tibetan Plateau. J. Geophys. Res. Atmos. 2017, 122, 5808–5822. [Google Scholar] [CrossRef]
  27. Spicer, R.A. Tibet, the Himalaya, Asian monsoons and biodiversity-In what ways are they related? Plant Divers. 2017, 39, 233–244. [Google Scholar] [CrossRef] [PubMed]
  28. Li, X.; Xue, Z.; Gao, J. Dynamic Changes of Plateau Wetlands in Madou County, the Yellow River Source Zone of China: 1990–2013. Wetlands 2016, 36, 299–310. [Google Scholar] [CrossRef]
  29. Bai, J.-H.; Lu, Q.-Q.; Wang, J.-J.; Zhao, Q.-Q.; Ouyang, H.; Deng, W.; Li, A.-N. Landscape pattern evolution processes of alpine wetlands and their driving factors in the Zoige Plateau of China. J. Mt. Sci. 2013, 10, 54–67. [Google Scholar] [CrossRef]
  30. Li, X.; Xue, Z.; Gao, J. Environmental Influence on Vegetation Properties of Frigid Wetlands on the Qinghai-Tibet Plateau, Western China. Wetlands 2016, 36, 807–819. [Google Scholar] [CrossRef]
Figure 1. Flow Chart. AP, MP and DP stand for annual, monthly and daily precipitation, respectively.
Water 12 02486 g001
Figure 2. The source region of the Yellow River with 12 meteorological stations (in red) and 51 CMFD (China Meteorological Forcing Dataset) grids (in black).
Water 12 02486 g002
Figure 3. The mean and extreme of LMDI (long-term marginal disorder index) for annual and monthly precipitation series at 51 CMFD grids during 1979–2015.
Water 12 02486 g003
Figure 4. The spatial distribution of LMDI (long-term marginal disorder index) based on AP (annual precipitation) and the Mann–Kendall (M–K) test statistic of the AP series during 1979–2015 in the source region of the Yellow River (SRYR).
Water 12 02486 g004
Figure 5. The average of regional mean monthly precipitation and the M–K test statistic during 1979–2015 in the SRYR.
Water 12 02486 g005
Figure 6. The spatial distribution of the LMDI (long-term marginal disorder index) and the significant increasing trend of the MP (monthly precipitation) time series by the M–K test in January, February and May during 1979–2015 over the SRYR.
Water 12 02486 g006
Figure 7. The spatial distribution of the multi-year average AMDI (annual marginal disorder index) based on daily precipitation and its significant trends by the M–K test during 1979–2015 over the SRYR.
Water 12 02486 g007
Figure 8. The mean and extreme of the long-term AMDI (annual marginal disorder index) of daily precipitation during 1979–2015 at selected grid.
Water 12 02486 g008
Figure 9. Average values and monotonic trends of annual precipitation over a decade for (a) 1979–1988, (b) 1988–1997, (c) 1997–2006 and (d) 2006–2015.
Water 12 02486 g009
Figure 10. Decadal average intra-annual variability for daily precipitation series and its trends measured by decadal averaged annual marginal disorder index (DAMDI) and UMK respectively, for (a) 1979–1988, (b) 1988–1997, (c) 1997–2006 and (d) 2006–2015.
Water 12 02486 g010
Figure 11. Spatial distribution of LMDI for AP (a) and MP in May (b) during 1979–2015, with a dividing line.
Water 12 02486 g011
Figure 12. The average annual (a) and monthly (b) air temperature and the M–K test statistic during 1979–2015 in the SRYR.
Water 12 02486 g012
Figure 13. Land cover map combined with the information in Figure 7, the isolines of the mean value of AMDI during 1979–2015 and the areas with AMDI significant trends over the SRYR, and three regions with typical underlying surface, marked with a, b and c.
Water 12 02486 g013
Table 1. Meteorological stations in the source region of the Yellow River.
IDNameLongitude (°E)Latitude (°N)Altitude (m)Period (Year)
52957 1Tongde100.6535.273289.41954–1998
52968Zeku101.4735.033662.81957–1990
56033Maduo98.2234.924272.31953–
56041Zhongxin99.234.274211.11959–1997
56043Guoluo100.2534.4737191991–
56046Dari99.6533.753967.51956–
56065Henan101.634.7335001959–
56067Jiuzhi101.4833.433628.51958–
56074Maqu102.08343471.41967–
56075Langmusi102.6334.083362.71957–1988
56079Ruoergai102.9733.583439.61957–
56173Hongyuan102.5532.83491.61960–
1 gray shaded represents an historical national station.
Table 2. The mean, extremes and CV of the selected 51 AP series (1979–2015).
No.Mean (mm)Max (mm)Min (mm)CVNo.Mean (mm)Max (mm)Min (mm)CV
13215051970.24275326793940.14
24536352630.19284946573070.17
33475271970.24294296132850.19
44747252850.22306227674600.14
53485052190.20315737454170.15
62704821530.37325217883720.19
74988103290.25334428103070.24
83505692410.22347279205690.12
92875481530.38356918765270.13
104887673290.23366258324380.15
113395042200.17375367673720.18
125337253500.16384136132860.22
135158353720.233976310295710.14
143825482640.18406878985270.14
156137694600.14416237674380.14
165497013720.14425357233720.16
175036793500.194383910765260.13
184556792860.234481010075260.14
193495912200.25457299645710.13
206117884160.14466288765040.14
215516793720.14477479645040.13
225256793940.16486938784830.13
235218323290.26496619864820.17
244046572420.25507359205910.12
256328544160.16516758985040.14
265928104600.14Avg5427543770.18
Table 3. Abrupt change detection results of the AP (annual precipitation) series and AMDI (annual marginal disorder index) series during 1979–2015 at 51 selected grids.
YearAPAMDIYearAPAMDI
GridCountGridCountGridCountGridCount
198934; 452-019999111; 432
1990-0-020006; 22223; 332
1991-0-020015; 13; 1434; 412
1992-027; 28220027; 8; 10; 12; 15; 16; 17; 21; 31; 35; 36; 40; 41; 511418; 19; 243
1993-0-0
1994-0-0
1995-01; 3; 463
1996-0401
199719; 23; 50312; 16; 21; 36; 37; 42; 44; 47; 48; 49; 50; 511220031; 2; 3; 4; 28; 30; 32; 37; 389-0
200411; 29; 333-0
199818; 2427; 10; 14; 39; 4552005-0-0
SUM 39 32
Table 4. The regional mean and extreme values of averaged AP and AMDI with inclination rates during different periods over the SRYR.
PeriodAvg AP (mm)/Rate (mm·a−1 1)Avg AMDI/Rate (10·a−1)
MeanMinMaxMeanMinMax
1979–1988523/−5.4186/−0.1890/−14.61.75/−0.101.41/−0.092.27/−0.24
1988–1997497/−2.0166/1.8844/−13.41.69/0.081.32/−0.022.27/0.14
1997–2006529/9.8237/12.0896/15.31.77/0.081.30/−0.032.41/0.09
2006–2015596/2.8314/4.9920/9.21.78/−0.041.34/0.022.37/0.09
1979–2015540/2.7229/5.0895/1.41.75/0.011.35/−0.032.34/0.04
1 a represents year in this article.