Recreation and Tourism Service Systems Featuring High Riverbanks in Taiwan


Abstract
:1. Introduction
2. Materials and Methods
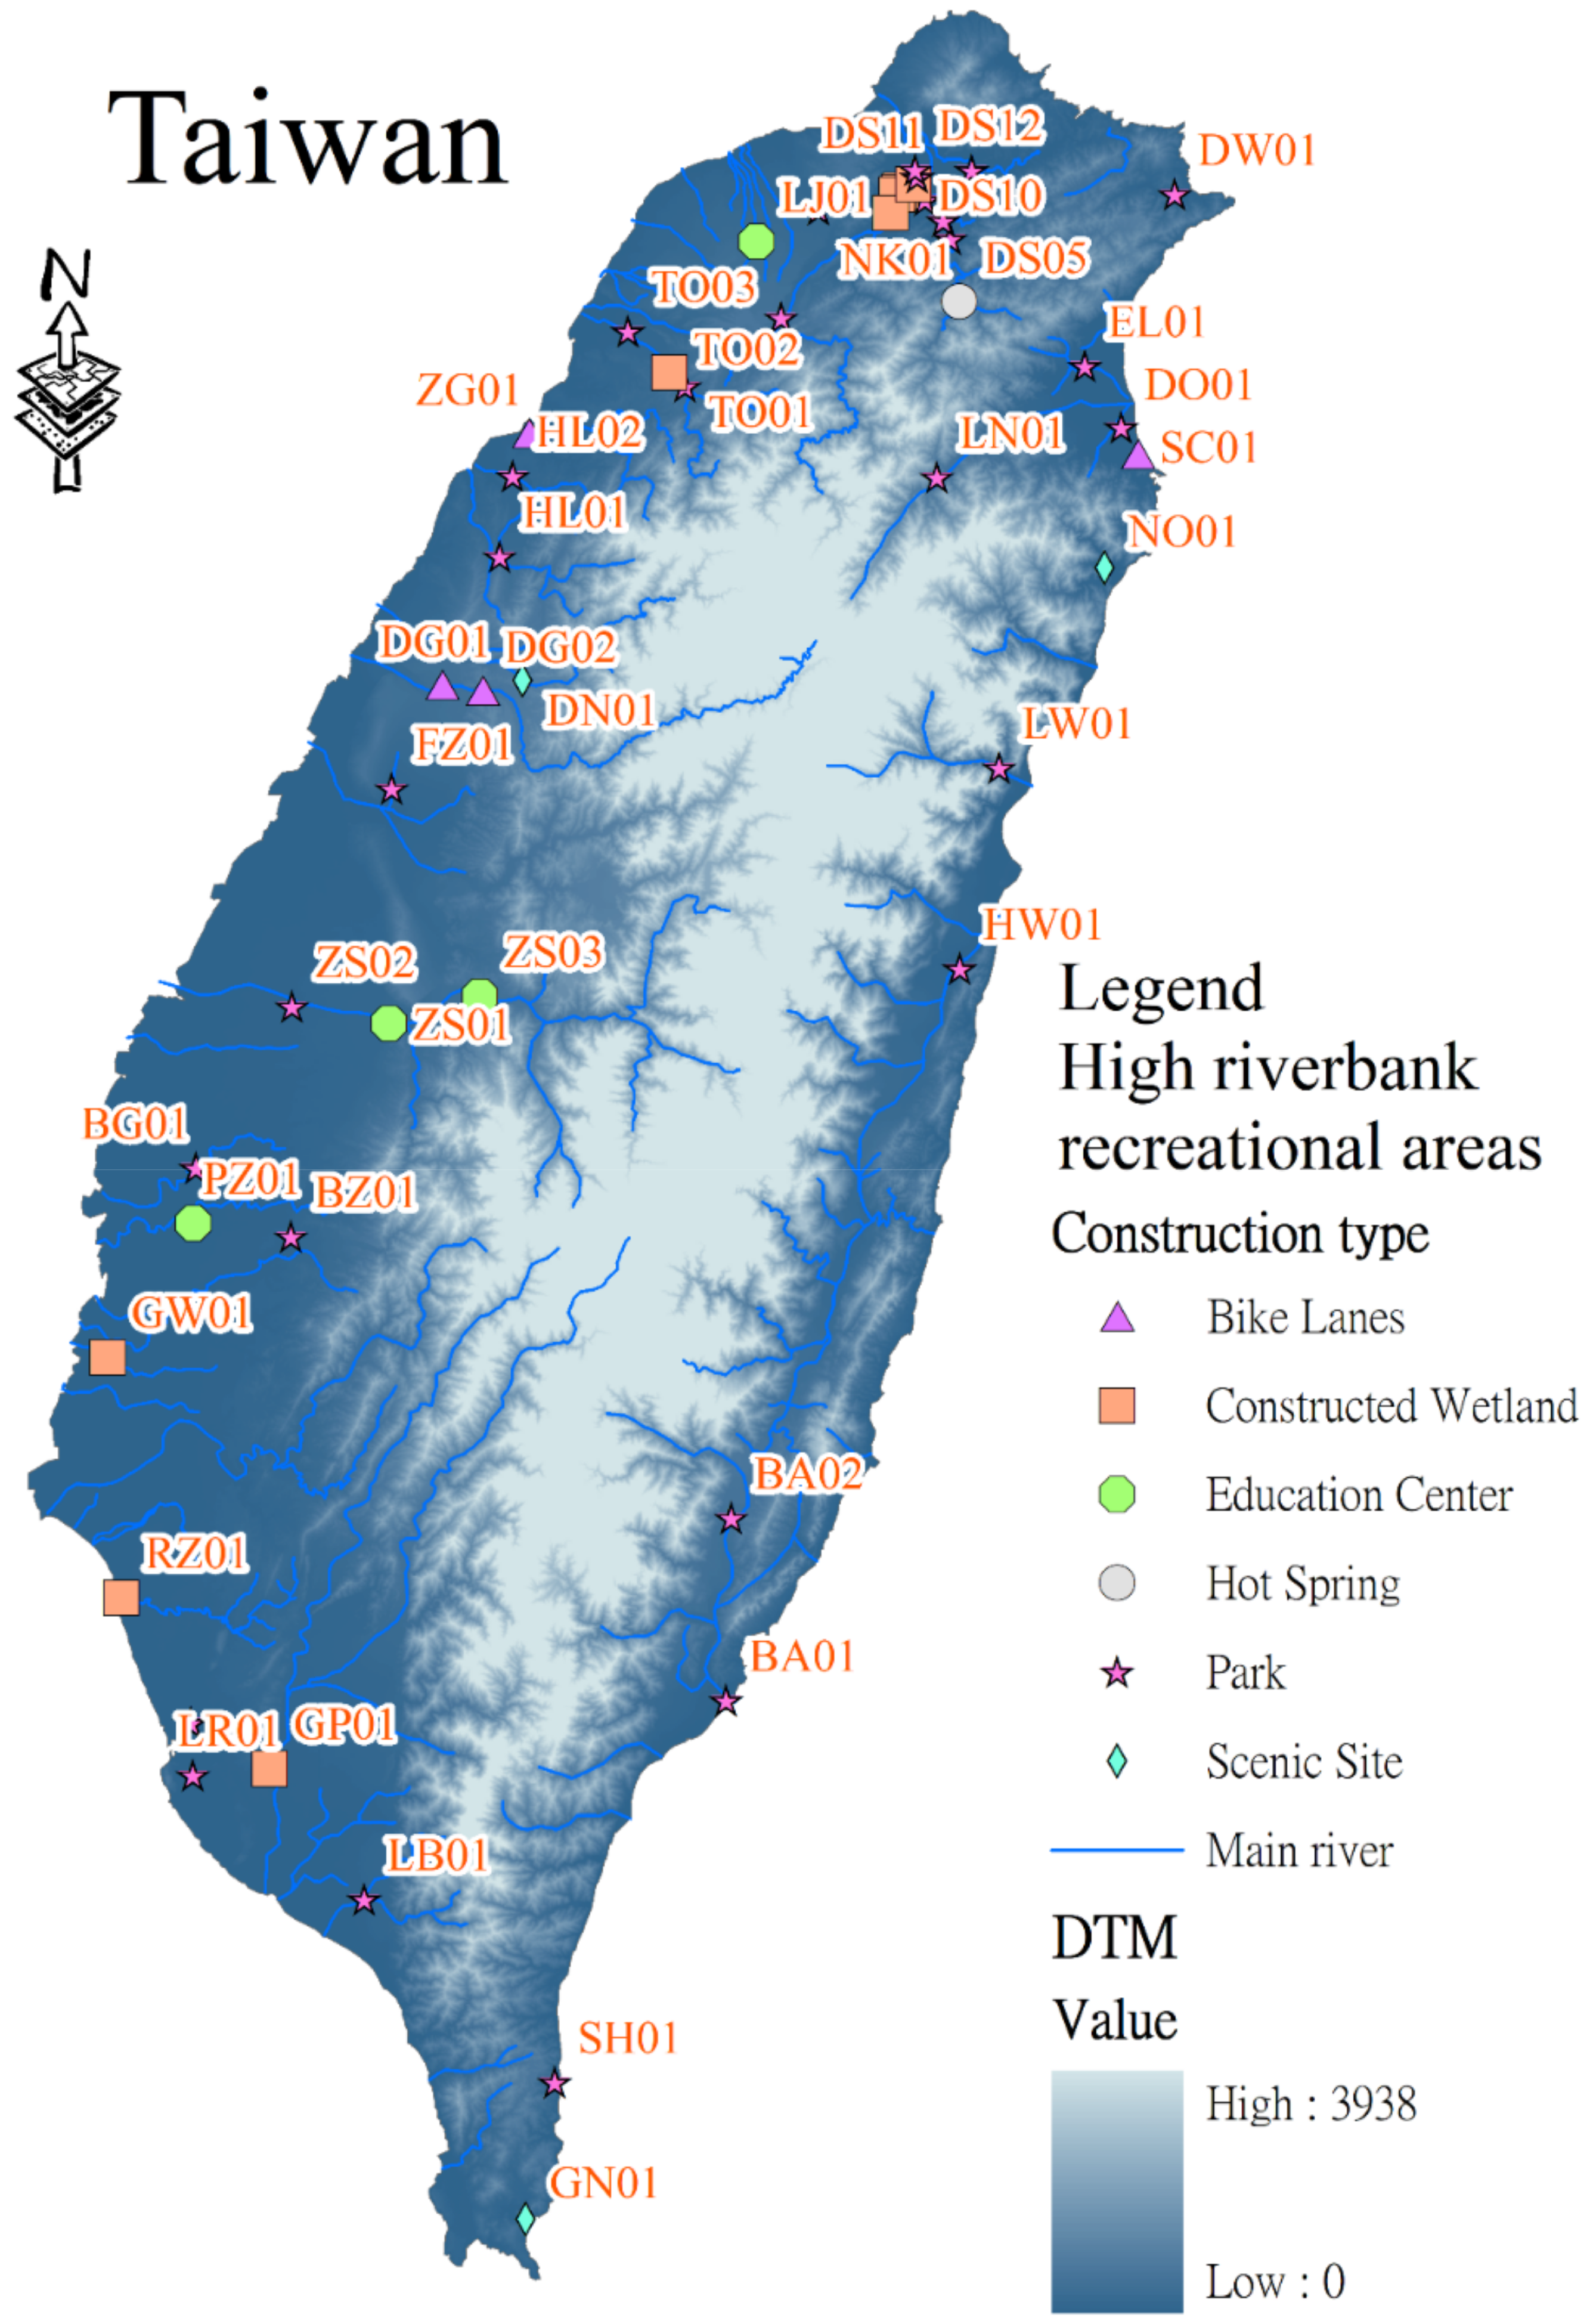
2.1. Research Material
2.2. Onsite Investigation
2.3. Establishment of the Comfortable Water Environment Rest Assessment Form
2.4. Multivariate Analysis
3. Results
3.1. CWERAF Results and the Number of Visitors
3.2. Analyzing Influential Factors of High Riverbank Recreational Areas
- A.
- Exploratory Factor Analysis
- B.
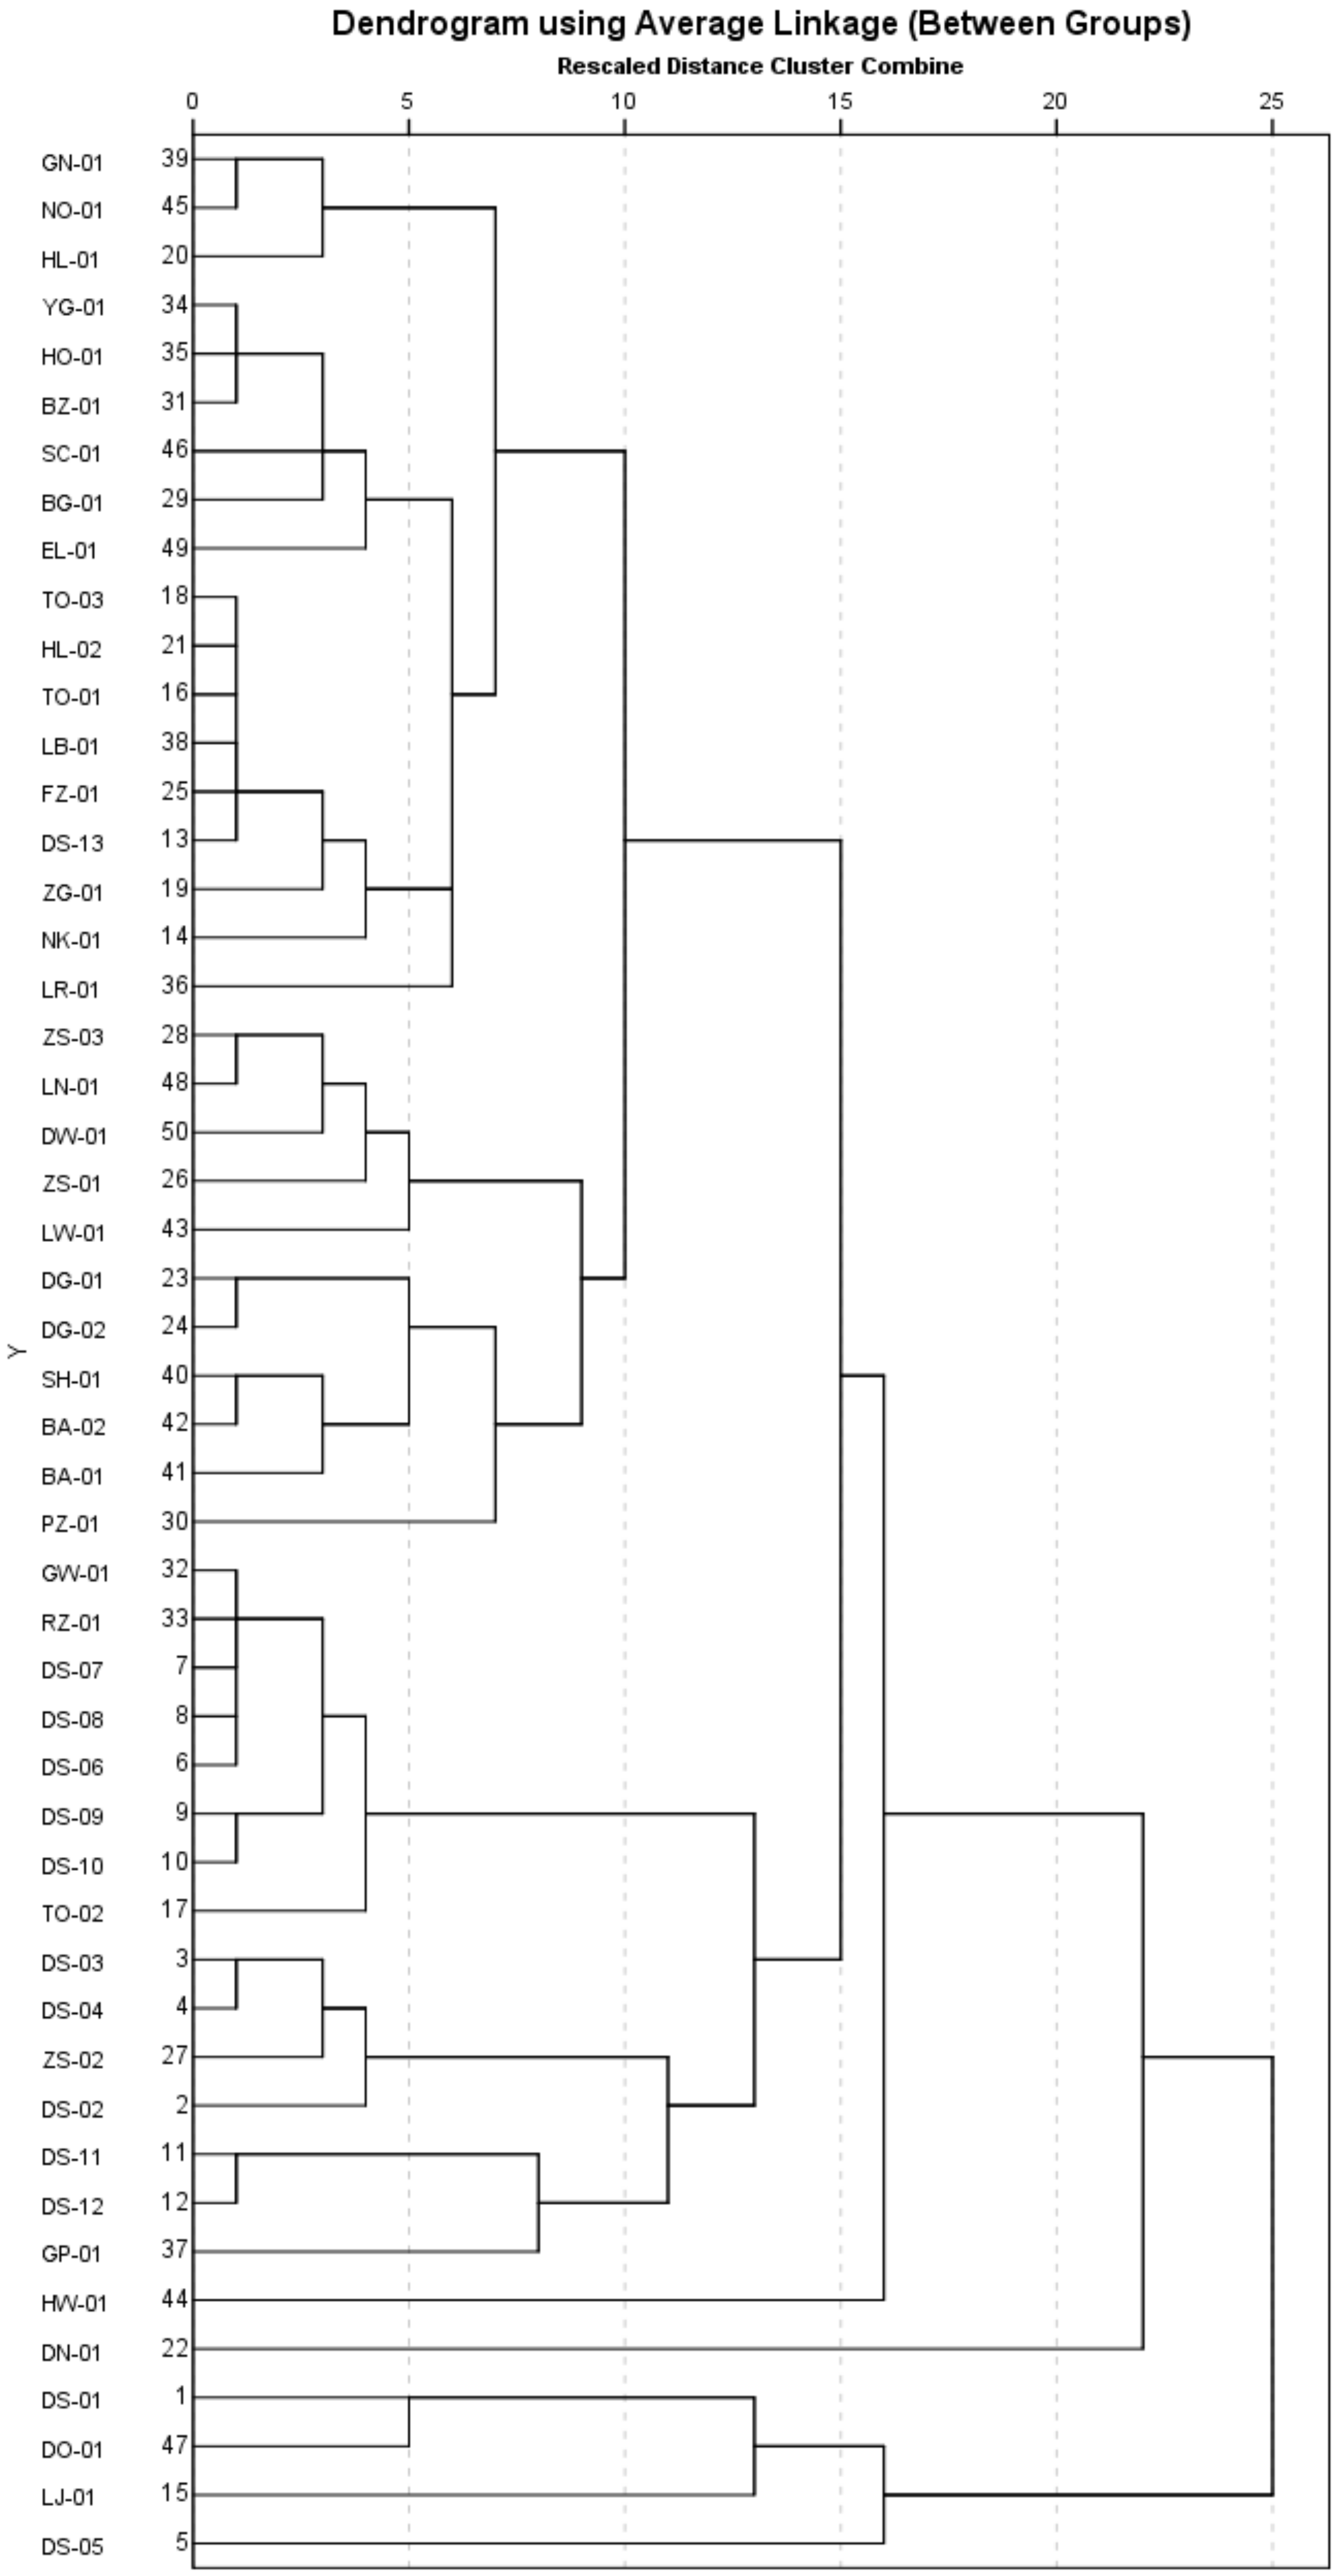
- Feature clusters
3.3. Logistic Regression Analysis of Factors for Driving Site Popularity
4. Discussion
5. Conclusions
Author Contributions
Funding
Acknowledgments
Conflicts of Interest
References
- Aeschbacher, J.; Liniger, H.; Weingartner, R. River water shortage in a highland–lowland system. Mt. Res. Dev. 2005, 25, 155–162. [Google Scholar] [CrossRef]
- Dobson, M.; Mathooko, J.M.; Ndegwa, F.K.; M’Erimba, C. Leaf litter processing rates in a Kenyan highland stream, the Njoro River. Hydrobiologia 2004, 519, 207–210. [Google Scholar] [CrossRef]
- Beyene, A.; Legesse, W.; Triest, L.; Kloos, H. Urban impact on ecological integrity of nearby rivers in developing countries: The Borkena River in highland Ethiopia. Environ. Monit. Assess. 2009, 153, 461. [Google Scholar] [CrossRef] [PubMed]
- Wałęga, A.; Grzebinoga, M.; Paluszkiewicz, B. On using the Snyder and Clark unit hydrograph for calculations of flood waves in a highland catchment (the Grabinka River example). Acta Sci. Pol. Form. Circumiectus 2011, 10, 47–56. [Google Scholar]
- Razali, A.; Ismail, S.N.S.; Awang, S.; Praveena, S.M.; Abidin, E.Z. Land use change in highland area and its impact on river water quality: A review of case studies in Malaysia. Ecol. Process. 2018, 7, 19. [Google Scholar] [CrossRef] [Green Version]
- Ferguson, C.C. Highland Park and River Oaks: The Origins of Garden Suburban Community Planning in Texas; University of Texas Press: Austin, TX, USA, 2014. [Google Scholar]
- Nautiyal, P.; Mishra, A.S.; Verma, J.; Agrawal, A. River ecosystems of the Central Highland ecoregion: Spatial distribution of benthic flora and fauna in the Plateau rivers (tributaries of the Yamuna and Ganga) in Central India. Aquat. Ecosyst. Health 2017, 20, 43–58. [Google Scholar] [CrossRef]
- Renó, V.; Novo, E.; Escada, M. Forest fragmentation in the lower Amazon floodplain: Implications for biodiversity and ecosystem service provision to riverine populations. Remote Sens. 2016, 8, 886. [Google Scholar] [CrossRef] [Green Version]
- Tsujimoto, Y.; Inusah, B.; Katsura, K.; Fuseini, A.; Dogbe, W.; Zakaria, A.I.; Sakagami, J.I. The effect of sulfur fertilization on rice yields and nitrogen use efficiency in a floodplain ecosystem of northern Ghana. Field Crops Res. 2017, 211, 155–164. [Google Scholar] [CrossRef]
- Burby, R.J. Flood insurance and floodplain management: The US experience. Glob. Environ. Chang. Part. B Environ. Hazards 2001, 3, 111–122. [Google Scholar] [CrossRef]
- Msofe, N.K.; Sheng, L.; Li, Z.; Lyimo, J. Impact of Land Use/Cover Change on Ecosystem Service Values in the Kilombero Valley Floodplain, Southeastern Tanzania. Forests 2020, 11, 109. [Google Scholar] [CrossRef] [Green Version]
- Tomscha, S.A.; Gergel, S.E.; Tomlinson, M.J. The spatial organization of ecosystem services in river-floodplains. Ecosphere 2017, 8, e01728. [Google Scholar] [CrossRef]
- Whipple, A.A.; Viers, J.H.; Dahlke, H.E. Flood regime typology for floodplain ecosystem management as applied to the unregulated Cosumnes River of California, United States. Ecohydrology 2017, 10, 1817. [Google Scholar] [CrossRef] [Green Version]
- Shih, S.S. Spatial Habitat Suitability Models of Mangroves with Kandelia obovata. Forests 2020, 11, 477. [Google Scholar] [CrossRef] [Green Version]
- Cheng, B.Y.; Liu, T.C.; Shyu, G.S.; Chang, T.K.; Fang, W.T. Analysis of trends in water quality: Constructed wetlands in metropolitan Taipei. Water Sci. Technol. 2011, 64, 2143–2150. [Google Scholar] [CrossRef]
- Lee, T.H. Influence analysis of community resident support for sustainable tourism development. Tour. Manag. 2013, 34, 37–46. [Google Scholar] [CrossRef]
- Lin, H.H.; Lee, S.S.; Perng, Y.S.; Yu, S.T. Investigation about the Impact of Tourism Development on a Water Conservation Area in Taiwan. Sustainability 2018, 10, 2328. [Google Scholar] [CrossRef] [Green Version]
- Lee, T.M.; Yeh, H.C. Applying remote sensing techniques to monitor shifting wetland vegetation: A case study of Danshui River estuary mangrove communities, Taiwan. Ecol. Eng. 2009, 35, 487–496. [Google Scholar] [CrossRef]
- Zhu, T.; Lund, J.R.; Jenkins, M.W.; Marques, G.F.; Ritzema, R.S. Climate change, urbanization, and optimal long-term floodplain protection. Water Resour. Res. 2007, 43, W06421. [Google Scholar] [CrossRef] [Green Version]
- Moradkhani, H.; Baird, R.G.; Wherry, S.A. Assessment of climate change impact on floodplain and hydrologic ecotones. J. Hydrol. 2010, 395, 264–278. [Google Scholar] [CrossRef]
- Otero, I.; Ezquerra, A.; Navarra, M.; Sendra, P. Model for determining the load or carrying capacity of rivers and riverbanks for recreational use. Estud. Geogr. 2015, 76, 633–670. [Google Scholar] [CrossRef] [Green Version]
- Agita, S. The river basin approach in tourism planning. In Proceedings of the 45th Congress of the European Regional Science Association: Land Use and Water Management in a Sustainable Network Society, Amsterdam, The Netherlands, 23–27 August 2005. [Google Scholar]
- Hidayati, R.; Sudaryono, D.W.; Prayitno, B. Tourism development of historical riverbanks in Jatinom Village. Procedia-Soc. Behav. Sci. 2016, 227, 650–655. [Google Scholar] [CrossRef] [Green Version]
- Savage, V.R.; Huang, S.; Chang, T.C. The Singapore River thematic zone: Sustainable tourism in an urban context. Geogr. J. 2004, 170, 212–225. [Google Scholar] [CrossRef]
- Brandolini, P.; Faccini, F.; Paliaga, G.; Piana, P. Urban geomorphology in coastal environment: Man-made morphological changes in a seaside tourist resort (Rapallo, Eastern Liguria, Italy). Quaest. Geogr. 2017, 36, 97–110. [Google Scholar] [CrossRef] [Green Version]
- Gaughan, A.E.; Binford, M.W.; Southworth, J. Tourism, forest conversion, and land transformations in the Angkor basin, Cambodia. Appl. Geogr. 2009, 29, 212–223. [Google Scholar] [CrossRef]
- Junk, W.J.; Bayley, P.B.; Sparks, R.E. The flood pulse concept in river-floodplain systems. Can. Spec. Publ. Fish. Aquat. Sci. 1989, 106, 110–127. [Google Scholar]
- Navrátil, J.; Pícha, K.; Rajchard, J.; Navrátilová, J. Impact of visit on visitors’ perceptions of the environments of nature-based tourism sites. Turiz. Međunarodni Znan. Stručni Časopis 2011, 59, 7–23. [Google Scholar]
- Nedović-Budić, Z.; Kan, R.G.; Johnston, D.M.; Sparks, R.E.; White, D.C. Community Viz-based prototype model for assessing development impacts in a naturalized floodplain—Emiquon Viz. J. Urban Plan. Dev. 2006, 132, 201–210. [Google Scholar] [CrossRef]
- Prideaux, B.; Timothy, D.J.; Cooper, M. Introducing River Tourism: Physical, Ecological and Human Aspects. In River Tourism; Prideaux, B., Cooper, M., Eds.; CAB Publishing: Wallingford, UK, 2009; pp. 1–22. [Google Scholar]
- Schramm, H.L., Jr.; Eggleton, M.A. Applicability of the flood-pulse concept in a temperate floodplain river ecosystem: Thermal and temporal components. River Res. Appl. 2006, 22, 543–553. [Google Scholar] [CrossRef]
- Linstone, H.A.; Turoff, M. The Delphi Method-Techniques and Applications; Addison-Wesley, Inc.: Boston, MA, USA, 2002. [Google Scholar]
- Bross, I.D. How to use ridit analysis. Biometrics 1958, 14, 18–38. [Google Scholar] [CrossRef]
- Shyu, G.S.; Lin, S.J.; Fang, W.T.; Cheng, B.Y. How to Screen Suitable Service Improve Community Health Care Services by University Students in Taiwan. Int. J. Environ. Res. Public Health 2020, 17, 5402. [Google Scholar] [CrossRef]
- Bommier, E.; Chapat, L.; Guiot, A.L.; Hilaire, F.; Cariou, C.; Poulet, H.; De Luca, K. Multivariate analysis of the immune response to different rabies vaccines. Vet. Immunol. Immunopathol. 2020, 220, 109986. [Google Scholar] [CrossRef] [PubMed]
- Segar, M.W.; Patel, K.V.; Ayers, C.; Basit, M.; Tang, W.W.; Willett, D.; Pandey, A. Phenomapping of patients with heart failure with preserved ejection fraction using machine learning-based unsupervised cluster analysis. Eur. J. Heart Fail. 2020, 22, 148–158. [Google Scholar] [CrossRef] [PubMed]
- Kuha, J.; Mills, C. On group comparisons with logistic regression models. Sociol. Methods Res. 2020, 49, 498–525. [Google Scholar] [CrossRef]
- Cheng, B.Y.; Shyu, G.S.; Wu, S.C.; Lin, H.H.; Hsu, C.H.; LePage, B.A.; Fang, W.T. Fragmented riverine habitats in taiwan have spatio-temporal consequences, re-distributing Caprimulgus affinis into urban areas leading to a human–wildlife conflict. Sustainability 2019, 11, 1778. [Google Scholar] [CrossRef] [Green Version]
- Smith, C.; Clark, A.F.; Wilk, P.; Tucker, P.; Gilliland, J.A. Assessing the effectiveness of a naturally occurring population-level physical activity intervention for children. Public Health 2020, 178, 62–71. [Google Scholar] [CrossRef] [PubMed]
- Lin, C.-J.; Chang, H.-M.; Hung, C.-J. The impact of low fertility in East Asia: A case study of low fertility crisis management in Japan. Asian J. Educ. Soc. Stud. 2020, 6, 11–18. [Google Scholar] [CrossRef]
- Den Hoed, W. Where everyday mobility meets tourism: An age-friendly perspective on cycling in the Netherlands and the UK. J. Sustain. Tour. 2020, 28, 185–203. [Google Scholar] [CrossRef] [Green Version]
- Nakata, M.; Momsen, J.D. Gender and tourism: Gender, age and mountain tourism in Japan. Geogr. Malays. J. Soc. Space 2017, 6, 63–71. [Google Scholar]
- Ting, T.-H.; Lin, T.-N.; Shen, S.-H.; Chang, Y.-W. Guidelines for 5G end to end architecture and security issues. arXiv 2019, arXiv:preprint/1912.10318. [Google Scholar]
- Li, Y.; Hu, C.; Huang, C.; Duan, L. The concept of smart tourism in the context of tourism information services. Tour. Manag. 2017, 58, 293–300. [Google Scholar] [CrossRef]
- Yoo, C.W.; Goo, J.; Huang, C.D.; Nam, K.; Woo, M. Improving travel decision support satisfaction with smart tourism technologies: A framework of tourist elaboration likelihood and self-efficacy. Technol. Forecast. Soc. Chang. 2017, 123, 330–341. [Google Scholar] [CrossRef]
- Fang, W.-T. Tourism in Emerging Economies: The Way We Green, Sustainable, and Healthy; Spring Nature: Singapore, 2020. [Google Scholar]

| No. | River Names | Main River Length km (Catchment Area km2) | Average Annual Rainfall in the Basin (mm) | Water Resource Utilization | Points of the River Basins |
|---|---|---|---|---|---|
| 1 | Lanyang River | 73 (978) | 3256 | Public water supply and Agricultural water | Downstream |
| 2 | Tamsui River | 158.7 (2726) | 2966 | Public water supply and District drainage | Midstream |
| 3 | Touqian River | 60.03 (565.94) | 2239 | Public water supply and Agricultural water | Downstream |
| 4 | Zhonggang River | 54.14 (445.58) | 2391 | Agricultural water | Downstream |
| 5 | Houlong River | 58.3 (537) | 1988 | Public water supply and Agricultural water | Downstream |
| 6 | Da’an River | 95.76 (758.47) | 2354 | Public water supply and Industrial water | Midstream |
| 7 | Dajia River | 124.2 (1235.73) | 2372 | Public water supply and Industrial water | Midstream |
| 8 | Hualien River | 57.28 (1507.09) | 2550 | Public water supply and Agricultural water | Downstream |
| 9 | Erren River | 61.2 (339.2) | 2730 | Public water supply and Agricultural water | Downstream |
| 10 | Beinan River | 84.35 (1603.21) | 3062 | Public water supply and Agricultural water | Downstream |
| 11 | Bazhang River | 80.86 (474.74) | 2432 | Public water supply and Agricultural water | Midstream |
| 12 | Puzih River | 75.87 (426.60) | 2406 | Public water supply and Agricultural water | Midstream |
| 13 | Jishui River | 65.00 (379.00) | 2604 | Public water supply and Agricultural water | Downstream |
| 14 | Nankang River | 44.01 (214.6) | 2219 | Agricultural water and District drainage | Midstream |
| 15 | Laojie River | 36.70 (81.59) | 2232 | Agricultural water and District drainage | Midstream |
| 16 | Fazi River | 21.25 (132.6) | 2392 | Agricultural water and District drainage | Midstream |
| 17 | Zhuoshui River | 186.6 (3156.9) | 2453 | Agricultural water and Industrial water | Midstream |
| 18 | Beigang River | 82.0 (645.21) | 2401 | Public water supply and Agricultural water | Midstream |
| 19 | Agongdian River | 38.0 (137.07) | 3018 | Public water supply and Agricultural water | Downstream |
| 20 | Houjin River | 13.0 (73.45) | 3014 | Public water supply and Agricultural water | Downstream |
| 21 | Ai River | 12.0 (56.0) | 3006 | District drainage | Downstream |
| 22 | Gaoping River | 171.0 (3256.85) | 3046 | Public water supply and Agricultural water | Midstream |
| 23 | Linbian River | 41.30 (336.30) | 3062 | Agricultural water and District drainage | Downstream |
| 24 | Gangkou River | 32.0 (101.69) | 3054 | Agricultural water and District drainage | Downstream |
| 25 | Sihchong River | 31.91 (124.88) | 3085 | Agricultural water and District drainage | Downstream |
| 26 | Liwu River | 55 (616) | 3152 | Agricultural water and District drainage | Downstream |
| 27 | Xincheng River | 18.13 (50.46) | 3204 | Agricultural water | Downstream |
| 28 | Nan’ao River | 48.40 (311.73) | 3212 | Public water supply and Agricultural water | Downstream |
| 29 | Shuanghsi River | 26.81 (132.50) | 3224 | Public water supply and Agricultural water | Downstream |
| Working Day | Investigation Area Code | Time Period | Person Times | Working Day | Investigation Area Code | Time Period | Person Times |
|---|---|---|---|---|---|---|---|
| Day 1 | DS-06 | A | 16 | Day 15 | ZS-01 | A | 52 |
| DS-07 | B | 16 | ZS-02 | B | 52 | ||
| DS-08 | C | 16 | ZS-03 | C | 51 | ||
| Day 2 | DS-10 | A | 11 | Day 16 | BG-01 | A | 12 |
| DS-11 | B | 11 | PZ-01 | B | 12 | ||
| DS-12 | C | 11 | BZ-01 | C | 12 | ||
| Day 3 | DS-01 | B | 8 | Day 17 | GW-01 | D | 8 |
| DS-02 | C | 8 | Day 18 | RZ-01 | D | 9 | |
| Day 4 | DS-03 | D | 6 | Day 19 | YG-01 | A | 12 |
| Day 5 | DS-04 | B | 10 | HO-01 | B | 12 | |
| Day 6 | DS-05 | B | 11 | LR-01 | C | 12 | |
| Day 7 | DS-09 | B | 11 | Day 20 | GP-01 | B | 47 |
| Day 8 | DS-13 | B | 8 | Day 21 | LB-01 | B | 7 |
| LJ-01 | C | 8 | Day 22 | GN-01 | B | 6 | |
| Day 9 | NK-01 | D | 9 | SH-01 | C | 6 | |
| Day 10 | TO-01 | A | 10 | Day 23 | BA-01 | B | 7 |
| TO-02 | B | 10 | BA-02 | C | 7 | ||
| TO-03 | C | 10 | Day 24 | HW-01 | B | 45 | |
| Day 11 | ZG-01 | B | 8 | Day 25 | LW-01 | B | 8 |
| HL-02 | C | 8 | Day 26 | NO-01 | B | 9 | |
| Day 12 | HL-01 | D | 5 | Day 27 | SC-01 | B | 21 |
| Day 13 | DN-01 | A | 9 | DO-01 | C | 21 | |
| DG-01 | B | 9 | Day 28 | LN-01 | B | 25 | |
| DG-02 | C | 9 | EL-01 | C | 25 | ||
| Day 14 | FZ-01 | B | 8 | Day 29 | DW-01 | B | 10 |
| Index | Variable | Description |
|---|---|---|
| CW1 | Aquatic zones | (5) Has aquatic zones and relevant tools; (3) has plans to develop aquatic zones; (1) does not have aquatic zones |
| CW2 | Bike paths | (5) Has exclusive bike paths or shared bike/pedestrian paths; (3) has bike paths and bike lanes on roadways; (1) does not have bike paths |
| CW3 | Service center | (5) Has a service center with clusters of shops or vendors; (3) has a service center; (1) does not have a service center |
| CW4 | Entrance image | (5) Has an entrance image and the image is unique; (3) has an entrance image and the image is mediocre; (1) does not have an entrance image |
| CW5 | Information boards | (5) Has information boards with educational information; (3) has information boards with general information; (1) does not have information boards |
| CW6 | Cleaning and maintenance conditions | (5) Receives cleaning and maintenance and has high cleanliness; (3) receives cleaning and maintenance regularly and has standard cleanliness; (1) has low cleanliness |
| CW7 | Parking lots | (4) Has multiple parking lots; (3) has a parking lot; (2) does not have a parking lot, but it is easy to park nearby; (1) does not have a parking lot and parking is difficult nearby |
| CW8 | Exercise facilities | (5) Has exercise facilities and all of them are usable; (3) has exercise facilities, but not all of them all usable; (1) does not have exercise facilities |
| CW9 | Overall design plan | (5) Has a distinctive design plan; (3) has a design plan, but the design is not distinctive; (1) does not have a design plan |
| CW10 | Mass transportation accessibility | (5) Is accessible via two or more modes of mass transportation; (3) is accessible via one mode of mass transportation; (1) inaccessible through mass transportation |
| CW11 | Number of hourly visitors | Recorded by the 10s of persons. If the number of hourly visitors exceeds 100, record as “>100” |
| Code | Sum_Ridit | Visits per Hour | Code | Sum_Ridit | Visits per Hour |
|---|---|---|---|---|---|
| DS-01 | 8.8 | >100 | ZS-01 | 6.2 | 30 |
| DS-02 | 6.2 | 50 | ZS-02 | 5.4 | 50 |
| DS-03 | 5.8 | 50 | ZS-03 | 5.4 | 30 |
| DS-04 | 5.8 | 50 | BG-01 | 5.2 | 30 |
| DS-05 | 8 | >100 | PZ-01 | 6.4 | 50 |
| DS-06 | 6 | 20 | BZ-01 | 5.6 | 30 |
| DS-07 | 6 | 20 | GW-01 | 5.8 | 20 |
| DS-08 | 6 | 20 | RZ-01 | 5.8 | 20 |
| DS-09 | 6.6 | 20 | YG-01 | 5.6 | 30 |
| DS-10 | 6.4 | 20 | HO-01 | 5.6 | 30 |
| DS-11 | 7.6 | >100 | LR-01 | 5.8 | 50 |
| DS-12 | 7.6 | >100 | GP-01 | 7.4 | 50 |
| DS-13 | 5.4 | 20 | LB-01 | 5.4 | 20 |
| NK-01 | 5 | 20 | GN-01 | 4.6 | 20 |
| LJ-01 | 7 | 50 | SH-01 | 6 | 30 |
| TO-01 | 5.6 | 20 | BA-01 | 6.4 | 30 |
| TO-02 | 6 | 20 | BA-02 | 6 | 30 |
| TO-03 | 5.6 | 20 | LW-01 | 6.4 | 50 |
| ZG-01 | 5.2 | 20 | HW-01 | 5.2 | 40 |
| HL-01 | 4.4 | 20 | NO-01 | 4.6 | 20 |
| HL-02 | 5.6 | 50 | SC-01 | 6 | 20 |
| DN-01 | 2.8 | 20 | DO-01 | 8.8 | >100 |
| DG-01 | 6.2 | 50 | LN-01 | 5.6 | 30 |
| DG-02 | 6.2 | 50 | EL-01 | 6.2 | 30 |
| FZ-01 | 5.8 | 50 | DW-01 | 5.2 | 30 |
| CW1 | CW2 | CW3 | CW4 | CW5 | CW6 | CW7 | CW8 | CW9 | CW10 | |
|---|---|---|---|---|---|---|---|---|---|---|
| CW1 | 1 | 0.402 ** | 0.016 | −0.058 | 0.086 | 0.049 | −0.077 | 0.464 ** | 0.340 * | 0.533 ** |
| CW 2 | 1 | −0.200 | −0.209 | 0.237 | −0.259 | −0.044 | 0.459 ** | 0.159 | 0.496 ** | |
| CW 3 | 1 | 0.374 ** | 0.020 | 0.550 ** | 0.372 ** | −0.265 | 0.656 ** | 0.060 | ||
| CW 4 | 1 | 0.342 * | 0.175 | 0.243 | −0.071 | 0.360 * | 0.116 | |||
| CW 5 | 1 | −0.294 * | −0.428 ** | −0.047 | 0.170 | 0.001 | ||||
| CW 6 | 1 | 0.569 ** | −0.117 | 0.514 ** | 0.207 | |||||
| CW 7 | 1 | 0.018 | 0.379 ** | 0.217 | ||||||
| CW 8 | 1 | 0.021 | 0.457 ** | |||||||
| CW 9 | 1 | 0.449 ** | ||||||||
| CW 10 | 1 |
| Component | 1 | 2 | 3 | 4 | 5 | 6 | 7 | 8 | 9 | 10 | |
|---|---|---|---|---|---|---|---|---|---|---|---|
| Initial Eigenvalues | Total | 2.90 | 2.53 | 1.58 | 0.82 | 0.66 | 0.43 | 0.37 | 0.32 | 0.21 | 0.16 |
| Variance (%) | 29.00 | 25.32 | 15.84 | 8.20 | 6.64 | 4.35 | 3.66 | 3.20 | 2.14 | 1.65 | |
| Cumulative (%) | 29.00 | 54.32 | 70.17 | 78.37 | 85.01 | 89.35 | 93.01 | 96.21 | 98.35 | 100.00 | |
| Extraction Sums of Squared Loadings | Total | 2.90 | 2.53 | 1.58 | |||||||
| Variance (%) | 29.00 | 25.32 | 15.84 | ||||||||
| Cumulative (%) | 29.00 | 54.32 | 70.17 | ||||||||
| Rotation Sums of Squared Loadings | Total | 2.55 | 2.33 | 2.13 | |||||||
| Variance (%) | 25.52 | 23.32 | 21.32 | ||||||||
| Cumulative (%) | 25.52 | 48.84 | 70.17 |
| Component a | Rotation Component b | |||||
|---|---|---|---|---|---|---|
| 1 | 2 | 3 | 1 | 2 | 3 | |
| Aquatic zones | 0.292 | 0.720 c | −0.003 | 0.770 | 0.105 | −0.018 |
| Bike paths | 0.018 | 0.806 | 0.031 | 0.768 | −0.090 | −0.232 |
| Service center | 0.749 | −0.339 | 0.225 | −0.128 | 0.754 | 0.375 |
| Entrance image | 0.469 | −0.187 | 0.561 | −0.102 | 0.742 | −0.088 |
| Information boards | −0.086 | 0.226 | 0.902 | 0.091 | 0.490 | −0.790 |
| Cleaning and maintenance conditions | 0.763 | −0.296 | −0.278 | −0.028 | 0.430 | 0.749 |
| Parking lots | 0.671 | −0.206 | −0.438 | 0.048 | 0.244 | 0.789 |
| Exercise facilities | 0.047 | 0.744 | −0.248 | 0.748 | −0.241 | 0.012 |
| Overall design plan | 0.855 | 0.138 | 0.253 | 0.353 | 0.778 | 0.288 |
| Mass transportation accessibility | 0.511 | 0.677 | −0.101 | 0.804 | 0.210 | 0.200 |
| Logit Thresholds of H0 | |||||||||
|---|---|---|---|---|---|---|---|---|---|
| Variables | CW11 > 100 | Sig. | Δ odds | CW11 > 50 | Sig. | Δ odds | CW11 > 20 | Sig. | Δ odds |
| F1 | 2.083 | 0.019 * | 8.03 | 4.631 | 0.010 * | 102.62 | - | - | - |
| F2 | - | - | - | 2.540 | 0.017 * | 12.68 | 2.920 | 0.009 ** | 18.54 |
| F3 | - | - | - | 3.430 | 0.004 ** | 30.88 | 4.058 | 0.006 ** | 57.86 |
| Constant | −3.986 | 0.002 ** | - | −0.890 | 0.091 | - | 1.529 | 0.021 * | - |
© 2020 by the authors. Licensee MDPI, Basel, Switzerland. This article is an open access article distributed under the terms and conditions of the Creative Commons Attribution (CC BY) license (http://creativecommons.org/licenses/by/4.0/).
Share and Cite
Shyu, G.-S.; Fang, W.-T.; Cheng, B.-Y. Recreation and Tourism Service Systems Featuring High Riverbanks in Taiwan. Water 2020, 12, 2479. https://doi.org/10.3390/w12092479
Shyu G-S, Fang W-T, Cheng B-Y. Recreation and Tourism Service Systems Featuring High Riverbanks in Taiwan. Water. 2020; 12(9):2479. https://doi.org/10.3390/w12092479
Chicago/Turabian StyleShyu, Guey-Shin, Wei-Ta Fang, and Bai-You Cheng. 2020. "Recreation and Tourism Service Systems Featuring High Riverbanks in Taiwan" Water 12, no. 9: 2479. https://doi.org/10.3390/w12092479
APA StyleShyu, G.-S., Fang, W.-T., & Cheng, B.-Y. (2020). Recreation and Tourism Service Systems Featuring High Riverbanks in Taiwan. Water, 12(9), 2479. https://doi.org/10.3390/w12092479