Article

Optimization-Based Water-Salt Dynamic Threshold Analysis of Cotton Root Zone in Arid Areas

1
Center for Agricultural Water Research in China, China Agricultural University, Beijing 100083, China
2
State Key Laboratory of Desert and Oasis Ecology, Xinjiang Institute of Ecology and Geography, Chinese Academic of Science, Urumqi 830011, China
3
Akesu National Station of Observation and Research for Oasis Agro-ecosystem, Akesu 843017, China
*
Author to whom correspondence should be addressed.
Water 2020, 12(9), 2449; https://doi.org/10.3390/w12092449
Submission received: 2 August 2020 / Revised: 27 August 2020 / Accepted: 28 August 2020 / Published: 31 August 2020

Abstract

:
Threshold levels of soil moisture and salinity in the plant root zone can guide crop planting and farming practices by providing a baseline for adjusting irrigation and modifying soil salinity. This study describes a method of soil water and salinity control based on an optimized model for growing cotton in an arid area. Experiments were conducted in Akesu Irrigation District, southern Xinjiang, northwest China, to provide data for cotton yield and soil water content and salinity in the root zone at different growth stages. The sensitivity of cotton to soil water content and salinity was predicted for different growth periods using a modified Jensen model. An optimization model with 480 boundary conditions was created, with the objective of maximizing yield, to obtain the dynamically varying water and salt threshold levels in the root zone for scenarios that included three initial soil moisture content values (W0), eight irrigation quantities (M), five initial soil salt content values (S0), and four irrigation water salinity levels (K). Results showed that the flowering–boll stage is the crucial period for cotton yield, and the threshold levels of soil water content and salinity in the cotton root zone varied with the boundary conditions. The scenario chosen for the research area in this study was W0 = 0.85θfc (θfc is field capacity), S0 = 4 g kg−1, M = 400 mm, K = 0 g L−1. The predicted threshold levels of soil water for different growth stages (seedling, bud, flowering–boll, and boll-opening) were respectively 0.75–0.85θfc, 0.65–0.75θfc, 0.56–0.65θfc, and 0.45–0.56θfc. Corresponding threshold levels of salt were 4–4.16, 4.16–4.39, 4.39–4.64, and 4.64–4.97 g kg−1 when no action was taken to remove salt from the root zone. This study provides an innovation method for the determination of dynamically varying soil water content and salt thresholds.

1. Introduction

Soil salinization and drought are two key factors restricting agricultural development in most arid areas of the world [1,2]. Salinization reduces the availability of soil water, causes soil compaction and decreases the number of microorganisms, which leads to land degradation and agricultural productivity is threatened finally [3,4]. Over 100 countries and 23% cultivated land in the world suffer from soil salinity [5,6,7]. It is a consensus that water is an essential factor for crop growth due to photosynthesis. Drought results in water shortage and accompanied by strong evaporation will aggravate salinity. Meanwhile, controlling soil salinity consumes valuable water resources [8], which in turn makes the drought worse. Stabilizing crop production in the areas of water shortage and soil salinity is a substantial problem in China and other arid regions of the world.
Cotton is an important fiber crop [9] and grown in arid and semi-arid areas worldwide where drought is common. China is largest raw cotton growing country of the world [10] and Xinjiang is the center of an important high quality cotton producing area in China [11] in which drought and salinization are normal [12]. However, cotton is not considered a drought-tolerant [13] but a moderately salt-tolerant crop, with a critical point of 7.7 dS m−1 [14]. In general, the effects of drought and salinization on the growth stages of cotton are different. For example, cotton is most sensitive to salt at the seedling stage. However, during this stage, water shortage promotes the development of the root system. The flowering–boll period is important for reproductive growth; water stress or salt stress during this period reduces yield, but the plant can withstand a certain amount of water and salt stress during the bud and boll-opening stages [15,16,17]. On the basis of these studies, the quantification of how crop yield is influenced by soil moisture and salinity in order to modify the soil water–salt environment is crucial to coping with the mismatch between water supply and demand, ensuring optimal irrigation of crops and the promotion of yield in arid areas.
Many crop water and soil salinity models have been proposed to quantify the crop response to water and salt. Some models characterize the individual effects of water or salt on yield. There are three typical crop-salt production functions [18]. Maas and Hoffman [14] developed a piecewise linear equation based on the assumption that there are critical and limiting values of salt tolerance over the entire crop growth period. Moreover, van Genuchten and Hoffman [19] developed sigmoid and exponential functions to describe the effects of salt to crop yield under steady state condition. Crop-water production function models describe the relationship between yield and evapotranspiration at different growth stages, such as the Jensen model [20] and these models have been widely used to determine plant sensitivity to water at different growth stages, to develop irrigation schedules, and to predict crop yield [21,22,23]. Some studies have quantified the combined effects of water and salt stress on crops. Russo [24] used a polynomial to determine crop yield taking soil moisture and salt content into account. Letey [25] built a crop-water production model in the case of saline irrigation. Shani [26] and Skaggs [27] separately calculated transpiration by adding the water factor to the exponential, sigmoid and threshold models. However, plants display differing degrees of sensitivity to water and salt during different growth stages, which many models do not take into account. This omission is a cause of error in model fitting [28]. To solve this problem, we added a salt stress factor to modify the Jensen model so that it can simultaneously consider the impact of soil water and salt on yield at different growth stages of crops.
Some researchers have attempted to adjust soil water and salinity to determine their effects on crop yield. Methods have included controlling soil water potential or soil salinity at different soil depths and determining related changes in crop yield [29,30]. Then, the crop water or salt production function is fitted, and the soil moisture content or salinity is deduced at a determined yield level and used as the recommended threshold for a desired yield [31]. There are also some integrated models, such as AquaCrop and SWAP (Soil Water Atmosphere Plant) that can reflect crop growth, the dynamic of soil water, and salt, and their relationship to facilitate research [32,33,34]. However, field experiments are time consuming and labor intensive. Integrated models need a large number of scenarios, such as different irrigation schedules, to determine crops water and salinity thresholds, even under the same initial and boundary conditions. Moreover, in most researches, salinity threshold values are treated as constant over the whole growth period, without taking account of varying sensitivity to salinity at different plant growth stages. Sometimes, controlling such values especially salinity thresholds may also be impractical in arid regions since it may require the consumption of large amounts of freshwater that is simply unavailable [30]. This is clearly not the best method to ensure crop yield based on threshold values obtained from experiments. Instead, the determination of the threshold of soil water and salinity in the root zone must balance crop yield and the field conditions including available water and soil salinity. The desired threshold values of water and salinity in the root zone are the dynamically changing levels of water and salinity at different growth stages that will support higher crop yield. They vary with different control objectives. Optimization will find the optimal combination of decision variables, thus providing a method for obtaining the dynamic threshold values to meet varying objectives. Few studies introduced crop yield with soil water and salinity in an optimization model to adjust soil water and salinity environment. We have developed a method that calculates the dynamic threshold values of soil water content and salinity in the root zone to guarantee a desired crop yield.
We used Xinjiang cotton in our experiment to illustrate how to find the dynamic threshold values of soil water content and salinity at different growth stages in order to produce maximum yield. Our goals were: (1) to quantify cotton yield in response to varying soil water content and salinity at different growth stages by fitting a modified Jensen model parameters; (2) to develop an optimization method to obtain crop root water and salinity using the modified Jensen model with determined parameters; and (3) based on the optimization model, to analyze the changes of the dynamic thresholds of soil moisture and salt in the cotton root zone and yield under different scenarios when cotton yield is optimal. This study will provide guidance for those who need to control soil water and salinity in arid areas. Figure 1 shows an overview of the study.

2. Materials and Methods

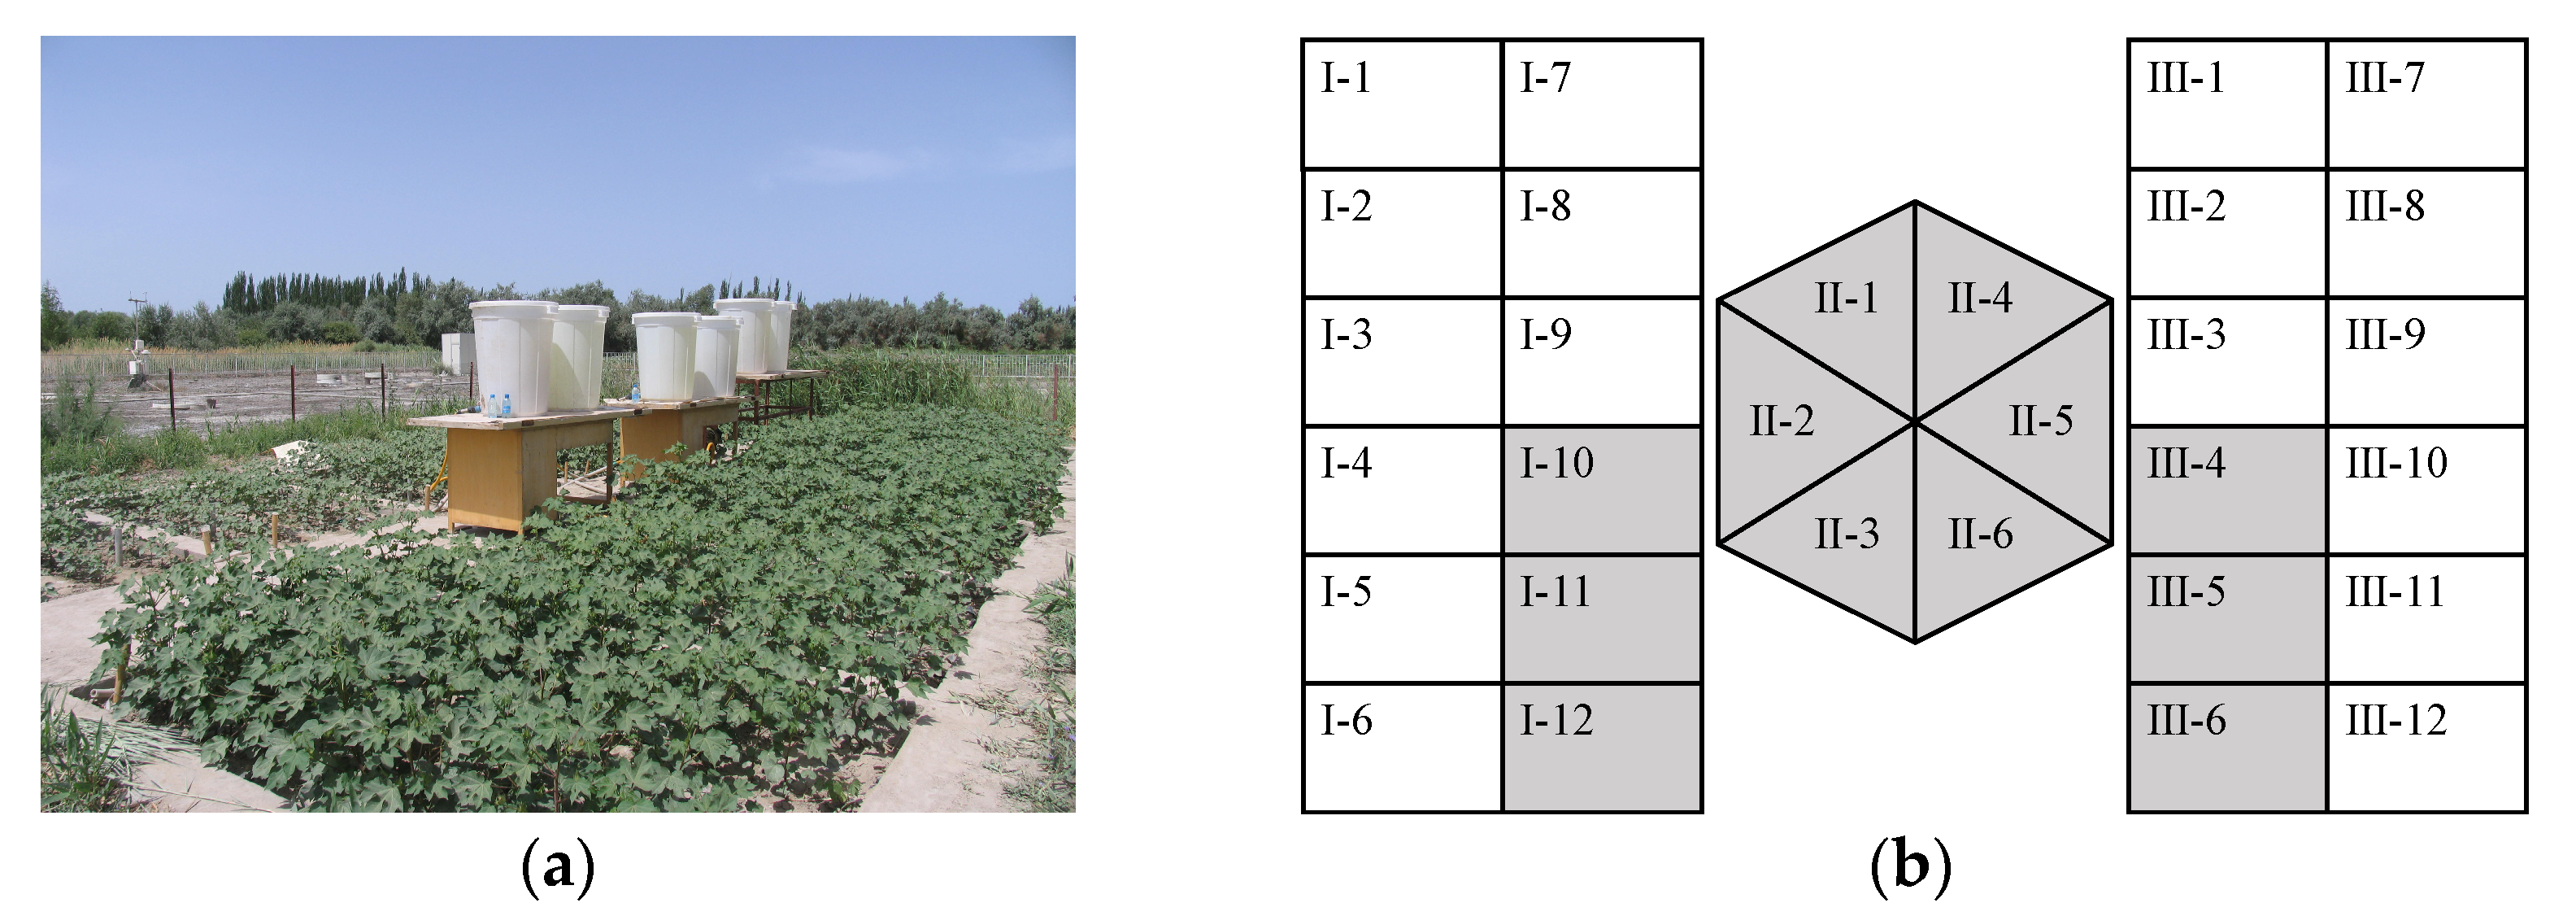
2.1. Field Experiments

2.1.1. Experiment One

Experimental Site and Design

The experiment was conducted at the Akesu National Station of Observation and Research for Oasis Agro-ecosystem (40°37′ N, 80°51′ E) in Xinjiang, northwest China from 2008 to 2010. The region has a continental desert climate, with average annual rainfall 45.7 mm, average annual evaporation 2110.5 mm, annual sunshine hours 2950 h, and annual solar radiation 6000 MJ m−2.
This experiment was carried out in non-weighing lysimeters, each with an area of 5 m2 (1.8 m × 2.78 m), and a depth of 1.7 m (Figure 2). The soil texture is silty loam, bulk soil density was 1.42 g cm−3, field capacity (θfc) was 0.35 cm3 cm−3, and wilting point (θwp) was 0.085 cm3 cm−3. The cotton used in the experiment was Gossypium hirsutum L. cv. Zhongmian 49, planted wide–narrow row arrangement (30 cm + 60 cm) with plant spacing 10 cm and planting density 20 plants m−2. Plants were irrigation with 6 (K1–K6), 5 (K1–K5), and 5 (K1–K5) levels of salinity in three years of the experiment and freshwater irrigation (K1) was used as the control treatment (Table S1). Each treatment was replicated to three groups of plants; therefore, there were respectively 18, 15, and 15 plots in each of the three years of experiment. Saline groundwater (salinity 11.80 g L−1) and surface fresh water (salinity 0.32 g L−1) were mixed in various proportions to obtain irrigation water samples with different salinity gradients. The irrigation method was drip irrigation beneath the plastic film. Freshwater was used once to irrigate all plants at the seedling stage to protect seedlings against salt stress before the experimental treatments commenced. The irrigation interval was seven days, with irrigation quantities 32.6, 34.0, and 26.0 mm each year, which was consistent with the local irrigation schedules. Freshwater was used for winter irrigation and pre-planting irrigation to leach the salt at the root zone. The irrigation schedule is shown in Table S2.

Observation and Measurements

The data observed and measured about the experiment are shown in Table S6. Meteorological data were obtained from Akesu Meteorological Observatory (40°37′ N, 80°49′ E). Daily ET0 (reference crop evapotranspiration), as calculated by the FAO-56 Penman–Monteith equation [35] and precipitation are shown in Figure S1a–c.
The entire growth period of the cotton was divided into seedling stage, bud stage, flowering–boll stage, and boll-opening stage. The dates of the cotton growth stages in the three-year experiments are shown in Table S3.
Soil moisture content (Figure S2) was measured by a neutron probe every 5 d at depths of 0–20, 20–40, 40–60, 60–80, 80–100, 100–120, and 120–140 cm; supplementary measurements were taken before and after irrigation. Soil salinity was measured once or twice at different growth stages. The saline soil samples were air-dried, and the conductivity of a leaching solution having soil-to-water ratio 1:5 (EC1:5 dS m−1) was measured by an electrical conductivity meter. Soil salt content (S g kg−1) (Figure S2) was converted by the equation (1) [36]:
S = 4.6126 × EC1:5, (R2 = 0.9604)
where, 4.6126 is the regression coefficient of EC1:5 and S.
Evapotranspiration at each growth stages was calculated by a water balance Equation (2) [37]:
ET = I + P + Qe − ΔWQDR
where: ET is evapotranspiration at each growth stage (mm); I is the irrigation amount (mm); P is precipitation (mm); Qe is capillary rise (mm); ΔW is change in soil moisture content (mm); QD is drainage (mm); and R is runoff (mm). R, Qe, and QD can be ignored because the irrigation method was drip irrigation under plastic film, and soil depth for soil moisture measurement was adequate.
Cotton yield was obtained by multiplying boll number per plant by single boll weight and planting density. Boll number per plant was taken to be the mean boll number per plant of 20 cotton plants. Single boll weight was taken to be the mean weight of 50 fully open cotton peaches from different cotton plants at the peak of the boll-opening stage.

2.1.2. Experiment Two

Experiment two provided data used to determine the relationship between cotton yield and soil moisture content and salinity. We collected data from two different field experiments that were conducted in 2018, one at the Akesu National Station of Observation and Research for Oasis Agro-ecosystem (40°37′ N, 80°51′ E) and the other at the Experimental Irrigation Station of the Xinjiang First Division Water Conservancy Bureau (40°6′ N, 81°2′ E). The two sites are so close that they have the same weather data (Figure S1d), cotton growth stage durations (Table S4), and soil texture.
The cotton was Gossypium hirsutum L. cv. Xinluzhong 46 planted in wide–narrow rows (66 cm + 10 cm) with plant spacing 10 cm and planting density 20 plants m−2.The irrigation method was drip irrigation beneath the plastic film. The groundwater depth in each experiment was > 2 m during the whole growth period, thus any groundwater effect on soil moisture and salinity in the root zone was ignored. The data collected are shown in Table S6.
In the first experiment, four irrigation treatments were administered over 12 plots (3 plots per treatment), each having an area of 119 m2 (17 m × 7 m). Irrigation quantity was determined from ET. The four treatments were two levels of deficit irrigation (I0.6 60% ET and I0.8 80% ET), full irrigation (I1.0 100% ET) and over-irrigation (120% ET). The irrigation schedule is shown in Table S5.
In the second experiment, the plants were irrigated with one of four treatments in the seedling and bud stages: full irrigation (A1: 45 mm per time) and three levels of deficit irrigation (A2: 37.5 mm, A3: 30 mm and A4: 22.5 mm per time). The plants were also irrigated with one of four treatments across the flowering–boll and boll-opening stages: full irrigation (B1: 45 mm per time) and three levels of deficit irrigation (B2: 37.5 mm, B3: 30 mm, B4: 22.5 mm per time). Thus, each plot received one A and one B treatment (denoted AiBj). There were no A2B2, A3B3, or A4B4 treatments; thus, there were 13 treatments altogether. A1B1 was the control treatment. Each treatment was replicated three times (39 plots altogether, each 35 m long and 7 m wide). The irrigation schedule is shown in Table S5.
Soil moisture content was measured gravimetrically. Evapotranspiration was calculated using Equation (2). Soil salinity was obtained by the method described in 2.1.1.2. Soil salinity was calculated from EC1:5 by (3) [38]:
S = 5.839 × EC1:5, (R2 = 0.9695)
where, 5.839 is the regression coefficient of EC1:5 and S.
Cotton yield was measured when the boll-opening rate was above 80%. Three 2.33 m × 2 m rectangles were randomly selected in each plot to calculate the seed yield.

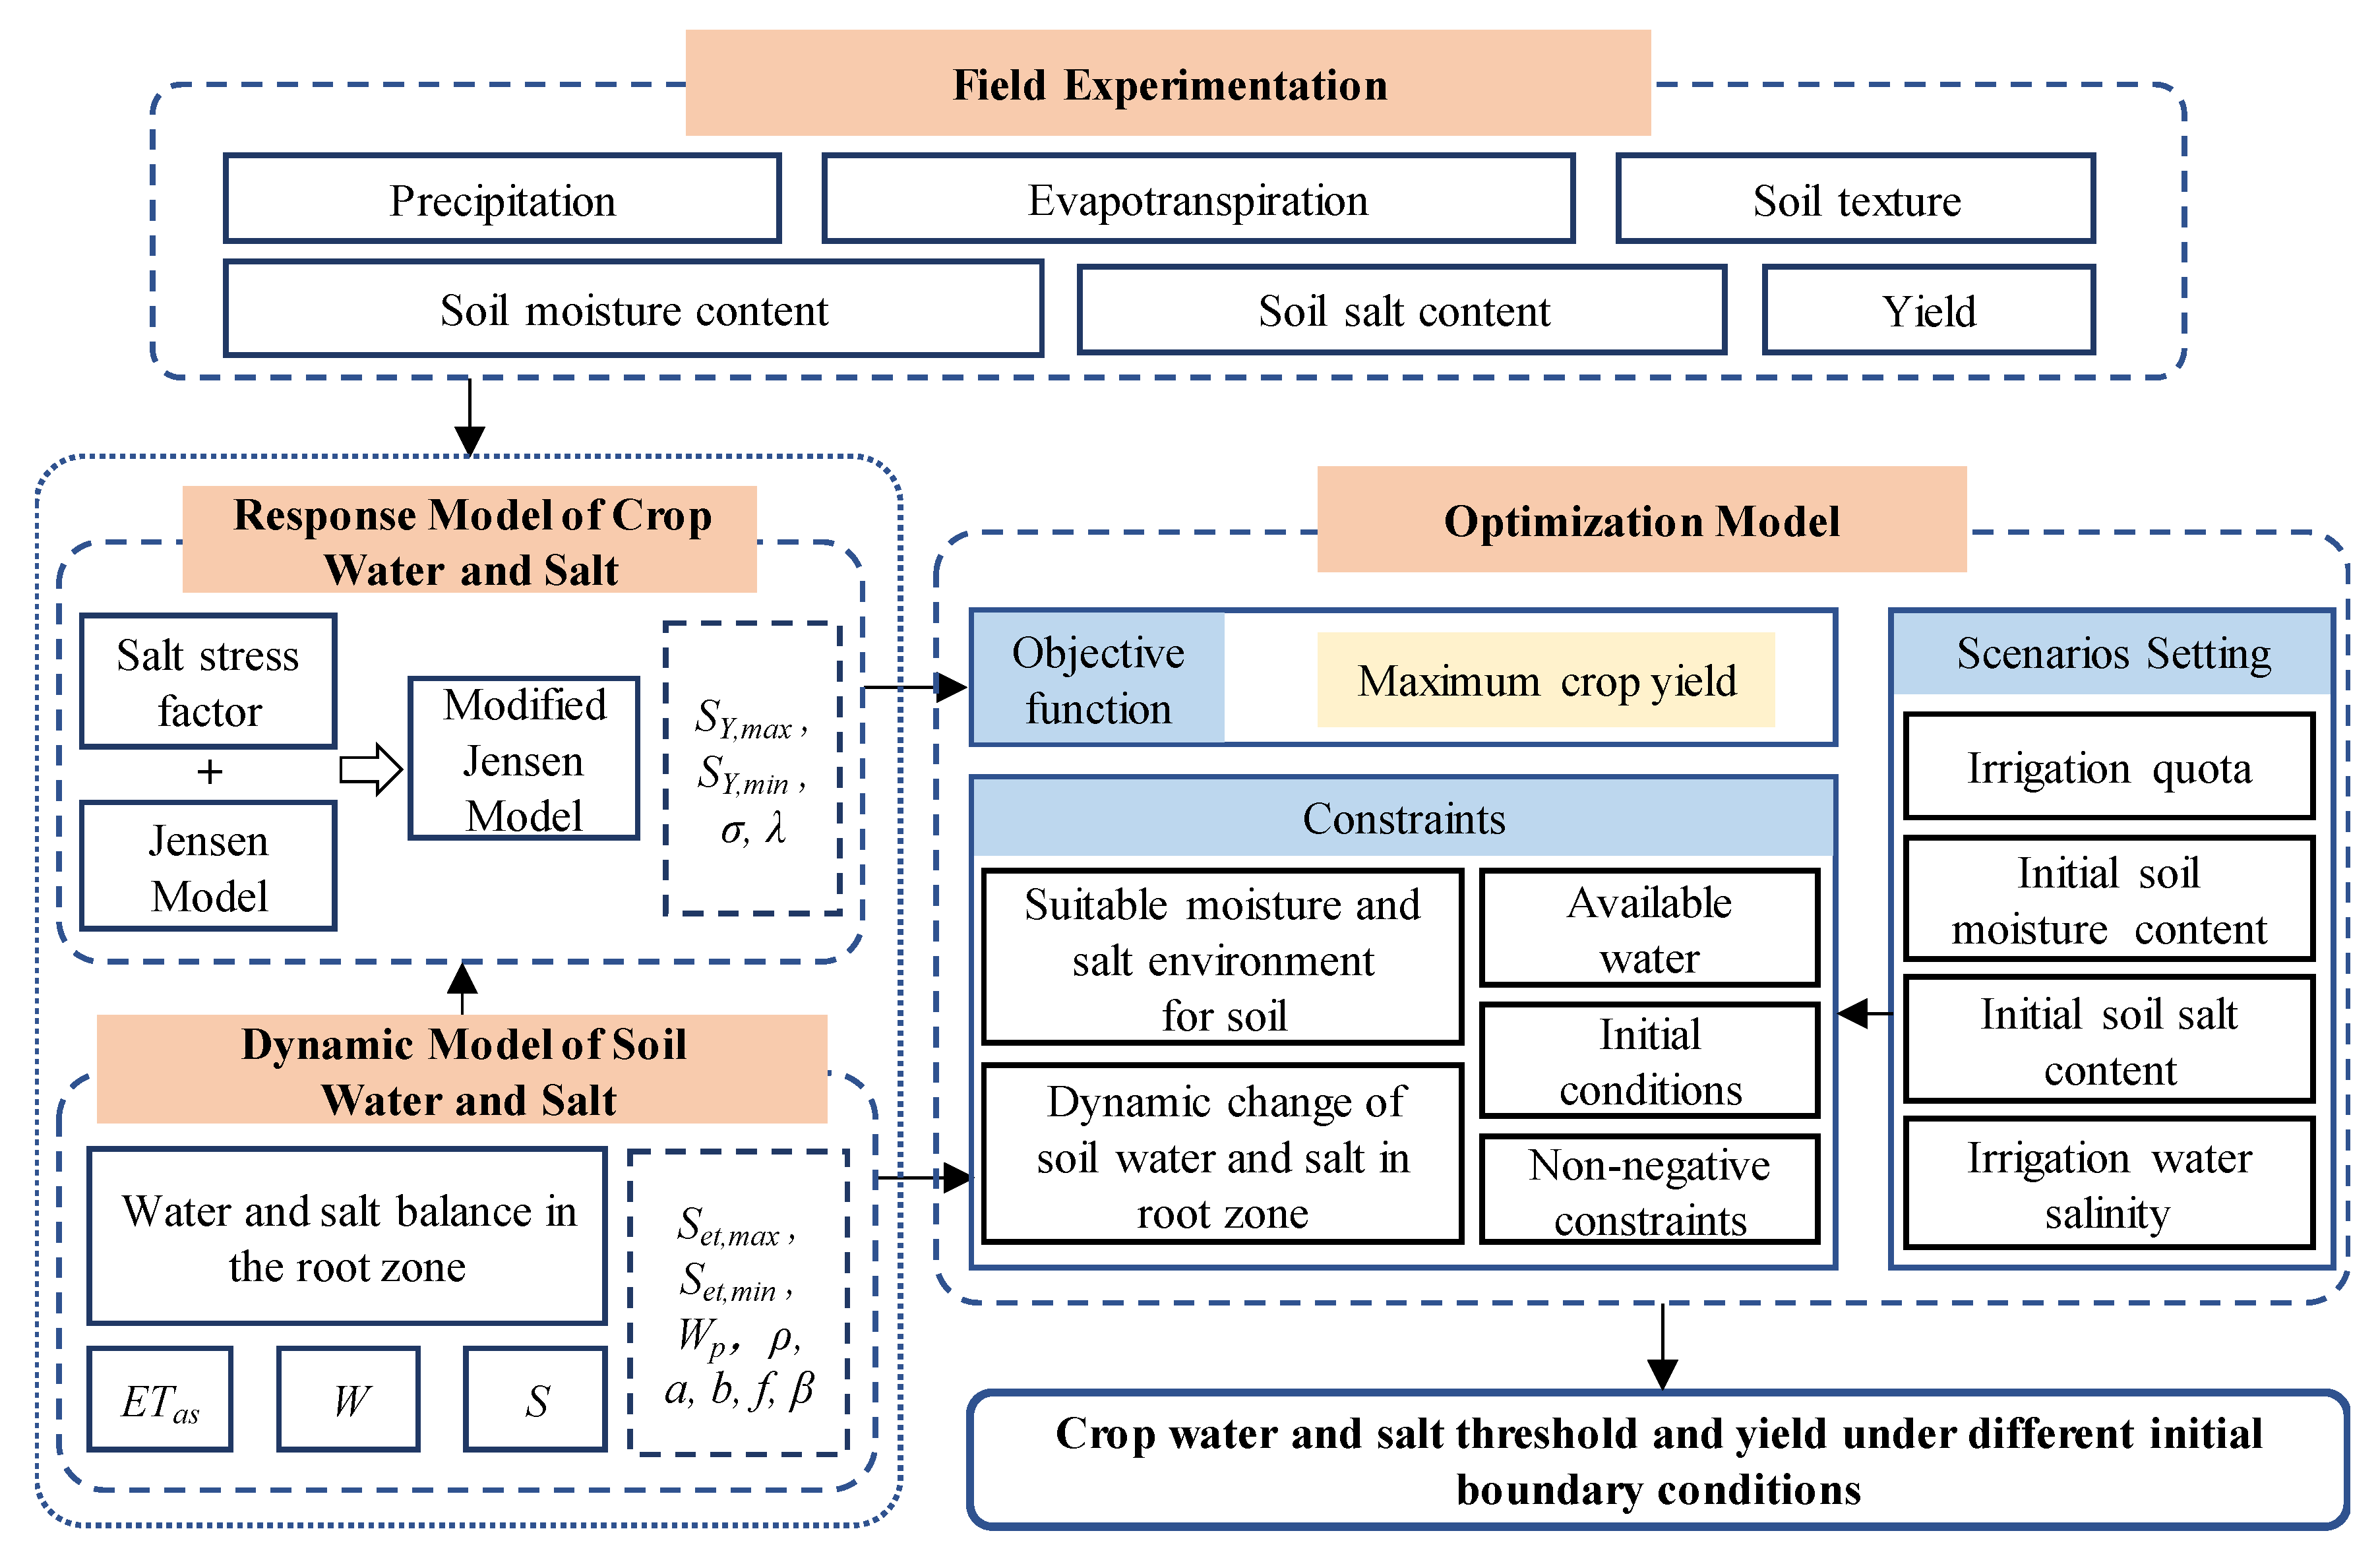
2.2. Model of Response to Crop Water and Salinity

2.2.1. Response of Yield to Water and Salt

The Jensen model [20] is widely used to calculate relative crop yield. It relates yield and evapotranspiration (ET):
Y a Y m = i = 1 n ( E T a i E T m i ) λ i
where n is the number of growth stages; i is the growth stage; Ya is actual crop yield; Ym is potential crop yield when there is sufficient water; ETai and ETmi are actual evapotranspiration and maximum evapotranspiration of growth stage i; λi is the water deficit sensitivity index of yield at growth stage i.
The Maas-Hoffman model uses a single salt stress factor for the whole growth period [14]. However, cotton plants vary in sensitivity to salinity according to growth stage; therefore, we introduced a salt stress function γY(S) with a salt stress sensitivity index of yield σ [39] which will change for different growth stages, similar to the water deficit sensitivity index of Jensen model:
γ Y ( S ) = { 1 S S   Y , min ( S Y , max S S Y , max S Y , min ) σ , S Y , min < S S Y , max 0 S > S Y , max
where σ is the salt stress sensitivity index of yield (σ represents the effect of soil salinity on yield), and SY,min and SY,max are critical and maximum soil salinity, which affect the yield at different growth stages (g kg−1). When soil salinity >SY,min, crop yield begins to be affected; when soil salinity >SY,max, the yield is 0.
The modified Jensen model is [40]:
Y a Y m = i = 1 n g i
g i = { ( E T a E T m ) i λ i S i S ,   Y i , min ( S Y , max S S Y , max S Y , min ) i σ i ( E T a E T m ) i λ i S Y i , min < S i S Y i , max   0 , S i > S Y i , max
where: gi is the response factor of yield to water and salinity at growth stage i. The rest of the parameters in the model are as described above.

2.2.2. Response of Evapotranspiration to Water and Salt

Evapotranspiration for plants subjected to water stress and salt stress is calculated by the following equation; water stress factor Ksw and salt stress factor Kss are included in the calculation [35]:
ETa = Ks ETm = Ksw Kss ETm
When the plants suffer only from salt stress, Kss can be calculated by Equation (9). When the plants only suffer from water stress, Ksw can be calculated by Equation (10).
K s s = ( S e t , max S S e t , max S e t , min ) ρ
K s w = θ i θ w p θ p i θ w p
where: S is actual soil salt content for the growth stage (g kg−1); ρ is the salt stress sensitivity index of ET, which indicates the effect of soil salinity on ET; Set,min and Set,max are critical and maximum soil salt content, which affect ET (g kg−1); and θpi is critical water content (cm3 cm−3). When soil salt content exceeds Set,min, ET is affected by the salt in soil, and when soil salt content exceeds Set,max, ET will be 0.

2.3. Optimization Model of Water and Salinity Threshold

2.3.1. Optimization Model of Soil Water and Salt Thresholds in the Root Zone

We optimized soil water and salinity thresholds to maximize relative yield. The constraints were soil water and salinity balance in the root zone, soil volumetric moisture content and salt content, irrigation quantity, boundary conditions, and nonnegative constraints. The water and salt modules are described in Section 2.3.2 and Section 2.3.3. The optimization model is as follows:
The objective function is:
O B J = max Y a Y m = max i = 1 n g i
with the following constraints:
(1)
water balance constraint:
Wi+1 = Wi + Pi + Ii − ETai + Qei − QDi − Ri,
(2)
salt balance constraint:
Sai+1 = Sai + SIi + SPi + Sei − SDi − SCi
(3)
irrigation quantity constraints:
i = 1 n I i = M
I 1 < 30
(4)
boundary condition constraints:
θ w p θ i θ f c
θ n + 1 θ w p
S i S i , max
S n + 1 S r
W 1 = W 0
S 1 = S 0
(5)
non-negative constraints
I i 0
S i 0
where: Wi and Wi+1 are soil moisture content (mm) at the beginning and end of growth stage i; ETasi, Ii, Pi, Qei, QDi, Ri, and θi are evapotranspiration (mm), irrigation (mm), precipitation (mm), capillary water (mm), drainage (mm), runoff (mm), and soil moisture content (cm3 cm−3) at growth stage i; Sai and Sai+1 are salt content of the root zone soil at the beginning and end of growth stage i (kg m−2); SIi, SPi, Sei, and SDi are salt content of irrigation water, precipitation, capillary water, and deep drainage at growth stage i (kg m−2), and SCi is plant salt absorption (kg m−2); M is the irrigation quota (mm); θwp is the wilt coefficient and θfc is the field capacity (cm3 cm−3); Si and Si,max are root soil salt content and maximum salt content (g kg−1) at the beginning of growth stage i; Sr is the maximum allowable salt content (g kg−1) at the end of the growth stage; W0 is initial water content (mm) and S0 is initial salt content (g kg−1).
A total of 480 scenarios were created from three initial soil moisture content values (W0 = θfc, 0.85θfc, 0.7θfc; θfc is field capacity), eight irrigation quantities (M = 200, 250, 300, 350, 400, 450, 500, 550 mm), five initial soil salt content values (S0 = 2, 4, 6, 8, 10 g kg−1) and four irrigation water salinity levels (K = 0, 3, 6, 9 g L−1). Freshwater irrigation (K = 0 g L−1) was used to ensure seedling emergence at the seedling stage.
Calculations were based on the situation in 2009, and the calculation depth was 50 cm, which is the mean root layer depth of cotton. The soil moisture and salt content in the calculation are the average of the 50 cm soil layer. Generally, cotton is either not irrigated or irrigated once at the seedling stage. Studies show that the irrigation quantity at the seedling stage is < 30 mm.

2.3.2. Root Zone Water Balance Module

The effects of rainfall, irrigation, evapotranspiration, supply, and drainage are considered in the water balance module:
Wi+1 = Wi + Pi + Ii − ETai + Qei − QDi − Ri
Wi = 1000 Hiθi
ETai = Kswi·Kssi·ETmi
Qei = aETai
QDi = b(Pi + Ii)
where a and b are exchange coefficients. The effects of groundwater on the water and salt dynamics are ignored in the experiment; thus the main drivers of Qei and QDi are respectively ET and (P + I). Qei and QDi are assumed to vary linearly with ET and (P + I). R is ignored because the irrigation method is drip irrigation beneath the plastic film and there is little precipitation during the entire growth period. Hi is the layer depth in the root zone (m).

2.3.3. Root Zone Salt Content Module

Salt enters the cotton root zone in various ways (irrigation, rainfall, and capillary water) and leaves it principally by drainage and absorption by plants. Salt balance for mean salt content in the cotton root zone is given by:
Sai+1 = Sai + SIi + SPi + Sei − SDi − SCi
SIi = Ii ·Ki/1000
SPi = Pi · CPi/1000,
S e i = Q e i C e i / 1000
S D i = Q D i C D i / 1000
Sai = Si∙ρb∙H
where: Ki, CPi, Cei, and CDi are respectively salt concentration of irrigation water, precipitation, capillary rise, and deep drainage in growth stage i (kg m−3); and ρb is dry bulk density (kg m−3). SPi and SCi are ignored because rainfall and plant salt absorption have little effect on soil salt in the root zone.
Salt concentration of deep drainage water is [41]:
CDi = f·Ci + (1 − f)·Cwi
Ci = Si∙ρbi
where: f is the leaching coefficient; Ci is salt concentration of the root soil at the beginning of growth stage i (kg m−3); Cwi is average salt concentration of irrigation water and precipitation (kg m−3), and is calculated by:
C w i = C I i I i + C P i P i I i + P i
Salt concentration of capillary water is proportional to salt concentration of deep drainage water [37], and is calculated by:
Cei = β∙CDi
where: β is the capillary rise coefficient.

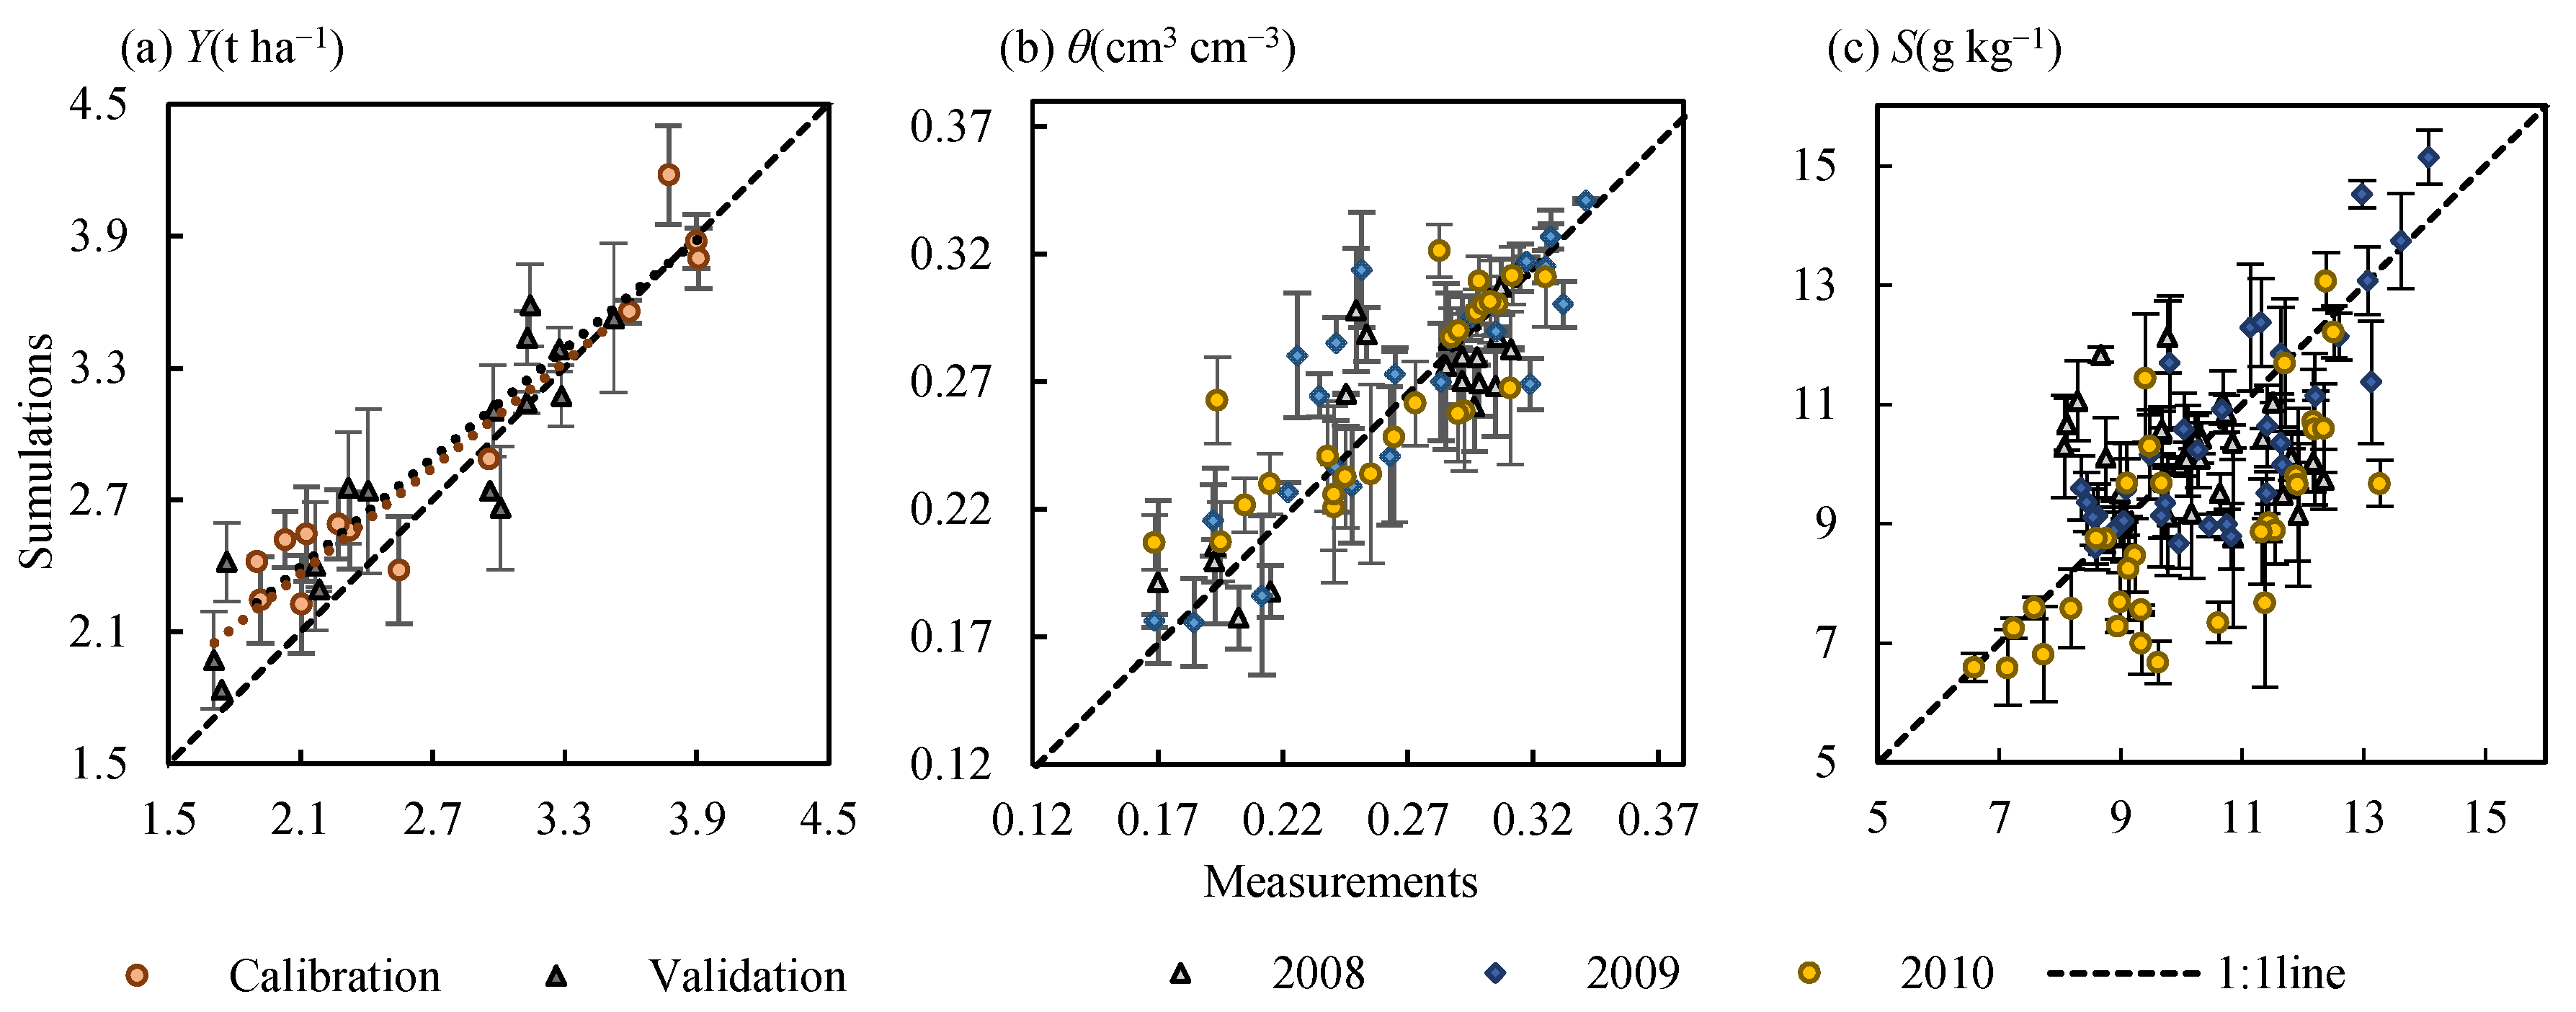
2.3.4. Model Evaluation

Data from 2008 to 2010 and 2018 were used to calibrate and validate the parameters of the yield module. The parameters of the soil water and salt modules were calibrated with the data of 2009 and validated with the data of 2008 and 2010; because there was not enough soil data in two experiments in 2018. SY,min and SY,max of the yield module was obtained experimentally and from technical reports. θp was estimated to be 0.7θfc, at the depth of the main root layer, based on local conditions and farmers’ experience.
Model accuracy was evaluated by the coefficient of determination (R2), root mean square error (RMSE), and normalized root mean square error (nRMSE):
R 2 = ( i = 1 n ( M i M ¯ ) ( S i S ¯ ) i = 1 n ( M i M ¯ ) 2 i = 1 n ( S i S ¯ ) 2 ) 2
R M S E = i = 1 n ( M i S i ) 2 n
n R M S E = 1 M ¯ i = 1 n ( M i S i ) 2 n · 100 %
where M and S are measured and simulated values, M ¯ and S ¯ are the means, and n is the number of samples.
We used Excel to calibrate and verify the parameters of yield and water-salt balance module due to their simplicity. Excel 2016 and MATLAB R2019a were utilized to generate the figures needed in this paper. Moreover, the optimization model was solved using the Linear Interactive and General Optimizer 11.0 (LINGO 11.0).

3. Results and Discussion Generate

3.1. Analysis of Model Parameters

The values of the water deficit sensitivity index (λ) and the salt stress sensitivity index (σ) to yield are given in Table 1. The greatest value of λ was recorded at the flowering–boll stage, followed in descending order by the values at the bud and boll-opening stages, and the negative value at the seedling stage. These values indicate that water deficit at the seedling stage increased yield, which is consistent with the results of some studies: slight or moderate short-term water deficit at the seedling stage promotes root growth in cotton, enabling the plants to absorb water from a deeper soil layer; it also influences plant growth and yield [42,43].
The value of σ was greatest at the flowering–boll stage, followed in descending order by the seedling, bud and boll-opening stages. The negative value at the boll-opening stage indicates that salt stress at that stage increased yield. The effect of salt on cotton growth is twofold: salt in the root zone reduces water availability (i.e., it decreases soil water potential), thus causing drought stress [15,44]; and when soil salt content reaches a certain level, salt ions are absorbed by crops and become toxic [45]. Some studies have shown that the cotton seedling stage is the stage that is most sensitive to salt [46]; other studies have shown that slight salt stress in the early growth stages of cotton promoted root growth and increased leaf thickness [47]. In this study, the root system at the seedling stage did not reach a depth of 50 cm; plants were not sensitive to water at the seedling stage. Thus, the sensitivity to salt at the seedling stage was less than that at the flowering–boll stage. This indicates that the flowering–boll stage was the critical period of cotton yield determination, and the both drought stress and salt stress had a great effect on yield [48,49].
The accuracy of relative yield prediction is shown in Table 2 and Figure 3a. The calibrated and verified values of R2 (0.827 and 0.914), RMSE (0.708 and 0.577 t ha−1), and nRMSE (24.4% and 20.4%) indicate that the accuracy of the modified Jensen model predictions was acceptable and show that the modified Jensen model produced good yield estimates for different years and different cotton varieties.
The fitting results for the water balance module (Table 1) showed that the sensitivity of evapotranspiration to salinity (ρ) in different growth stages was ranked, in descending stage order, bud, flowering-boll, boll-opening, and seedling. Evapotranspiration in the seedling stage was least sensitive to salt because there was little transpiration, and most ET was from soil evaporation. We found that the critical value of yield for salt (SY,min) was greater than the critical value for ET to salt (Set,min), since the reproductive growth indexes (i.e., number of bolls and fruit branch number) of cotton had higher salt tolerance than the vegetative growth indexes [50,51,52]. The values of R2, RMSE, and nRMSE of soil moisture content for 2008, 2009, and 2010 were in the range of 0.681–0.753, 0.036–0.049 cm3 cm−3, and 14.9–18.1%, respectively (Table 2). The salt balance module had only two parameters: f and β. The value of f is related to the soil type [41]. Due to the large porosity, water holding capacity of sandy soils is poorer compared with that of clay. In addition, sandy soils have small surface area and fewer adsorbed ions [53]. This is why f of sandy soils is usually small, while that of clay soils is the opposite. The value of β is always constant. When the time scale is large, β is 1 [37]; we used a value of 1.4 because the time scale was small and soil salt content below the root layer was high. The values of R2, RMSE, and nRMSE for 2008, 2009, and 2010 of soil salt content were 0.012, 0.657 and 0.485 (R2), 1.649, 1.690 and 1.843 g kg−1(RMSE), 16.2%, 16.0% and 18.6% (nRMSE) (Table 2). Because the gradient of irrigation water salinity is small, R2 for 2008 is small, but RMSE and nRMSE are within the acceptable range. Model prediction of soil salt content was less accurate in 2010 than 2009; model values were less than measured values (Figure 3c). The reason for this is that the 2009 experiment caused salt to accumulate in the soil below the roots, which increased capillary water salt content of in 2010 compared to 2009.

3.2. Response of Yield to Soil Water and Salinity under Different Scenarios

Available water for the entire crop growth period (W’) is the sum of initial soil moisture content (W0) and irrigation quota (M), and the total salt content of soil (S’) is the sum of initial soil salt content (S0) and salt entering the soil due to irrigation. Figure 4 shows the relationship between relative yield and W’ and S’. It can be seen that relative yield increases as W’ increases and as S’ decreases. There are small peaks in the figure, and the slope and height of the small peaks increase as S’ increases; that is, relative yield increasingly varies. When S’ decreases to a certain value, only W’ exerts an influence on relative yield because relative yield is not affected by soil salinity when S’ < Smin. Relative yield varied with respect to both the horizontal and vertical axes, and the amplitude changed with respect to both W’ and S’, which indicates that differences in both W0 and M in W’ [54,55] and differences in S0 and K in S’ [56] affect relative yield.

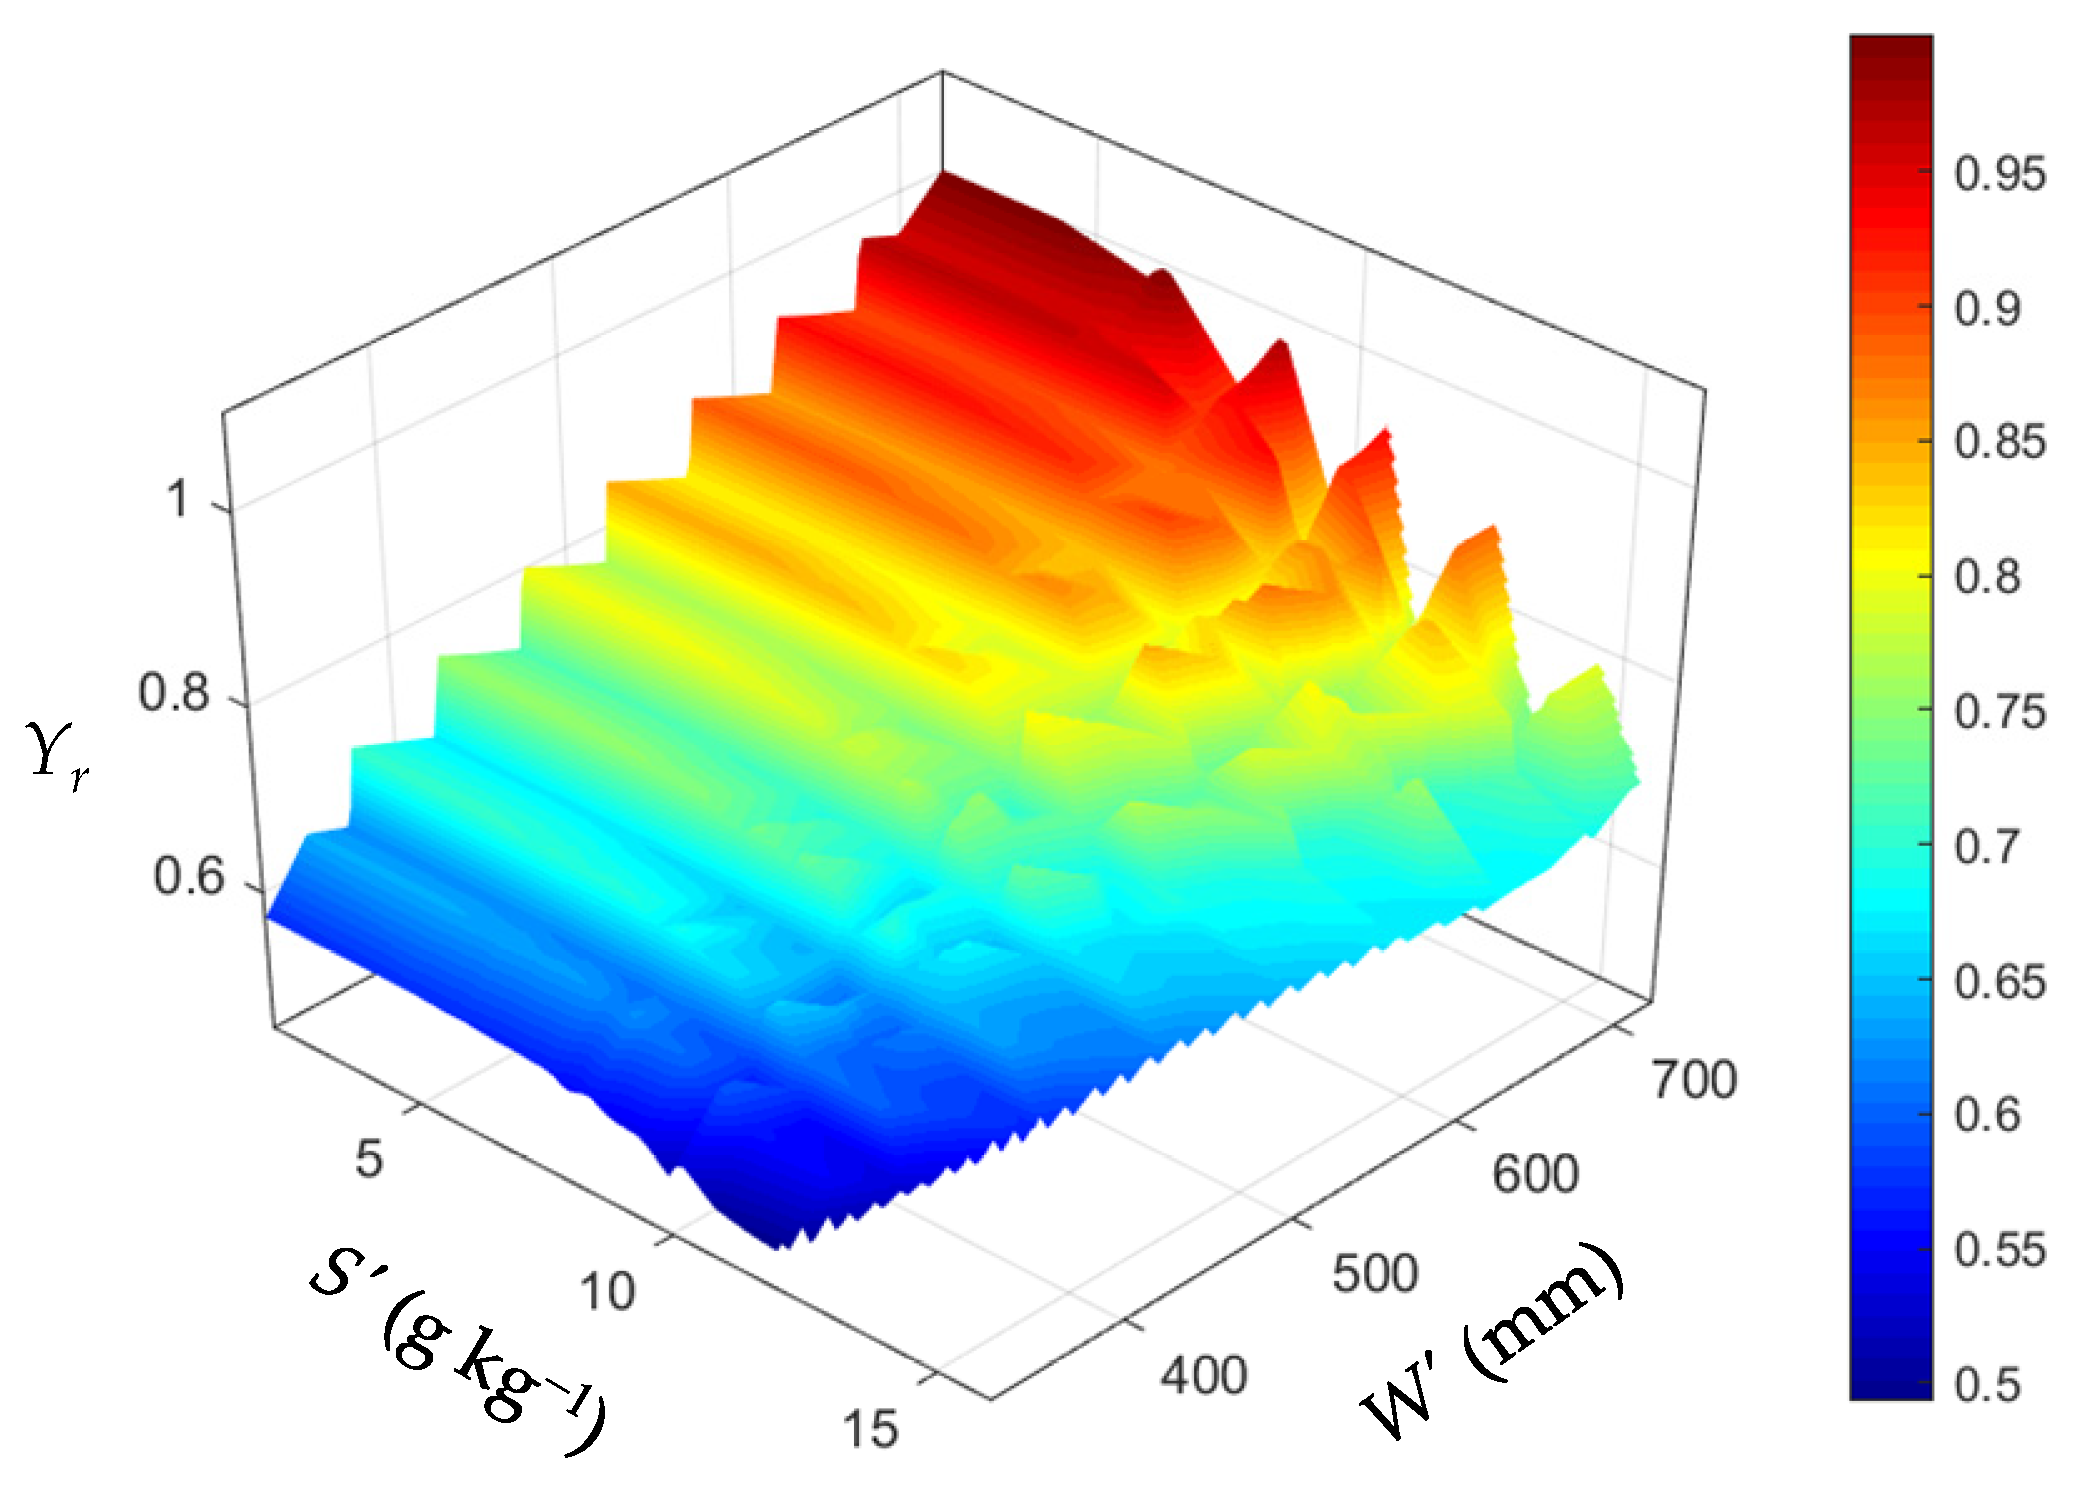
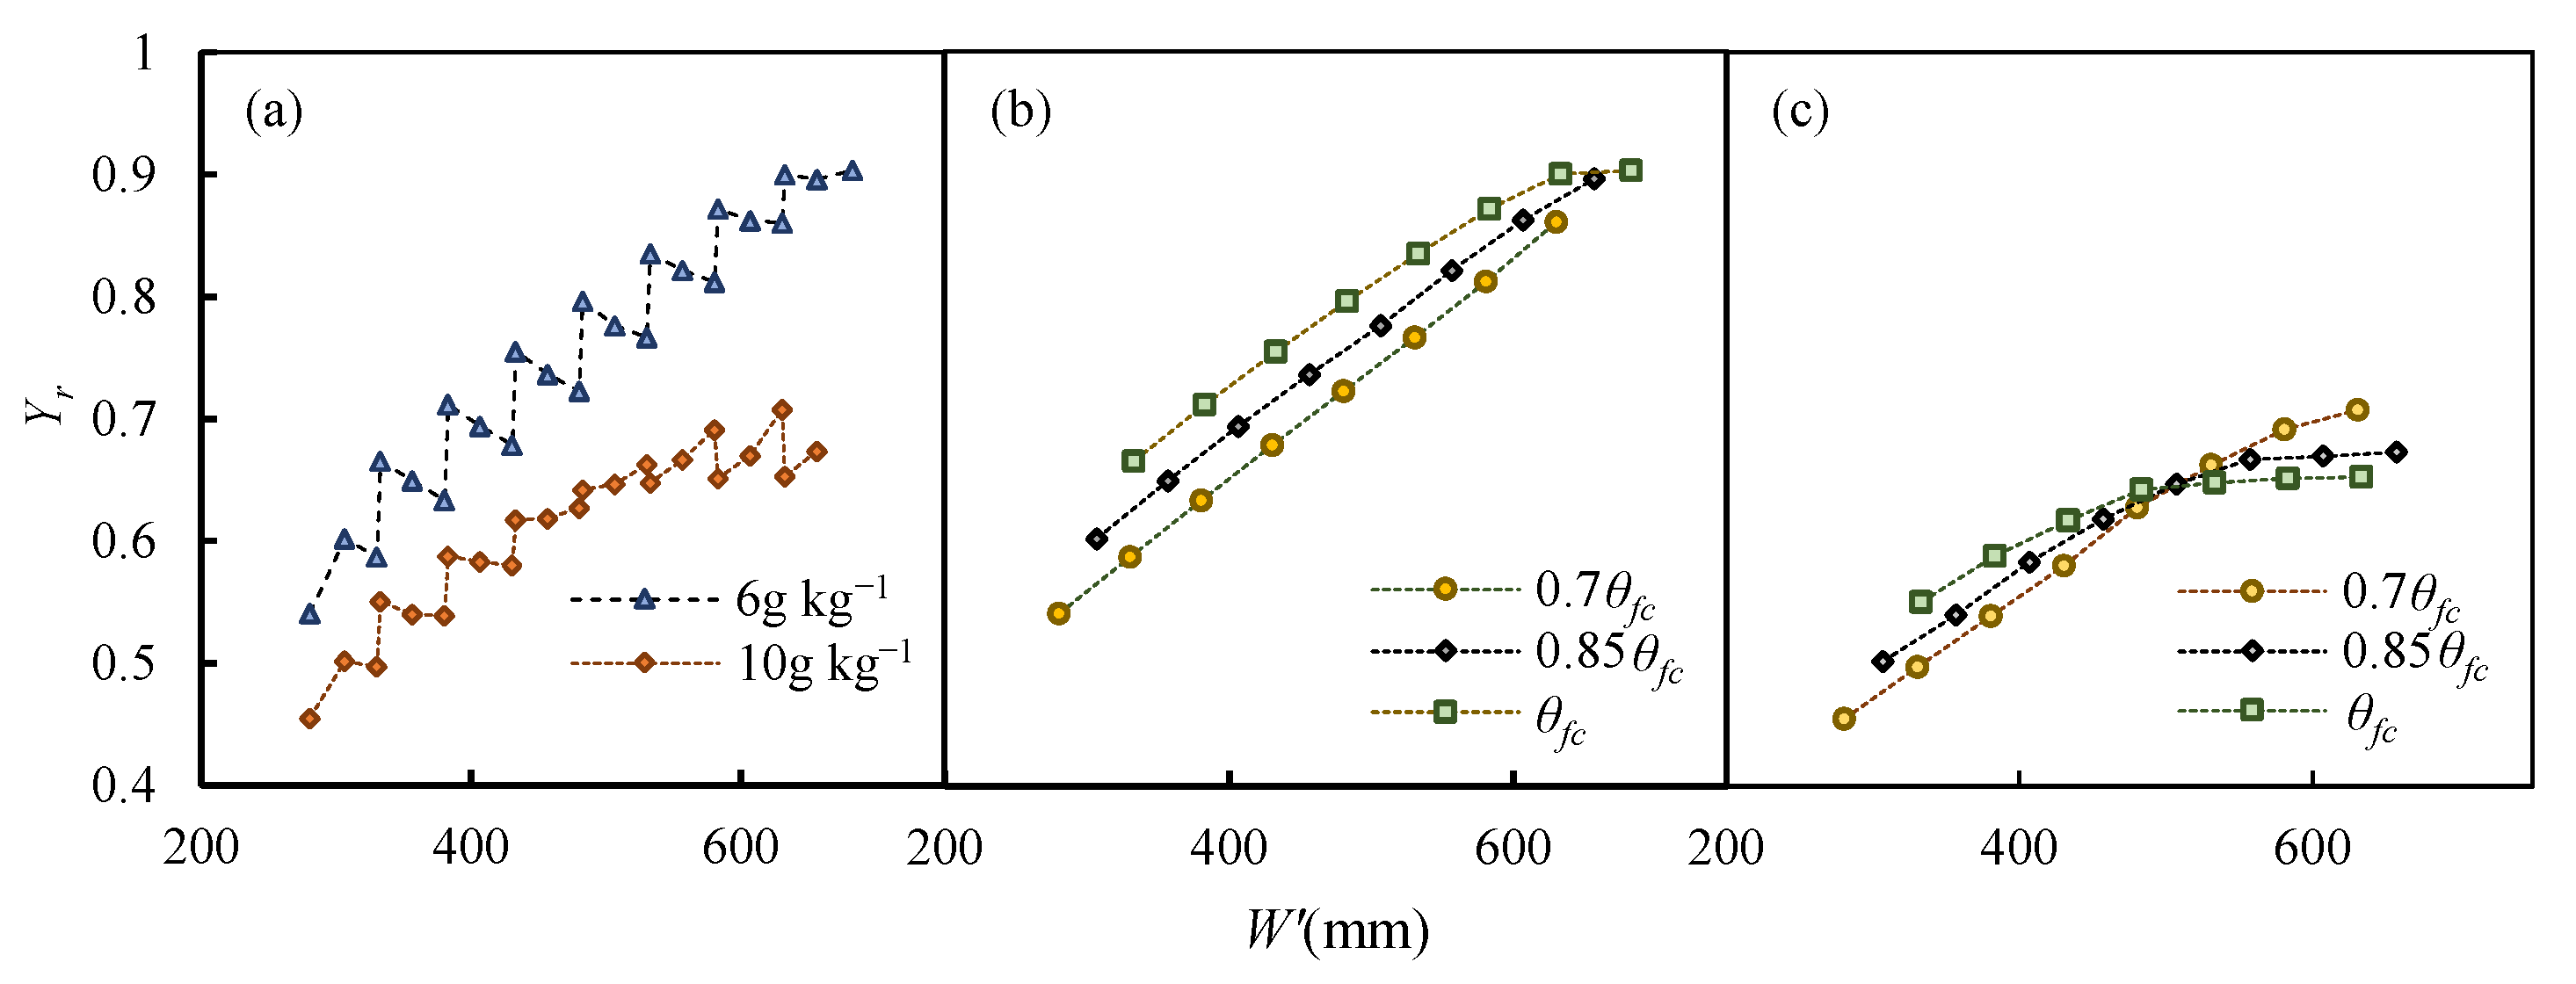
3.2.1. Effect of Available Water on Yield

The scenarios S0 = 6 g kg−1 or 10 g kg−1 and K = 3 g L−1 were investigated to exclude the effect of salt on relative yield. We found that relative yield varied as W’ increased (Figure 5a). Variation was due to the difference between W0 and M (Figure 5). Both M and W0 have significant effects on relative yield.
Relative yield increased as M increased, but when M reached a certain level, relative yield tended to be steady (Figure 5b,c). Research has shown that change in cotton yield with respect to M can be expressed as a second degree polynomial in binomial form [57,58]. When relative yield reached a maximum value, further increase in irrigation resulted in a slight decrease in relative yield. Increased irrigation reduces soil aeration, which will reduce yield. We ignored the effect of this factor on yield, and thus the result was inconsistent with researches mentioned above. An increase in W0 decreases the rate at which relative yield increases with respect to M. This phenomenon was more pronounced with the increase in S0; that is, when W0 increased, the gradient of the curve in Figure 5b,c was less than the gradient of the curve in Figure 5 when there was a similar increase in S0.
When W’ was unchanged, an increase in W0 corresponded to an increase in relative yield (Figure 5b,c), which is consistent with the results of Tan et al. [59]. On the contrary, when S0 and M were both large, relative yield decreased because the crop was affected by salt stress. An increase in W0 reduced the capacity of irrigation water to reduce soil salinity, thus subjecting plants to greater salt stress. However, when M was becoming smaller, plants were mainly affected by water, and an increase in W0 increased the amount of available water during the crop growth period, and thus relative yield increased.

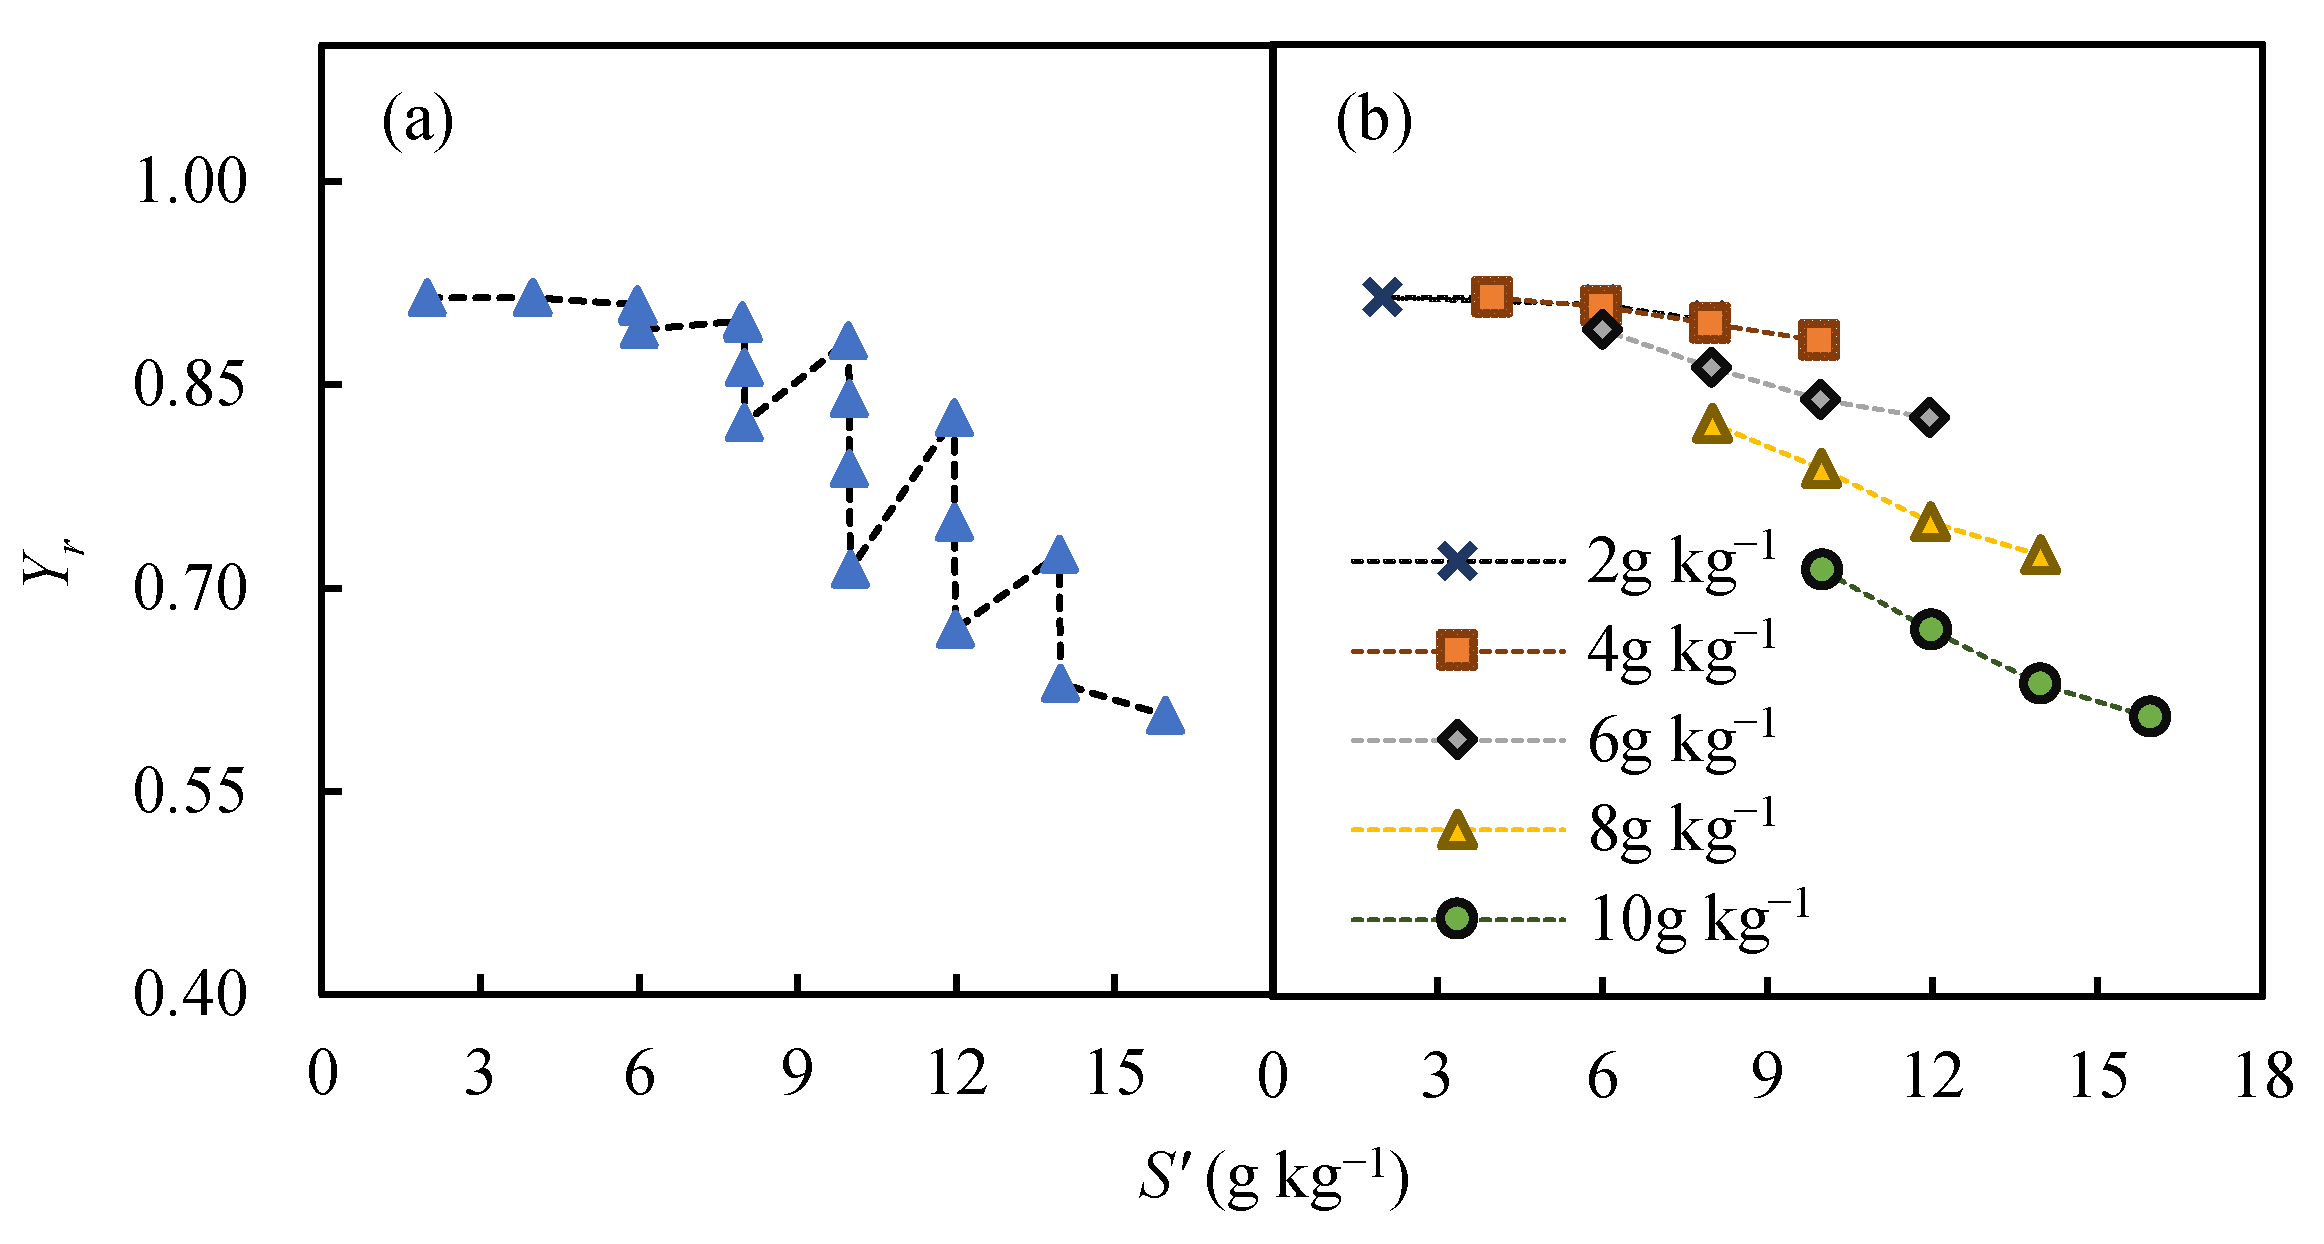
3.2.2. Effect of Soil Salinity on Yield

We investigated the scenario M = 500 mm and W0 = 0.85θfc to determine the effects on relative yield of excluding W′. Relative yield varied as S’ increased (Figure 6a) due to the difference between S0 and K (Figure 6b). Analysis of the relationship between S’ and Yr for different values of S0 showed that both S0 and K had a significant effect on relative yield. Relative yield decreased as S0 increased. The effect of K on relative yield was affected by S0. When S0 was small, K had no effect on relative yield; as S0 increased, the effect of K on yield became more pronounced [56]. When S’ was constant, the effect of S0 on relative yield was greater than the effect of K [60] because S0 affected relative yield over the entire growth period, and salt stress caused by irrigation in different growth stages could be controlled or remediated. Long-term salt-water irrigation inhibits cotton yield due to salt accumulation in the soil [61]; it also increases any initial soil salinity, resulting in further yield reduction [62]. Our results are consistent with the results of these studies.

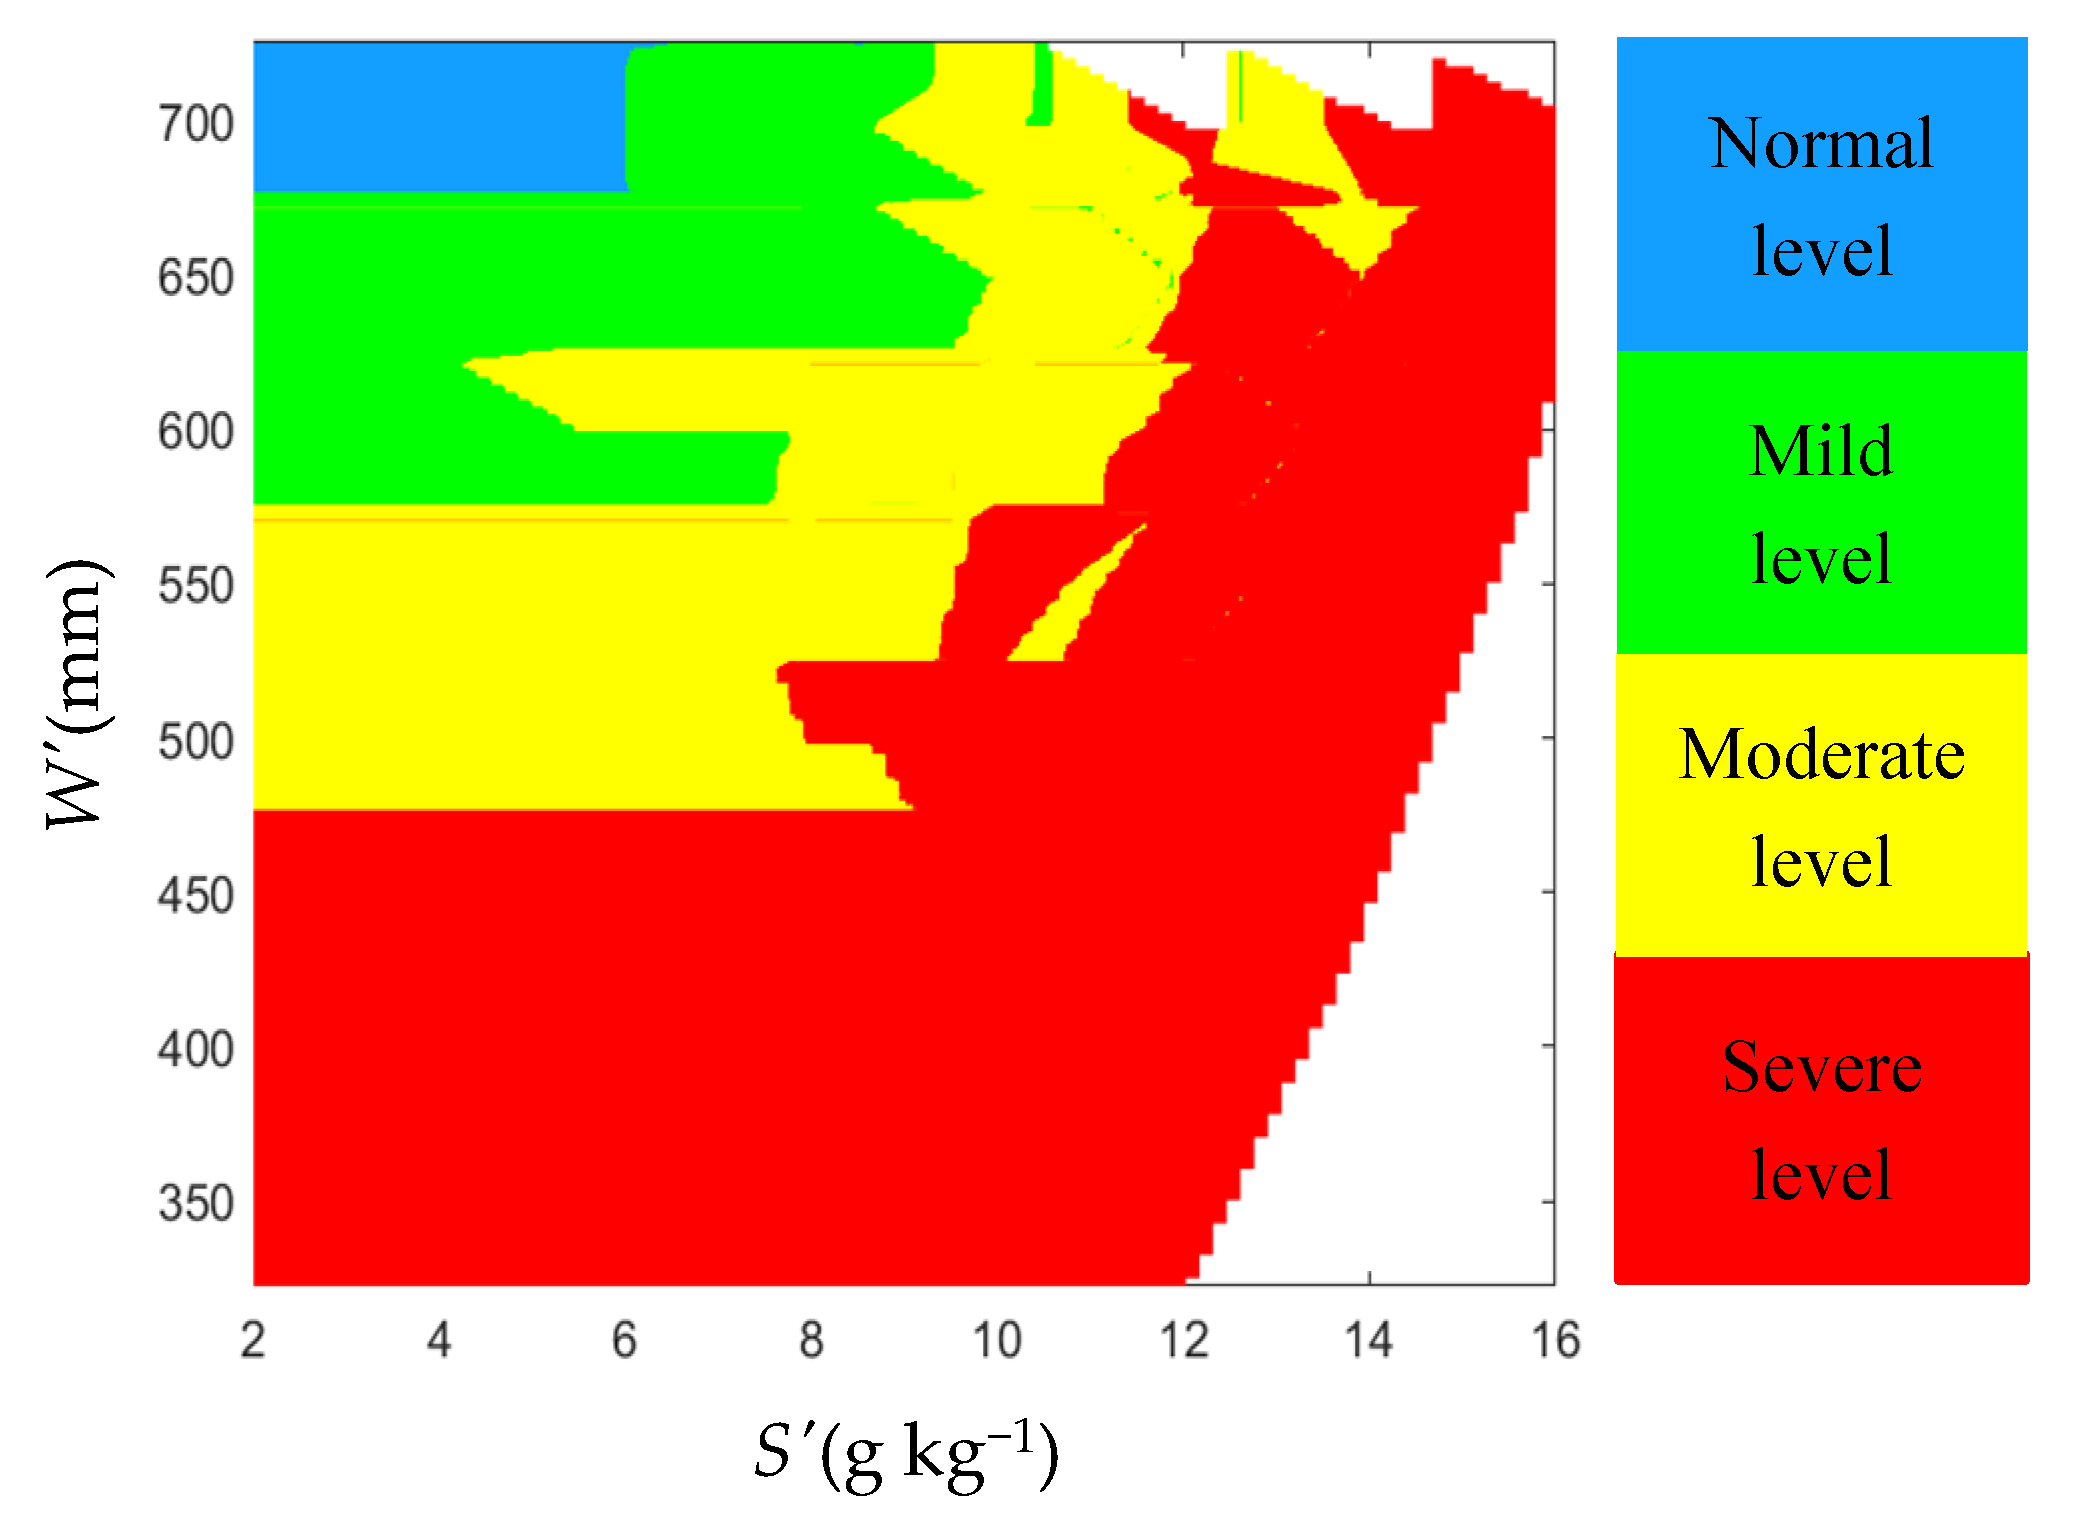
3.2.3. Soil Water and Salt Content under Different Yield Reduction Levels

Relative yield Yr ≥ 0.95 was taken to be the normal level, 0.85 ≤ Yr < 0.95 was considered a mild decrease, 0.75 ≤ Yr < 0.85 a moderate decrease, and Yr < 0.75 a severe decrease. Figure 7 shows the values of S’ and W’ for different degrees of decrease in relative yield. It can be seen from the figure that for a mild decrease, W’ and S’ have to be such that W’ > 535 mm (with W0 ≥ 0.85θfc and M ≥ 400 mm) and S’ < 9 g kg−1 (with S0 ≤ 8 g kg−1 and K ≤ 6 g L−1). To ensure no relative yield reduction, W’ has to be > 635 mm (with W0 = θfc and M ≥ 500 mm) and S’ has to be < 6 g kg−1 (when S0 < 2 g kg−1, K < 9 g L−1; and when S0 < 4 g kg−1, K < 6 g L−1). Thus, there are two requirements for guaranteeing relative yield: ensure the availability of irrigation water over the entire growth period; and to ensure the level of initial soil water in the root zone [63]. Saline soil necessitates measures to reduce soil salt content; if there is sufficient available water, using some to leach salt out of the soil after harvest is an effective method of improving future cotton yield [31,64]. When soil salt content is low (S0 ≤ 6 g kg−1), a certain amount of brackish water can be used for irrigation [60].

3.3. Dynamic Thresholds of Water and Salinity in the Cotton Root Zone During the Growth Period

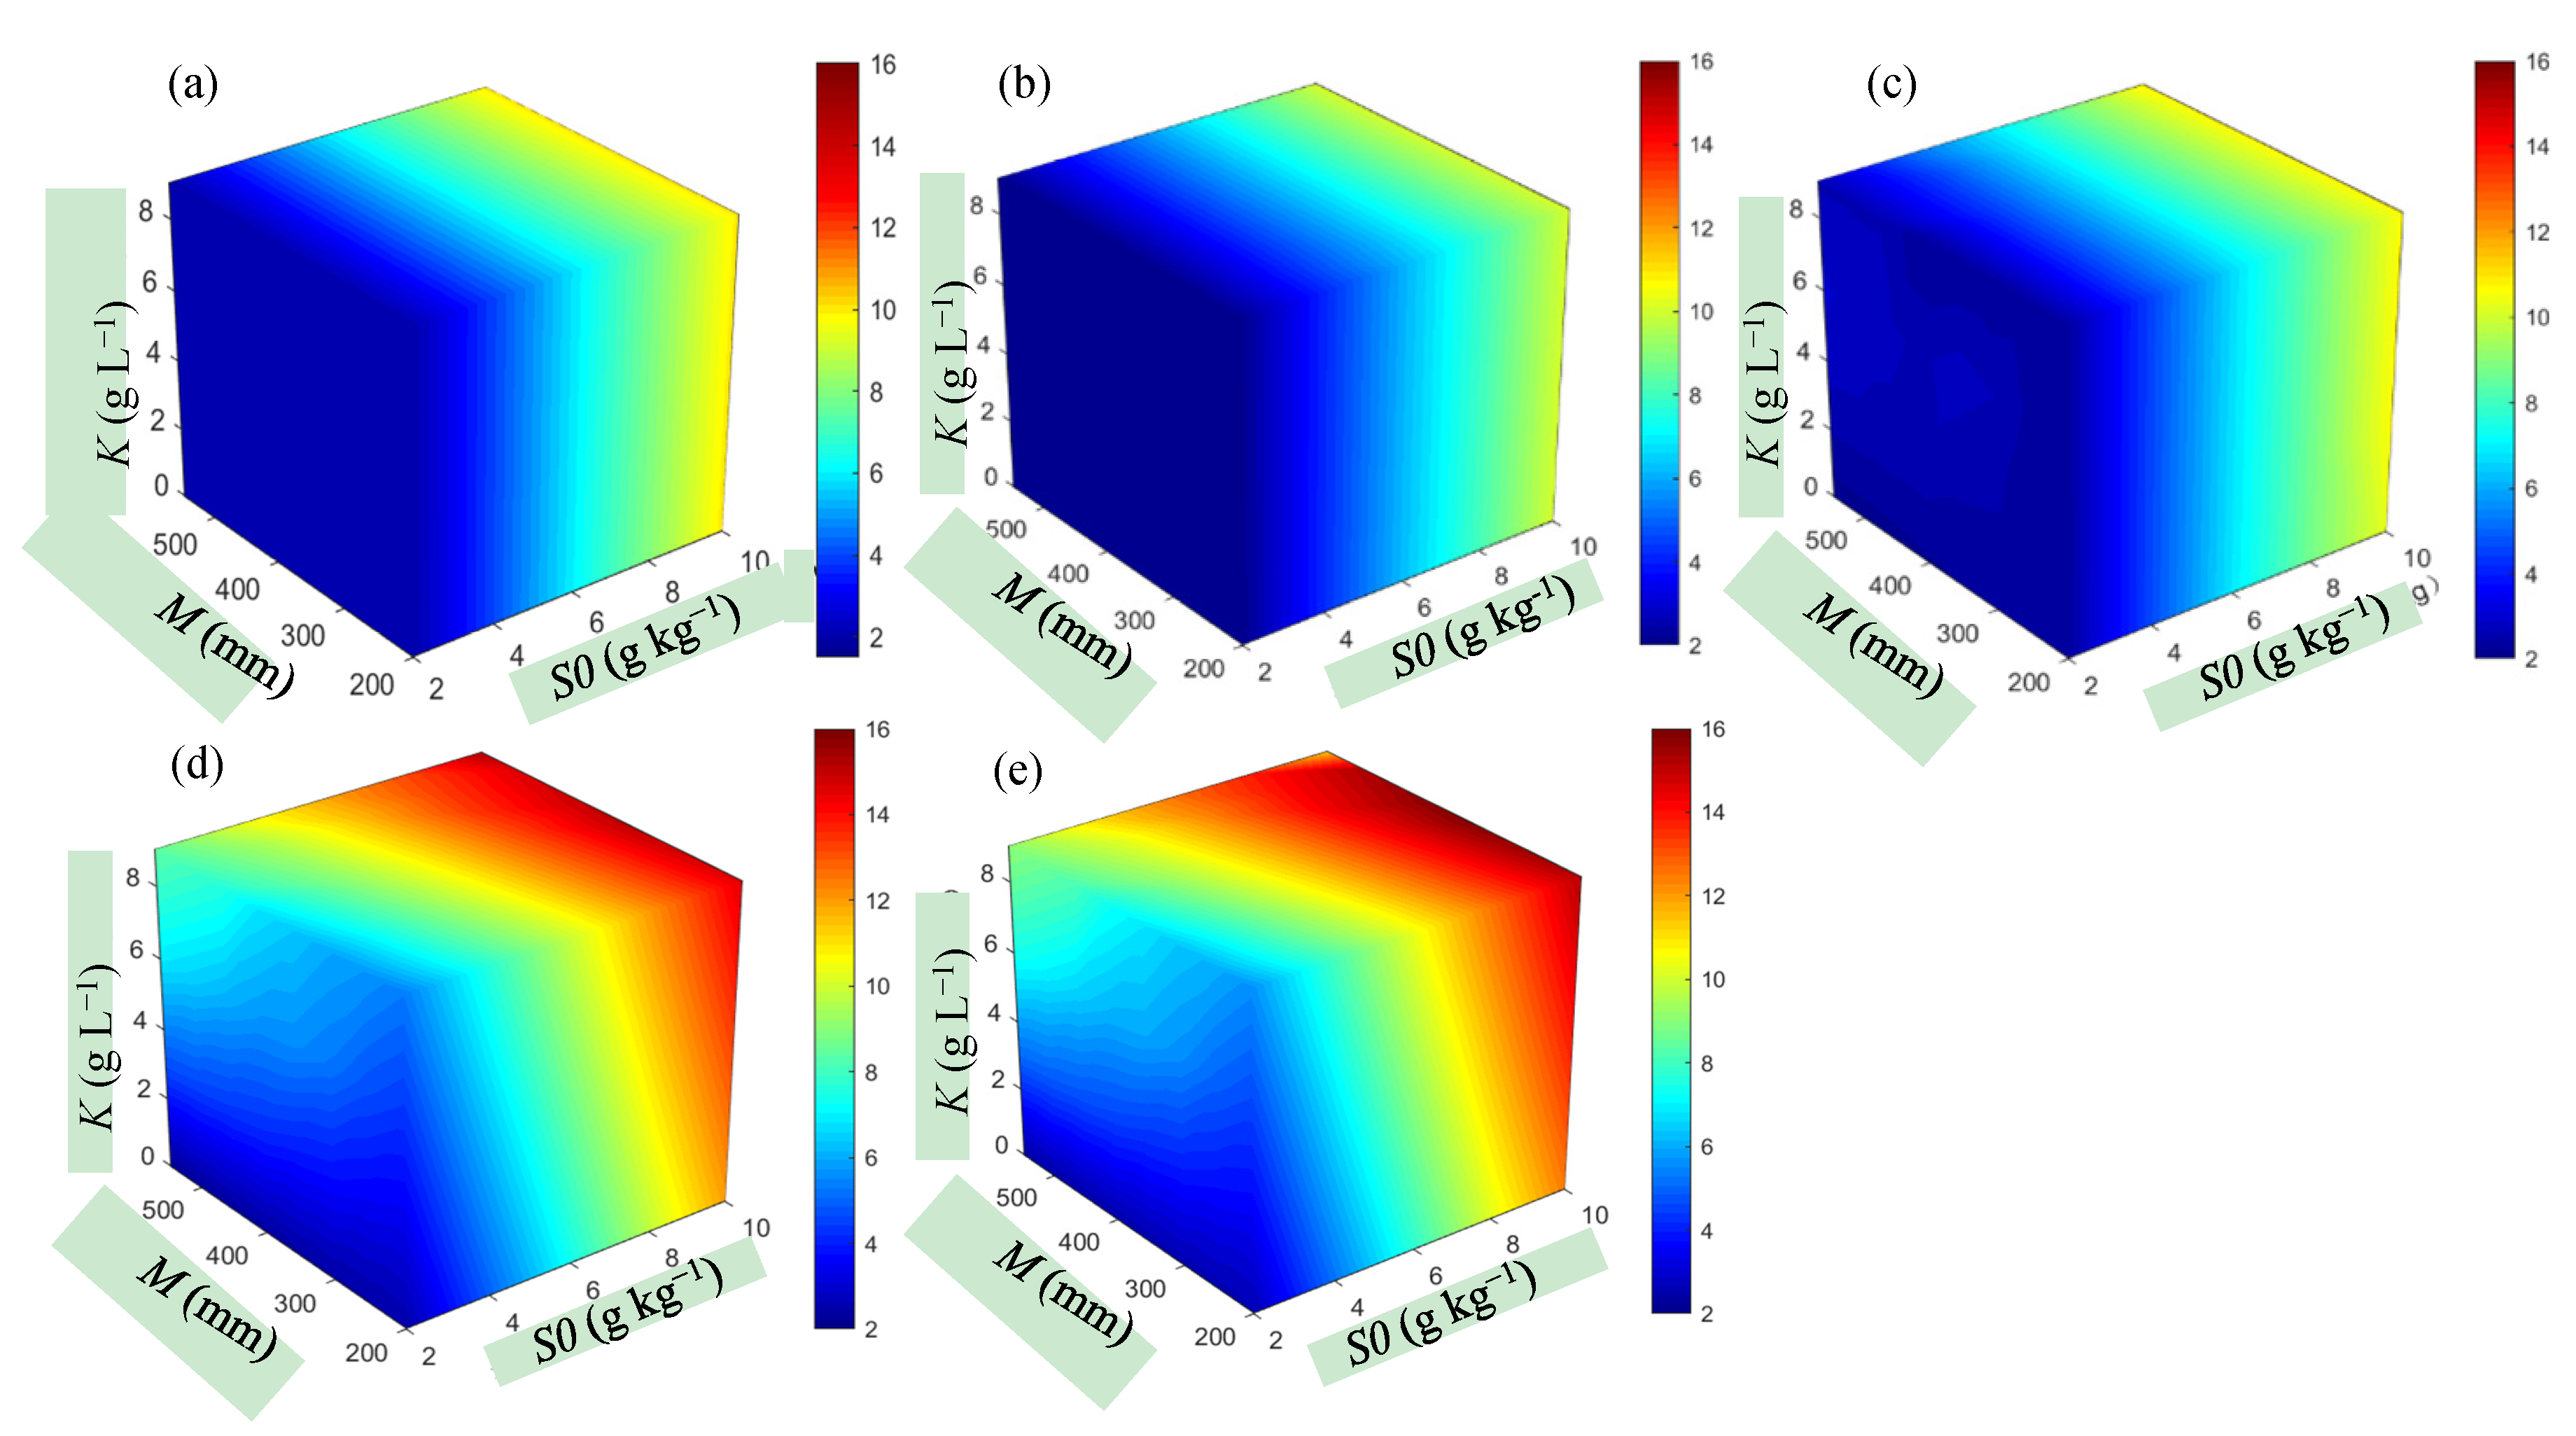
3.3.1. Threshold Values of Soil Water and Salinity in the Root Zone during the Growth Period

The threshold values of soil water and salinity at different growth stages were obtained using the model for 480 scenarios. Soil water and salinity in the root zone were analyzed in scenarios for W0 = 0.85θfc. Change over time in soil moisture content in the root zone is shown in Figure 8. Soil moisture content was identical for all scenarios at the beginning of the initial growth stage and differed over time in different scenarios. At the end of the seedling stage (i.e., the beginning of the bud stage) (Figure 8b), soil moisture content had decreased from the initial value. Cotton is not sensitive to water at the seedling stage, and little water was provided at this stage [46]. The flowering–boll stage is a critical period for water demand; in scenarios where average soil moisture content reached the critical value of water demand in this stage, yield was little affected if salt stress was minimal. Soil moisture content at the beginning and end of the flowering–boll stage is shown in Figure 8c,d. We note that at the beginning of the flowering–boll stage, when S0, M, and K were all large, soil moisture content was also large due to severe salt stress and little evapotranspiration. However, at the end of this stage, soil water content was very small at S0 = 10 g kg−1, M = 550 mm and K = 6 g L−1 or 9 g L−1. The most probable reason for this is that, in these scenarios, salt stress greatly affects yield. The irrigation amount was small to prevent irrigation from introducing excessive salt into the soil. At the end of the entire growth period, when M, S0, and K were small, soil moisture content was also small, which is consistent with previous research results [65].
Salt accumulation over the growing period was inevitable, especially when K and M were large (Figure 9 and Figure 10). The model minimizes the increase in root zone salinity in the flowering–boll stage because this stage is most sensitive to salinity. In scenarios where S0, M, and K were large, the trend of salt accumulation in the root zone differed from the overall trend (Figure 10b). There was no irrigation during the flowering–boll stage because of high plant sensitivity to salt; the crop was instead irrigated during the least sensitive boll-opening period, when there was less evaporation. This treatment tends to desalinate the soil. An increased quantity of irrigation water had little effect on yield when S0 and K were large, which is consistent with previous research results [24].
Our results showed that water content and salinity thresholds in the root zone changed dynamically rather than remaining fixed during the growth period. We found that change depended on the actual conditions. This finding differs from previous research results [29,30,66,67]. It is preferable to investigate the dynamic changes in threshold levels because the sensitivity of plants to soil water and salt in the root zone varies between growth stages. Soil salinity varies widely across southern Xinjiang. Soil salt content is in the range 4–14 g kg−1 [62], and the threshold levels of soil water and salinity will change accordingly. Areas of low salt content, such as 4 g kg−1, are represented by the scenario W0 = 0.85θfc, S0 = 4 g kg−1, M = 400 mm, K = 0 g L−1. In this scenario, the threshold values of soil water in the seedling, bud, flowering–boll and boll-opening stages were respectively 0.75–0.85θfc, 0.65–0.75θfc, 0.56–0.65θfc, and 0.45–0.56θfc; corresponding salinity threshold values were 4–4.16, 4.16–4.39, 4.39–4.64, and 4.64–4.97 g kg−1.

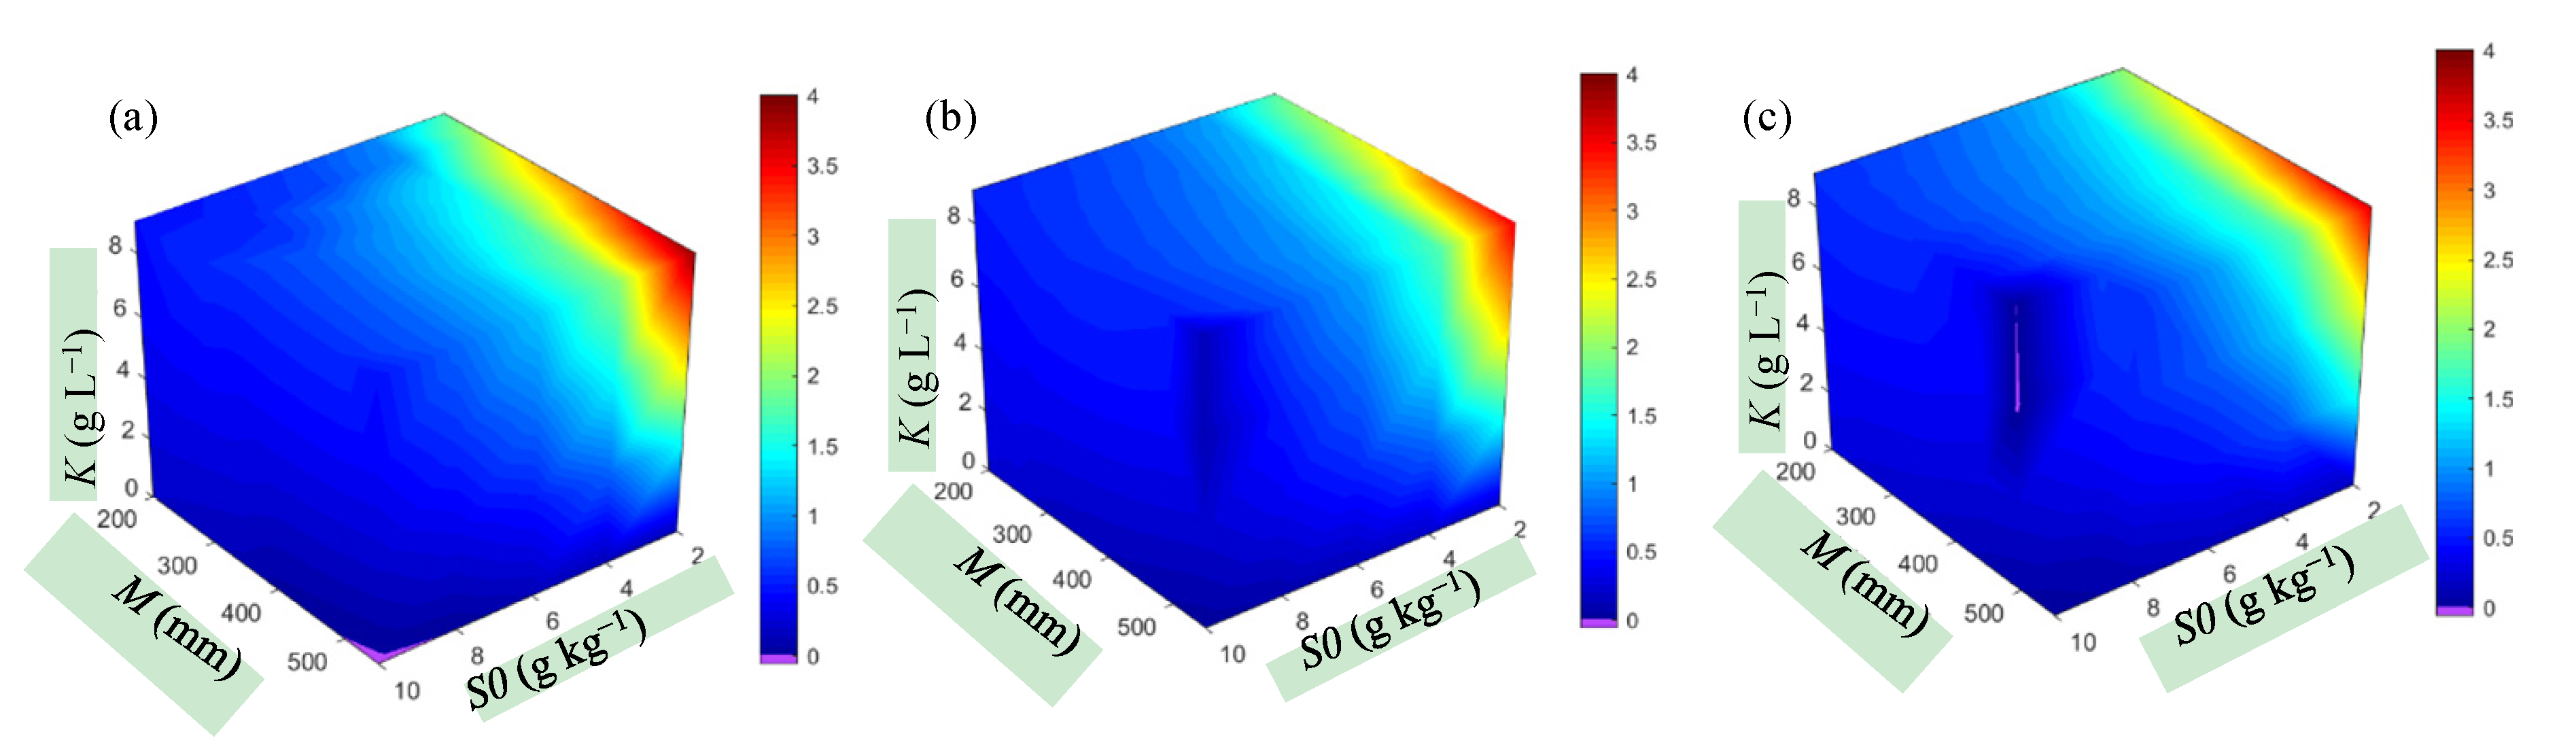
3.3.2. Soil Salt Accumulation over the Entire Growth Period

Freshwater resources are scarce in Xinjiang. Farmers use brackish water for irrigation to guarantee crop yield [64], a practice that increases soil salinity [68], decreases soil fertility, and reduces agricultural sustainability. The levels of salinity at the ends of growth stages in different scenarios (Figure 11) show that, in most cases, salinity increases in the soil of the root zone over a growth period, especially when the values of W0, M and K are high and S0 is small. There were two exceptions. In the scenario W0 = 0.7θfc, M = 550 mm, S0 = 10 g kg−1, and K = 0 g L−1 (Figure 11a), when the soil contained ample freshwater and was highly saline, it was easier to remove salt from below the root layer than when S0 was small. In the scenario W0 = θfc, M = 500 mm, S0 = 10 g kg−1, and K = 6 g L−1 (Figure 11c), both soil salinity and the salt content of irrigation water were excessive, resulting in salt stress. Thus, irrigation at the flowering–boll stage would not produce maximum yield even if the irrigation amount was sufficient. The remaining water was instead used to irrigate at the boll-opening stage, which is not very sensitive to salt. Eventually, the soil was desalinated. We note that the relative yield in these two scenarios was not high (0.818 and 0.701), but both scenarios consumed large quantities of water. In practice, it is necessary to take measures to remove salt from the root zone, such as spring or autumn irrigation [64], or surface drainage [69], to maintain a high yield over a long period of time while restricting irrigation water consumption to being within a reasonable range.

4. Conclusions

The modified Jensen model was used to predict the sensitivity of cotton yield to soil water and salinity at different growth stages. We developed a method of obtaining a high yield by optimizing soil moisture content and salinity in the root zone. The response of yield to soil water and salinity was quantified, under the assumption that there were no measures taken to reduce salinity during the entire growth period. The threshold values of soil water and salinity in the root zone, which change dynamically, were obtained for different growth stages under 480 different scenarios. We draw the following conclusions:
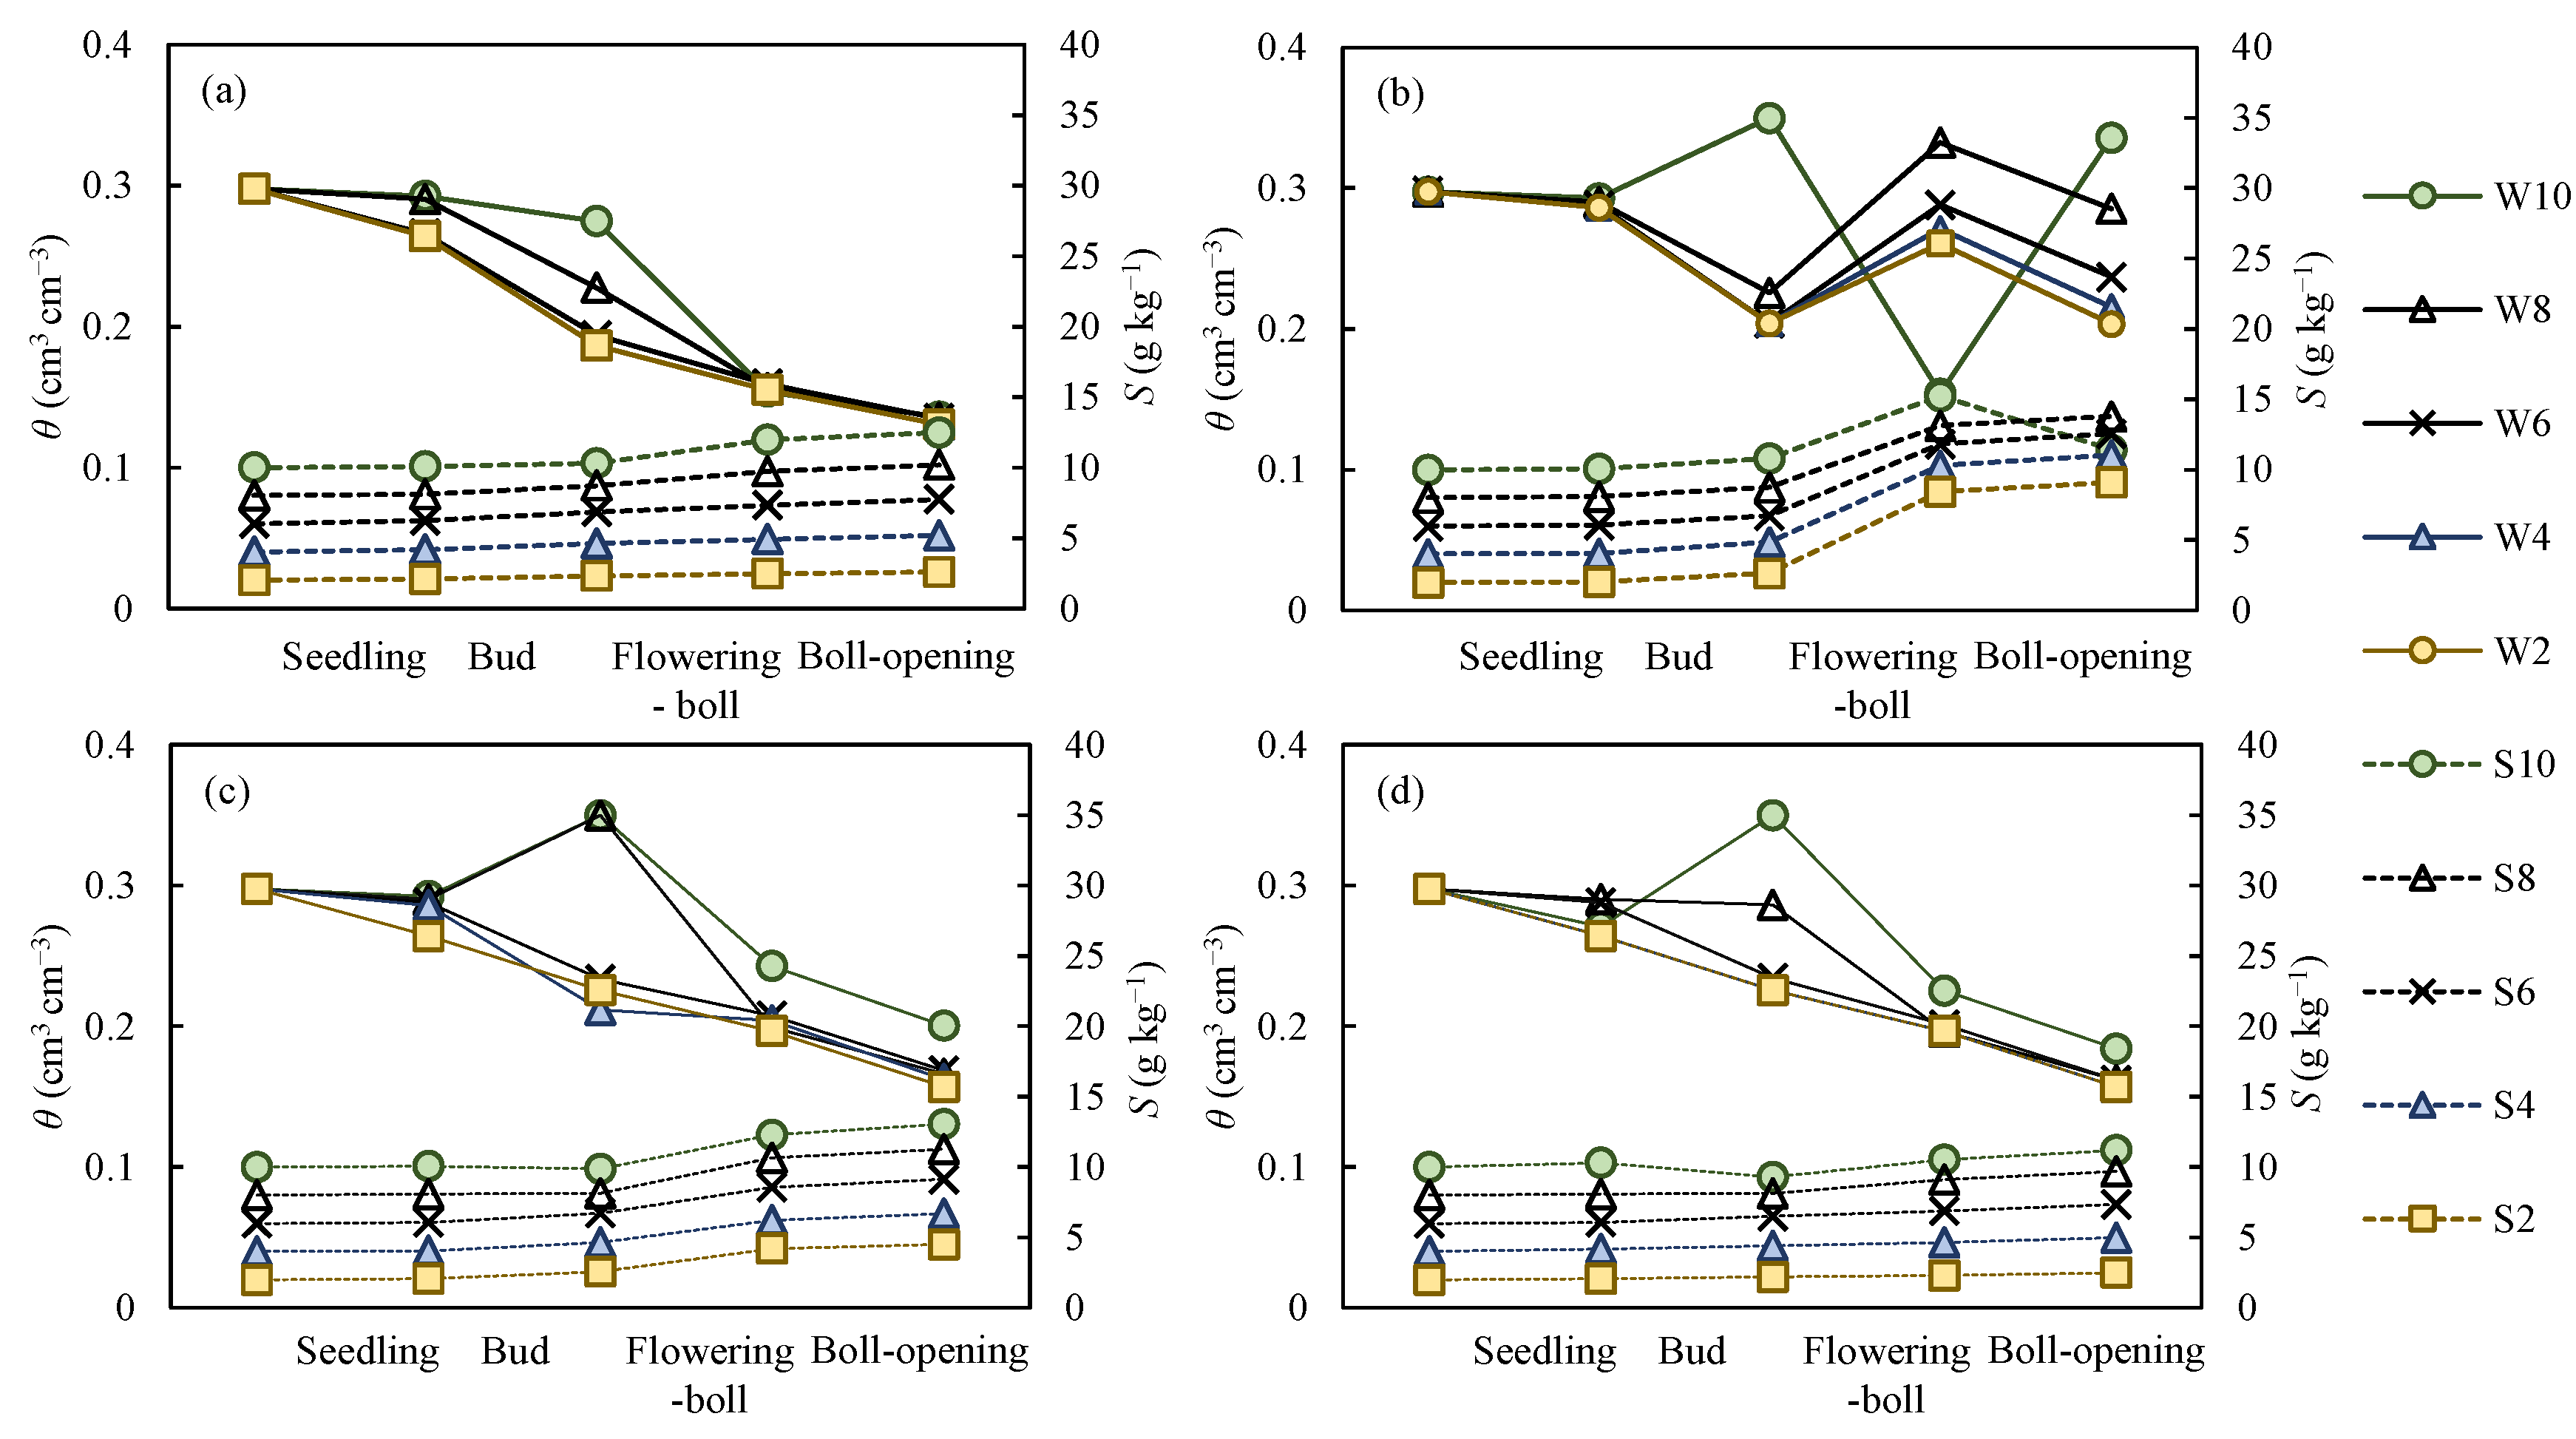
  • cotton plants differ in sensitivity to soil moisture content and salinity at different growth stages. In descending order of sensitivity, the stages for soil water sensitivity are ordered: flowering–boll > bud > boll-opening > seedling; and the stages for sensitivity to salinity are ordered: flowering–boll > seedling > bud > boll-opening. The flowering–boll stage is the crucial period for cotton yield; therefore, particular attention should be given to the control of soil water and salinity during that period;
  • cotton yield is significantly affected by irrigation quota M, initial soil moisture content W0, initial soil salt content S0, and irrigation water saltinity K. To ensure that the relative yield of cotton is above 0.85, the available water W’ (the sum of W0 and M) must meet the requirement W’ > 535 mm (with W0 ≥ 0.85θfc and M ≥ 400 mm), and total soil salt S’ should meet the requirement S’ < 9 g kg−1 (with S0 < 8 g kg−1 and K < 6 g L−1) in southern Xinjiang;
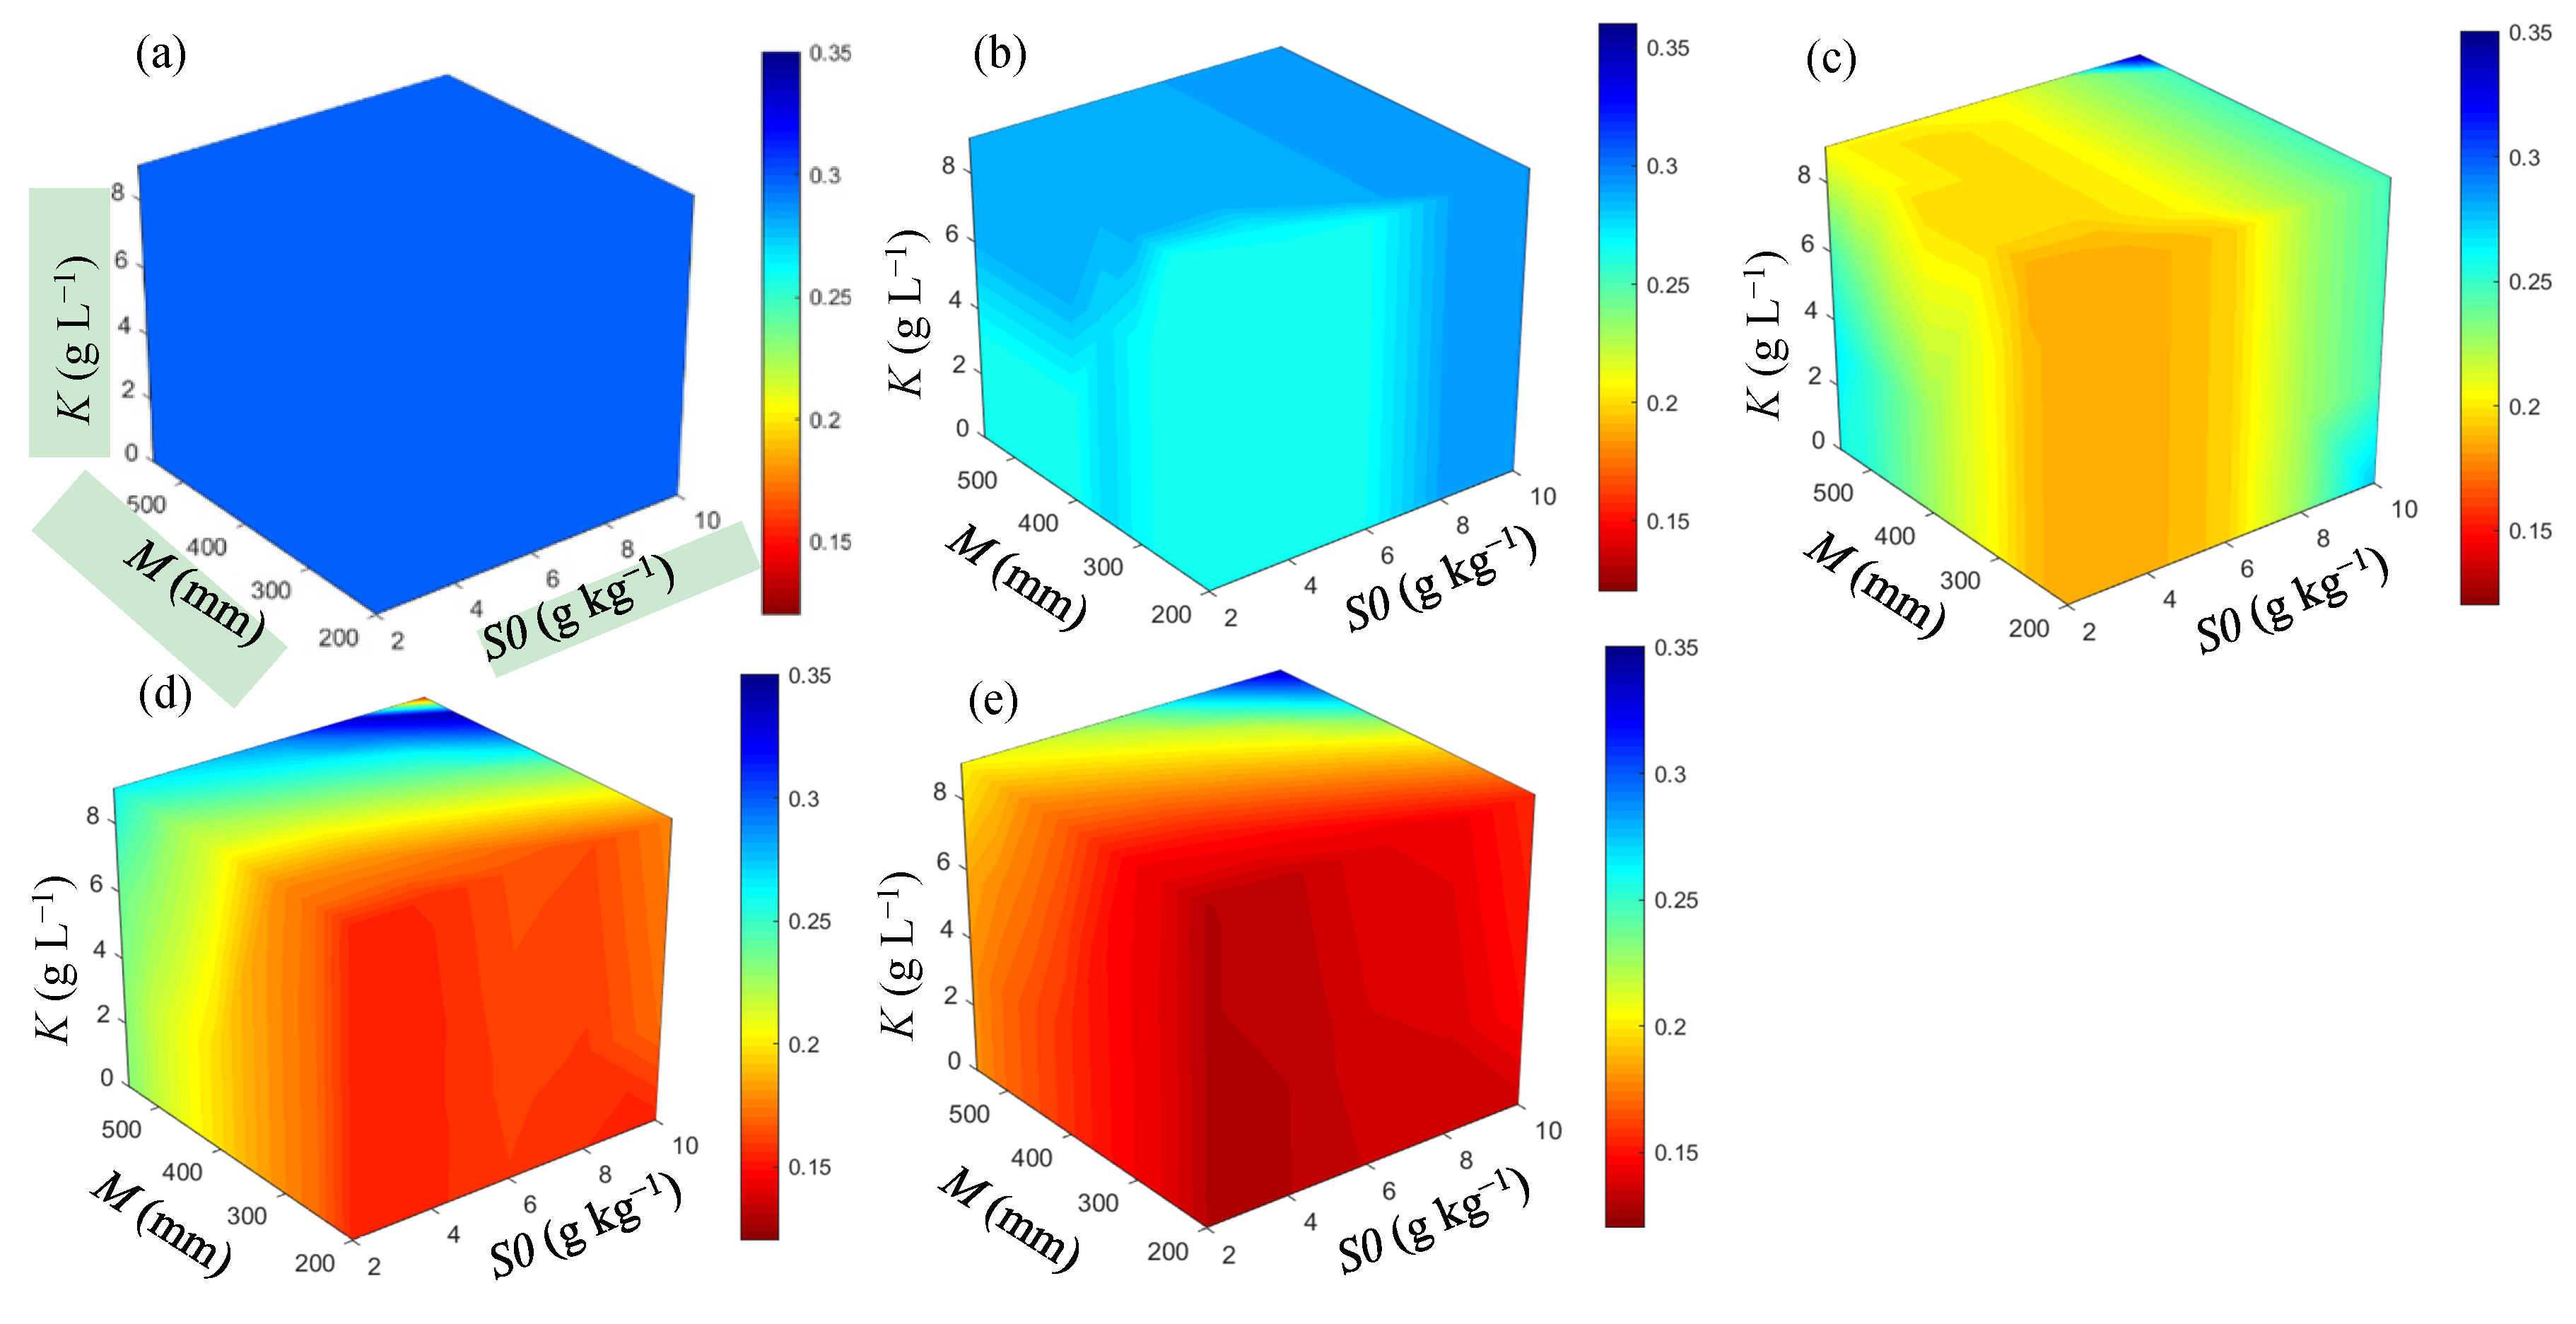
  • the threshold levels of water content and salt in the root zone under different scenarios vary considerably. This result indicates that the change in threshold levels depended on the initial boundary conditions and other factors. The Akesu Irrigation District in southern Xinjiang, where soil salt content is relatively low, can be represented reasonably well by the scenario W0 = 0.85θfc, S0 = 4 g kg−1, M = 400 mm, K = 0 g L−1. In this scenario, when no actions were taken to remove salt during the growth period, the threshold levels of soil water at different growth stages (seedling, bud, flowering–boll and boll-opening) were respectively 0.75–0.85θfc, 0.65–0.75θfc, 0.56–0.65θfc, and 0.45–0.56θfc, and the threshold levels of salt were, respectively, 4–4.16, 4.16–4.39, 4.39–4.64, and 4.64–4.97 g kg−1. In most cases, due to salt accumulation over the entire growth period, it is necessary to reduce the salt content of the root zone to ensure sustainable agriculture.
The dynamically changing soil water and salinity thresholds under different conditions of salt deposition require further study.

Supplementary Materials

The following are available online at https://www.mdpi.com/2073-4441/12/9/2449/s1. Table S1: Salinity of irrigation water in different years (g L−1). Table S2: Irrigation schedule of Experiment One. Table S3: Dates of cotton growth stages of Experiment One. Table S4: Dates of cotton growth stages of Experiment Two. Table S5: Irrigation schedule of Experiment Two. Table S6. Data recorded of the two experiment in 2008-2010 and 2018. Figure S1 Daily reference evapotranspiration (ET0) and precipitation during the whole growth period of cotton in Experiment One (a-c) and Experiment Two (d). Figure S2. Soil moisture content of (a) 2008, (b) 2009, (c) 2010 and soil salt content of (d) 2008, (e) 2009 and (f) 2010.

Author Contributions

Conceptualization, S.K.; Data curation, S.H.; Formal analysis, H.W. and X.L.; Methodology, H.W. and X.L.; Project administration, S.K.; Resources, X.L., S.K. and P.G.; Software, H.W.; Writing—review and editing, H.W., X.L., S.K. and P.G. All authors have read and agreed to the published version of the manuscript.

Funding

This research was supported by the National Natural Science Foundation of China (51790534 and 51909262), and the project “Research on Water-Saving and Quality-Efficient Irrigation Technology for Greenhouse Crop” of Shanghai Irrist Corp., Ltd.

Acknowledgments

The authors would like to express their gratitude for the funding agencies, the editor and reviewers for leveraging the quality of this work and students who participated in the fieldwork and laboratory work.

Conflicts of Interest

The authors declare no conflict of interest.

Abbreviation

Model of response to crop water and salinity
Parameters and VariablesMeaning and Description
iThe ith growth stage
nThe number of growth stages
λiThe water deficit sensitivity index of yield at growth stage i
θpiThe critical water content (cm3 cm−3) at growth stage i
ρ, σSalt stress sensitivity index of ET and yield
Ya, YmThe actual crop yield and the potential crop yield (kg ha−1)
ETai, ETmiActual and maximum evapotranspiration (mm) of growth stage i
SY,max,SY,minThe critical and maximum soil salinity which affect the yield at different growth stages (g kg−1)
Set,max,Set,minThe critical and maximum soil salinity which affect ET at different growth stages (g kg−1)
KsThe stress factor
KswThe water stress factor
KssThe salt stress factor
Optimization model of dynamic thresholds of soil water and salt in the root zone
Parameters and VariablesMeaning and Description
Ya, YmThe actual crop yield and the potential crop yield (kg ha−1)
giThe response factors of yield to water and salinity at growth stage i.
Wi,Wi+1The soil moisture content (mm) at the beginning and end of growth stage i
ETsi, Ii, Pi, Qei, QDi, Ri, θiThe evapotranspiration (mm), irrigation (mm), precipitation (mm), capillary water (mm), drainage (mm), runoff (mm), and soil moisture content (cm3 cm−3) at growth stage i
Sai,Sai+1The salt content of the root zone soil at the beginning and end of growth stage i (kg m−2)
SIi, SPi, Sei, Sdi,SciThe salt content of irrigation water, precipitation, capillary water, deep drainage and absorbed by the plants at growth stage i (kg m−2)
θwp, θfcWilt coefficient and field capacity (cm3 cm−3)
Si, Si,maxThe root soil actual and maximum salt content (g kg−1) at the beginning of growth stage i
SrThe maximum allowable salt content (g kg−1) at the end of the growth stage
MThe irrigation quota (mm)
W0, S0Initial water content (mm) and initial salt content (g kg−1)
Root zone water and salt balance module
Parameters and VariablesMeaning and Description
a, bThe exchange coefficients of capillary rise and drainage
HiThe layer depth in the root zone (m)
fThe leaching coefficient
βThe capillary rise coefficient
Ki, CPi, Cei, CDiThe salt concentration of irrigation water, precipitation, capillary rise and deep drainage in growth stage i (kg m−3)
CiThe salt concentration of the root soil at the beginning of growth stage i (kg m−3)
CwiThe average salt concentration of irrigation water and precipitation (kg m−3)

References

  1. Asfaw, E.; Suryabhagavan, K.V.; Argaw, M. Soil salinity modeling and mapping using remote sensing and GIS: The case of Wonji sugar cane irrigation farm, Ethiopia. J. Saudi Soc. Agric. Sci. 2018, 17, 250–258. [Google Scholar] [CrossRef] [Green Version]
  2. Ma, C.J.; Naidu, R.; Liu, F.G.; Lin, C.H.; Ming, H. Influence of hybrid giant Napier grass on salt and nutrient distributions with depth in a saline soil. Biodegradation 2012, 23, 907–916. [Google Scholar] [CrossRef] [PubMed]
  3. Mai, W.X.; Tian, C.Y.; Li, C.J. Soil salinity dynamics under drip irrigation and mulch film and their effects on cotton root length. Commun. Soil Sci. Plan. 2013, 44, 1489–1502. [Google Scholar] [CrossRef]
  4. Dixit, P.N.; Chen, D. Modification of a spatially referenced crop model to simulate the effect of spatial pattern of subsoil salinity. Comput. Electron. Agric. 2010, 74, 313–320. [Google Scholar] [CrossRef] [Green Version]
  5. Qadir, M.; Oster, J. Vegetative bioremediation of calcareous sodic soils: History, mechanisms, and evaluation. Irrig. Sci. 2002, 21, 91–101. [Google Scholar]
  6. Letey, J.; Hoffman, G.J.; Hopmans, J.W.; Grattan, S.R.; Suarez, D.; Corwin, D.L.; Oster, J.D.; Wu, L.; Amrhein, C. Evaluation of soil salinity leaching requirement guidelines. Agric. Water Manag. 2011, 98, 502–506. [Google Scholar] [CrossRef] [Green Version]
  7. Corwin, D.L.; Lesch, S.M. A simplified regional-scale electromagnetic induction-Salinity calibration model using ANOCOVA modeling techniques. Geoderma 2014, 230, 288–295. [Google Scholar] [CrossRef]
  8. Mao, W.; Yang, J.Z.; Zhu, Y.; Ye, M.; Wu, J.W. Loosely coupled SaltMod for simulating groundwater and salt dynamics under well-canal conjunctive irrigation in semi-arid areas. Agric. Water Manag. 2017, 192, 209–220. [Google Scholar] [CrossRef]
  9. Campbell, B.T.; Saha, S.; Percy, R.; Frelichowski, J.; Jenkins, J.N.; Park, W.; Mayee, C.D.; Gotmare, V.; Dessauw, D.; Giband, M. Status of the global cotton germplasm resources. Crop Sci. 2010, 50, 1161–1179. [Google Scholar] [CrossRef] [Green Version]
  10. Zhang, H.; Khalid, H.; Li, W.; He, Y.; Liu, G.; Chen, C. Employing response surface methodology (RSM) to improve methane production from cotton stalk. Environ. Sci. Pollut. Res. 2018, 25, 7618–7624. [Google Scholar] [CrossRef]
  11. Yang, Z.N.; Tang, J.J.; Yu, X.L. Xinjiang Cotton industry present situation and countermeasure research. Res. Agric. Mod. 2013, 34, 298–302. (In Chinese) [Google Scholar]
  12. Wang, Z.M.; Jin, M.G.; Šimůnek, J.; van Genuchten, M.T. Evaluation of mulched drip irrigation for cotton in arid Northwest China. Irrig. Sci. 2014, 32, 15–27. [Google Scholar] [CrossRef] [Green Version]
  13. Penna, J.C.V.; Verhalen, L.M.; Kirkham, M.B.; McNew, R.W. Screening cotton genotypes for seedling drought tolerance. Genet. Mol. Biol. 1998, 21, 545–549. [Google Scholar] [CrossRef]
  14. Maas, E.V.; Hoffman, G.J. Crop salt tolerance-current assessment. J. Irrig. Drain. Div. 1977, 103, 115–134. [Google Scholar]
  15. Munns, R. Comparative physiology of salt and water stress. Plant Cell Environ. 2002, 25, 239–250. [Google Scholar] [CrossRef] [PubMed]
  16. Pace, P.F.; Cralle, H.T.; El-Halawany, S.H.; Cothren, J.T.; Senseman, S.A. Drought-induced changes in shoot and root growth of young cotton plants. J. Cotton Sci. 1999, 3, 183–187. [Google Scholar]
  17. Turner, N.C.; Hearn, A.B.; Begg, J.E.; Constable, G.A. Cotton (Gossypium-hirsutum-l): Physiological and morphological responses to water deficits and their relationship to yield. Field Crop. Res. 1986, 14, 153–170. [Google Scholar] [CrossRef]
  18. Minhas, P.S.; Ramos, T.B.; Ben-Gal, A.; Pereira, L.S. Coping with salinity in irrigated agriculture: Crop evapotranspiration and water management issues. Agric. Water Manag. 2020, 227, 105832. [Google Scholar] [CrossRef]
  19. Van Genuchten, M.T.; Hoffman, G.J. Analysis of crop production. Soil. Salin. Irrig. 1984, 51, 258–271. [Google Scholar]
  20. Jensen, M.E. Water Consumption by Agricultural Plants (Chapter 1); Academic Press: New York, NY, USA, 1968. [Google Scholar]
  21. Chen, J.L.; Kang, S.Z.; Du, T.S.; Guo, P.; Qiu, R.J.; Chen, R.Q.; Gu, F. Modeling relations of tomato yield and fruit quality with water deficit at different growth stages under greenhouse condition. Agric. Water Manag. 2014, 146, 131–148. [Google Scholar] [CrossRef]
  22. Wang, J.T.; Guo, S.S.; Kang, S.Z.; Wang, Y.F.; Du, T.S.; Tong, L. Joint optimization of irrigation and planting pattern to guarantee seed quality, maximize yield, and save water in hybrid maize seed production. Eur. J. Agron. 2020, 113, 125970. [Google Scholar] [CrossRef]
  23. Zeng, W.Z.; Xu, C.; Wu, J.W.; Huang, J.S. Sunflower seed yield estimation under the interaction of soil salinity and nitrogen application. Field Crop. Res. 2016, 198, 1–15. [Google Scholar] [CrossRef]
  24. Russo, D.; Bakker, D. Crop-water production functions for sweet corn and cotton irrigated with saline waters. Soil Sci. Soc. Am. J. 1987, 51, 1554–1562. [Google Scholar] [CrossRef]
  25. Letey, J.; Dinar, A. Simulated crop-water production functions for several crops when irrigated with saline waters. Hilgardia 1986, 54, 1–32. [Google Scholar] [CrossRef] [Green Version]
  26. Shani, U.; Ben-Gal, A.; Tripler, E.; Dudley, L.M. Plant response to the soil environment: An analytical model integrating yield, water, soil type, and salinity. Water Resour. Res. 2007, 43, W08418. [Google Scholar] [CrossRef]
  27. Skaggs, T.H.; Anderson, R.G.; Corwin, D.L.; Suarez, D.L. Analytical steady-state solutions for water-limited cropping systems using saline irrigation water. Water Resour. Res. 2014, 50, 9656–9674. [Google Scholar] [CrossRef]
  28. Jalali, V.; Asadi Kapourchal, S.; Homaee, M. Evaluating performance of macroscopic water uptake models at productive growth stages of durum wheat under saline conditions. Agric. Water Manag. 2017, 180, 13–21. [Google Scholar] [CrossRef]
  29. Wang, R.S.; Kang, Y.H.; Wan, S.Q.; Hu, W.; Liu, S.P.; Liu, S.H. Salt distribution and the growth of cotton under different drip irrigation regimes in a saline area. Agric. Water Manag. 2011, 100, 58–69. [Google Scholar] [CrossRef]
  30. Wang, R.S.; Wan, S.Q.; Sun, J.X.; Xiao, H.J. Soil salinity, sodicity and cotton yield parameters under different drip irrigation regimes during saline wasteland reclamation. Agric. Water Manag. 2018, 209, 20–31. [Google Scholar] [CrossRef]
  31. Wang, Z.H.; Liao, R.K.; Lin, H.; Jiang, G.J.; He, X.L.; Wu, W.Y.; Lili, Z.Z. Effects of drip irrigation levels on soil water, salinity and wheat growth in North China. Int. J. Agric. Biol. Eng. 2018, 11, 146–156. [Google Scholar] [CrossRef]
  32. Kumar, P.; Sarangi, A.; Singh, D.K.; Parihar, S.S. Evaluation of AquaCrop model in predicting wheat yield and water productivity under irrigated saline regimes. Irrig. Drain. 2014, 63, 474–487. [Google Scholar] [CrossRef]
  33. Supit, I.; Hooijer, A.A.; van Diepen, C.A. System Description of the WOFOST 6.0 Crop Simulation Model Implemented in CGMS, Vol. 1: Theory and Algorithms; Joint Research Centre, Commission of the European Communities: Luxembourg, 1994; p. 146. [Google Scholar]
  34. Van Dam, J.C.; Huygen, J.; Wesseling, J.G.; Feddes, R.A.; Kabat, P.; Van Walsum, P.; Groenendijk, P.; van Diepen, C.A. Theory of SWAP Version 2.0; Simulation of Water Flow, Solute Transport and Plant Growth in the Soil-Water-Atmosphere-Plant Environment; DLO Winand Staring Centre: Wageningen, The Netherlands, 1997. [Google Scholar]
  35. Allen, R.G.; Pereira, L.S.; Raes, D.; Smith, M. Crop evapotranspiration-Guidelines for computing crop water requirements-FAO Irrigation and drainage paper 56. FAO Rome 1998, 300, D5109. [Google Scholar]
  36. Guang, M.L.; Jing, S.Y.; Rong, J.Y. Chemical factors to electrical conductivity of soil extract and their intensity. Acta Pedol. Sinica 2005, 2, 247–252. (In Chinese) [Google Scholar]
  37. Sun, G.F.; Zhu, Y.; Ye, M.; Yang, J.Z.; Qu, Z.Y.; Mao, W.; Wu, J.W. Development and application of long-term root zone salt balance model for predicting soil salinity in arid shallow water table area. Agric. Water Manag. 2019, 213, 486–498. [Google Scholar] [CrossRef]
  38. Wang, F.; Sun, J.; Liu, Z.; Ning, H.; Qiang, X.; Shen, X. Effect of different irrigation scheduling on salt distribution and leaching in cotton field. Trans. Chin. Soc. Agric. Mach. 2013, 44, 120–127. (In Chinese) [Google Scholar]
  39. Zhang, Z.Y.; Guo, X.P. Dynamic response model of crop to water-salinity. J. Hydraul. Eng. 1998, 12, 66–70. (In Chinese) [Google Scholar]
  40. Hu, M. Mechanisms and Simulation for Two Representative Desert Shrubs Response to Water and Salt Stress in Arid Region. Ph.D. Thesis, China Agricultural University, Beijing, China, November 2010. (In Chinese). [Google Scholar]
  41. Zhu, Z.D. Principles and Applications of Drainage, II. Theory of Field Drainage and Runoff; Agriculture Press: Beijing, China, 1981. (In Chinese) [Google Scholar]
  42. Luo, H.H.; Zhang, Y.L.; Zhang, W.F. Effects of water stress and rewatering on photosynthesis, root activity, and yield of cotton with drip irrigation under mulch. Photosynthetica 2016, 54, 65–73. [Google Scholar] [CrossRef]
  43. Larcher, W. Physiological Plant Ecology: Ecophysiology and Stress Physiology of Functional Groups; Springer Science & Business Media: Berlin, Germany, 2003. [Google Scholar]
  44. Mahajan, S.; Tuteja, N. Cold, salinity and drought stresses: An overview. Arch. Biochem. Biophys. 2005, 444, 139–158. [Google Scholar] [CrossRef]
  45. Zhu, J. Plant salt tolerance. Trends Plant Sci. 2001, 6, 66–71. [Google Scholar] [CrossRef]
  46. Munns, R.; Tester, M. Mechanisms of Salinity Tolerance. Annu. Rev. Plant Biol. 2008, 59, 651–681. [Google Scholar] [CrossRef] [Green Version]
  47. Abdelraheem, A.; Esmaeili, N.; O’Connell, M.; Zhang, J. Progress and perspective on drought and salt stress tolerance in cotton. Ind. Crop. Prod. 2019, 130, 118–129. [Google Scholar] [CrossRef]
  48. Zonta, J.H.; Brandao, Z.N.; Rodrigues, J.I.D.S.; Sofiatti, V. Cotton response to water deficits at different growth stages. Rev. Caatinga 2017, 30, 980–990. [Google Scholar] [CrossRef] [Green Version]
  49. Longenecker, D.E. The influence of high sodium in soils upon fruiting and shedding, boll characteristics, fiber properties, and yields of two cotton species. Soil Sci. 1974, 118, 387–396. [Google Scholar] [CrossRef]
  50. Fowler, J.L. Salinity and Fruiting; The Cotton Foundation: Memphis, TN, USA, 1986; pp. 107–111. [Google Scholar]
  51. Feng, D.; Zhang, J.P.; Sun, J.S.; Zheng, C.L.; Cao, C.Y.; Li, K.J.; Liu, Z.G. Cotton salt tolerance appraisal indices and eigenvalue under border irrigation with saline water. Trans. Chin. Soc. Agric. Eng. 2012, 28, 52–57. (In Chinese) [Google Scholar]
  52. Feng, D.; Zhang, J.P.; Sun, C.T.; Dang, H.K.; Liu, H.; Ning, H.F.; Sun, J.S.; Li, K.J. Responses of cotton growth and water physiological indices to salt stress at different growing stages. Chin. J. Ecol. 2014, 33, 1195–1199. (In Chinese) [Google Scholar]
  53. Pearson, K.E.; Bauder, J.W.; Warrance, N.J. The Basics of Salinity and Sodicity Effects on Soil Physical Properties; Montana State University: Bozeman, MO, USA, 2006; pp. 1–11. [Google Scholar]
  54. Yang, M.; Wang, G.; Lazin, R.; Shen, X.; Anagnostou, E. Impact of planting time soil moisture on cereal crop yield in the Upper Blue Nile Basin: A novel insight towards agricultural water management. Agric. Water Manag. 2020, 243, 106430. [Google Scholar] [CrossRef]
  55. Ali, M.H.; Hoque, M.R.; Hassan, A.A.; Khair, A. Effects of deficit irrigation on yield, water productivity, and economic returns of wheat. Agric. Water Manag. 2007, 92, 151–161. [Google Scholar] [CrossRef]
  56. Wang, Q.; Huo, Z.; Zhang, L.; Wang, J.; Zhao, Y. Impact of saline water irrigation on water use efficiency and soil salt accumulation for spring maize in arid regions of China. Agric. Water Manag. 2016, 163, 125–138. [Google Scholar] [CrossRef]
  57. Stewart, J.I.; Hagan, R.M. Functions to predict effects of crop water deficits. J. Irrig. Drain. Div. 1973, 99, 421–439. [Google Scholar]
  58. García Vila, M.; Fereres, E.; Mateos, L.; Orgaz, F.; Steduto, P. Deficit Irrigation Optimization of Cotton with AquaCrop. Agron. J. 2009, 101, 477–487. [Google Scholar] [CrossRef]
  59. Tan, S.; Wang, Q.J.; Zhang, J.H.; Chen, Y.; Shan, Y.Y.; Xu, D. Performance of AquaCrop model for cotton growth simulation under film-mulched drip irrigation in southern Xinjiang, China. Agric. Water Manag. 2018, 196, 99–113. [Google Scholar] [CrossRef]
  60. Patell, R.M.; Prasher, S.O.; Donnelly, D.; Bonnell, R.B. Effect of initial soil salinity and subirrigation water salinity on potato tuber yield and size. Agric. Water Manag. 2001, 46, 231–239. [Google Scholar] [CrossRef]
  61. Selim, T.; Berndtsson, R.; Persson, M.; Somaida, M.; El-Kiki, M.; Hamed, Y.; Mirdan, A.; Zhou, Q.Y. Influence of geometric design of alternate partial root-zone subsurface drip irrigation (APRSDI) with brackish water on soil moisture and salinity distribution. Agric. Water Manag. 2012, 103, 182–190. [Google Scholar] [CrossRef]
  62. Zhao, X.N.; Othmanli, H.; Schiller, T.; Zhao, C.; Sheng, Y.; Zia, S.; Müller, J.; Stahr, K. Water use efficiency in saline soils under cotton cultivation in the Tarim River Basin. Water 2015, 7, 3103–3122. [Google Scholar] [CrossRef]
  63. Chen, J.L. Modeling Fruit Growth and Sugar Accumulation and Optimizing Irrigation Schedule to Improve Water Use Efficiency and Fruit Quality of Tomato. Ph.D. Thesis, China Agricultural University, Beijing, China, November 2016. (In Chinese). [Google Scholar]
  64. Chen, W.P.; Hou, Z.N.; Wu, L.S.; Liang, Y.C.; Wei, C.Z. Evaluating salinity distribution in soil irrigated with saline water in arid regions of northwest China. Agric. Water Manag. 2010, 97, 2001–2008. [Google Scholar] [CrossRef]
  65. Chen, W.L.; Jin, M.G.; Ferré, T.P.A.; Liu, Y.F.; Xian, Y.; Shan, T.R.; Ping, X. Spatial distribution of soil moisture, soil salinity, and root density beneath a cotton field under mulched drip irrigation with brackish and fresh water. Field Crop. Res. 2018, 215, 207–221. [Google Scholar] [CrossRef]
  66. Zhao, B. Study on Control Indicator of Automatic Irrigation about Cotton under Film Drip Irrigation. Master’s Thesis, Shihezi University, Shihezi, China, January 2017. (In Chinese). [Google Scholar]
  67. Wang, Z.H.; Zhou, B.; Pei, L.; Zhang, J.Z.; He, X.L.; Lin, H. Controlling threshold in soil salinity when planting spring wheat and sequential cropping silage corn in Northern Xinjiang using drip irrigation. Int. J. Agric. Biol. Eng. 2018, 11, 108–114. [Google Scholar] [CrossRef] [Green Version]
  68. Mmolawa, K.; Or, D. Root zone solute dynamics under drip irrigation: A review. Plant Soil 2000, 222, 163–190. [Google Scholar] [CrossRef]
  69. Manjunatha, M.V.; Oosterbaan, R.J.; Gupta, S.K.; Rajkumar, H.; Jansen, H. Performance of subsurface drains for reclaiming waterlogged saline lands under rolling topography in Tungabhadra irrigation project in India. Agric. Water Manag. 2004, 69, 69–82. [Google Scholar] [CrossRef]
Figure 1. Outline of the study. Note: the dotted boxes represent the parameters in the model that need to be calibrated by the experimental data. SY,max and SY,min are the critical and maximum soil salinity which affect the yield at different growth stages, respectively; Set,max and Set, min are the critical and maximum soil salinity which affect ET at different growth stages, respectively; ETas are the actual evapotranspiration; W and S are soil moisture content and soil salt content, respectively; Wp is the critical water content at different growth stage; a and b are exchange coefficients of capillary rise and drainage, respectively; f and β are the leaching and capillary rise coefficient.
Water 12 02449 g001
Figure 2. (a) Lysimeters where the experiment was carried out; (b) schematic diagram of the experimental site (the gray in this figure indicates the lysimeters that were not used). Note: I-1 represents the first experimental field in Field One and so on.
Water 12 02449 g002
Figure 3. Modeled and measured values for comparison: (a) yield (Y), (b) soil water content (θ), (c) soil salt content (S).
Water 12 02449 g003
Figure 4. Relationship between Yr (relative yield) () and S’ (total salt content of soil) and W’ (available water for the entire crop growth period) in different scenarios.
Water 12 02449 g004
Figure 5. Change in relative yield (Yr) with respect to W’: (a) when S0 = 6 g kg−1 and K = 3 g L−1 and when S0 = 10 g kg−1 and K = 3 g L−1; (b) when S0 = 6 g kg−1 and K = 3 g L−1 for different values of W0; (c) when S0 = 10 g kg−1 and K = 3 g L−1 for different values of W0. Note: W’ is available water for the entire crop growth period; S0 is initial soil salt content; K is irrigation water salinity level; W0 is initial soil moisture content.
Water 12 02449 g005
Figure 6. (a) Relationship between Yr and S’ when M = 500 mm and W0 = 0.85θfc; (b) relationship between Yr and S’ when M = 500 mm and W0 = 0.85θfc for different S0.
Water 12 02449 g006
Figure 7. Relationship between relative yield decrease and S’ and W’.
Water 12 02449 g007
Figure 8. Dynamic thresholds of soil moisture content in the root zone at different growth stages when W0 = 0.85θfc: at the beginning of (a) the growth stages, (b) the bud stage, (c) the flowering–boll stage, (d) the boll-opening stage, (e) at the end of the growth stages.
Water 12 02449 g008
Figure 9. Dynamic thresholds of soil salt content in the root zone at different growth stages when W0 = 0.85θfc: at the beginning of (a) the growth stages, (b) the bud stage, (c) the flowering–boll stage, (d) the boll-opening stage, (e) at the end of the growth stages.
Water 12 02449 g009
Figure 10. Dynamic thresholds of soil water content and salinity in the root zone for different scenarios: (a) W0 = 0.85θfc, M = 200 mm, K = 0 g L−1; (b) W0 = 0.85θfc, M = 550 mm, K = 9 g L−1; (c) W0 = 0.85θfc, M = 400 mm, K = 3 g L−1; (d) W0 = 0.85θfc, M = 400 mm, K = 0 g L−1; W2, W4, W6, W8 and W10 and S2, S4, S6, S8 and S10 are soil moisture content and salinity when S0 = 2, 4, 6, 8 or 10 g kg−1.
Water 12 02449 g010
Figure 11. Salt accumulation under different scenarios: (a) W0 = 0.7θfc; (b) W0 = 0.85θfc; (c) W0 = θfc; % salt accumulation = (soil salt content at end of growth period−soil salt content at beginning of growth period)/soil salt content at beginning of growth period) × 100. Purple areas in the figure represent desalinated soil.
Water 12 02449 g011
Table 1. Parameter fitting of the modified Jensen model and the soil water and salt balance modules.
ModuleParameterSeedling StageBud StageFlowering–Boll StageBoll-Opening Stage
Modified Jensen modelλ−0.1500.2020.4110.166
σ0.1210.0510.29−0.683
SY,min (g kg−1)6.647.378.148.53
SY,max (g kg−1)21.0122.1924.6927.87
Water balance moduleρ0.70.980.810.78
Set,min (g kg−1)4.515.485.805.88
Set,max (g kg−1)25.017.928.025.0
θp (cm3 cm−3)0.245
a0.561
b−0.635
Salt balance modulef0.2
β1.4
Table 2. Model prediction accuracy for yield (Y), soil water content (θ), and soil salt content (S).
VariableYearR2RMSEnRMSE (%)
YieldCalibration0.8270.70824.4
(t ha−1)Validation0.914 0.57720.4
Soil water content
(cm3 cm−3)
20080.7530.04015.0
20090.7470.04918.1
20100.6810.03614.9
Soil salt content
(g kg−1)
20080.0121.64916.2
20090.6571.69016.0
20100.485 1.84318.6
Note: R2 is the coefficient of determination; RMSE is root mean square error; and nRMSE is normalized root mean square error.

