Article

Internal Erosion Failure of Uniform Sands under Confinement and Constricted Seepage Exit

1
Department of Soil and Water Conservation, National Chung Hsing University, Taichung 402, Taiwan
2
U.S. Bureau of Reclamation, Denver, CO 80225, USA
*
Author to whom correspondence should be addressed.
Water 2020, 12(9), 2417; https://doi.org/10.3390/w12092417
Submission received: 6 August 2020 / Revised: 20 August 2020 / Accepted: 26 August 2020 / Published: 28 August 2020
(This article belongs to the Section Hydrology)

Abstract

:
Seepage water may move soil particles and cause internal erosion of soils, leading to sinkholes and the collapse of embankments and slopes. To account for the effects of confinement and constricted seepage exit, a test apparatus was developed to study the internal erosion of granular soils under various confining pressures, particle sizes, and sizes of the seepage exit opening. As indicated in the literature, the behavior of internal erosion has been largely studied by laboratory experiments and field investigations, and mechanical models that help describe the failure mechanism of internal erosion are less prevalent. A hydro-mechanical model that incorporates the fluid drag force and the shear strength of soil was therefore developed for quantifying the internal erosion experiments conducted in this study. The experimental results showed that the greater the confining pressure or the particle size, the greater the critical velocity; the greater the seepage exit opening, the smaller the critical velocity. The critical velocity predicted by the proposed hydro-mechanic model compares reasonably well with the experimental data. In addition to the confining pressure, particle size, and size of the seepage exit opening, the proposed model also showed that the friction angle and porosity of the soil are factors influencing the critical velocity, which is consistent with the experimental findings of this study.

1. Introduction

The detachment and transport of soil particles due to seepage-induced internal erosion have been attributed to the failures of embankment dams and foundations of buildings. In fact, according to the statistics compiled by the International Commission on Large Dams [1], 46% of known embankment dam failures over the world were caused by internal erosion. Three modes of internal erosion behavior have been identified: (1) backward erosion piping, (2) concentrated leak erosion, and (3) suffusion [2]. Richards and Reddy [2] mentioned that backward erosion piping occurs with seepage through intergranular flow in which a pipe develops progressively toward the upstream source of the seepage, and the concentrated leak erosion occurs along soil–structure openings or cracks through an embankment. Suffusion occurs in internally unstable or gap graded non-plastic soils when the finer soil particles are transported by the seepage water through the pores of the coarser soil particles; the term “internal stability” has been defined in the literature as the ability to prevent the loss of fine particles due to seepage flow. Hillslope failure can also be induced by seepage erosion; small-scale model tests and numerical analyses were performed by Crosta and di Prisco [3], and they found that the slope failure of a fluvial terrace was caused by the concentrated groundwater flow. Internal erosion due to seepage has also been recognized as a contributing factor in the potential failure of streambanks; Chu-Agor et al. [4] devised a laboratory physical model to evaluate tension failure and bank undercutting under seepage and found that these failure mechanisms were controlled largely by the soil’s bulk density, effective cohesion, friction angle, and critical shear stress.
Factors influencing the internal erosion of soil due to seepage flow include hydraulic gradient, flow velocity, flow direction, stress, particle size, grain size distribution, pore size, constricted size, etc. [5,6]. Different laboratory apparatuses have been developed by various researchers to study the behavior of internal erosion failure of soil. Tomlinson and Vaid [7] developed a permeameter and tested various granular filter and base soil combinations under variable confining pressures to determine critical gradient for internal erosion. Chang and Zhang [8] developed a stress-controlled erosion apparatus to investigate the initiation of suffusion, and they showed that the maximum erosion rate, the variation in permeability, and the total deformation of the soil specimen increase with increasing deviatoric stress; as a result of suffusion, the stress–strain behavior of a particular soil specimen changed from dilative to contractive. Richards and Reddy [2] designed a true triaxial internal erosion test apparatus to study backward erosion piping in the soil; they found that the critical velocity (velocity that initiates internal erosion) was influenced by the initial void ratio, stresses (i.e., confining pressure, intermediate stress, major principal stress), and the seepage angle.
In general, a poorly graded soil is more resistant to internal erosion. Many criteria have been proposed to assess the internal erosion susceptibility according to grain size distribution [8,9,10]. Seepage energy has also been proposed to evaluate internal erosion potential [11,12]. Internal erosion should be associated with hydraulics and stress conditions as the seepage force is a body force and that the soil strength is stress-dependent; although the influence of stress conditions is generally not considered in practice. Nevertheless, mechanics-based approaches have also been proposed to help explain the occurrence of internal erosion in soils [5,13,14,15]. In recent years, numerical analyses utilizing the discrete element method have also been applied in evaluating internal erosion failure [16,17]. Discrete element method analyses have revealed the soil particle arrangement interaction and the development of force chains in terms of the micro-mechanics for internal erosion.
The concentrated leak erosion is a common internal erosion failure mode [2]. Rice et al. [18] designed a laboratory test to evaluate internal erosion behavior due to concentrated seepage flow and stated that the initiation of erosion is a complex mechanism involving hydraulics and soil mechanics principles. In particular, soil arching is a factor that influences the initiation of internal erosion failure. Similar to the test setup of Rice et al., most internal erosion laboratory tests do not involve confining pressure. The confining pressure near the ground surface is relatively low; however, confining pressure increases with depth. Internal erosion of soil occurs not only near the ground surface, but it also occurs at depths where the confining pressure is relatively high. As is the case of the backward erosion piping in an embankment dam, piping initiates at the downstream toe near the ground surface and erodes progressively upstream toward the seepage source; the confining pressure at the interior or foundation of the dam where the piping has developed is significantly higher than the confining pressure at the toe.
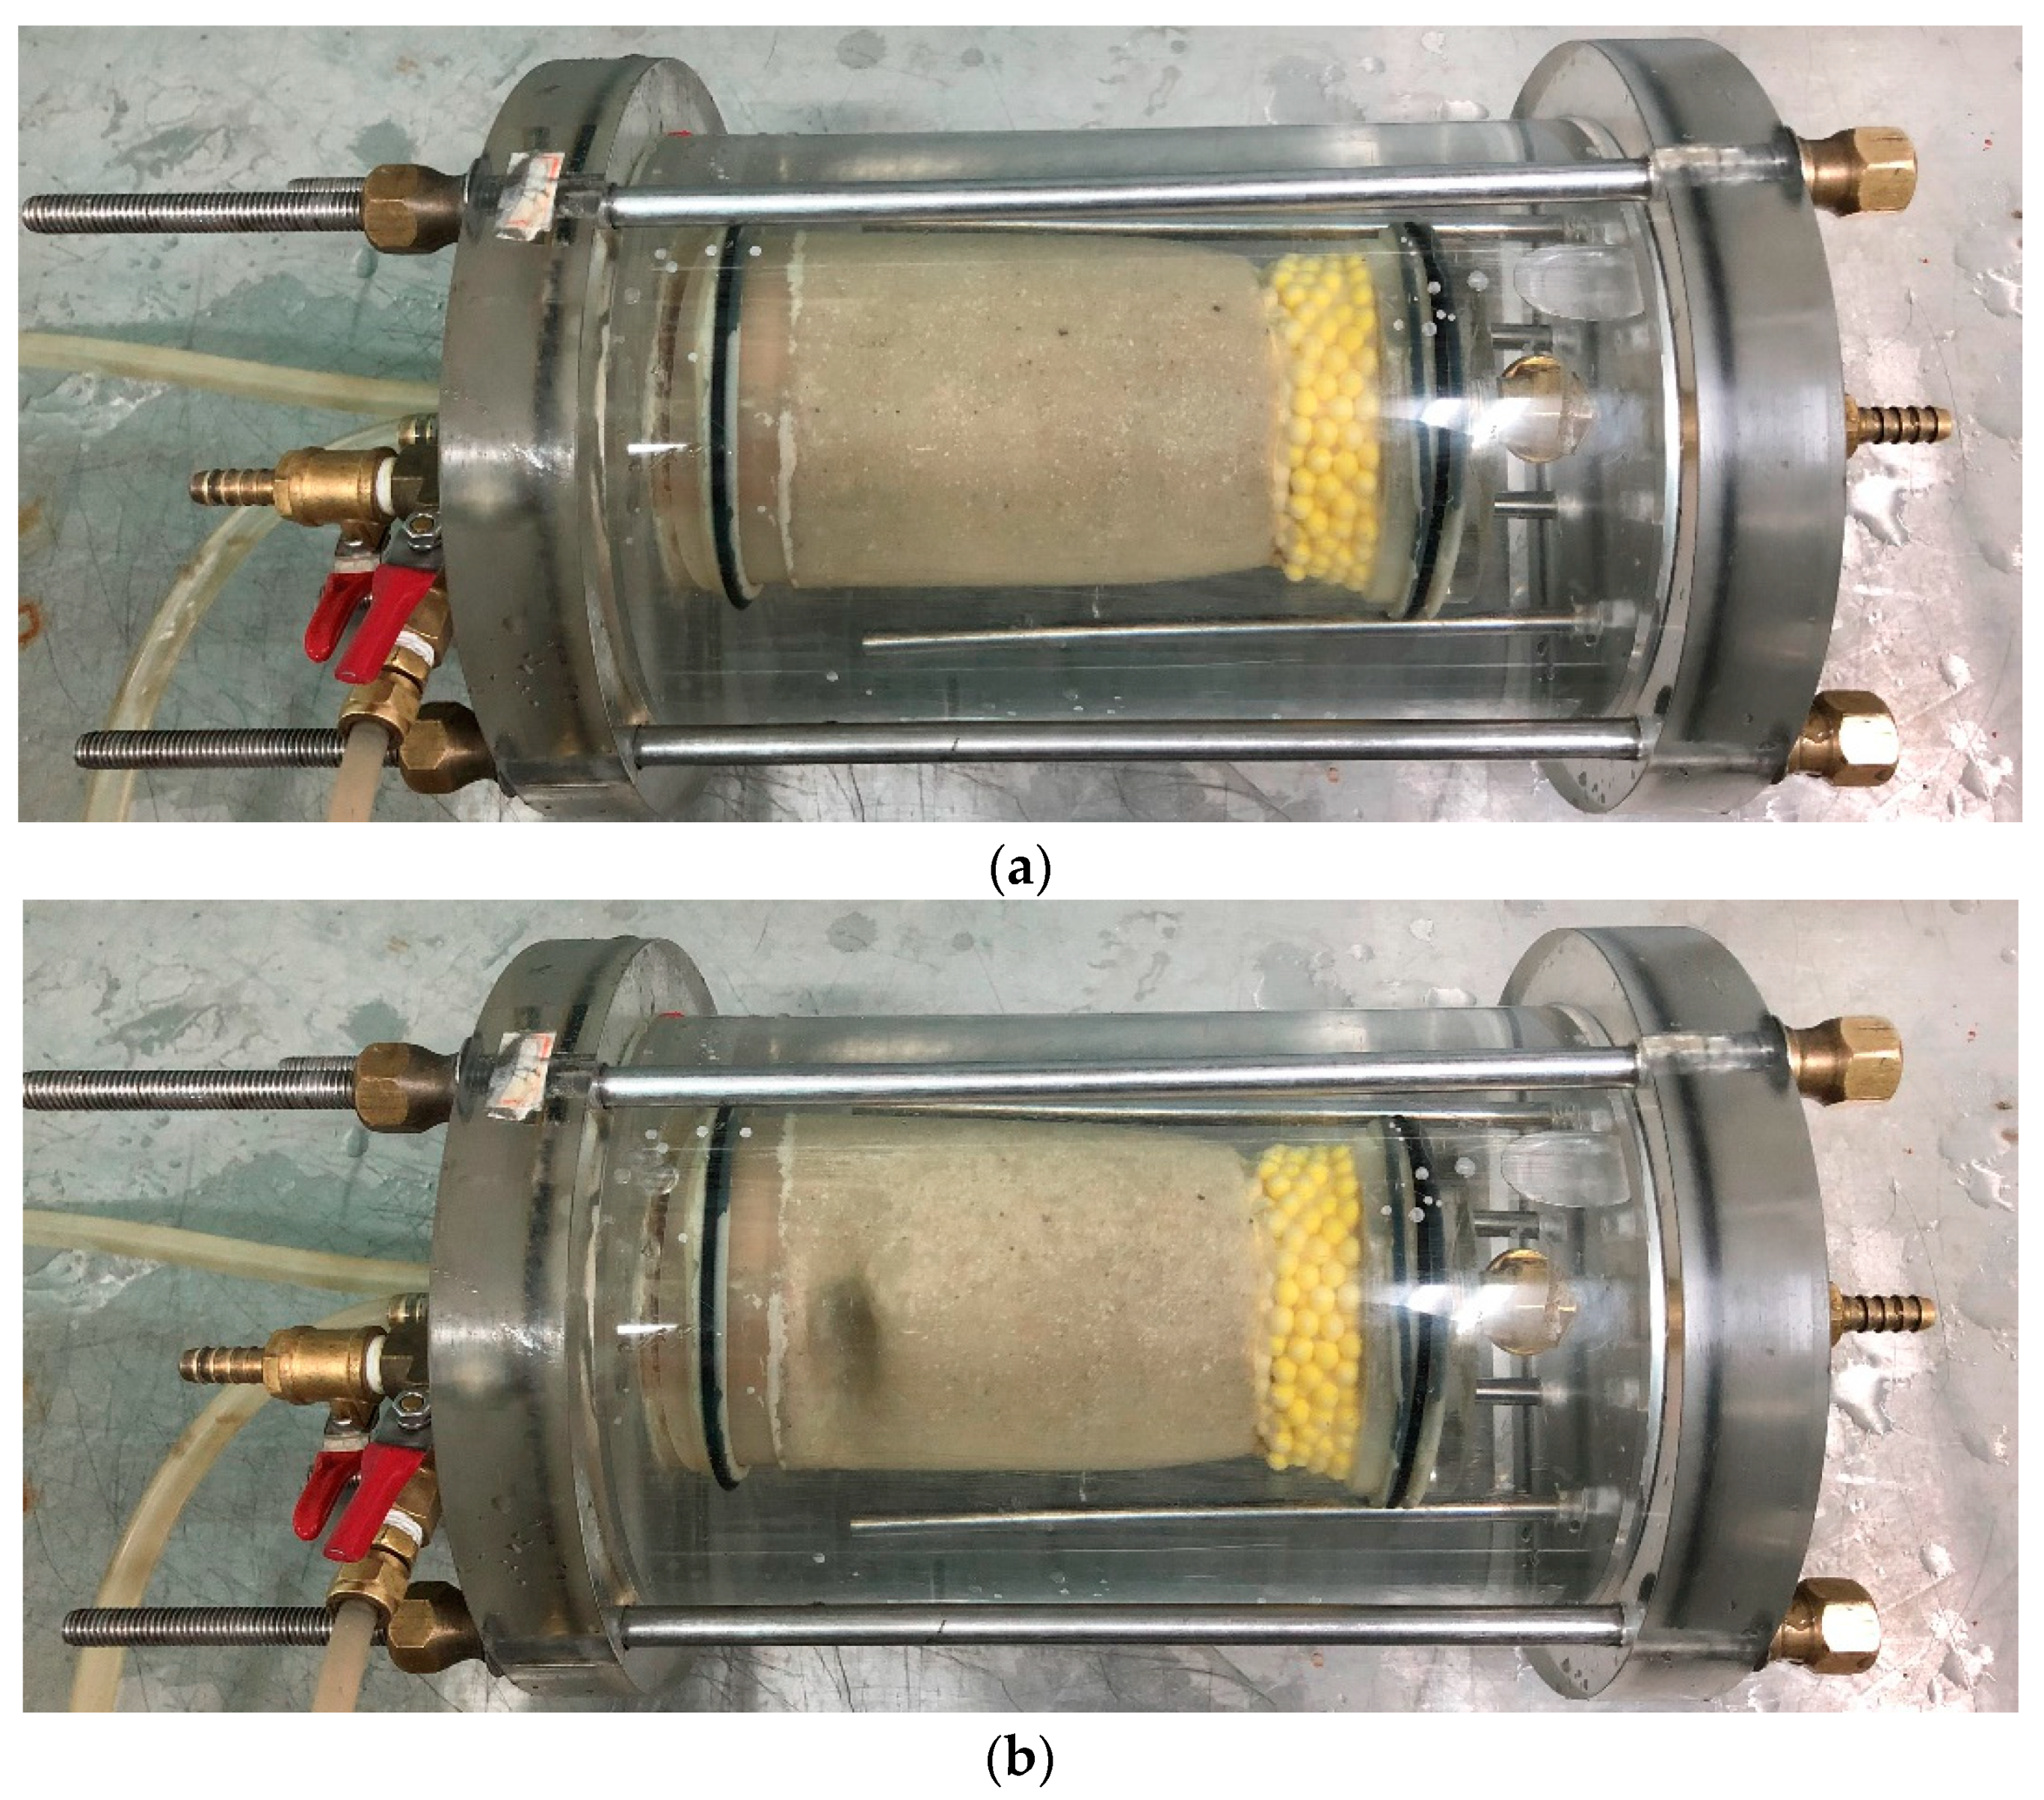
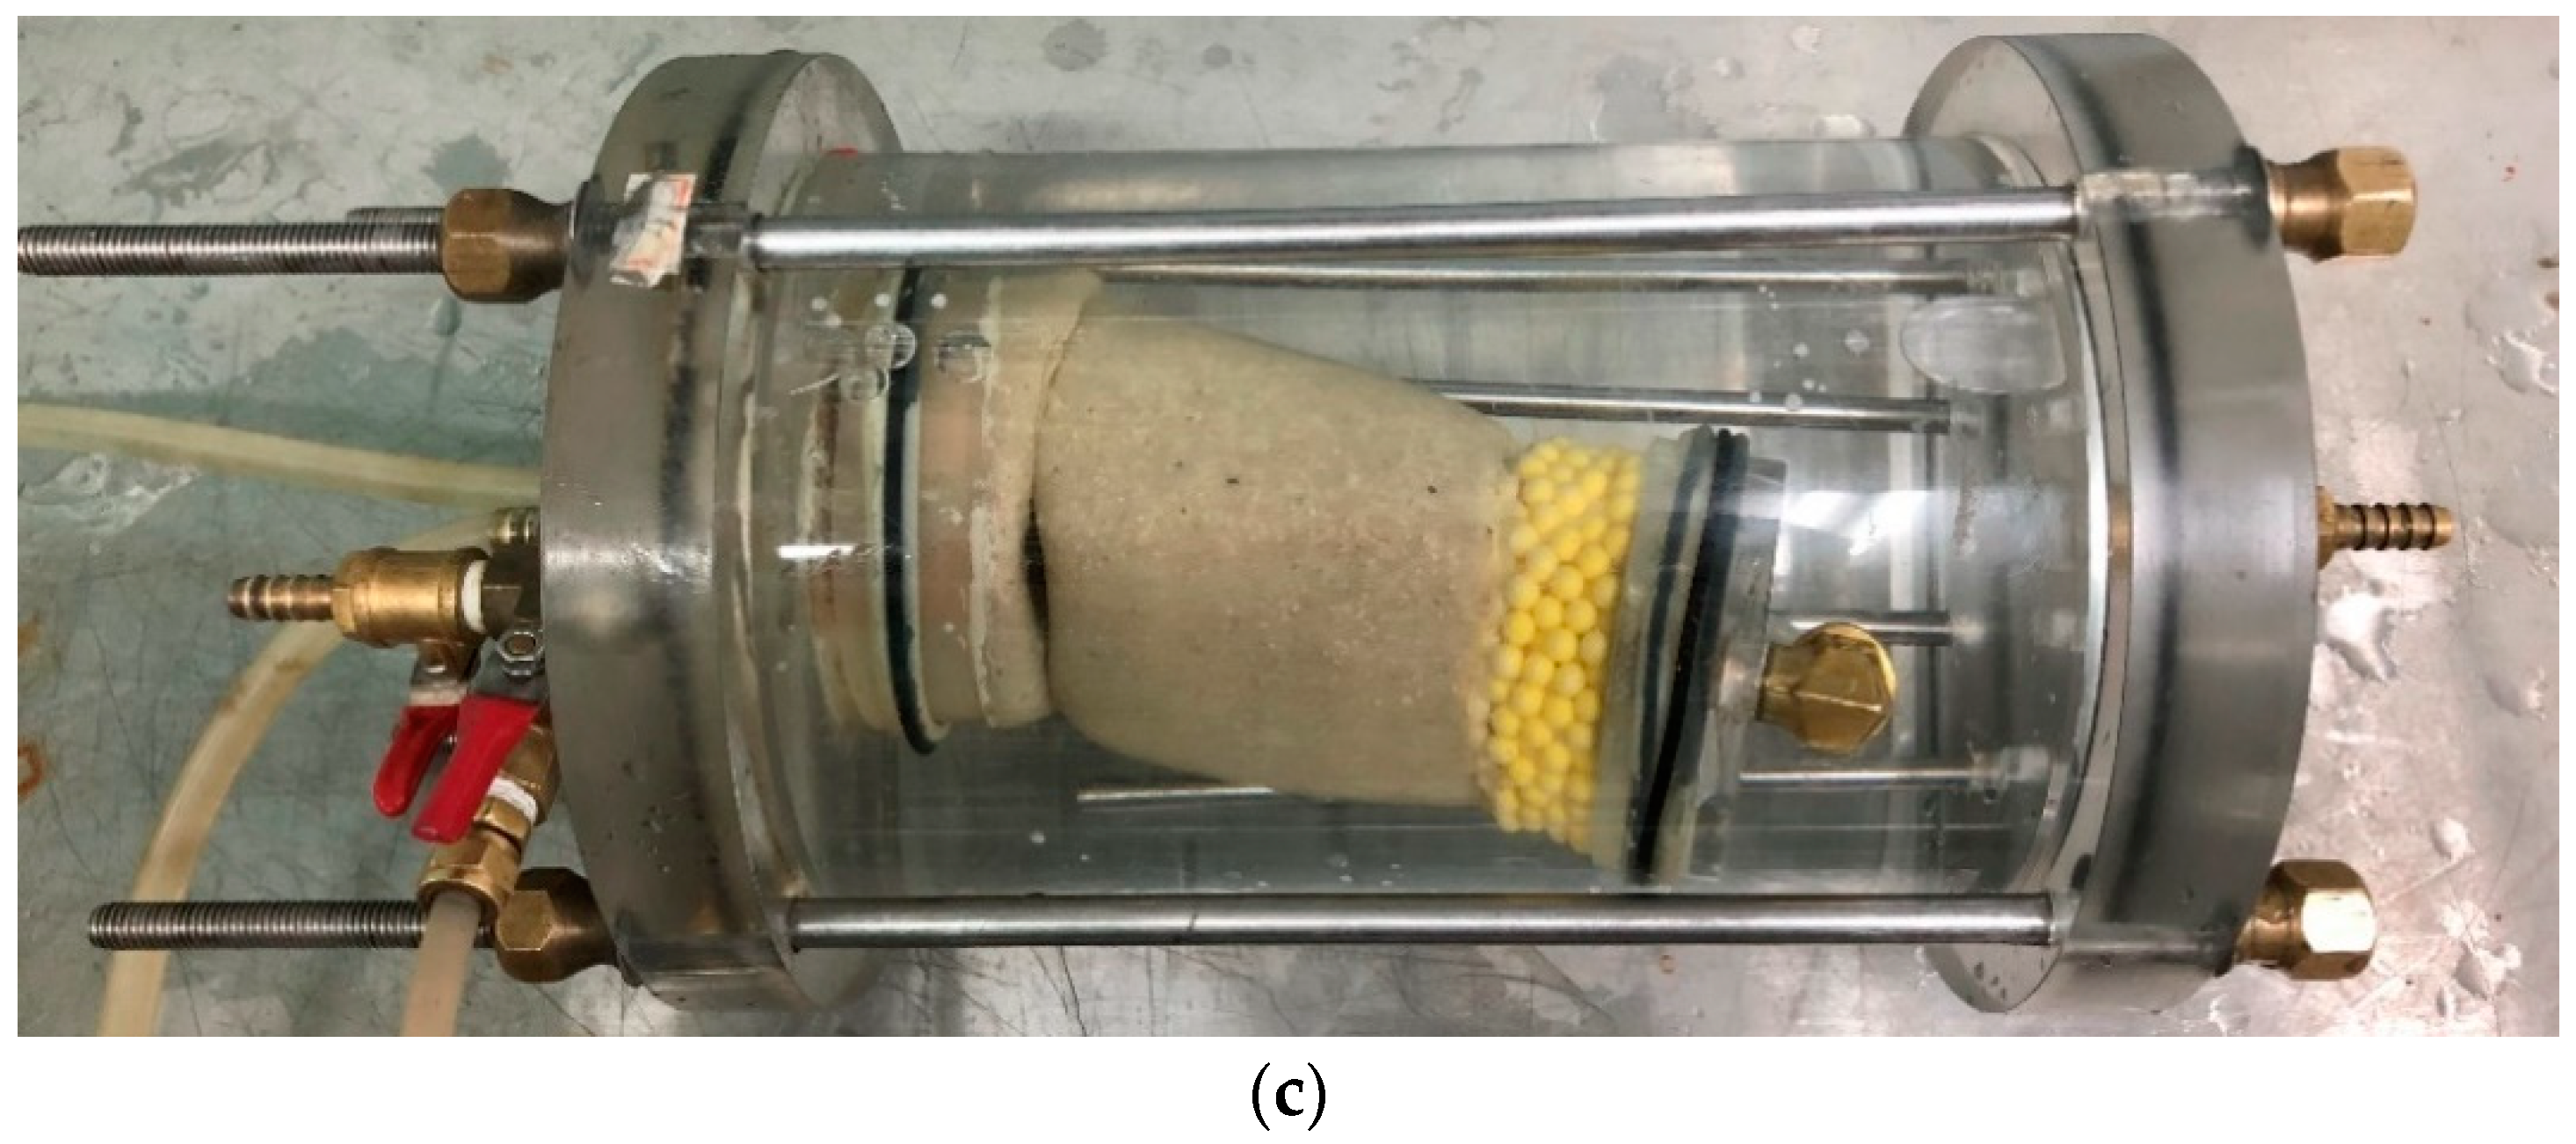
In light of the confining pressure and the concentrated leak erosion, a laboratory test apparatus was developed in this study to evaluate the internal erosion failure of sands under confinement with concentrated seepage flow. The experimental results showed that the critical velocity (i.e., the discharge velocity when the internal erosion failure occurs) is affected by the confining pressure, particle size, and the size of opening at the seepage exit. In addition, by incorporating the fluid drag force of the sand particles due to seepage and the Mohr–Coulomb failure criterion, a hydro-mechanical model was developed to help describe the initiation of internal erosion. The critical velocities predicted from the hydro-mechanical model were compared with the experimental results to evaluate its effectiveness. In general, it was found that the critical velocity predicted by the proposed hydro-mechanical model showed good accuracy with the experimental data.

2. Experimentation Setup

2.1. Test Apparatus

Based on the concepts of Chang and Zhang [8], a new internal erosion test apparatus was developed for implementing confining pressures. The schematic of the test apparatus is shown in Figure 1. In the test apparatus, a high-head cell is connected to the right side (upstream) of the specimen. The soil sample is located in the specimen cell, and the confinement is supplied by the confining pressure cell. Both the high-head cell and the confining pressure cell provided pressurized water. A low-head reservoir is connected to the left side (downstream) of the specimen. To reduce the effects of self-weight on the internal erosion failure, the specimen was laid horizontally during the test and was subjected to the horizontal seepage flow. The applied confining pressure ranged from 20 to 80 kPa. Four sizes of seepage exit opening were evaluated: 0.4 cm, 1 cm, 2 cm, and 3 cm. Three uniform sub-rounded quartz sands were used for testing, and the d 50 ’s are 0.091 mm, 0.338 mm, and 0.725 mm. The particle size distribution curves of the three sands are shown in Figure 2. The influences of confining pressure, particle size, and size of seepage exit opening on the critical velocity for the initiation of internal erosion were systematically evaluated in this study.

2.2. Specimen Preparation

The specimen preparation is similar to that of triaxial testing. During the specimen preparation, the specimen cell was set in the upright position. The specimens were prepared such that each sample of the designated particle size had the same dry mass and hence identical unit weight and porosity. The physical properties of the three quartz sands are summarized in Table 1. The friction angles of the three sands, also presented in Table 1, were obtained from the triaxial compression tests with confining pressures ranged from 20 to 80 kPa.
The constricted seepage exit is controlled by the circular opening in the wooden plug, which was fitted at the base pedestal of the specimen cell as shown in Figure 3a. A steel mesh with an opening of 2.4 mm was placed on top of the wooden plug, which was overlaid by a wash-away Avalon film. The wash-away film helped retained the sand particles during the pluviation process. The wash-away film dissolves under running water, and once dissolved it does not impede the seepage water during testing. A rubber membrane was secured to the base pedestal with an O-ring, and the top end of the rubber membrane was folded over the two-part split molds. Sand was then pluviated inside the rubber membrane. A thin layer of high porosity sponge overlaid by 6 mm diameter plastic beads was placed on top of sand specimen to help evenly distribute the upstream flow of water during the erosion test. A layer of standard sieve no. 200 mesh was placed between the plastic beads and the top platen. Subsequently, the rubber membrane was unrolled from the split molds and lapped onto the top platen; an O-ring was fastened tightly around the rubber membrane at the top platen. A vacuum of 24 kPa was applied to the sand specimen prior to the removal of the split molds. The specimen under vacuum confinement is shown in Figure 3b. Each specimen had a diameter of 7 cm and a height, including the specimen and plastic beads, of 14 cm. The specimen preparation was completed by encasing the specimen with the Lucite cylinder and the top plate. The complete assembly of specimen cell is shown in Figure 3c.

2.3. Saturation and Internal Erosion Failure

Once the specimen cell was assembled, the chamber was filled with water; after which, low confining pressure was applied to stabilize the specimen. The specimen cell was then laid horizontally, and the vacuum inside the specimen was released. The specimen was saturated with water flowing from the low head reservoir by gravity; the water flowed from the wooden plug opening at the base pedestal to the top platen (from the left end to the right end of the specimen as shown in Figure 1), which resulted in a wetting fringe moving slowly from the left end to the right end of the specimen. The flow of water was continued as it exited the drainage tube attached to the top platen. The specimen was considered saturated when the water exiting the specimen appeared steady and showed no signs of air bubble. The valves connected to the left and right drainage tubes were closed to preserve the saturated condition. The left drainage tube was then connected to a flask for the purpose of capturing sediments during the erosion test, and the flask was connected to the low head reservoir. The right drainage tube was connected to the high head cell. The valve connected to the low head reservoir was opened first and was followed by the opening of the valve connected to the high head cell. The confining pressure in the specimen cell chamber was then increase to the designated level.
It should be noted that the applied confining pressure is close to the effective confining pressure for the soil near the seepage exit. The elevation difference between the low head reservoir and the seepage exit is 25 cm; hence the pore pressure around the seepage exit is very small at about 2.5 kPa. It is therefore reasonable to assume that the effective confining pressure is approximately the same as the applied confining pressure.
The internal erosion test was performed by increasing the water pressure in the high head cell, which progressively increased the seepage velocity within the specimen. The critical velocity corresponded to the initiation of internal erosion, whereby the sand particles were eroded continuously. The flow rate was recorded during the test, and the critical velocity was calculated knowing the flow rate and the area of the seepage exit opening. For the subsequent confining pressure test, the high head pressure that caused the previous failure was set as the initial high head pressure for the test. For example, high head pressure that caused the failure of the 20 kPa confining pressure test was used as the initial high head pressure for the 30 kPa confining pressure test. Typically, the internal erosion failure of a test occurred in less than a minute. To ensure repeatability and accuracy of the testing program, each test was repeated three times. The representative critical velocity was taken as the average of the three tests.

3. Experimental Results

3.1. Initiation of Internal Erosion

In reference to the test schematic shown in Figure 1, the seepage water entered the sand specimen from the right or upstream end (high head cell). By increasing the high head pressure, the seepage velocity within the specimen increased as well. Higher seepage velocity occurred near the exit opening. The critical velocity was determined from the flow rate that produced continuous erosion of sand particles. This condition is consistent with the global critical state of internal erosion defined by Liang et al. [14], where a significant loss of soil particles occurs. When the seepage velocity reached the critical velocity, internal erosion of the specimen was initiated; sand particles adjacent to the exit opening were eroded, which resulted in a sinkhole. Multiple sinkholes were then developed near the seepage exit opening. Ultimately, a great portion of the downstream specimen was eroded away, and the specimen length was significantly reduced. Figure 4 depicts the progression of internal erosion failure. In particular, Figure 4b shows the initiation of internal erosion failure around the exit opening and the consequent sinkhole at the left end of the specimen. For the tests with the smallest seepage exit opening of 0.4 cm and the smallest particle size of 0.091 mm, after the initiation of internal erosion, an obvious sinkhole had developed. However, for tests with the smallest seepage exit opening and with larger particle sizes of 0.338 mm and 0.725 mm, after the initiation of internal erosion, the development of sinkhole was less conspicuous, and the amounts of eroded sand particles were also lower.

3.2. Effects of Confinement, Particle Size, and Size of Seepage Exit Opening

The variation of critical velocity with confining pressure for the four seepage exit opening sizes is presented in Figure 5. For a given particle size, it was observed that the greater the confining pressure, the higher is the critical velocity. The positive correlation between the confining pressure and the critical velocity is more pronounced in tests with particle sizes of 0.725 mm and 0.338 mm irrespective of the seepage exit opening size. The particle size of 0.091 mm and the seepage exit opening size of 0.4 cm (Figure 5a) show the pronounced correlation; however, correlation is less pronounced for the rest of the tests with the particle size of 0.091 mm and larger seepage exit opening sizes (Figure 5b–d). In terms of the slope (or the rate of change) of the correlation between critical velocity and confining pressure, tests with the particle size of 0.725 mm showed the highest rate of change, whilst tests with the particle size of 0.091 mm showed the least rate of change. For a given seepage exit opening size, the critical velocity increased markedly with increasing confining pressure for the particle sizes of 0.725 mm and 0.338 mm as compared to the particle size of 0.091 mm. In other words, the effects of confining pressure on the critical velocity are more pronounced for the larger size of particles than the smaller size of particles.
As shown in Figure 6, given a particle size and a confining pressure, it is observed that the greater the seepage exit opening, the lower is the critical velocity. Although the trend remains valid, for tests with the particle size of 0.091 mm, a small difference in critical velocity is observed for seepage exit openings of 2 cm and 3 cm (Figure 6a). From the experimental results, it was found that the critical velocity is influenced by the confining pressure, particle size, and the size of seepage exit opening. Particularly, a positive correlation is observed between the critical velocity and the particle size, and the positive correlation is also true between the critical velocity and the confining pressure. Conversely, a negative correlation is observed between the critical velocity and the size of seepage exit opening.

4. Hydro-Mechanical Model for Internal Erosion Failure

Moffat and Fannin [5] conducted permeameter experiments and found that the critical hydraulic gradient increases with vertical effective stress. Moffat and Herrera [13] considered vertical momentum balance and developed a model to determine the critical hydraulic gradient. Liang et al. [14] considered the static equilibrium and the moment equilibrium of a fine particle between coarse particles to derive critical hydraulic gradient under isotropic and anisotropic stress conditions. To help elucidate the experimental results for the internal erosion failure of uniform sands with confinement and constricted seepage exit, a hydro-mechanical model was developed in this study to estimate the critical velocity of sands. In saturated granular soil, internal erosion could occur due to the fluid drag force. In addition, since the shear strength of granular soils is overburden stress-dependent, granular soils under confinement are subjected to a higher resistance to the drag force; the critical velocity of granular soils for the initiation of internal erosion would depend on the fluid drag force of seepage water through the pores of the soils and the shear strengths of the soils. In contrast to the drag force experienced by a single particle, the fluid drag force of a particle in a fluid–multiparticle interaction system is affected by the flow field with neighboring particles. Di Felice [19] formulated the fluid drag force on a particle in the multiparticle system based on the Reynolds number and porosity. Kafui et al. [20] and Zhou et al. [21] revised the equations proposed by Di Felice and suggested the equation for the drag force F d of a single particle in the multiparticle system as:
F d = 1 8 C d   ρ f   π   d 2   v f 2   n χ + 1
where C d is the fluid drag coefficient, ρ f is the fluid density, d is the particle diameter, v f is the seepage velocity, and n is the porosity. The variable χ is defined by:
χ = ( 3.7 0.65   e x p [ ( 1.5 l o g R e ) 2 2 ] )
The fluid drag coefficient C d and the particle Reynolds number R e are obtained by:
C d = ( 0.63 + 4.8 R e ) 2
R e = n   ρ f   d   v f μ f
where μ f is the fluid viscosity. The variables χ and C d are related to the particle Reynolds number R e .
Xu et al. [22] and Liang et al. [23] conducted trapdoor tests to study soil arching effect with and without seepage conditions. The displacement and shear strain were measured using a particle image velocimetry technique. In particular, as trapdoor displacement became large, vertical slip surfaces were formed. Little shear strains or relative displacements were observed between the two vertical slip surfaces. The prismatic sliding mass with vertical sides was observed by Iglesia et al. [24] as well. Despite the two-dimensional trapdoor tests, the displacement mode of sands in the trapdoor tests is analogous to the experiments performed herein. As such, a cylindrical critical failure zone in the sand specimen of the internal erosion test was assumed to be located immediately upstream of the seepage exit opening (Figure 7).
The total number of sand particles N that occupy the cylindrical critical failure zone can be calculated knowing the volume of solids in the critical failure zone and the volume of the individual sand particle:
N = 3   ( 1 n )   D 2   L 2   d 3
where D is the diameter of the critical failure zone, L is the length of the critical failure zone, and d is the diameter of the individual sand particle. The total fluid drag force exerted in the critical failure zone can be estimated by summing the drag forces from the particles occupying the failure zone:
f d = f d × N = 1 8 ( 0.63 + 4.8 R e ) 2 ρ f π   d 2 v f 2 n ( 3.7     0.65 exp [ ( 1.5     l o g R e ) 2 2 ] ) + 1 ( 3 ( 1     n ) D 2 L 2 d 3 )
The shear strength of the granular soil is governed by the Mohr–Coulomb failure criterion as:
τ r = c + σ c   t a n ϕ
where c and ϕ are the cohesion and friction angle of the soil, respectively, and σ c is the effective confining pressure. For the internal erosion tests conducted in this study, the total confining pressure exerted on the specimen is considered as the effective confining pressure due to the very small pore water pressure experienced at the seepage exit. The fluid drag force exerted in the cylindrical critical failure zone is considered as the driving force, which is resisted by the shear force surrounding the boundary area of the cylindrical critical failure zone. At equilibrium, the driving force is equal to the resisting force:
f d = τ r   π   D   L
Based on Equations (7) and (8), the seepage velocity v f of the cylindrical failure zone at the verge of internal erosion failure is:
v f 2 = 2   ×   σ c   ×   t a n ϕ 1 8 · ( 0.63 + 4.8 R e ) 2   ×   ρ f   ×   n ( 3.7     0.65 e x p [ ( 1.5     l o g R e ) 2 2 ] ) + 1   ×   3 ( 1     n ) D d
Note that v f is a seepage velocity, which is the actual velocity of water through the voids, and it is related to the discharge velocity v as:
v = n   ×   v f
where n is the porosity of the soil [25].

5. Comparison between Predicted and Experimental Results

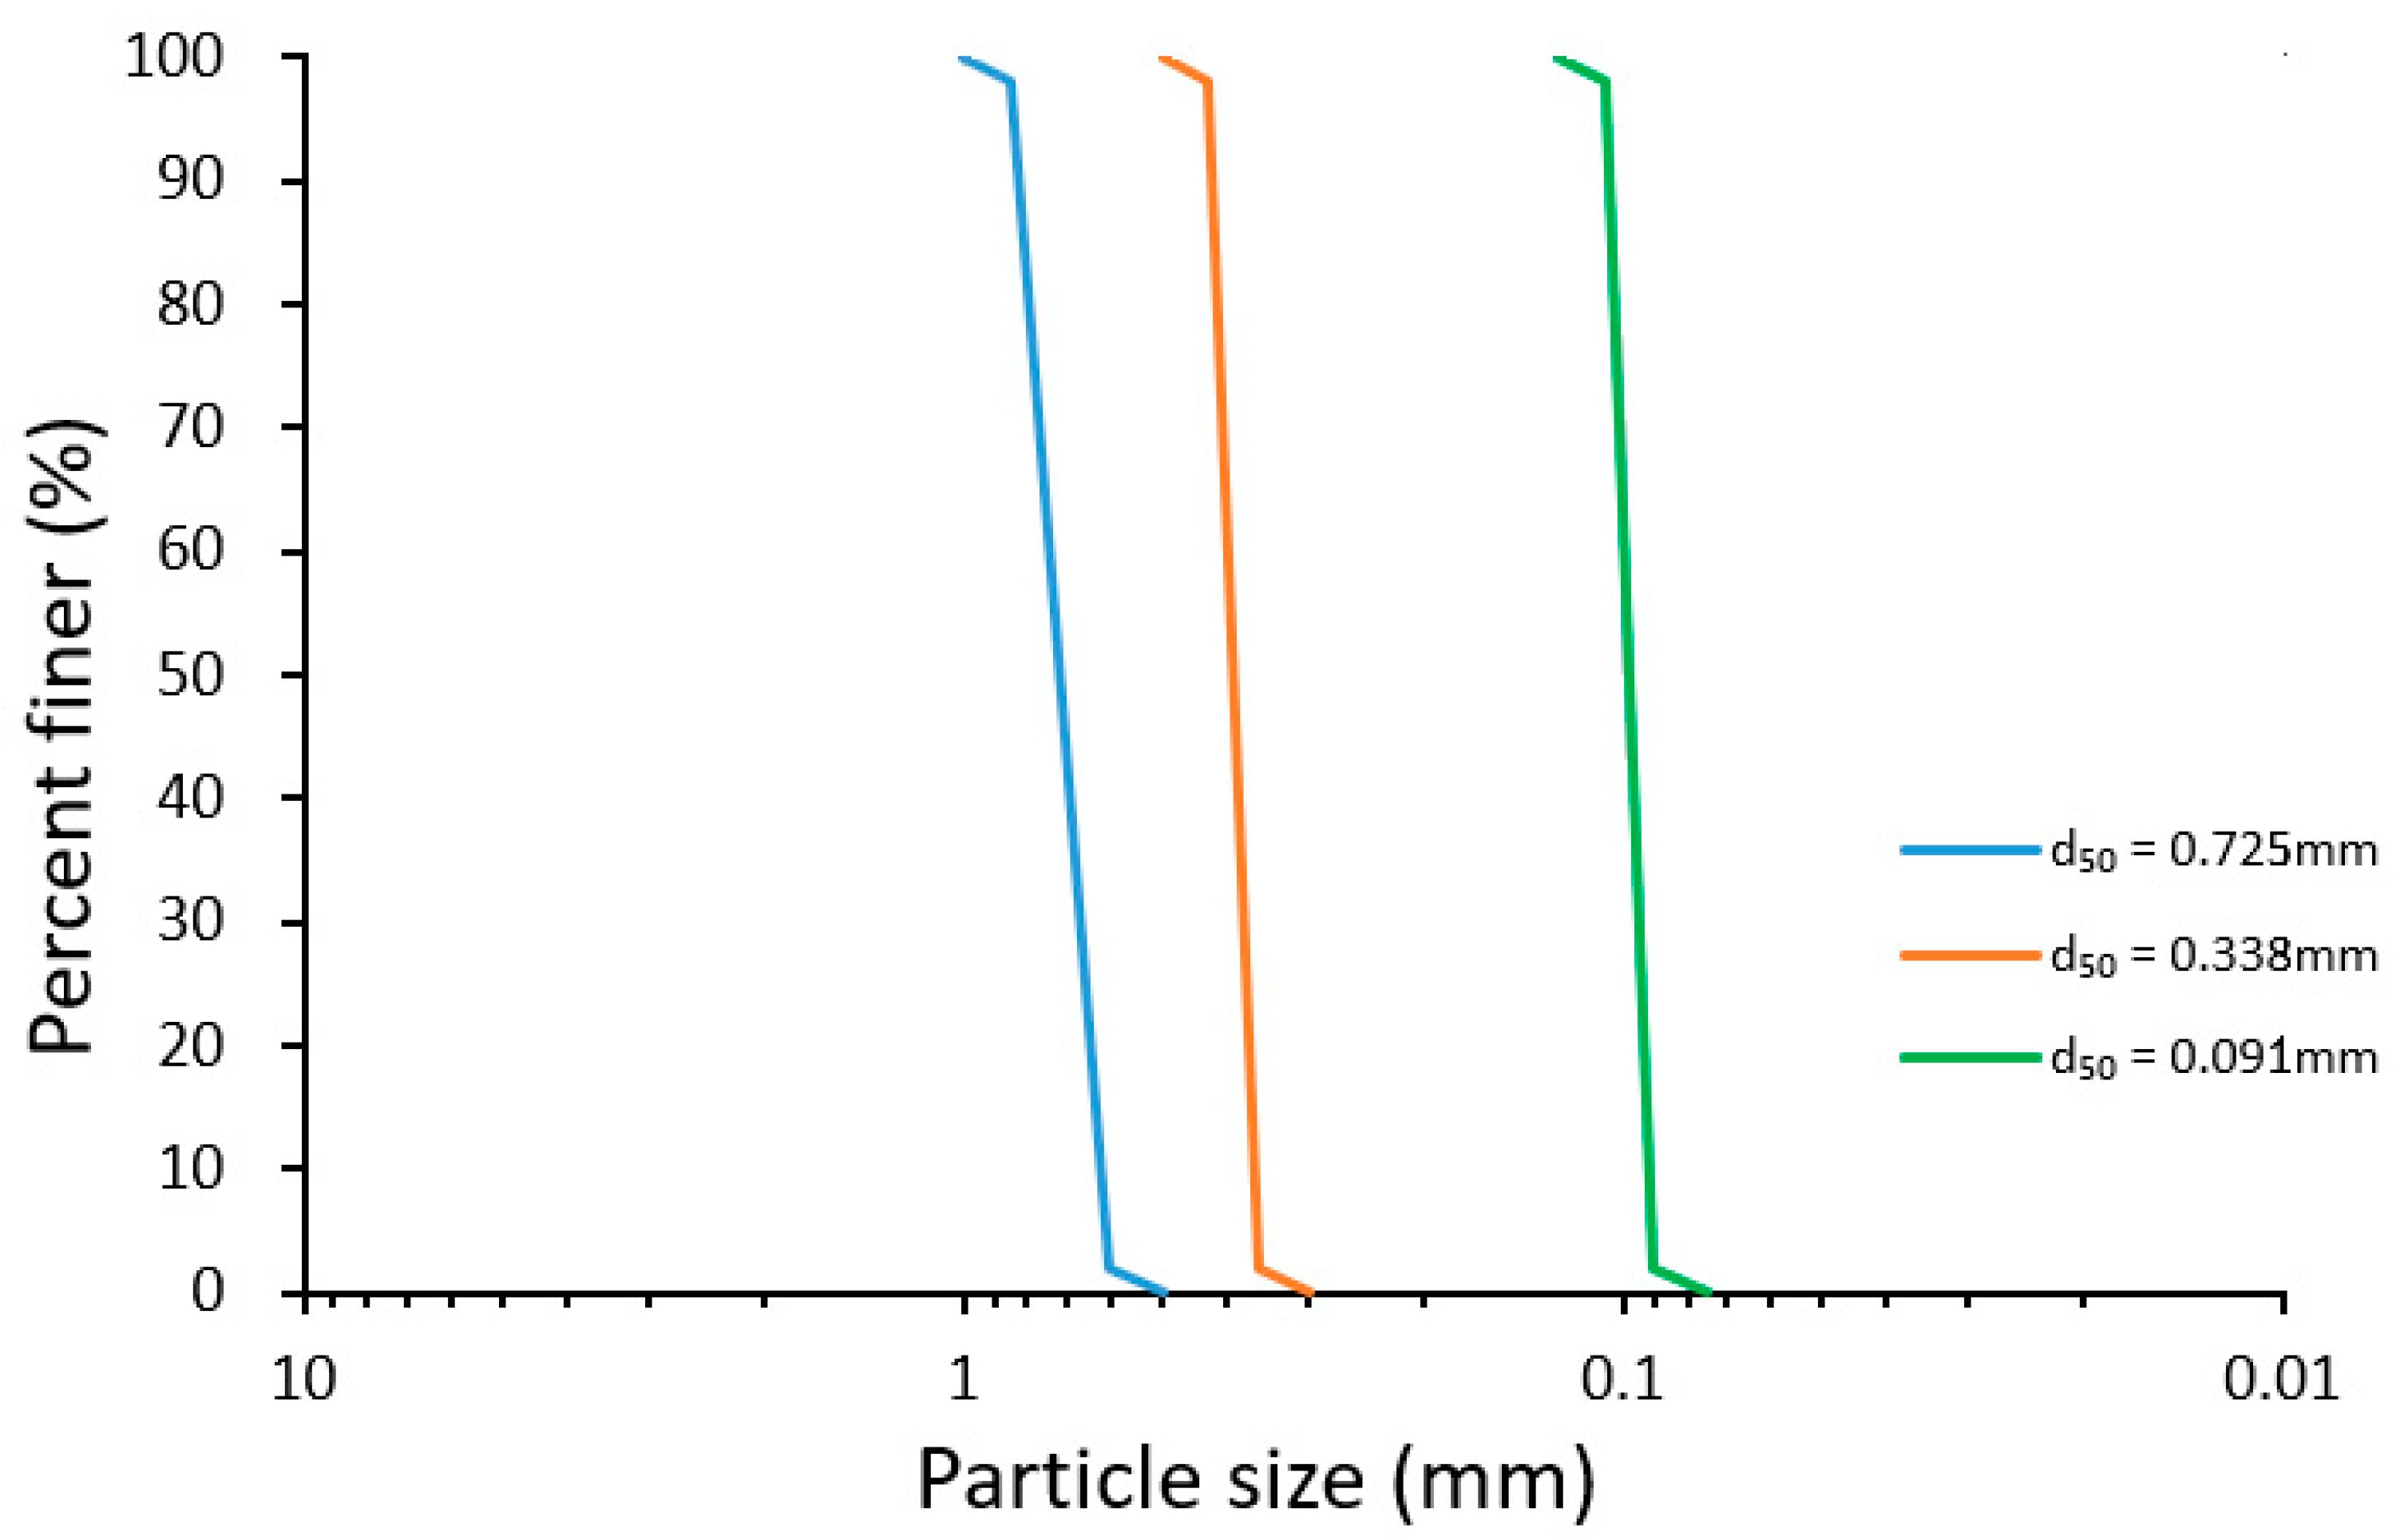
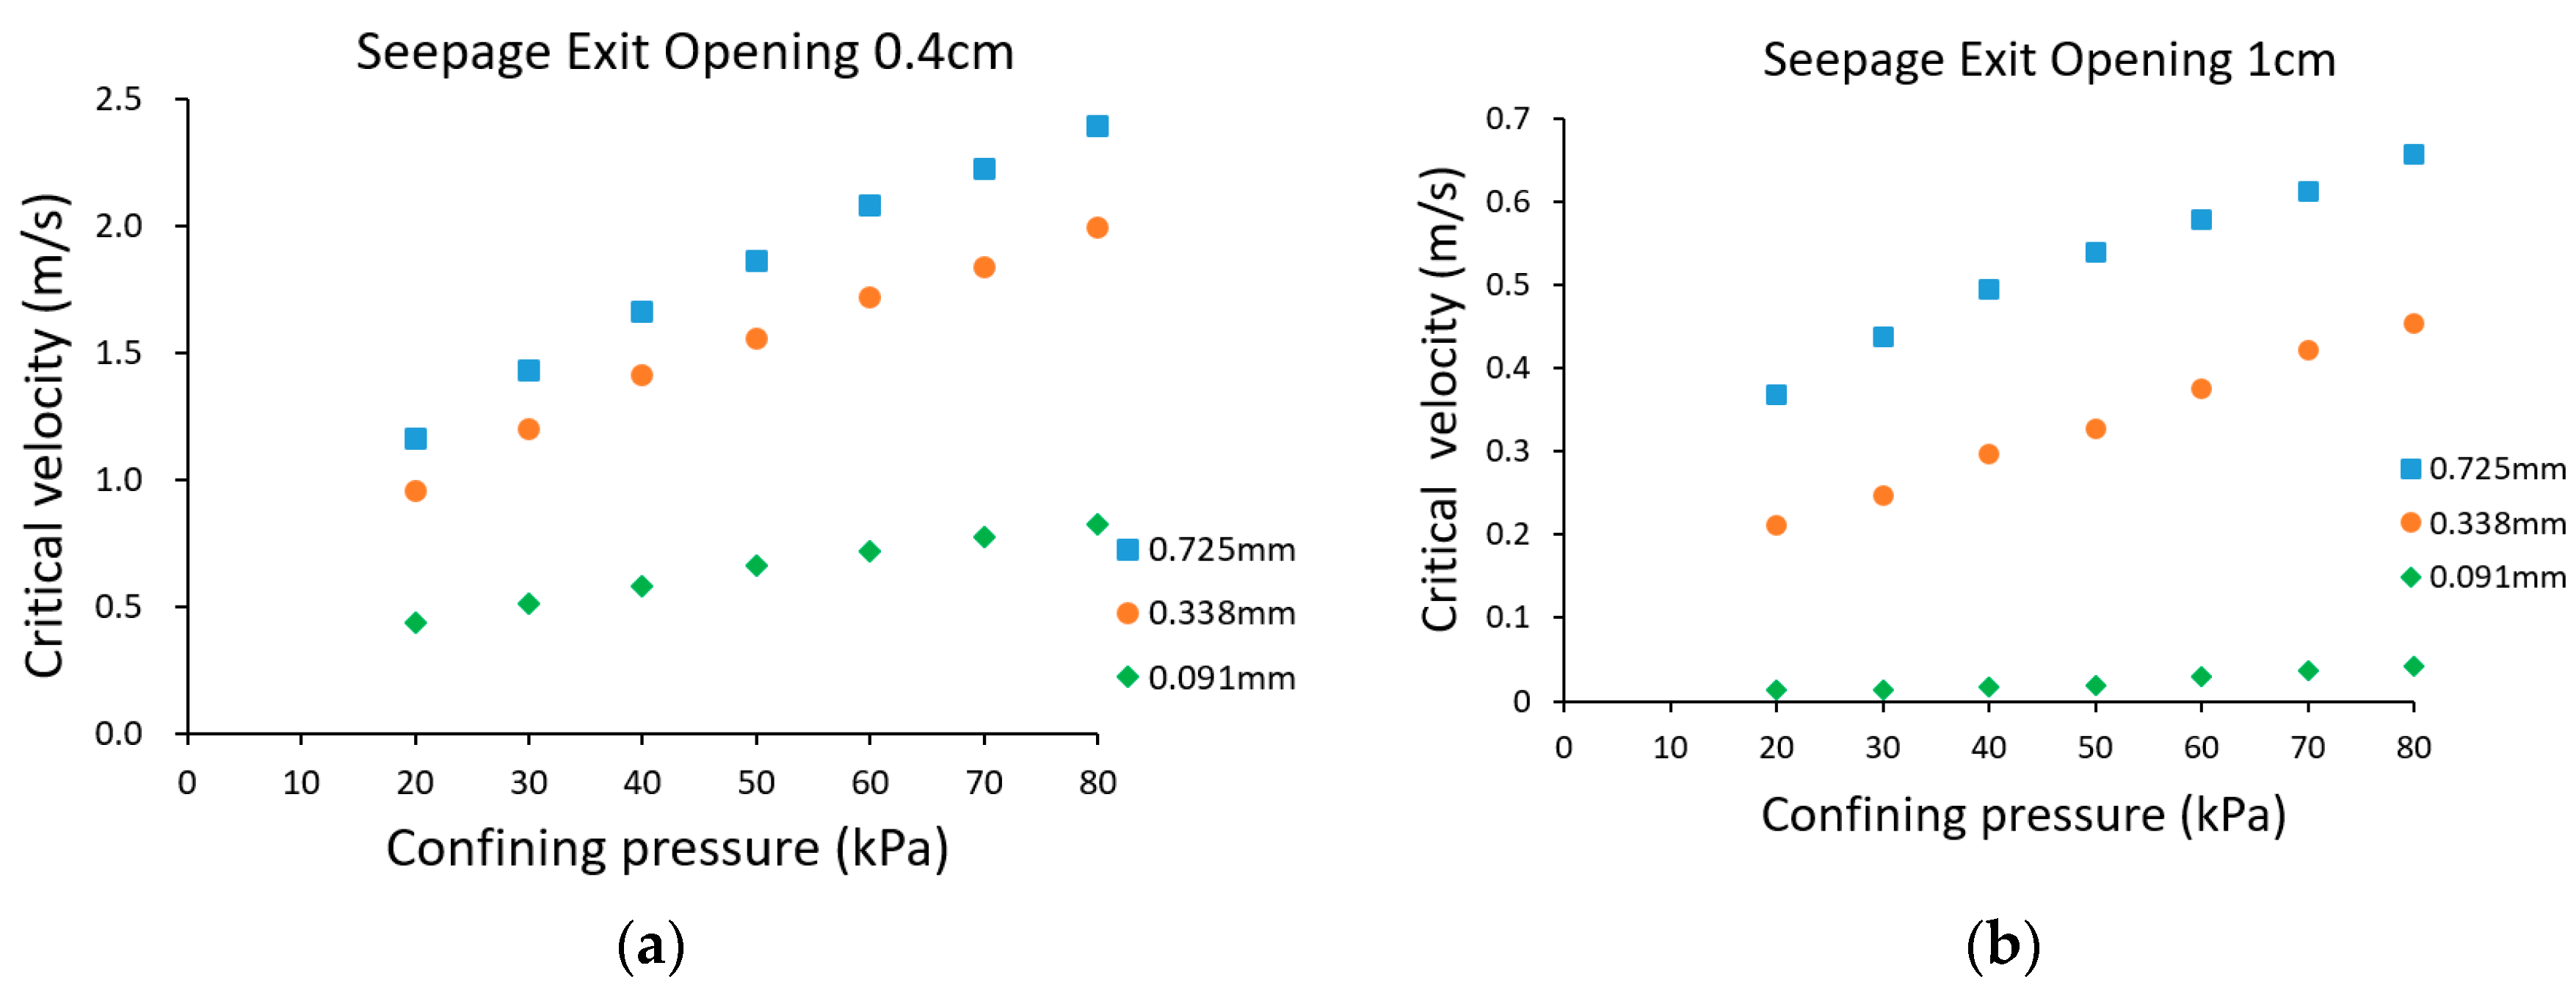
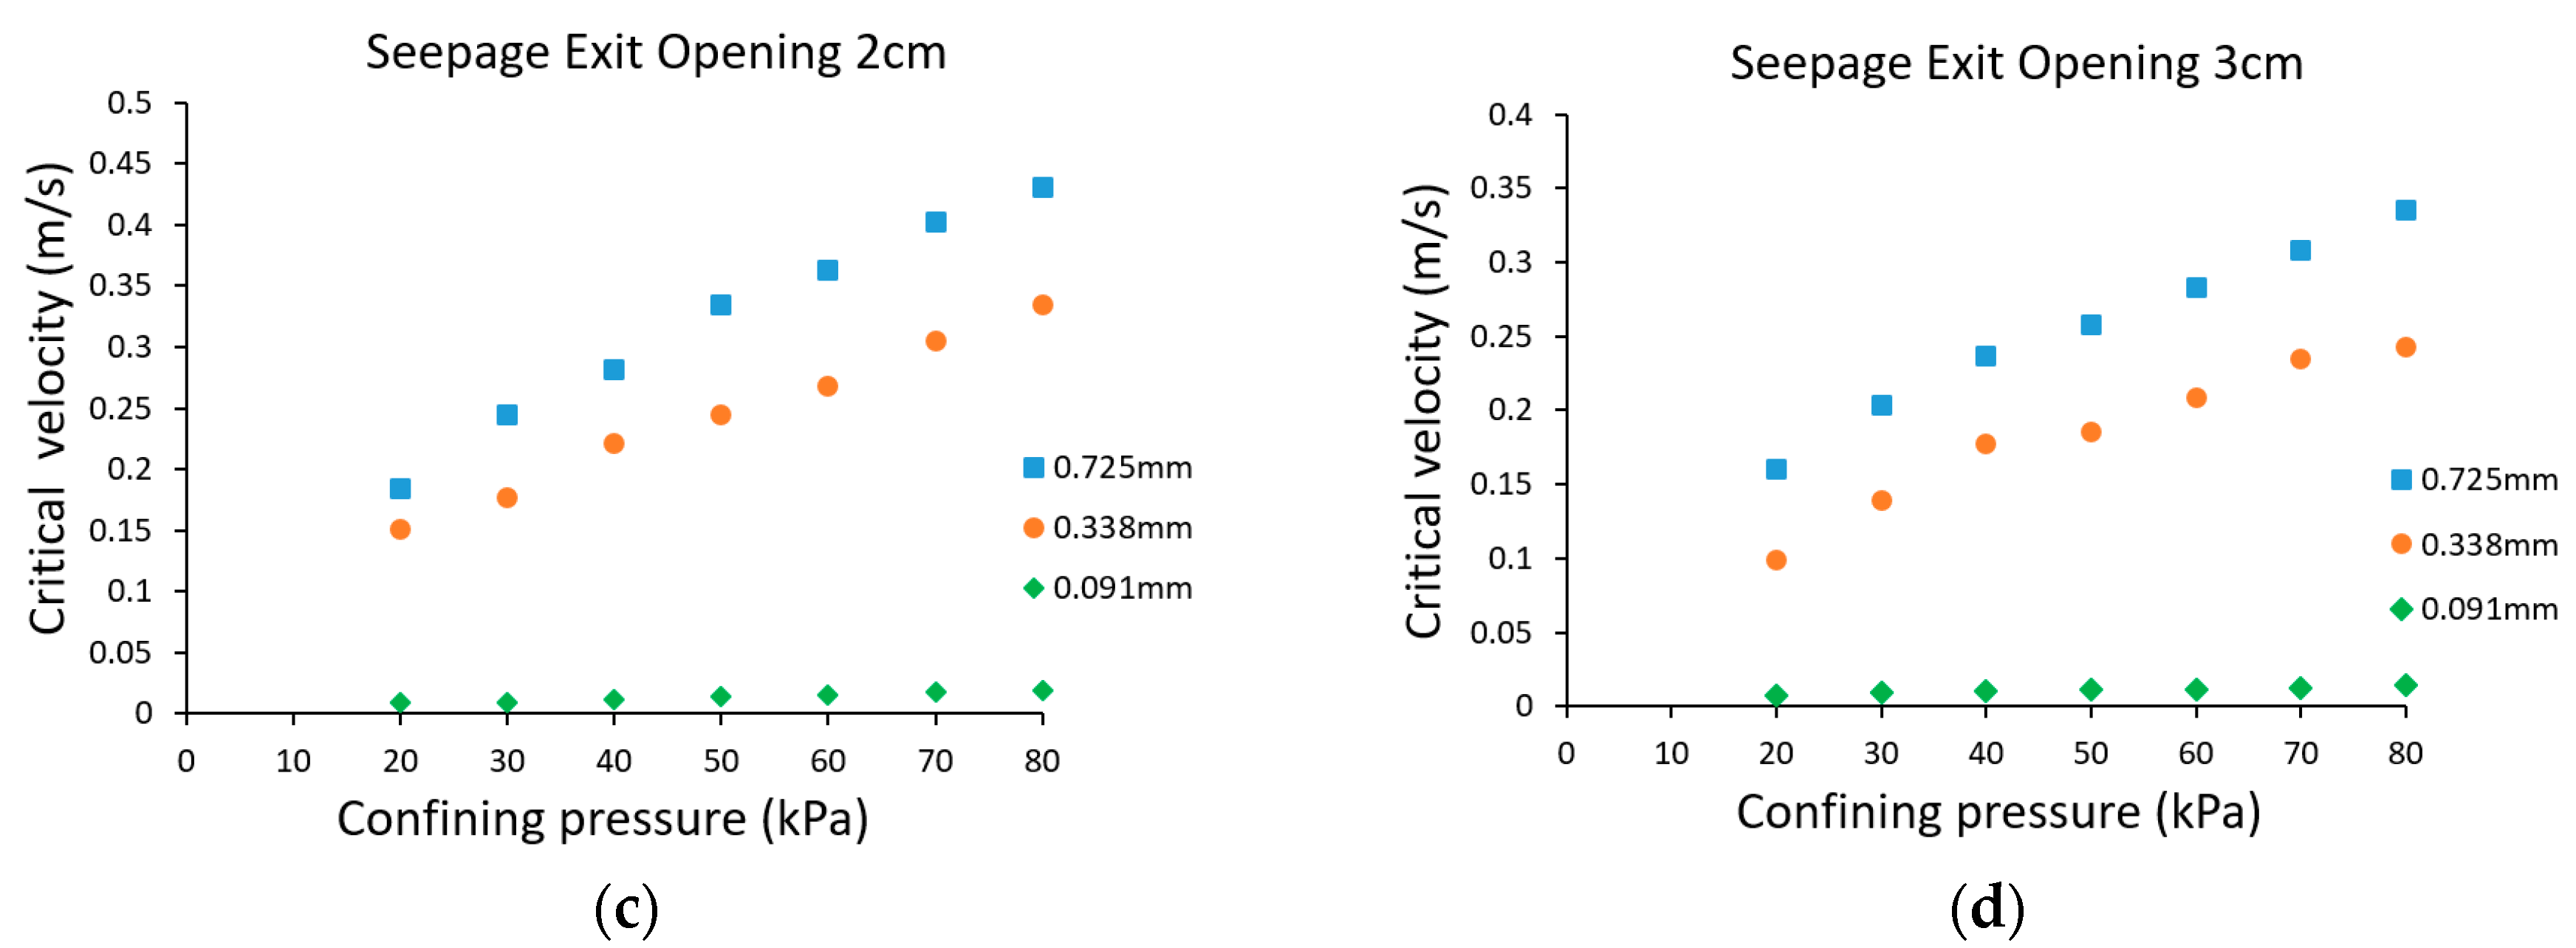
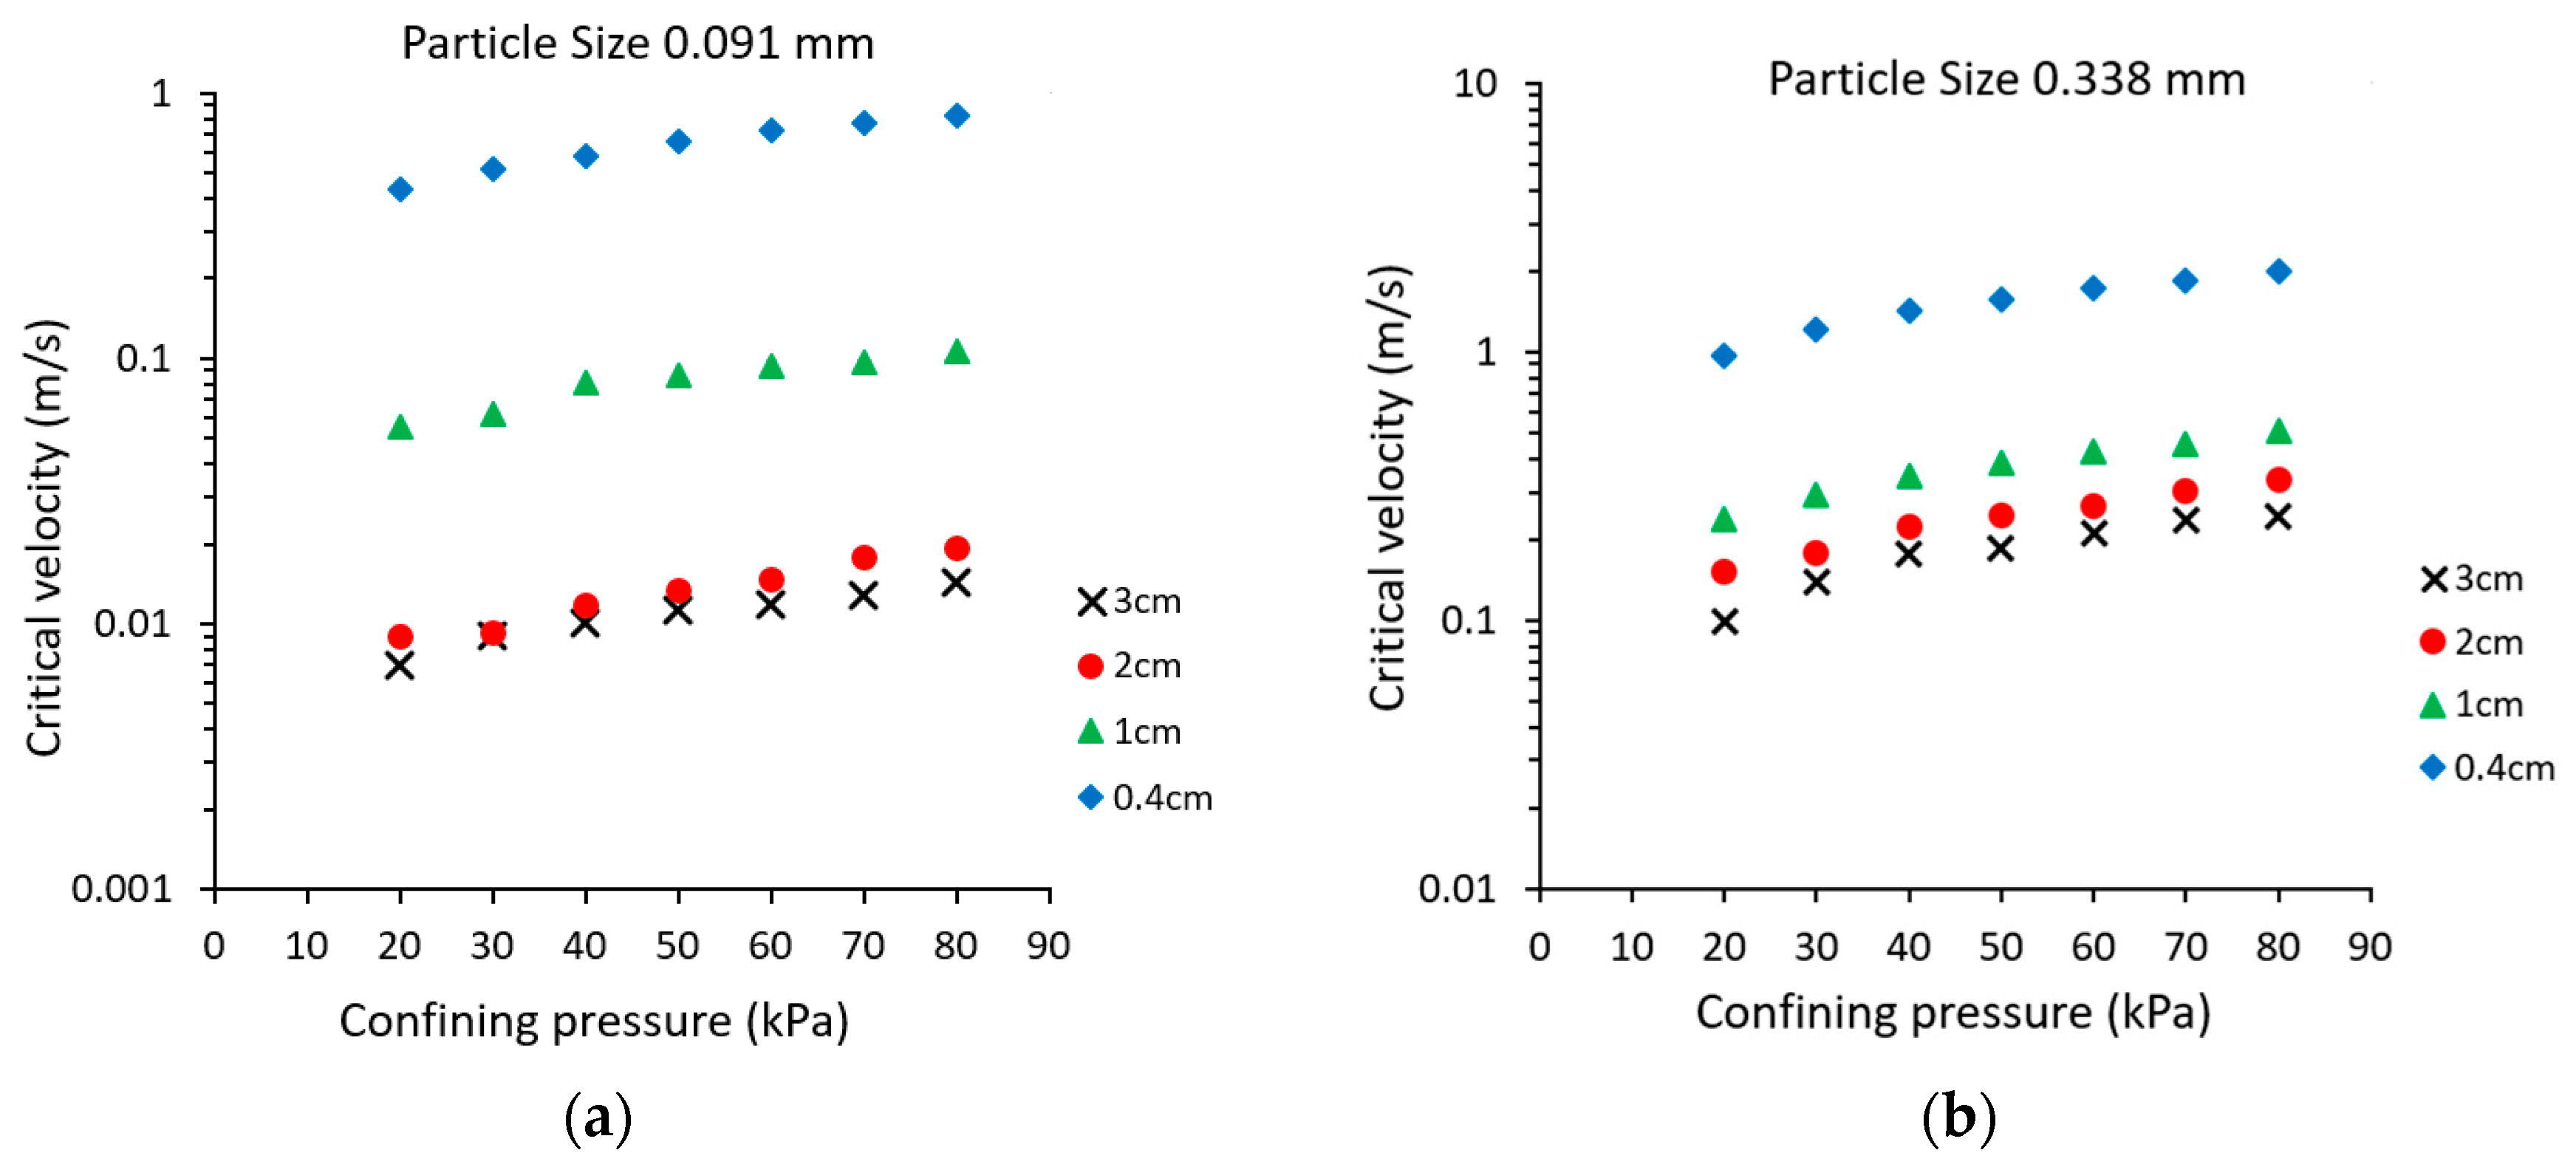
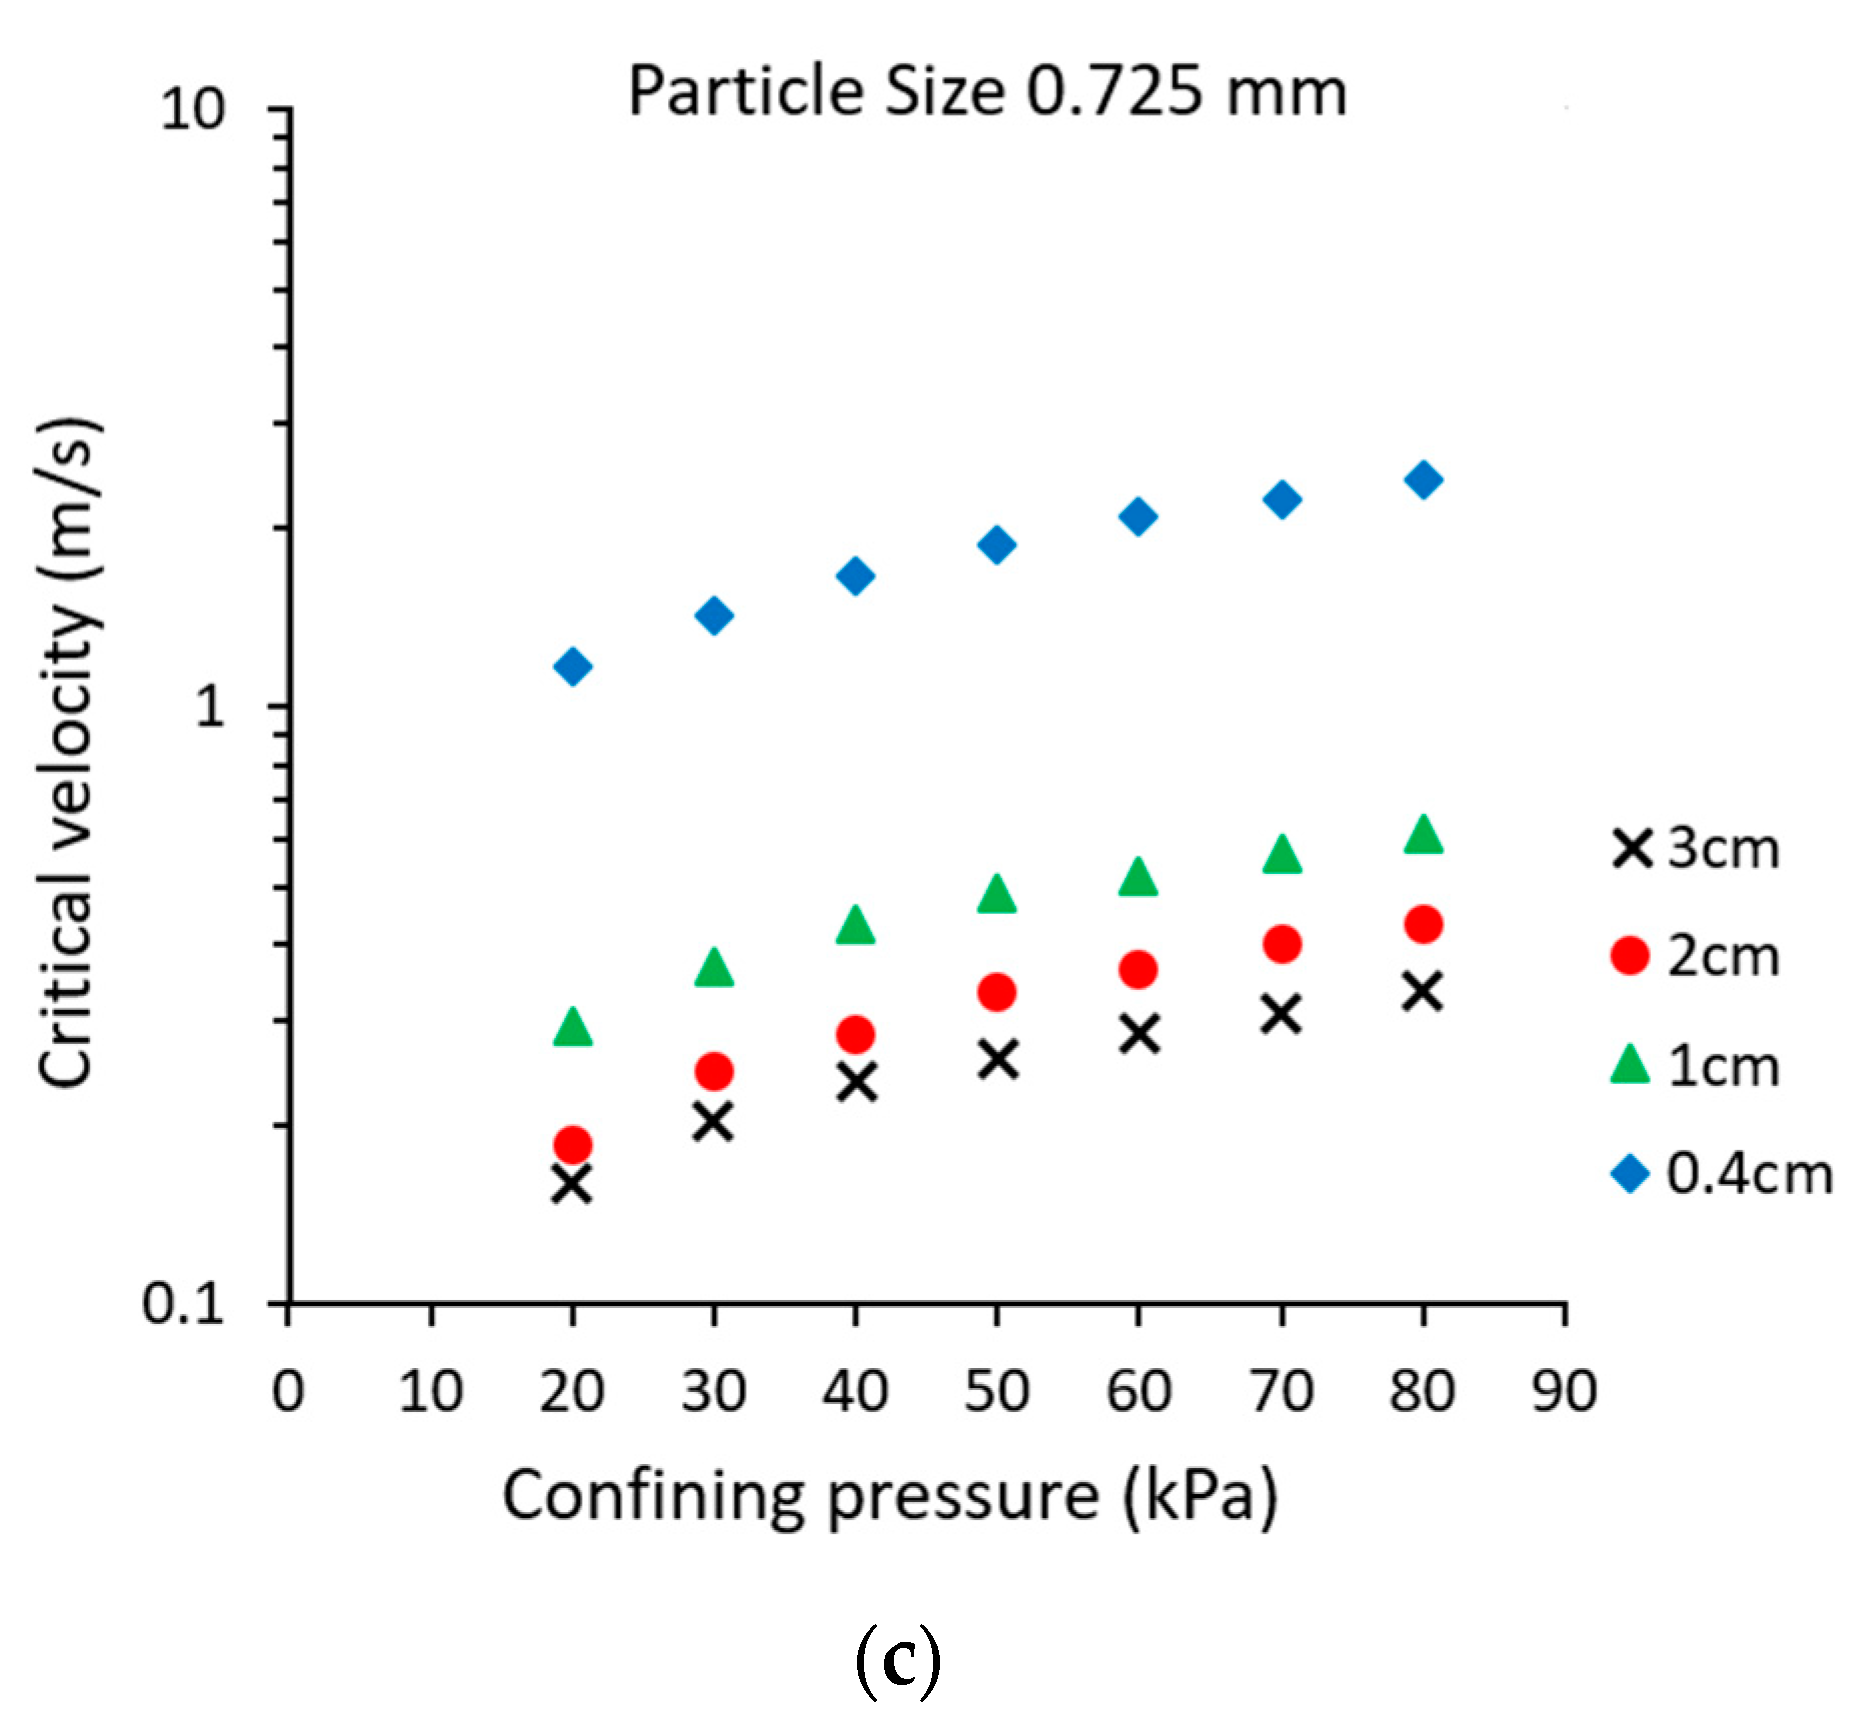
The aforementioned experimental study was conducted to evaluate the effects of the confining pressure, particle size of uniform quartz sand, and size of seepage exit opening on the critical velocity. The seepage exit opening sizes tested were 0.4 cm, 1 cm, 2 cm, and 3 cm; the particle sizes of the quartz sand tested were 0.091 mm, 0.338 mm, and 0.725 mm; the confining pressures applied ranged from 20 to 80 kPa. In addition, a hydro-mechanical model for predicting the critical velocity was proposed in Equations (9) and (10). To verify the accuracy of the proposed model, the predicted values were compared against the experimental results. Figure 8 shows the comparison of the critical velocity for the seepage exit opening of 0.4 cm. Note that an exact match would be plotted on the 1:1 or 45° diagonal line; an overprediction by the model plots above the diagonal line, and underprediction by the model plots below the diagonal line. In Figure 8, all three particle sizes show higher measured critical velocities than the predicted critical velocities by a factor of about 2; although the hydro-mechanical model underpredicts the critical velocity, better agreement was observed for the particle size of 0.091 mm as compared to the other two larger particle sizes. The comparisons for the seepage exit openings of 1 cm, 2 cm, and 3 cm are presented in Figure 9, Figure 10 and Figure 11, respectively. In these comparisons, good agreements between the predicted values and the experimental results were observed for the particle sizes of 0.725 mm and 0.338 mm, and the hydro-mechanical model consistently overpredicted the critical velocity for the particle size of 0.091 mm. However, overprediction is more pronounced for seepage exit openings of 2 cm and 3 cm (Figure 10 and Figure 11) as compared to the seepage exit opening of 1 cm (Figure 9).
In Figure 8, Figure 9, Figure 10 and Figure 11, there are seven data points for each particle size, and they represent the seven confining pressures tested, in which the applied confining pressure ranged from 20 to 80 kPa. High critical velocity is associated with high confining pressure. It can be seen that the spread of data points is wider for the large particle size as compared to the small particle size. The gap between two successive data points is also larger for the large particle size as compared to the small particle size; stated differently, the rate of change in critical velocity relative to the change in confining pressure is higher for large particle size as compared to the small particle size. Similar behaviors in terms of the spread of data points and the gap between two successive data points were also captured by the hydro-mechanical model. Based on the comparisons, it can be concluded that the proposed hydro-mechanical model is capable of predicting critical velocity for seepage exit openings of 1 cm, 2 cm, and 3 cm and particle sizes of 0.338 mm and 0.725 mm with good accuracy. However, the prediction with the seepage exit opening size of 0.4 cm is somewhat less accurate. Less accurate prediction is also observed for the small particle size of 0.091 mm associated with seepage exit openings of 2 cm and 3 cm. Despite some discrepancies, the proposed hydro-mechanical model shows that the predicted critical velocity is positively correlated with confining pressure and particle size and that the critical velocity is negatively correlated with the size of seepage exit opening; in general, the predicted behaviors are consistent with the experimental results.

6. Discussion

The foregoing comparisons show that the proposed hydro-mechanical model can predict critical velocity with good accuracy for particle sizes of 0.338 mm and 0.725 mm with seepage exit openings of 1 cm, 2 cm, and 3 cm, in which the ratio of seepage exit opening to particle size ( D / d 50 ) ranges from 14 to 89. The proposed model underpredicted the critical velocity with the small seepage exit opening of 0.4 cm, where the value of D / d 50 is relatively small (i.e., 12 and 6 for particle sizes of 0.338 mm and 0.725 mm, respectively). The small seepage exit opening was intended to simulate the perforation of a drain pipe, which is typically located at the downstream toe of an embankment dam. Typical perforation of the drain pipe can be as small as 0.45 cm [26].
Iglesia et al. [27] studied particle-size scaling in centrifuge modeling by means of trapdoor tests. The soil behavior in the trapdoor tests is significantly affected by soil arching, which is associated with the ratio of the trapdoor width to the particle size d 50 . They indicated that when the ratio of trapdoor width to particle size is greater than 20, the same soil as the prototype can be used in the centrifuge model without scaling the particle size. Oldal et al. [28] derived an equation to predict the discharge rate of granular materials through a silo by considering the arching effect and the relative size between the outlet orifice and particles; it was found that the equation is appropriate when the ratio greater than 7. Based on these findings, it can be inferred that the effect of soil arching is rather significant in the internal erosion tests conducted herein with the seepage exit opening size of 0.4 cm, where the ratio D / d 50 is small. This is supported by the underprediction of the model with the seepage opening size of 0.4 cm, where the measured critical velocity is higher than the predicted value (Figure 8); for a small seepage exit opening, a higher seepage velocity is needed to initiate internal erosion.
The proposed hydro-mechanical model overpredicted the critical velocity for the particle size of 0.091 mm with seepage exit openings of 1 cm, 2 cm, and 3 cm, and the respective D / d 50 ratios are 110, 220, and 330. With these large D / d 50 ratios, a small displacement (or detachment) of particles would initiate the onset of internal erosion; this behavior is in agreement with the trapdoor tests with centrifuge for particle-size scaling [27]. As evident from the soil arching results of trapdoor tests [23,24], triangular slip surfaces are associated with small displacement of particles, and vertical slip surfaces are associated with large displacement of particles. With a small displacement of particles observed for tests with large D / d 50 ratios, the slip surfaces in these internal erosion tests are likely to be conical (or triangular in a plane section), which is notably different from the cylindrical failure surface assumed in the proposed hydro-mechanical model. The difference in the failure surfaces could attribute to the overprediction of critical velocity for tests with large D / d 50 ratios.
Many of the internal erosion laboratory tests performed by the previous researchers did not apply confining pressure to the soil specimen, and the flow of water was directed vertically from bottom to top (an upward flow); the head loss and the hydraulic gradient incurred in the specimen were examined [29,30,
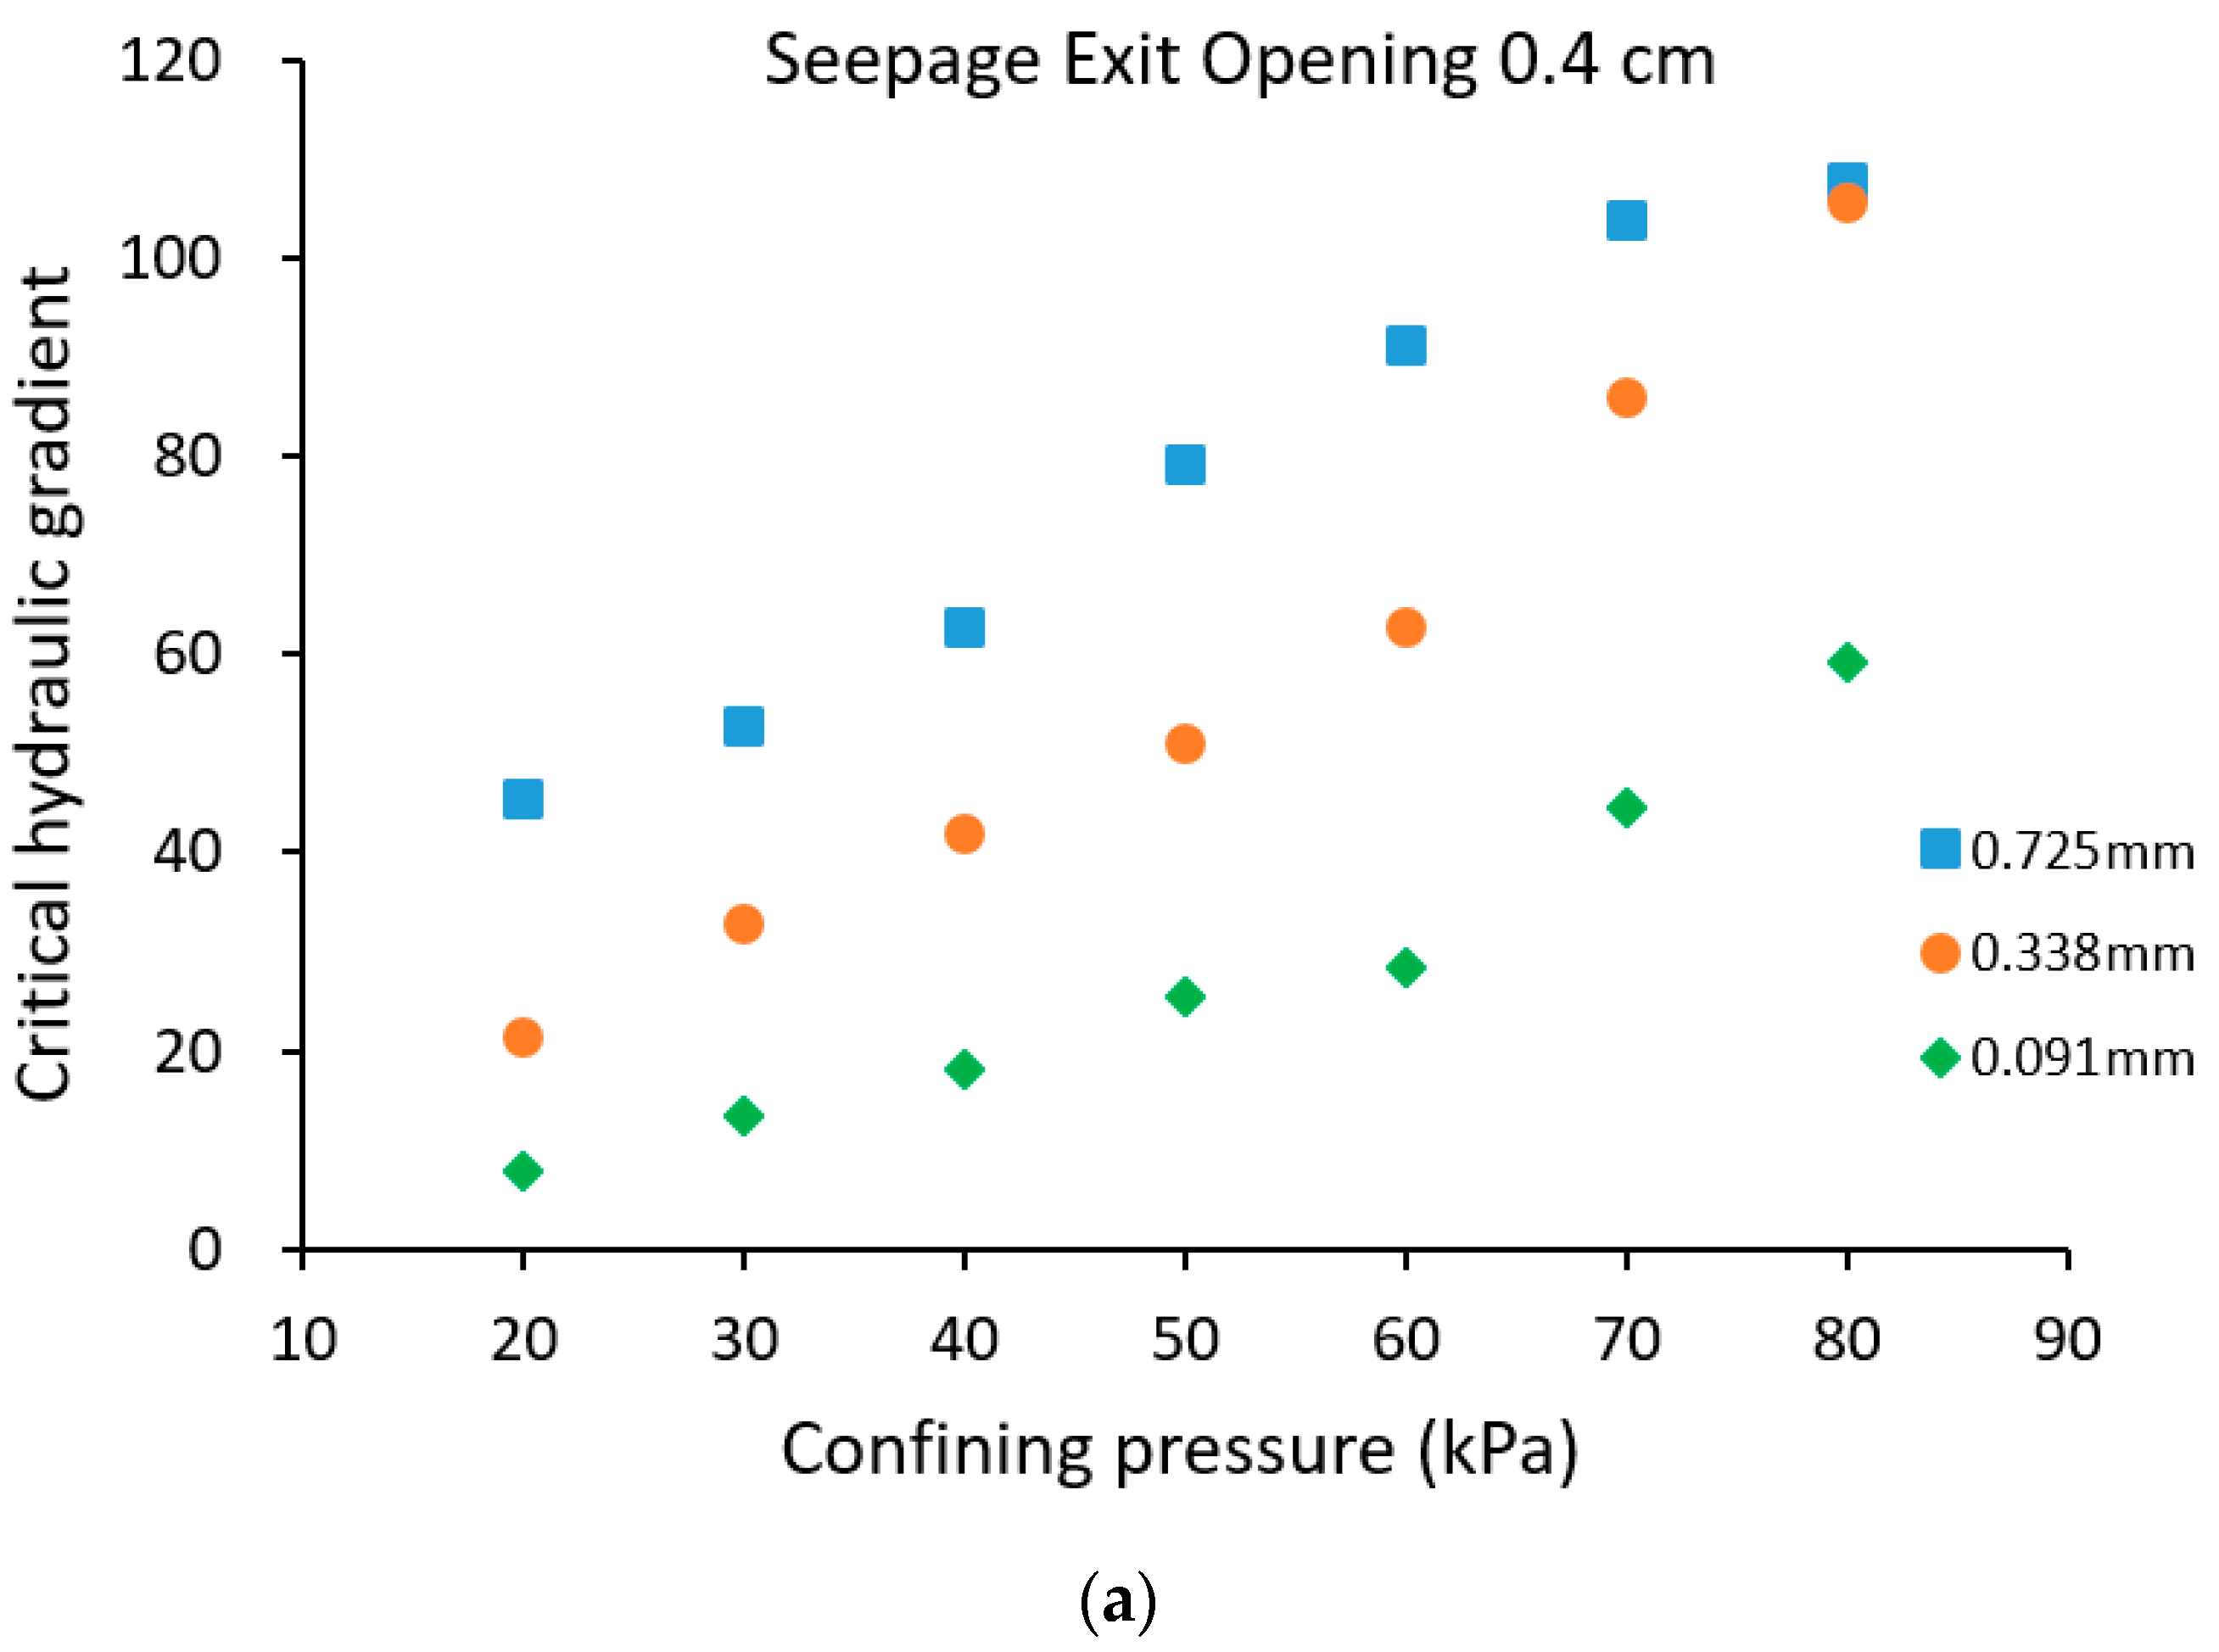
31]. These internal erosion laboratory tests are considered applicable to the seepage exit near the downstream toe of an embankment dam, where the confining pressure is relatively small. As indicated by the results of seepage tests without confinement, the critical hydraulic gradient needed to initiate an internal erosion is relatively low (e.g., 1 to 3). When the confining pressure is more significant, such as in the foundation near the centerline of an embankment dam where a defect exists, a higher critical hydraulic gradient would be required to initiate an internal erosion failure. In comparison to the critical hydraulic gradients from erosion tests without confinement, the erosion tests with confinement conducted in this study showed much higher critical hydraulic gradients; Figure 12 shows the variation of the critical hydraulic gradient with confining pressure for seepage exit openings of 0.4 cm and 1 cm. The critical hydraulic gradient was calculated by dividing the total head loss by the specimen length of 14 cm; hence, the calculated hydraulic gradient is an average value and was assumed to be constant throughout the specimen. The total head loss is the difference in total heads between the upstream and downstream ends of the specimen. The total head at the upstream end of the specimen was determined from the pressure gauge attached to the inlet tubing. The total head at the downstream end of the specimen was 25 cm, which is the difference in elevation from the tailwater in the low-head reservoir to the location of the seepage exit opening. Note that the hydraulic gradient in the critical failure zone would be higher than the average value since the seepage velocity is higher near the seepage exit opening. As such, it was thought by the authors that the critical velocity is a better parameter for describing the initiation of internal erosion than the critical hydraulic gradient when confinement is deemed critical.

7. Conclusions

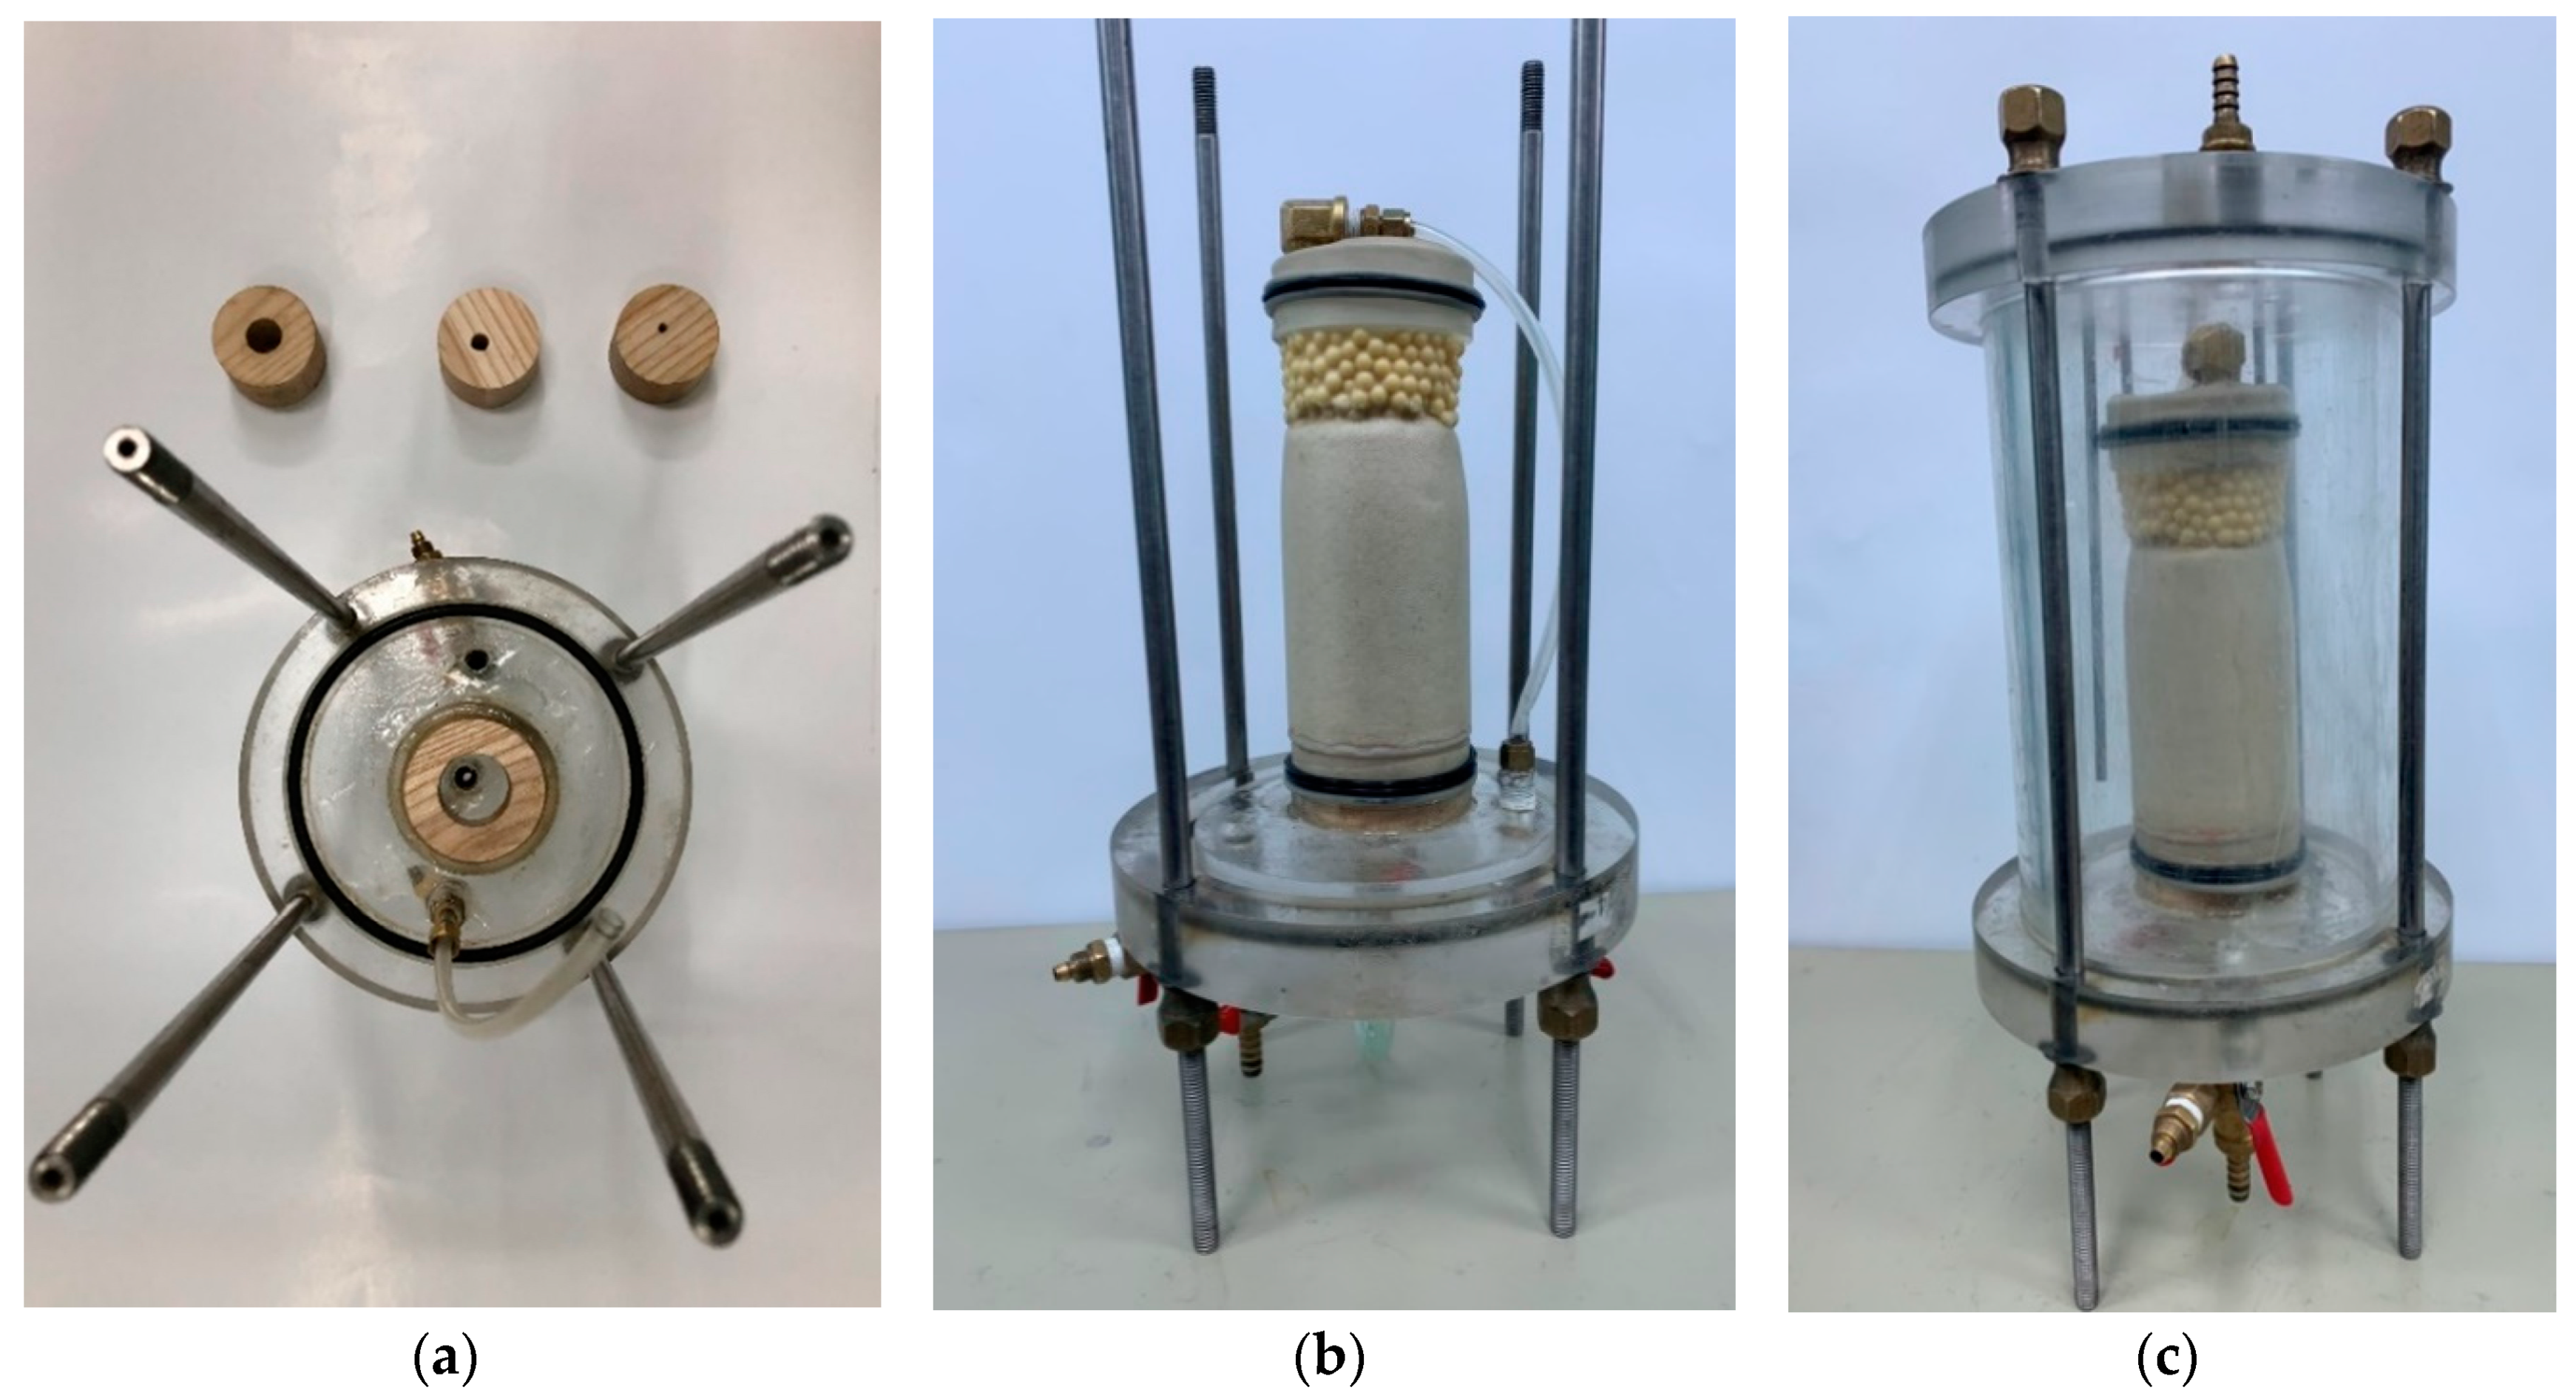
A test apparatus consisted of a high head cell, a specimen cell, and a confining cell was developed in this study. Using the test apparatus, critical velocities were determined for uniform quartz sand specimens with d 50 particle sizes of 0.091 mm, 0.338 mm, and 0.725 mm. The effects of seepage exit opening size (i.e., 0.4 cm, 1 cm, 2 cm, and 3 cm) and confining pressure (i.e., 20 to 80 kPa) on the critical velocity were evaluated. The experimental results showed that the particle size, seepage exit opening, and the confining pressure all influenced the value of critical velocity. In addition, a hydro-mechanical model was proposed to help estimate the critical velocity at the initiation of internal erosion. By comparing to the experimental results, the proposed hydro-mechanical model can predict the critical velocity with good accuracy for particle sizes of 0.338 mm and 0.725 mm with seepage exit openings of 1 cm, 2 cm, and 3 cm. However, the prediction is less accurate for the particle size of 0.091 mm and the seepage exit opening of 0.4 cm. It was found that the underprediction occurs when the ratio of seepage exit opening to the particle size ( D / d 50 ) is small, where the effect of soil arching becomes significant. Conversely, overprediction also occurs when the D / d 50 ratio becomes large. The conclusions drawn from this study are as follows:
  • Given a specific particle size and a size of seepage exit opening, the higher the confining pressure, the higher is the critical velocity. The effect of confining pressure on the critical velocity is more pronounced in large particle sizes.
  • Given a specific seepage exit opening size and a confining pressure, the larger the particle size, the higher is the critical velocity and vice versa.
  • Given a specific particle size and a confining pressure, the greater is the seepage exit opening, the lower is the critical velocity. The difference in critical velocity is small for the particle size of 0.091 mm and seepage exit openings of 2 cm and 3 cm.
  • Based on the proposed hydro-mechanical model, the calculated critical velocity, found by equating the driving fluid drag force of the cylindrical volume of the critical failure zone and the resisting shear force acting along the cylindrical boundary surface of the critical failure zone based on the Mohr–Coulomb failure criterion, is in good agreement with the experimental data; this verifies the validity of the proposed model.
  • The influences of particle size, size of seepage exit opening, and confining pressure on the critical velocity are reflected by the proposed hydro-mechanical model. The effects of friction angle and the porosity of the soil are also captured by the proposed model.

Author Contributions

Conceptualization, K.-T.C.; methodology, K.-T.C., K.Z.-Z.L.; formal analysis, K.Z.-Z.L., H.-Y.W.; investigation, K.Z.-Z.L., H.-Y.W.; data curation, K.-T.C., K.Z.-Z.L.; writing–original draft preparation, K.-T.C.; writing–review and editing, K.-T.C., K.Z.-Z.L.; visualization, H.-Y.W.; supervision, K.-T.C.; project administration, K.-T.C.; funding acquisition, K.-T.C. All authors have read and agreed to the published version of the manuscript.

Funding

This research was funded by the Ministry of Science and Technology of Taiwan through the grant MOST 108-2625-M-005-008.

Acknowledgments

The authors would like to thank the anonymous reviewers who helped to improve the original manuscript.

Conflicts of Interest

The authors declare no conflict of interest. The funder and the authors’ affiliated organizations had no role in the design of the study; in the collection, analyses, or interpretation of data; in the writing of the manuscript; or in the decision to publish the results.

References

  1. International Commission on Large Dams. Internal Erosion of Existing Dams, Levees and Dikes, and Their Foundations, Bulletin 164; ICOLD Committee on Embankment Dams: Paris, France, 2017; 292p. [Google Scholar]
  2. Richards, K.S.; Reddy, K.R. Experimental investigation of initiation of backward erosion piping in soils. Geotechnique 2012, 62, 933–942. [Google Scholar] [CrossRef]
  3. Crosta, G.; di Prisco, C. On slope instability induced by seepage erosion. Can. Geotech. J. 1999, 36, 1056–1073. [Google Scholar] [CrossRef]
  4. Chu-Agor, M.L.; Fox, G.A.; Cancienne, R.M.; Wilson, G.V. Seepage caused tension failures and erosion undercutting of hillslopes. J. Hydrol. 2008, 359, 247–259. [Google Scholar] [CrossRef]
  5. Moffat, R.; Fannin, R.J. A hydromechanical relation governing internal stability of cohesionless soil. Can. Geotech. J. 2011, 48, 413–424. [Google Scholar] [CrossRef]
  6. Chang, D.S.; Zhang, L.M. Extended internal stability criteria for soils under seepage. Soils Found. 2013, 53, 569–583. [Google Scholar] [CrossRef] [Green Version]
  7. Tomlinson, S.S.; Vaid, Y.P. Seepage forces and confining pressure effects on piping erosion. Can. Geotech. J. 2000, 37, 1–13. [Google Scholar] [CrossRef]
  8. Chang, D.S.; Zhang, L.M. A Stress-controlled Erosion Apparatus for Studying Internal Erosion in Soils. Geotech. Test. J. 2011, 6, 579–589. [Google Scholar] [CrossRef]
  9. Kenney, T.C.; Lau, D. Internal stability of granular filters. Can. Geotech. J. 1985, 22, 215–225. [Google Scholar] [CrossRef]
  10. Fannin, R.J.; Moffat, R. Observations on internal stability of cohesionless soils. Geotechnique 2006, 56, 497–500. [Google Scholar] [CrossRef]
  11. Richards, K.S.; Reddy, K.R. Kinetic Energy Method for Predicting Initiation of Backward Erosion in Earthen Dams and Levees. Environ. Eng. Geosci. 2014, 20, 85–97. [Google Scholar] [CrossRef]
  12. Rochim, A.; Marot, D.; Sibille, L.; Le, V.T. Effects of Hydraulic Loading History on Suffusion Susceptibility of Cohesionless Soils. J. Geotech. Geoenviron. Eng. 2017, 143, 04017025. [Google Scholar] [CrossRef]
  13. Moffat, R.; Herrera, P. Hydromechanical model for internal erosion and its relationship with the stress transmitted by the finer soil fraction. Acta Geotech. 2015, 10, 643–650. [Google Scholar] [CrossRef]
  14. Liang, Y.; Yeh, T.C.J.; Wang, J.; Liu, M.; Zha, Y.; Hao, Y. Onset of suffusion in upward seepage under isotropic and anisotropic stress conditions. Eur. J. Environ. Civ. Eng. 2019, 23, 1520–1534. [Google Scholar] [CrossRef]
  15. Chang, K.T.; Chen, Y.L. Failure criterion of seepage erosion. In Proceedings of the 9th International Conference on Scour and Erosion, Taipei, Taiwan, 5–8 November 2018; Yeh, K.-C., Ed.; Taylor and Francis Group: London, UK, 2019; pp. 99–102. [Google Scholar]
  16. Abdoulaye Hama, N.; Ouahbi, T.; Taibi, S.; Souli, H.; Fleureau, J.M.; Pantet, A. Analysis of mechanical behaviour and internal stability of granular materials using discrete element method. Int. J. Numer. Anal. Methods Geomech. 2016, 40, 1712–1729. [Google Scholar] [CrossRef]
  17. Wang, Y.; Chai, J.; Xu, Z.; Qin, Y.; Wang, X. Numerical Simulation of the Fluid-Solid Coupling Mechanism of Internal Erosion in Granular Soil. Water 2020, 12, 137. [Google Scholar] [CrossRef] [Green Version]
  18. Rice, J.D.; Ibrahim, I.A.; Peng, S. Tracking and assessment of backward erosion piping progression into constricted seepage exits. In Proceedings of the 9th International Conference on Scour and Erosion, Taipei, Taiwan, 5–8 November 2018; Yeh, K.-C., Ed.; Taylor and Francis Group: London, UK, 2019; pp. 111–117. [Google Scholar]
  19. Di Felice, R. The voidage function for fluid-particle interaction systems. Int. J. Multiph. Flow 1994, 20, 153–159. [Google Scholar] [CrossRef]
  20. Kafui, K.D.; Thornton, C.; Adams, M.J. Discrete particle-continuum fluid modelling of gas-solid fluidised beds. Chem. Eng. Sci. 2002, 57, 2395–2410. [Google Scholar] [CrossRef]
  21. Zhou, Z.Y.; Zhu, H.P.; Yu, A.B.; Wright, B.; Zulli, P. Discrete particle simulation of gas-solid flow in a blast furnace. Comput. Chem. Eng. 2008, 32, 1760–1772. [Google Scholar] [CrossRef]
  22. Xu, C.; Liang, L.; Chen, Q.; Luo, W.; Chen, Y.F. Experimental study of soil arching effect under seepage condition. Acta Geotech. 2019, 14, 2031–2044. [Google Scholar] [CrossRef]
  23. Liang, L.; Xu, C.; Chen, Q.; Chen, Q. Experimental and Theoretical Investigations on Evolution of Soil-Arching Effect in 2D Trapdoor Problem. Int. J. Geomech. 2020, 20, 06020007. [Google Scholar] [CrossRef]
  24. Iglesia, G.R.; Einstein, H.H.; Whitman, R.V. Investigation of Soil Arching with Centrifuge Tests. J. Geotech. Geoenviron. Eng. 2014, 140, 04013005. [Google Scholar] [CrossRef]
  25. Taylor, H.F.; O’Sullivan, C.; Sim, W.W.; Carr, S.J. Sub-particle-scale investigation of seepage in sands. Soils Found. 2017, 57, 439–452. [Google Scholar] [CrossRef]
  26. U.S. Department of the Interior. S. Department of the Interior. Design Standards No. 13, Embankment Dams, Chapter 5, Protective Filters; Bureau of Reclamation, Technical Service Center: Denver, CO, USA, 2011; 254p.
  27. Iglesia, G.R.; Einstein, H.H.; Whitman, R.V. Validation of Centrifuge Model Scaling for Soil Systems via Trapdoor Tests. J. Geotech. Geoenviron. Eng. 2011, 137, 1075–1089. [Google Scholar] [CrossRef]
  28. Oldal, I.; Keppler, I.; Csizmadia, B.; Fenyvesi, L. Outflow properties of silos: The effect of arching. Adv. Powder Technol. 2012, 23, 290–297. [Google Scholar] [CrossRef]
  29. Fleshman, M.S.; Rice, J.D. Laboratory Modeling of the Mechanisms of Piping Erosion Initiation. J. Geotech. Geoenviron. Eng. 2014, 140, 04014017. [Google Scholar] [CrossRef]
  30. Israr, J.; Indraratna, B. Study of Critical Hydraulic Gradients for Seepage-Induced Failures in Granular Soils. J. Geotech. Geoenviron. Eng. 2019, 145, 04019025. [Google Scholar] [CrossRef]
  31. Peng, S.; Rice, J.D. Measuring Critical Gradients for Soil Loosening and Initiation of Backward Erosion-Piping Mechanism. J. Geotech. Geoenviron. Eng. 2020, 146, 04020069. [Google Scholar] [CrossRef]
Figure 1. Schematic of the test apparatus.
Water 12 02417 g001
Figure 2. Particle size distribution of the sands.
Water 12 02417 g002
Figure 3. Assembly of the specimen cell: (a) seepage exit opening in wooden plug; (b) specimen under vacuum; (c) complete specimen cell.
Water 12 02417 g003
Figure 4. Progression of internal erosion failure with the particle size of 0.725 mm, confining pressure of 50 kPa, and seepage exit opening of 1 cm: (a) specimen under saturation; (b) initiation of internal erosion failure with a sinkhole; (c) sand particles greatly eroded away at the downstream end.
Water 12 02417 g004aWater 12 02417 g004b
Figure 5. Critical velocity with various confining pressure: (a) seepage exit opening of 0.4 cm; (b) seepage exit opening of 1 cm; (c) seepage exit opening of 2 cm; (d) seepage exit opening of 3 cm.
Water 12 02417 g005aWater 12 02417 g005b
Figure 6. Critical velocity with various confining pressure: (a) particle size of 0.091 mm; (b) particle size of 0.338 mm; (c) particle size of 0.725 mm.
Water 12 02417 g006aWater 12 02417 g006b
Figure 7. Critical failure zone near the seepage exit opening.
Water 12 02417 g007
Figure 8. Comparison between predicted and experimental results with the seepage exit opening of 0.4 cm.
Water 12 02417 g008
Figure 9. Comparison between predicted and experimental results with the seepage exit opening of 1 cm.
Water 12 02417 g009
Figure 10. Comparison between predicted and experimental results with the seepage exit opening of 2 cm.
Water 12 02417 g010
Figure 11. Comparison between predicted and experimental results with the seepage exit opening of 3 cm.
Water 12 02417 g011
Figure 12. Estimated critical hydraulic gradient: (a) seepage exit opening of 0.4 cm; (b) seepage exit opening of 1 cm.
Water 12 02417 g012aWater 12 02417 g012b
Table 1. Physical properties of sand specimens.
Particle Diameter (mm)Dry unit Weight (kN/m3)PorosityFriction Angle (Degree)Specific Gravity
0.72517.30.33534.42.65
0.33816.390.3732.92.65
0.09116.20.37732.62.65

