Coastal Flooding Risk Assessment Using a GIS-Based Spatial Multi-Criteria Decision Analysis Approach


Abstract
1. Introduction
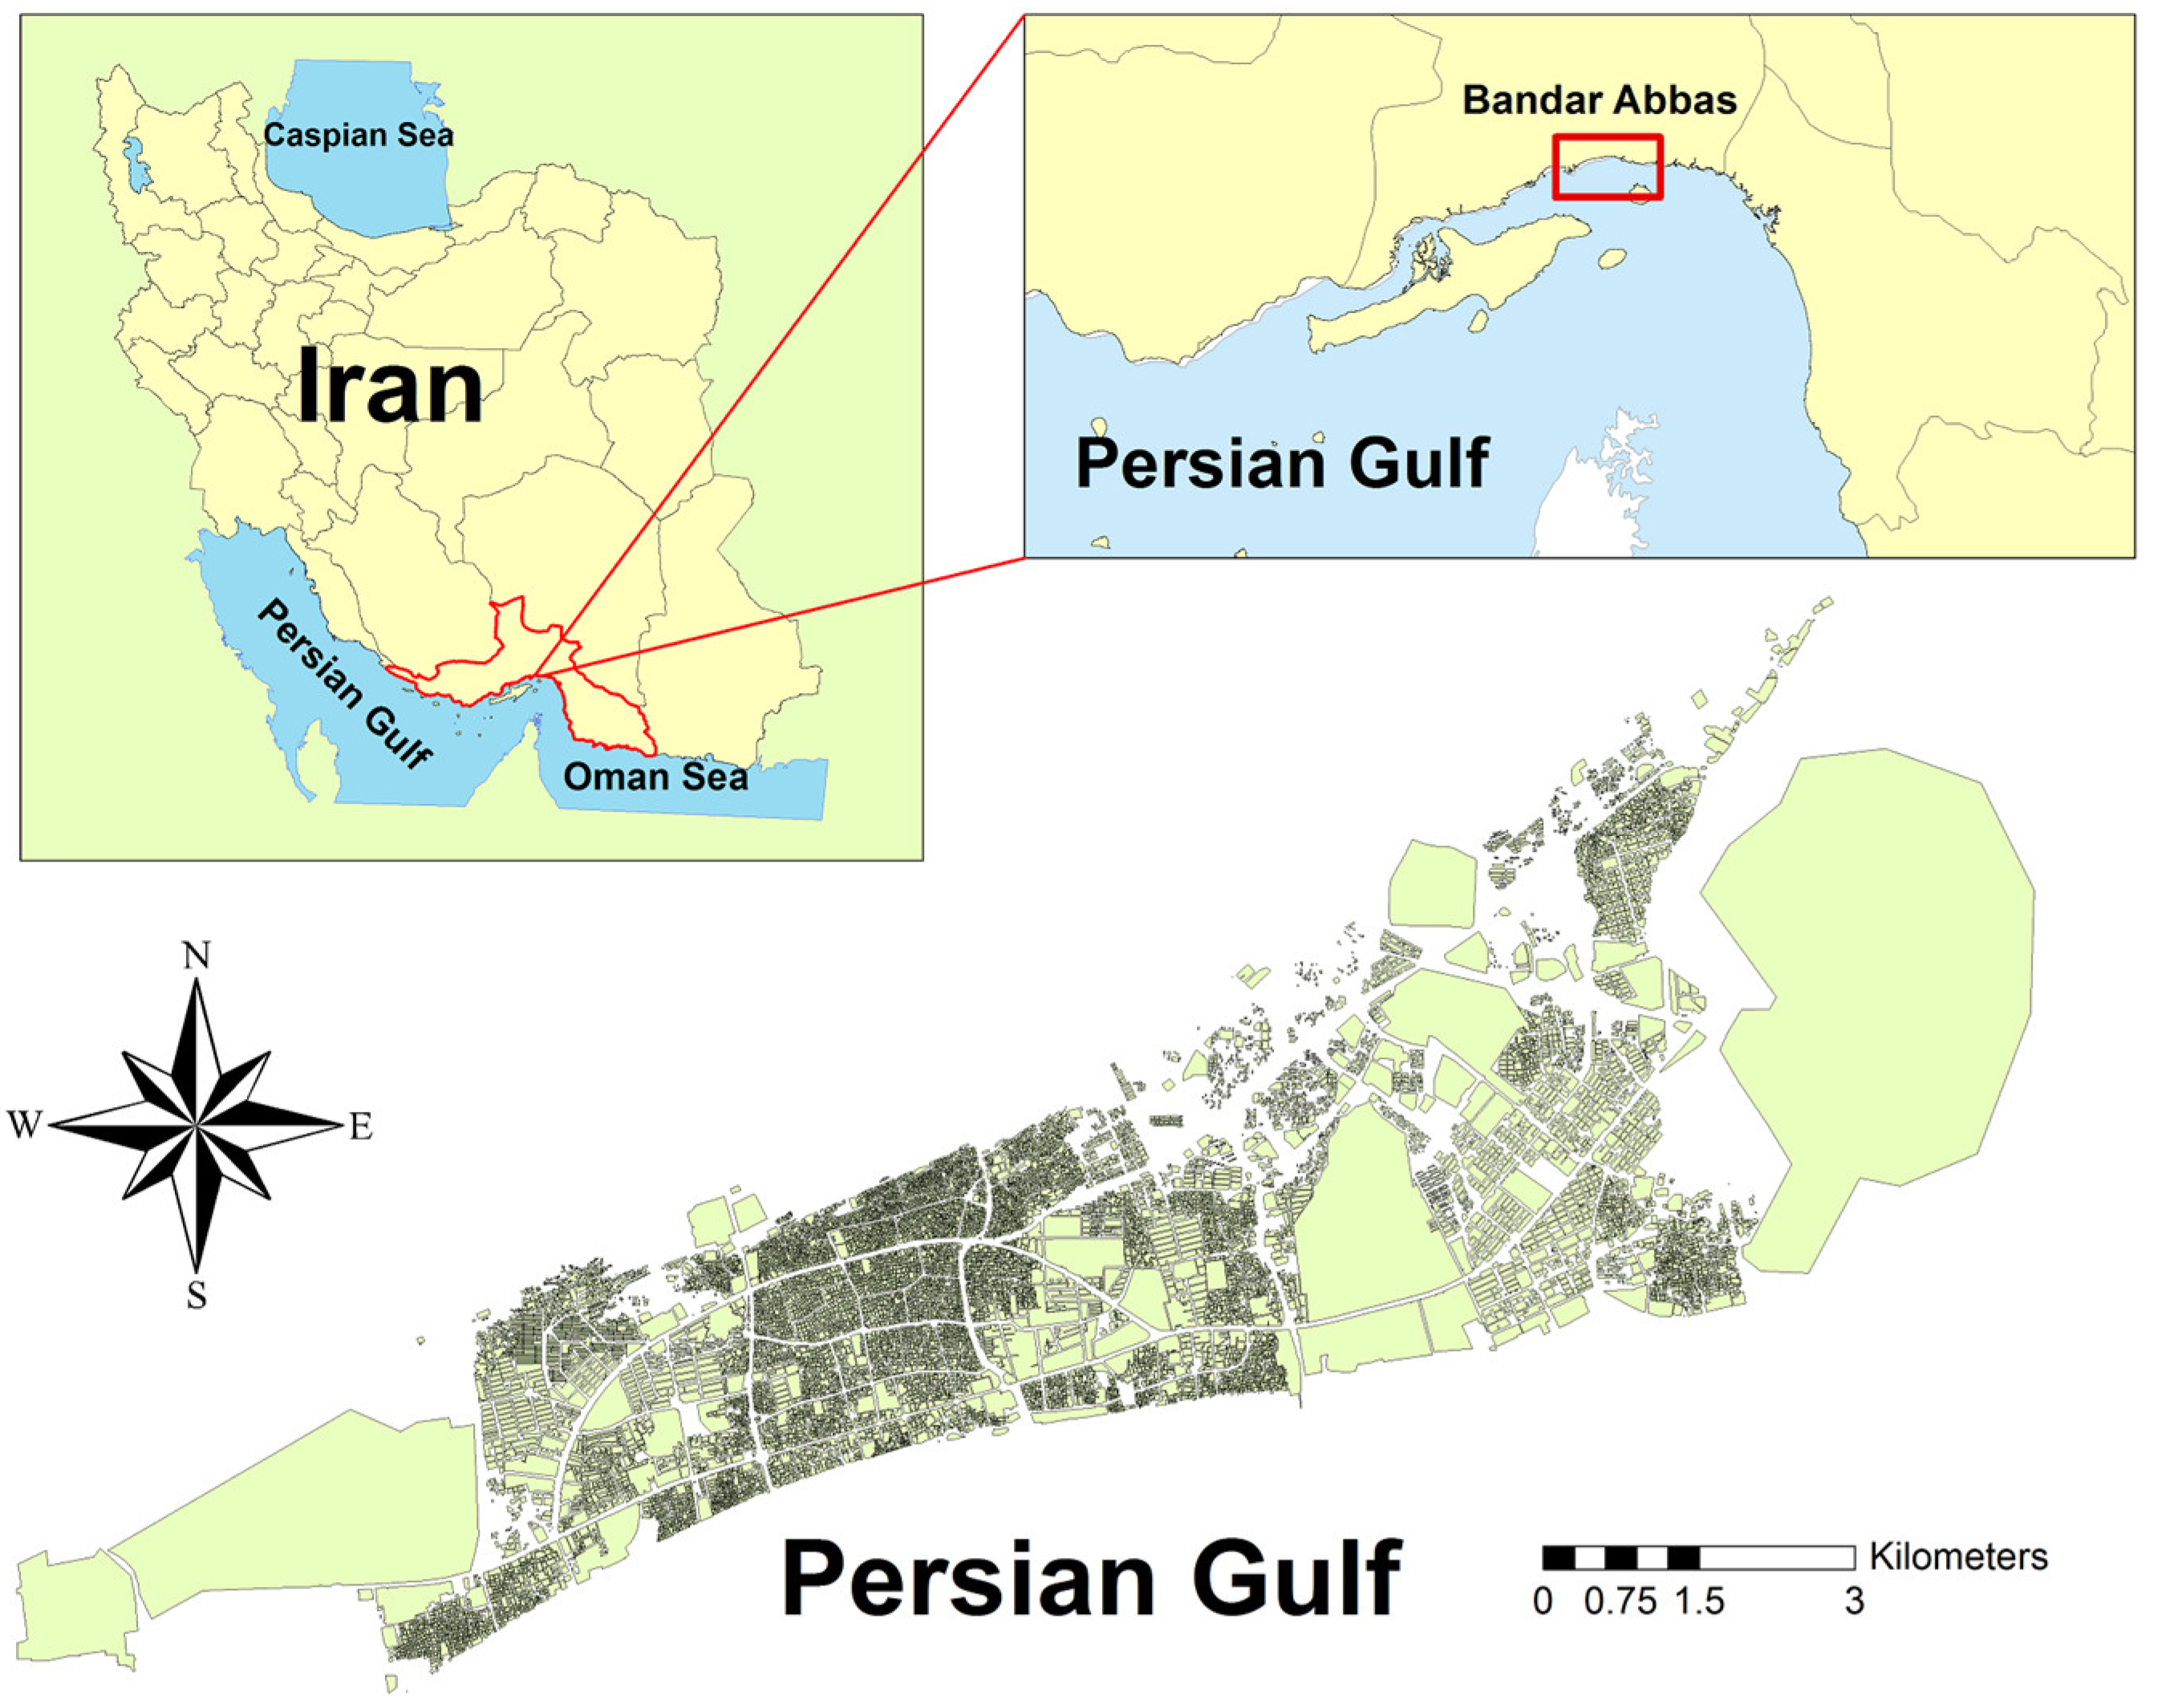
2. Study Area
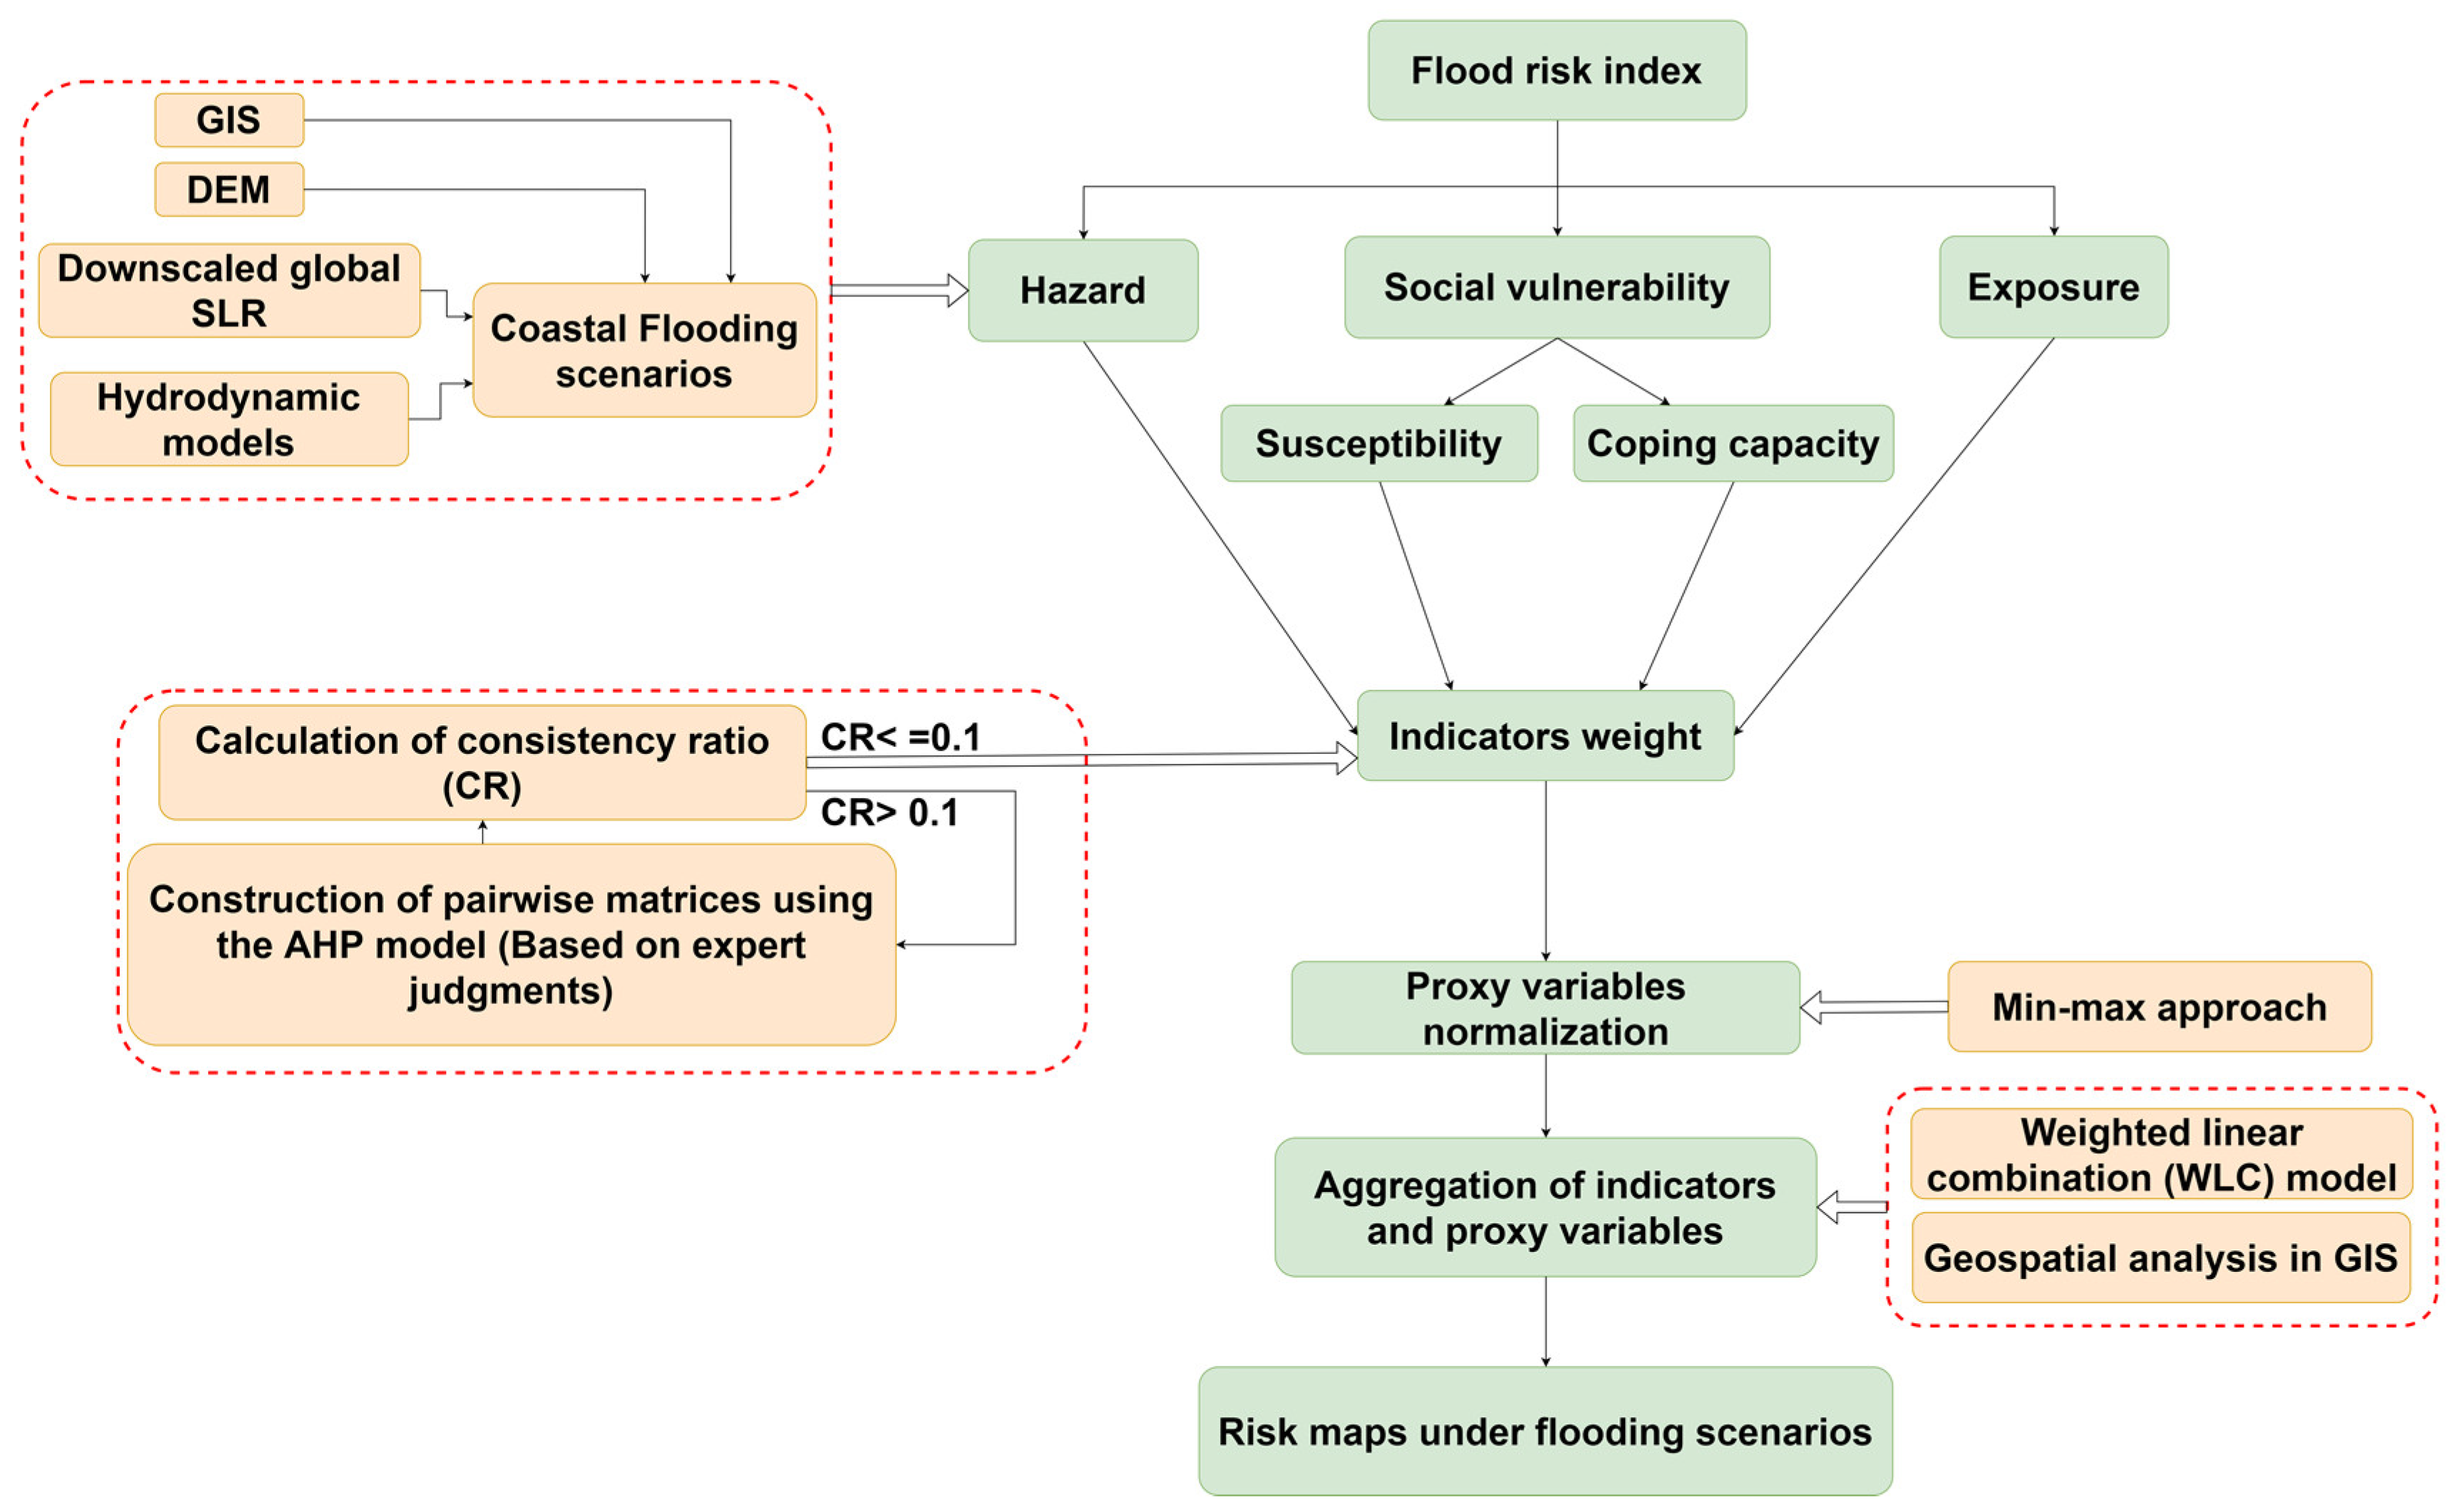
3. Materials and Methods
3.1. Indicators and Proxy Variables Selection and Derivation
3.1.1. Hazard Component
3.1.2. Vulnerability Component
3.1.3. Exposure Component
3.2. Spatial MCDA Approach
3.2.1. Normalizing Proxy Variables
3.2.2. Weighting Indicators
3.2.3. Aggregation Method
4. Results
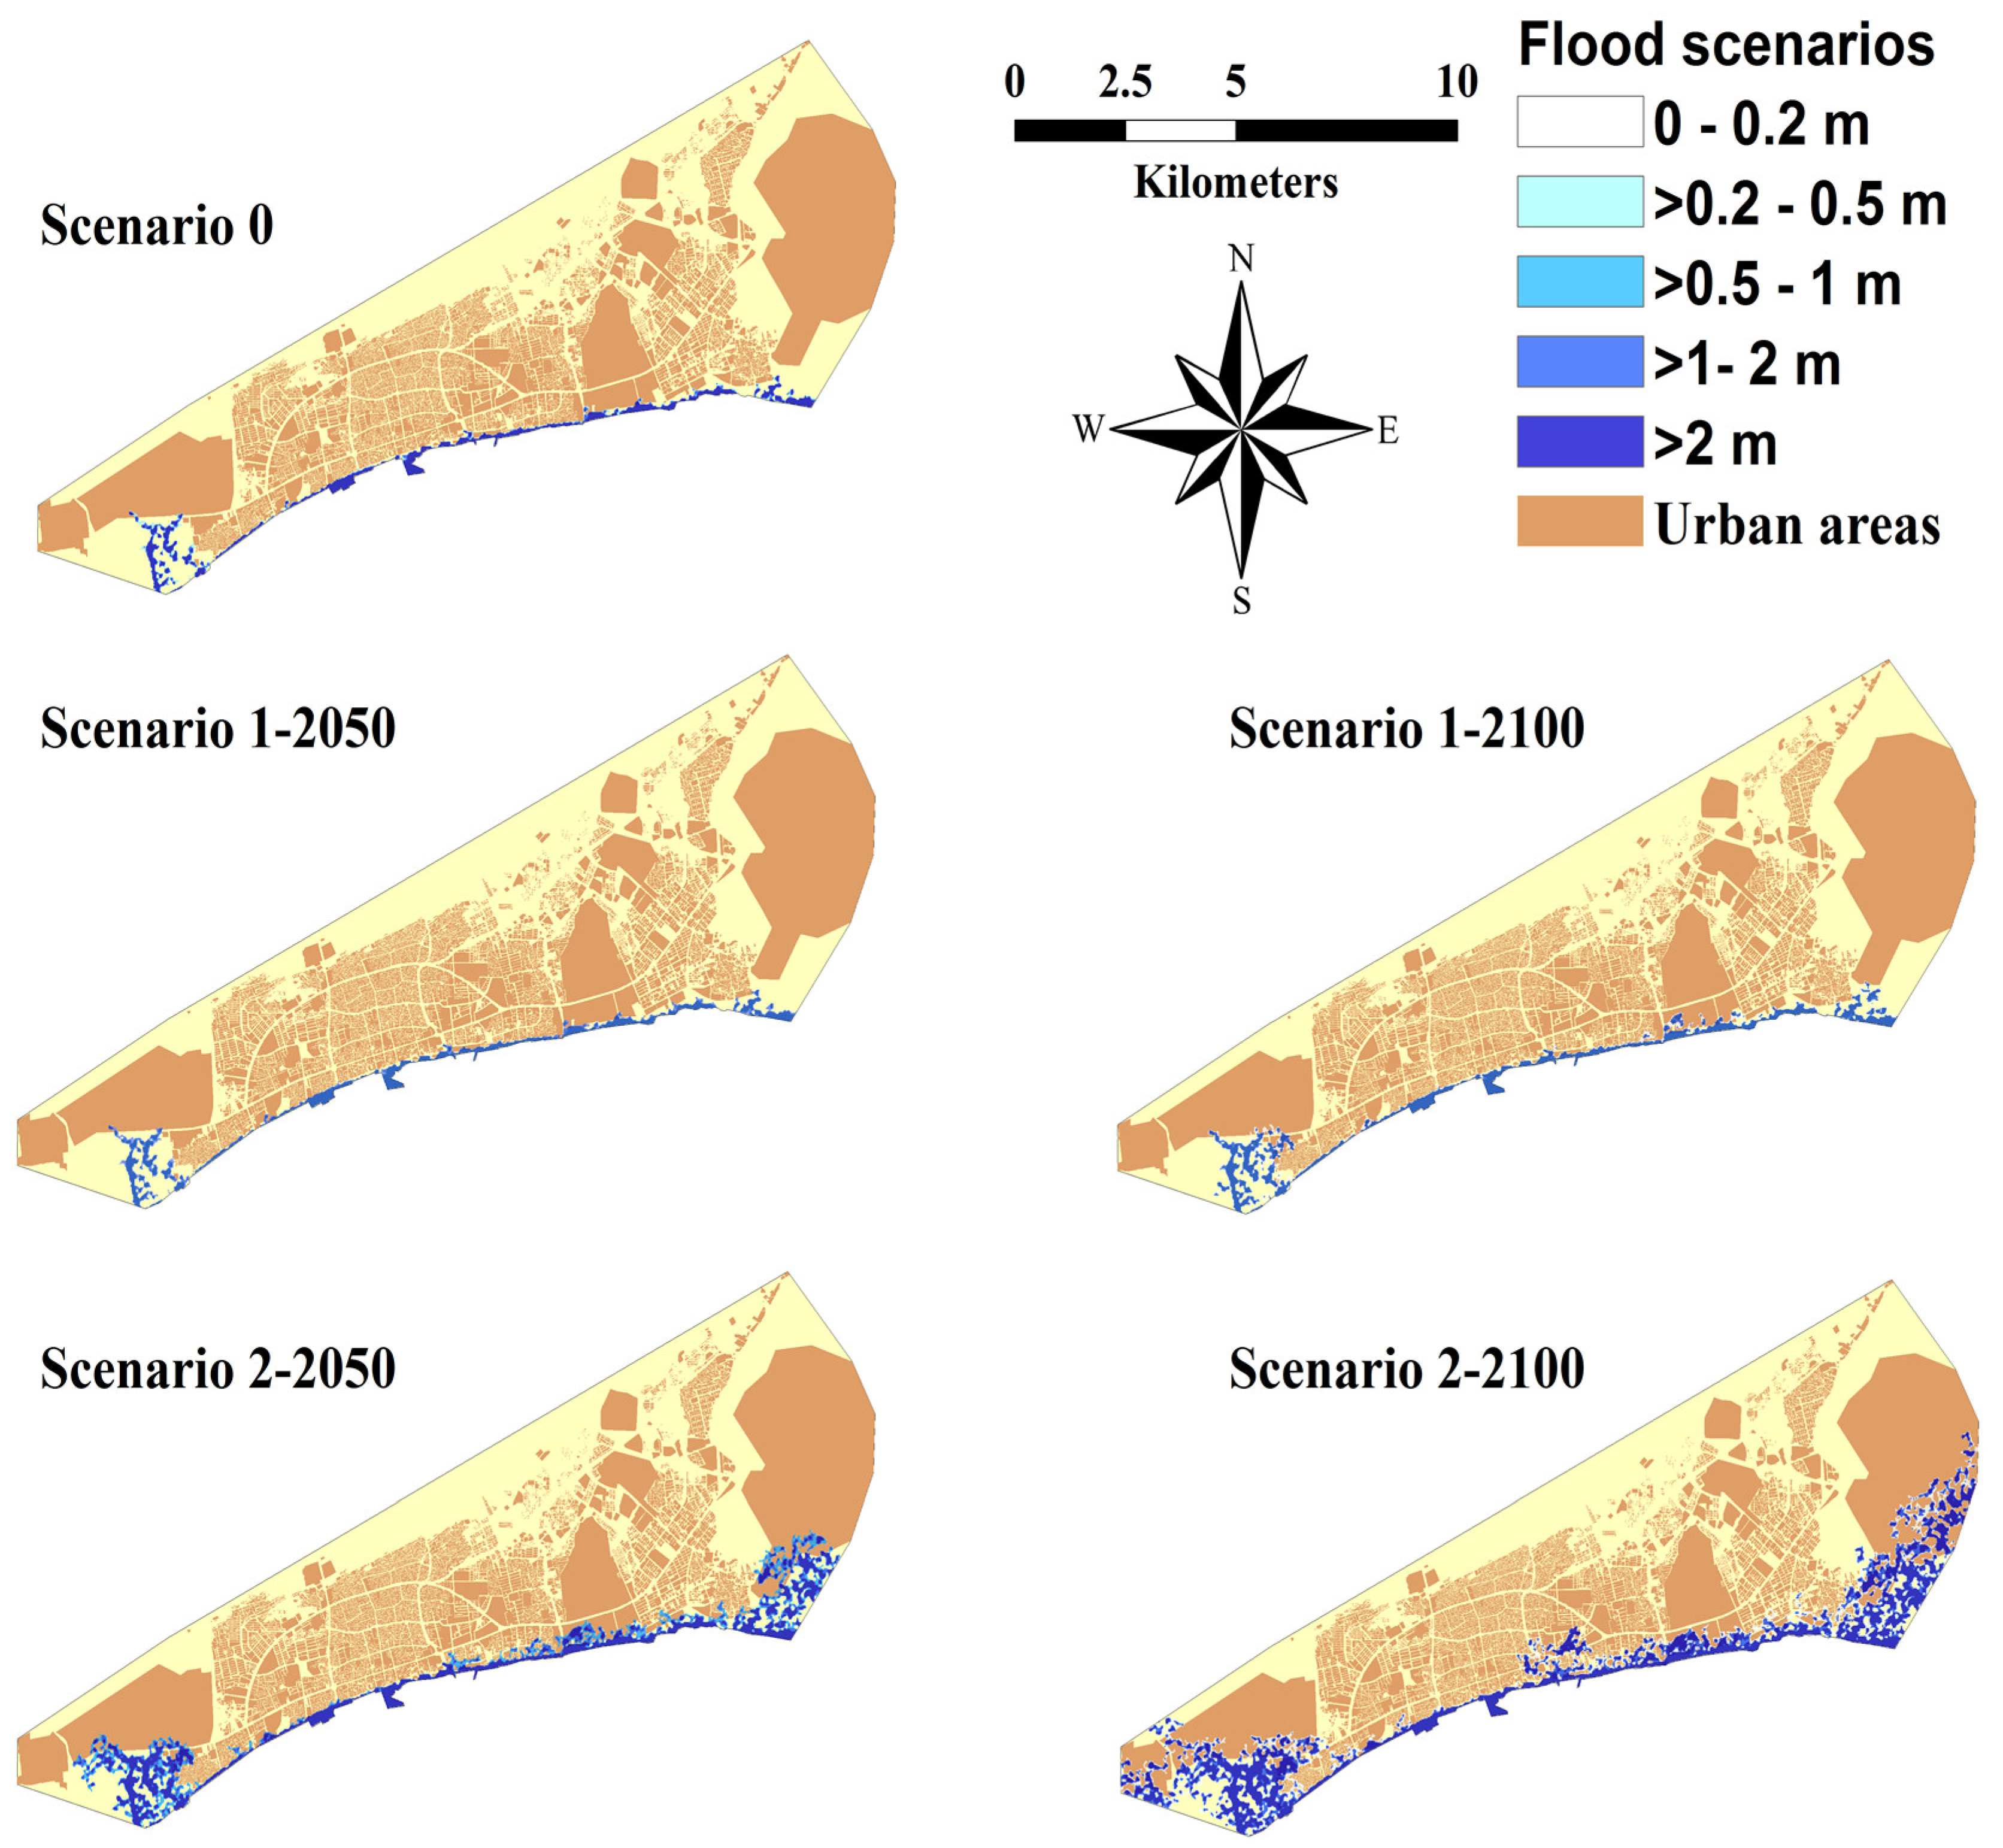
4.1. Flood Hazard Analysis
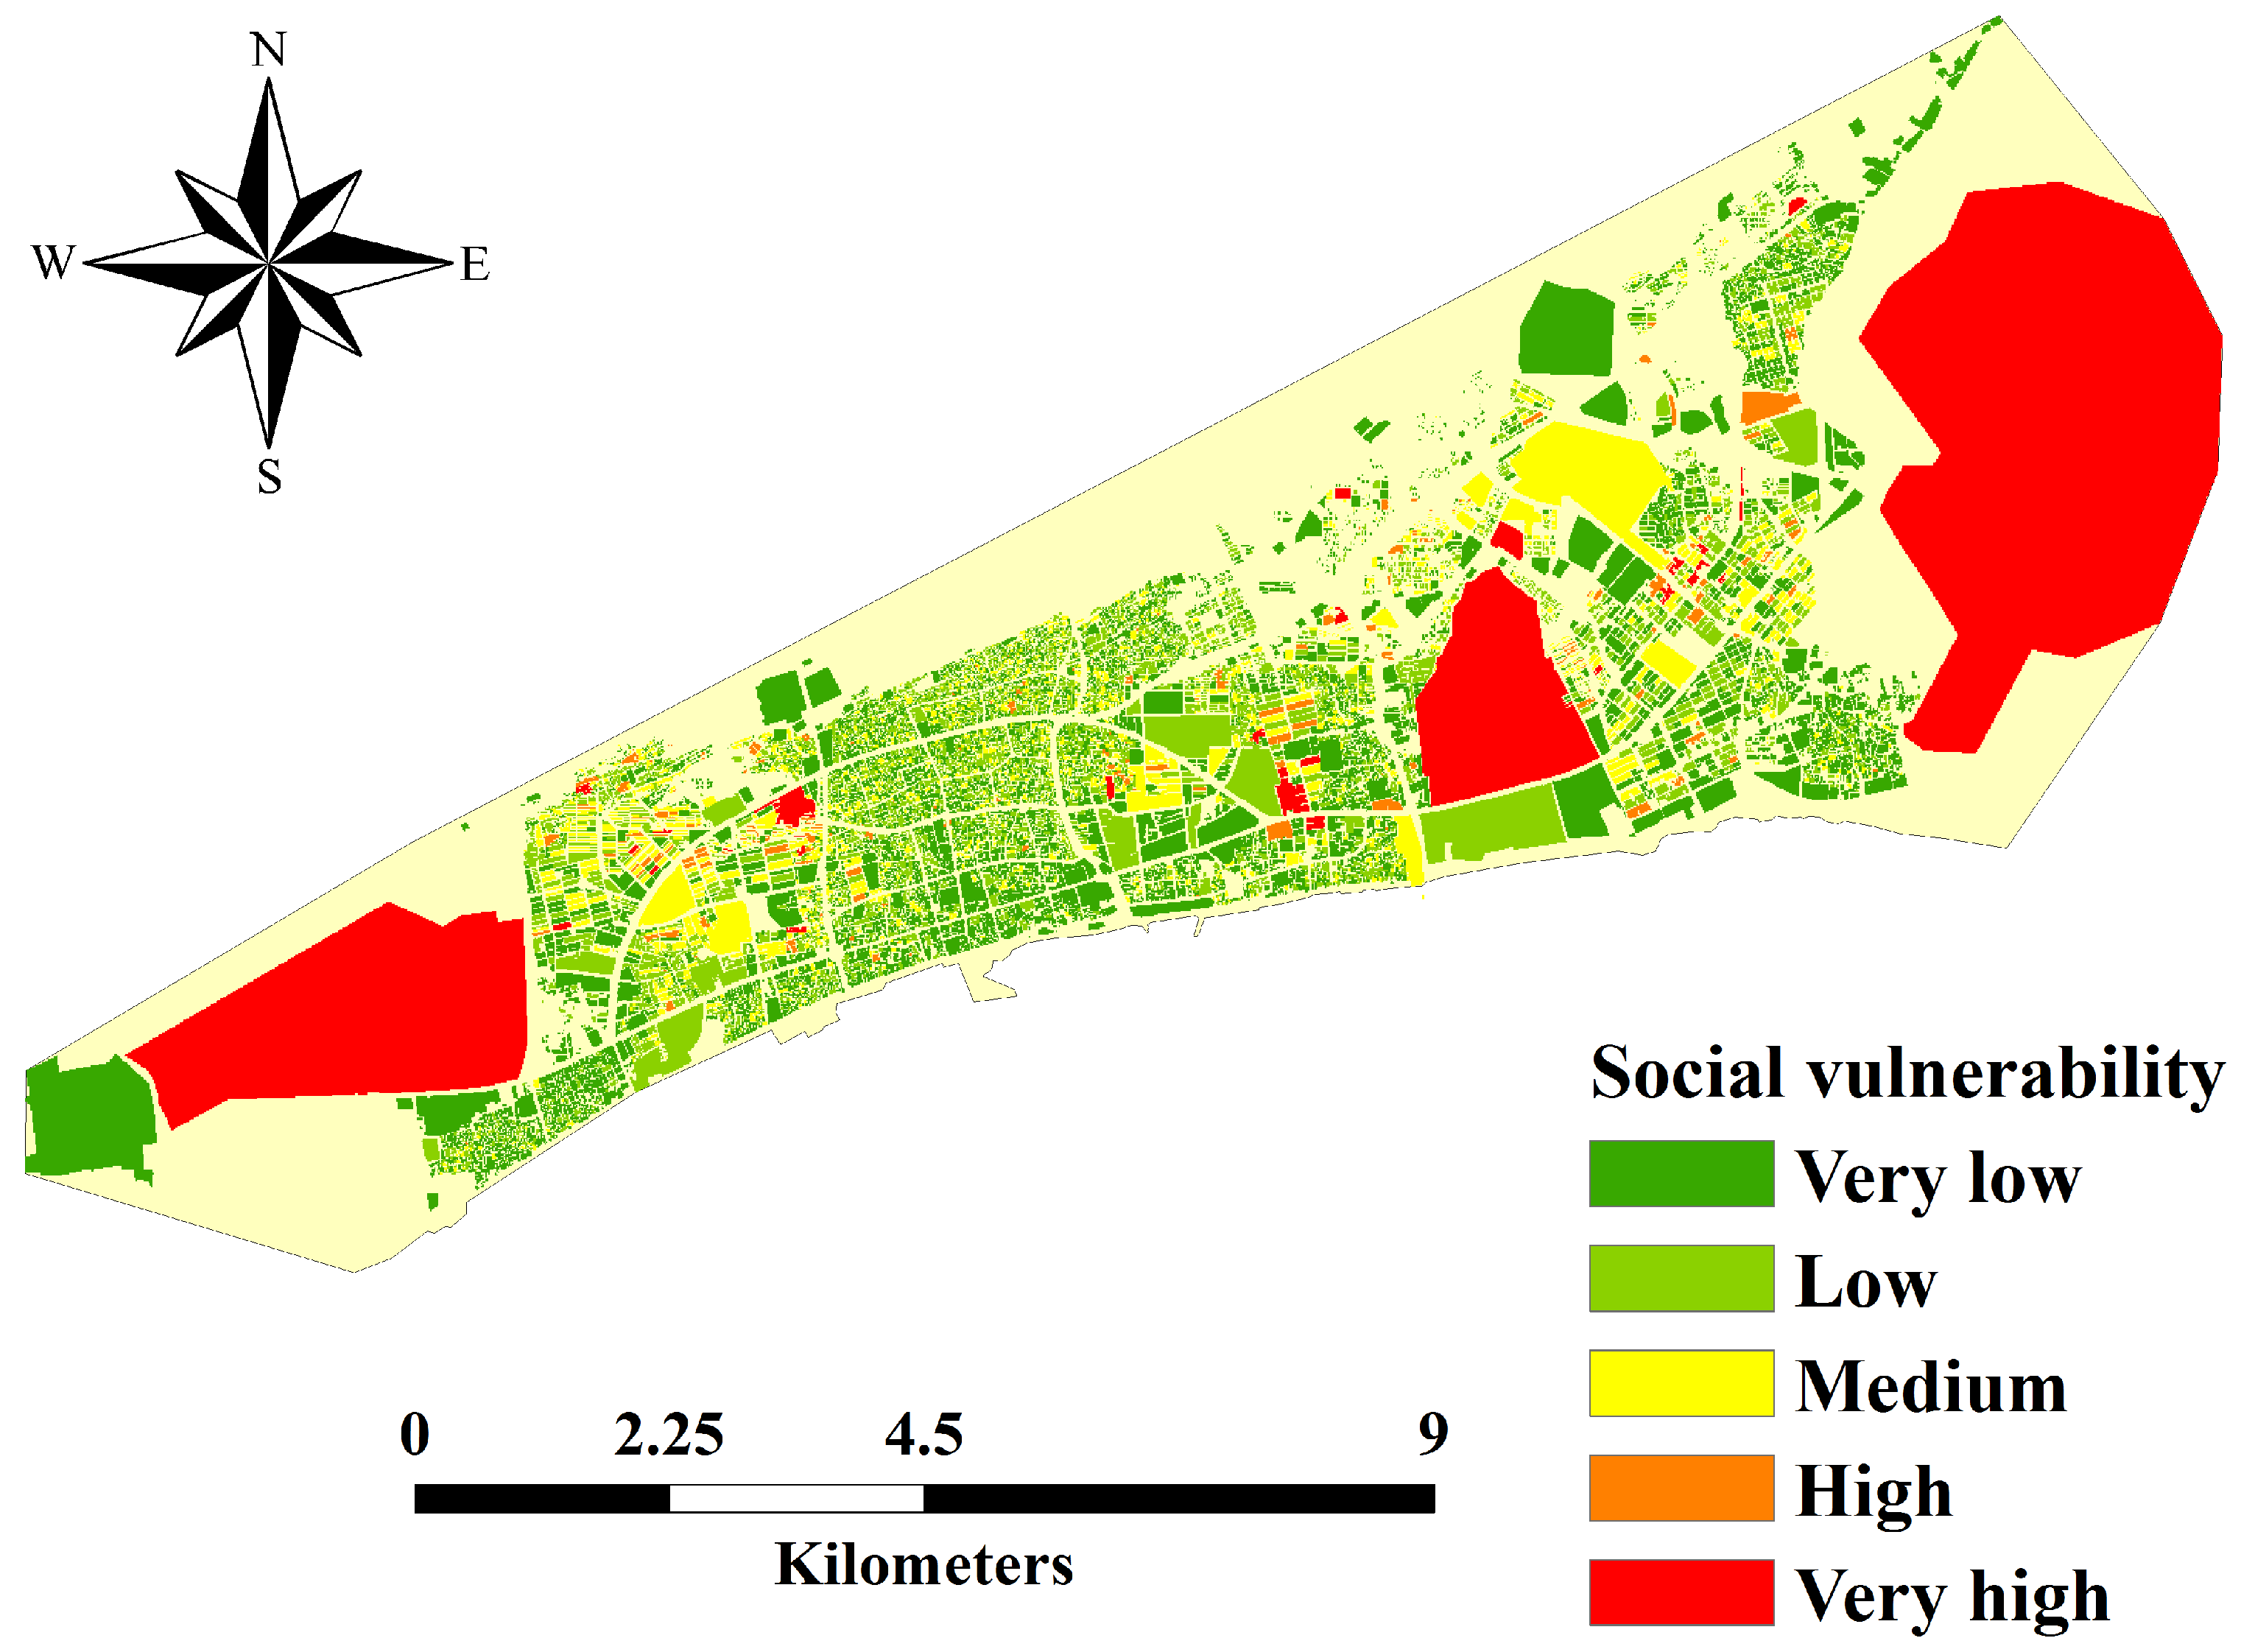
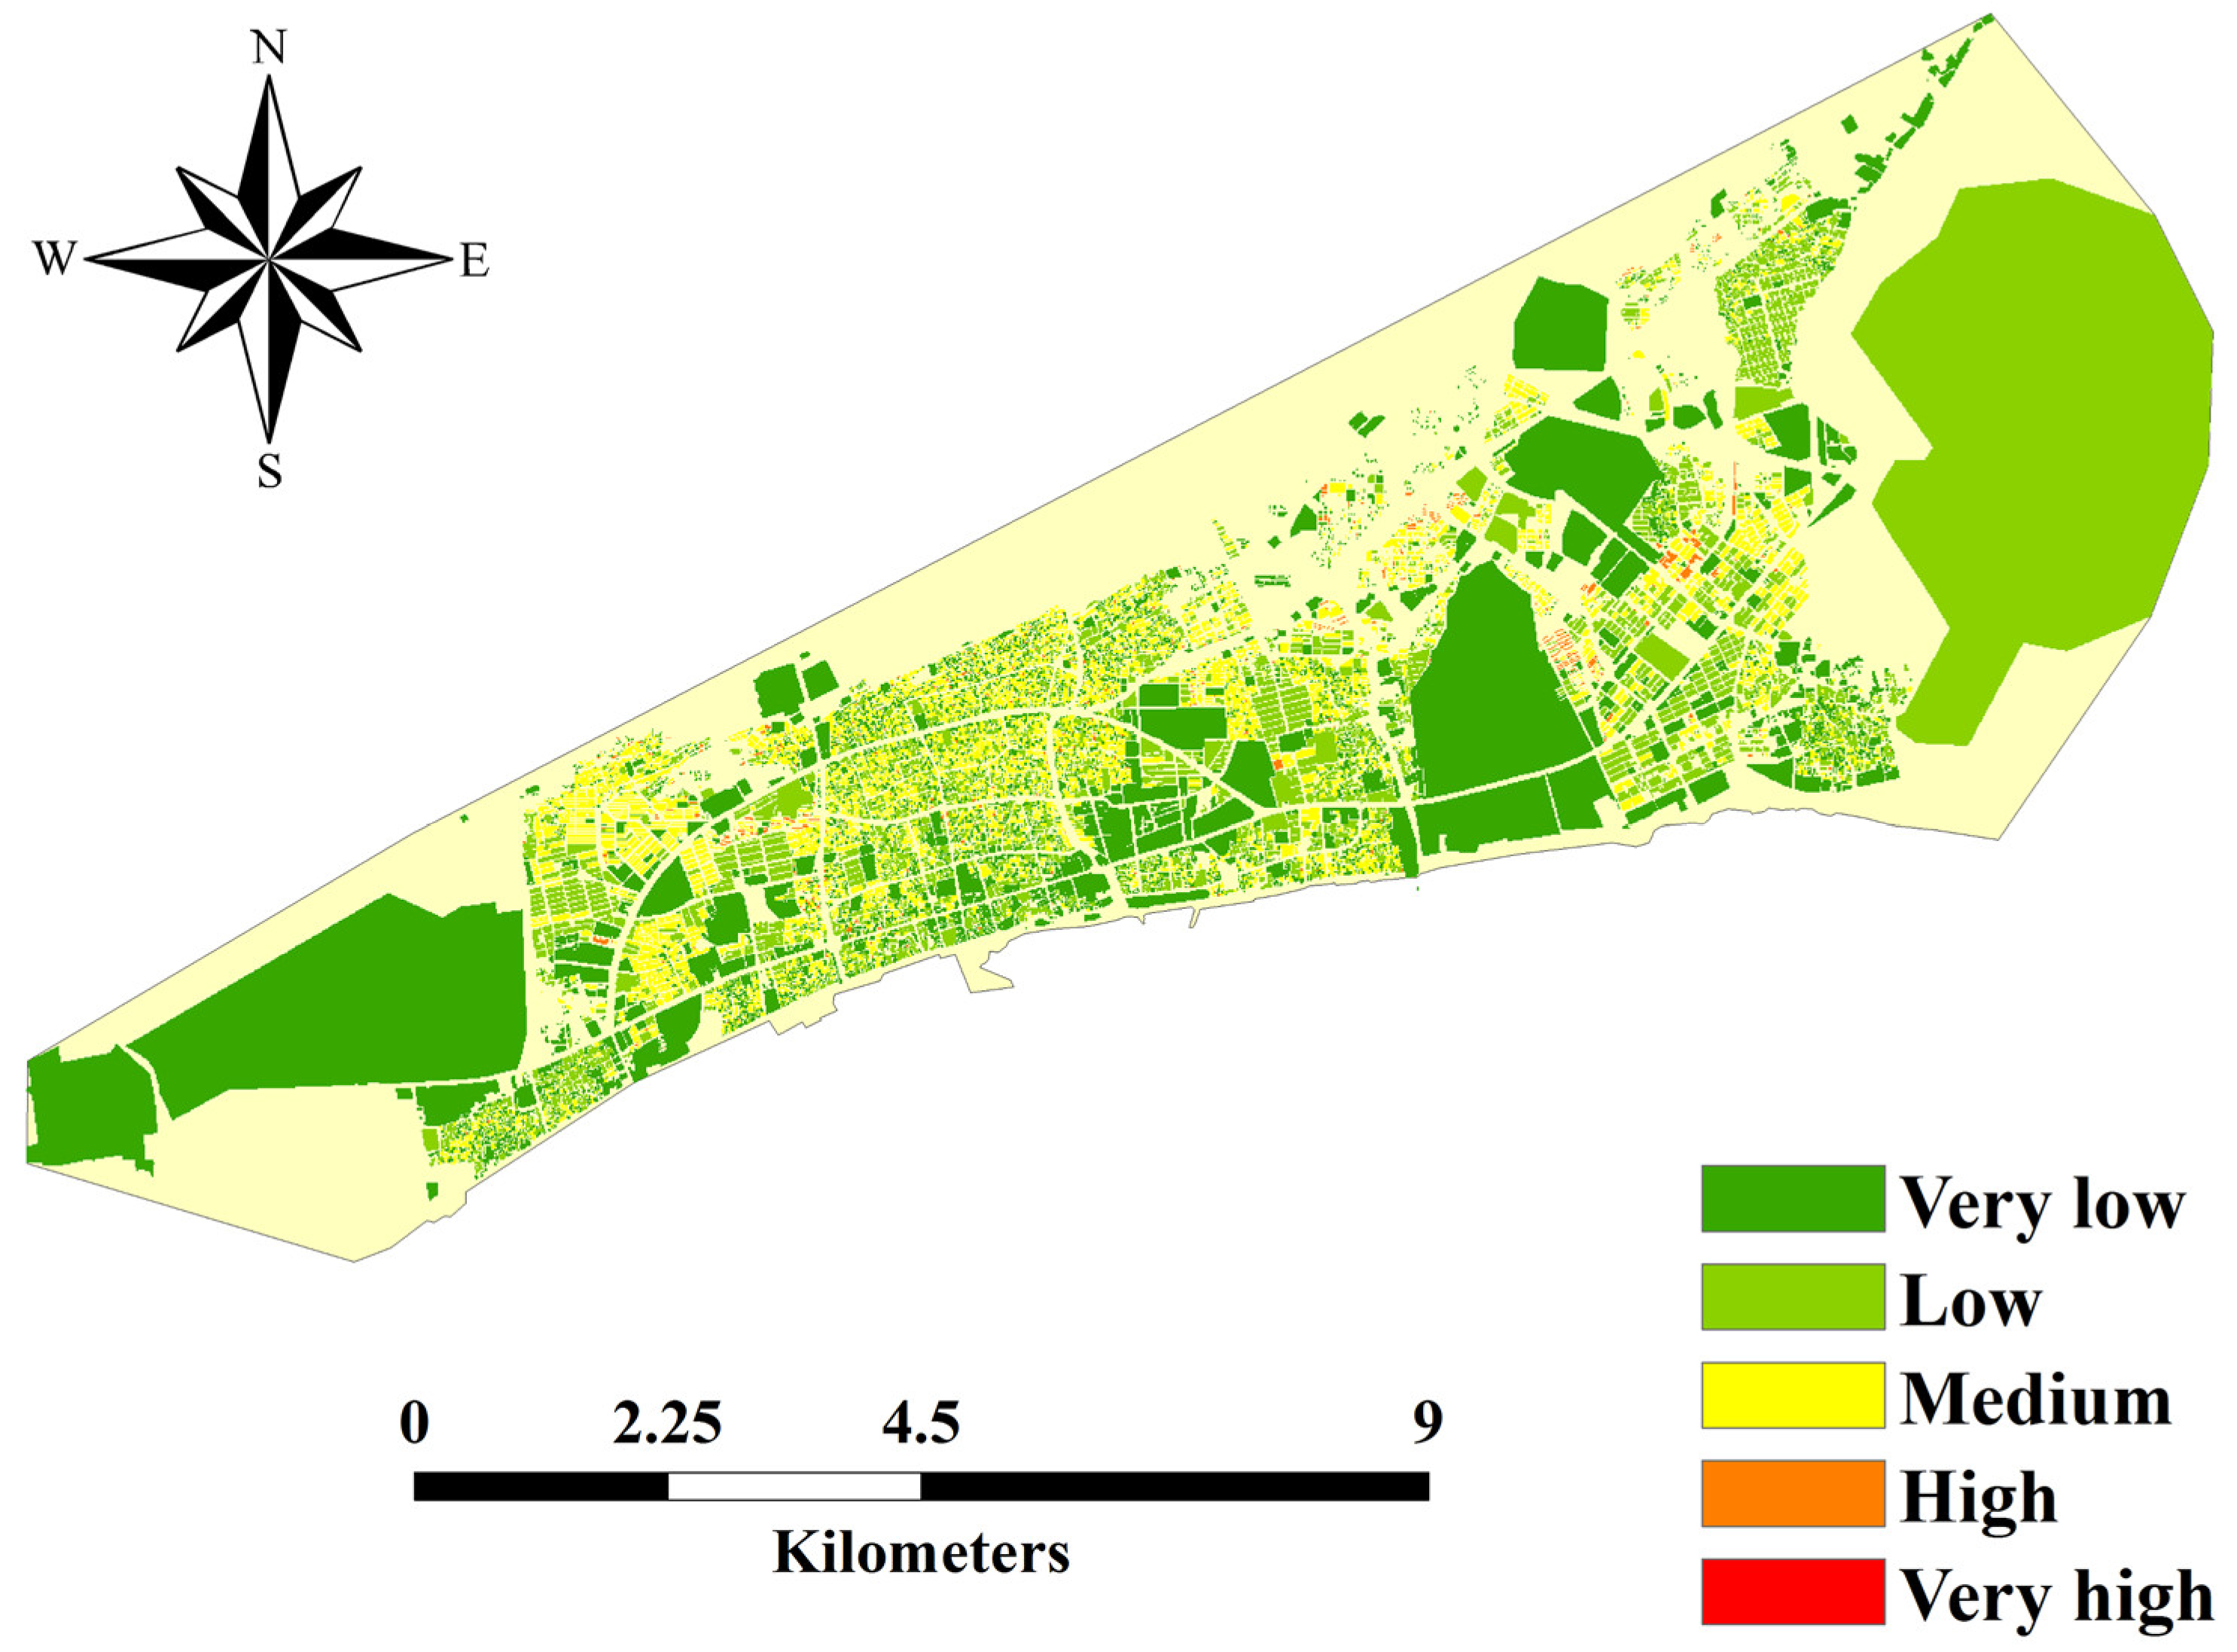
4.2. Vulnerability Analysis
4.3. Exposure Analysis
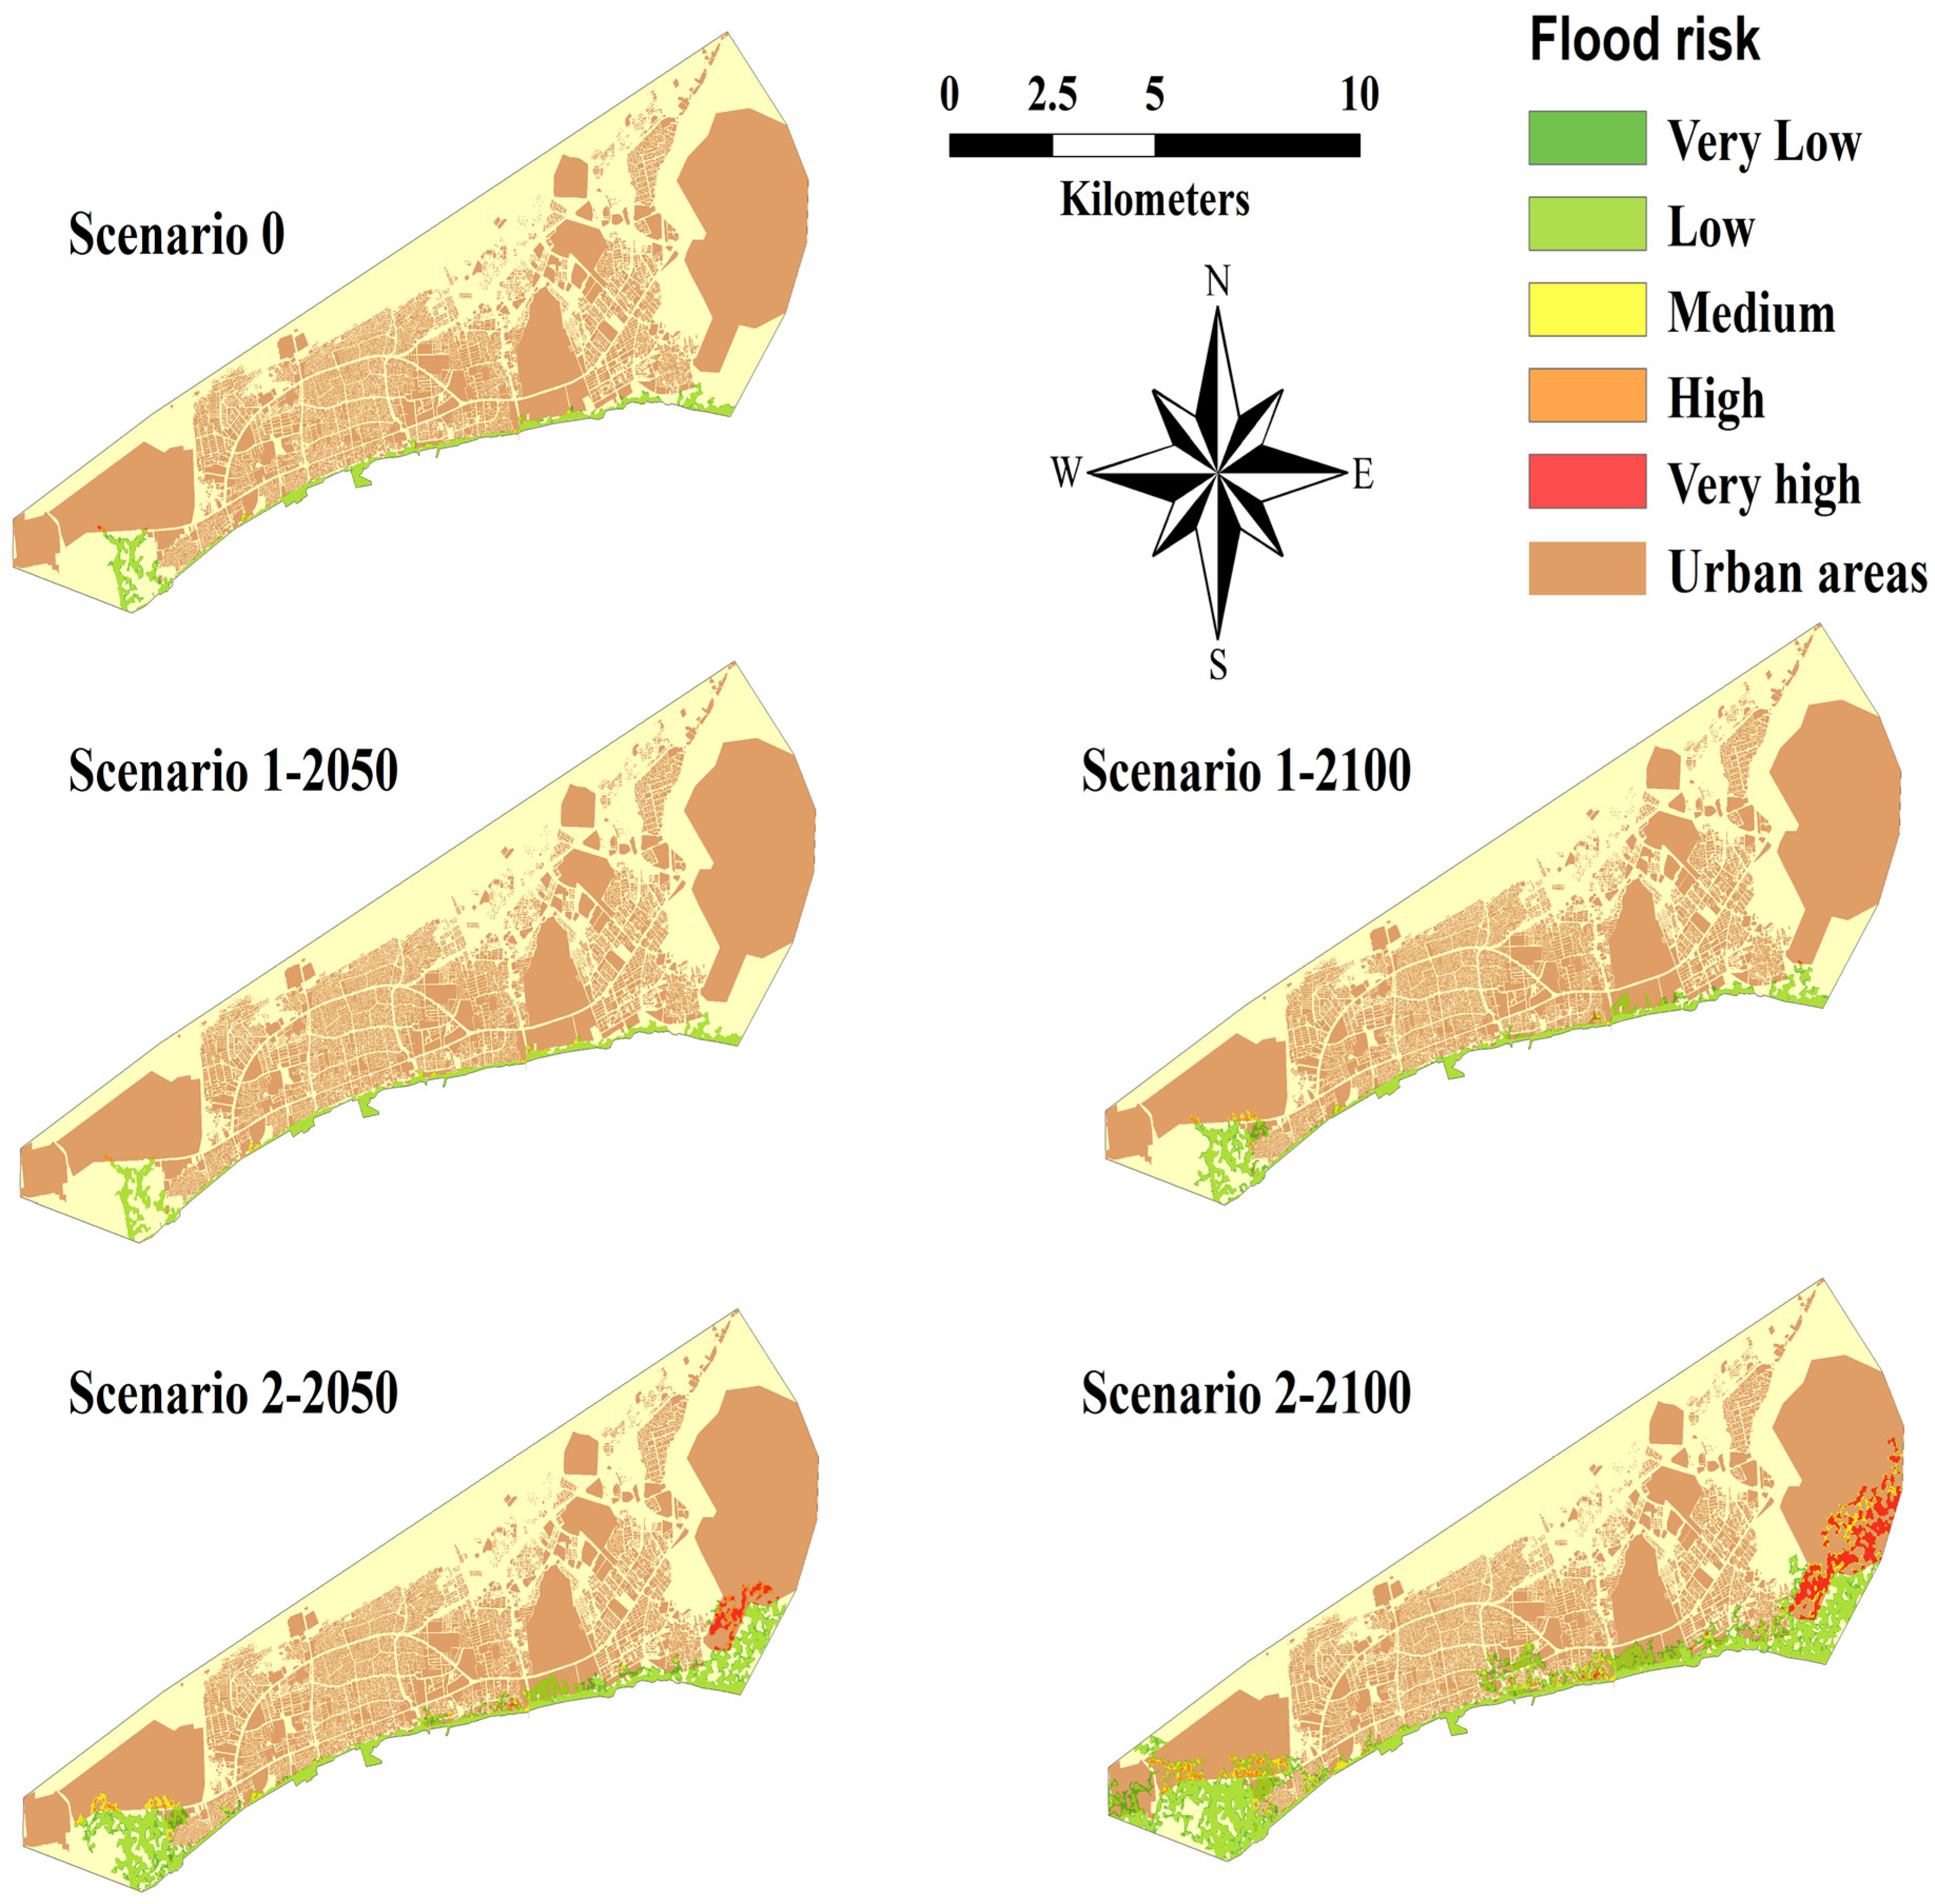
4.4. Flood Risk Assessment
5. Discussion
6. Conclusions
Author Contributions
Funding
Conflicts of Interest
References
- Hanson, S.; Nicholls, R.; Ranger, N.; Hallegatte, S.; Corfee-Morlot, J.; Herweijer, C.; Chateau, J. A global ranking of port cities with high exposure to climate extremes. Clim. Chang. 2011, 104, 89–111. [Google Scholar] [CrossRef]
- Neumann, B.; Vafeidis, A.T.; Zimmermann, J.; Nicholls, R.J. Future coastal population growth and exposure to sea-level rise and coastal flooding—A global assessment. PLoS ONE 2015, 10, e0118571. [Google Scholar] [CrossRef] [PubMed]
- Jongman, B.; Ward, P.J.; Aerts, J.C.J.H. Global exposure to river and coastal flooding: Long term trends and changes. Glob. Environ. Chang. 2012, 22, 823–835. [Google Scholar] [CrossRef]
- IPCC. Summary for Policymakers. In Climate Change 2013: The Physical Science Basis. Contribution of Working Group I to the Fifth Assessment Report of the Intergovernmental Panel on Climate Change; Stocker, T.F., Qin, D., Plattner, G.-K., Tignor, M., Allen, S.K., Boschung, J., Nauels, A., Xia, Y., Bex, V., Midgley, P.M., Eds.; Cambridge University Press: Cambridge, UK; New York, NY, USA, 2013. [Google Scholar]
- Aerts, J.C.; Lin, N.; Botzen, W.; Emanuel, K.; de Moel, H. Low-probability flood risk modeling for New York City. Risk Anal. 2013, 33, 772–788. [Google Scholar] [CrossRef]
- Mori, N.; Kato, M.; Kim, S.; Mase, H.; Shibutani, Y.; Takemi, T.; Tsuboki, K.; Yasuda, T. Local amplification of storm surge by Super Typhoon Haiyan in Leyte Gulf. Geophys. Res. Lett. 2014, 41, 5106–5113. [Google Scholar] [CrossRef]
- Pielke, R.A., Jr.; Gratz, J.; Landsea, C.W.; Collins, D.; Saunders, M.A.; Musulin, R. Normalized hurricane damage in the United States: 1900–2005. Nat. Hazards Rev. 2008, 9, 29–42. [Google Scholar] [CrossRef]
- IPCC. A Special Report of Working Groups I and II of the Intergovernmental Panel on Climate Change. In Managing the Risks of Extreme Events and Disasters to Advance Climate Change Adaptation; Field, C.B., Barros, V., Stocker, T.F., Qin, D., Dokken, D.J., Ebi, K.L., Mastrandrea, M.D., Mach, K.J., Plattner, G.-K., Allen, S.K., et al., Eds.; Cambridge University Press: Cambridge, UK; New York, NY, USA, 2012; p. 582. [Google Scholar]
- Kron, W. Flood Risk = Hazard • Values • Vulnerability. Water Int. 2005, 30, 58–68. [Google Scholar] [CrossRef]
- Hallegatte, S.; Green, C.; Nicholls, R.J.; Corfee-Morlot, J. Future flood losses in major coastal cities. Nat. Clim. Chang. 2013, 3, 802–806. [Google Scholar] [CrossRef]
- Rahmati, O.; Pourghasemi, H.R.; Zeinivand, H. Flood susceptibility mapping using frequency ratio and weights-of-evidence models in the Golastan Province, Iran. Geocarto Int. 2015, 31, 42–70. [Google Scholar] [CrossRef]
- Tehrany, M.S.; Pradhan, B.; Jebur, M.N. Flood susceptibility mapping using a novel ensemble weights-of-evidence and support vector machine models in GIS. J. Hydrol. 2014, 512, 332–343. [Google Scholar] [CrossRef]
- Kazakis, N.; Kougias, I.; Patsialis, T. Assessment of flood hazard areas at a regional scale using an index-based approach and Analytical Hierarchy Process: Application in Rhodope-Evros region, Greece. Sci. Total Environ. 2015, 538, 555–563. [Google Scholar] [CrossRef] [PubMed]
- Gigović, L.; Pamučar, D.; Bajić, Z.; Drobnjak, S. Application of GIS-Interval Rough AHP Methodology for Flood Hazard Mapping in Urban Areas. Water 2017, 9, 360. [Google Scholar] [CrossRef]
- Youssef, A.M.; Pradhan, B.; Sefry, S.A. Flash flood susceptibility assessment in Jeddah city (Kingdom of Saudi Arabia) using bivariate and multivariate statistical models. Environ. Earth Sci. 2015, 75, 12. [Google Scholar] [CrossRef]
- Wang, Y.; Hong, H.; Chen, W.; Li, S.; Pamučar, D.; Gigović, L.; Drobnjak, S.; Bui, D.T.; Duan, H. A Hybrid GIS Multi-Criteria Decision-Making Method for Flood Susceptibility Mapping at Shangyou, China. Remote Sens. 2018, 11, 62. [Google Scholar] [CrossRef]
- Hong, H.; Tsangaratos, P.; Ilia, I.; Liu, J.; Zhu, A.X.; Chen, W. Application of fuzzy weight of evidence and data mining techniques in construction of flood susceptibility map of Poyang County, China. Sci. Total Environ. 2018, 625, 575–588. [Google Scholar] [CrossRef] [PubMed]
- Wang, Y.; Fang, Z.; Hong, H.; Peng, L. Flood susceptibility mapping using convolutional neural network frameworks. J. Hydrol. 2020, 582, 124482. [Google Scholar] [CrossRef]
- Tehrany, M.S.; Pradhan, B.; Mansor, S.; Ahmad, N. Flood susceptibility assessment using GIS-based support vector machine model with different kernel types. Catena 2015, 125, 91–101. [Google Scholar] [CrossRef]
- Khosravi, K.; Pham, B.T.; Chapi, K.; Shirzadi, A.; Shahabi, H.; Revhaug, I.; Prakash, I.; Bui, D.T. A comparative assessment of decision trees algorithms for flash flood susceptibility modeling at Haraz watershed, northern Iran. Sci. Total Environ. 2018, 627, 744–755. [Google Scholar] [CrossRef]
- Chen, W.; Li, Y.; Xue, W.; Shahabi, H.; Li, S.; Hong, H.; Wang, X.; Bian, H.; Zhang, S.; Pradhan, B.; et al. Modeling flood susceptibility using data-driven approaches of naive Bayes tree, alternating decision tree, and random forest methods. Sci. Total Environ. 2020, 701, 134979. [Google Scholar] [CrossRef]
- Costache, R.; Hong, H.; Pham, Q.B. Comparative assessment of the flash-flood potential within small mountain catchments using bivariate statistics and their novel hybrid integration with machine learning models. Sci. Total Environ. 2020, 711, 134514. [Google Scholar] [CrossRef]
- Mechler, R.; Bouwer, L.M. Understanding trends and projections of disaster losses and climate change: Is vulnerability the missing link? Clim. Chang. 2014, 133, 23–35. [Google Scholar] [CrossRef]
- Birkmann, J.; Cardona, O.D.; Carreño, M.L.; Barbat, A.H.; Pelling, M.; Schneiderbauer, S.; Kienberger, S.; Keiler, M.; Alexander, D.; Zeil, P.; et al. Framing vulnerability, risk and societal responses: The MOVE framework. Nat. Hazards 2013, 67, 193–211. [Google Scholar] [CrossRef]
- Cutter, S.L.; Boruff, B.J.; Shirley, W.L. Social vulnerability to environmental hazards. Soc. Sci. Q. 2003, 84, 242–261. [Google Scholar] [CrossRef]
- Füssel, H.-M.; Klein, R.J. Climate change vulnerability assessments: An evolution of conceptual thinking. Clim. Chang. 2006, 75, 301–329. [Google Scholar] [CrossRef]
- Sterlacchini, S.; Akbas, S.O.; Blahut, J.; Mavrouli, O.-C.; Garcia, C.; Luna, B.Q.; Corominas, J. Methods for the Characterization of the Vulnerability of Elements at Risk. In Mountain Risks: From Prediction to Management and Governance; Springer: Dordrecht, The Netherlands, 2014; pp. 233–273. [Google Scholar]
- UNISDR. Global Assessment Report on Disaster Risk Reduction. From Share Risk to Shared Value: The Business Case for Disaster Risk Reduction; United Nations International Strategy for Disaster Reduction Secretariat: Geneva, Switzerland, 2013. [Google Scholar]
- Merz, B.; Kreibich, H.; Schwarze, R.; Thieken, A. Review article “Assessment of economic flood damage”. Nat. Hazards Earth Syst. Sci. 2010, 10, 1697–1724. [Google Scholar] [CrossRef]
- De Moel, H.; Jongman, B.; Kreibich, H.; Merz, B.; Penning-Rowsell, E.; Ward, P.J. Flood risk assessments at different spatial scales. Mitig. Adapt. Strat. Glob. Chang. 2015, 20, 865–890. [Google Scholar] [CrossRef] [PubMed]
- Koks, E.E.; Jongman, B.; Husby, T.G.; Botzen, W.J.W. Combining hazard, exposure and social vulnerability to provide lessons for flood risk management. Environ. Sci. Policy 2015, 47, 42–52. [Google Scholar] [CrossRef]
- Adger, W.N. Social vulnerability to climate change and extremes in coastal Vietnam. World Dev. 1999, 27, 249–269. [Google Scholar] [CrossRef]
- Brooks, N. Vulnerability, risk and adaptation: A conceptual framework. Tyndall Cent. Clim. Chang. Res. Work. Pap. 2003, 38, 1–16. [Google Scholar]
- Tapsell, S.; McCarthy, S.; Faulkner, H.; Alexander, M. Social vulnerability to natural hazards. In State of the Art Report from CapHaz-Net’s WP4; Middlesex University: London, UK, 2010. [Google Scholar]
- Hadipour, V.; Vafaie, F.; Kerle, N. An indicator-based approach to assess social vulnerability of coastal areas to sea-level rise and flooding: A case study of Bandar Abbas city, Iran. Ocean Coast. Manag. 2020, 188, 105077. [Google Scholar] [CrossRef]
- Teo, M.; Goonetilleke, A.; Deilami, K.; Ahankoob, A.; Lawie, M. Engaging residents from different ethnic and language backgrounds in disaster preparedness. Int. J. Disaster Risk Reduct. 2019, 39, 101245. [Google Scholar] [CrossRef]
- Christie, E.K.; Spencer, T.; Owen, D.; McIvor, A.L.; Möller, I.; Viavattene, C. Regional coastal flood risk assessment for a tidally dominant, natural coastal setting: North Norfolk, southern North Sea. Coast. Eng. 2017, 134, 177–190. [Google Scholar] [CrossRef]
- Percival, S.; Teeuw, R. A methodology for urban micro-scale coastal flood vulnerability and risk assessment and mapping. Nat. Hazards 2019, 97, 355–377. [Google Scholar] [CrossRef]
- Teo, M.; Goonetilleke, A.; Ahankoob, A.; Deilami, K.; Lawie, M. Disaster awareness and information seeking behaviour among residents from low socio-economic backgrounds. Int. J. Disaster Risk Reduct. 2018, 31, 1121–1131. [Google Scholar] [CrossRef]
- Fekete, A. Spatial disaster vulnerability and risk assessments: Challenges in their quality and acceptance. Nat. Hazards 2011, 61, 1161–1178. [Google Scholar] [CrossRef]
- Saaty, T.L. The Analytic Hierarchy Process: Planning, Priority Setting, Resources Allocation; McGraw-Hill: New York, NY, USA, 1980; p. 281. [Google Scholar]
- Malczewski, J. GIS-based multicriteria decision analysis: A survey of the literature. Int. J. Geogr. Inf. Sci. 2006, 20, 703–726. [Google Scholar] [CrossRef]
- Cai, T.; Li, X.; Ding, X.; Wang, J.; Zhan, J. Flood risk assessment based on hydrodynamic model and fuzzy comprehensive evaluation with GIS technique. Int. J. Disaster Risk Reduct. 2019, 35, 101077. [Google Scholar] [CrossRef]
- Lin, K.; Chen, H.; Xu, C.-Y.; Yan, P.; Lan, T.; Liu, Z.; Dong, C. Assessment of flash flood risk based on improved analytic hierarchy process method and integrated maximum likelihood clustering algorithm. J. Hydrol. 2020, 584, 124696. [Google Scholar] [CrossRef]
- Luu, C.; von Meding, J. A Flood Risk Assessment of Quang Nam, Vietnam Using Spatial Multicriteria Decision Analysis. Water 2018, 10, 461. [Google Scholar] [CrossRef]
- Lyu, H.-M.; Shen, S.-L.; Zhou, A.; Yang, J. Perspectives for flood risk assessment and management for mega-city metro system. Tunn. Undergr. Space Technol. 2019, 84, 31–44. [Google Scholar] [CrossRef]
- Meyer, V.; Scheuer, S.; Haase, D. A multicriteria approach for flood risk mapping exemplified at the Mulde river, Germany. Nat. Hazards 2008, 48, 17–39. [Google Scholar] [CrossRef]
- Ouma, Y.; Tateishi, R. Urban Flood Vulnerability and Risk Mapping Using Integrated Multi-Parametric AHP and GIS: Methodological Overview and Case Study Assessment. Water 2014, 6, 1515–1545. [Google Scholar] [CrossRef]
- Wang, Y.; Li, Z.; Tang, Z.; Zeng, G. A GIS-Based Spatial Multi-Criteria Approach for Flood Risk Assessment in the Dongting Lake Region, Hunan, Central China. Water Resour. Manag. 2011, 25, 3465–3484. [Google Scholar] [CrossRef]
- Zhang, D.; Shi, X.; Xu, H.; Jing, Q.; Pan, X.; Liu, T.; Wang, H.; Hou, H. A GIS-based spatial multi-index model for flood risk assessment in the Yangtze River Basin, China. Environ. Impact Assess. Rev. 2020, 83, 106397. [Google Scholar] [CrossRef]
- Hsu, T.-W.; Shih, D.-S.; Li, C.-Y.; Lan, Y.-J.; Lin, Y.-C. A Study on Coastal Flooding and Risk Assessment under Climate Change in the Mid-Western Coast of Taiwan. Water 2017, 9, 390. [Google Scholar] [CrossRef]
- Li, M.; Wu, W.; Wang, J.; Che, Z.; Xie, Y. Simulating and mapping the risk of surge floods in multiple typhoon scenarios: A case study of Yuhuan County, Zhejiang Province, China. Stoch. Environ. Res. Risk Assess. 2016, 31, 645–659. [Google Scholar] [CrossRef]
- Liu, Y.; Lu, C.; Yang, X.; Wang, Z.; Liu, B. Fine-Scale Coastal Storm Surge Disaster Vulnerability and Risk Assessment Model: A Case Study of Laizhou Bay, China. Remote Sens. 2020, 12, 1301. [Google Scholar] [CrossRef]
- Cozannet, G.L.; Garcin, M.; Bulteau, T.; Mirgon, C.; Yates, M.L.; Méndez, M.; Baills, A.; Idier, D.; Oliveros, C. An AHP-derived method for mapping the physical vulnerability of coastal areas at regional scales. Nat. Hazards Earth Syst. Sci. 2013, 13, 1209–1227. [Google Scholar] [CrossRef]
- ISC. Census Data; Iranian Statistic Center: Tehran, Iran, 2012.
- Dadras, M.; Shafri, H.Z.; Ahmad, N.; Pradhan, B.; Safarpour, S. Land use/cover change detection and urban sprawl analysis in Bandar Abbas city, Iran. Sci. World J. 2014, 2014, 690872. [Google Scholar] [CrossRef]
- Fritz, H.M.; Blount, C.D.; Albusaidi, F.B.; Al-Harthy, A.H.M. Cyclone Gonu storm surge in Oman. Estuar. Coast. Shelf Sci. 2010, 86, 102–106. [Google Scholar] [CrossRef]
- IPCC. Climate Change: Impacts, Adaptation, and Vulnerability. Part A: Global and Sectoral Aspects. Contribution of Working Group II to the Fifth Assessment Report of the Intergovernmental Panel on Climate Change; Field, C.B., Barros, V.R., Dokken, D.J., Mach, K.J., Mastrandrea, M.D., Bilir, T.E., Chatterjee, M., Ebi, K.L., Estrada, Y.O., Genova, R.C., et al., Eds.; Cambridge University Press: Cambridge, UK; New York, NY, USA, 2014; p. 1132. [Google Scholar]
- Irani, M. Vulnerability Assessment to Seawater Intrusion Coastal Aquifers Affected by Rising Sea Levels Caused by Climate Change (Case Study: Aquifers of Bushehr and Hormozgan Provinces). Master’s Thesis, University of Tehran, Tehran, Iran, 2017. [Google Scholar]
- Harati, A.N. Decesion Support System in Coastal Inundation under Combined Scenarios. Ph.D. Thesis, K.N.Toosi University of Technology, Tehran, Iran, 2012. [Google Scholar]
- Alaska Satellite Facility Distributed Active Archive Data Center. Available online: https://vertex.daac.asf.alaska.edu (accessed on 3 August 2018).
- Muis, S.; Guneralp, B.; Jongman, B.; Aerts, J.C.; Ward, P.J. Flood risk and adaptation strategies under climate change and urban expansion: A probabilistic analysis using global data. Sci. Total Environ. 2015, 538, 445–457. [Google Scholar] [CrossRef] [PubMed]
- Aerts, J.C.; Botzen, W.W.; Emanuel, K.; Lin, N.; De Moel, H.; Michel-Kerjan, E.O. Evaluating flood resilience strategies for coastal megacities. Science 2014, 344, 473–475. [Google Scholar] [CrossRef] [PubMed]
- Merz, B.; Thieken, A.H.; Gocht, M. Flood Risk Mapping at the Local Scale: Concepts and Challenges. In Flood Risk Management in Europe; Springer: Dordrecht, The Netherlands, 2007; pp. 231–251. [Google Scholar]
- Ahsan, M.N.; Warner, J. The socioeconomic vulnerability index: A pragmatic approach for assessing climate change led risks—A case study in the south-western coastal Bangladesh. Int. J. Disaster Risk Reduct. 2014, 8, 32–49. [Google Scholar] [CrossRef]
- Fekete, A. Validation of a social vulnerability index in context to river-floods in Germany. Nat. Hazards Earth Syst. Sci. 2009, 9, 393–403. [Google Scholar] [CrossRef]
- Karagiorgos, K.; Thaler, T.; Hübl, J.; Maris, F.; Fuchs, S. Multi-vulnerability analysis for flash flood risk management. Nat. Hazards 2016, 82, 63–87. [Google Scholar] [CrossRef]
- Zahran, S.; Brody, S.D.; Peacock, W.G.; Vedlitz, A.; Grover, H. Social vulnerability and the natural and built environment: A model of flood casualties in Texas. Disasters 2008, 32, 537–560. [Google Scholar] [CrossRef] [PubMed]
- Foudi, S.; Osés-Eraso, N.; Tamayo, I. Integrated spatial flood risk assessment: The case of Zaragoza. Land Use Policy 2015, 42, 278–292. [Google Scholar] [CrossRef]
- De Sherbinin, A.; Bardy, G. Social vulnerability to floods in two coastal megacities: New York City and Mumbai. Vienna Yearb. Popul. Res. 2016, 1, 131–165. [Google Scholar] [CrossRef]
- Balica, S.F.; Wright, N.G.; van der Meulen, F. A flood vulnerability index for coastal cities and its use in assessing climate change impacts. Nat. Hazards 2012, 64, 73–105. [Google Scholar] [CrossRef]
- Ge, Y.; Dou, W.; Liu, N. Planning Resilient and Sustainable Cities: Identifying and Targeting Social Vulnerability to Climate Change. Sustainability 2017, 9, 1394. [Google Scholar] [CrossRef]
- Yoon, D.K. Assessment of social vulnerability to natural disasters: A comparative study. Nat. Hazards 2012, 63, 823–843. [Google Scholar] [CrossRef]
- Cutter, S.L.; Burton, C.G.; Emrich, C.T. Disaster resilience indicators for benchmarking baseline conditions. J. Homel. Secur. Emerg. Manag. 2010, 7, 24. [Google Scholar] [CrossRef]
- Kablan, M.K.A.; Dongo, K.; Coulibaly, M. Assessment of Social Vulnerability to Flood in Urban Côte d’Ivoire Using the MOVE Framework. Water 2017, 9, 292. [Google Scholar] [CrossRef]
- De Brito, M.M.; Evers, M. Multi-criteria decision-making for flood risk management: A survey of the current state of the art. Nat. Hazards Earth Syst. Sci. 2016, 16, 1019–1033. [Google Scholar] [CrossRef]
- Boroushaki, S.; Malczewski, J. Implementing an extension of the analytical hierarchy process using ordered weighted averaging operators with fuzzy quantifiers in ArcGIS. Comput. Geosci. 2008, 34, 399–410. [Google Scholar] [CrossRef]
- Deng, H. Multicriteria analysis with fuzzy pairwise comparison. Int. J. Approx. Reason. 1999, 21, 215–231. [Google Scholar] [CrossRef]
- Hadipour, A.; Vafaie, F.; Hadipour, V. Land suitability evaluation for brackish water aquaculture development in coastal area of Hormozgan, Iran. Aquac. Int. 2015, 23, 329–343. [Google Scholar] [CrossRef]
- Vafai, F.; Hadipour, V.; Hadipour, A. Determination of shoreline sensitivity to oil spills by use of GIS and fuzzy model. Case study—The coastal areas of Caspian Sea in north of Iran. Ocean Coast. Manag. 2013, 71, 123–130. [Google Scholar] [CrossRef]
- Vafaie, F.; Hadipour, A.; Hadipour, V. GIS-based fuzzy multi-criteria decision making model for coastal aquaculture site selection. EEMJ 2015, 14, 11. [Google Scholar] [CrossRef]
- Hamidi, A.R.; Wang, J.; Guo, S.; Zeng, Z. Flood vulnerability assessment using MOVE framework: A case study of the northern part of district Peshawar, Pakistan. Nat. Hazards 2020, 101, 385–408. [Google Scholar] [CrossRef]
- Kittipongvises, S.; Phetrak, A.; Rattanapun, P.; Brundiers, K.; Buizer, J.L.; Melnick, R. AHP-GIS analysis for flood hazard assessment of the communities nearby the world heritage site on Ayutthaya Island, Thailand. Int. J. Disaster Risk Reduct. 2020, 48, 101612. [Google Scholar] [CrossRef]
- Ustaoglu, E.; Aydınoglu, A.C. Suitability evaluation of urban construction land in Pendik district of Istanbul, Turkey. Land Use Policy 2020, 99, 104783. [Google Scholar] [CrossRef]
- Perpiña, C.; Martínez-Llario, J.C.; Pérez-Navarro, Á. Multicriteria assessment in GIS environments for siting biomass plants. Land Use Policy 2013, 31, 326–335. [Google Scholar] [CrossRef]
- Chen, Y.; Yu, J.; Khan, S. Spatial sensitivity analysis of multi-criteria weights in GIS-based land suitability evaluation. Environ. Model. Softw. 2010, 25, 1582–1591. [Google Scholar] [CrossRef]
- Chen, Y.; Liu, R.; Barrett, D.; Gao, L.; Zhou, M.; Renzullo, L.; Emelyanova, I. A spatial assessment framework for evaluating flood risk under extreme climates. Sci. Total Environ. 2015, 538, 512–523. [Google Scholar] [CrossRef]
- Highfield, W.E.; Peacock, W.G.; Van Zandt, S. Mitigation Planning. J. Plan. Educ. Res. 2014, 34, 287–300. [Google Scholar] [CrossRef]
- Teo, M.; Lawie, M.; Goonetilleke, A.; Ahankoob, A.; Deilami, K. Engaging vulnerable populations in preparedness and response: A local government context. Aust. J. Emerg. Manag. 2018, 33, 38–47. [Google Scholar]
- Tascón-González, L.; Ferrer-Julià, M.; Ruiz, M.; García-Meléndez, E. Social Vulnerability Assessment for Flood Risk Analysis. Water 2020, 12, 558. [Google Scholar] [CrossRef]
- Kirby, R.H.; Reams, M.A.; Lam, N.S.N.; Zou, L.; Dekker, G.G.J.; Fundter, D.Q.P. Assessing Social Vulnerability to Flood Hazards in the Dutch Province of Zeeland. Int. J. Disaster Risk Sci. 2019, 10, 233–243. [Google Scholar] [CrossRef]


| Scenarios | Permanent SLR (cm) | Temporary Sea Level (cm) | Total (cm) | ||
|---|---|---|---|---|---|
| S0 | 0 | Wave and wind set-up (50 year return periods) + MHHW | 259 | 259 | |
| S1 (2050) | Average (RCP2.6 and RCP8.5) | 25 | Wave and wind set-up (100 year return periods) + MHHW | 320 | 345 |
| S1 (2100) | Average (RCP2.6 and RCP8.5) | 61 | 381 | ||
| S2 (2050) | Average (RCP2.6 and RCP8.5) | 25 | Wave and wind set-up (100 year return periods) + MHHW + storm surge | 470 | 495 |
| S2 (2100) | Average (RCP2.6 and RCP8.5) | 61 | 531 | ||
| Risk Components | Sub-Components | Indicators | Proxy Variables | Impacts | Reference |
|---|---|---|---|---|---|
| Hazard | SLR Tidal range Wave set-up Wind set-up Storm surge | Inundation depth (m) | + | [21,69] | |
| Social vulnerability | Susceptibility | Population | Population density (%) | + | [49,68,70] |
| Population with any sort of disability (%) | + | [25,71] | |||
| Age | Children < 5 years old (%) | + | [67,72] | ||
| Elderly people > 65 years old (%) | + | ||||
| Gender | Female (%) | + | [25,53] | ||
| Coping capacity | Socioeconomic status | Employment (%) | − | [25,66] | |
| People with high school diploma (%) | − | [25] | |||
| Exposure | Population | Population density (%) | + | [31,49,72] |
| Intensity of Importance | Degree of Preference |
|---|---|
| 1 | Equally important |
| 3 | Moderately more important |
| 5 | Strongly more important |
| 7 | Very Strongly more important |
| 9 | Extremely more importance |
| 2, 4, 6, 8 | Intermediate values |
| N | 1 | 2 | 3 | 4 | 5 | 6 | 7 | 8 | 9 | 10 | 11 |
|---|---|---|---|---|---|---|---|---|---|---|---|
| RI | 0 | 0 | 0.58 | 0.9 | 1.12 | 1.24 | 1.32 | 1.41 | 1.45 | 1.49 | 1.51 |
| Hazard | Wave Set-Up | Wind Set-Up | SLR | Storm Surge | Tide | Weight by the AHP Model |
|---|---|---|---|---|---|---|
| Wave set-up | 1 | 1/2 | 1/3 | 1/2 | 1/3 | 0.087 |
| Wind set-up | 2 | 1 | 1/2 | 1/2 | 1/2 | 0.137 |
| SLR | 3 | 2 | 1 | 1 | 1/2 | 0.224 |
| Storm surge | 2 | 2 | 1 | 1 | 1/2 | 0.209 |
| Tide | 3 | 2 | 2 | 2 | 1 | 0.343 |
| Susceptibility | Population | Gender | Age | Weight by the AHP Model |
|---|---|---|---|---|
| Population | 1 | 3 | 1 | 0.44 |
| Gender | 1/3 | 1 | 1/2 | 0.17 |
| Age | 1 | 2 | 1 | 0.39 |
| Flooding Scenarios | Risk Value (%) | ||||
|---|---|---|---|---|---|
| Very Low | Low | Medium | High | Very High | |
| S0 | 16.9 | 79.9 | 1.8 | 0.8 | 0.4 |
| S1-2050 | 2.1 | 93.7 | 3 | 1 | 0.2 |
| S1-2100 | 20 | 75 | 2.7 | 1.8 | 0.5 |
| S2-2050 | 20.1 | 64.5 | 4.8 | 5.5 | 5.1 |
| S2-2100 | 18.3 | 57.3 | 9.6 | 2.5 | 12.3 |
© 2020 by the authors. Licensee MDPI, Basel, Switzerland. This article is an open access article distributed under the terms and conditions of the Creative Commons Attribution (CC BY) license (http://creativecommons.org/licenses/by/4.0/).
Share and Cite
Hadipour, V.; Vafaie, F.; Deilami, K. Coastal Flooding Risk Assessment Using a GIS-Based Spatial Multi-Criteria Decision Analysis Approach. Water 2020, 12, 2379. https://doi.org/10.3390/w12092379
Hadipour V, Vafaie F, Deilami K. Coastal Flooding Risk Assessment Using a GIS-Based Spatial Multi-Criteria Decision Analysis Approach. Water. 2020; 12(9):2379. https://doi.org/10.3390/w12092379
Chicago/Turabian StyleHadipour, Vahid, Freydoon Vafaie, and Kaveh Deilami. 2020. "Coastal Flooding Risk Assessment Using a GIS-Based Spatial Multi-Criteria Decision Analysis Approach" Water 12, no. 9: 2379. https://doi.org/10.3390/w12092379
APA StyleHadipour, V., Vafaie, F., & Deilami, K. (2020). Coastal Flooding Risk Assessment Using a GIS-Based Spatial Multi-Criteria Decision Analysis Approach. Water, 12(9), 2379. https://doi.org/10.3390/w12092379