Article

Nitrogen Fertilization of Plants Irrigated with Desalinated Water: A Study of Interactions of Nitrogen with Chloride

1
Institute of Soil, Water and Environmental Sciences, Agricultural Research Organization (ARO), The Volcani Center, Rishon Lezion 75359, Israel
2
The Robert H. Smith Faculty of Food Agriculture and Environment, The Hebrew University of Jerusalem, Rehovot 76100001, Israel
*
Author to whom correspondence should be addressed.
Water 2020, 12(9), 2354; https://doi.org/10.3390/w12092354
Submission received: 22 June 2020 / Revised: 17 August 2020 / Accepted: 17 August 2020 / Published: 21 August 2020
(This article belongs to the Special Issue Desalination of Seawater for Agricultural Irrigation)

Abstract

:
The overall aim of this research was to optimize nitrogen (N) fertilization of plants under desalinated water and a wide range of chloride concentrations for high yield while minimizing downward leaching of nitrate and chloride. The response of two crops, lettuce and potato, to N concentration (CN) in the irrigating solution using desalinated and wide range of Cl concentrations (CCL) was evaluated. The yields of both crops increased with N up to optimal CN of the irrigating solution and decreased as CCL increased. Optimal CN in both crops was higher in the desalinated water than high CCL treatments. N uptake by plants increased with CN in the irrigating solution and the highest uptake was at low CCL. As expected, N fertilization suppressed Cl accumulation in plant tissues. Drainage of N and Cl increased with increase in CCL in the irrigating solution and N fertilization above optimal CN resulted in steep rise in downward N leaching. The overall conclusion is that as water quality is improved through desalination, higher N supply is required for high yields with less groundwater pollution by downward leaching of N and Cl.

1. Introduction

The growing demand for fresh water led to an increase in the production of desalinated water, mainly in arid and semiarid regions [1,2]. An annual production of 585 × 106 m3/year in Israel was reported [3], approximately 40% of the total fresh water consumption [4]. The use of desalinated seawater for irrigation in Israel was estimated at 200 × 106 m3/year [5], which is ~40% of the national freshwater irrigation consumption.
In intensive agriculture, the majority of crops grown are defined as glycophyte plants, meaning high sensitivity to salinity above a threshold value, which is specific for each crop [6,7,8,9]. Salinity may interfere with mineral nutrition acquisition by plants in two ways [10,11]: (i) the total ionic strength of the soil solution, regardless of its composition, can reduce nutrient uptake and translocation, and (ii) uptake competition with specific ions such as sodium and chloride can reduce nutrient uptake. These interactions may lead to Na-induced Ca and/or K deficiencies [12] and Cl induced inhibition of NO3 uptake [13,14]. Antagonism between Cl and NO3 uptake by plants was demonstrated in numerous publications [13]. This antagonism was found in various plants, including substrate-grown crops such as melon and lettuce [15], tomato and melon [16,17,18], and rose [14]. Direct competition between NO3 and Cl on uptake by plants was reported in several publications [19,20,21]. Therefore, there is a possibility that yield reduction due to increased salinity may be partially due to induced deficiency of N by the increased external Cl concentration. Addition of nitrate to the irrigation water reduced chloride accumulation in avocado plant and alleviated its adverse effects [22], whereas another publication suggested that a reduction in water uptake led to the reduced nitrate uptake [23]. Under conditions of salinity, nitrogen concentration in plant leaves decreased due to increasing chloride concentration in pepper [24], tomato [16], lettuce, and Chinese cabbage [25].
Due to the above findings, increasing the NO3 supply to sensitive crops irrigated with water containing high chloride concentrations was recommended in several publications [13,16,22]. Consequently, the shift from irrigation with conventional water to using desalinated water calls for adjustment in the amount of additional minerals. Adjustment in the amount of minerals needed for plant growth requires understanding the effects of the quality of water supplied for irrigation on plants response to nutrients.
Irrigation with desalinated water was found to increase maximum yields of bell peppers by 50% and allowed a reduction in irrigation water application rate by half compared to irrigation with local brackish groundwater (electrical conductivity (EC = 3.2 dS·m−1) [26]. It was shown that the higher water dose required with saline water than with desalinated water was due to the required excess water for leaching out soluble salts from the root zone [26]. This leaching application results in high volumes of drainage water that are often enriched with salts and also in other nutrients [27] including nitrate [28]. The reduction in the required leaching fraction with the reduction in water salinity was shown to reduce N leaching and enhance the efficiency of N fertilization [29]. A simulation study of water and salts transport in soil of irrigated orchard in Mediterranean region showed that a shift from natural water to desalinated seawater reduced downward leaching of contaminants to the groundwater [5].
Contamination of groundwater by nitrate is a major problem worldwide [30,31,32]. In Israel, it has led to disqualification of a greater number of drinking water wells than any other environmental contaminant in the beginning of the 21st century [33]. Nitrate is highly soluble and in most soils it is very mobile within the soil–water solution. Consequently, when nitrogen fertilizer inputs exceed the amount of nitrogen needed by the plant, the excess nitrate is then easily leached by irrigation water and rainwater to deeper soil layers, finally reaching groundwater [34,35].
We hypothesized that optimal nitrogen concentration for the highest yield will be lower and the total uptake of water and nitrogen will increase with decrease in the chloride concentration of the irrigating solution; consequently, chloride and nitrate downward leaching below the root zone will decrease with reducing salinity of the irrigation water. Optimization of N application in combination with irrigation with desalinated water will also lead to reduction of N and Cl fluxes below the root zone and protect underground water sources from N and Cl contamination.
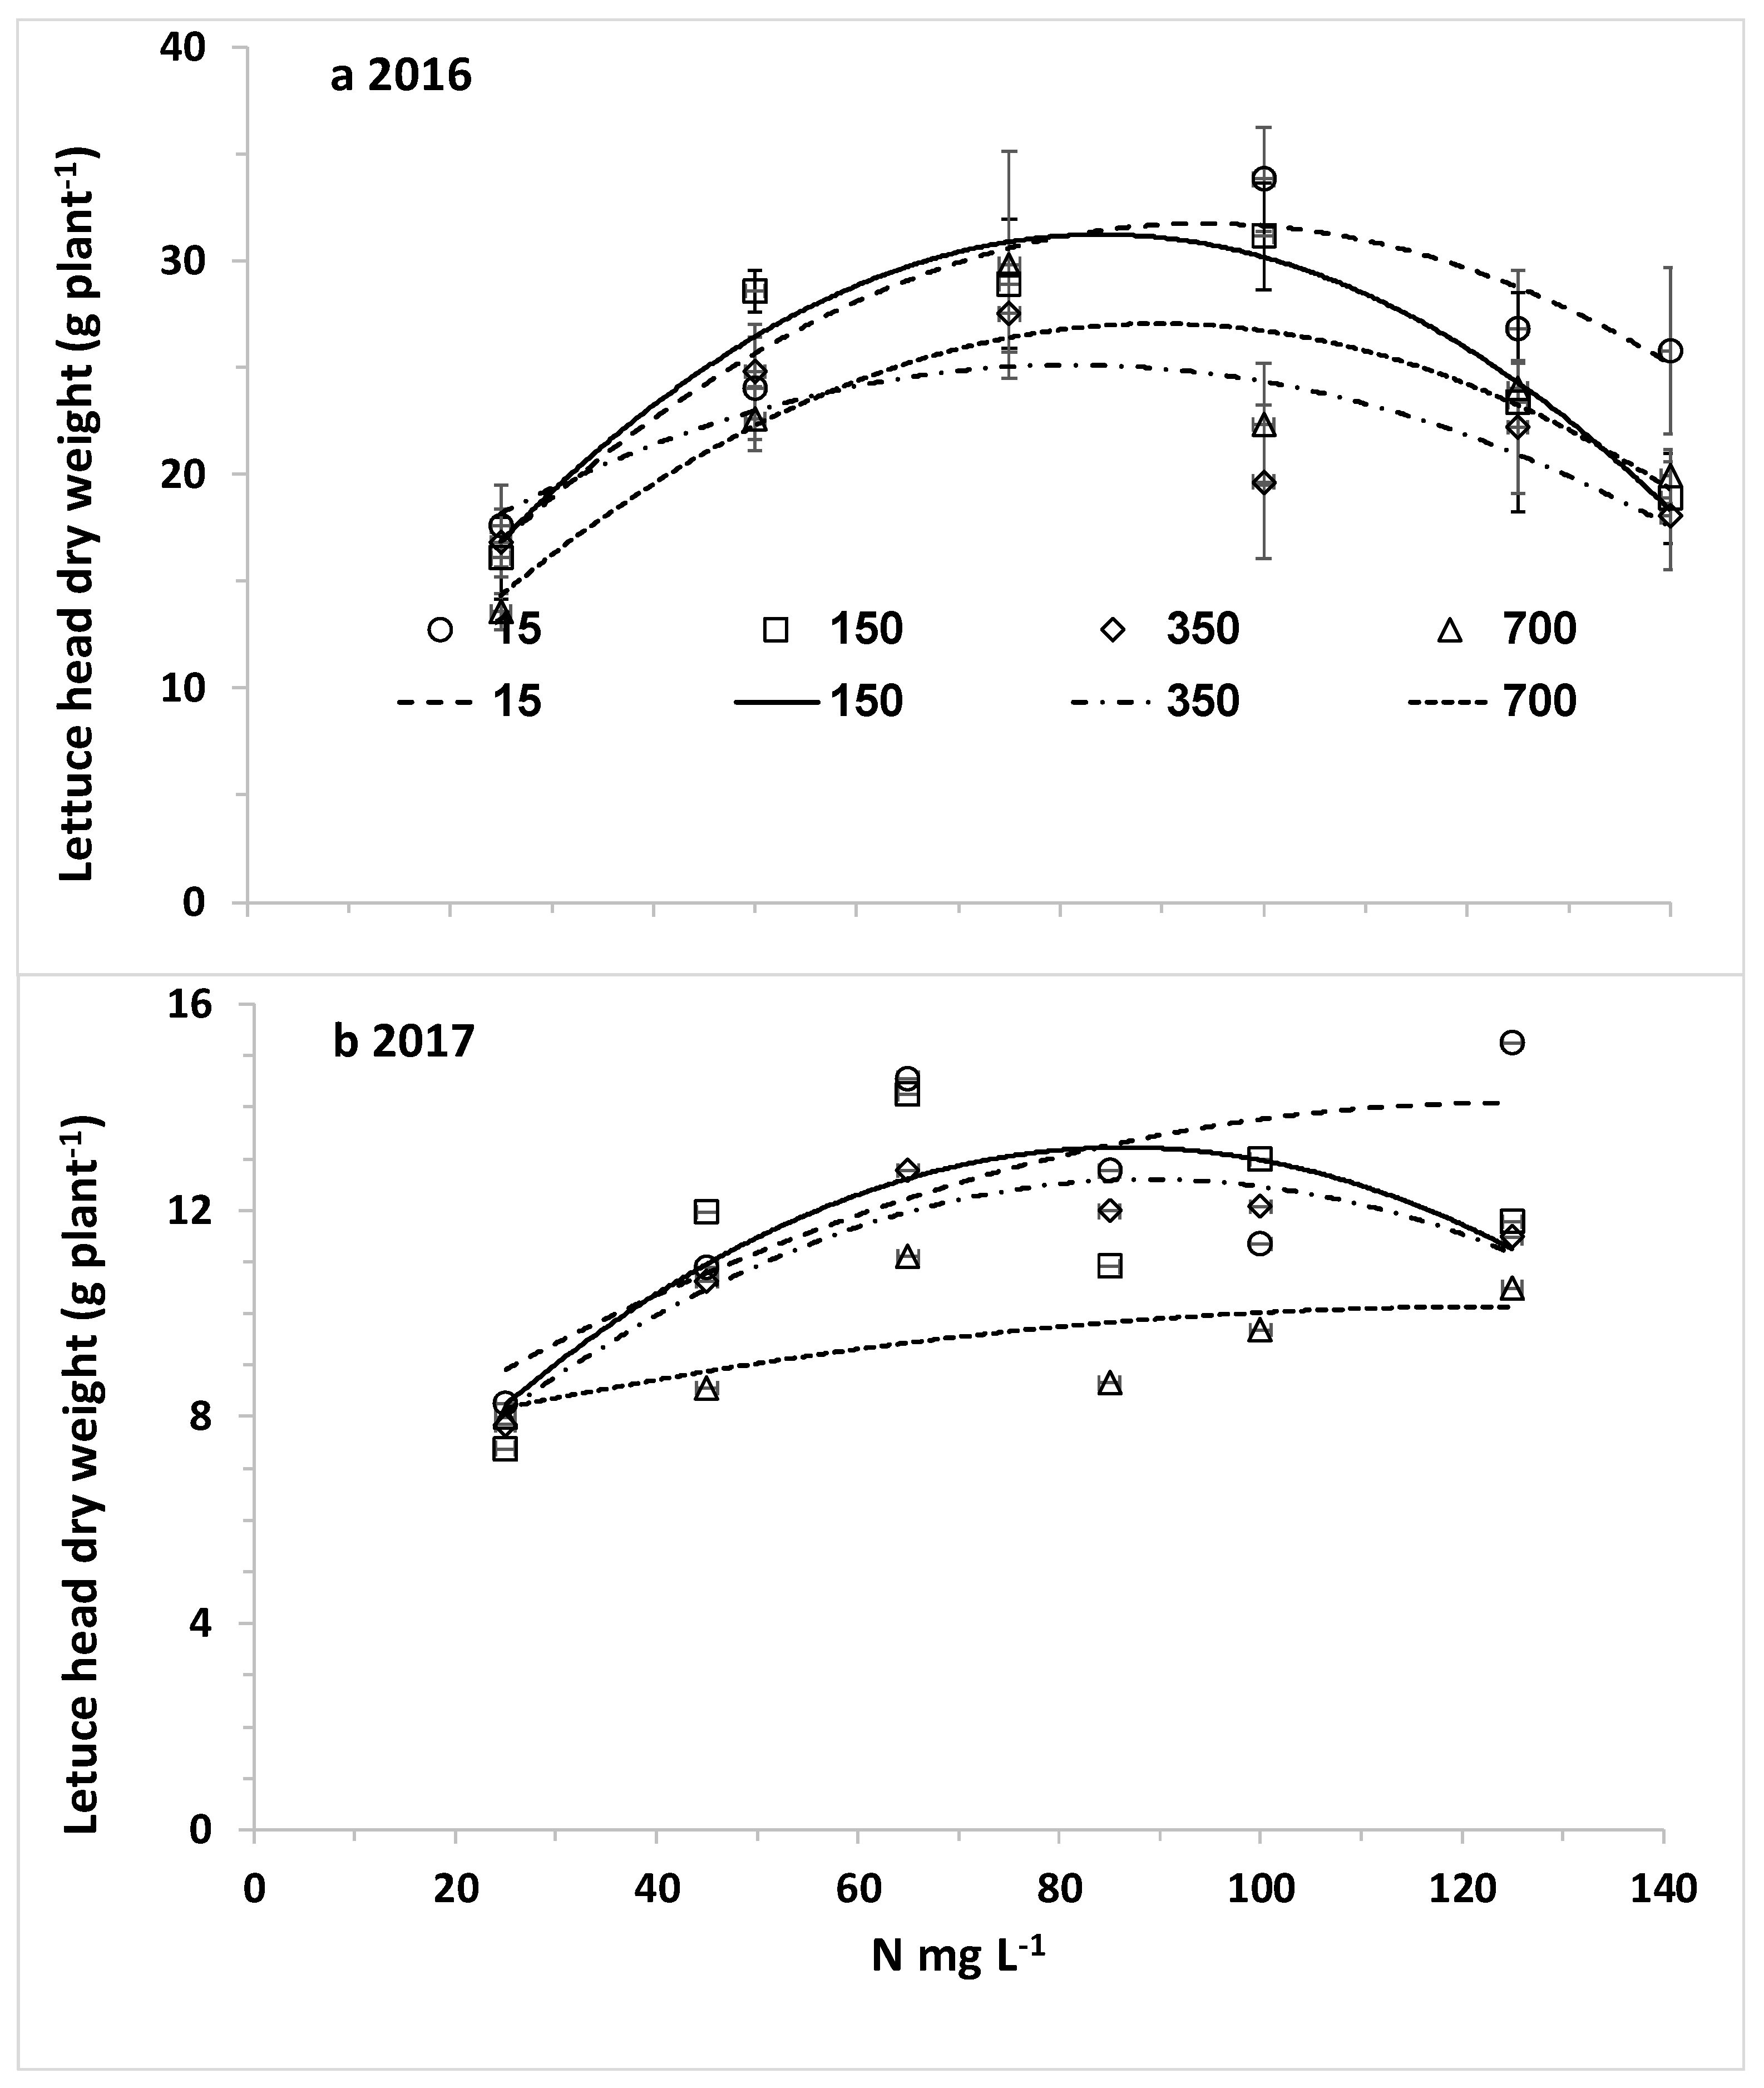
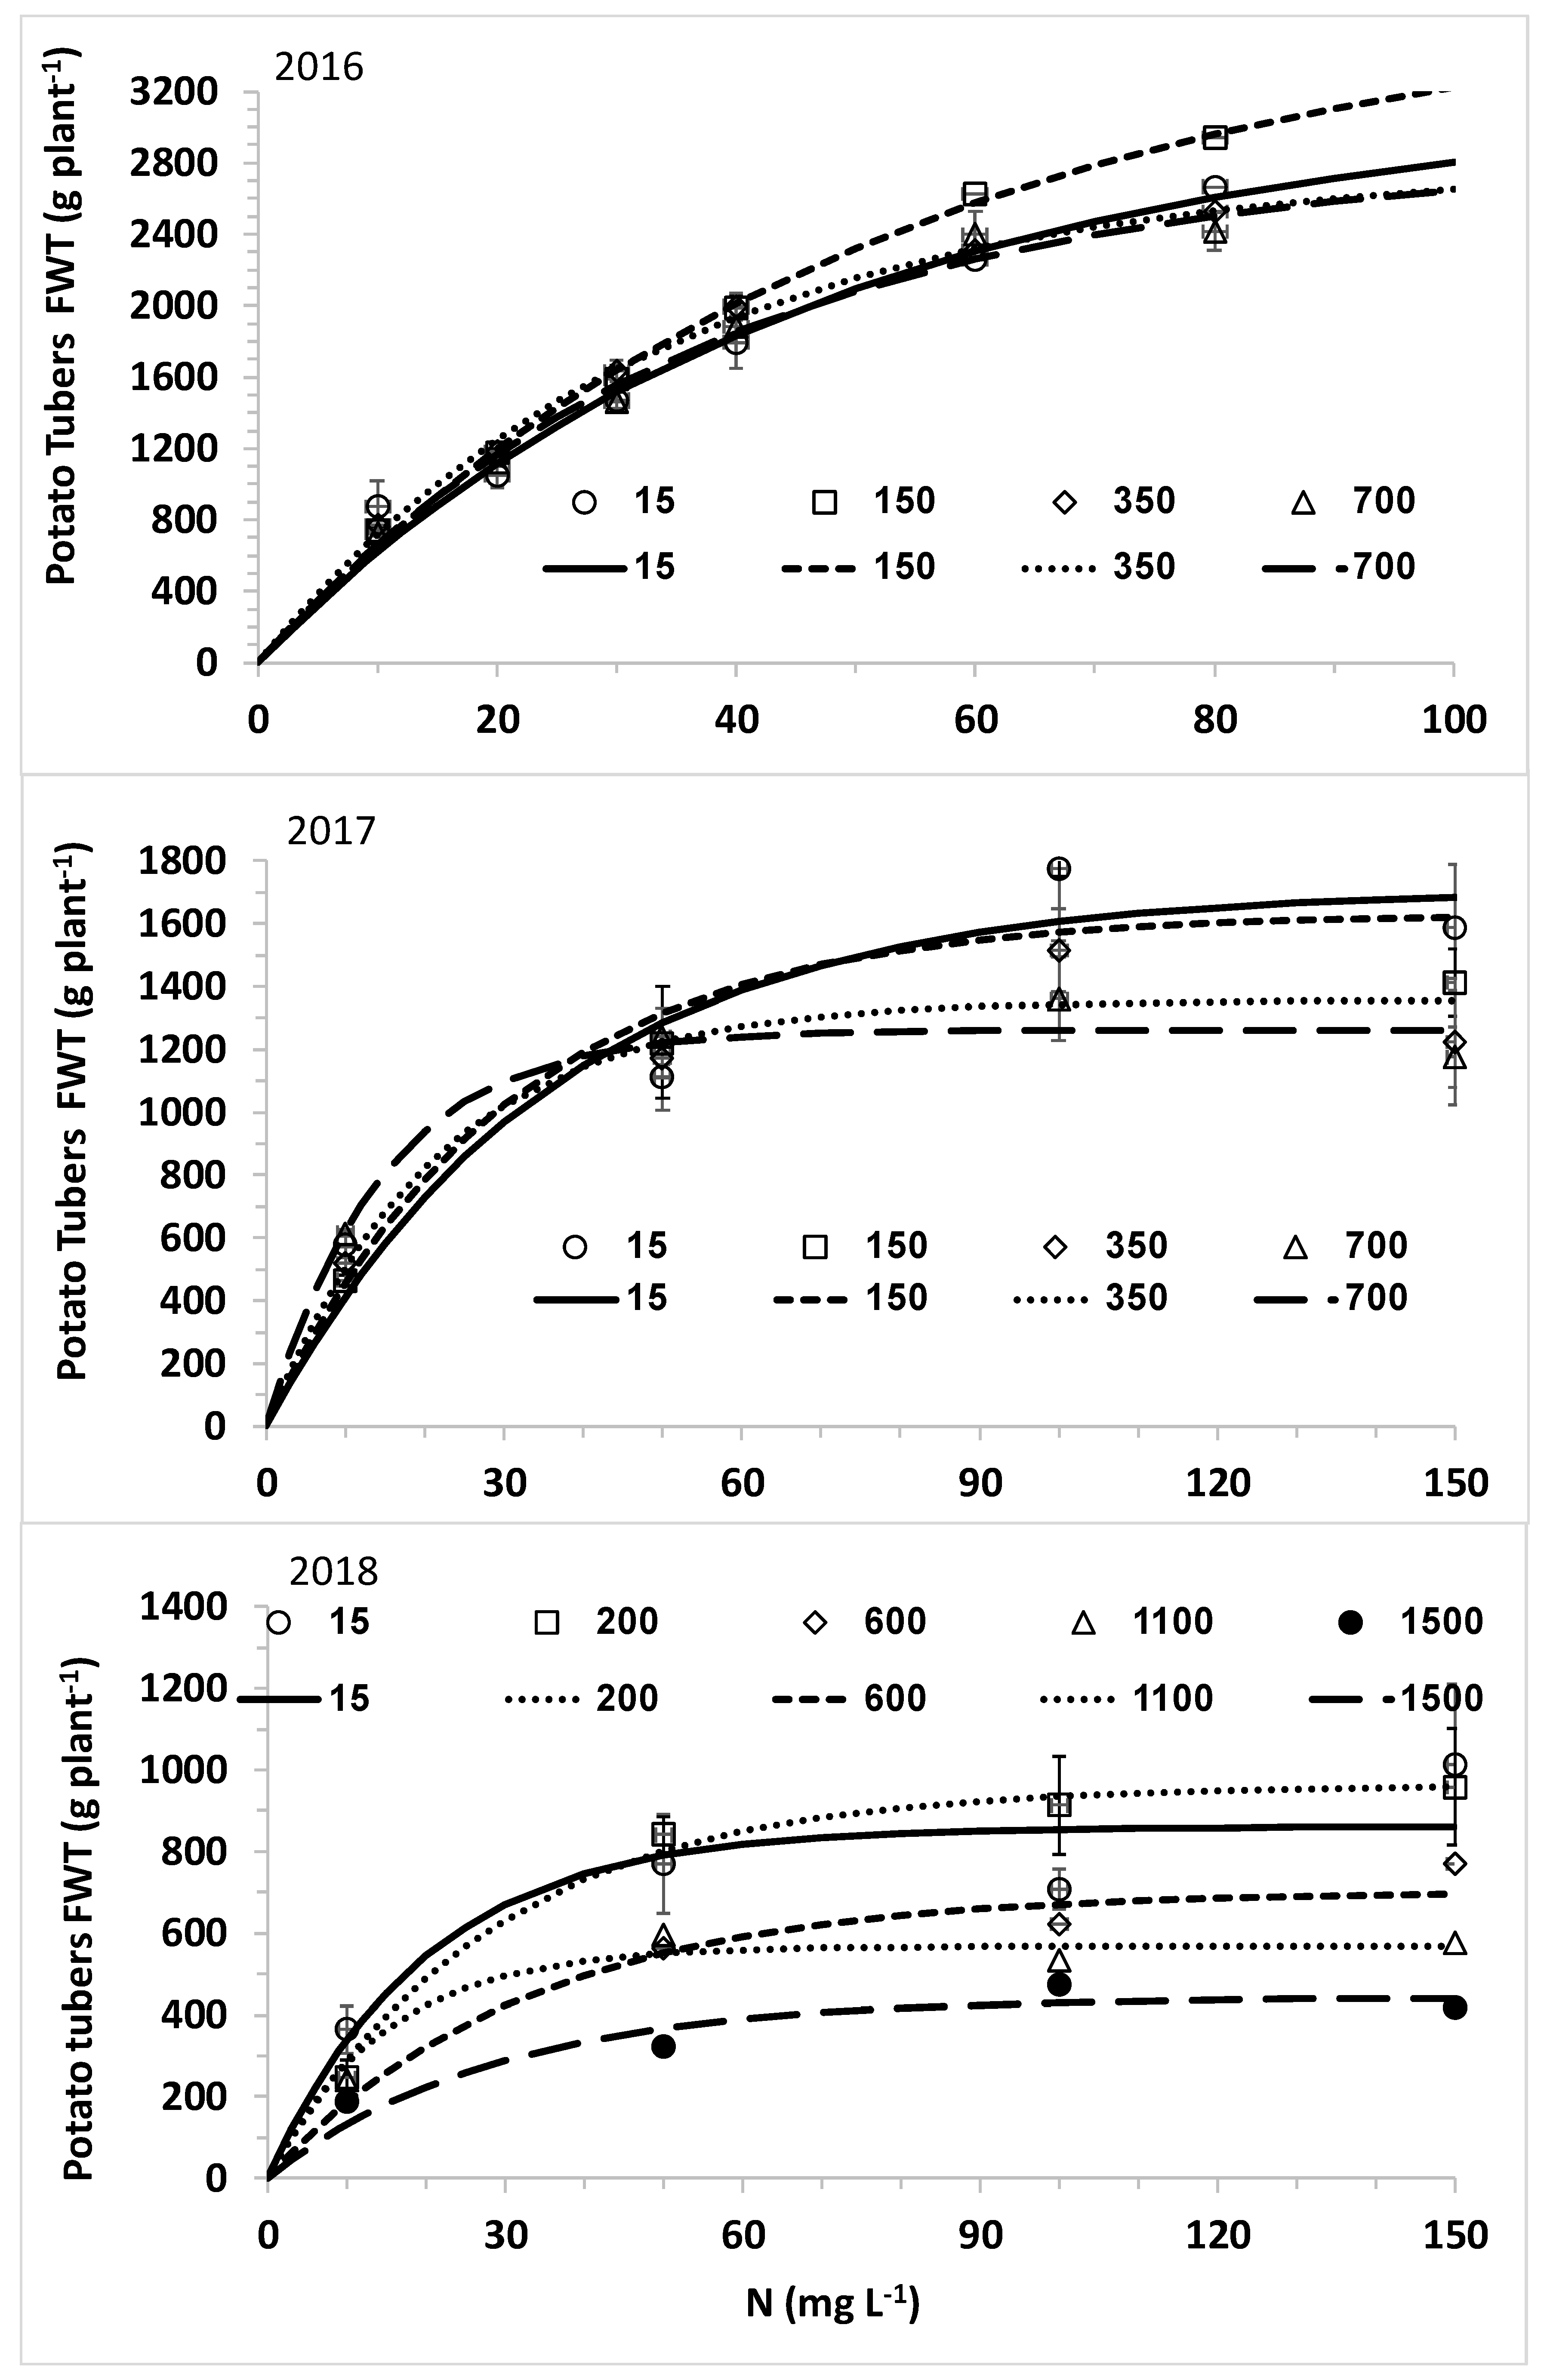
The overall aim of this research was to optimize nitrogen fertilization of plants under desalinated water and a wide range of chloride concentrations for high yield while minimizing downward leaching of nitrate and chloride. The specific objectives were (1) to determine the response curves of lettuce biomass and potato tubers to CN (N concentration in the irrigating solution) at different CCl (Cl concentration in the irrigating solution); (2) to explore the effects of CN at different CCl values on N and Cl concentrations in the leaves of lettuce and potato; and (3) to determine the effects of N and Cl concentrations in the irrigating water on the water leaching fraction (LF) and the downward leaching of nitrogen and chloride.

2. Materials and Methods

The effect of N concentrations combined with irrigation with desalinated water and a wide range of Cl concentrations on lettuce and potato plants was investigated in five experiments: Three winter season potato (Solanum tuberosum L.) experiments (20 January–3 May 2016, 15 January–17 May 2017, and 1 March–27 June 2018) and two summer season lettuce (Lactuca sativa L.) experiments (17 August 2016–26 September 2016 and 14 September–22 October 2017). The following varieties were used for the three potato experiments; Sifra, Rozana, and Desire in 2016, 2017, and 2018. The variety Romit-Raviv was used for the two lettuce experiments. The experiments were carried out in automated lysimeters at Bet Dagan, Israel (34°49′15″ E, 31°59′34″ N).

2.1. Description of the Study Site and Lysimeter System

Ninety-six lysimeters of 60 L volume (height: 54 cm; radius in the range of 55 to 60 cm, from bottom to top) were placed on 24 tables. The lysimeters were filled with coarse sand (>1400 µm—13.8%, 1000–1400 µm—56.5%, 500–1000 µm—25%, 250–500 µm—1.8%, 50–250 µm—2.2%, and <50—0.6%), and the following physical properties; bulk density: 1.66 g cm−3, total porosity: 37.4%, and saturated hydraulic conductivity: 3.3 cm min−1. The sand in the lysimeters was used throughout the five experiments with no replacement and/or washing of the medium before starting each experiment. A 60 cm long rockwool drain with a diameter of 5 cm was installed in each lysimeter. The dimensions of the rockwool drain were made according to Ben-Gal and Shani (2002) [36] for preventing saturation at the bottom of the lysimeters and to allow continuous water flow. Below each drain was a container for the collection of the drainage (96 drainage containers) and the weight of the drainage was determined manually every few days. The irrigation was done by nutrient solutions from 24 solution tanks (one for each treatment) each with 200 L capacity. The solution tanks were supplied with desalinated water from two storage tanks with a total volume of 5 m3. The desalinated water was produced by a desalination device (TROS160LPH, Treatment, Israel) to the level of electrical conductivity EC = 0.005 ds m−1. After the 24 tanks were filled with water, salts and fertilizers that were weighed in the laboratory were added to each container according to treatments. Each solution container had a shipping pump and 4 tubes connected to 4 lysimeters for different repetitions of the same treatment. Each container irrigated 4 lysimeters in sequence using a separate valve for each lysimeter. The entire irrigation system was controlled by a computer using a tailored control software (Crystal Vision, Kibbutz Samar, Israel).

2.2. Experiments Treatments

The two lettuce experiments consisted of 24 treatments of full factorial combinations of 6 N and 4 Cl concentrations (Table 1). The first potato experiment in 2016 included 24 treatments consisted of 6 N and 4 Cl concentrations, the second potato experiment in 2017 included 16 treatments consisted of 4 N and 4 Cl concentrations, and the third potato experiment consisted of 20 treatments consisted of 4 N and 5 Cl concentrations.

2.3. Measurements Performed

2.3.1. Plant Growth and Yield

In the lettuce experiment, the heads’ (leaves) fresh and dry weights (FW and DW, respectively) were determined. Lettuce roots FW and DW were also recorded. At the termination of the potato experiments, the above ground part of all plants from all lysimeters were cut and separated from tubers and the FW and DW of the above ground part and tubers were determined separately. In all experiments, the fresh samples of the plants organs were rinsed for 15 s with deionized water, dried at 70 °C in a ventilated oven, and weighed again in order to determine dry matter content.
Quadratic equation was used for quantitative expression of the potato tubers yield as a function of CN at each CCl value,
Y = a X2 + b X + c
where y is the yield; x is the nutrient concentration (CN); and a, b, and c are coefficients derived by best fitting.
Mitcherlich model Equation (2) was used for quantitative expression of the potato tubers yield as function of CN at each CCl value,
y = A (1 − e−Cx)
where y is the yield, x is the nutrient concentration (CN), A is the potential yield that would be obtained by supplying all growth factors in their optimum amounts, and C is a proportionality constant that depends on the individual growth factor.

2.3.2. Mineral Concentration in Plant Tissues

After harvesting and oven drying, the subsamples of the plant organs were ground to a fine powder. A subsample (100 mg) in powder form was digested using sulfuric acid and peroxide according to Snell and Snell (1948). N was determined in an autoanalyzer (Discrete Autoanalyzer Gallery, Thermo Fisher Scientific, Finland). Chloride was extracted from the leaf powder in water (100:1 water/dry matter) and determined with a Cl analyzer (Sherwood-Scientific, chloride analyzer 926, Cambridge, UK).

2.3.3. Mineral Concentration in Drainage

Drainage water was collected continuously under each lysimeter and the accumulated leachate was weighed frequently, every 3 to 7 days and subsamples of water were taken for analyses of ammonium, nitrate, and chloride concentrations in each event of drainage collection (5 to 15 times) using the autoanalyzer described above.

2.3.4. Leaching Fraction and Leached N and Cl

As stated before, drainage water was collected continuously and weighed periodically for calculations of the drainage volume, leaching fraction (LF), and the total amount of N and Cl in the drainage (MN and MCl, respectively). LF was calculated as the ratio of the amount of water collected as drainage to the amount of irrigated water. A 25% given as LF was maintained in one of the treatments with high nitrogen and low chloride. The irrigation dose in all other treatments was the same as in the reference treatment. MN and MCl were calculated in each measurement event by multiplication of the volume of the drainage by the concentration of N (sum of NH4+-N and NO3-N) or Cl, respectively, and then the total MN and MCl were calculated as sum of all the measured events. The average N and Cl concentrations in the drainage were calculated by dividing the total MN and MCl by the accumulated drainage volume.

2.4. Statistics

The main effects of the N and Cl concentrations and their interactions on measured variables were determined statistically using the two-way ANOVA procedure of JMP 14. The significance of comparisons among treatments was tested by the Tukey–Kramer honestly significant difference (HSD) at p < 0.05. Response curves of plant biomass production to CN and N concentration and mass in the drainage water as function of CN were fit using the NLIN procedure of JMP 14.

3. Results

3.1. Plants Response to N and Cl Concentrations

For achieving the first objective, to determine the response curves of lettuce biomass and potato tubers to CN at different CCl, the biomass production of lettuce and the yield of potato were determined in the above described lettuce and potato experiments.

3.1.1. Biomass in Lettuce Experiments

In the two lettuce experiments, the lettuce head fresh and dry weight were significantly affected by CN and CCL, but no significant interaction between these factors was obtained (Table 2). As expected, lettuce head dry weight increased significantly as CN was raised from the lowest value of 25 mg L−1 to 50 and 45 mg L−1 in the first and second experiments, respectively. The highest head weights were obtained with 75 and 65 mg L−1 in the first and second experiments. As expected, increasing CCl had negative effect on lettuce head fresh and dry weights in both experiments. In the first experiment, a significant reduction in the FW and DW was obtained with the increase from 150 to 350 mg L−1, and 15 to 350 mg L−1, whereas in the second experiment significant lower FW and DW were obtained as the CCl was raised to 700 mg L−1.
When the response of the head dry weight as a function of CN for each CCL level in the first experiment is presented, the same trend is obtained, except the desalinated water (CCl = 15 mg L−1) treatment in which the maximum weight occurred with the maximal CN, 125 mg L−1 (Figure 1). Equation (1) was employed to fit curves to the response of the lettuce head to CN at each CCl value in the two lettuce experiments (Figure 1). In the first experiment, the r2 at the different CCl was in the range of 0.58 to 0.94 (Table 3). The obtained optimum CN of the desalinated water (CCl = 15 mg L−1) was 94.6 mg L−1 and for water with higher CCl, 150, 350, and 700 mg L−1, the optimum CN values were 84.3, 80.8, and 90.8 mg L−1, respectively. In the second experiment, the r2 at the different CCl were in the range of 0.60 to 0.91 for CCL 15 to 350 mg L−1 (Table 3). The relative effect of CN on the head DW at 700 mg Cl l−1 was much smaller than at the lower CCl values (Figure 1) with low r2 just 0.39 (Table 3). The obtained optimum CN of the desalinated water (CCl = 15 mg L−1) was 129.8 mg L−1, compared with 87.8, 88.9, and 124.0 mg L−1, at CCl treatments of 150, 350, and 700 mg L−1, respectively. In both experiments, the highest calculated optimal CN values for lettuce were obtained with desalinated water. In both experiments the lowest optimal CN values were obtained at the median CCL levels of 150 and 350 mg L−1.
In both lettuce experiments, the root fresh weight was much smaller than the head (Table 2); the shoot to root ratio was in the range of 45.9 to 15.7 in the first experiment and 13.7 to 6.2 in the second experiment. In both experiments, the root fresh weight was affected significantly by CN. In both experiments, the highest root FW were obtained at the lowest CN of 25 mg L−1 and decreased insignificantly with further increase in CN from 50 and 65 mg l−1 in the first and second experiments, respectively (Table 2). In the first experiment, the root fresh weight was not affected by CCl and no significant interaction of CN with CCl was obtained, whereas in the second experiment it was significantly increased as the CCl increased in the studied range of 15 to 700 mg L−1. A significant interaction effect of CN with CCl on the root FW was obtained in the second experiment (Table 2), but no change in the trend of the effect of CN at different CCl was obtained.

3.1.2. Biomass in Potato Experiments

Potato biomass, tubers fresh and dry weight, and shoot dry weight responded positively to CN in the three potato experiments (Table 4). In the first experiment, significant increases in the tuber and shoot mass were obtained with each increment of raising CN by 10 or 20 mg L−1 with the highest masses at 80 mg L−1. In the second and third experiments, the range of CN was extended to 150 mg L−1. In the second experiment, the highest shoot and tuber masses were obtained at 100 mg N L−1 and they decreased with a further raise of CN to 150 mg L−1. In the third experiment, the highest shoot and tuber masses were obtained at 150 mg N L−1, but the difference between the mass at CN 100 and 150 mg L−1 were insignificant. In the first and second experiments, the effect of CCl on the potato plants was tested in the range of 15 to 700 mg L−1. In the first experiment, the increase of CCL in this range had negative effect on potato shoot and tubers masses, as expected; however, in the second experiment the effects on the shoot and tubers mass were insignificant. Therefore, in the third experiment the range of CCL was extended to 1500 mg L−1 resulting in a significant negative effect on the shoot dry mass and the tubers fresh and dry mass. Significant interaction of the effects of CN with CCL was obtained just for the shoot and tubers dry weights in the first experiment and shoot dry weight and tubers fresh weight in the third experiment. The significant interactions between CN and CCl in the first and third experiments are due to differences in the magnitudes of the effect of CN on the tubers mass at different CCl values, whereas the general trend is similar, as shown for the tubers fresh weight in Figure 2.
The response of the tubers fresh weight to CN at each level of the studied CCl value is presented in Figure 2. In the first experiment, the highest tuber yield at all CCl values was observed at the highest CN treatment, 80 mg L−1. However, the increase in mass as CN was raised from 60 to 80 mg L−1 was bigger as CCl was lower: 407, 317, 220, and 20 g plant−1 for 15, 150, 350, and 700 mg L−1, respectively. In the second experiment the highest tuber yield at all CCl values was observed at 100 mg L−1. However, the increase in mass as CN was increased from 50 to 100 mg l−1 was bigger as CCl was lower: 663, 642, 340 and 119 g plant−1 for 15, 150, 350 and 700 mg L−1, respectively. In the third experiment, the main difference in the tubers yields at the highest CN (150 mg L−1) between CCl treatments stemmed from the difference in the increase in yield as the CN was raised from 50 to 150 from mg L−1.
All the curves in the second and third experiments show steep slope as CN increased from 0 to 20–30 mg L−1 followed by moderate slope, and above 80–120 mg L−1 the curves approach maximal values according to the Mitcherlich equation with lower values for the high CCl Equation (2). The visual fitness of the curves to the observed values for each CCl value in the second and third years is satisfactory. In the first year only the first two stages of the curves (steep and moderate slope) appear as a result of the narrow CN range, 10–80 mg L−1, in comparison to 10–150 mg L−1 in the second and third experiments. In the first year, the effect of CCl treatments was small and the interaction was insignificant, therefore only the curve at 150 mg Cl L−1 is clearly separated from the other curves. The best fit values of the coefficients A and C at each CCl Equation (2) in the three potato experiments are presented in Table 5. In the three experiments the A values that are defined in the Mitcherlich equation as the maximal value for each CCl decrease as CCl increase above 150 mg L−1. In the first and third years, the A value of the desalinated water (15 mg L−1) was lower than that of 150 and 200 mg L−1; these values are in the range of concentrations of natural water sources used for irrigation in Israel and other semiarid and arid regions. In the third experiment, in which the range of CCl was extended from 700 to 1500 mg L−1, the strongest impact on A was obtained. The C coefficient can be used to calculate the CN value to obtain any percentage of the maximal yield at each CCl. Thus, the CN value for achieving 95% of the maximal yield (CN95) at each CCl was calculated and presented in Table 5. In the first and second experiments, the general trend is reduction in CN95 as CCl increased above 150 and 15 mg L−1, respectively. In both years the calculated CN95 for desalinated water is higher than that for the two highest salinities, 350 and 700 mg L−1, in contrast to the assumption that the required CN for optimal yield will be lower for desalinated water. In the third year, no clear trend in the effect of CCl on the calculated CN95 was obtained, probably because of the big effect of CCl on the A value, which is highly correlated with C.

3.2. N and Cl Concentrations in Plants Leaves

For achieving the second objective, we determined the concentrations of N and Cl in organs of lettuce and potato grown at different combinations of CN and CCl in the experiments described in the previous section.

3.2.1. N and Cl Concentrations in Lettuce Heads and Roots

In the first and second lettuce experiments, N concentration in lettuce head was significantly affected by CN, but was not affected by CCL, and no significant interaction between these factors was obtained (Table 6). In both experiments N concentration in lettuce roots was significantly affected by CN and it was significantly affected by CCL in the first experiment, while no significant effect was obtained in the second experiment. In both experiments, no significant interaction between these factors on N concentration in the roots was obtained. In both experiments, N concentrations in lettuce head and roots increased significantly with raising CN from the lowest value of 25 up to 75 mg L−1 in the first experiment and 140 mg L−1 in the second experiment. In the first experiment N concentration in the roots decreased significantly as CCl was raised from 15 to 700 mg L−1, however the effect was relatively small, just an 11% difference. As expected nitrate concentration in lettuce head increased significantly as CN increased. CCl had also significant effect on nitrate concentration in lettuce head, but no significant interaction between these factors was obtained. N concentration in the roots increased from 0.62 to 3.51 mg N g−1 with increasing CN from the lowest to the highest value, 25 and 140 mg L−1, respectively. Although the effect of CCl on nitrate concentration was significant it was inconsistent and the differences between treatments were relatively small. The highest and the lowest values were obtained with 15 and 150 mg Cl L−1, whereas no significant differences were obtained between these treatments and the two other treatments (350 and 700 mg Cl L−1).
Cl concentration in lettuce head and roots were significantly affected by CN and by CCL and no significant interaction between these factors was obtained (Table 6). As expected, Cl concentration in lettuce head and roots increased significantly from 10.8 to 33.2 mg g−1 and from 5.1 to 42.0 mg g−1 with increasing CCl from the lowest to the highest value, 15 and 700 mg L−1, respectively. In agreement with the hypothesis, Cl concentration in lettuce head and roots decreased significantly from 30.8 to 20.9 mg g−1 and from 30.3 to 23.2 mg g−1, respectively, with increasing CN from the lowest to the highest value, 25 and 140 mg L−1.
The correlation of the mean Cl concentrations for all CCl levels in lettuce heads and roots with the respective N concentrations in these organs in 2016 was examined. High correlation (r2 = 0.95) was obtained for Cl vs. N in lettuce head with significant slope (p = 0.0008). In the root the correlation was low, r2 = 0.47, and the slope was insignificant.

3.2.2. N and Cl Concentrations in Potato Leaves and Tubers

In the three potato experiments, N concentrations in the leaves and tubers were significantly affected by CN, but were not affected by CCL and no significant interaction between these factors was obtained (Table 7a,b). In the three potato experiments, N concentrations in the leaves and tubers increased significantly with raising CN from 10 to 80 mg L−1 in the first experiment, from 10 to 150 mg L−1 in the second and third experiments, independently of the CCl level (Table 7a,b). In the second and third experiments there was gradual decrease in the effect of CN on N concentrations in the leaves and tubers as CN became higher. Nitrate concentration in potato leaves was determined just in the first potato experiment and like the reduced N it was significantly affected by CN. In contrast to the reduced N nitrate concentration in potato leaves was also significantly affected by CCl and a significant interaction between these factors was also obtained. Despite this significant interaction effect the major effect of each factor (CN and CCl) is presented and discussed, because the interaction effect is due to differences in the magnitude of the CCl effect with each CN level, rather than the direction of the effect. The nitrate concentration in the leaves increased gradually from 0.41 to 1.53 mg g−1 with the incremental raise of CN from 10 to 80 mg L−1. Note that the concentration of the reduced N was 20 to 56 times that of nitrate-N.
Cl concentrations in the shoot were significantly affected by both CCl and CN with significant interaction between these factors in all three experiments (Table 7a,b). In the first and second experiments, Cl concentrations in the tubers were also significantly affected by both CCl and CN with significant interaction between these factors, whereas in the third experiment it was affected significantly just by CCl. The interaction effect of CN and CCl in all cases is due to differences in the magnitude of the CCl effect with each CN level, rather than the direction of the effect. Therefore, we present the major effects of CN and CCl. Overall, Cl concentrations in the shoot and tubers increased with increasing CCl, with reduction in the relative effect as the CCl became higher. In the majority of cases, Cl concentrations in shoot and tubers decreased with raising the CN, except non-consistent effect of CN on Cl concentration in the shoot in the first potato experiment and nonsignificant effect on Cl concentration in the tuber in the third potato experiment.
The correlation of the mean Cl concentrations for all CCl levels in leaves and tubers with the respective N concentrations in these organs was examined. In the first experiment, high correlation (r2 = 0.87) was obtained for Cl vs. N in the potato leaves with significant slope (p = 0.0216) for all CN treatments, excluding the lowest CN level in which low Cl leaf concentration was obtained. High correlation (r2 = 0.76) was also obtained in the tubers and the slope was also significant (p = 0.0238). In the second experiment, high correlation (r2 = 0.85) was obtained for Cl vs. N in the potato leaves, but the slope was insignificant (p = 0.0762). High correlation (r2 = 0.88) was also obtained in the tubers, and, although the slope was not significant, it indicates tendency (p = 0.06). In the third experiment, high correlation (r2 = 0.89) was obtained for Cl vs. N in the potato leaves, with p-value of the slope very close to significant value (p = 0.052). High correlation (r2 = 0.94) was also obtained in the tubers with significant value (p = 0.0322). Lower correlation (r2 = 0.42) for Cl leaf with N leaf over all the experiments together was obtained but the slope was highly significant (p = 0.0169). High correlation (r2 = 0.92) for Cl leaf with N leaf over all the experiments together was obtained and the slope was also highly significant (p ≤ 0.0001).

3.3. Leaching Fraction and Leachate Composition

For achieving the third objective, we determined the volume of the drainage and the concentrations of N and Cl in the leachate as affected by the CN and CCl in the described experiments in the previous sections.

3.3.1. Leaching Fraction and Leachate Composition in the Lettuce Experiments

The leachate fractions (LF) in the lettuce experiments were high, above 0.5, due to the excess irrigation used in order to obtain drainage for estimating the water composition in the growth medium. High dose and frequent irrigation were also required in the coarse sand to maintain available water for plants. In the first lettuce experiment, the LF was very high above 0.7 in all treatments (Table 8), due to high dose and frequent irrigations after transplanting. This irrigation management was practiced for preventing water shortage and drying in the high potential evaporation conditions in middle to the end of August (17 to 31 August 2016). During the two last weeks of the lettuce growth, a shading screen was set above the plants, reducing the direct irradiation, wind speed, and the potential transpiration, leading to lower LF values that ranged between 0.5 to 0.62. In the second lettuce experiment, the LF was much lower, in the range of 0.3 to 0.5, as a result of transplanting in September and set up of the shading screen before transplanting. In the first experiment, LF increased slightly to a peak value as CN increased from 25 up to 75 mg N L−1, but it decreased with further increasing of CN. The LF was also affected significantly by CCl, and a significant interaction of CN with CCl was obtained. This interaction is due to differences in the relative effect of CN at the different CCl levels, but no difference in the general trend. In the second lettuce experiment, both CN and CCl had a significant effect on LF, and also a significant interaction was obtained. The highest values of LF were obtained at CN 25 and 125 mg N L−1 with significant lower values at the CN range of 45 to 100 mg N L−1. The Lf increased significantly from 0.37–0.40 to 0.44–0.45 with increasing the CCl from 15–150 to 350–700 mg Cl L−1. The significant interaction of CN with CCl is due to differences in the relative effect of CN at the different CCl levels, but no difference in the general trend. The effects of CN and CCl on LF showed a general expected trend, as the biomass was higher the LF became lower.
The drainage N concentration (CNL) in both lettuce experiments increased with CN with significant differences between all CN levels (Table 8). The CNL in 2016 was lower than the corresponding CN values, whereas the opposite results were observed in 2017, probably due to the higher LF values in 2016 than 2017. In both years, CNL increased steeply as CN increased. CCl had no significant effect on CNL in the first lettuce experiments. In in the second experiment, significant higher values were obtained at CCl = 700 mg L−1 than all other CCl treatments, but the relative effect of CCl was much smaller than the effect of CN. Although a significant interaction of CN with CCl was obtained in 2017, the general trend of CN effect on CNL was similar at all CCl concentrations with differences in the relative effect. The drainage N mass (MNL) in both lettuce experiments increased with CN with significant differences between all CN levels, similar to the CNL. While higher CNL values were obtained in 2017 than in 2016, the opposite effect on MNL was obtained, due to the much higher LF values in 2016. In the first experiment, the MNL increased linearly with CN, while in the second experiment it increased exponentially, with steeper increase in MNL as CN increased above 85 mg N L−1 (Figure 3). While CCl had no effect on MNl in the first experiment, it had a significant effect in the second experiment (Table 8 and Figure 3), in which the relative effect on MNL was much bigger than on CNL., probably due to the effect of CCl on LF.
The drainage Cl concentration (CClL) in both lettuce experiments increased with CCl, with significant differences between all CCl levels (Table 8). Because of the much bigger LF in the first than the second lettuce experiment, the CClL values in 2016 were slightly lower than the corresponding CCl, while the opposite was obtained in 2017. In 2016, CN had significant effect on CClL, but the change in CClL as a function of CN was not consistent with clear trend, and in 2017 no significant effect of CN on CClL was obtained. In 2016, there was no interactive effect of CN with CCl on CClL, while in 2017 there was interactive effect but the same trend of effect of CCl on CClL was obtained in all CN treatments. The drainage Cl mass (MClL) in both lettuce experiments increased with CCl, with significant differences between all CCl levels. Because of the much bigger LF in the first than the second lettuce experiment, the MClL values in 2016 were greater than in 2017 (Table 8; Figure 4). In the two lettuce experiments, CN had significant effect on MClL, but the change in MClL as a function of CN, was not consistent with clear trend and it was much smaller than the effect of the CCl. Significant interactive effect of CN with CCl on MClL was obtained in the second experiment, however the same trend of effect of CCl on MClL was obtained in all CN treatments. Overall, a linear increase of MClL with raising CCl was obtained in both years (Figure 4).

3.3.2. Leaching Fraction and Leachate Composition in the Potato Experiments

Similar to the lettuce experiments, in the three potato experiments the LF was relatively high, above 0.45, due to the excess irrigation in the coarse sand to maintain available water for plants and to obtain drainage for monitoring water composition in the growth medium. In the three experiments, LF decreased considerably and significantly with increasing the CN (Table 9a). In the first experiment, CCL had no effect on LF and no interaction of CN with CCL was obtained. In the second and third experiments, the LF significantly increased as the CCl increased; a mirror of the effect of CCl on the biomass production. An interactive effect of CN with CCL was obtained in the third experiment, due to the different effect of CCl on LF in the lowest CN value than in the other CN treatments. This difference is probably a result of the strong and dominant negative effect of the lowest CN treatment on biomass production and transpiration.
In the three potato experiments, CNL increased significantly with raising CN with no effect of CCl and no interactive effect of CN with CCl (Table 9a). The values of CNL were lower than the corresponding CN in the first experiment, whereas similar and higher values were obtained in the third and second experiments, respectively. The MNL was also significantly increased with raising CN in all three potato experiments (Table 9a and Figure 5). No effect of CCl and no interaction of CN with CCl were observed in the first experiment, whereas a significant increase of MNL with increasing CCl and interactive effect of CN with CCl was observed in the second and third experiments due to difference in the strength but not the trend of the effect of CN on MNL at each CCl level (Table 9a and Figure 5). The effect of CCl on MNL in the second and third experiments is probably due to the increase in the LF with CCl, as no effect of CCl on CNL was observed. In the three experiments, a nonlinear effect of CN on MNL was observed. In 2016, the predictions of MNL as function of CN by the exponential model were very close to the measured values, whereas in 2017 and 2018 the predictions of the exponential model underestimated N drainage mass of at CN 100 mg L−1 and overestimated it at CN 150 mg L−1 (Figure 5). Nevertheless, in all three years the slope became steeper as CN was raised above 40 mg L−1.
In all three potato experiments the CClL was significantly affected by CCl and CN, and also the interactive effect of these factors was obtained (Table 9b). However, in all three experiments the relative effect of CCl on CClL is much bigger than that of CN and the interactive effect is due to small differences in the relative effect of CCl at different CN values, but no difference in the trend of the effect was obtained, therefore the overall main effects are further discussed. CClL increased linearly with CCl in the three experiments with the following slopes; 1.01, 1.156, and 1.09 in the first, second, and the third experiment, respectively. In all three experiments, CClL increased linearly with CN (Table 9b) as a result of the decreased LF with inncreasing CN as shown above. In all three experiments, MClL increased considerably and significantly with raising the CCl, whereas CN had no considerable effect. In the first experiment, there was no interactive effect of CCl with CN, whereas a significant interactive effect was obtained in the second and third experiments. Despite the interactive effect of CCl with CN in two of the experiments, the same trend of increasing MClL with CCl was obtained at all CN levels in the three experiments. In all three experiments, MClL increased linearly with CCl with slopes in the range of 0.086 to 0.128 g Cl/pot/(mg Cl/L) (Figure 6). Unlike the relation of MNL with CN, there is no a threshold CCl point above which there is steeper increase of MClL with further increase in CCl.

4. Discussion

The main hypothesis of this research was that the optimal nitrogen concentration for the highest yield will be lower with decreasing chloride concentration of the irrigating solution. Therefore, we hypothesized that lower nitrogen concentrations will be required with desalinated water for achieving maximum yield. However, the opposite results were obtained in the current experiment with two crops: lettuce and potato. Using the best fit response curves of lettuce heads (quadratic equation) and potato tubers (Mitcherlich model) we found that higher values of CN were required for obtaining the maximal yield with desalinated or moderate salinity (low chloride concentrations) than for irrigation with high salinity water (high chloride concentrations). However, one should note that the maximum yields under desalinated or moderate salinity were bigger than under high salinity water. Extending the scope of the research from the question of the opportunity to reduce nitrogen fertilization with the use of desalinated water to the wider question of the possible interaction of salinity with fertilization, several published studies showed interactions of nitrogen with chloride in avocado [22], tomato [16,17,18,19], and melon [17], whereas other studies found no interaction in maize [37], pepper [38], and various horticultural crops [39].
The hypothesis of the possible interaction of CN with CCl leading to the opportunity to reduce the recommended CN with desalinated water is based on findings on competition between the ions chloride and nitrate in uptake by plants [14,16,17,18]. Our assumptions were (i) the uptake and the concentration of chloride in organs of plants will be reduced by elevating CN and (ii) the uptake of and the concentration of nitrogen in organs of plants irrigated with desalinated water will be higher than in plants irrigated with higher chloride concentrations when the same CN is applied. As expected, we also found that the concentration of chloride in plant organs of lettuce and potato decreased with elevating the CN (Table 6 and Table 7). However, no effect of CCl on the concentrations of reduced nitrogen in plant organs was found in lettuce and potato (Table 6 and Table 7), in agreement with published findings for pepper [38]. On the other hand, nitrate concentration in lettuce and potato leaves decreased with increasing CCl, but this reduction had negligible impact on the total content of nitrogen in plants organs, because the reduced nitrogen is the main component of nitrogen in plant organs.
The response of plants biomass production to nitrogen is dependent of environmental conditions including salinity. Following Liebig’s law of the minimum, when water of low salinity, like desalinated water, is used, the potential for high biomass production is elevated and the demand for nitrogen is higher. Therefore, the optimal CN for fertigation with desalinated water or another water source with low salinity and chloride concentration is higher or the same than the concentration recommended with other fresh water with relative low salinity. When the irrigating water containing high chloride concentration the salinity leads to reduction in the potential biomass and the demand for nitrogen, consequently in most investigations there was no positive effect of elevating CN with saline water irrigation. The negative effect of high salinity on plant biomass is caused by two main factors: (i) osmotic effect on water uptake and (ii) specific toxic effects of ions. Elevating CN as well as other nutrients is useless as a mitigating tool against the negative effect of the osmotic pressure; moreover, the elevated concentrations of nutrients contribute to higher osmotic pressure. Consequently, in many studies no positive effect of elevating nutrients concentrations above the recommended levels with fresh water were observed [18,37,38]. The few cases where positive effects of elevating nutrients concentrations applied with saline water above the optimal concentration for plants irrigated with low salinity water were probably obtained with plants that are highly sensitive to specific toxic effects of some ions, especially Cl and Na [13,22,40]. In the current research with both lettuce and potato, which are defined as moderately salt-sensitive [6,7], the major impact of the high chloride treatments was probably the total salinity affecting the osmotic pressure and the required energy for water uptake. In such crops the optimal required nitrogen is not higher in high salinity and chloride solutions.
Several reviews concluded that the results reported in the literature on the interaction between salinity and nutrients were contradictory or indicated no interactive effects [10,15,37,39,41]. Grattan and Grieve (1999) [39] concluded that “Despite a large number of studies that demonstrate that salinity reduces nutrient uptake and accumulation or affects nutrient partitioning within the plant, little evidence exists that adding nutrients at levels above what is considered optimal in non-saline environments, improves crop yield.” Recently, it was reported that nitrogen doses beyond the recommended values exacerbated the negative effects of salinity on growth and photosynthetic rates, in maize and cotton plants growing under moderate to high salinity conditions [42]. They found that the negative effect of high salinity with high dose of nitrogen was stronger in maize which is less tolerant to salinity.
However, part of this conflict can be removed by using the Bernstein definitions [43] of three different types of idealized salinity/nutrition interactions: (a) increased salt tolerance at suboptimal nutritional levels, (b) independent effects of salinity and nutrition at optimal and suboptimal nutritional levels, and (c) decreased salt tolerance at suboptimal nutritional levels. This method requires several salinity levels at each fertilization level. In the current research just in the third potato experiment there were more than four concentrations of CCl (salinity level) and in that experiment we found that the slope of reduction in yield as a function of CCl was not affected by the CN (type b case in Bernstein model).
We also set the hypothesis that the uptake of water and nitrogen of plants irrigated with desalinated water will be higher than that of plants irrigated with water containing higher chloride concentrations; consequently, the LF and the downward leaching of chloride and nitrate below the root zone will be reduced by irrigation with desalinated water. The results of the current research approved this hypothesis for both crops when the irrigation volume was the same for all combinations of CN and CCl. In reality, the optimal management of irrigation with water sources with different salinity levels should be adjusted to minimize the salinity in and below the root zone. Therefore, the required volume and LF of irrigating water decrease as the salinity decreases and thus the lowest water volume is required when plants are irrigated with desalinated water. Consequently, the efficiency of the applied nitrogen is higher and the total amount of applied nitrogen with desalinated water might be lower despite the higher CN of the fertigation. We expected that the use of desalinated water will enhance plant biomass and water uptake and reduce the LF over water of moderate salinity. However, in most of the lettuce and potato experiments in the current study there was no advantage to desalinated water over the treatment of low CCl in the range of 100 to 200 mg L−1. It should be noted that the response of the plants is to the effective salinity, in the root zone, rather than the salinity of the irrigated water. The LF in irrigation of commercial fields and in most experiments is much lower than the LF values in the current experiments. Therefore, the effective salinity or Cl concentration in the soil solution in commercial fields is several times higher than that of the irrigation water, while in the current research the Cl concentration of the drainage was similar or just two times higher than CCl. Therefore, we suggest that in real life the enhancement of biomass production and reduction in LF and downward leaching of nitrate and chloride by a shift from moderate salinity to desalinated water will be bigger than in the current study.
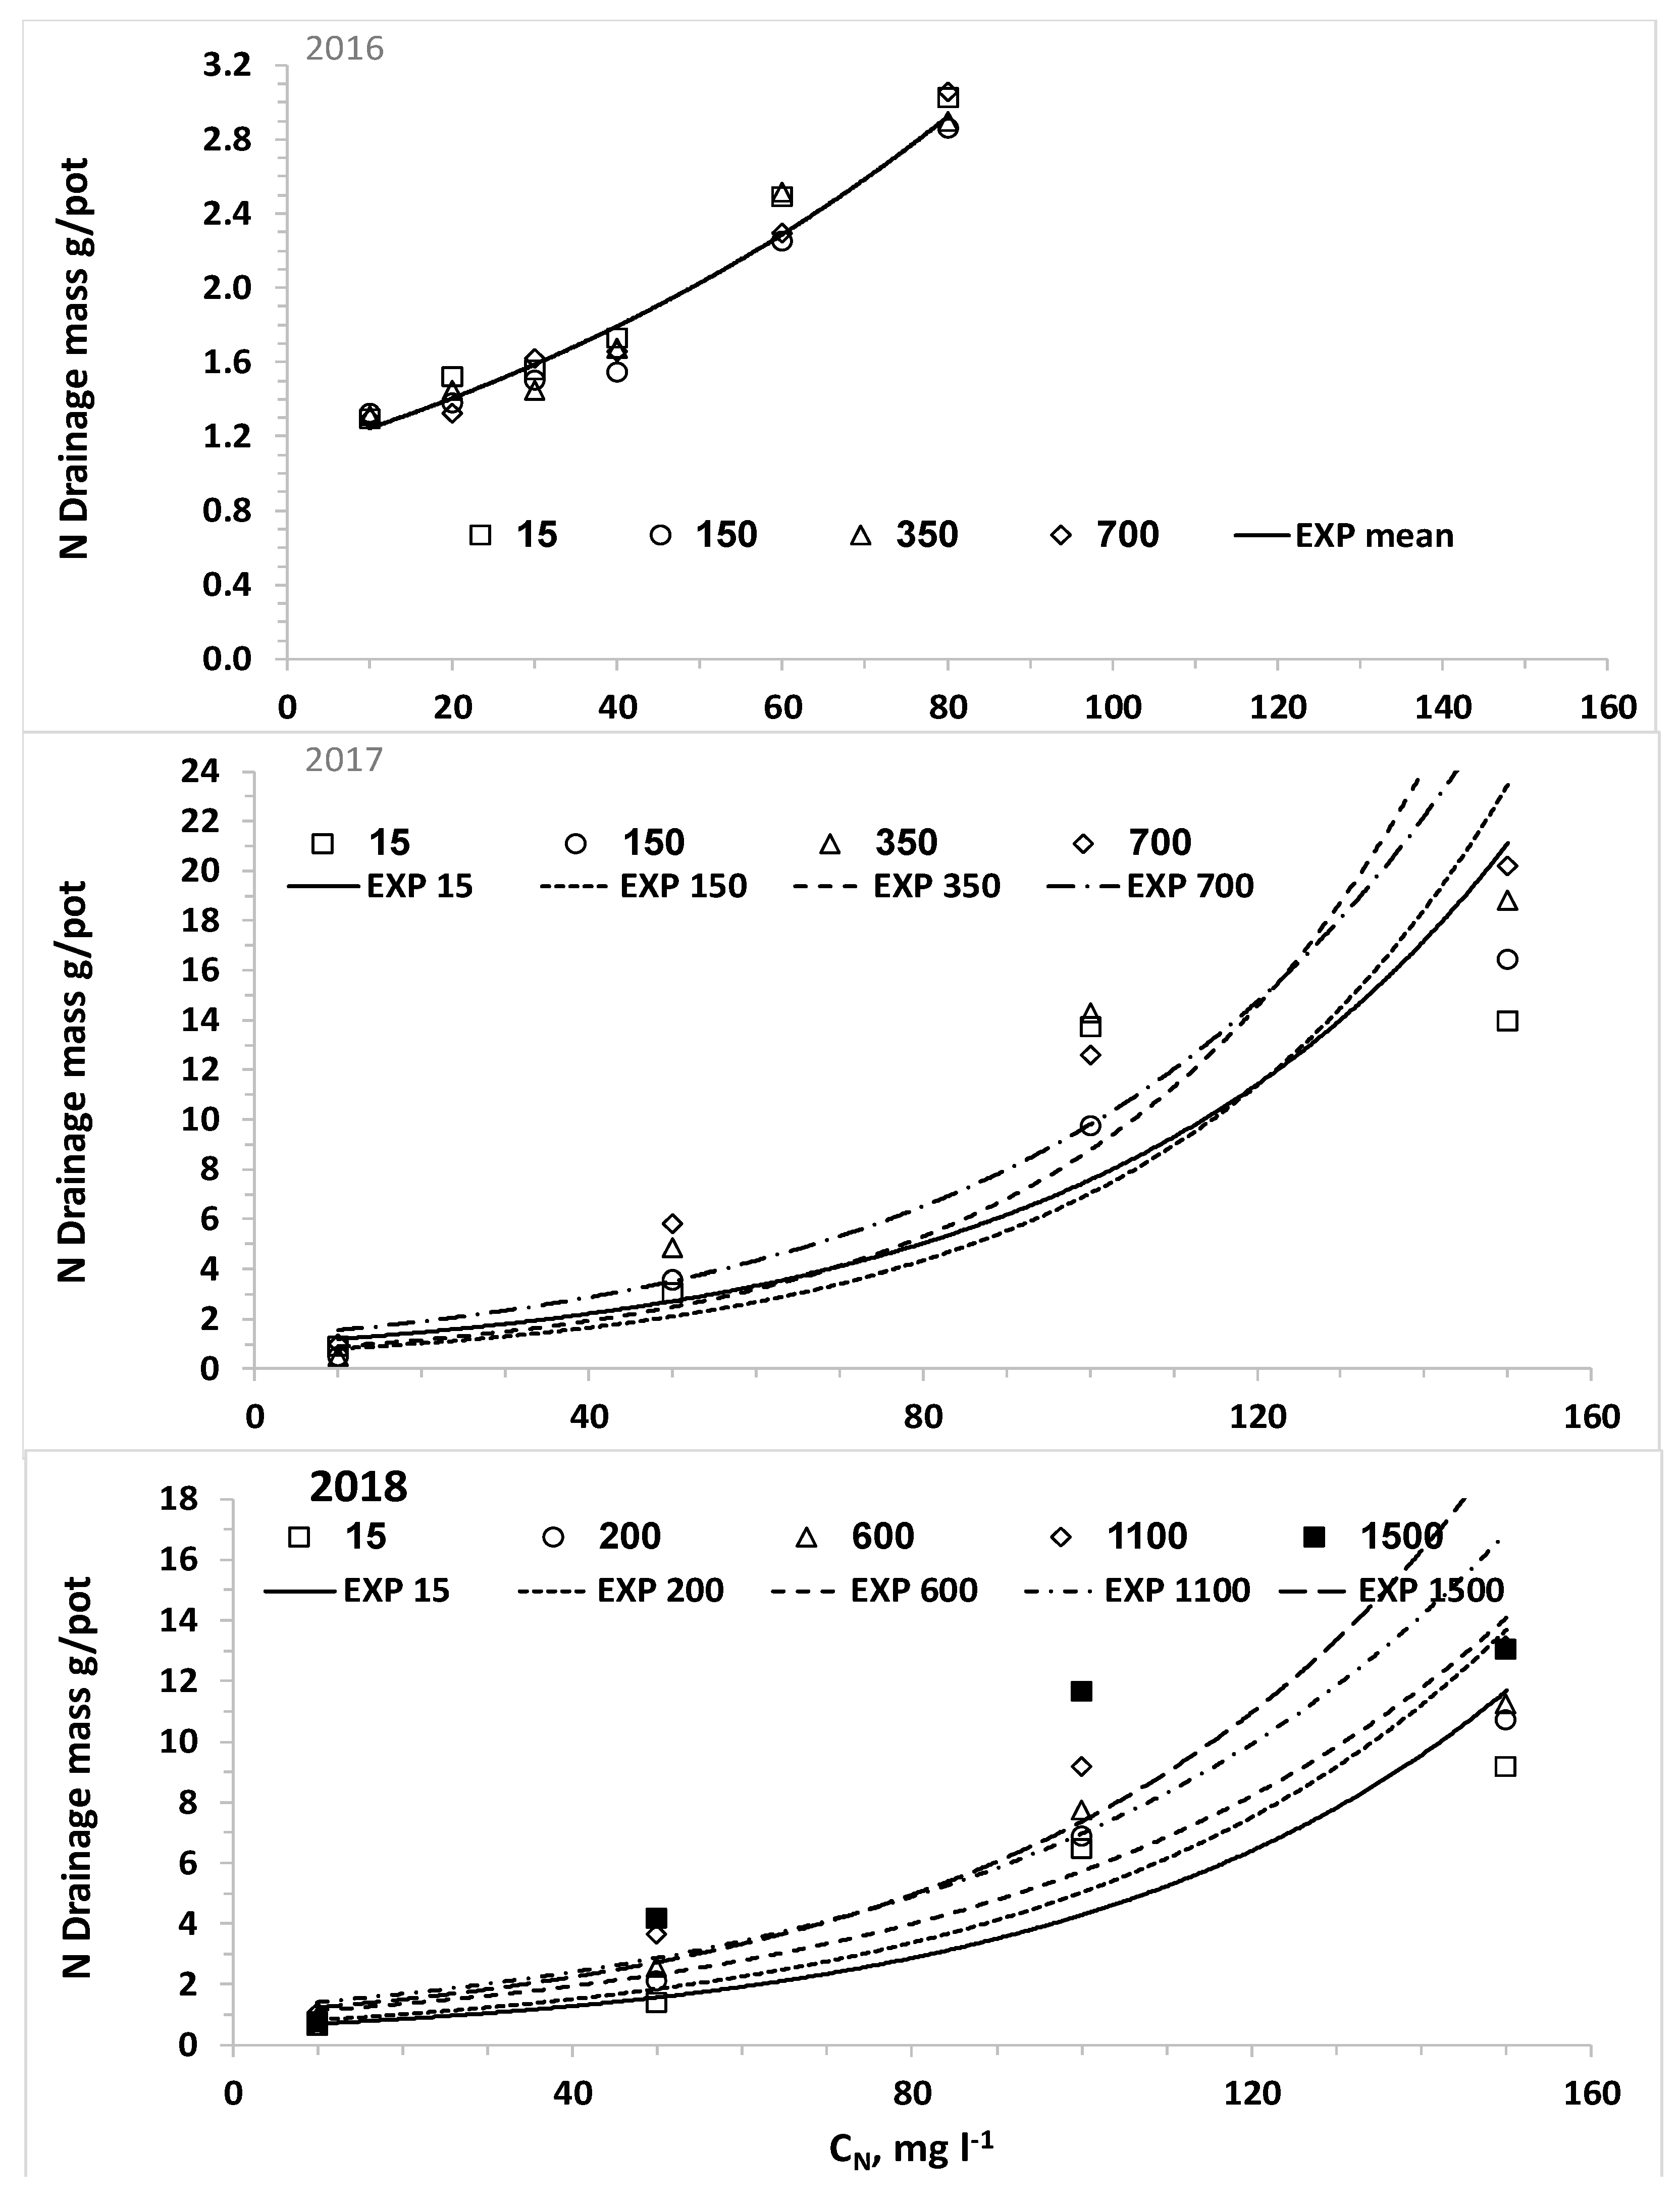
The nonlinear increase of CNL and MNL as a function of CN with steep increase above a threshold that was obtained in all potato experiments is in agreement with our previous study [44]. This result is typical of the reduced efficiency of N uptake with increased CN, which is quantitatively described by nutrient uptake models like the Michalis–Menten equation [14]. In part of the experiments, elevating CCL level increased significantly MNL as a result of the smaller biomass production and higher LF. Although the LF values in the current experiments were much higher than those in commercial fields, the general trend of higher leaching fraction with higher salinity is also practiced in commercial fields to prevent salts accumulation in the root-zone [27,28,35,41]. Thus, reduced MNL and higher efficiency of CN fertigation is expected with desalinated water, although irrigation with desalinated water did not enhance reduced nitrogen concentration in lettuce and potato organs. In contrast to potato, in lettuce no such clear threshold value of CN was obtained. The main reason for this difference is that in lettuce the uptake of nitrogen in low CN values is less efficient than in potato and there was no change in the N uptake efficiency as a function of C
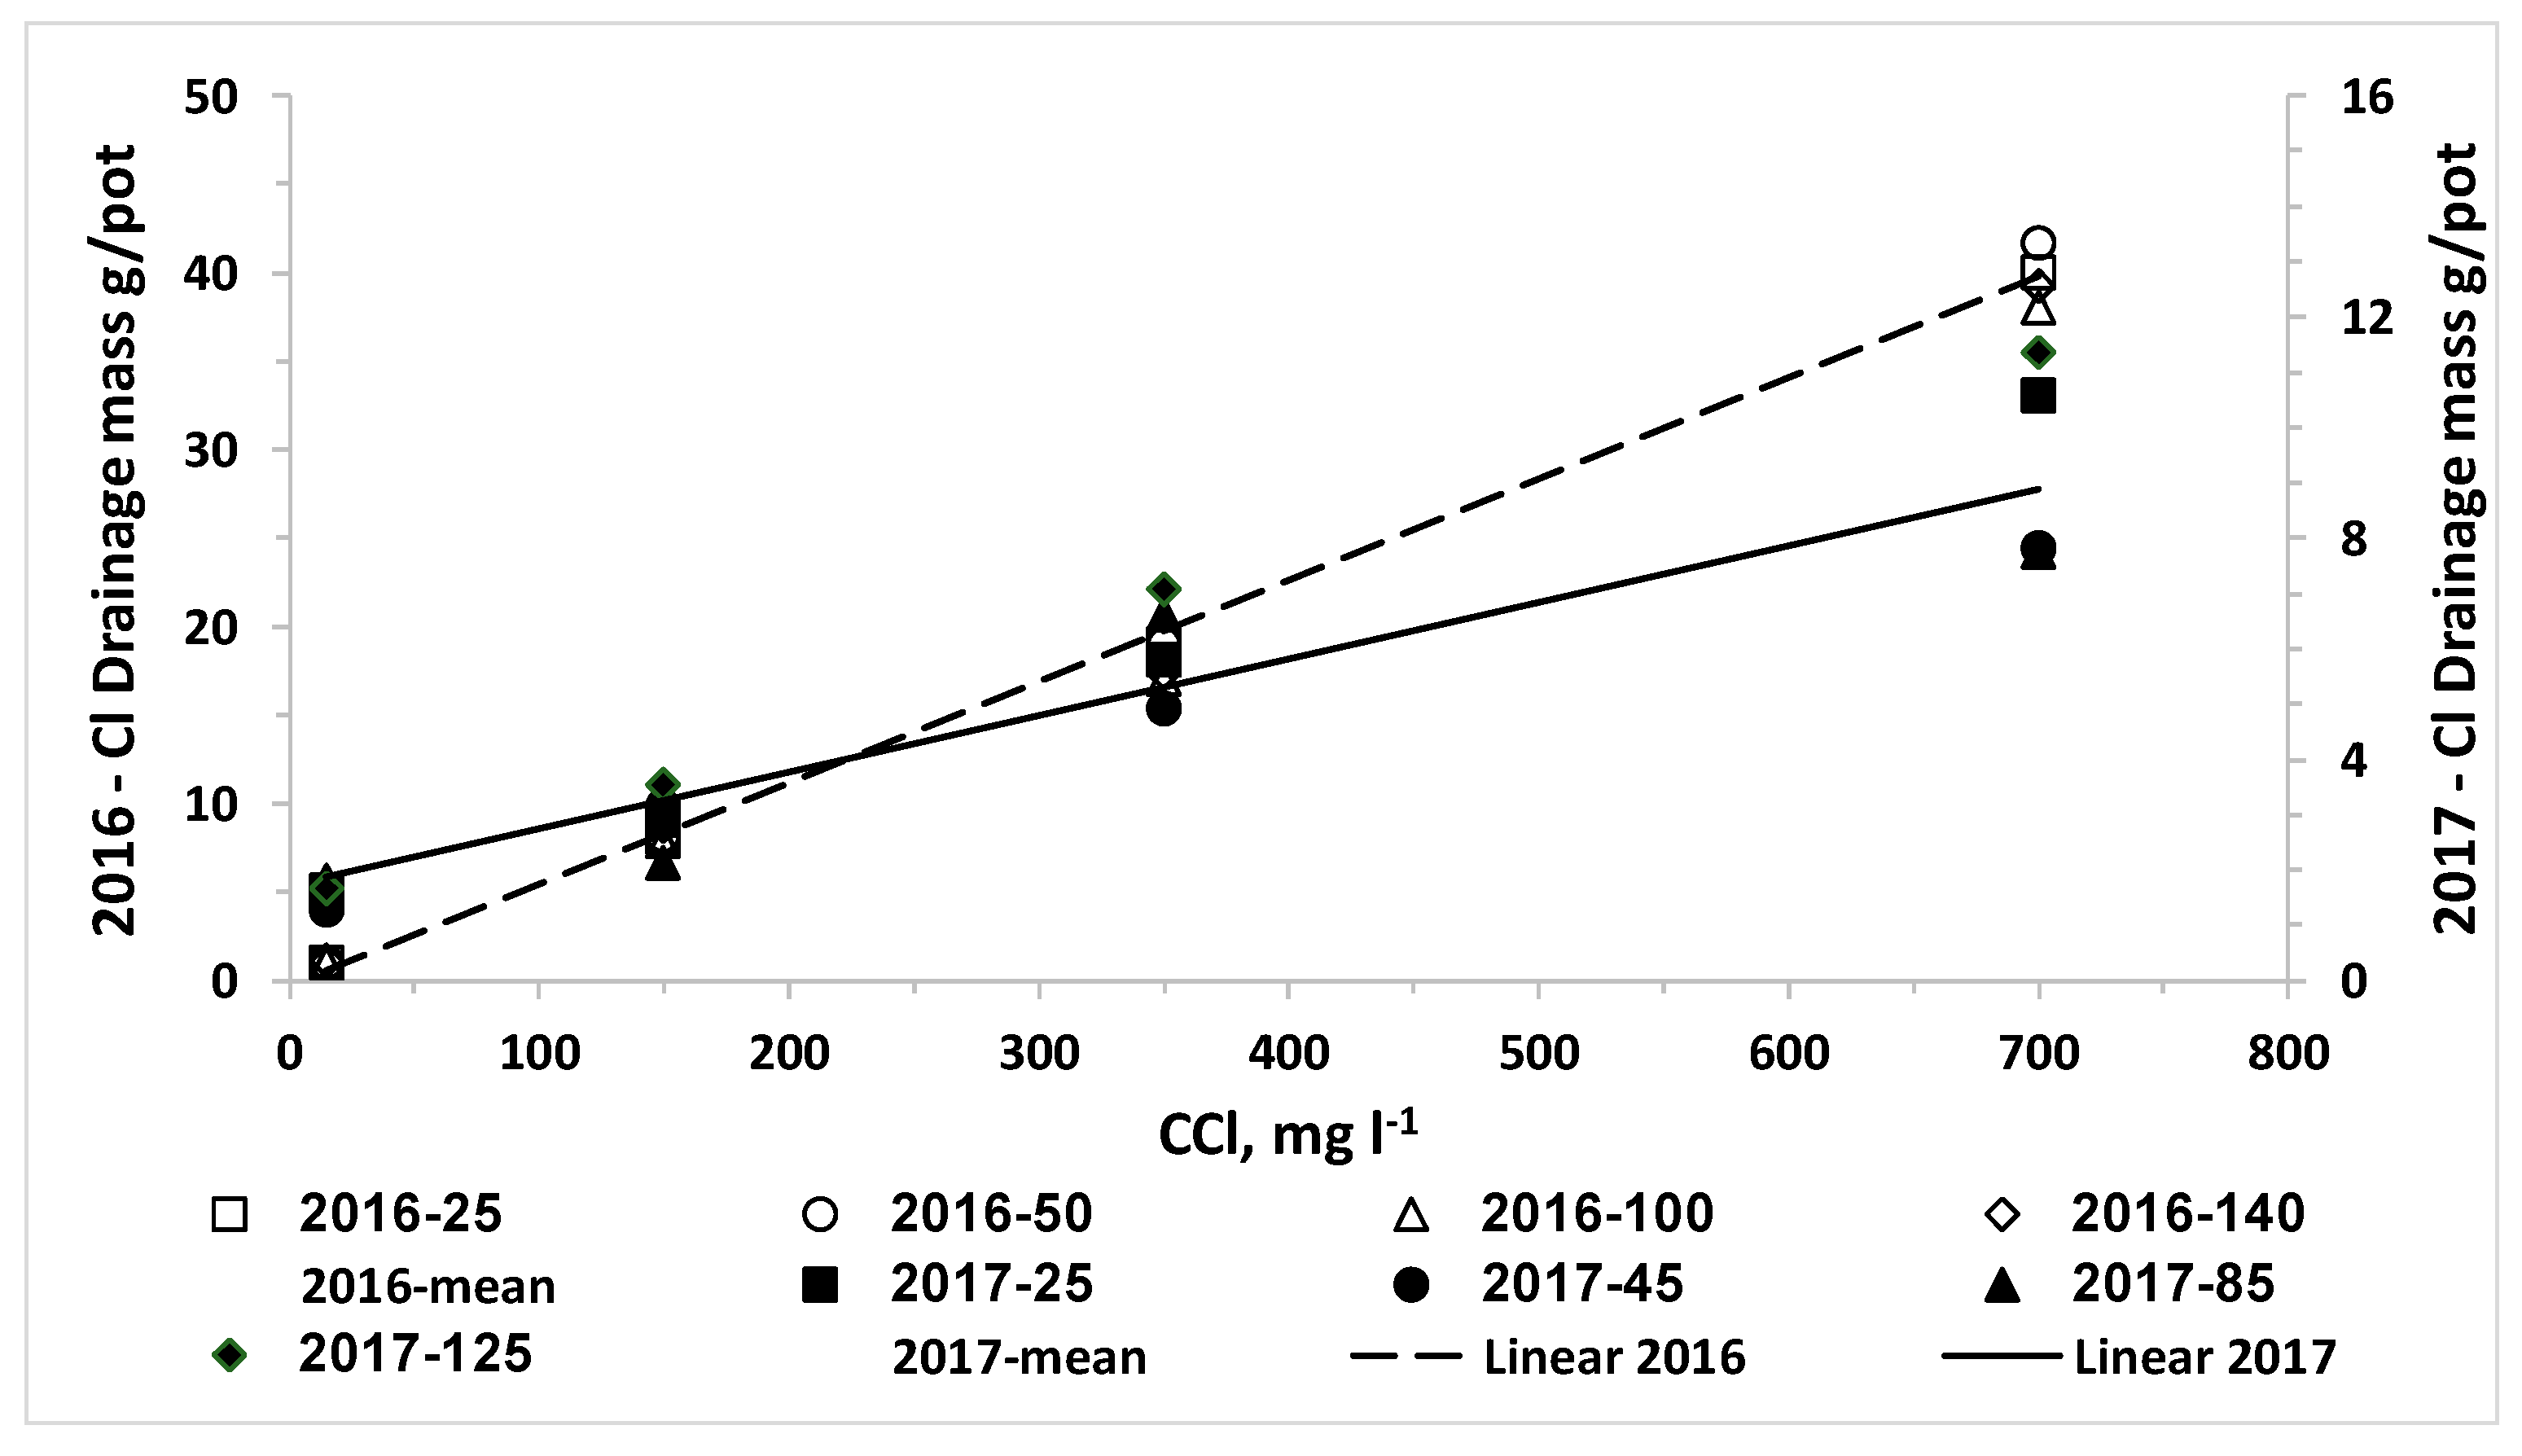
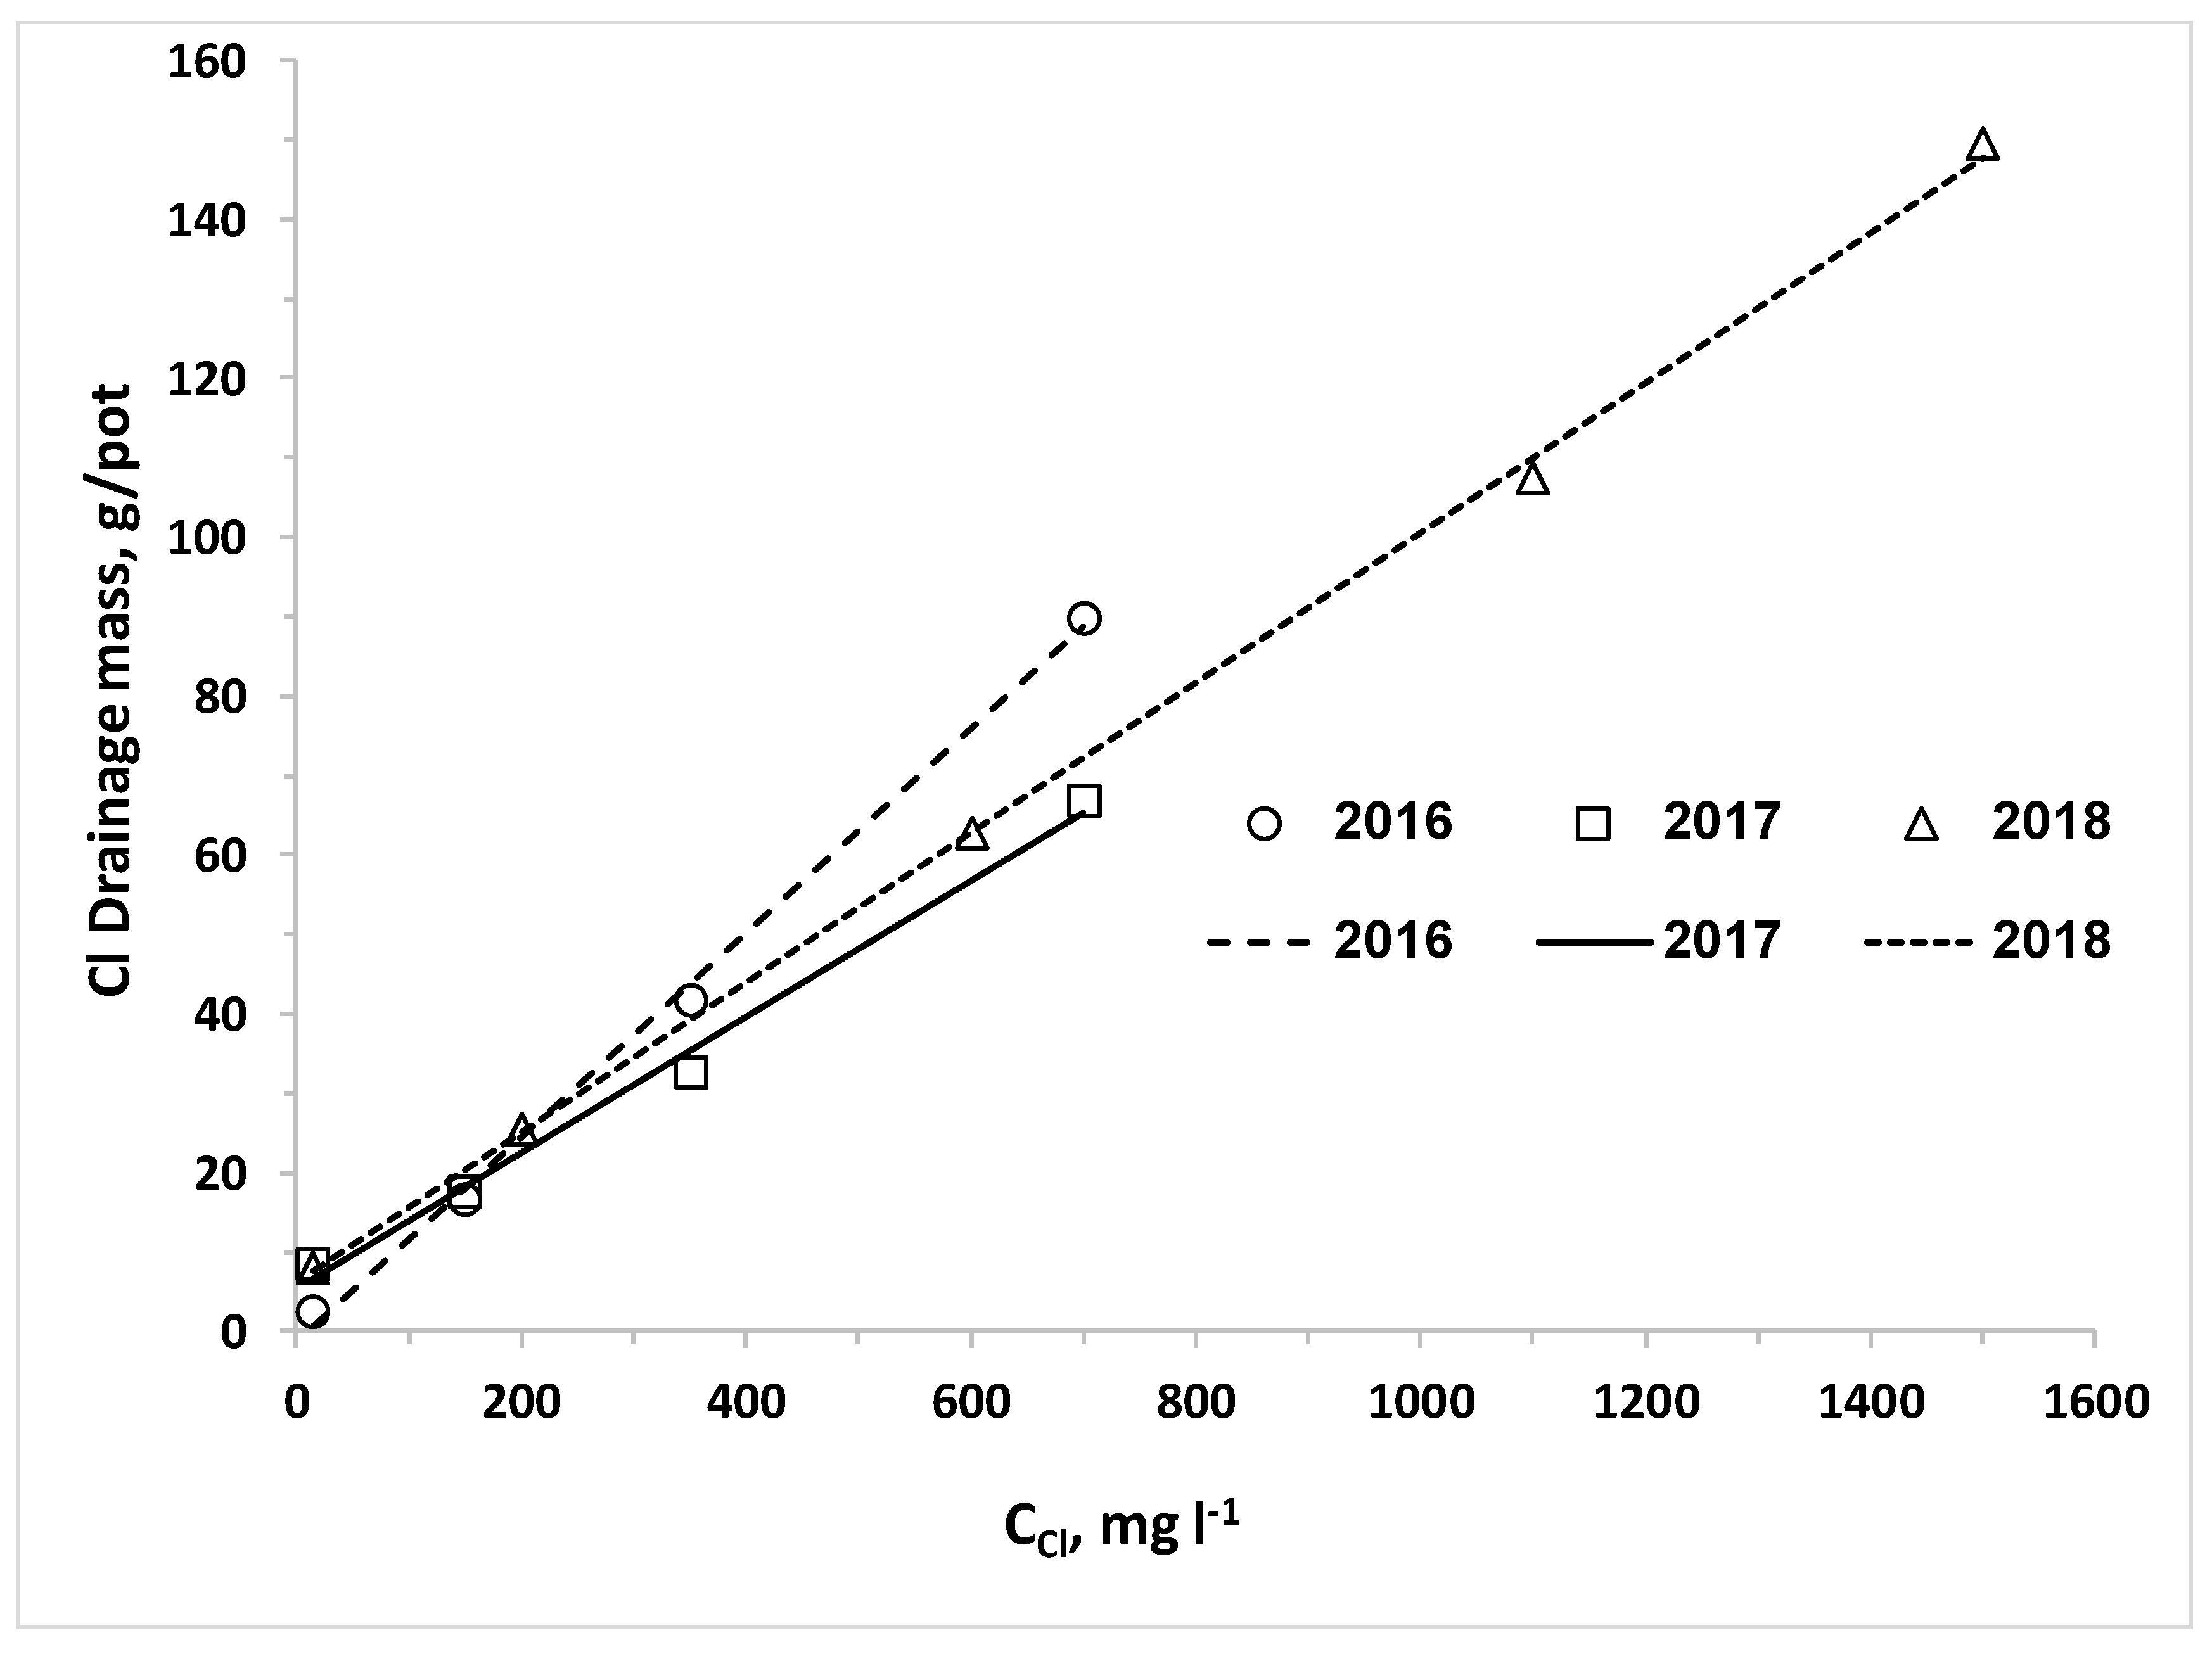
N.
The linear increase of CClL and MClL as function of CCl that was obtained for both crops in all experiments was expected due to the very low uptake of chloride [13], which does not change considerably the concentration of chloride in the drainage from the irrigation water. Although CN had significant effect on Cl concentration in plant organs, this effect is small relative to the total amount of Cl applied even in the desalinated water, and therefore it had no significant effect on CClL. Thus, the significant effect of CN on MCl is due its’ effect on LF discussed above.

5. Conclusions

In contrast to the hypothesis of this research, optimal CN in both crops was higher in the desalinated water than in high CCL treatments. This result is related to the increase in N uptake by plants at low CCL and with CN in the irrigating solution. As expected, N fertilization suppressed Cl accumulation in plant tissues without effecting plant biomass production. Drainage of N and Cl increased with increasing CCL in the irrigating solution and N fertilization above optimal CN resulted in steep rise in downward N leaching. The overall conclusion is that, as water quality is improved through desalination, higher N supply is required for high yields with less groundwater pollution by downward leaching of N and Cl.

Author Contributions

Conceptualization, A.B.-T. and D.K.; methodology, A.B.-T. and D.K.; validation, A.B.-T. and D.K.; formal analysis, A.B.-T., E.K., and B.K.; investigation, E.K., B.K., I.N., and R.S.; Project administration, I.N., E.K., B.K., and R.S.; resources, D.K. and A.B.-T.; data curation, A.B.-T., E.K., and B.K.; writing—original draft preparation, A.B.-T.; writing—review and editing, A.B.-T. and D.K.; visualization, A.B.-T., E.K., and B.K.; supervision, A.B.-T. and D.K.; funding acquisition, D.K. and A.B.-T. All authors have read and agreed to the published version of the manuscript.

Funding

This research was funded by the Chief Scientist Fund of the Ministry of Agriculture and Rural Development, Israel, grant number 20-13-0013.

Conflicts of Interest

The authors declare no conflict of interest. The funders had no role in the design of the study; in the collection, analyses, or interpretation of data; in the writing of the manuscript; or in the decision to publish the results.

References

  1. Yermiyahu, U.; Tal, A.; Ben-Gal, A.; Bar-Tal, A.; Tarchitzky, J.; Lahav, O. Rethinking desalinated water quality and agriculture. Science 2007, 318, 920–921. [Google Scholar] [CrossRef]
  2. Hanasaki, N.; Yoshikawa, S.; Kakinuma, K.; Kanae, S. A seawater desalination scheme for global hydrological models. Hydrol. Earth Syst. Sci. 2016, 20, 4143–4157. [Google Scholar] [CrossRef] [Green Version]
  3. Stanhill, G.; Kurtzman, D.; Rosa, R. Estimating desalination requirements in semi-arid climates: A Mediterranean case study. Desalination 2015, 355, 118–123. [Google Scholar] [CrossRef]
  4. Israel Water Authority, 2018. Consumption of Potable Water in 2017 (in Hebrew). Available online: http://www.water.gov.il/Hebrew/ProfessionalInfoAndData/Allocation-Consumption-and-production/20172/shafirim_mavo_2017.pdf (accessed on 16 October 2018).
  5. Russo, D.; Kurtzman, D. Using Desalinated Water for Irrigation: Its Effect on Field Scale Water Flow and Contaminant Transport under Cropped Conditions. Water 2019, 11, 687. [Google Scholar] [CrossRef] [Green Version]
  6. Maas, E.V. Crop salt tolerance. In Agricultural Salinity Assessment and Management; Tanji, K.K., Ed.; American Society of Civil Engineers: New York, NY, USA, 1990; pp. 262–304. [Google Scholar]
  7. Maas, E.V.; Hoffman, G.J. Crop salt tolerance—Current assessment. J. Irrig. Drain. Div. ASCE 1977, 103, 115–134. [Google Scholar]
  8. Shanon, M.C.; Grieve, C.M. Tolerance of vegetables crop to salinity. Sci. Hortic. 1999, 78, 5–38. [Google Scholar] [CrossRef]
  9. Sonneveld, C. The salt tolerance of greenhouse crops. Neth. J. Agric. Sci. 1988, 36, 63–73. [Google Scholar]
  10. Grattan, S.R.; Grieve, C.M. Mineral element acquisition and growth response of plants grown in saline environments. Agric. Ecosyst. Environ. 1992, 38, 275–300. [Google Scholar] [CrossRef]
  11. Munns, R. Physiological processes limiting plant growth in saline soil: Some dogmas and hypotheses. Plant Cell Environ. 1993, 16, 15–24. [Google Scholar] [CrossRef]
  12. Volkmar, K.M.; Hu, Y.; Steppuhn, H. Physiological responses of plants to salinity: A review. Can. J. Plant Sci. 1998, 78, 19–27. [Google Scholar] [CrossRef]
  13. Xu, G.; Magen, H.; Tarchitzky, J.; Kafkafi, U. Advances in chloride nutrition of plants. Adv. Agron. 2000, 68, 97–150. [Google Scholar]
  14. Massa, D.; Mattson, N.S.; Lieth, H.J. Effects of saline root environment (NaCl) on nitrate and potassium uptake kinetics for rose plants: A Michaelis-Menten modeling approach. Plant Soil 2009, 318, 101–115. [Google Scholar] [CrossRef]
  15. Feigin, A. Fertilization management of crops irrigated with saline water. Plant Soil 1985, 89, 285–299. [Google Scholar] [CrossRef]
  16. Kafkafi, U.; Valoras, N.; Letay, J. Chloride interaction with NO3 and phosphate nutrition in tomato. J. Plant Nutr. 1982, 5, 1369–1385. [Google Scholar] [CrossRef]
  17. Feigin, A.; Rylski, I.; Meiri, M.; Shalhevet, J. Response of melon and tomato plants to chloride-nitrate ratio in saline nutrient solutions. J. Plant Nutr. 1987, 10, 1787–1794. [Google Scholar] [CrossRef]
  18. Heuer, B.; Feigin, A. Interactive effects of chloride and nitrate on photosynthesis and related growth parameters in tomatoes. Photosynthetica 1993, 28, 549–554. [Google Scholar]
  19. Frechilla, S.; Lasa, B.; Ibarretxe, L.; Lamsfus, C.; Aparicio-Tejo, P. Pea responses to saline stress is affected by the source of nitrogen nutrition (ammonium or nitrate). Plant Growth Regul. 2001, 35, 171–179. [Google Scholar] [CrossRef]
  20. Flores, P.; Navarro, J.; Carvajal, M.; Cerdá, A.; Martínez, V. Tomato yield and quality as affected by nitrogen source and salinity. Agronomie 2003, 23, 249–256. [Google Scholar] [CrossRef] [Green Version]
  21. Horchani, F.; R’bia, O.; Hajri, R.; Aschi-Smiti, S. Does the source of nitrogen affect the response of tomato plants to saline stress? Curr. Bot. 2010, 2, 8–14. [Google Scholar]
  22. Bar, Y.; Apelbaum, A.; Kafkafi, U.; Goren, R. Relationship between chloride and nitrate and its effect on growth and mineral composition of avocado and citrus plants. J. Plant Nutr. 1997, 20, 715–731. [Google Scholar] [CrossRef]
  23. Lea-Cox, J.D.; Syvertsen, J.P. Salinity reduces water-use and nitrate-N-use efficiency of Citrus. Ann. Bot. 1993, 72, 47–54. [Google Scholar] [CrossRef]
  24. Rubio, J.S.; García-Sánchez, F.; Rubio, F.; García, A.L.; Martínez, V. The importance of K+ in ameliorating the negative effects of salt stress on the growth of pepper plants. Eur. J. Hortic. Sci. 2010, 75, 33–41. [Google Scholar]
  25. Feigin, A.; Pressman, E.; Imas, P.; Miltau, O. Combined effects of KNO3 and salinity on yield and chemical composition of lettuce and chinese cabbage. Irrig. Sci. 1991, 12, 223–230. [Google Scholar] [CrossRef]
  26. Ben-Gal, A.; Yermiyahu, U.; Cohen, S. Fertilization and blending alternatives for irrigation with desalinated water. J. Environ. Qual. 2009, 38, 529–536. [Google Scholar] [CrossRef]
  27. Jalali, M.; Merrikhpour, H. Effects of poor quality irrigation waters on the nutrient leaching and groundwater quality from sandy soil. Environ. Geol. 2008, 53, 1289–1298. [Google Scholar] [CrossRef]
  28. Feng, Z.Z.; Wang, X.K.; Feng, Z.W. Soil N and salinity leaching after the autumn irrigation and its impact on groundwater in Hetao Irrigation District, China. Agric. Water Manag. 2005, 71, 131–143. [Google Scholar] [CrossRef]
  29. Yasuor, H.; Ben-Gal, A.; Yermiyahu, U.; Beit-Yannai, E.; Cohen, S. Nitrogen Management of Greenhouse Pepper Production: Agronomic, Nutritional, and Environmental Implications. HortScience 2013, 48, 1241–1249. [Google Scholar] [CrossRef] [Green Version]
  30. Levy, Y.; Shapira, R.H.; Chefetz, B.; Kurtzman, D. Modeling nitrate from land surface to wells’ perforations under agricultural land: Success, failure, and future scenarios in a Mediterranean case study. Hydrol. Earth Syst. Sci. 2017, 21, 3811–3825. [Google Scholar] [CrossRef] [Green Version]
  31. Spalding, R.F.; Exner, M.E. Occurrence of nitrate in groundwater—A review. J. Environ. Qual. 1993, 22, 392–402. [Google Scholar] [CrossRef]
  32. Erisman, J.W.; Sutton, M.A.; Galloway, J.N.; Klimont, Z.; Winiwarter, W. How a century of ammonia synthesis changed the world. Nat. Geosci. 2008, 1, 636–639. [Google Scholar] [CrossRef]
  33. Elhanany, S. Challenges in preserving the quality of water resources in Israel. In Proceedings of the Conference on Confronting Contamination in Soil and Water, The Israeli Institute for Energy and Environment (in Hebrew), Tel-Aviv, Israel, 28 September 2016. [Google Scholar]
  34. Oyarzun, R.; Arumi, J.; Salgado, L.; Mariño, M. Sensitivity analysis and field testing of the RISK-N model in the Central Valley of Chile. Agric. Water Manag. 2007, 87, 251–260. [Google Scholar] [CrossRef]
  35. Libutti, A.; Monteleone, M. Soil vs. groundwater: The quality dilemma. Managing nitrogen leaching and salinity control under irrigated agriculture in Mediterranean conditions. Agric. Water Manag. 2017, 186, 40–50. [Google Scholar] [CrossRef]
  36. Ben-Gal, A.; Shani, U. A highly conductive drainage extension to control the lower boundary condition of lysimeters. Plant Soil 2002, 239, 9–17. [Google Scholar] [CrossRef]
  37. Shenker, M.; Ben-Gal, A.; Shani, U. Sweet corn response to combined nitrogen and salinity environmental stresses. Plant Soil 2003, 256, 139–147. [Google Scholar] [CrossRef]
  38. Yasuor, H.; Tamir, G.; Stein, A.; Cohen, S.; Bar-Tal, A.; Ben-Gal, A.; Yermiyahu, U. Does water salinity affect pepper plant response to nitrogen fertigation? Agric. Water Manag. 2017, 191, 57–66. [Google Scholar] [CrossRef]
  39. Grattan, S.R.; Grieve, C.M. Salinity-mineral nutrient relations in horticultural crops. Sci. Hortic. 1999, 78, 127–157. [Google Scholar] [CrossRef]
  40. Cordovilla, M.P.; Ocana, A.; Ligero, F.; Lluch, C. Growth and macronutrient contents of faba bean plants: Effects of salinity and nitrate nutrition. J. Plant Nutr. 1995, 18, 1611–1628. [Google Scholar] [CrossRef]
  41. Shalhevet, J. Using water of marginal quality for crop production: Major issues. Agric. Water Manag. 1994, 25, 233–269. [Google Scholar] [CrossRef]
  42. Riberio, A.D.A.; de Lacerda, C.F.; Neves, A.L.R.; de Sousa, C.H.C.; Braz, R.D.S.; de Oliveira, A.C.; Pereira, J.M.G.; Ferreira, J.F.D.S. Use and losses of nitrogen by maize and cotton under salt stress. Arch. Agron. Soil Sci. 2020, 1–14. [Google Scholar] [CrossRef]
  43. Bernstein, L.; Francois, L.E.; Clark, R.A. Interactive effects of salinity and fertility on yields of grains and vegetables. Agron. J. 1974, 66, 412–421. [Google Scholar] [CrossRef]
  44. Kurtzman, D.; Shapira, R.; Bar-Tal, A.; Fine, P.; Russo, D. Nitrate fluxes to groundwater under citrus orchards in Mediterranean climate observations, calibrated models, simulations and agro-hydrological conclusions. J. Contam. Hydrol. 2013, 151, 93–104. [Google Scholar] [CrossRef] [PubMed]
Figure 1. Lettuce head dry weight as a function of N concentration in the irrigating solution at different Cl concentrations in the irrigating solution (a) first experiment on 26 September 2016 and (b) second experiment on 22 October 2017.
Water 12 02354 g001
Figure 2. Potato tubers fresh weight (FWT) as a function of N concentration in the irrigating solution at different Cl concentrations in the irrigating solution, (bottom) 26 May 2016, (middle) May 2017, and (top) May 2018.
Water 12 02354 g002
Figure 3. N mass in the leachate of lettuce experiments: 2016 and 2017. The equations of the best fit curves presented in Figure 3 are as follows: 2016, CCl = 15, Y = 0.4217e0.0137X, R2 = 0.873. 2016, CCl = 150, Y = 0.2834e0.0162X, R2 = 0.803. 2016, CCl = 300, Y = 0.3277e0.0174X, R2 = 0.862. 2016, CCl = 700, Y = 0.425e0.0169X, R2 = 0.952. 2017, Mean CCl, Y = 0.0432X − 0.261, R2 = 0.995.
Water 12 02354 g003
Figure 4. Cl mass in the leachate of lettuce experiments, 2016 and 2017. The equations of best fit curves presented in Figure 4 are as follows: 2016, Y = 0.057X − 0.2646, R2 = 0.998. 2017, Y = 0.010X + 1.73, R2 = 0.992.
Water 12 02354 g004
Figure 5. Nitrogen mass in the leachate of three potato experiments: 2016, 2017, and 2018. The equations of best fit curves of N-Drainage mass (MNL) vs. N irrigation concentration (CN) are presented in Figure 5 as follows: 2016, mean, Y = 1.1008e0.0122x, R2 = 0.975. 2017, 15, Y = 0.9752e0.0205x, R2 = 0.882. 2017, 150, Y = 0.631e0.0241x, R2 = 0.896. 2017, 350, Y = 0.7004e0.0253x, R2 = 0.839. 2017, 700, Y = 1.2692e0.0204x, R2 = 0.887. 2018, 15, Y = 0.5781e0.02x, R2 = 0.948. 2018, 200, Y = 0.6808e0.02x, R2 = 0.952. 2018, 600, Y = 0.9483e0.018x, R2 = 0.951. 2018, 1100, Y = 1.1867e0.0177x, R2 = 0.927. 2018, 1500, Y = 1.1015e0.0198x, R2 = 0.927.
Water 12 02354 g005
Figure 6. MCl as function of CCl in three potato experiments: 2016, 2017, and 2018. The equations of best fit curves of Cl-Drainage mass (MClL) vs. Cl irrigation concentration (CCl) are presented in Figure 5 are as follows: 2016, Y = 0.1285X − 1.34, R2 = 0.998. 2017, Y = 0.086X + 5.33, R2 = 0.998. 2018, Y = 0.0944X + 6.15, R2 = 0.999.
Water 12 02354 g006
Table 1. List of the Lettuce and potato experiments conducted in the lysimeters, Bet Dagan, 2016–2018.
CropPotatoLettucePotatoLettucePotato
Planting15.1.201617.8.201615.1.201714.9.20171.3.2018
Harvest31.5.201627.9.201617.5.201722.10.201727.6.2018
Cl (mg L−1)15, 150, 350, 70015, 150, 350, 70015, 150, 350, 70015, 150, 350, 70015, 200, 600, 1100, 1500
N (mg L−1)10, 20, 30, 40, 60, 8025, 50, 75, 100, 125, 14010, 50, 100, 150225, 45, 65, 85, 100, 125510, 50, 100, 150
Table 2. The effect of CN and CCL on lettuce head fresh and dry weight and root fresh weight. Probability of F values for CN, CCl, Block factors, and the interaction of CN and CCl were determined using the two-way ANOVA procedure of JMP 14. Different letters on the right side of values indicate significant difference between treatments (HSD) at p < 0.05 by the Tukey–Kramer honestly test. No letters are presented when no significant difference was obtained.
2016 (First Lettuce Experiment)2017 (Second Lettuce Experiment)
Variable HeadHeadRootVariableHeadHeadRoot
fwtdwtfwt fwtdwtfwt
g plant−1 g plant−1
CN CN
mg L−1 mg L−1
25 297.0 d16.0 d18.9 a25116.4 b7.9 a18.7 a
50 502.5 ab25.0 abc13.8 b45182.7 a10.5 ab17.3 ab
75 528.8 a29.8 a13.5 b65182.4 a13.2 b15.5 bc
100 509.0 ab26.7 ab11.2 b85164.5 a11.1 b13.5 cd
125 437.5 bc24.1 bc10.5 b100157.3 a11.5 b12.4 d
140 383.3 cd20.7 cd9.9 b125166.9 a12.2 b12.2 d
CCL CCL
mg L- mg L−1
15 497.2 a26.8 a11.515171.2 a12.2 a13.7 b
150 484.4 a24.5 ab12.9150169.8 a11.5 a15.1 ab
350 407.6 b21.5 b13.6350166.9 a11.1 ab15.1 ab
700 394.2 b22.0 b13.9700138.8 b9.4 b15.8 a
Factordf p value Factordf p value
CN5<0.0001<0.0001<0.0001CN5<0.0001<0.0001<0.0001
CCL30.00030.00090.3018CCL30.00150.00320.0205
Block30.00290.00160.0936Block30.92340.25080.0047
CNXCCl150.07740.05990.8696CNXCCl150.2160.7870.0378
Table 3. Best fit parameters of Equation (1) for best fit curves of Figure 1. r2—coefficient of determination.
Clabcr2N Optimum
mg L−1 mg L−1 mg L−1
2016
15−0.00310.58654.10.9194.6
150−0.00410.69142.20.9484.3
350−0.00220.355710.70.5880.8
700−0.0030.54472.60.7790.8
2017
15−0.00050.12986.000.60129.8
150−0.00130.22843.360.6387.85
350−0.00110.19573.890.9188.95
700−0.00020.04967.050.39124.0
Table 4. The effect of CN and CCL on potato shoot dry weight and tubers fresh and dry weight and N, Cl, and nitrate-N concentrations in leaf tissue. Probability of F values for CN, CCl, Block factors, and the interaction of CN and CCl were determined using the two-way ANOVA procedure of JMP 14. Different letters on the right side of values indicate significant difference between treatments (HSD) at p < 0.05 by the Tukey–Kramer honestly test. No letters are presented when no significant difference was obtained.
201620172018
Variable ShootTubers WeightVariable ShootTubers WeightVariable ShootTubers Weight
dwtfwtdwt dwtfwtdwt dwtfwtdwt
g plant−1kg plant−1 g plant−1kg plant−1 g plant−1kg plant−1
CN CNCN CN
mg L−1 mg L−1mg L−1 mg L−1
10 9.3 f0.777 f0.092 f10 34.1 b0.54 c0.150 c10 6.3 c0.229 c0.029 c
20 16.5 e1.132 e0.133 e50 47.4 a1.19 b0.351 b50 32.2 b0.610 b0.077 b
30 25.3 d1.540 d0.191 d100 55.4 a1.63 a0.498 a100 49.0 a0.693 ab0.088 ab
40 33.0 c1.916 c0.229 c150 48.6 a1.36 b0.418 ab150 57.4 a0.811 a0.109 a
60 43.6 b2.397 b0.299 b
80 53.6 a2.640 a0.354 a
CCL CCL CCL
mg L−1 mg L−1 mg L−1
15 20.8 c1.686 ab0.220 ab15 46.41.270.38215 49.6 a0.753 ba0.105 a
150 30.9 b1.843 a0.234 a150 49.81.240.374200 49.6 a0.771 a0.103 ab
350 35.4 a1.737 ab0.209 b350 43.81.10.331600 33.5 b0.582 bc0.072 bc
700 33.9 ab1.667 b0.203 b700 45.61.10.3291100 29.5 b0.472 cd0.054 c
1500 19.0 b0.350 d0.045 c
FactordfProbability of F Factordf Factordf
CCl3<0.00010.04260.0031CCl30.49910.19140.1533CCl3<0.0001<0.0001<0.0001
CN3<0.0001<0.0001<0.0001CN30.0001<0.0001<0.0001CN4<0.0001<0.0001<0.0001
Block30.12320.43460.289Block30.00070.40650.3209Block30.63340.00950.0200
CNXCCl90.03510.49510.025CNXCCl90.44830.18920.3250CNXCCl120.00080.04350.3120
Table 5. Best fit parameters of the Mitcherlich equation for best fit curves of Potato tubers fresh weight as a function of N concentration in the irrigating solution at different Cl concentrations in the irrigating solutions (Figure 2). Numbers in brackets are the standard errors of the estimated parameters. The values of the parameters and their standard errors were determined using the Nlin procedure of JMP 14.
ClACN (Y = 95%) Optimum
mg L−1 2016
153163 (471)0.022 (0.006)137.9
1503810 (272)0.019 (0.002)159.8
3502794 (111)0.030 (0.002)101.0
7002849 (160)0.026 (0.003)113.9
2017
151712 (178)0.028 (0.010)107.7
1501632 (128)0.033 (0.010)91.0
3501356 (91)0.047 (0.013)64.1
7001262 (57)0.068 (0.015)43.8
2018
15860 (87)0.050 (0.024)59.9
200963 (76)0.0355 (0.011)84.3
600737 (92)0.027 (0.012)110.9
1100568 (53)0.068 (0.051)43.8
1500443 (63)0.0353 (0.021)84.8
Table 6. The effect of CN and CCL on N, Cl, and nitrate-N concentrations in lettuce head and roots. The probability of F values for CN, CCl, Block factors, and the interaction of CN and CCl was determined using the two-way ANOVA procedure of JMP 14. Different letters on the right side of values indicate significant difference between treatments (HSD) at p < 0.05 by the Tukey–Kramer honestly test. No letters are presented when no significant difference was obtained.
20162017
HeadRoots HeadRoots
Variable NClNitrate-NNClVariableNN
CN CN
mg L−1 mg g−1mg L−1mg g−1
25 28.4 c30.8 a0.62 d15.3 d30.3 ab2524.9 e10.8 d
50 34.4 b28.0 ab1.26 c21.9 c32.4 a4532.8 d13.0 cd
75 40.1 a25.1 bc1.86 b22.4 c24.9 bc6536.7 c15.6 bc
100 40.8 a23.1 c2.27 b27.9 b29.0 abc8542.4 b16.3 bc
125 43.1 a21.1 c3.14 a29.5 ab25.7 abc10044.5 b19.0 ab
140 43.0 a20.9 c3.51 a32.0 a23.2 c12548.2 a20.7 a
CCL1 CCL
mg L−1 mg L−1
15 3810.5 c2.36 a26.9 a4.6c1538.916.8
150 3826.2 b1.92 b25.1 ab26.5 b15037.316.3
350 39.229.5 b2.05 ab24.5 ab37.3 a35038.214.7
700 37.933.2 a2.09 ab22.9 b42.0 a70038.615.8
FactordfProbability of FFactorProbability of F
CN5<0.0001<0.0001<0.0001<0.00010.0011CN<0.0001<0.0001
CCL30.775<0.00010.02410.0064<0.0001CCL0.26010.1658
Block30.04570.35590.84990.78110.9054Block0.37070.5010
CNXCCl150.90300.59010.28040.82820.2963CNXCCl0.57480.2453
Table 7. The effect of CN and CCL on the concentrations of (a) N and nitrate-N, and (b) Cl in Potato leaves and tubers. Probability of F values for CN, CCl, Block factors, and the interaction of CN and CCl were determined using the two-way ANOVA procedure of JMP 14. Different letters on the right side of values indicate significant difference between treatments (HSD) at p < 0.05 by the Tukey–Kramer honestly test. No letters are presented when no significant difference was obtained.
(a) Nitrogen and Nitrate
201620172018
Variable Shoot TubersVariable ShootTubersVariable ShootTubers
NNitrate-NN NN NN
mg g−1 mg g−1 mg g−1
CN CN CN
mg L−1 mg L−1 mg L−1
10 23.0 c0.41 d10.2 bc10 38.6 b19.9 b10 16.9 c12.3 b
20 24.8 bc0.48 cd11.5 bc50 43.5 ab21.9 b50 23.3 bc15.3 ab
30 25.2 bc0.61 cd8.7 c100 43.2 ab25.9 ab100 25.7 ab17.3 a
40 25.9 bc0.80 bc11.7 bc150 47.9 a29.1 a150 31.4 a18.7 a
60 28.2 ab1.08 b12.7 ab
80 30.3 a1.53 a15.1 a
CCL CCL CCL
mg L−1 mg L−1 mg L−1
15 27.21.47 a10.715 45.624.415 24.516.8
150 25.10.69 b11.2150 44.624.2200 23.214.1
350 26.30.56 b12.2350 42.024.0600 27.515.8
700 26.30.56 b12.4700 40.824.21100 22.917.5
1500 23.616.0
Factordf Factordf Factordf
CCl30.2807<0.00010.1549CCl30.18340.9979CCl40.46930.693
CN5<0.0001<0.0001<0.0001CN30.00740.0014CN3<0.00010.0040
Block30.46000.78080.1849Block30.23510.1821Block30.06290.8313
CNXCCl150.1019<0.00010.0597CNXCCl90.92810.7288CNXCCl120.98570.9981
(b) Chloride
2017 2018
Variable ShootTubersVariable ShootTubersVariableShootTubers
Cl Cl Cl
mg g−1 mg g−1 mg g−1
CN CN CN
mg l−1 mg L−1 mg L−1
10 71.0 d18.4 a10 70.7 a14.8 a10 68.7 a16.0
20 92.0 a19.2 a50 52.4 b10.0 b50 60.2 a14.5
30 86.1 ab18.9 a100 39.3 c7.3 c100 49.5 b13.8
40 79.4 bc17.2 ab150 31.8 d5.8 d150 47.0 b12.0
60 72.2 cd15.3 bc
80 69.2 d14.1 c
CCL CCL CCL
mg l−1 mg l−1 mg l−1
15 27.1 c9.0 d15 18.5 c4.5 d15 33.7 b8.8 b
150 73.9 b16.0 c150 46.8 b9.3 c200
350 103.9 a20.6 b350 62.5 a11.0 b600 64.8 a15.4 a
700 108.6 a23.2 a700 66.5 a13.1 a1100
1500 70.5 a18.0 a
Factor df Factordf Factordf
CCl 3<0.0001<0.0001CCl3<0.0001<0.0001CCl2<0.0001<0.0001
CN 5<0.0001<0.0001CN3<0.0001<0.0001CN3<0.00010.1082
Block 30.15750.8786Block30.90660.0870Block30.27810.2980
CNXCCl 15<0.00010.0502CNXCCl90.0005<0.0001CNXCCl60.00050.7343
Table 8. Leaching fraction, the concentrations of N and Cl in the leachate (CNL and CClL) and the mass of N and Cl in the leachate (MNL and MClL) and the ratio of MNL of the applied N of the lettuce experiments. Probability of F values for CN, CCl, Block factors, and the interaction of CN and CCl were determined using the two-way ANOVA procedure of JMP 14. Different letters on the right side of values indicate significant difference between treatments (HSD) at p < 0.05 by the Tukey–Kramer honestly test. No letters are presented when no significant difference was obtained.
20162017
VariableLFCNLMNLCClLMClLVariableLFCNLMNLCClLMClL
mg L−1g pot−1mg L−1g pot−1 mg L−1g pot−1mg L−1g pot−1
CN CN
(mg L−1) (mg L−1)
250.80 b15.8 f0.91 f300.7 ab17.1 bc250.47 a42.4 e0.55 e391.65.24 ab
500.79 bc33.8 e1.94 e304.5 ab17.5 ab450.38 b83.5 d0.85 d397.14.31 b
750.86 a53.0 d3.31 d306.4 ab18.9 a650.37 b96.3 cd1.01 cd416.04.40 b
1000.75 cd71.0 c3.83 c297.4 b16.0 c850.38 b116.4 c1.25 c424.34.60 b
1250.74 d93.3 b5.15 b311.4 a17.3 bc1000.39 b162.0 b1.83 b412.74.47 b
1400.77 bcd107.2 a5.96 a306.7 ab16.7 bc1250.49 a232.8 a3.32 a432.55.94 a
CCl CCl
(mg L−1) (mg L−1)
150.80 a61.83.5020.2 d1.0 d150.40 b117.7 b1.31 c196.7 d2.17 c
1500.79 ab62.53.66145.7 c8.5 c1500.37 b111.8 b1.22 c292.8 c2.90 c
3500.79 a61.83.38334.2 b18.7 b3500.44 a115.7 b1.59 b433.5 b5.30 b
7000.76 b63.33.53718.1 a40.3 a7000.45 b143.8 a1.79 a726.3 a8.94 a
variabledfProbability of F valuevariabledf
CN5<0.0001<0.0001<0.00010.01330.0079CN5<0.0001<0.0001<0.00010.786<0.0001
CCl30.00410.16010.0476<0.0001<0.0001CCl3<0.00010.0015<0.0001<0.0001<.0001
Block30.08660.09770.05590.92570.3459Block30.2830.69660.66720.99230.4310
CN* CCl15<0.00010.31290.15820.47520.0839CN* CCl15<.00010.0011<0.0001<0.0001<0.0001
Table 9. The effects of CN and CCl on (a) leaching fraction (LF) and the concentrations and mass of N in the leachate (CNL and MNL), and (b) the concentrations and the mass of Cl in the leachate (CClL and MClL) in the potato experiments. The probability of F values for CN, CCl, block factors, and the interaction of CN and CCl was determined using the two-way ANOVA procedure of JMP 14. Different letters on the right side of values indicate significant difference between treatments (HSD) at p < 0.05 by the Tukey–Kramer honestly test. No letters are presented when no significant difference was obtained.
(a) Leaching fraction (LF), the Concentrations and Mass of N in the Leachate (CNL and MNL).
201620172018
Variable LFCNLMNLVariable LFCNLMNLVariable LFCNLMNL
mg L−1g pot−1 mg L−1g pot−1 mg L−1g pot−1
CN CN CN
mg L−1 mg L−1 mg L−1
10 0.86 a9.1 e1.31 d10 0.66 a8.8 d0.71 d10 0.79 a9.7 d0.82 d
20 0.82 b10.5 de1.42 cd50 0.50 b69.1 c0.43 c50 0.70 b35.7 c2.80 c
30 0.77 c12.2cd1.53 cd100 0.50 b210.5 b1.26 b100 0.68 b114.4 b8.40 b
40 0.73 c14.0 c1.65 c150 0.47 b315.9 a1.73 a150 0.57 c186.9 a11.49 a
60 0.66 d22.5 b2.39 b
80 0.60 e30.6 a2.96 a
CCl CCl CCl
mg L−1 mg L−1 mg L−1
15 0.7616.61.9415 0.51 ab151.27.90 ab15 0.59 c84.94.44 d
150 0.7316.01.81150 0.46 b149.67.54 b200 0.61 c88.25.11 cd
350 0.7316.61.88350 0.55 ab155.09.59 a600 0.69 b80.15.64 bc
700 0.7416.71.87700 0.60 a148.59.88 a1100 0.75 ab87.06.78 ab
1500 0.78 a93.17.43 a
variabledf variabledf variabledf
CN5<0.0001<0.0001<0.0001CN3<0.0001<0.0001<0.0001CN3<0.00010.1859<0.0001
CCl30.09700.57400.4756CCl30.00180.84410.0057CCl4<0.0001<0.0001<0.0001
Block30.29970.17800.0797Block30.49760.20180.4815Block30.27110.24000.3673
CN * CCl150.35540.95150.9907CN * CCl90.07330.18410.0403CN * CCl12<0.00010.46240.0109
(b) The Concentrations and Mass of Cl in the Leachate (CClL and MClL).
201620172018
Variable CClLMClLVariable CClLMClLVariable CClLMClL
mg L−1g pot−1 mg L−1g pot−1 mg L−1g pot−1
CN CN CN
mg L−1 mg L−1 mg L−1
10 282 e40.4 a10 390 b31.510 794 b66.0 b
20 290 de38.5 ab50 490 a31.250 894 a74.0 a
30 306 cd38.3 ab100 522 a30.5100 953 a78.5 a
40 318 bc36.6 b150 529 a32.2150 961 a64.0 b
60 339 b36.0 b
80 3851 a36.4 b
CCl CCl CCl
mg L−1 mg L−1 mg L−1
15 21 d2.6 d15 147 d8.5 d15 137 e7.9 e
150 139 c16.6c150 324 c17.5 c200 396 d25.4 d
350 351 b41.8 b350 512 b32.7 b600 847 c62.8 c
700 768 a89.8 a700 949 a66.7 a1100 1333 b107.5 b
1500 1790 a149.5 a
variabledf variabledf variabledf
CN5<0.0001<0.0001CN3<0.00010.7444CN3<0.0001<0.0001
CCl3<0.0001<0.0001CCl3<0.0001<0.0001CCl4<0.0001<0.0001
Block30.84370.8732Block30.31870.5949Block30.02620.3923
CN * CCl15<0.00010.1934CN * CCl90.05030.0002CN * CCl120.0020<0.0001

