Article

Characteristics of the Biochemical Composition and Bioavailability of Phytoplankton-Derived Particulate Organic Matter in the Chukchi Sea, Arctic

Division of Polar Ocean Sciences, Korea Polar Research Institute, 26 Songdomirae-ro, Yeonsu-gu, Incheon 21990, Korea
*
Author to whom correspondence should be addressed.
Water 2020, 12(9), 2355; https://doi.org/10.3390/w12092355
Submission received: 21 July 2020 / Revised: 10 August 2020 / Accepted: 20 August 2020 / Published: 21 August 2020
(This article belongs to the Special Issue Marine Nitrogen Fixation and Phytoplankton Ecology)

Abstract

:
Analysis of the biochemical composition (carbohydrates, CHO; proteins, PRT; lipids, LIP) of particulate organic matter (POM, mainly phytoplankton) is used to assess trophic states, and the quantity of food material is generally assessed to determine bioavailability; however, bioavailability is reduced or changed by enzymatic hydrolysis. Here, we investigated the current trophic state and bioavailability of phytoplankton in the Chukchi Sea (including the Chukchi Borderland) during the summer of 2017. Based on a cluster analysis, our 12 stations were divided into three groups: the southern, middle, and northern parts of the Chukchi Sea. A principal component analysis (PCA) revealed that relatively nutrient-rich and high-temperature waters in the southern part of the Chukchi Sea enhanced the microphytoplankton biomass, while picophytoplankton were linked to a high contribution of meltwater derived from sea ice melting in the northern part of the sea. The total PRT accounted for 41.8% (±7.5%) of the POM in the southern part of the sea, and this contribution was higher than those in the middle (26.5 ± 7.5%) and northern (26.5 ± 10.6%) parts, whereas the CHO accounted for more than half of the total POM in the northern parts. As determined by enzymatic hydrolysis, LIP were more rapidly mineralized in the southern part of the Chukchi Sea, whereas CHO were largely used as source of energy for higher trophic levels in the northern part of the Chukchi Sea. Specifically, the bioavailable fraction of POM in the northern part of the Chukchi Sea was higher than it was in the other parts. The findings indicate that increasing meltwater and a low nutrient supply lead to smaller cell sizes of phytoplankton and their taxa (flagellate and green algae) with more CHO and a negative effect on the total concentration of POM. However, in terms of bioavailability (food utilization), which determines the rate at which digested food is used by consumers, potentially available food could have positive effects on ecosystem functioning.

1. Introduction

In terms of bottom-up controls, phytoplankton is key organism that serves as a primary producer and primary food source for organisms at higher trophic levels in the foodwebs of aquatic ecosystems. Climate change enhances the sea ice melting in the Arctic Ocean with increasing concerns about primary production and nutrient cycling. Sea ice loss reduces surface albedo and enhances light penetration, creating irregularities on the timing and the duration of phytoplankton blooms [1,2]. These conditions can create discontinuity between the available food resources and the nutritional demands of higher producers [1], including higher trophic level organisms [3], and thus affect the energy flow of the entire arctic food web.
In natural systems, however, the food value of phytoplankton cannot be adequately described by measuring their biomass (chlorophyll a) and primary production. Hence, measures of the main biochemical classes (proteins, PRT; lipids, LIP; carbohydrates, CHO) of organic compounds have been used by various authors to estimate the quality and quantity of food in organic pools (reviewed by Bhavya et al. [4]). It is assumed that other biochemical components comprise negligible weights [5] and that the three major biochemical constituents (PRT, LIP, and CHO) are easier to digest and assimilate [6,7,8]. In reality, LIP, PRT, and CHO play roles in the structural components and energy storage of marine organisms [9,10], accounting for up to 90% of the weight in algae [11].
Generally, particulate organic matter (POM) is composed of living and dead organisms and refractory organic matter. For POM that consists of mainly phytoplankton-derived materials, the biochemical composition of POM reflects the physiological state of the phytoplankton in response to environmental conditions and phytoplankton energy value [4,12,13,14]. For example, PRT synthesis is generally promoted in productive areas or the exponential growth phase of phytoplankton [13,15,16], while the biosynthesis of non-nitrogenous storage compounds, such as CHO and LIP, is enhanced under high light intensity [17], low temperatures [18] and low nitrogen conditions [19,20]. LIP contain more calories than PRT and CHO [21]. In addition, the labile fractions of POM are characterized by the activities of enzymes, and their degradation provides insight into how POM is bioavailable to consumer organisms [22,23,24]. Therefore, changes in the biochemical composition and hydrolysable fractions of phytoplankton-derived POM can be useful for determining the physiological and nutritional conditions of phytoplankton.
Our study area is the Chukchi Sea (including the Chukchi Borderland), which contains pathways of water from the Pacific Ocean that flow poleward through the narrow Bering Strait to the Arctic Ocean [25] and transfer freshwater, heat, and nutrients from the northern Bering Sea (Yang and Bai [26] and reference therein). The southern Chukchi Sea is one of the most productive areas globally (up to 4.7 g C m−2 day−1; Korsak [27]), and has an especially high benthic productivity and biodiversity [28,29] because of the nutrients supplied by the inflow of water from the Pacific Ocean. A few studies have estimated the quantity and biochemical composition of POM in the Arctic Ocean [30,31,32,33]. However, bioavailable POM food resources created through enzymatic hydrolysis have not been investigated. Hence, the purpose of this study was (i) to investigate the spatial distribution and influence of physical (e.g., salinity, temperature, and meltwater) and chemical (major inorganic nutrients) properties on the biochemical composition of POM and (ii) to estimate potentially bioavailable food for higher trophic levels in the Arctic marine ecosystem using the labile fraction of POM obtained by enzymatic hydrolysis.

2. Materials and Methods

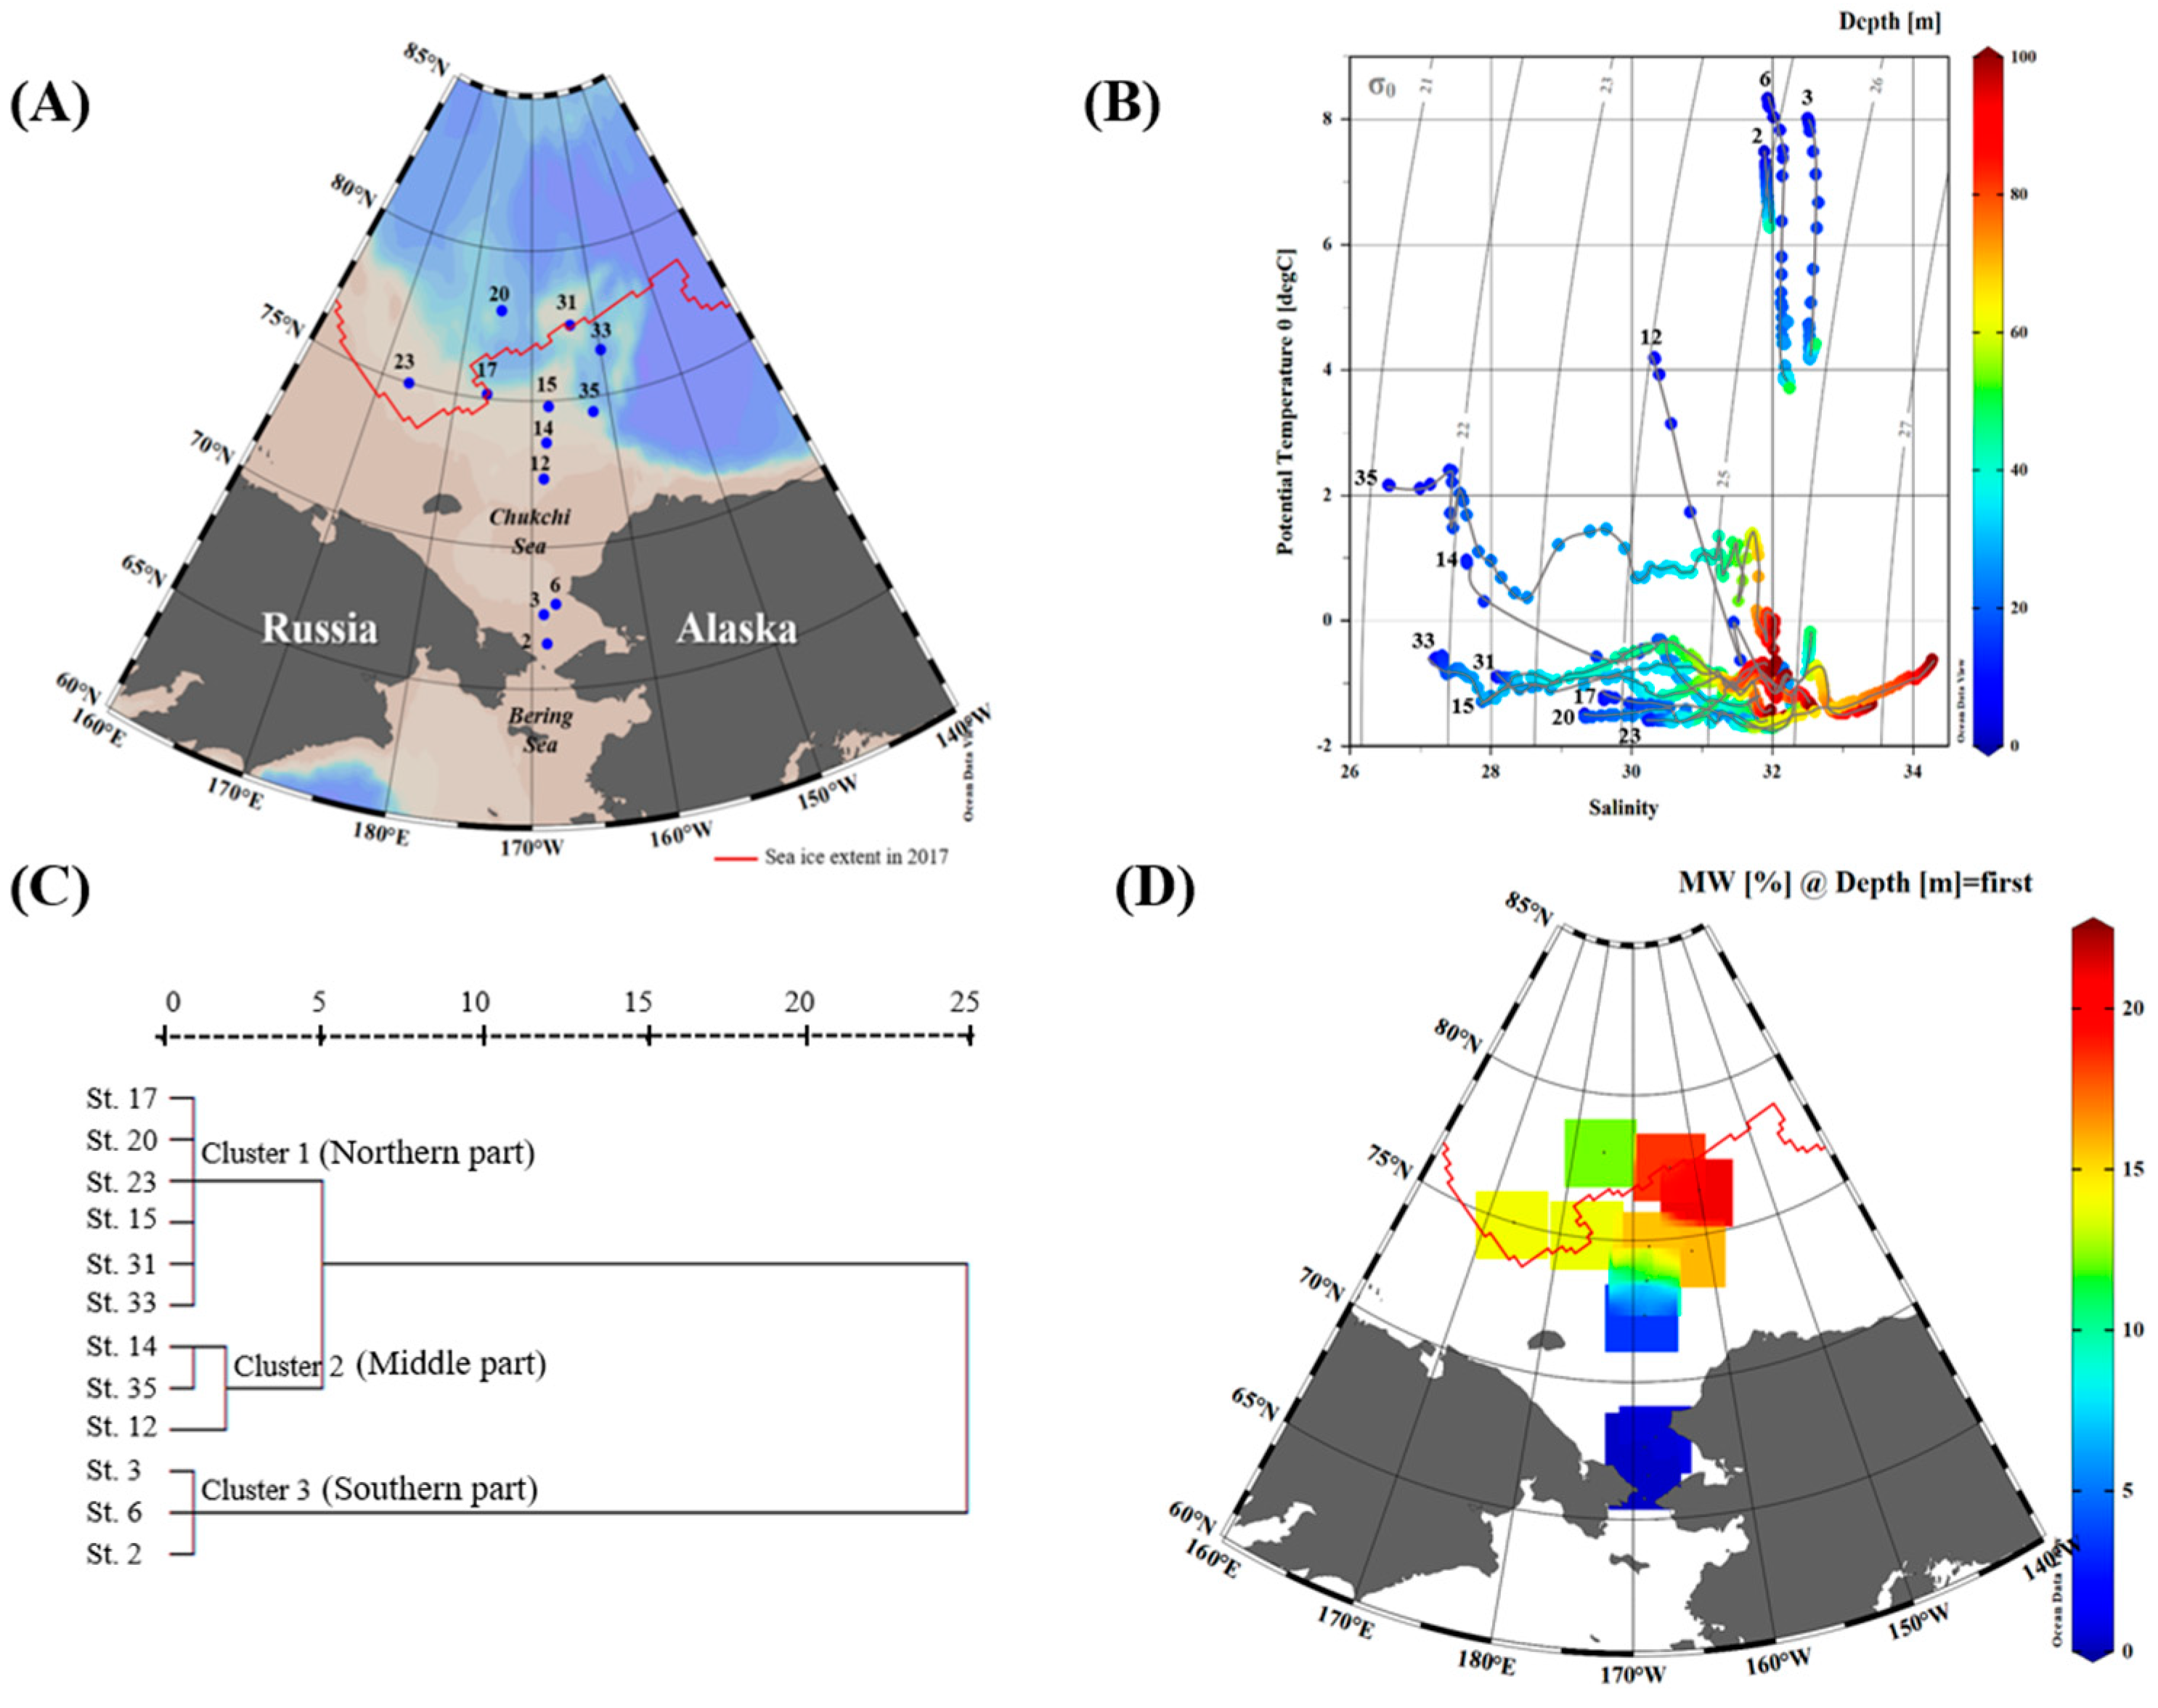
2.1. Field Sampling and Measurements of the Environmental Variables

This study was carried out at 12 stations in the Chukchi Sea onboard the R/V Araon icebreaker from 7 to 24 August 2017 (Figure 1A). The potential temperature, salinity, and photosynthetically active radiation (PAR) from the surface to a 100 m depth were measured by a rosette-mounted Sea-Bird conductivity-temperature-depth (CTD) system—1% PAR at the surface light level was defined as the euphotic layer [34] by a Secchi disc using the vertical attenuation coefficient (Kd = 1.7/secchi depth). The meltwater percentage (MW; %) was calculated from the salinity at each sampled depth ( S m e a s ) and the greatest depth (either the bottom depth or 100 m in this study; S d e e p ), assuming an average sea ice salinity of 6 [35,36] since the mean salinity at a melt pond in the western Arctic Ocean was 5.9 [37]:
MW ( % ) = { 1 [ ( S m e a s 6 ) ( S d e e p 6 ) ] } × 100
The water samples used to determine the dissolved inorganic nutrients, chlorophyll a (chl-a), photosynthetic pigments, and POM (from carbon isotope samples at the surface), were obtained from the surface to the euphotic layer (2–5 depths) using a CTD/rosette sampler with 10-L Niskin bottles (Ocean Test Equipment Inc., Fort Lauderdale, FL, USA). The dissolved inorganic nutrients (nitrate + nitrite, ammonium, silicate, and phosphates) were analyzed onboard using a 4-channel QuAAtro Auto Analyzer (Seal Analytical, Norderstedt, Germany). The concentrations of the nutrients were measured using standard colorimetric methods, and the reference material for nutrients in seawater (Lot. No. “BV”, Kanso Technos Co., Ltd., Osaka, Japan) were used in addition to standards for every batch of runs to ensure accurate and comparable measurements during the cruise.
After prefiltration through a 200 μm mesh net to remove large zooplankton, the water samples used to determine total chlorophyll a (chl-a) and accessory pigments were filtered onto GF/F filters (precombusted at 450 °C for 4 h; Whatman, Port Washington, NY, USA) immediately after collection. The filters were stored at −80 °C until the analyses were performed. Size-fractionated chl-a was determined from samples passed sequentially through 20 µm (>20 μm; microphytoplankton), 2 µm (2–20 µm; nanophytoplankton) and Whatman GF/F filters (0.7–2 µm; picophytoplankton). All the chl-a concentrations were calculated by the methods described by Parsons et al. [39] using a Trilogy fluorometer (Turner Designs, San Jose, CA, USA). The phytoplankton community composition was determined with photosynthetic pigments measured by high performance liquid chromatography (HPLC; Agilent 1260 Infinity LC, Agilent Technologies Inc, Santa Clara, CA, USA)-CHEMTAX analyses. For the stable carbon isotope composition of POM, seawater was filtered onto precombusted (450 °C for 4 h) 25 mm GF/F (Whatman, 0.7 µm pore) filters. The filters were immediately stored at −80 °C until further analysis. Stable carbon isotope composition was determined using isotope ratio mass spectrometry (IRMS; visION, Elementar UK, Manchester, UK) in the stable isotope laboratory at the University of Hanyang, Ansan, Korea, after HCl fuming overnight to remove the carbonate. The carbon isotope fractionation, δ13C (‰), was calculated using the following equation:
δ 13 C   ( ) = [ ( 13 C 12 C ) s a m p l e ( 13 C 12 C ) s t a n d a r d 1 ]   × 1000
where the standard for δ13C is IAEA-CH-3 [40].

2.2. Biochemical Composition and Enzyme-Hydrolysable Experiments Related to the POM

The water samples (n = 51) used to assess the biochemical composition of the POM were obtained from two to six different depths at each site within the euphotic layer, and for each macromolecule (PRT, CHO, and LIP), 0.5–1 L of the seawater sample went through a precombusted 25 mm GF/F filter (at 450 °C for 4 h). The filter was immediately stored at −80 °C until analysis. Analysis of the PRT and CHO was performed using the methods described by Lowry et al. [41] and Dubois et al. [42], respectively. For the total PRT extraction, we added deionized water to a filter and, alkaline copper solution and Folin-Ciocalteu phenol regent to the sample tube. The CHO content was measured by a phenol–sulfuric acid reaction. The LIP were extracted from the filter with chloroform and methanol (1:2; v:v) [43], followed by sulfuric acid at 200 °C [44]. The absorbance of the samples, blanks and standards was determined at wavelengths of 750, 490, and 360 nm for the PRT, CHO, and LIP, respectively, using a spectrophotometer (Hitachi, Tokyo, Japan). The concentrations of the macromolecules were determined by comparison to the standard curve created with blank filters (procedural control filters, Whatman GF/F filter). The standard solutions for the PRT, CHO, and LIP were used a protein standard (2 mg mL−1, Albumin from bovine serum, CAS No. 9048-46-8, Sigma-Aldrich, St. Louis, MO, USA), glucose standard (1 mg mL−1, CAS No. 50-99-7, Sigma-Aldrich), and tripalmitin (50 mg in 100 mL chloroform, CAS No. 555-44-2, Sigma-Aldrich), respectively.
For enzyme-hydrolysable experiments, sampling was conducted by randomly selected samples of 35. Three enzymes were used in the enzyme-hydrolysable experiments: proteinase K derived from Tritirachium album (CAS No. 39450-01-6), β-glucosidase from almonds (CAS No. 9001-22-3), and lipase from Rhizopus oryzae (CAS No. 9001-62-1) (Sigma-Aldrich). Since these enzymes have hydrolytic activities similar to those of natural marine organisms, including autotrophs and heterotrophs [45], proteinase K, β-glucosidase, and lipase were chosen for the hydrolysis of PRT, CHO, and LIP, respectively [22,24,46,47,48,49]. The sample filters and blank filters were placed in enzyme solutions (100 mg L−1 in 0.1 M sodium phosphate buffer) to react for 2 h (proteinase K), 2 h (β-glucosidase), and 30 min (lipase). After hydrolysis, each filter was rinsed with buffer and deionized water and the concentrations of PRT, CHO, and LIP were determined as previously described. The concentration of the hydrolyzed biochemical fractions was calculated by the difference between before and after treatment of enzyme for each fraction.

2.3. Statistical Analysis

The statistical analyses (t-test, Pearson’s correlation, and principal component analysis (PCA)) were performed with SPSS statistical software (version 12.0; SPSS Inc., Chicago, IL, USA) and R software (version 3.4). Cluster analysis was performed by using a hierarchical clustering algorithm with Ward’s method to identify the groups of sampling stations. A t-test evaluates whether the means of two independent groups are significantly different from each other. The relationships between the depth, nutrients, chl-a, and biochemical components were tested using Pearson’s correlation. PCA was used to evaluate the differences in the biochemical components and identify the significance of the environmental factors (e.g., salinity, temperature, density, phytoplankton size, MW (%), and major inorganic nutrient concentrations) among the groups and at each station. The average value of each variable within the euphotic layer was used for PCA (Table S1). We adopted the principle that an eigenvalue >1.0 can be used to determine the number of principal components.

3. Results

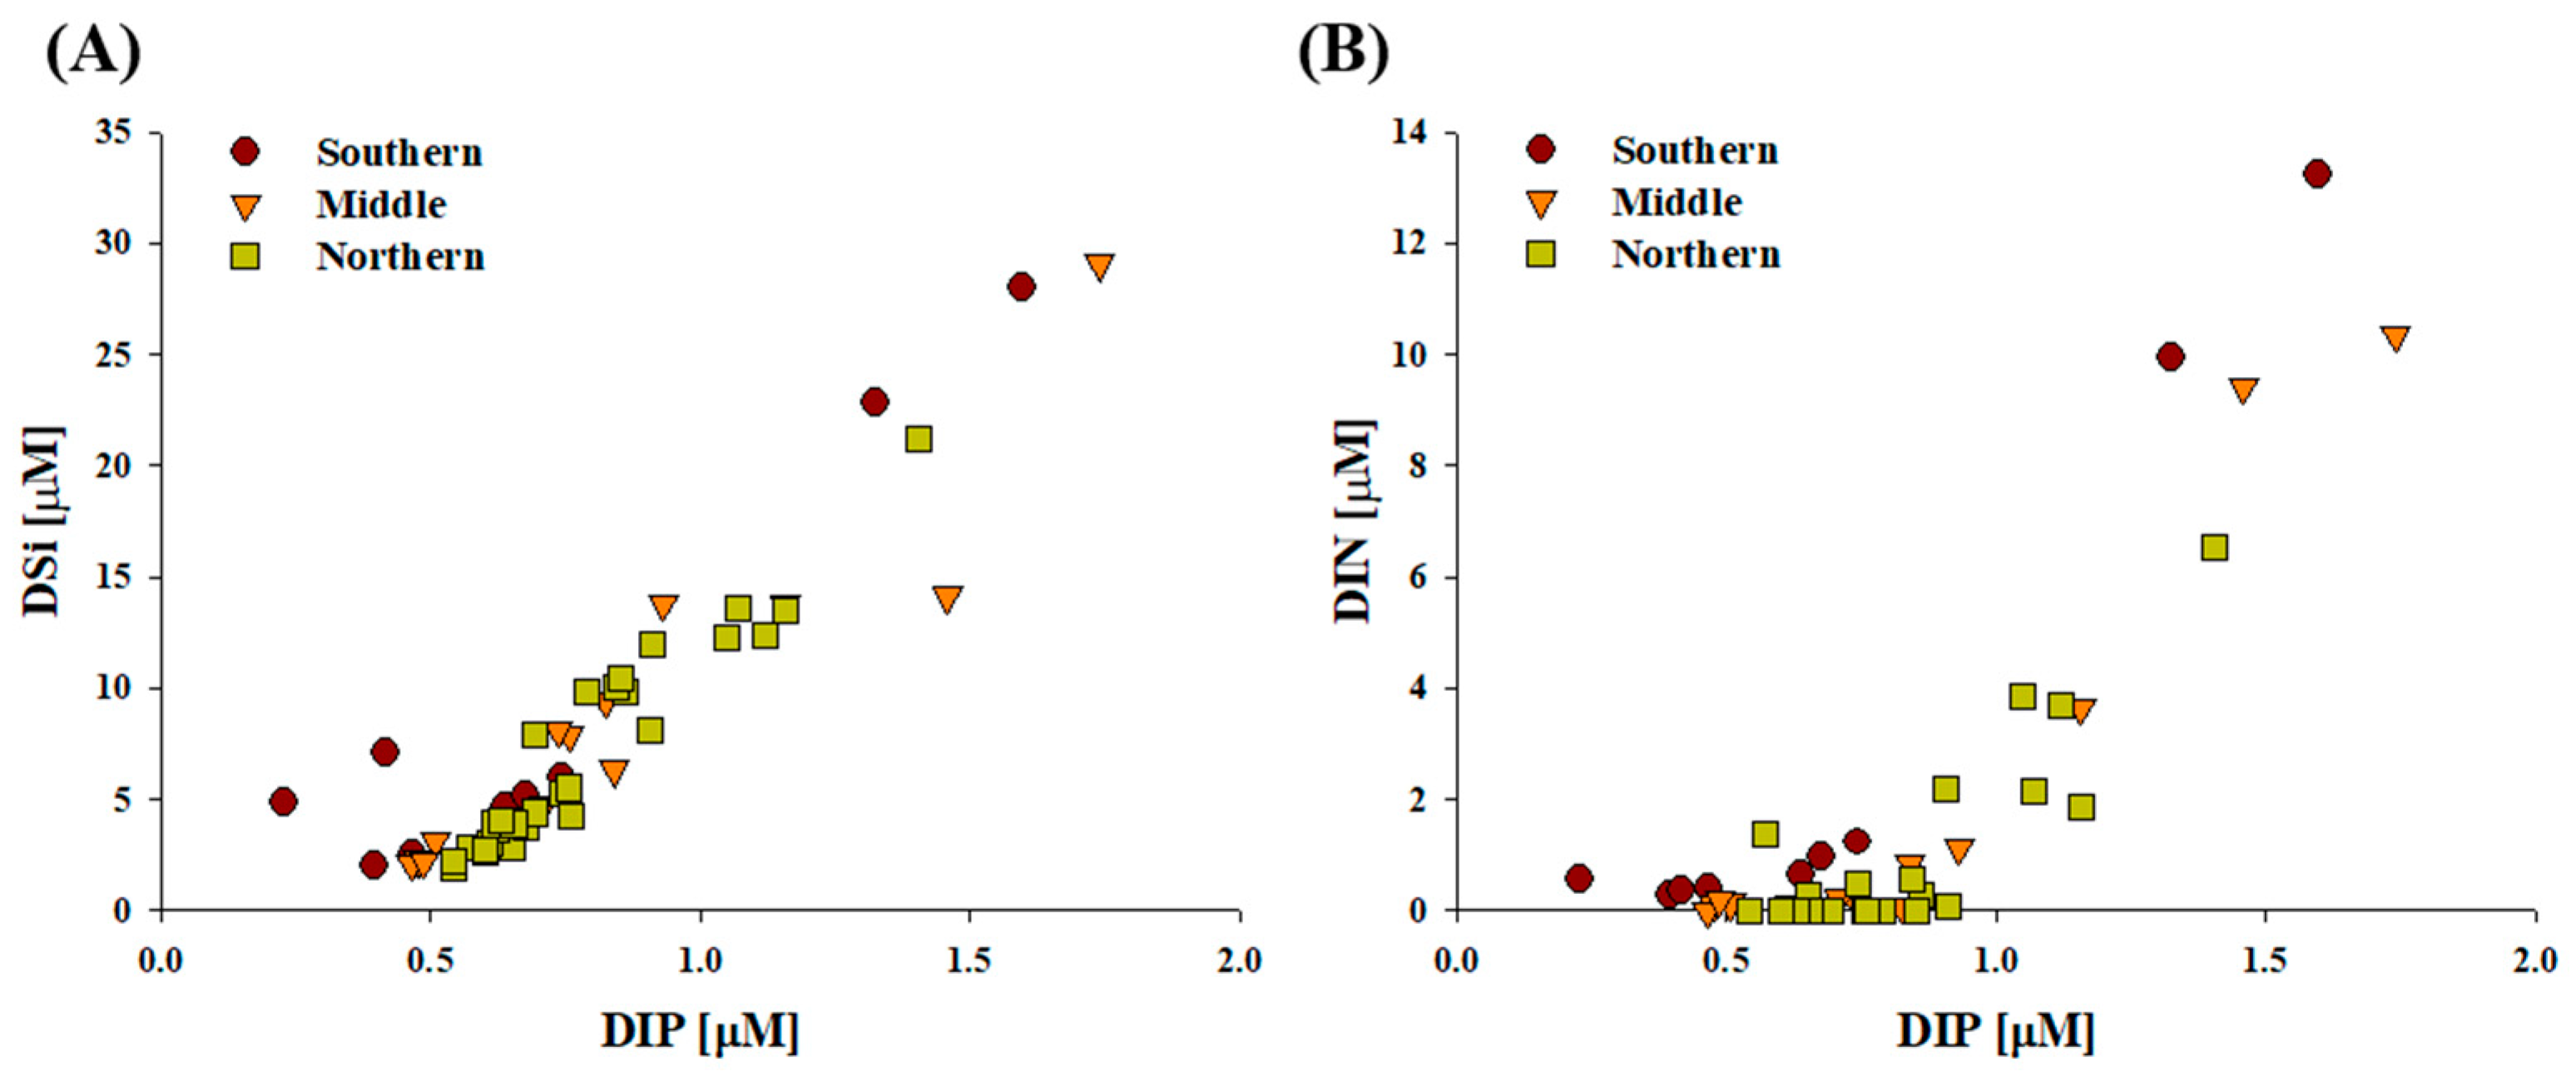
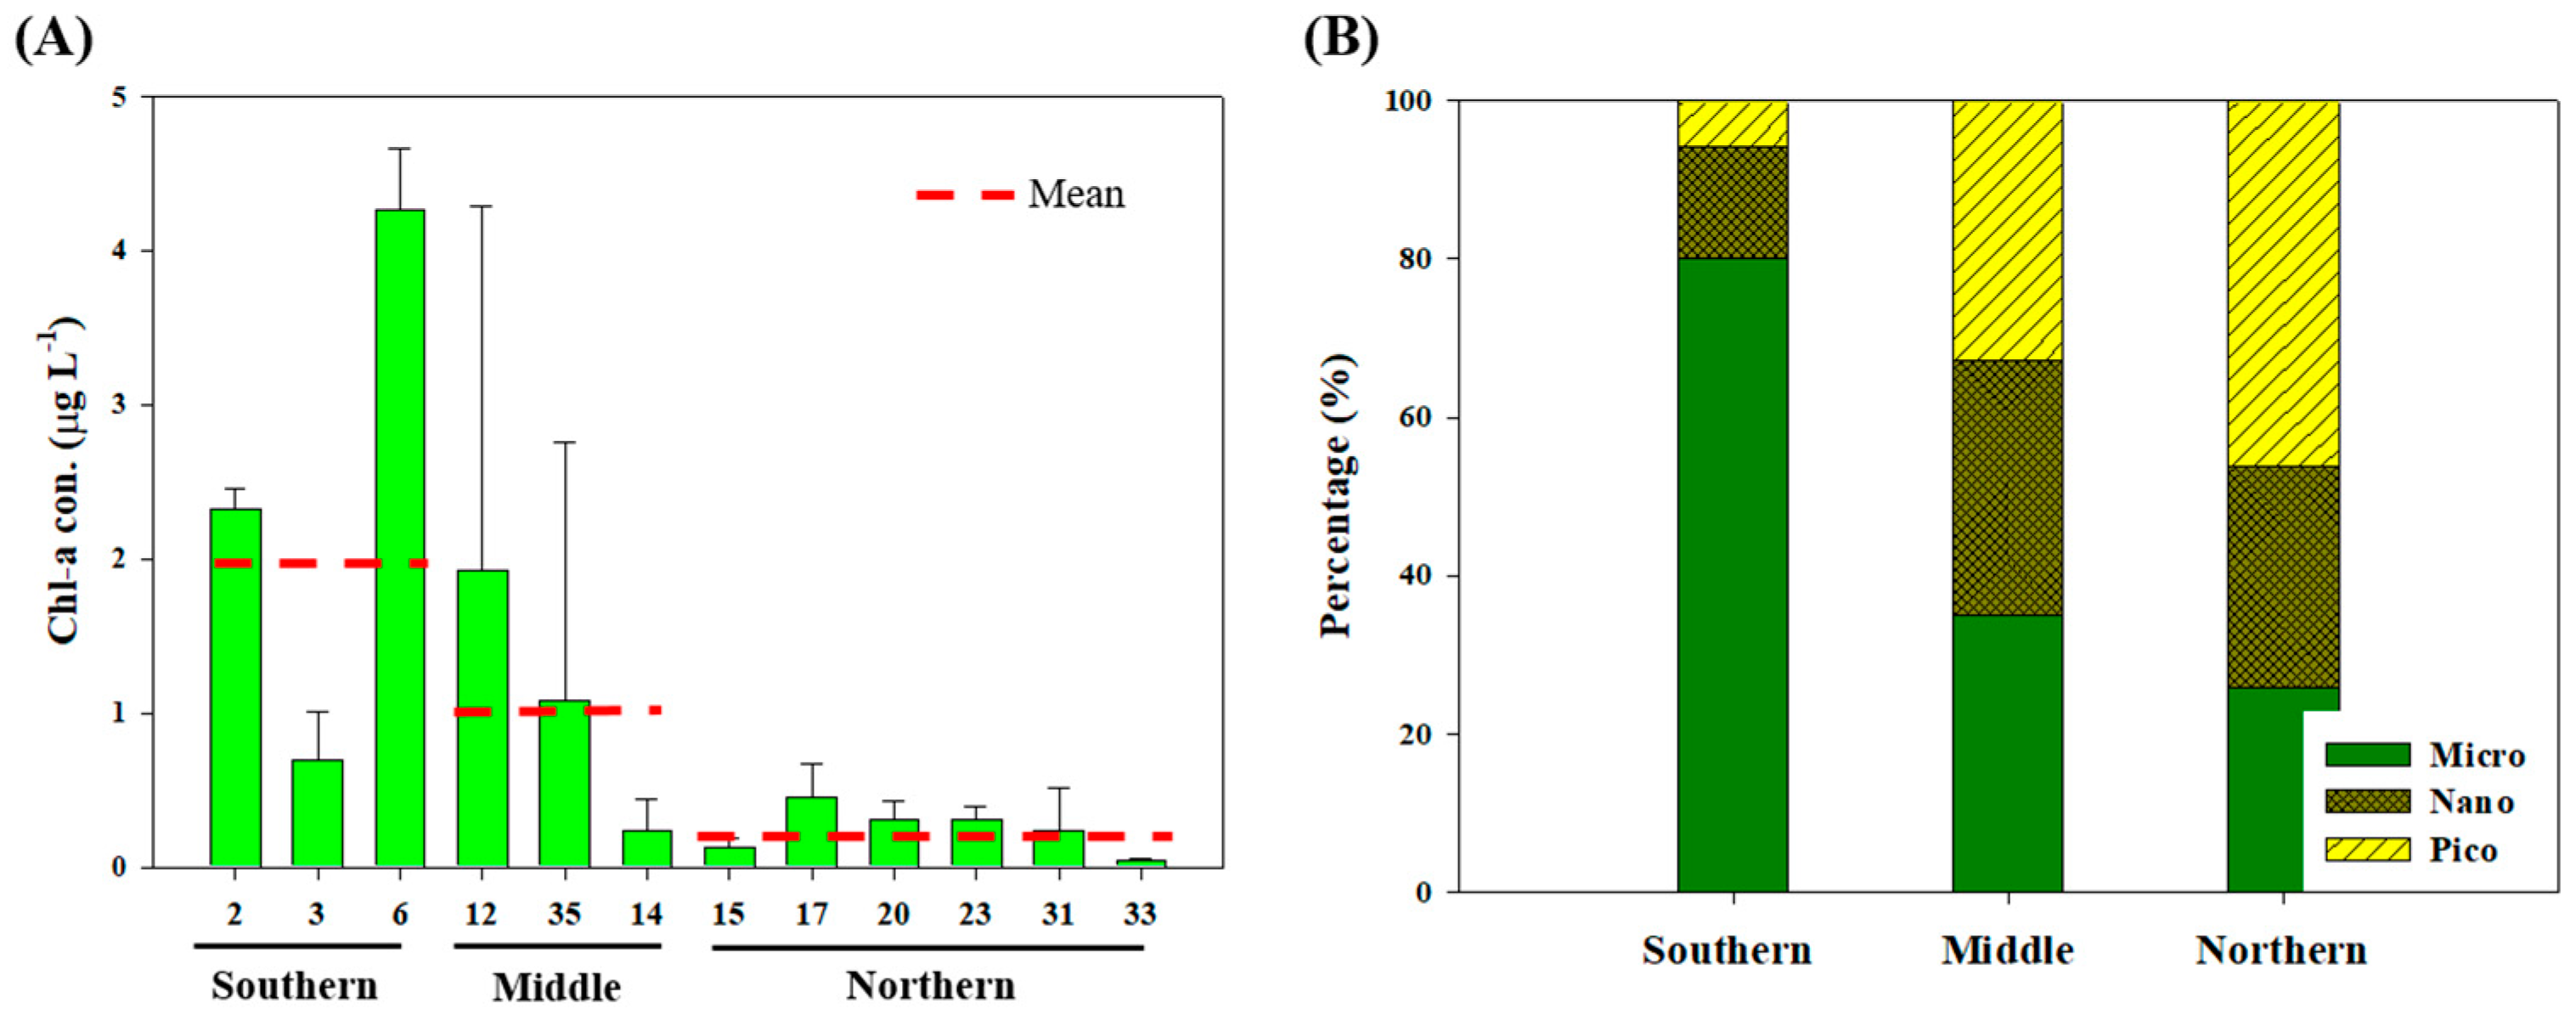
3.1. Physicochemical and Biological Characteristics During the Sampling Period

The potential temperature and salinity diagram reveal different hydrodynamic conditions during the sampling periods (Figure 1B). Based on Gong and Pickart’s work [50], the summertime water mass properties of Stations 2, 3, and 6 were mainly composed of Alaskan coastal water (potential temperature (T) ≥ 3 °C and salinity (S) ≥ 0). Chukchi summer water (−1 °C < T < 3 °C and 30 < S < 33.6), and Pacific winter water (T < −1 °C and S > 31.5) were found in the other stations (Figure 1B). Since sea-surface temperature and salinity are strongly affected by sea ice and related meltwaters, brine rejection, continental runoff, and the heat flux in the Arctic Ocean [51], we assumed that the temperature and salinity at the surface were representative of the ambient water conditions. As a result, the cluster analysis of the surface potential temperature and salinity data allowed the identification of the three types of regions in the Chukchi Sea: cluster 1 (hereafter, the southern part; Stations 2, 3, and 6) was located at a latitude of approximately 66–70 °N; cluster 2 (hereafter, the northern part; Stations 15, 17, 20, 23, 31, and 33) was located at a latitude of 74.7–78 °N and included the Chukchi Borderland; cluster 3 (hereafter, the middle part; Stations 12, 14, and 35) was located between two areas of the Chukchi Sea (the southern and northern parts) (Figure 1C and Table 1).
The potential temperature at the surface was approximately 8 °C in the southern part, while in the northern part, it fell further, to below 0 °C, ranging from −1.6 to −0.6 °C. The salinity at the surface in the southern Chukchi Sea (shallow continental shelf) was above 31.9, with the maximum value (32.5) recorded at Station 3, while the salinity in the northern part was below 30.3, with the minimum value (27.2) recorded at Station 33 (Figure 1B). Overall, the northern part of the Chukchi Sea is characterized by a relatively cold temperature and low salinity, while we found higher temperatures and salinities in the surface water in the southern part (Figure 1B). Hydrodynamic characteristics are subject to the considerable influence of sea ice. The meltwater percentage (MW; %) in the euphotic layer of the study area ranged from 0 to 21.1%, with large spatial variations. Such a situation is specific to the northern part, with an average MW (%) ranging from 4.6 to 18.4 and a mean of 12.8% (SD = ± 3.6). Based on the sea ice extent, the MW (%) accounted for <15% of the surface water at the inner stations (Stations 17, 20, and 23) while at the outer stations (Stations 15, 31, 33, and 35), the MW accounted for more than 15% of the surface water (t-test, p < 0.05; Figure 1D). This result suggests that the salinity was greatly influenced by the regional melting of sea ice.
The concentrations of the dissolved inorganic nitrate + nitrite + ammonium (DIN), silicate (DSi) and phosphate (DIP) are shown in Figure 2. In the sampling period, the DSi and DIP concentrations from the surface to the euphotic layer ranged from 1.9 to 29.0 µM and 0.2 to 1.7 µM with means of 7.8 (SD = ±6.4 µM) and 0.8 (SD = ±0.3 µM), respectively (Figure 2A). The concentration of DIN, which was generally depleted (<1 µM) at the surface layer throughout our study area, was in the range of 0–13.2 µM, with an average of 1.5 µM (SD = ±3.0 µM) (Figure 2B). All the mean nutrient concentrations decreased from the southern to the northern parts of this region.
The average total chl-a concentration of phytoplankton from the surface to the euphotic depth ranged from 0.04 to 5.3 µg L−1 with a mean of 0.8 µg L−1 (SD = ±1.3 µg L−1) at all stations, decreasing northward (Figure 3A). The phytoplankton community was dominated by picophytoplankton, which accounted for 46.2% (SD = ±15.0%) of the total chl-a concentration, followed by nanophytoplankton (mean ± SD = 27.8 ± 10.0%) and microphytoplankton (mean ± SD = 26.0 ± 17.3%) in the northern part of the Chukchi Sea (Figure 3B). In the southern and middle parts, microphytoplankton were dominant (mean ± SD = 80.1 ± 5.9% for the southern part and mean ± SD = 35.0 ± 34.5% for the middle part) within the euphotic layer (Figure 3B).

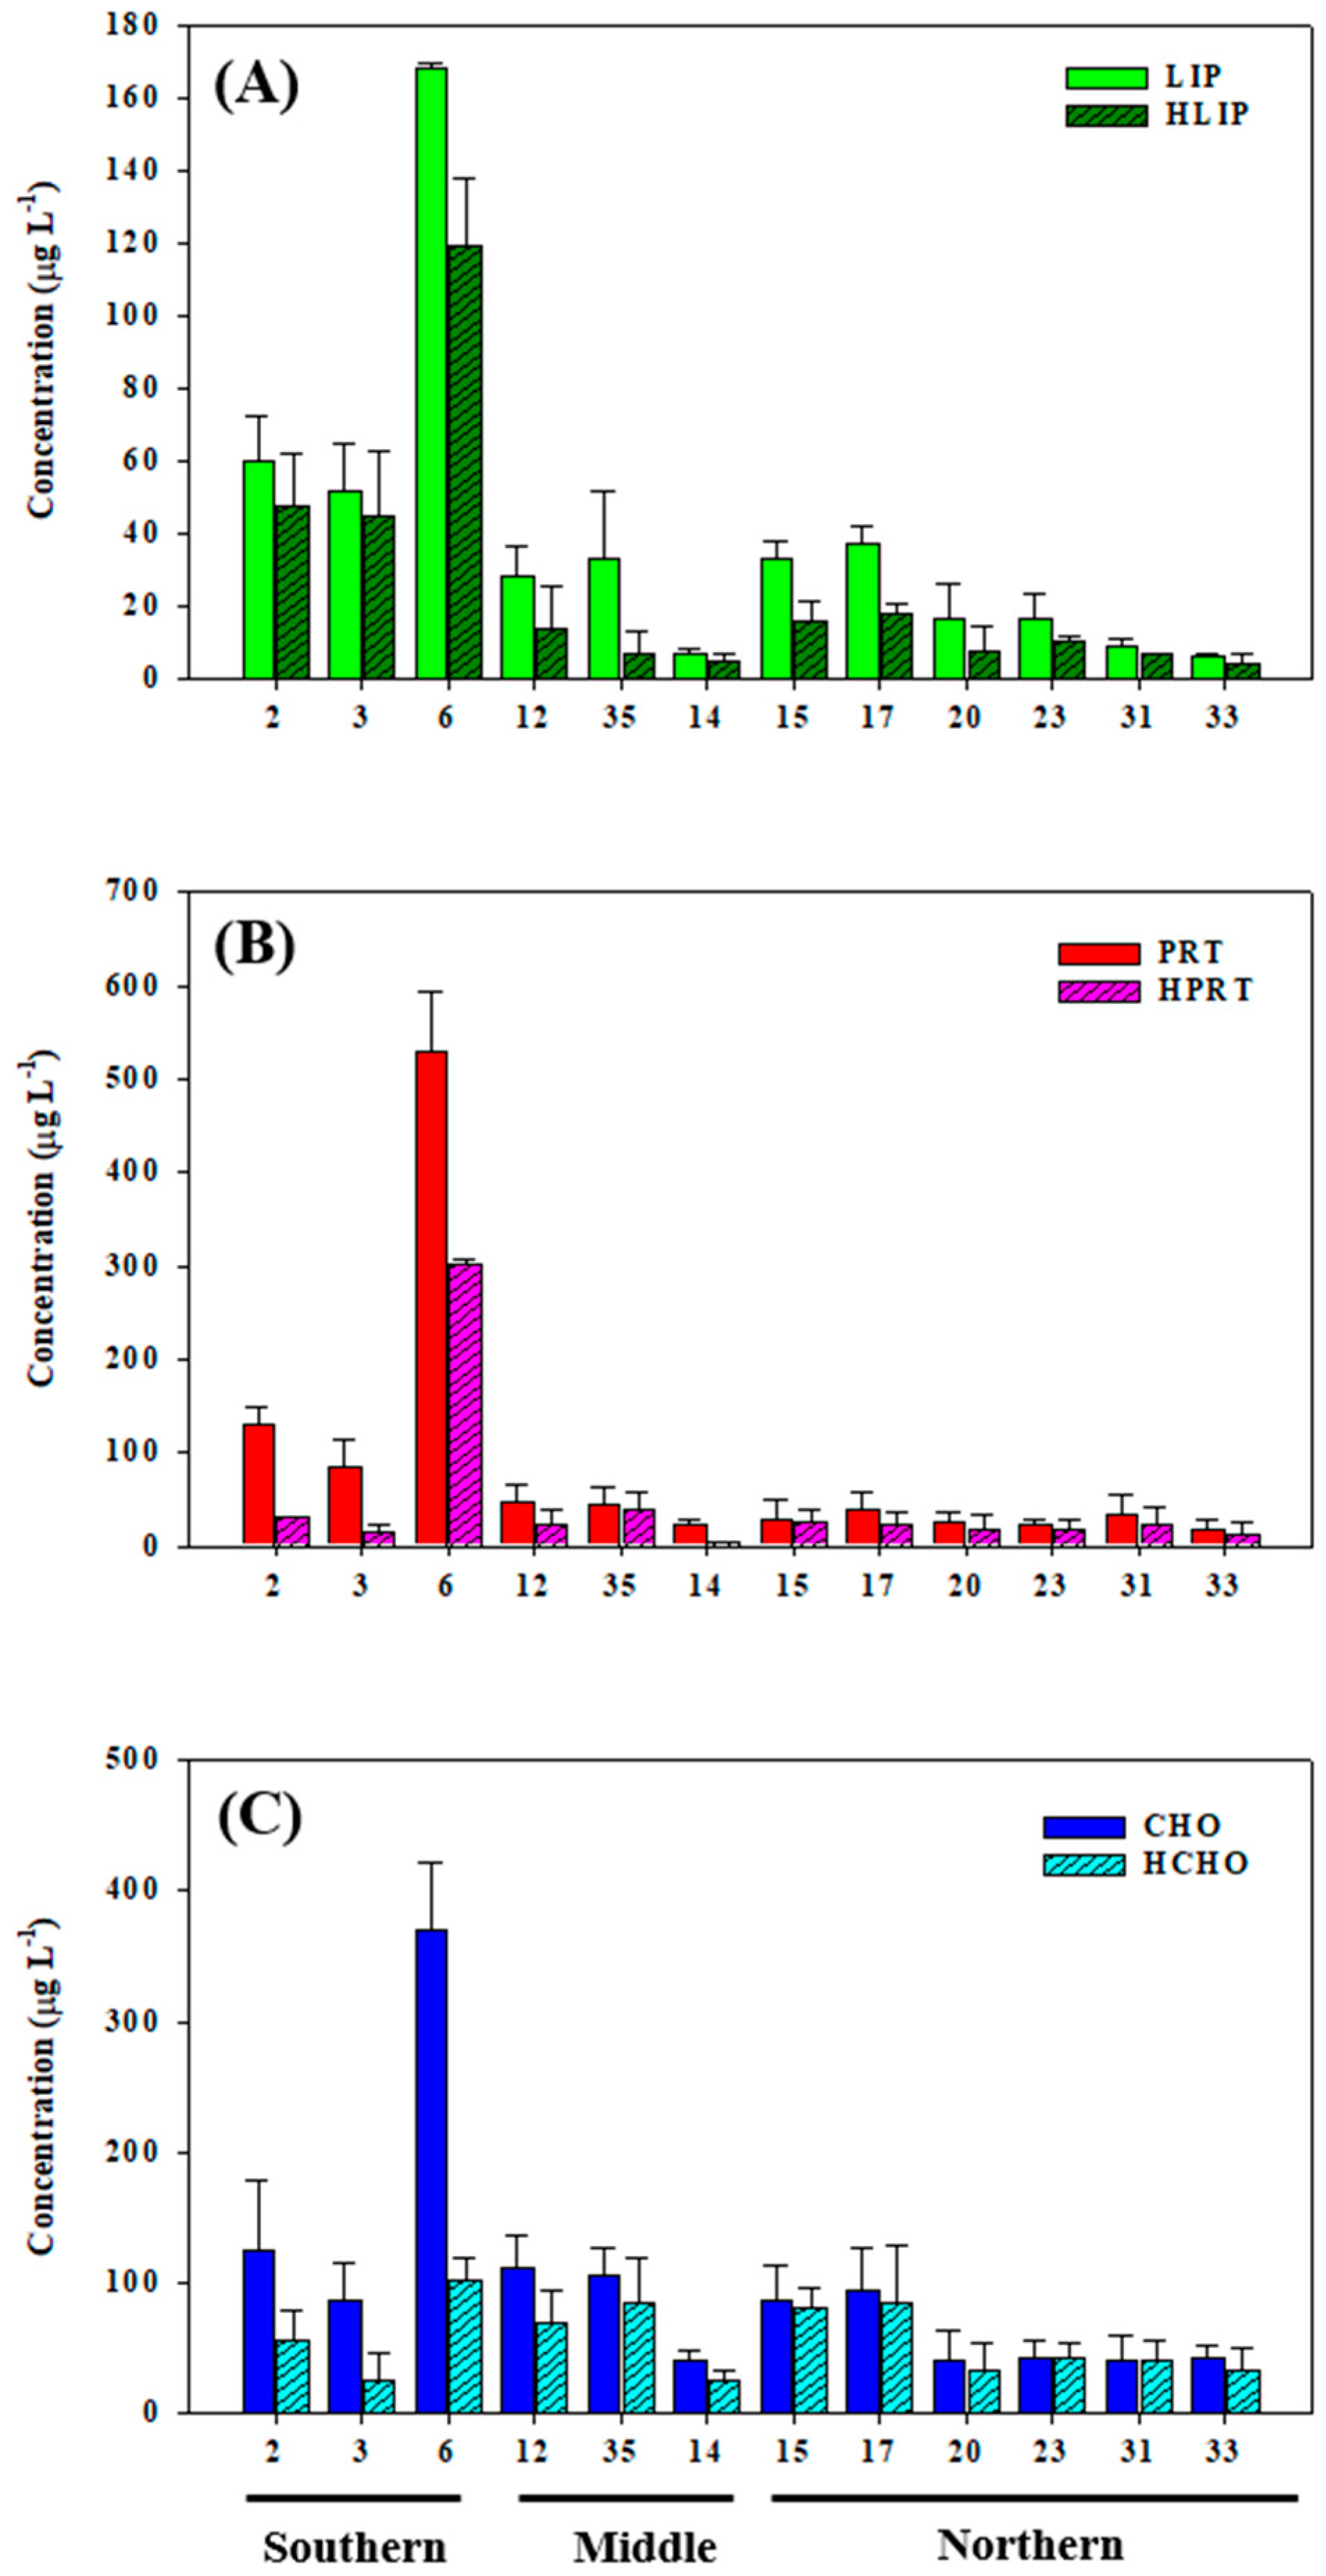
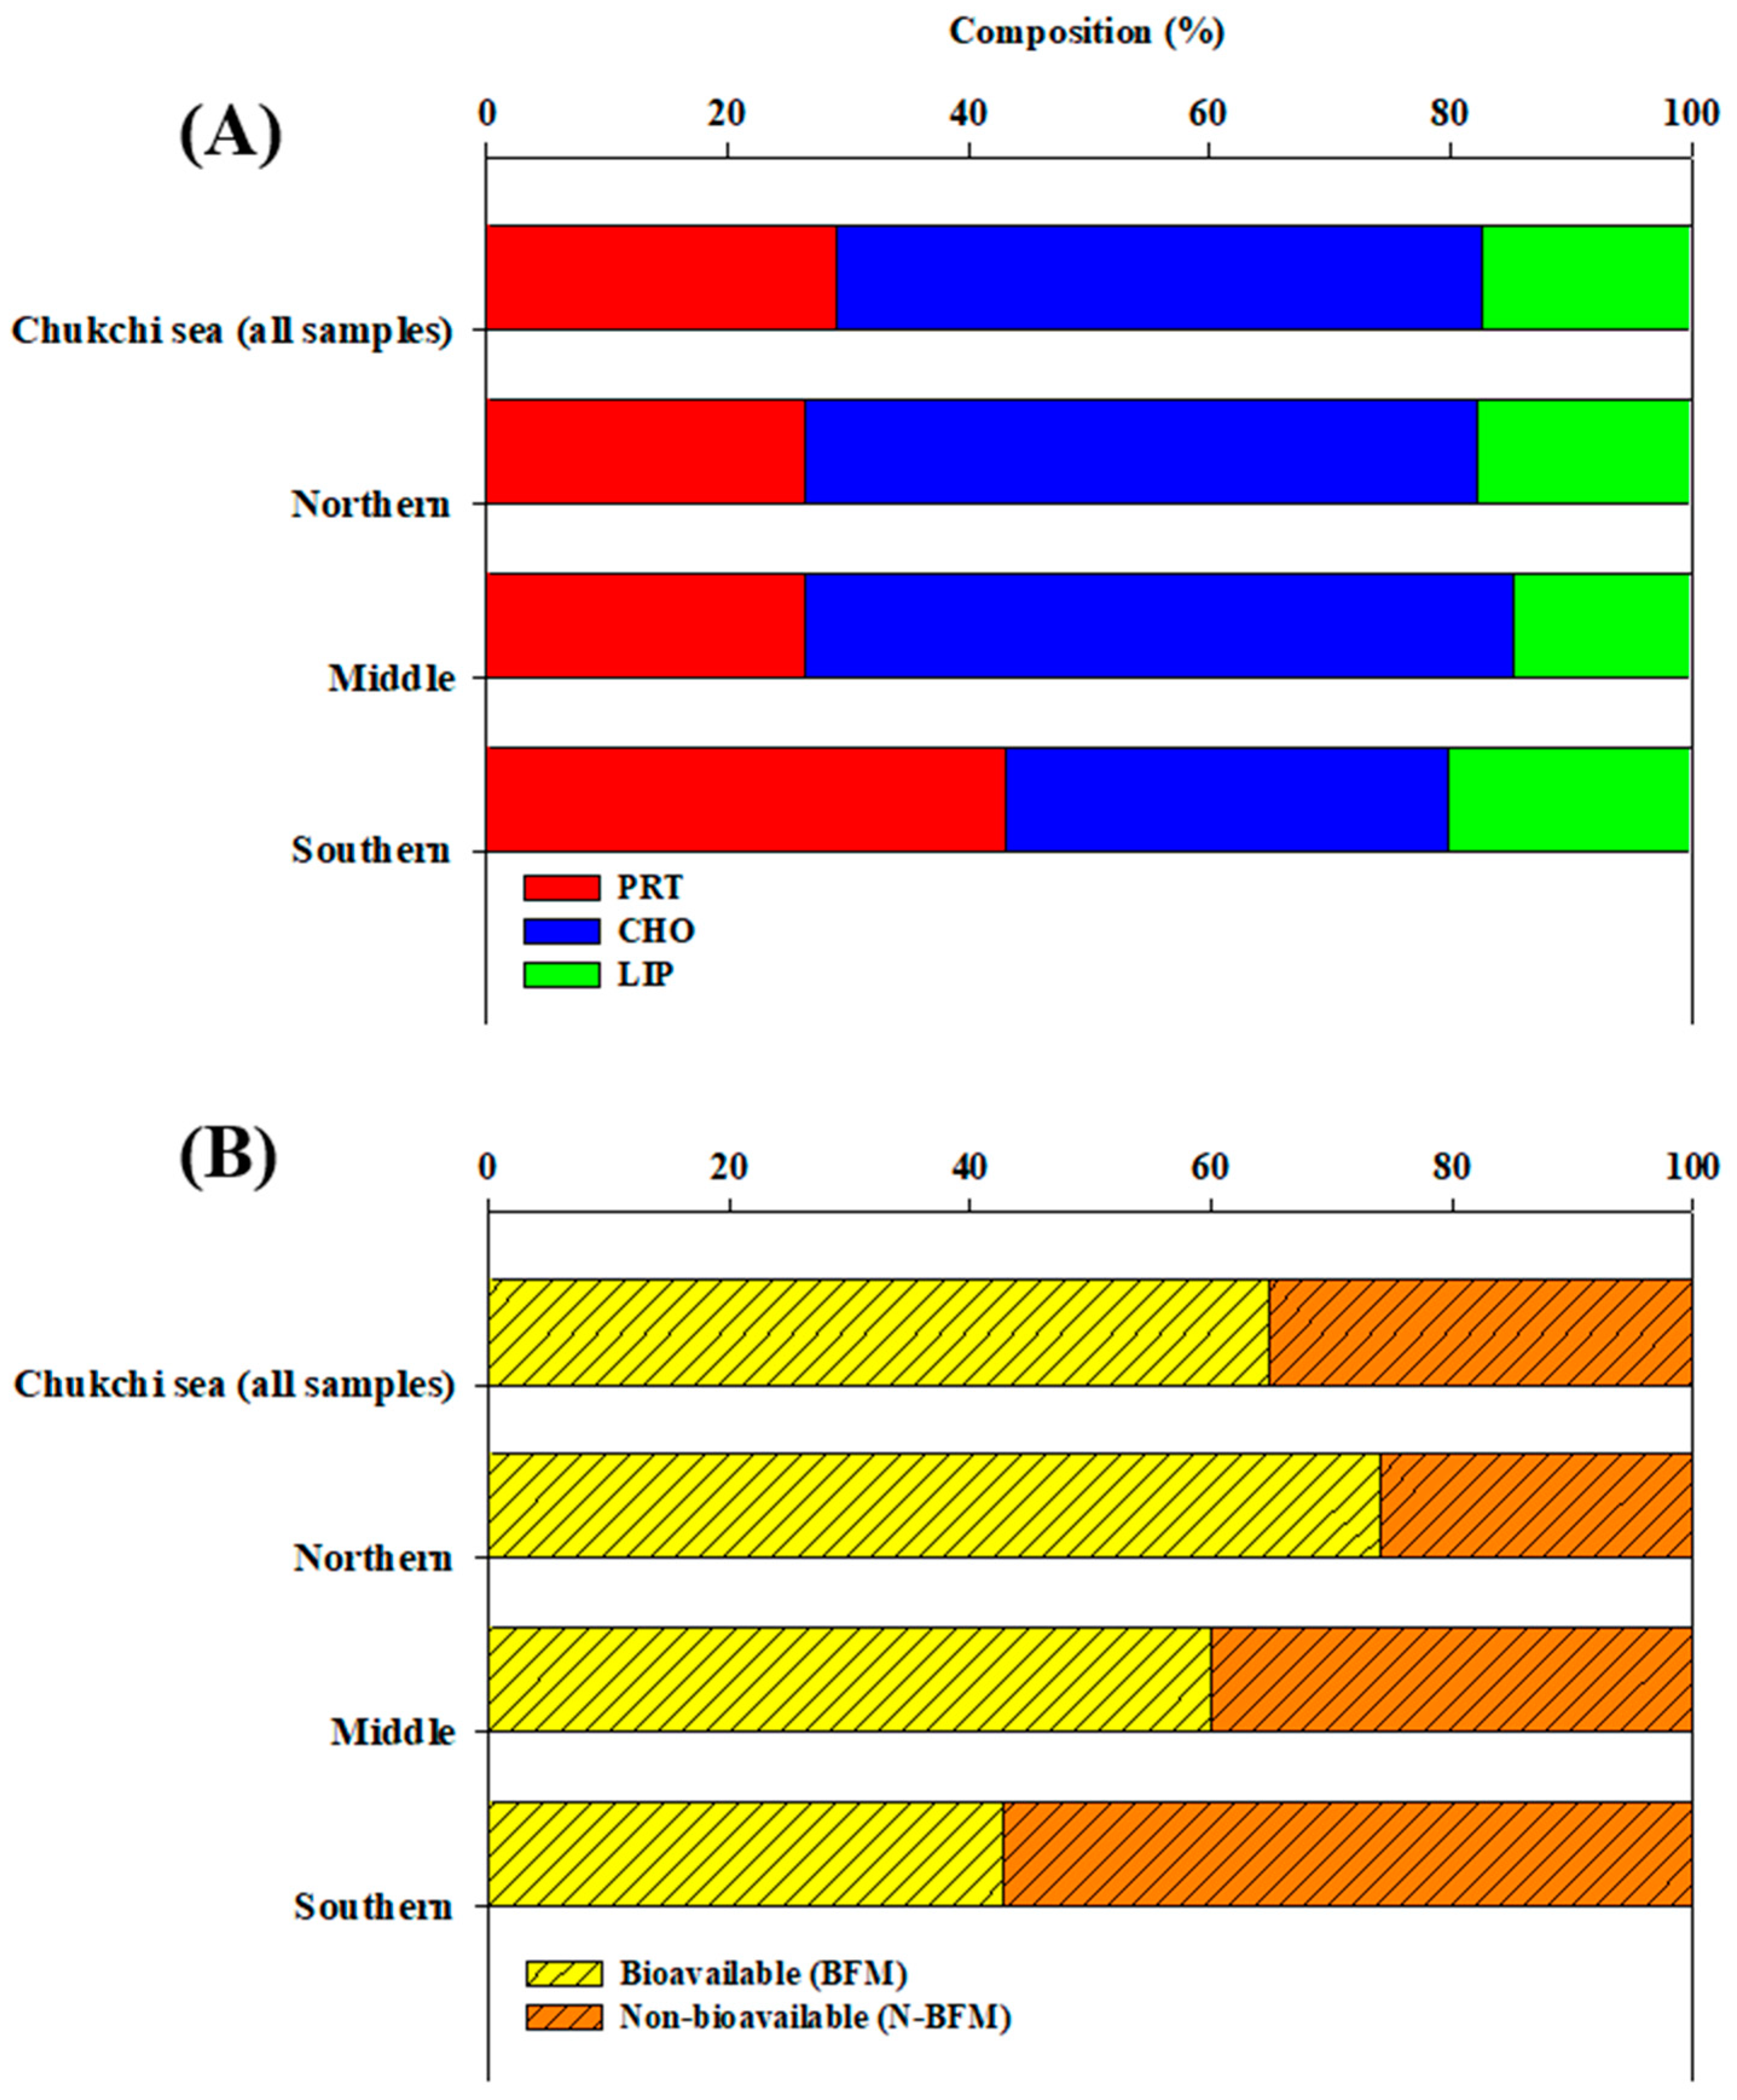
3.2. Biochemical Composition (PRT, LIP, and CHO) of POM

The LIP and PRT concentrations in the POM ranged from 5.4 to 169.1 µg L−1 (mean ± SD = 32.4 ± 32.8 µg L−1) and 9.7 to 573.8 µg L−1 (mean ± SD = 61.6 ± 101.0 µg L−1) within the euphotic layer, respectively (Figure 4). The CHO concentration ranged from 29.9 to 406.4 µg L−1 with a mean of 86.6 µg L−1 (SD = ± 67.9 µg L−1) (Figure 4A). The vertical distribution of the LIP, PRT, and CHO concentrations did not show a specific trend (p > 0.05) but was characterized by significant spatial changes (Figure 4A). In the southern part of the Chukchi Sea, the average PRT concentration (198.8 µg L−1) was approximately 5.1 and 6.9 times higher than those of the stations in the middle (39.2 µg L−1) and northern parts (28.7 µg L−1) (t-test, p < 0.05), respectively. Similarly, at the southern stations, the average LIP (80.3 µg L−1) concentration was approximately 3.4 and 3.8 times higher than the average LIP concentrations in the middle and northern parts, respectively, while the average CHO (162.7 µg L−1) concentration was approximately 1.8 and 2.7 times higher than the average CHO concentrations in the middle and northern parts (Figure 4A).
The food material (FM) is represented by the sum of PRT, CHO, and LIP concentrations in POM ([13] and reference therein) and concentration of each biochemical constituent (PRT, CHO, and LIP) covaried with the FM, as expected. The FM ranged from 53.7 to 1074.2 μg L−1, with an average of 180.5 μg L−1 (SD = ± 195.3 μg L−1), and the FM decreased northward in this study.

3.3. Hydrolysable Compounds of POM

The concentrations of hydrolysable compounds (hydrolysable PRT, HPRT; hydrolysable LIP, HLIP; hydrolysable PRT, HPRT) in the POM were different among the groups (Figure 4A). In the southern part, the concentrations of HPRT ranged from 10.6 to 306.0 µg L−1 (mean ± SD = 93.4 ± 129.4 µg L−1), and the concentrations of HLIP ranged from 33.4 to 132.2 µg L−1 (mean ± SD = 64.5 ± 36.7 µg L−1) (Figure 4A). The HCHO ranged from 8.3 to 113.8 µg L−1, with a mean of 56.5 ± 36.3 µg L−1 (Figure 4A). HLIP represented 79.0% of the total LIP value, followed by HCHO, which represented 34.2% of the total CHO value and HPRT, which represented 31.0% of the total PRT value. In comparison, the HPRT concentrations in the middle and northern parts ranged from 4.3 to 59.3 µg L−1 (mean ± SD = 25.5 ± 20.4 µg L−1) and from 0.1 to 44.2 µg L−1 (mean ± SD = 20.6 ± 13.1 µg L−1), respectively (Figure 4A). In the middle and northern parts, the HLIP concentrations ranged from 3.2 to 22.1 µg L−1 (mean ± SD = 8.6 ± 7.0 µg L−1) and 0.9 to 23.9 µg L−1 (mean ± SD = 10.6 ± 6.2 µg L−1), respectively, and the HCHO concentrations ranged from 19.7 to 124.6 µg L−1 (mean ± SD = 63.7 ± 35.6 µg L−1) and 28.0 to 114.3 µg L−1 (mean ± SD = 52.8 ± 24.7 µg L−1), respectively. Consistent with this observation, HCHO accounted for 72.1% (middle part) and 89.3% (northern part) of the overall value, which was more than the contributions of HLIP or HPRT (Figure 4). The concentrations of the hydrolysable compounds except for HCHO were higher in the southern part than in the middle or northern parts. Overall, the average concentrations of HLIP, HPRT, and HCHO at all the stations were 22.5 µg L−1 (SD = ± 29.1 µg L−1), 38.2 µg L−1 (SD = ± 67.5 µg L−1), and 55.9 µg L−1 (SD = ± 29.2 µg L−1), respectively. The contributions of the hydrolysable components of POM to the total value were 56.1 ± 25.5% for LIP, 54.0 ± 31.3% for PRT, and 73.2 ± 26.6% for CHO.
In this study, the bioavailable fraction of POM (BFM, as the sum of HPRT, HLIP, and HCHO concentrations) can be considered the actual nutritional constituents and/or potentially available food for consumers that are able to be digested. In FM, the remaining values (excluding BFM) are expressed as a non-bioavailable form (N-BFM). In our study, similar to FM, the BFM concentration was much higher (mean ± SD = 214.4 ± 194.5 µg L−1) in the southern than in the middle (mean ± SD = 97.8 ± 52.6 µg L−1) and northern (mean ± SD = 84.1 ± 36.7 µg L−1) parts. Similarly, the average N-BFM (256.0 µg L−1) at the southern stations was approximately 4.3 and 8.4 times greater than that at the middle and northern stations, respectively. These results show that the positive effect of a large amount of FM is influenced by the quantity of BFM and that the majority of POM is not actually composed of bioavailable PRT, CHO, and LIP.

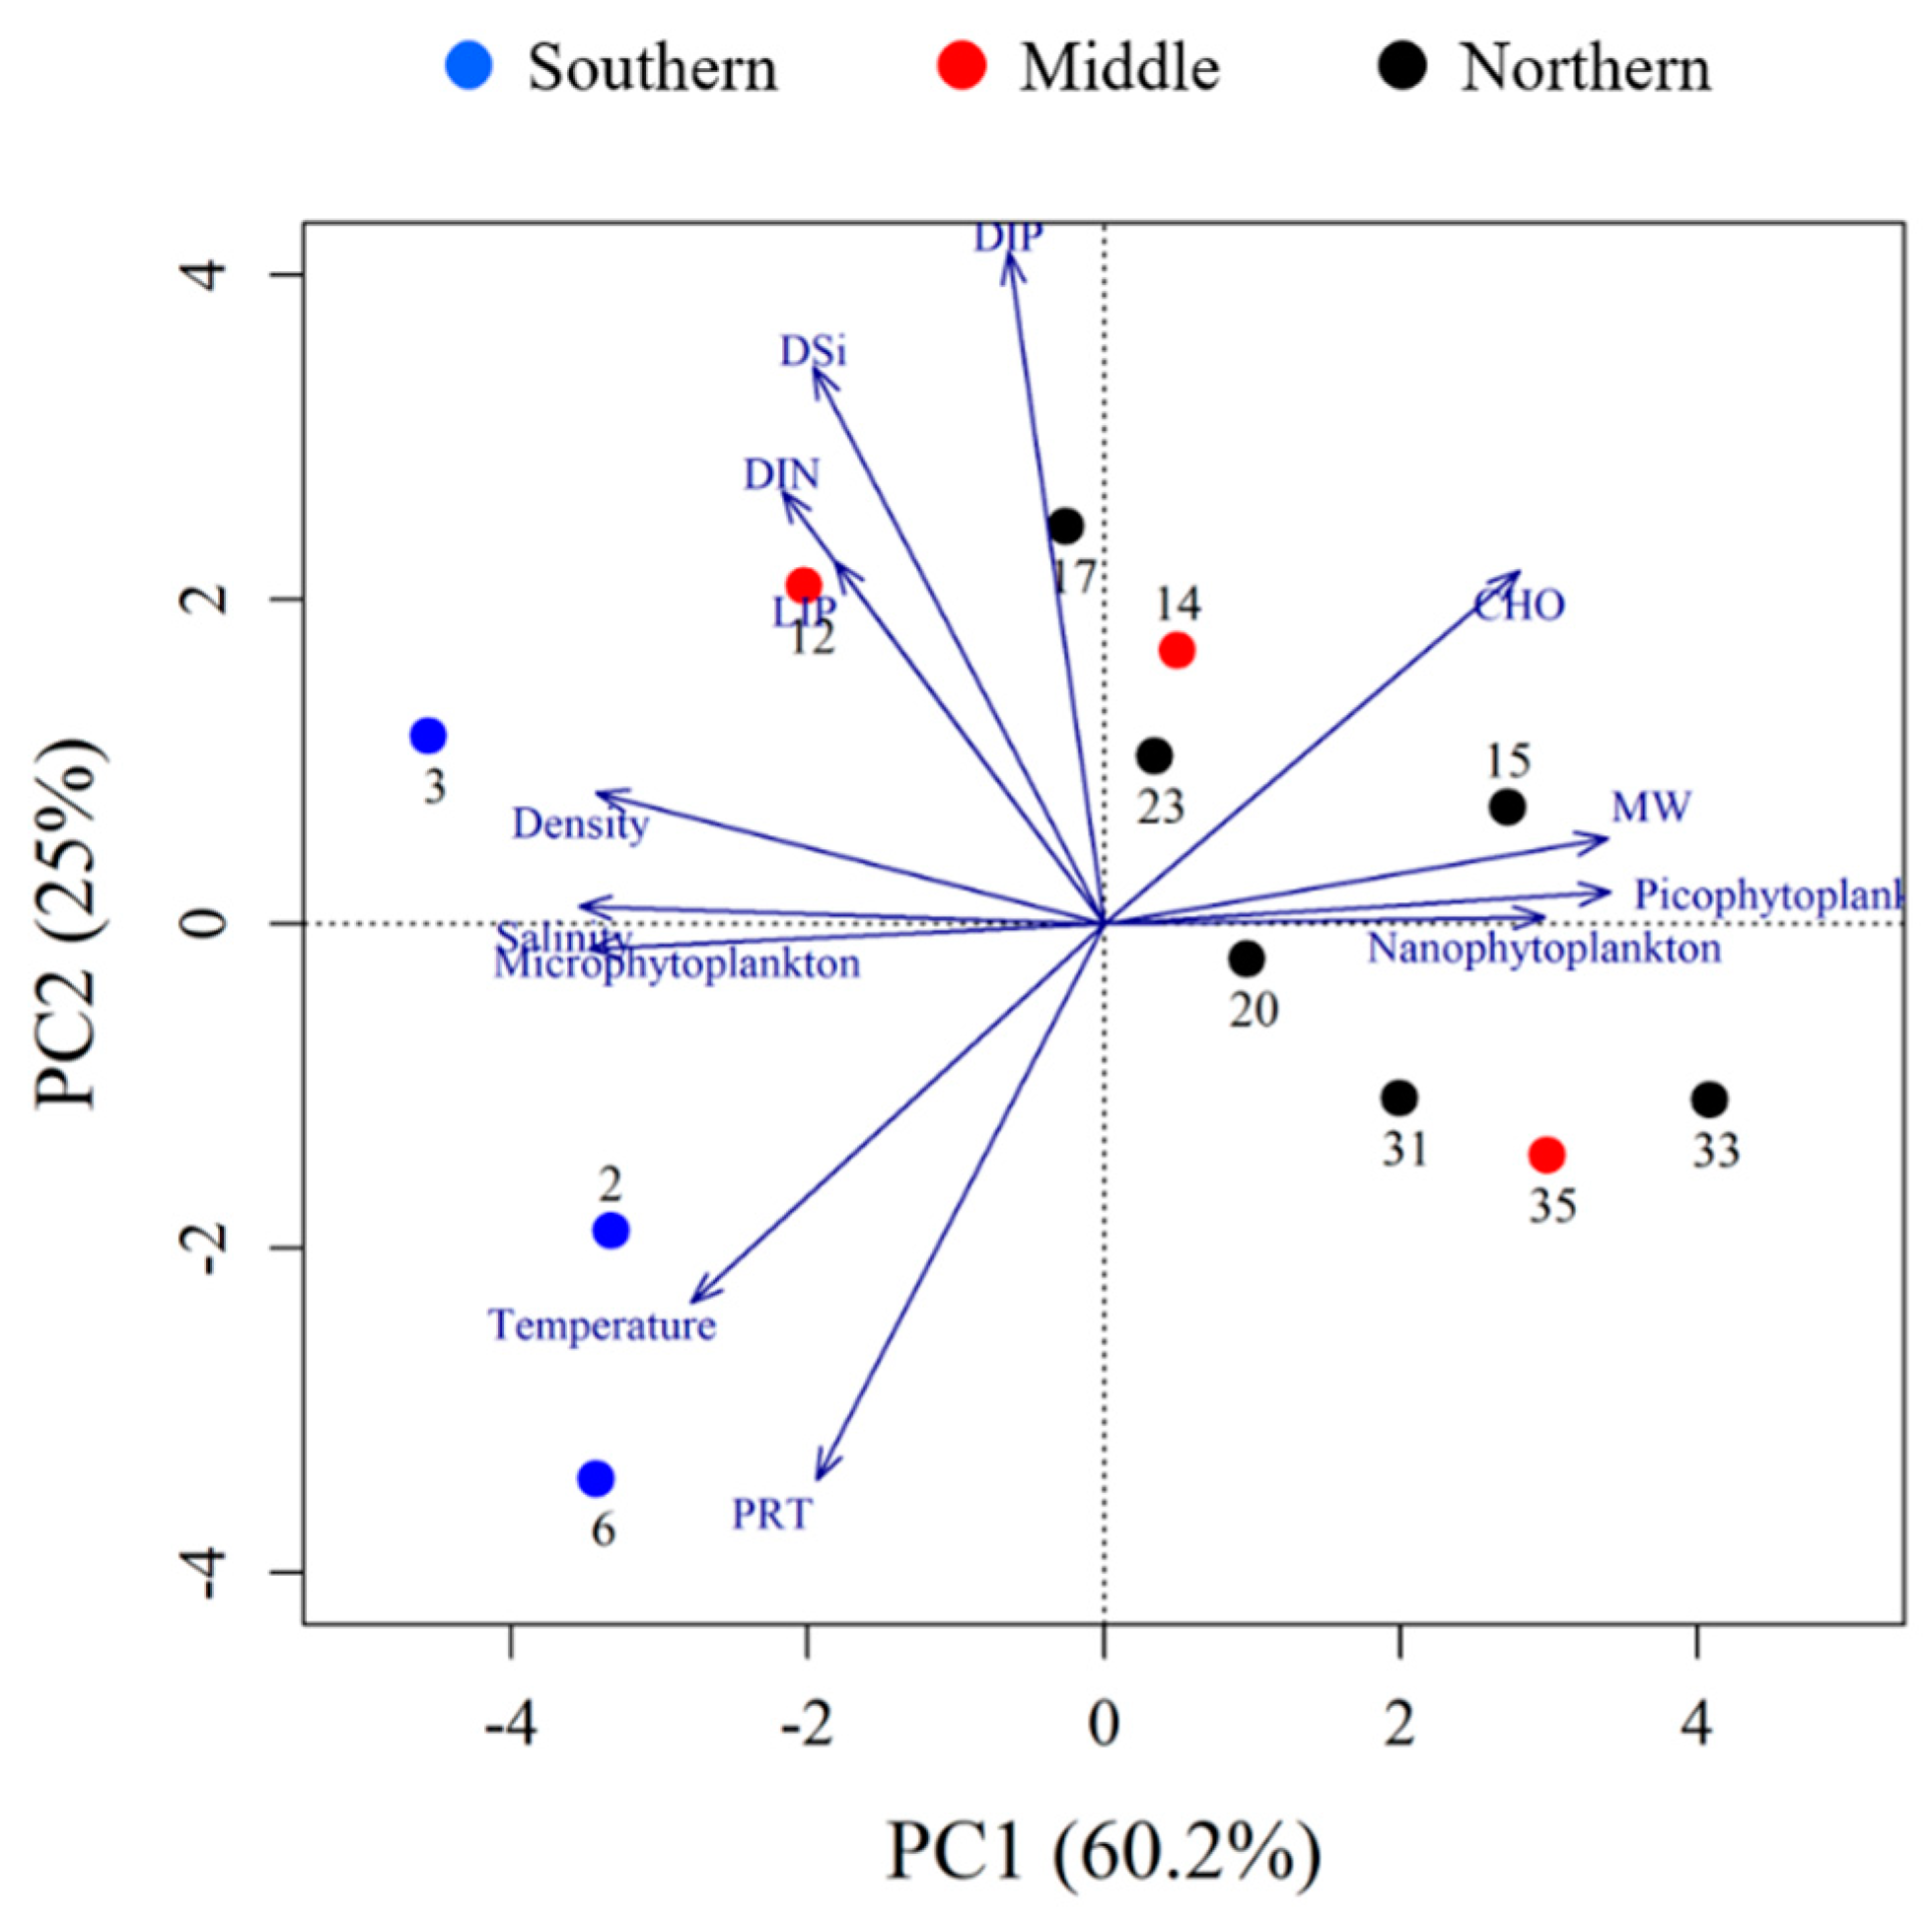
3.4. Multivariate Statistical Analysis

PCA was performed to determine the similarity among the environmental variables between stations. The PCA ordination of the sampled stations according to the measured environmental parameters is plotted in Figure 5 with eigenvalues presented in Table 2. The first two principal components (PC1 and PC2) accounted for 60.2% and 25.0% of the total variability, respectively. The temperature, salinity, density, and microphytoplankton (%) (eigenvectors of 0.931, 0.882, 0.785, and 0.891, respectively) were differentiated from the MW (%) and picophytoplankton (%) (eigenvectors of −0.907 and −0.880, respectively) by PC1, while PC2 was positively correlated with the major inorganic nutrient variables (eigenvectors ≥ 0.8). The analysis indicated general latitudinal groupings of stations in terms of their physical, chemical, and biological characteristics. The southern part was distinguished from the northern part by relatively high nutrient concentrations, temperatures, salinity, densities and relative contribution (%) of microphytoplankton. The northern part was characterized by a high MW (%) and relative contribution (%) of picophytoplankton values. The diagonal trajectory of the stations in the middle part within the ordination indicated that they represented a combination of PC1 and PC2.

4. Discussion

4.1. Origin and Quantity of POM

Our POM samples were collected by filtration and consisted of a variety of complex mixtures of compounds. Many studies have reported that chemical markers, such as chl-a, natural abundance of the stable isotopes of carbon (δ13C), and the C:N ratio, can be used to distinguish phytoplankton, as live components, from POM [9,12,30,52]. In our samples, the respective concentrations of PRT, LIP, and CHO in the POM had a linear relationship to the chl-a concentration (r = 0.689, 0.714, 0.724, n = 47, p < 0.01 for PRT, LIP, and CHO, respectively), which was used as a proxy for phytoplankton biomass. The δ13C value of the POM ranged from −28.5 to −22.1‰ (mean ± SD = −26.2 ± 2.8‰); our values were within the range previously reported in phytoplankton samples (Kim et al. [30]; Ahn et al. [33]; reference therein). Kim et al. [30] and Ahn et al. [33] reported that POM is mainly derived from phytoplankton during summer in the Arctic Ocean based on δ13C and the C:N ratio. In addition, during the sampling period, the low DIN concentration (<1 µM) and salinity distribution in the surface water suggest that the POM was greatly influenced by regional sea ice rather than a riverine source (terrigenous). Therefore, in our study, the POM was considered to have mainly come from a marine phytoplankton origin.
A field study has shown a large spatial variability in the concentration of FM in the Chukchi Sea. Kim et al. [30] reported that FM concentrations ranged from 80.5 to 698.8 μg L−1, with an average of 294.4 μg L−1 (SD = ± 228.1 μg L−1) in the euphotic layer of the Chukchi Sea, a value that was approximately 1.6 times higher than that in this study (mean ± SD = 180.5 ± 195.3 μg L−1). Yun et al. [31] also found concentrations of FM similar to results from a previous study in this area in this area that similar to results from a previous study in this area, ranged from 89.7 to 362.4 μg L−1 with an average of 156.4 μg L−1 in the euphotic layer during summer. These variations are thought to result from spatial and temporal variations in the biomass, composition, and productivity of phytoplankton which are common in the Arctic Ocean [53].
Early studies indicated that primary production is higher in the southern Chukchi Sea than in the northern Chukchi Sea, which is consistent with chl-a abundance [27,54,55,56,57]. Based on 13C uptake in the southern Chukchi Sea, Lee et al. [54] estimated a daily production of 0.6 g C m−2 day−1 (0.1 to 1.5 g C m−2 day−1). In comparison, the estimated averages of the daily primary production rates for the southern Chukchi Sea are 1.6 g C m−2 day−1 and 1.7 g C m−2 day−1 from Zeeman [58] and Korsak [27], respectively. The mean daily production in the northern Chukchi Sea measured by Yun et al. [56] was somewhat lower (mean ± SD = 0.14 ± 0.10 g C m−2 day−1) than the rate (0.66 ± 0.62 g C m−2 day−1) in the southern region, which is consistent with the findings from Lee et al. [54] (0.16 ± 0.16 g C m−2 day−1) and Lee et al. [55] (mean ± SD = 0.18 ± 0.07 g C m−2 day−1). Similarly, the mean chl-a concentration (2.0 µg L−1) in the southern part of the Chukchi Sea during the summer of 2017 was approximately one order of magnitude higher than the average value (0.2 µg L−1) in the northern part (Figure 3). These results suggest that the regional differences in quantitative POM may have resulted from the different levels of phytoplankton biomass in the Chukchi Sea.

4.2. Biochemical Composition in Relation to Environmental Parameters

Overall, CHO accounted for 53.3% of the POM for all the survey stations, followed by PRT (29.2%) and LIP (17.5%) (Figure 6A), which led to a low PRT:CHO ratio (0.6). Consistent with this observation, the DIN:DIP (mean ± SD = 1.3 ± 2.0) molar ratio within the euphotic layer was also low compared with the N:P Redfield ratio of 16 [59], indicating substantial nitrogen limitation in this region (Figure 2B). However, interestingly, the PCA revealed that there were significant differences in the compounds among the groups (Figure 5). More specifically, the biochemical composition of the POM was dominated by PRT (41.8%); in the southern part, there was PRT:CHO ratio of 1.2 despite a low DIN:DIP ratio (mean ± SD = 2.7 ± 3.0), while a CHO-dominant (>50%) system was found in the northern Chukchi Sea with a PRT:CHO ratio of 0.5. In general, the PRT fraction was greater than the CHO and LIP fractions under sufficient nitrogen conditions and growth stages of phytoplankton, which could lead to a high (>1) PRT:CHO ratio [13,15,16]. Fogg and Thake [60] and Hu [61] reported that as prolonged stressful conditions (such as nitrogen limitation) occur, metabolic changes in synthesizing enzyme systems can convert CHO into LIP synthesis. Thus, our results suggest that at least in the southern region, nitrogen limitation was not severe enough to limit phytoplankton growth. The northern part has not been exposed to nitrogen stress for a long time.
In addition, the results of the biplots (Figure 5) based on PCA revealed that microphytoplankton were influenced by relatively nutrient-replete conditions and had maximum chl-a and PRT values, while the picophytoplankton were more sensitive to nutrient deficiency and the MW (%), and were characterized by a high CHO contribution. These conditions were situated between two distinct areas (the southern and the northern parts) (Figure 5). Similar phenomena have been described by Jin et al. [62] and Li et al. [63] in relation to dominant species, nutrient depletion, and ice cover conditions in the western Arctic Ocean. Li et al. [63] suggested that small cells (<2 µm) thrive as a result of low nitrate availability and a strong stratification since pico-sized cells have a large surface area to volume ratio compared to that of larger cells, which allows effective nutrient and photon acquisition. CHEMTAX pigment analysis revealed that changes in temperature (caused by the timing of sea ice retreat) influence phytoplankton community structure [64]. Thus, it seems that the variation in biochemical compounds discovered among the two different groups (i.e., the southern and northern groups) could be the result of environmentally (such as the level of nutrients and freshwater) induced differences in the size classes and communities of phytoplankton in the Chukchi Sea.
Generally, the analysis of photosynthetic marker pigments (e.g., fucoxanthin, diadinoxanthin and diatoxanthin for diatoms, zeaxanthin for cyanobacteria, chlorophyll b and prasinoxanthin for green algae, 19′ butanoyloxy fucoxanthin and 19′ hexanoyloxy fucoxanthin for flagellates) can be useful biomarkers for phytoplankton biomass and species [65]. In our study, thirteen pigments except chl-a were identified through the (HPLC)-CHEMTAX analyses (Figure S1). As shown by the abundance of specific phytoplankton groups based on their corresponding biomarker pigments, the southern part was dominated by diatoms (88%), whereas pigments associated with flagellates and green algae made up approximately 44% of the total accessory pigment concentration and diatoms (53%) were observed in the northern Chukchi Sea (Figure S1). Several studies of phytoplankton have documented that species-specific characteristics, such as the cell wall structure and functional characteristics, play a significant role in the variation in biochemical components of phytoplankton [10,33,66,67,68,69]. Haug et al. [66] found that in diatoms, the concentration of PRT was generally much higher than that of CHO and LIP, whereas dinoflagellates have abundant CHO within their cell walls. Yun et al. [69] also reported that there were significantly close relationships between flagellates and the LIP fraction and diatoms and the PRT proportion in the Chukchi Sea. According to Shifrin and Chisholm [67], green algae and diatoms contained an average of 17.1% and 24.5% LIP (% of total dry weight), respectively, during log-phase growth in 30 cultured phytoplankton species. Therefore, the distributions and the relative contribution of these different dominant species and/or taxa of phytoplankton might also largely affect changes in the biochemical composition in the region.

4.3. Bioavailability of POM

Even now, the FM concentration, is used to represent the quantity of food in POM in relation to indicators of energy and material transfer to higher trophic levels [8,13,14,30]. However, FM is ideal when POM is made only of bioavailable constituents. In reality, POM contains bioavailable and non-bioavailable (refractory or less labile) fractions.
Bioavailability is a pivotal term for nutritional effectiveness, and the contribution of BFM to FM (%; nutritional efficiency) was used to assess POM bioavailability in this study. The nutritional efficiency ranged between 33.1 and 89.7%, with an average of 64.1% in the Chukchi Sea. More interestingly, the nutritional efficiency in the northern Chukchi Sea (74.0%) was approximately 1.2 times higher (60.0%) than it was in the middle part, while a lower mean value (42.7%) was observed in the southern part (Figure 6B). These results may have contributed to the different hydrolysis rates among the components, for which a greater presence is also an important factor. For example, the POM in the southern Chukchi Sea had a high contribution from PRT (41.8%) but a low level of HPRT (approximately 31.0% of their total pool), whereas a high level of HLIP (approximately 79% of their total pool) were observed despite a low contribution of LIP to the POM (20.5%). In the northern part, a large contribution from the HCHO (>80% of their total pool) was observed, with CHO accounting, for more than 50%, on average, of the POM in the northern part. In the middle part, HCHO accounted for 72.1% of the total CHO pool, followed by HPRT (55.4% of their total pool) and HLIP (40% of their total pool).
However, our findings, except for the middle part, are contradictory to the conclusions of Handa and Tominaga [70] and to the results obtained by Dawson and Liebezeit [71], Christian and Karl [72], and Fabiano et al. [8]. These reports suggested that cellular and proteinous amino acids were lost more rapidly than extractable sugars and particulate CHO. Such contrasting results suggest that different sizes [62] and species [73] of phytoplankton likely influence bioavailability. In our study, we found that the bioavailable contribution was negatively correlated with the relative amount of microphytoplankton (r = −0.652, p < 0.05, n = 20) and positively correlated with the relative amount of picophytoplankton (r = 0.668, p < 0.05, n = 20) (Figure S2); this result is consistent with the results from Jin et al. [62], who reported that picophytoplankton is more likely to mineralize and degrade in the upper ocean layers. In addition, CHO and amino acids are more enriched in intracellular materials than in cell wall materials [74]. Liebezeit [73] showed somewhat lower CHO degradation (38%) at stations dominated by diatoms than at stations dominated by Haptophyceae (86%) in the upper 100 m of the water column in the Bransfield Strait. Diatoms are characterized by silica shells (frustules) that are resistant to acid conditions (reviewed in DeNicolar [75]) and crushing forces [76]. In this sense, inherent structural differences in phytoplankton might also affect enzymatic hydrolysis, because phytoplankton was the major source of organic matter in our study. Taken together, although these results cannot be explained simply, different enzymatically hydrolysable efficiencies among the three different regions in the Chukchi Sea resulted from a selective loss of labile compounds and different communities of phytoplankton. Therefore, the higher POM bioavailability in the northern part of the Chukchi Sea could be caused by the different biochemical structures of the dominant picophytoplankton community compared to those of the microphytoplankton and diatom dominated community in the southern part of the Chukchi Sea. Clearly, a higher POM bioavailability provides more effective food materials for potential consumers in the northern part of the Chukchi Sea despite their lower biomass and lower primary productivity.

5. Conclusions

The biochemical composition of POM in the regions of the Chukchi Sea studied was due to differences in both environmental variables and the structure of the phytoplankton community. We also expect the observed results of the biochemical composition of POM to influence the nutritional quality of the available food. For instance, changes in the size, quantity and bioavailability of prey (phytoplankton) could affect the feeding, growth, reproduction and survival of predators [1,77,78]. In particular, in the Arctic Ocean, recent studies have indicated warming and decreased salinity of the water, with concomitant small phytoplankton sizes and decreased primary production [56,63]. If the sea ice continues to melt, then the quantity, quality, and labile level of POM will change, and consequently, the ecosystem structure, such as the trophic chain and microbial loop efficiency, will change in Arctic ecosystems. Therefore, further studies are needed to better understand the recent potential food materials under rapidly changing environmental conditions in the Arctic Ocean and picophytoplankton trophic roles in the microbial foodweb process.

Supplementary Materials

The following are available online at https://www.mdpi.com/2073-4441/12/9/2355/s1, Figure S1: Relative contribution of accessory pigments to total accessory pigment (wt:wt) in euphotic layer of southern, middle, and northern part of the Chukchi Sea, Figure S2: The relationship between relative contribution of micro (red dot) and picophytoplankton (green dot) fraction to total phytoplankton biomass (chl-a) and POM bioavailability. Solid lines indicate the fitted regression lines of the raw data points, Table S1: Average environmental parameters (± SD) within euphotic layer at each station in the Chukchi Sea.

Author Contributions

S.-Y.H. conceived of the study, participated in its design and helped to draft the manuscript; B.K.K. drafted the manuscript and performed the field and laboratory experiments; J.J. and Y.L. carried out the analysis of the nutrients, chl-a, δ13C, and pigments; K.-H.C. processed the CTD data; J.-K.G. critically reviewed the manuscript; S.-H.K. was the leader of the Korean Arctic Research Program and provided scientific advice. All authors have read and agreed to the published version of the manuscript.

Funding

This study was supported by Ministry of Oceans and Fisheries (MOF) and undertaken part of “Korea-Arctic Ocean Observing System (K-AOOS; 20160245)”.

Acknowledgments

We thank the captain, officers, and crew of the R/V Araon for their valuable assistance at field work.

Conflicts of Interest

The authors declare that the research was conducted in the absence of any commercial or financial relationships that could be construed as a potential conflict of interest.

References

  1. Søreide, J.E.; Leu, E.; Berge, J.; Graeve, M.; Falk-Petersen, S. Timing of blooms, algal food quality and Calanus glacialis reproduction and growth in a changing Arctic. Glob. Chang. Boil. 2010, 16. [Google Scholar] [CrossRef] [Green Version]
  2. Engel, A.; Bracher, A.; Dinter, T.; Endres, S.; Grosse, J.; Metfies, K.; Peeken, I.; Piontek, J.; Salter, I.; Nöthig, E.-M. Inter-annual variability of organic carbon concentration in the eastern Fram Strait during summer (2009–2017). Front. Mar. Sci. 2019, 6, 1–17. [Google Scholar] [CrossRef]
  3. Wassmann, P.; Duarte, C.M.; Agustí, S.; Sejr, M.K. Footprints of climate change in the Arctic marine ecosystem. Glob. Chang. Boil. 2011, 17, 1235–1249. [Google Scholar] [CrossRef]
  4. Bhavya, P.S.; Kim, B.K.; Jo, N.; Kim, K.; Kang, J.J.; Lee, J.H.; Lee, D.; Lee, J.H.; Joo, H.; Ahn, S.H.; et al. A review on the macromolecular compositions of phytoplankton and the implications for aquatic biogeochemistry. Ocean Sci. J. 2018, 54, 1–14. [Google Scholar] [CrossRef]
  5. Kreeger, D.; Goulden, C.; Kilham, S.; Lynn, S.; Datta, S.; Interlandi, S. Seasonal changes in the biochemistry of lake seston. Freshw. Boil. 1997, 38, 539–554. [Google Scholar] [CrossRef]
  6. Fichez, R. Composition and fate of organic matter in submarine cave sediments; implications for the biogeochemical cycle of organic carbon. Oceanol. Acta 1991, 14, 369–377. [Google Scholar]
  7. Danovaro, R.; Fabiano, M.; Croce, N.D. Labile organic matter and microbial biomasses in deep-sea sediments (Eastern Mediterranean Sea). Deep. Sea Res. Part I Oceanogr. Res. Pap. 1993, 40, 953–965. [Google Scholar] [CrossRef]
  8. Fabiano, M.; Danovaro, R.; Crisafi, E.; La Ferla, R.; Povero, P.; Acosta-Pomar, L.; Ferla, R. Particulate matter composition and bacterial distribution in Terra Nova Bay (Antarctica) during summer 1989–1990. Polar Boil. 1995, 15, 393–400. [Google Scholar] [CrossRef]
  9. Parsons, T.R.; Stephens, K.; Strickland, J.D.H. On the chemical composition of eleven species of marine phytoplankters. J. Fish. Res. Board Can. 1961, 18, 1001–1016. [Google Scholar] [CrossRef]
  10. Brown, M.R. The amino-acid and sugar composition of 16 species of microalgae used in mariculture. J. Exp. Mar. Boil. Ecol. 1991, 145, 79–99. [Google Scholar] [CrossRef]
  11. Richmond, A.; Hu, Q. Handbook of Microalgal Culture: Applied Phycology and Biotechnology, 2nd ed.; John Wiley and Sons: Hoboken, NJ, USA, 2011. [Google Scholar] [CrossRef]
  12. Fabiano, M.; Povero, P.; Danovaro, R. Distribution and composition of particulate organic matter in the Ross Sea (Antarctica). Polar Boil. 1993, 13, 525–533. [Google Scholar] [CrossRef]
  13. Danovaro, R.; Dell’Anno, A.; Pusceddu, A.; Marrale, D.; Croce, N.D.; Fabiano, M.; Tselepides, A. Biochemical composition of pico-, nano- and micro-particulate organic matter and bacterioplankton biomass in the oligotrophic Cretan Sea (NE Mediterranean). Prog. Oceanogr. 2000, 46, 279–310. [Google Scholar] [CrossRef]
  14. Kim, B.K.; Lee, S.; Ha, S.-Y.; Jung, J.; Kim, T.-W.; Yang, E.J.; Jo, N.; Lim, Y.J.; Park, J.; Lee, S.H. Vertical distributions of macromolecular composition of particulate organic matter in the water column of the amundsen sea polynya during the summer in 2014. J. Geophys. Res. Oceans 2018, 123, 1393–1405. [Google Scholar] [CrossRef]
  15. Hecky, R.E.; Kilham, P. Nutrient limitation of phytoplankton in freshwater and marine environments: A review of recent evidence on the effects of enrichment. Limnol. Oceanogr. 1988, 33, 796–822. [Google Scholar] [CrossRef] [Green Version]
  16. Kilham, S.; Kreeger, D.; Goulden, C.; Lynn, S. Effects of nutrient limitation on biochemical constituents of Ankistrodesmus falcatus. Freshw. Boil. 1997, 38, 591–596. [Google Scholar] [CrossRef]
  17. Lee, S.H.; Whitledge, T.E.; Kang, S.-H. Carbon uptake rates of sea ice algae and phytoplankton under different light intensities in a landfast sea ice zone, Barrow, Alaska. Arctic 2008, 61, 281–291. [Google Scholar] [CrossRef] [Green Version]
  18. Smith, A.E.; Morris, I. Pathways of carbon assimilation in phytoplankton from the Antarctic Ocean1. Limnol. Oceanogr. 1980, 25, 865–872. [Google Scholar] [CrossRef]
  19. Takagi, M.; Watanabe, K.; Yamaberi, K.; Yoshida, T. Limited feeding of potassium nitrate for intracellular lipid and triglyceride accumulation of Nannochloris sp. UTEX LB1999. Appl. Microbiol. Biotechnol. 2000, 54, 112–117. [Google Scholar] [CrossRef]
  20. Li, Y.; Horsman, M.E.; Wang, B.; Wu, N.; Lan, C.Q. Effects of nitrogen sources on cell growth and lipid accumulation of green alga Neochloris oleoabundans. Appl. Microbiol. Biotechnol. 2008, 81, 629–636. [Google Scholar] [CrossRef]
  21. Winberg, G.G. Symbols, Units and Conversion Factors in Study of Fresh Waters Productivity; International Biological Programme: London, UK, 1971; p. 23. [Google Scholar]
  22. Dell’Anno, A.; Fabiano, M.; Mei, M.; Danovaro, R. Enzymatically hydrolysed protein and carbohydrate pools in deep-sea sediments: Estimates of the potentially bioavailable fraction and methodological considerations. Mar. Ecol. Prog. Ser. 2000, 196, 15–23. [Google Scholar] [CrossRef] [Green Version]
  23. Pusceddu, A.; Dell’Anno, A.; Danovaro, R.; Manini, E.; Sarà, G.; Fabiano, M. Enzymatically hydrolyzable protein and carbohydrate sedimentary pools as indicators of the trophic state of detritus sink systems: A case study in a Mediterranean coastal lagoon. Estuaries 2003, 26, 641–650. [Google Scholar] [CrossRef]
  24. Misic, C.; Harriague, A.C.; Mangoni, O.; Aulicino, G.; Castagno, P.; Cotroneo, Y. Effects of physical constraints on the lability of POM during summer in the Ross Sea. J. Mar. Syst. 2017, 166, 132–143. [Google Scholar] [CrossRef]
  25. Woodgate, R.A.; Aagaard, K.; Weingartner, T.J. Monthly temperature, salinity, and transport variability of the Bering Strait through inflow. Geophys. Res. Lett. 2005, 32, L04601. [Google Scholar] [CrossRef] [Green Version]
  26. Yang, Y.; Bai, X. Summer changes in water mass characteristics and vertical thermohaline structure in the Eastern Chukchi Sea, 1974–2017. Water 2020, 12, 1434. [Google Scholar] [CrossRef]
  27. Korsak, M.N. Primary production of organic matter. In Results of the Third Joint US-USSR Bering and Chukchi Seas Expedition (BERPAC): Summer 1988; Nagel, P.A., Ed.; US Fish and Wildlife Service: Washington, DC, USA, 1992; pp. 215–218. [Google Scholar]
  28. Grebmeier, J.; Cooper, L.; Feder, H.M.; Sirenko, B.I. Ecosystem dynamics of the Pacific-influenced Northern Bering and Chukchi Seas in the Amerasian Arctic. Prog. Oceanogr. 2006, 71, 331–361. [Google Scholar] [CrossRef]
  29. Grebmeier, J.M. Shifting patterns of life in the Pacific arctic and Sub-Arctic seas. Annu. Rev. Mar. Sci. 2012, 4, 63–78. [Google Scholar] [CrossRef] [Green Version]
  30. Kim, B.K.; Lee, J.H.; Yun, M.S.; Joo, H.; Song, H.J.; Yang, E.J.; Chung, K.H.; Kang, S.-H.; Lee, S.H. High lipid composition of particulate organic matter in the northern Chukchi Sea, 2011. Deep. Sea Res. Part II Top. Stud. Oceanogr. 2015, 120, 72–81. [Google Scholar] [CrossRef]
  31. Yun, M.S.; Lee, D.B.; Kim, B.K.; Kang, J.J.; Lee, J.H.; Yang, E.J.; Park, W.G.; Chung, K.H.; Lee, S.H. Comparison of phytoplankton macromolecular compositions and zooplankton proximate compositions in the northern Chukchi Sea. Deep. Sea Res. Part II Top. Stud. Oceanogr. 2015, 120, 82–90. [Google Scholar] [CrossRef]
  32. Yun, M.S.; Joo, H.T.; Park, J.W.; Kang, J.J.; Kang, S.-H.; Lee, S.H. Lipid-rich and protein-poor carbon allocation patterns of phytoplankton in the northern Chukchi Sea, 2011. Cont. Shelf Res. 2018, 158, 26–32. [Google Scholar] [CrossRef]
  33. Ahn, S.H.; Whitledge, T.E.; Stockwell, D.A.; Lee, J.H.; Lee, H.W.; Lee, S.H. The biochemical composition of phytoplankton in the Laptev and East Siberian seas during the summer of 2013. Polar Boil. 2018, 42, 133–148. [Google Scholar] [CrossRef]
  34. Marra, J.F.; Lance, V.P.; Vaillancourt, R.D.; Hargreaves, B.R. Resolving the ocean’s euphotic zone. Deep. Sea Res. Part I Oceanogr. Res. Pap. 2014, 83, 45–50. [Google Scholar] [CrossRef]
  35. Catalano, G.; Povero, P.; Fabiano, M.; Benedetti, F.; Goffart, A. Nutrient utilisation and particulate organic matter changes during summer in the upper mixed layer (Ross Sea, Antarctica). Deep. Sea Res. Part I Oceanogr. Res. Pap. 1997, 44, 97–112. [Google Scholar] [CrossRef]
  36. Rivaro, P.F.; Abelmoschi, M.L.; Grotti, M.; Ianni, C.; Magi, E.; Margiotta, F.; Massolo, S.; Saggiomo, V. Combined effects of hydrographic structure and iron and copper availability on the phytoplankton growth in Terra Nova Bay Polynya (Ross Sea, Antarctica). Deep. Sea Res. Part I Oceanogr. Res. Pap. 2012, 62, 97–110. [Google Scholar] [CrossRef]
  37. Bates, N.R.; Garley, R.; Frey, K.E.; Shake, K.L.; Mathis, J.T. Sea-ice melt CO2–carbonate chemistry in the western Arctic Ocean: Meltwater contributions to air–sea CO2 gas exchange, mixed-layer properties and rates of net community production under sea ice. Biogeosciences 2014, 11, 6769–6789. [Google Scholar] [CrossRef] [Green Version]
  38. Fetterer, F.; Knowles, K.; Meier, W.N.; Savoie, M.; Windnagel, A.K. Updated Daily. Sea Ice Index, Version 3. [Indicate Subset Used]; National Snow and Ice Data Center (NSIDC): Boulder, CO, USA, 2017. [Google Scholar] [CrossRef]
  39. Parsons, T.R.; Maita, Y.; Lalli, C.M. A Manual of Chemical and Biological Methods for Seawater Analysis; Pergamon Press: Oxford, UK, 1984; p. 173. [Google Scholar]
  40. Coplen, T.B.; Brand, W.A.; Gehre, M.; Gröning, M.; Meijer, H.A.J.; TOMAN, B.; Verkouteren, R.M. New guidelines for δ13C measurements. Anal. Chem. 2006, 78, 2439–2441. [Google Scholar] [CrossRef] [Green Version]
  41. Lowry, O.H.; Rosebrough, N.J.; Farr, A.L.; Randall, R.J. Protein measurement with the Folin phenol reagent. J. Boil. Chem. 1951, 193, 265–275. [Google Scholar]
  42. Dubois, M.; Gilles, K.A.; Hamilton, J.K.; Rebers, P.A.; Smith, F. Colorimetric method for determination of sugars and related substances. Anal. Chem. 1956, 28, 350–356. [Google Scholar] [CrossRef]
  43. Bligh, E.G.; Dyer, W.J. A rapid method of total lipid extraction and purification. Can. J. Biochem. Physiol. 1959, 37, 911–917. [Google Scholar] [CrossRef] [Green Version]
  44. Marsh, J.B.; Weinstein, D.B. Simple charring method for determination of lipids. J. Lipid Res. 1966, 7, 574–576. [Google Scholar]
  45. Dall, W.; Moriaty, J.W. The biology of crustacea. In Functional Aspects of Nutrition and Digestion; Mantel, L.H., Ed.; Academic Press: New York, NY, USA, 1983; pp. 215–261. [Google Scholar]
  46. Gordon, D.C., Jr. A microscopic study of organic particles in the North Atlantic Ocean. Deep. Sea Res. Oceanogr. Abstr. 1970, 17, 175–185. [Google Scholar] [CrossRef]
  47. Mayer, L.M.; Linda, S.L.; Sawyer, T.; Plante, C.J.; Jumars, P.A.; Self, R.L.; Schick, L.L. Bioavailable amino acids in sediments: A biomimetic, kinetics based approach. Limnol. Oceanogr. 1995, 40, 511–520. [Google Scholar] [CrossRef] [Green Version]
  48. Fabiano, M.; Pusceddu, A. Total and hydrolizable particulate organic matter (carbohydrates, proteins and lipids) at a coastal station in Terra Nova Bay (Ross Sea, Antarctica). Polar Boil. 1998, 19, 125–132. [Google Scholar] [CrossRef]
  49. Pusceddu, A.; Bianchelli, S.; Danovaro, R. Quantity and biochemical composition of particulate organic matter in a highly trawled area (Thermaikos Gulf, Eastern Mediterranean Sea). Adv. Oceanogr. Limnol. 2015, 6, 21–32. [Google Scholar] [CrossRef]
  50. Gong, D.; Pickart, R.S. Summertime circulation in the eastern Chukchi Sea. Deep. Sea Res. Part II Top. Stud. Oceanogr. 2015, 118, 18–31. [Google Scholar] [CrossRef]
  51. Stroh, J.N.; Panteleev, G.; Kirillov, S.; Makhotin, M.; Shakhova, N. Sea-surface temperature and salinity product comparison against external in situ data in the Arctic Ocean. J. Geophys. Res. Ocean. 2015, 120, 7223–7236. [Google Scholar] [CrossRef]
  52. Volkman, J.K.; Tanoue, E. Chemical and biological studies of particulate organic matter in the ocean. J. Oceanogr. 2003, 25, 265–279. [Google Scholar] [CrossRef]
  53. Yun, M.S.; Chung, K.H.; Zimmermann, S.; Zhao, J.; Joo, H.M.; Lee, S.H. Phytoplankton productivity and its response to higher light levels in the Canada Basin. Polar Boil. 2012, 35, 257–268. [Google Scholar] [CrossRef]
  54. Lee, S.H.; Whitledge, T.E.; Kang, S.-H. Recent carbon and nitrogen uptake rates of phytoplankton in Bering Strait and the Chukchi Sea. Cont. Shelf Res. 2007, 27, 2231–2249. [Google Scholar] [CrossRef]
  55. Lee, S.H.; Yun, M.S.; Kim, B.K.; Saitoh, S.-I.; Kang, C.-K.; Kang, S.-H.; Whitledge, T. Latitudinal carbon productivity in the Bering and Chukchi Seas during the summer in 2007. Cont. Shelf Res. 2013, 59, 28–36. [Google Scholar] [CrossRef]
  56. Yun, M.S.; Whitledge, T.E.; Stockwell, D.; Son, S.H.; Lee, J.H.; Lee, D.B.; Lee, S.H.; Park, J.W.; Park, J. Primary production in the Chukchi Sea with potential effects of freshwater content. Biogeosciences 2016, 13, 737–749. [Google Scholar] [CrossRef] [Green Version]
  57. Nishino, S.; Kikuchi, T.; Fujiwara, A.; Hirawake, T.; Aoyama, M. Water mass characteristics and their temporal changes in a biological hotspot in the southern Chukchi Sea. Biogeosciences 2016, 13, 2563–2578. [Google Scholar] [CrossRef] [Green Version]
  58. Zeeman, S.I. The importance of primary production and CO2. In Results of the Third Joint US-USSR Bering and Chukchi Seas Expedition (BERPAC), Summer 1988; U.S. Fish and Wildlife Service: Washington, DC, USA, 1992; pp. 39–49. [Google Scholar]
  59. Redfield, A.C.; Ketchum, B.H.; Richards, F.A. The Influence of Organisms on the Composition of Sea-Water in the Sea; Hill, M.N., Ed.; Springer: New York, NY, USA, 1963; pp. 26–77. [Google Scholar]
  60. Fogg, G.E.; Thake, B. Cultures of limited volume. In Algal Cultures and Phytoplankton Ecology; University of Wisconsin Press: Maddison, WI, USA, 1987; pp. 12–42. [Google Scholar]
  61. Hu, Q. Environmental effects on cell composition. In Handbook of Microalgal Culture: Applied Phycology and Biotechnology; Richmond, A., Ed.; Oxford University Press: Oxford, UK, 2004; pp. 114–122. [Google Scholar]
  62. Jin, H.; Zhuang, Y.; Li, H.; Chen, J.; Gao, S.; Ji, Z.; Zhang, Y. Response of phytoplankton community to different water types in the western Arctic Ocean surface water based on pigment analysis in summer 2008. Acta Oceanol. Sin. 2017, 36, 109–121. [Google Scholar] [CrossRef]
  63. Li, W.K.W.; McLaughlin, F.A.; Lovejoy, C.; Carmack, E.C. Smallest algae thrive as the arctic ocean freshens. Science 2009, 326, 539. [Google Scholar] [CrossRef] [PubMed] [Green Version]
  64. Fujiwara, A.; Hirawake, T.; Suzuki, K.; Imai, I.; Saitoh, S.-I. Timing of sea ice retreat can alter phytoplankton community structure in the western Arctic Ocean. Biogeosciences 2014, 11, 1705–1716. [Google Scholar] [CrossRef] [Green Version]
  65. Jeffrey, S.W.; Mantoura, R.F.C.; Bjørnland, T. Data for the identification of 47 key phytoplankton pigments. In Phytoplankton Pigments in Oceanography: Guidelines to Modern Methods. Monographs on Oceanographic Methodology; Jeffrey, S.W., Mantoura, R.F.C., Wright, S.W., Eds.; UNESCO: Paris, France, 1997; pp. 449–559. [Google Scholar]
  66. Haug, A.; Myklestad, S.; Sakshaug, E. Studies on the phytoplankton ecology of the Trondheimsfjord. I. The chemical composition of phytoplankton populations. J. Exp. Mar. Boil. Ecol. 1973, 11, 15–26. [Google Scholar] [CrossRef]
  67. Shifrin, N.S.; Chisholm, S.W. Phytoplankton lipids: Interspecific differences and effects of nitrate, silicate and light-dark cycles1. J. Phycol. 2008, 17, 374–384. [Google Scholar] [CrossRef]
  68. Jo, N.; Kang, J.J.; Park, W.G.; Lee, B.R.; Yun, M.S.; Lee, J.H.; Kim, S.M.; Lee, D.; Joo, H.; Lee, J.H.; et al. Seasonal variation in the biochemical compositions of phytoplankton and zooplankton communities in the southwestern East/Japan Sea. Deep. Sea Res. Part II Top. Stud. Oceanogr. 2017, 143, 82–90. [Google Scholar] [CrossRef]
  69. Yun, M.S.; Joo, H.M.; Kang, J.J.; Park, J.W.; Lee, J.H.; Kang, S.-H.; Sun, J.; Lee, S.H. Potential implications of changing Photosynthetic end-products of Phytoplankton caused by sea ice conditions in the Northern Chukchi Sea. Front. Microbiol. 2019, 10, 2274. [Google Scholar] [CrossRef]
  70. Handa, N.; Tominaga, H. A detailed analysis of carbohydrates in marine particulate matter. Mar. Boil. 1969, 2, 228–235. [Google Scholar] [CrossRef]
  71. Dawson, R.; Liebezeit, G. Biochemical compounds in the pelagic and sedimentary environment of Antarctic waters. Publs. Cent. Natn. Exploit. Océans (Sér. Act. Colloques) 1982, 14, 67–86. [Google Scholar]
  72. Christian, J.R.; Karl, D.M. Bacterial ectoenzymes in marine waters: Activity ratios and temperature responses in three oceanographic provinces. Limnol. Oceanogr. 1995, 40, 1042–1049. [Google Scholar] [CrossRef] [Green Version]
  73. Liebezeit, G. Particulate carbohydrates in relation to phytoplankton in the euphotic zone of the Bransfield Strait. Polar Boil. 1984, 2, 225–228. [Google Scholar] [CrossRef]
  74. Cowie, G.L.; Hedges, J.I. Digestion and alteration of the biochemical constituents of a diatom (Thalassiosira weisflogii) ingested by an herbivorous zooplankton (Calanus pacificus). Limnol. Oceanogr. 1996, 41, 581–594. [Google Scholar] [CrossRef]
  75. DeNicola, D.M. A review of diatoms found in highly acidic environments. Hydrobiology 2000, 433, 111–122. [Google Scholar] [CrossRef]
  76. Hamm, C.; Merkel, R.; Springer, O.; Jurkojc, P.; Maier, C.; Prechtel, K.; Smetacek, V. Architecture and material properties of diatom shells provide effective mechanical protection. Nature 2003, 421, 841–843. [Google Scholar] [CrossRef] [Green Version]
  77. Vargas, C.A.; Escribano, R.; Poulet, S. Phytoplankton food quality determines time windows for successful zooplankton reproductive pulses. Ecology 2006, 87, 2992–2999. [Google Scholar] [CrossRef]
  78. Friedrichs, L.; Hornig, M.; Schulze, L.; Bertram, A.; Jansen, S.; Hamm, C. Size and biomechanic properties of diatom frustules influence food uptake by copepods. Mar. Ecol. Prog. Ser. 2013, 481, 41–51. [Google Scholar] [CrossRef]
Figure 1. (A) Location of sampling area in the Chukchi Sea, August 2017. Sea ice extent for the month of August in 2017 (red line) was obtained from the National Snow and Ice Data Center (NSIDC, Fetterer et al. [38]). (B) Temperature-salinity diagram from surface to 100 m depth (labeled with station numbers in bold black at the surface); (C) cluster analysis of the surface potential temperature and salinity data allowed identification of 3 types of the regions in the Chukchi Sea, (D) MW (%) distributions at surface water in the Chukchi Sea during a summer cruise in August 2017. (Ocean Data View (ODV) version 5.1.0) (AWI, Bremerhaven, Germany, Schlitzer, R.).
Water 12 02355 g001
Figure 2. The stoichiometric (A) dissolved inorganic silicate (DSi) and dissolved inorganic (DIP) and (B) dissolved inorganic nitrate + nitrite + ammonium (DIN) and dissolved inorganic phosphate (DIP) from the surface to euphotic layer at sampling stations.
Water 12 02355 g002
Figure 3. Average chlorophyll a (chl-a; µg L−1) concentration of phytoplankton within euphotic layer (A) in the study stations of the Chukchi Sea. (B) Relative chl-a (%) for size fraction of phytoplankton (0.7–2 µm, 2–20 µm and >20 µm; i.e., pico-, nano- and micro-phytoplankton, respectively). Data were sorted by station depths and divided into southern, middle, and northern. Error bar indicated standard deviation (n = 2–5).
Water 12 02355 g003
Figure 4. Average total (n = 51) and hydrolysable (n = 35) (A) lipids, (B) proteins, and (C) carbohydrates concentration of particulate organic matter (POM) within euphotic layer. Error bar indicated standard deviation (n = 2–6).
Water 12 02355 g004
Figure 5. The principal component analysis performed from sampling stations. The environmental variables taken into consideration are temperature, salinity, density, nutrients (DIP; dissolved inorganic phosphate, DSi; dissolved inorganic silicate, DIN; dissolved inorganic nitrogen, nitrite + nitrate + ammonium), MW (meltwater, %), relative contribution of phytoplankton size classes (microphytoplankton, picophytoplankton, and nanophytoplankton), and relative contribution of biochemical pools (carbohydrates, CHO; proteins, PRT; lipids, LIP). Rotated eigenvectors for each parameter are indicated by arrows.
Water 12 02355 g005
Figure 6. Spatial distribution of (A) specific biochemical compositions (PRT, CHO, and LIP) and (B) percentage non-bioavailable (N-BFM; non-hydrolysable) and bioavailable (BFM; hydrolysable, sum of hydrolysable PRT (HPRT), hydrolysable CHO (HCHO), and hydrolysable LIP (HLIP) concentration) fractions in each group (southern, middle, and northern part) and all samples (Chukchi Sea). Composition of the hydrolysable pool was deduced by subtraction of the non-hydrolysable pools from those of the total POM.
Water 12 02355 g006
Table 1. Description of sampling stations in the Chukchi Sea, 2017. Euphotic depth is the depth of the 1% light level. All samples were collected from two to six different depths at each site within euphotic depth.
StationDate (dd-mm-yyyy)Latitude
(°N)
Longitude
(°W)
Bottom Depth (m)Euphotic Depth (m)Sampling Depth (m)Group
207-08-201766.6298168.687443200, 10, 20Southern part
307-08-201767.6699168.960148310, 10, 18, 30Southern part
607-08-201768.0130167.866850170, 10Southern part
1209-08-201772.3601168.666848350, 10, 15, 20, 30Middle part
1409-08-201773.5803168.2824119440, 10, 20, 30, 44Middle part
3524-08-201774.5003162.24871536430, 10, 20, 30, 40Middle part
1510-08-201774.7987167.8904192540, 10, 15, 20, 30, 44Northern part
1711-08-201775.1509176.0166319330, 10, 13, 18, 30Northern part
2012-08-201777.9999174.93421672540, 10, 14, 22, 24, 30Northern part
2318-08-201775.0008173.6090135390, 10, 20, 25, 34Northern part
3122-08-201777.4722164.1178267400, 10, 15, 20, 30, 40Northern part
3323-08-201776.5254159.96932102730, 10, 20, 30Northern part
Table 2. A summary of eigenvectors of each environmental variable, eigenvalues, percentage (%) of variance explained by the first two axes resulted from the PCA. DIP; dissolved inorganic phosphate, DSi; dissolved inorganic silicate, DIN; dissolved inorganic nitrogen (nitrogen, nitrite + nitrate + ammonium).
ComponentPrincipal Component
PC1PC2
Eigenvalue7.83.3
Percentage60.225.0
Cumulative percent60.285.2
Eigenvector
VariablesEigenvectors
Salinity0.88820.450
Temperature0.931−0.138
Density0.7850.579
DIP−0.2420.920
DSi0.1590.936
DIN0.2870.805
MW−0.907−0.303
Microphytoplankton (%)0.8910.389
Nanophytoplankton (%)−0.753−0.351
Picophytoplankton (%)−0.880−0.373
LIP (%)0.2400.673
PRT (%)0.824−0.463
CHO (%)−0.9190.103

