Abstract
Water managers around the world face the increasingly challenging task to evaluate the impacts of technological measures and policy mechanisms from the local to the river basin scale. A toolset providing quantitative, actionable information on dependencies and trade-offs between upstream and downstream water users is currently lacking. Yet, any intervention needs to be assessed in terms of consequences for downstream water users. This study evaluates the potential of a tracer-like approach, implemented in the water allocation software WEAP, to quantitatively track return flows and their downstream reuse in the river basin context. The WEAP-Virtual Tracer (WEAP-VT) approach was successfully applied to one of Europe’s driest river basins, the Segura River Basin in Spain. For each water demand site, the different original sources of water supply, dependency on upstream return flows, and downstream reuse of its return flow were assessed. Based on these results, agricultural, urban, and environmental water users were evaluated in terms of their suitability for water saving measures and their vulnerability to the reduction in upstream return flows. A scenario analysis simulating the improvement of local efficiency improvements shows that specific irrigation schemes and ecosystems become deprived of water. Hence, efficiency improvement in water-scarce basins should be considered with caution. The demonstrated ability to quantify key water reuse indicators for individual water users and at different aggregation levels makes WEAP-VT a valuable tool to support water resource management decisions.
1. Introduction
Competition for water resources is intensifying in many river basins around the world. Climate change is projected to significantly impact spatial patterns and temporal dynamics of water availability [1,2]. Ambitions to save water are especially common in (semi-)arid basins with valuable economic benefits and ecosystem services associated with the use of water. A frequently applied response involves the introduction of modern technology or management practices which aim at enhancing the efficiency of a water use—i.e., increasing the ratio of consumptive use over withdrawal. However, the downstream reuse of return flows, either planned or unplanned, potentially limits the basin-scale beneficial effects of such local-scale interventions [3,4]. The relevance of accounting for dependencies and trade-offs through water reuse increases with the degree of water resources development and complexity of the network of water users in a basin.
Numerous case studies provide empirical evidence that the degree to which water can actually be saved at the basin level is often minimal [5]. Although the reduction in water withdrawals can provide benefits in various ways [6], local efficiency increases in practice often do not actually release water to alternative uses. If no legal or physical restrictions are in place, water users will find further productive use for the reduced return flows that are, by definition, associated with increasing local efficiency. Commonly observed examples include growing more water-intensive crops or expanding their irrigated acreage [7]. More permanent reductions in return flows can affect downstream agriculture, urban areas, and/or ecosystems [8,9,10]. Sound water management and the effective implementation of new technology, therefore, rely on reliable knowledge of upstream–downstream interactions.
Various conceptual and analytical frameworks have been developed with the purpose of characterizing a system of water users based on return flows and their reuse [11]. The practical application of these methods is, however, greatly limited by a lack of spatiotemporal data on fundamental variables such as water withdrawal, consumption, and non-consumptive use. Wiener et al. [12] demonstrated how water reuse can be analyzed for a watershed where extensive records of withdrawals, consumptive use and return flows are available. In the context of irrigated rice, Chinh [13] and Hafeez et al. [14] disposed of pumping records and flow data in drains and channels to characterize return flow reuse and its scale effects. Although such studies produced valuable information on local reuse situations, the need for extensive field data provides limited basis for upscaling to most of the world’s river basins, where this type of information is needed the most.
The scarcity of field data can be partly resolved by satellite-derived information [15]. Innovative approaches have recently been devised to assess key variables, such as water consumption, consumed fractions of irrigation water, and applied irrigation water [16,17,18]. These advances are encouraging as they limit the degree to which complex, physically-based modelling is required to separate surface water from soil and groundwater fluxes, avoiding the need for spatial data to describe the soil profile and vegetation properties.
The nature of satellite imagery, however, is unsuitable for an explicit assessment of lateral flows between water users. At best, some bulk flows and reuse factors can be computed. Complementary simulation modelling can allow for assessing the direct interactions between water users and quantifying water reuse indicators, under current conditions, as well as different water management scenarios. Dynamic models also allow for investigating the temporal dimension of reuse and impacts of alterations in timing of water availability. A range of modeling approaches has been developed and applied to quantify return flows, especially in the context of irrigation systems (e.g., [19,20,21]). The amount of studies explicitly looking into the actual reuse of these flows by downstream water users is, however, much more limited. Wu et al. [22,23] used a modified SWAT model to evaluate the return flow reuse processes on different scales for a paddy rice irrigation system, but this type of example is not very common. Hence, no modeling approach for comprehensively assessing basin-level water (re)use between different types of users is currently available.
A key challenge to such a model-based assessment is the explicit dimensioning of flows between water users, as well as mixing processes occurring when return flows are injected into sources and streams. In field studies, to tackle similar issues, artificial and environmental tracers are widely used for identifying water origins and flow paths [24]. In an irrigation context, for example, Vallet-Coulomb et al. [25] made use of this principle to partition groundwater recharge into rainfall infiltration and irrigation return flows. Beard et al. [26] were recently among the first to implement a tracer-like approach in a modeling environment to assess the contribution of treated wastewater to surface water used for irrigation. However, by working with a single tracer substance, their approach does not allow for evaluating the downstream reuse of flows from specific sources and assessing dependencies between individual water users. To our knowledge, so far, no studies have applied a tracer approach in water resources modeling with the purpose of assessing indicators of reuse at the level of individual water users.
The objective of this paper is therefore to explore the potential of applying a “Virtual Tracer” approach in a water allocation model for tracking water sources and reuse. The Segura River Basin in South-Eastern Spain was selected as the pilot area because of its exposure to water shortages and the regional significance of irrigated agriculture.
2. Materials and Methods
2.1. Study Area
The Segura River Basin covers an area of 18,930 km2 in the semi-arid southeastern corner of the Iberian Peninsula (Figure 1). Average precipitation in the region ranges from 1000 mm/year in the headwater sections to below 300 mm/year in the driest lowlands, while reference evapotranspiration averages 1500 mm/year. The river network is comprised by 1553 km of permanent and intermittent streams: a primary channel (Segura River) and various right-side (Taibilla, Moratalla, Argos, Quipar, Mulas and Guadalentín) and left-side tributaries (Mundo-Camarillas system). At the headwaters, the Segura and Mundo rivers contribute, on average, to 68% of the total surface water resources available in the region. The left-side tributaries have an intermittent flow regime and provide discharge only after very intense rainfall events [27].
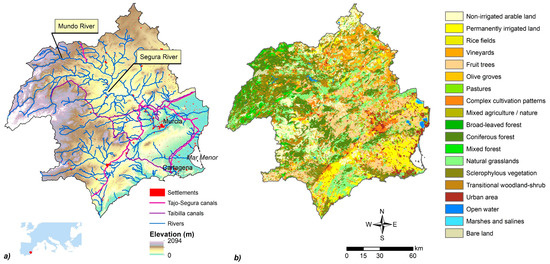
Figure 1.
Maps of the Segura River Basin: (a) main rivers, infrastructure and elevation, (b) land use/land cover.
The basin is home to a population of 2.1 million. The majority of these inhabitants live in the cities of Murcia and Cartagena as well as the urban area adjacent to the Mar Menor, a coastal saltwater lagoon of high ecological importance and significance to the tourism industry. Upstream mountainous areas are largely covered by forest and shrubland (Figure 1). Downstream, in particular the Campo de Cartagena region, is known for its intensive agricultural activity, despite a structural water deficit of more than 400 mm per year [28]. Overall, 43% of the basin is covered by agricultural land, of which a third is under irrigation. A wide range of fruit, vegetables, and flowers are grown across the alluvial plains of the Segura Basin. The water demand of irrigated agriculture amounts to 85% of total water demand in the basin [29]. Particular sites of ecological importance are the 120 wetlands in the basin, of which 70 are subject to special protection in the framework of the European Habitats directive [30].
The Segura River Basin is one of the most water-stressed regions in the Mediterranean basin. Management of the scarce water resources is the responsibility of the Confederación Hidrográfica del Segura (CHS), the basin water authority. To satisfy water demand in the absence of sufficient resources within the basin, the Tajo-Segura and Negratín (Guadalquivir) inter-basin aqueducts were constructed to provide additional water. The contribution of these inter-basin transfers accounts for approximately 20% of the average annual water demand [31]. The expansion of crop cultivation, population growth and prolonged drought events, along with groundwater pumping restrictions imposed by CHS, has led to the installation of desalination plants to further alleviate the gap between supply and demand. This development has been successful in reducing vulnerability to drought episodes [32]. Still, significant overexploitation of aquifers occurs to satisfy crop water requirements, with approximately 50% of the annually abstracted volume considered as non-renewable [33].
2.2. Concepts and Analytical Framework
This paper follows the water reuse framework of Simons et al. [11]. Reuse is defined as the downstream re-application of return flow from an upstream water use, where the latter can comprise any deliberate application of water to a specified purpose [34]. Return flows find their way downstream through both surface water and groundwater, therefore requiring both to be part of the reuse framework. Water can be reused for, for example, agricultural and landscape irrigation, industrial processes, domestic use, or aquaculture, and does not necessarily involve a treatment process. A special form of water reuse is the dependency of natural systems on upstream return flows for delivering valuable ecosystem services—e.g., by the inundation of wetlands. A glossary of all water balance terms used in this study is included in Appendix A.
A crucial starting point for analyzing water reuse is the fraction of withdrawn water that is removed from the system because it evaporated, was transpired by plants, incorporated into products or crops, or consumed by people or livestock. This Consumed Fraction (CF) is defined as follows:
where Qc is consumed water and Qw is the total volume of water withdrawn from various sources (both surface and groundwater). Dynamics of on-site water recycling (referred to as “direct water reuse” in some studies) are reflected in the CF value, with multiple cycles leading to a higher CF. Thus, when CF is computed for larger spatial domains, it is indicative of the extent to which water reuse occurs within that domain [17].
The non-consumed water (return flow) enters a network of natural and/or artificial hydrological flow paths and may ultimately be recovered for reuse at a downstream location. In order to perform a thorough assessment of water reuse across a system, this is the flow of water that needs to be tracked in space and time. Simons et al. [11] reviewed several indicators developed to characterize water reuse, and discussed these in terms of their value to decision makers, appropriate scales of application, and data requirements. The indicators Degree of Return flow Reuse (DRR) and Reuse Dependency (RD), as initially proposed by Chinh [13] in the context of a paddy rice system, were identified as potentially holding the most direct information on water reuse, but with limited practical application so far due to the high demand for input data. These are two key indicators examined in this paper at the level of a water user.
The original DRR definition needs to be modified to be applicable to a more generic context beyond irrigation only, and to focus on managed water (or “blue” [35]) water fluxes. For a water user x with n users located downstream, DRR can be computed as follows:
where χi is the mixing ratio between return flow from water user x and total flow through the source medium (e.g., a stream, aquifer, or reservoir) of downstream user i, Qw,i is the volume withdrawn by a downstream user i, and Qnc,x is return flow from x. In the case of multiple reuses and the inflow of additional water at locations downstream of the point of discharge of x, a sequence of unique χi values should be provided for each downstream reuse.
RD is complementary to DRR in the sense that it uses similar input variables to express the dependency of supply to a water user on upstream return flows. For a water user x with n users located upstream, it is defined as follows:
where Qw,x is the volume of water withdrawn by x.
In addition to indicators based on the quantitative assessment of actual flows, relating water demand to supply holds added value for water reuse analyses. To this end, it is important to distinguish between gross demand—i.e., total demand of a water user including on-site recycling and return flows—and net demand, which corrects for these terms. Local water shortages occur when supply is inadequate to meet gross demand, causing part of the demand to be unmet. Expressing this in a relative indicator yields the coverage (C), or the percentage of gross demand that is met by the supply to a water user:
where Dgross,x is gross water demand. Quantifying C helps to identify users that are deprived of water. It is particularly useful for evaluating different management scenarios as, for example, a water user with low C is likely to respond differently to changes in supply than a user with full coverage.
The CF, RD, DRR, and C indicators can be computed for individual water users, as well as aggregated to the sectoral or basin levels. Together, they provide a toolset for a comprehensive evaluation of water reuse processes across a river basin.
2.3. Modeling Approach
2.3.1. WEAP
The Water Evaluation And Planning (WEAP) system was used as the basic water resources model [36]. WEAP is a commonly used tool in strategic water resource planning and scenario assessment in many regions around the world (e.g., in [37,38,39]). WEAP uses the basic principle of water balance accounting, where total inflow equals total outflow, excluding any change in storage (in reservoirs, aquifers and soil). It represents a particular water system, with its main supply and demand nodes and the links between them, both numerically and graphically. Catchment attributes, such as river and groundwater systems, demand sites, wastewater treatment plants, and catchment and administrative political boundaries, are projected in a spatial environment. The concept-based representation of WEAP means that different scenarios can be quickly set up and compared. The system is scalable and consists of various modules that can be enabled and disabled.
WEAP users specify allocation rules by assigning priorities and supply preferences for each node; these preferences are mutable, both in space and time. WEAP then employs a priority-based optimization algorithm to allocate water in times of shortage. The challenge is to distribute the supply remaining after the satisfaction of catchment demand. Water delivery to various demand elements is optimized, according to their ranked priority and accounting for in-stream flow requirements. This is accomplished using an iterative linear programming algorithm. The demands of the same priority are referred to as “equity groups”. WEAP allocates equal percentages of water to the members of the same equity group when the system is supply-limited.
2.3.2. Virtual Tracer Approach
To evaluate water reuse processes in a river basin, a Virtual Tracer (VT) approach was developed making use of the water quality modelling functionality in WEAP. Unique tracers are added as conservative water quality constituents to the return flows of each agricultural and urban demand site, in a concentration of 1 g/L. Concentrations of each of these tracers are tracked across a basin and reported for the inflows of each downstream demand site. Similarly, the VT approach tracks original sources of water across the basin by introducing a unique tracer for each source. A standardized workflow in Microsoft Excel was developed using Application Programming Interfaces (APIs) for Visual Basic for Applications (VBA), to export the large amounts of WEAP results on flows and concentrations and report key water reuse indicators in an automated manner.
The WEAP modelling software was adjusted in several ways to implement the VT approach. For each demand site, outflow concentrations of all simulated tracers were set to equal inflow concentrations of the previous timestep. In order to track tracers as they traverse reservoirs, two new reservoir water quality methods were introduced: “Same as Inflow”, and “Simple Mixing”. The Same as Inflow method sets the reservoir outflow concentrations of all water quality constituents equal to the inflow concentration, whereas the Simple Mixing method tracks the concentration of water in storage, using a weighted average to calculate a new concentration for each tracer in each timestep, taking into account upstream inflows, evaporation and releases downstream. The thorough mixing of water in storage is assumed, so that the outflow concentration equals this average concentration. The Simple Mixing approach is required for reservoirs in cases where water is released from storage even though there is no inflow of water at that timestep. Such a Simple Mixing approach is essential for tracer studies, such as the current one, as water quality modeling more advanced reservoir mixing processes might be needed.
The VT approach was developed to evaluate reuse between demand sites in WEAP. It is, however, flexible in terms of scale, as the user determines the nature of the entity represented by a single demand site. For models where a demand site represents a system of various individual users (e.g., an irrigation scheme consisting of multiple fields), reuse within the demand site is not explicitly considered by the VT approach. This internal/direct reuse should be accounted for in the WEAP loss rate and reuse rate parameters.
2.3.3. The Segura River Basin Model
The schematization of the WEAP-VT model of the Segura River Basin was based on the 2010–2015 basin model developed for CHS using the SIMGES water resources model and the AquaTool interface [40,41,42]. For building the topology of the WEAP model, a lumped-aggregation strategy was adopted in order to reduce the complexity of the original model, while retaining the major water demand sites and infrastructure. The resulting schematization includes 16 river sections, 6 diversion canals, 32 reservoirs, 15 aquifers, 9 sources of external supply (desalination plants and inter-basin transfer), 37 demand sites, 127 distribution canals, 29 drainage canals, and 9 environmental flow requirements (Figure 2). For the reservoirs, volume–elevation curves, monthly net evaporation values, and operational parameters are specified in the WEAP model. As part of the VT approach, 32 water quality constituents were introduced; 15 and 13 tracers for the agricultural and urban demand sites, respectively, and 4 tracers representing the original sources of water in the basin: runoff generated in the catchment, aquifers, inter-basin aqueducts, and desalination plants [30]. A monthly timestep was used, corresponding with the application of the model for strategic evaluations.
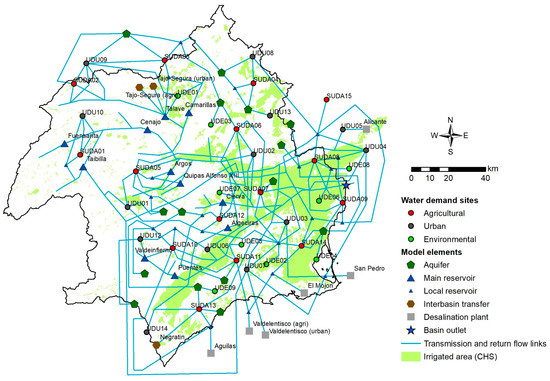
Figure 2.
Schematization of the WEAP Segura model.
Three different categories of water demand sites are considered in the model: agricultural (termed as Unidad de Demanda Agraria, or UDA, by CHS), urban (UDU), and environmental (UDE). The irrigation districts identified by CHS were aggregated into 15 nodes, coded as SUDAs. SUDA15 constitutes irrigated lands located in the Jucar Basin. For each irrigation demand site, cropped areas were provided for the 17 main crops in the catchment along with crop-specific water requirements varying per month. Thus, irrigation demands are calculated by the model based on a total of 255 separate units (17 crops multiplied by 15 irrigation systems). Water demands of the UDUs are calculated based on the number of equivalent inhabitants (permanent + seasonal population) at the municipal level and monthly dynamics in demand. Yearly environmental water demands of the wetlands and salt marshes in the basin are incorporated based on the difference between actual evapotranspiration and effective rainfall, as presented in the CHS River Basin Management Plan (RBMP) [40].
The model was configured for the period 1999–2011. All results presented in this paper are valid for the ten-year period of 2002–2011, with the first three years used for initialization purposes. Input data on catchment runoff, inter-basin and desalination supplies, crop water requirements, UDU and UDE demands, and consumed fractions at the demand site level were obtained from the RBMP [40]. The RBMP data on water demand concern blue water and are already corrected for rainfall and evapotranspiration of water in the soil profile. The WEAP-VT model, therefore, produces results on the use and reuse of these blue water flows.
3. Results and Discussion
3.1. Basin-Scale Analysis
Table 1 presents the basin-scale blue water cycle of the Segura River Basin obtained from the WEAP model and lists the results from previous studies for reference. Hunink et al. [43] applied data assimilation techniques using a combination of observations and the Water Accounting Plus framework to obtain overall water balance numbers. Contreras and Hunink [44] used observations from CHS and other reported sources and used those data in the United Nations System of Environmental–Economic Accounting for Water (UN-SEEAW). Aldaya [30] performed a similar analysis, based on the blue water natural regime for the period 1980–2012 combined with more recent information on the supply of external water resources. As can be seen from Table 1, the WEAP-VT results are largely consistent with these previous studies. Deviations shown in the Table can to a large extent be explained by differences in the period and methodological setup, where the dynamic modelling approach of WEAP-VT can be expected to provide a more accurate representation of basin-level consequences of interactions between water users. Based on Table 1, the current model is considered suitable to be used in a demonstration of the Virtual Tracer approach to analyze sources of water and reuse between various users. Obviously, the model could benefit from further calibration and validation with more local data (if they become available) for application as an operational management tool.

Table 1.
Blue water cycle of the Segura River Basin (ΔS = storage change, CF = Consumed Fraction).
As shown by Table 1, annual renewable water resources generated within the basin amount to 58% of the net blue water supply. There is a considerable net groundwater depletion of 124 hm3/year to complement water resources obtained from the catchment, reservoirs, inter-basin transfer aqueducts, and desalination plants. Clearly, most of the available water is consumed by irrigated agriculture. The overall consumed fraction is quite high at 0.86. This shows how the basin is effectively closed, with hardly any opportunities for the additional development of water resources and limited scope for further expansion of reuse.
Consumption and supply of water are related to demands in Table 2. Gross water demands of both the irrigation and urban sectors, including direct reuse and return flows, are not fully satisfied by supply. On average, annual shortages amount to 241 hm3/year (17%) and 19 hm3/year (9%), respectively. It should be noted that the flows in Table 2 are summed for the individual water demand sites, causing double accounting to occur as a consequence of water reuse. CF values in Table 2 should therefore be interpreted as averages per sector at the user level, as opposed to the basin-level value in 1. With this in mind, values of 0.76 and 0.73 are relatively high, which is indicative of extensive local recycling (direct reuse) occurring within the demand sites defined in WEAP-VT. Table 3 provides a disaggregation of gross demand, net demand, and the main relevant flows for the individual demand sites.
Table 2.
Annual average supply and demand of different types of water users aggregated for the entire Segura Basin using the WEAP analysis (CF = Consumed Fraction).
Table 3.
Demand, supply, return flow, and water reuse indicators calculated at the demand site level. Dgross = gross demand (hm3/year), Dnet = net demand (hm3/year), Qw = total withdrawal (hm3/year), Qnc = return flow (hm3/year), CF = Consumed Fraction (-), DRR = Degree of Return flow Reuse (-), RD = Reuse Dependency (-), C = Coverage (%).
3.2. Analysis of Original Water Sources and Return Flow Reuse
3.2.1. Original Sources
Water users in the Segura River Basin obtain their resources from four distinct sources of water: runoff generated in the catchment, aquifers, inter-basin transfers, and desalination plants. The timing of water delivered from the upstream mountainous catchments is managed through reservoir operations. The recharge of and extraction from the aquifers occur at the level of individual water users. On the other hand, the inter-basin transfers and desalination plants are centrally managed pieces of infrastructure. To account for the physical, political and financial aspects associated with each of these water sources, it is necessary to understand the dependency of the various water uses on each of these four distinct sources. Water extracted from a surface or groundwater source at a downstream point in the basin, may in fact have had a different original source, due to being withdrawn and discharged upstream.
Figure 3 shows the WEAP-VT modelling results. The breakdown of original sources of water is presented for each water demand site. For some sites, such as the SUDA01 irrigation system, which is located upstream, 100% of the water is withdrawn from the river and originates as renewable surface water resources from the upstream catchment. This is, however, not the case for most of the other agricultural demand sites, which have more complex networks of supply and reuse and rely on three or four different original water sources. Maintaining adequate water supply to these demand sites is especially challenging when these fractions are relatively equal, such as for SUDA10, SUDA11, SUDA12, and SUDA14. In general, the complexity of sources increases from the basin edges towards the river mouth. From a scientific point of view, these kinds of results are essential to better understand water flows in complex and over-exploited basins. From a management perspective, these results are key to making more balanced and informed decisions on water allocation and abstractions.
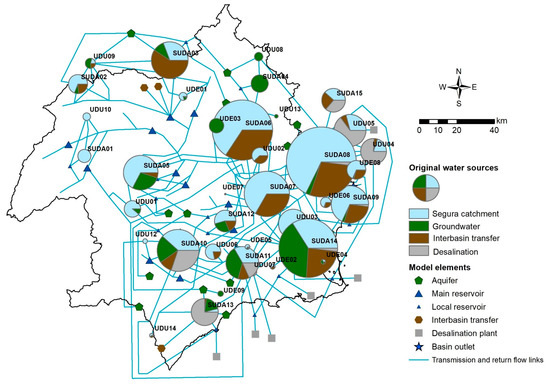
Figure 3.
Original sources of water per demand site. Sizes of the pie charts are in proportion to total annual supply to each demand site. SUDA, UDU, and UDE refer to agricultural, urban, and environmental demand sites, respectively.
The monthly pattern of supply from each of the water sources to agricultural, urban and environmental water demand sites is presented in Figure 4. Clearly, the peak supply of internally renewable water resources of the Segura catchment water occurs in July and August, which reflects the large storage capacity of local reservoirs to hold the water for several months. A striking observation is that water supplied to the environment varies in terms of original sources. Over 20% of the water supply to wetlands and salt marshes originates from the inter-basin transfers during 9 out of 12 months, reaching a maximum of 24% in March and July. This can be fully attributed to return flows from agricultural and urban sites, as no water from the inter-basin aqueducts is allocated directly to the environment. This is important information, as the Tajo-Segura aqueduct is primarily intended, and viewed, as a source of water for irrigation with limited impact on environmental flows [45]. The WEAP-VT results show that changes in transferred volumes to the Segura Basin will not only affect agriculture, but also supply to urban (with 15% of annual inflow supplied originally by inter-basin transfers) and environmental water demand sites. This is particularly relevant in the context of climate change, which is expected to reduce supply from the Upper Tajo by at least 70% [46]. In a similar fashion, Figure 4 shows that desalinated water, with urban water supply as its primary purpose, also constitutes a minor source of supply to agricultural and environmental demand sites.
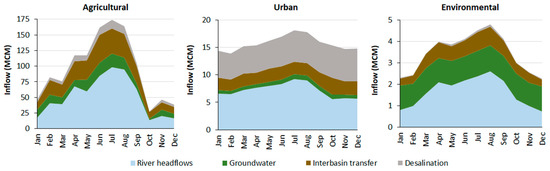
Figure 4.
Original sources of water for different types of water use in the Segura River Basin. Percentages indicate the overall contribution of the respective source to annual average supply.
3.2.2. Reuse of Demand Site Return Flows
As mentioned earlier, downstream implications must be assessed when planning policy mechanisms or technological interventions that may affect local withdrawals or the partitioning between consumptive and non-consumptive use. This requires knowledge of the downstream reuse of return flows, particularly in the context of irrigation systems, which typically have substantial return flows and are often targeted by water saving measures. In the Segura River Basin, there is on-going debate on the modernization of traditional irrigation canals (azarbes), and how this will affect riverine ecosystems and downstream water users [47]. Figure 5 shows three irrigation systems (SUDA05, SUDA06, SUDA07) as examples of the volume of return flow and which downstream system benefits from this return flow. For example, via the complex network of canals and local reservoirs, nine irrigation systems, urban supply and environmental sites depend on a total of 22.7 MCM/y of return flow generated by SUDA05. By contrast, 38.1 hm3/year (73%) of the reused return flow of the large irrigation system SUDA07 is used by a single demand site, SUDA08.
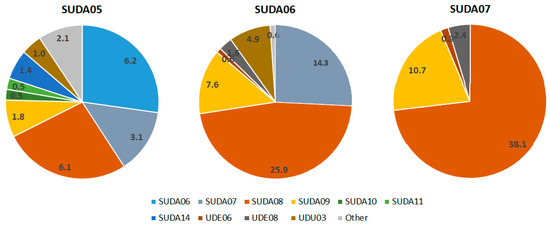
Figure 5.
Destinations of return flow for three agricultural demand sites with high downstream reuse volumes (hm3/year). All downstream sites at which less than 0.5 hm3/year of return flow is reused are grouped as “Other”.
Whether the supply to downstream users is significantly affected by changes in return flow at a demand site, depends on the DRR indicator—the ratio of actual return flow reuse (such as presented in Figure 5) to the total volume of return flow that is released back into the system. Typically, such upstream–downstream interactions through water reuse make up a balanced system that has evolved over many years, and trade-offs may occur once the upstream situation is changed. This is particularly the case for water users combining high DRR values with high return flow volumes.
Table 3 lists the annual average DRR value, as well as other key indicators and flow volumes, for each demand site in the Segura Basin. Strikingly, several demand sites have DRR values above 1, which indicates that their return flows are withdrawn more than once downstream. This is also the case for SUDA05, SUDA06, and SUDA07, presented in Figure 5. In other words, the return flow of these irrigation systems is already “overcommitted” to downstream reuse and increasing local consumptive use would lead to the further intensification of the system and potential downstream water shortages.
3.2.3. Reuse Dependency
The relevance of upstream return flow reductions to supply to an individual water user, depends on the fraction of its supply that was previously discharged by upstream users as return flow (Reuse Dependency, RD). Tabulated RD values per demand site are listed in Table 3. Figure 6 visualizes RD, disaggregated for the fraction to which each individual upstream site contributes to the water supply. There is clearly a large variability of overall RD values in the basin. While, in particular, several urban demand sites only withdraw water that was not previously used upstream, there are two downstream environmental demands (UDE02 and UDE04) which rely fully on water that was already withdrawn at least once. With regard to irrigation schemes, SUDA08 and SUDA09 rely on return flows for 43% and 60% of their water resources, and in particular the water drainage and percolation processes of SUDA06 and SUDA07. Over half (54%) of the water supplied to the irrigated area in the Jucar Basin, SUDA15, is comprised of return flows. It is interesting to note the number of different colors in each bar in Figure 6, i.e., the number of upstream users whose return flow is a source of supply. Demand sites with a relatively high overall RD, combined with a low amount of return flow sources, can be considered the sites most vulnerable to upstream changes in consumption. Examples include SUDA02, SUDA15, UDE04, UDE05, and UDU09.
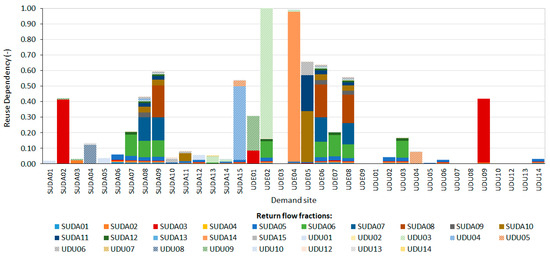
Figure 6.
Reuse dependency of each water demand site disaggregated per upstream user contributing to the supply.
Environmental water demands are typically the most vulnerable in river basins, as water supply is less well-monitored and sites of ecological relevance are commonly located downstream. Figure 7 presents the RD aggregated for each of the three water use sectors evaluated in the WEAP-VT model. Clearly, also in the Segura Basin, ecological demand sites are the most vulnerable to changes in upstream return flows. In the current situation, 41% of all water supply to the basin’s wetlands and salt marshes depends on return flows from upstream water users. The major portion (85%) of return flows reused at environmental demand sites originate from irrigated agriculture.
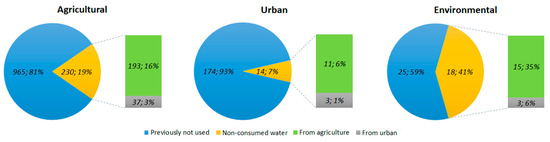
Figure 7.
Sector-specific dependency on return flows and water not previously withdrawn (blue). Values are in hm3/year; percentages are relative to total water supply.
The Natural Park of El Hondo (2495 ha, UDE08) is one of the most ecologically valuable areas in the Segura Basin, and it is the most important environmental water user in terms of annual volume. The park is included in the Ramsar convention list of protected wetlands and as a Special Protection Area under the European Union Directive on the Conservation of Wild Birds. As mentioned in Table 3, the average RD of the El Hondo Natural Park is 0.56 on an annual basis. Figure 8 demonstrates how water supply to the El Hondo wetlands depends on upstream return flows through the year. Panel (a) shows that, on average, RD drops to 27% during the wet January month, while it reaches a peak of over 70% in August. During the dry year 2006, as shown in panel (b), RD fluctuates around 0.80 for the months March to November. It is clear that, particularly under these conditions, reduced return flows of irrigation systems, such as SUDA07 and SUDA08, would negatively impact water availability to the El Fondo wetlands.
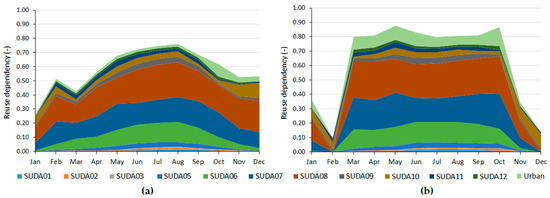
Figure 8.
Monthly dependency of the El Hondo wetlands on upstream return flow: (a) annual average for the period 2002–2011; (b) in 2006, a dry year.
3.3. Scenario Analyses of Unmet Demand and Coverage
As shown in Table 2, despite the supply of external water resources and water reuse within the basin, there is still an overall unmet demand in the Segura River Basin. Annual water supply is insufficient to 19 out of 37 demand sites during average conditions. Local efficiency increases are typical mitigation measures considered by water managers under these conditions. Two scenarios were simulated to explore the potential impacts of such measures. Both scenarios consider Consumed Fraction (CF) increases in all agricultural and urban demand sites to 0.9, which is the maximum local CF occurring in the baseline situation. In the first scenario (CF_90), it is assumed that no legal or geographical limitations are in place to stop water users from maximizing the consumptive use of the volume of water withdrawn under baseline conditions (2002–2011). The second scenario (CF_90_pol) represents the situation where caps on consumptive use per demand site are enforced by the water authorities. There is no possibility to increase consumption in this scenario, thus effectively leading to reduced gross demands.
Table 4 summarizes the demand and supply situation for the three main water-using sectors and the overall basin, under both scenarios. All key water balance components at the demand site level are provided in Appendix B. In CF_90, with stable demands but increasing efficiencies, consumption logically increases while return flows decrease. The high reduction in return flows leads to a rise in unmet demand at the basin level of 28%, and thus a decrease in coverage (supply divided by gross demand). Less water is available to demand sites with a high Reuse Dependency, resulting in a reduction in total supply. Figure 9 shows the changes in unmet demands at each demand site. Unmet demands of all sites with existing water shortages are increased, while unmet demands also newly occur at 9 sites.
Table 4.
Water demands, supply, and consumption simulated under the two scenarios. All values are in hm3/year. Percentages show changes of the basin-wide totals compared to the reference values, provided in Table 2. SUDA, UDU, and UDE refer to the totals for all agricultural, urban, and environmental demand sites, respectively.
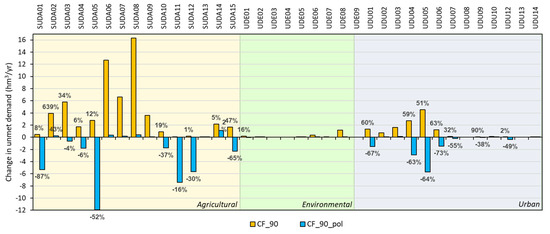
Figure 9.
Changes in unmet demand in the two scenarios, with respect to baseline conditions. Percentages indicate the relative unmet demand change for all demand sites with non-zero unmet demand under reference conditions.
Under the CF_90_pol scenario, the reduction in gross demand is almost fully reflected in the decrease in total supply to the demand sites. Combined with higher efficiency rates of individual demand sites, this logically leads to a substantial decrease in return flows. As the assumed restrictions on consumptive use are enforced on the basin scale, this scenario does not lead to a mere reallocation of flows, but instead reduces overall unmet demand in the basin by 18%. Figure 9 visualizes the changes in unmet demand for each site. Despite lower gross water demand, the overall reduction in unmet demand does result in a minor increase in consumption at the basin level, as some of the water shortages under baseline conditions are alleviated by a higher volumes of water remaining in streams and reservoirs. The basin-level CF remains largely stable, thus maintaining a similar level of river outflow as under baseline conditions.
3.4. General Implications for Water Resources Management
Limited knowledge of use, reuse, and original sources of water has led to ineffective or even harmful water management decisions. Subsequent conflicts over water resources have been described extensively for larger scales, such as river basins (e.g., in [48,49]). Additionally, on smaller scales, between irrigation systems or even within one canal system, those conflicts are often based on the uncertainty of source of water and reuse (e.g., in [50,51]).
Implementing the WEAP-VT methodology, as presented in this paper, contributes to water resources management by quantitatively tracking the use and reuse of water per unique combination of source and destination. This allows the results to be interpreted at the full range of spatial scales, from the individual demand site to the entire basin. In addition, the use of a dynamic model incorporates the monthly variability of both water availability and demand. By allowing for the evaluation of different scenarios related to consumed fractions and water demand, the methodology not only serves to characterize a system but can also support targeted interventions related to management, policy, and technology. In this manner, it is complementary to various water accounting methods that have been developed for the basin level and annual time scales, such as Water Accounting + [52].
The detailed information that is generated by the WEAP-VT methodology complies with the data requirements of informative water reuse indicators, such as RD and DRR. The opportunity to quantify these indicators on different spatial scales, as well as for each month of the year, can support a range of water resources management applications, which require information on upstream–downstream interactions. DRR assessments are typically relevant for irrigated agriculture located upstream, where users with a high value play an important role in the water reuse cascade and are, in most cases, not an appropriate target for water saving measures. Analyzing RD of high-value downstream water users, such as nature conservation areas, sheds light on their dependency on upstream return flows and can inform policies for ensuring adequate supply. Table 5 highlights a number of typical applications of the different indicators quantified by the WEAP-VT approach.
Table 5.
Schematic overview of example applications of key indicators quantified with the WEAP-VT methodology.
The scenario simulations for the Segura River Basin represent the extreme ends of possible impacts of efficiency-enhancing interventions in terms of trade-offs between users: (1) interventions that fail, from a basin perspective, in terms of water conservation and satisfying user needs (CF_90); (2) interventions which succeed in motivating water users to fully adapt their withdrawals to their consumptive needs (CF_90_pol). The results of these two scenarios are of broader interest to inform policy measures in water-scarce basins. Two main benefits can be observed from the CF_90_pol scenario: (i) alleviation of part of the water shortages occurring in the basin; (ii) a reduction in withdrawals of a comparable volume to the current extraction of non-renewable groundwater, indicating scope for reducing aquifer depletion when water allocation policies are properly implemented (specifically for the Segura case, the supply of external resources remains constant). Another benefit that is often assumed is that the “freeing up” of water at the basin level by reducing consumptive use does not occur due to extensive water reuse and an already high CF under baseline conditions. In fact, water consumption under CF_90_pol even slightly increases. This shows that the potential impacts of local alterations of consumed and non-consumed flows are particularly complex in a system that is already under stress—i.e., experiencing substantial unmet demand. Even when incentives are in place for users to adapt their withdrawals to their consumptive needs, thus leaving more water in-stream, overall basin consumption may increase as downstream water shortages are consequently reduced. This is an important notion that needs to be explicitly considered in the on-going debate of scale dependency of efficiencies and water saving options. Additionally, the scenario results demonstrate that the use of a modelling tool is required to evaluate the complex interlinkages and nonlinear relationships occurring in a system with intensive water reuse and various water users experiencing stress.
In its current form, WEAP-VT was developed specifically to perform quantitative water reuse analyses across river basins. Depending on the local context, additional aspects of water withdrawals and return flows should be considered when making decisions on water allocation and local-scale efficiency improvements. In many river basins, including the Segura, water quality is an important issue to take into account. On the one hand, generating significant return flows in irrigation schemes can be a deliberate choice to avoid the salinization of soils (leaching). On the other hand, return flows typically have higher pollution loads than non-return flows. When more water is left in-stream due to enhanced efficiency and effective policy mechanisms, more water of higher quality remains available for downstream use. Combining WEAP-VT with the modelling of water quality to evaluate such processes and trade-offs is a recommended subject for future research.
The presented WEAP-VT application for the Segura Basin made use of the data available from the Segura River Basin Management Plan, which contains recorded data for the key inputs required, such as river streamflow at various points, water demands, and consumed fractions at the user level [39]. To allow for applications in river basins that are less well-monitored, the WEAP-VT approach is also directly compatible with recently developed methods to assess consumed fractions for irrigation schemes [17]. Furthermore, the integrated rainfall-runoff module in WEAP allows for the simulation of upstream catchment processes in case inflow measurements are not available. For irrigated land, the validation of WEAP-VT results in more data-scarce conditions which could be pursued by applying recently developed techniques to evaluate blue water use with satellite data [16,17,18].
4. Conclusions
This paper has successfully demonstrated that the WEAP-Virtual Tracer approach can be applied to quantitatively track return flows and their (un-)planned reuse across complex systems. Analyses can be performed under baseline conditions as well as in different management scenarios, to reveal the impact of local interventions across a river basin in terms of (adequacy of) supply, consumption, and return flows. Outputs of a WEAP-VT analysis comply with the input data requirements of pre-developed water reuse indicators, which can be quantified on different spatial scales and for monthly to multi-annual periods.
For each water demand site in the Segura River Basin, the various original sources of water supply, dependency on upstream return flows, and downstream reuse of its own return flows were evaluated. Based on these results, agricultural, urban, and environmental water demand sites were characterized in terms of their suitability for water saving measures and their vulnerability to the reduction in upstream return flows. As the Segura River Basin can be considered illustrative for (semi-)arid basins with high competition for water resources, it can be concluded that WEAP-VT holds great potential for supporting sensible water saving measures and targeted efficiency improvements in such basins worldwide.
Author Contributions
Conceptualization, G.S., P.D., and W.B.; model development, S.C., P.D., G.S., and J.S.; writing—original draft preparation, G.S.; writing—review and editing, P.D., S.C., J.S., and W.B.; visualization, G.S. All authors have read and agreed to the published version of the manuscript.
Funding
This research was partially funded under Horizon 2020 (H2020-EU.3.5.4.), the EU research and innovation programme, grant number 641811 (IMproving PRedictions and management of hydrological Extremes—IMPREX).
Conflicts of Interest
The authors declare no conflict of interest.
Appendix A. Glossary
Table A1.
List of water balance terms used and their definitions. Where applicable, corresponding WEAP terminology is indicated between brackets.
Table A1.
List of water balance terms used and their definitions. Where applicable, corresponding WEAP terminology is indicated between brackets.
| Term | Definition |
|---|---|
| Blue water | All freshwater stored in lakes, streams, groundwater, glaciers and snow. |
| Consumed water | Water that is no longer available because it evaporated, was transpired by plants, incorporated into products or crops, or consumed by people or livestock. |
| Gross demand (WEAP: supply requirement) | The requirement of a water user after return flows and on-site recycling are taken into account. |
| Net demand (WEAP: water demand) | The requirement of a water user before return flows and on-site recycling are taken into account. |
| Return flow | Water that is not consumed in the process of water withdrawal. |
| Unmet demand | The amount of a user’s gross water demand that is not met by supply. |
| Water recycling | Reuse of water on-site for the same purpose. |
| Water reuse | Downstream re-application of return flows for further use with or without prior treatment. Water reuse includes the dependency of natural systems on return flows—e.g., for inundation of wetlands. |
| Water use (WEAP: supply delivered) | Any deliberate application of water to a specified purpose. Part of the water will evaporate, another part will return to the catchment where it was withdrawn, and yet another part may return to another catchment or the sea. |
Appendix B. Scenario Results per Demand Site
Table A2.
Demand, supply, return flow, and coverage at the demand site level under the CF_90 and CF_90_pol scenarios, in which the Consumed Fraction of all agricultural and urban demand sites is set to 0.9. Dgross = gross demand (hm3/year), Dnet = net demand (hm3/year), Qw = total withdrawal (hm3/year), Qnc = return flow (hm3/year), C = Coverage (%).
| Scenario | CF_90 | CF_90_pol | |||||||||
|---|---|---|---|---|---|---|---|---|---|---|---|
| Demand Site | Dgross | Dnet | Qw | Qnc | C | Dgross | Dnet | Qw | Qnc | C | |
| Agricultural | SUDA01 | 15.0 | 6.5 | 8.4 | 0.8 | 56% | 7.2 | 6.5 | 6.5 | 0.6 | 89% |
| SUDA02 | 19.3 | 11.6 | 14.8 | 1.5 | 77% | 12.9 | 11.6 | 12.0 | 1.2 | 93% | |
| SUDA03 | 85.4 | 66.8 | 62.7 | 6.3 | 73% | 74.2 | 66.8 | 57.9 | 5.8 | 78% | |
| SUDA04 | 43.7 | 36.2 | 13.5 | 1.3 | 31% | 40.3 | 36.2 | 13.5 | 1.4 | 34% | |
| SUDA05 | 84.3 | 58.1 | 58.7 | 5.9 | 70% | 64.6 | 58.1 | 53.7 | 5.4 | 83% | |
| SUDA06 | 185.6 | 140.7 | 172.9 | 17.3 | 93% | 156.4 | 140.7 | 156.0 | 15.6 | 100% | |
| SUDA07 | 105.1 | 58.8 | 98.5 | 9.8 | 94% | 65.4 | 58.8 | 65.2 | 6.5 | 100% | |
| SUDA08 | 250.3 | 169.7 | 233.9 | 23.4 | 93% | 188.5 | 169.7 | 188.1 | 18.8 | 100% | |
| SUDA09 | 71.3 | 61.9 | 67.7 | 6.8 | 95% | 68.8 | 61.9 | 68.7 | 6.9 | 100% | |
| SUDA10 | 94.1 | 79.4 | 88.4 | 8.8 | 94% | 88.2 | 79.4 | 85.2 | 8.5 | 97% | |
| SUDA11 | 101.0 | 83.3 | 54.7 | 5.5 | 54% | 92.6 | 83.3 | 53.8 | 5.4 | 58% | |
| SUDA12 | 42.6 | 32.4 | 23.6 | 2.4 | 55% | 36.0 | 32.4 | 22.8 | 2.3 | 63% | |
| SUDA13 | 83.2 | 75.0 | 36.8 | 3.7 | 44% | 83.3 | 75.0 | 36.8 | 3.7 | 44% | |
| SUDA14 | 223.1 | 200.7 | 174.2 | 17.4 | 78% | 223.0 | 200.7 | 175.2 | 17.5 | 79% | |
| SUDA15 | 32.2 | 24.0 | 27.0 | 2.7 | 84% | 26.7 | 24.0 | 25.4 | 2.5 | 95% | |
| Total | 1436.2 | 1105.2 | 1135.9 | 113.6 | 79% | 1228.0 | 1105.2 | 1021.0 | 102.1 | 83% | |
| Urban | UDU01 | 16.1 | 10.0 | 12.4 | 1.2 | 77% | 11.1 | 10.0 | 10.3 | 1.0 | 93% |
| UDU02 | 12.8 | 11.5 | 12.1 | 1.2 | 94% | 12.8 | 11.5 | 12.8 | 1.3 | 100% | |
| UDU03 | 44.5 | 38.3 | 42.9 | 4.3 | 96% | 42.5 | 38.3 | 42.4 | 4.2 | 100% | |
| UDU04 | 39.0 | 25.3 | 31.6 | 3.2 | 81% | 28.1 | 25.3 | 26.4 | 2.6 | 94% | |
| UDU05 | 61.6 | 43.1 | 48.1 | 4.8 | 78% | 47.9 | 43.1 | 44.7 | 4.5 | 93% | |
| UDU06 | 14.2 | 7.1 | 11.0 | 1.1 | 77% | 7.9 | 7.1 | 7.4 | 0.7 | 93% | |
| UDU07 | 3.6 | 3.1 | 3.0 | 0.3 | 85% | 3.4 | 3.1 | 3.2 | 0.3 | 95% | |
| UDU08 | 3.5 | 2.5 | 3.5 | 0.3 | 100% | 2.8 | 2.5 | 2.8 | 0.3 | 100% | |
| UDU09 | 5.3 | 3.7 | 5.2 | 0.5 | 97% | 4.1 | 3.7 | 4.0 | 0.4 | 99% | |
| UDU10 | 2.9 | 2.0 | 2.7 | 0.3 | 95% | 2.3 | 2.0 | 2.2 | 0.2 | 100% | |
| UDU12 | 1.8 | 0.9 | 1.1 | 0.1 | 61% | 1.0 | 0.9 | 0.7 | 0.1 | 65% | |
| UDU13 | 0.7 | 0.5 | 0.7 | 0.1 | 100% | 0.5 | 0.5 | 0.5 | 0.1 | 100% | |
| UDU14 | 0.8 | 0.6 | 0.8 | 0.1 | 95% | 0.6 | 0.6 | 0.6 | 0.1 | 100% | |
| Total | 206.8 | 148.6 | 175.0 | 17.5 | 85% | 165.1 | 148.6 | 158.1 | 15.8 | 96% | |
| Environmental | UDE01 | 4.3 | 4.3 | 3.2 | - | 73% | 4.3 | 4.3 | 3.3 | - | 77% |
| UDE02 | 1.3 | 1.3 | 1.2 | - | 95% | 1.3 | 1.3 | 1.3 | - | 100% | |
| UDE03 | 10.7 | 10.7 | 10.7 | - | 100% | 10.7 | 10.7 | 10.7 | - | 100% | |
| UDE04 | 1.2 | 1.2 | 1.2 | - | 100% | 1.2 | 1.2 | 1.2 | - | 100% | |
| UDE05 | 1.2 | 1.2 | 1.1 | - | 93% | 1.2 | 1.2 | 1.2 | - | 100% | |
| UDE06 | 5.5 | 5.5 | 5.1 | - | 93% | 5.5 | 5.5 | 5.5 | - | 100% | |
| UDE07 | 0.1 | 0.1 | 0.1 | - | 95% | 0.1 | 0.1 | 0.1 | - | 100% | |
| UDE08 | 17.9 | 17.9 | 16.7 | - | 94% | 17.9 | 17.9 | 17.8 | - | 100% | |
| UDE09 | 1.5 | 1.5 | 1.5 | - | 100% | 1.5 | 1.5 | 1.5 | - | 100% | |
| Total | 43.7 | 43.7 | 40.9 | - | 93% | 43.7 | 43.7 | 42.6 | - | 97% | |
References
- Flörke, M.; Schneider, C.; McDonald, R.I. Water competition between cities and agriculture driven by climate change and urban growth. Nat. Sustain. 2018, 1, 51–58. [Google Scholar] [CrossRef]
- Wijngaard, R.R.; Biemans, H.; Lutz, A.F.; Shrestha, A.B.; Wester, P.; Immerzeel, W.W. Climate change vs. socio-economic development: Understanding the future South-Asian water gap. Hydrol. Earth Syst. Sci. 2018, 22, 6297–6321. [Google Scholar] [CrossRef]
- Zhang, L.; Ma, Q.; Zhao, Y.; Wu, X.; Yu, W. Determining the influence of irrigation efficiency improvement on water use and consumption by conceptually considering hydrological pathways. Agric. Water Manag. 2019, 213, 674–681. [Google Scholar] [CrossRef]
- Williams, J.; Grafton, R.Q. Missing in action: Possible effects of water recovery on stream and river flows in the Murray–Darling Basin, Australia. Aust. J. Water Resour. 2019, 23, 78–87. [Google Scholar] [CrossRef]
- FAO. Does Improved Irrigation Technology Save Water? A Review of the Evidence; FAO: Cairo, Egypt, 2017; ISBN 9789251097748. [Google Scholar]
- Gleick, P.H.; Christian-Smith, J.; Cooley, H. Water-use efficiency and productivity: Rethinking the basin approach. Water Int. 2011, 36, 784–798. [Google Scholar] [CrossRef]
- Koech, R.; Langat, P. Improving irrigation water use efficiency: A review of advances, challenges and opportunities in the Australian context. Water (Switzerland) 2018, 10, 1171. [Google Scholar] [CrossRef]
- Contor, B.A.; Taylor, R.G. Why improving irrigation efficiency increases total volume of consumptive use. Irrig. Drain. 2013, 62, 273–280. [Google Scholar] [CrossRef]
- Berbel, J.; Gutiérrez-Martín, C.; Rodríguez-Díaz, J.A.; Camacho, E.; Montesinos, P. Literature Review on Rebound Effect of Water Saving Measures and Analysis of a Spanish Case Study. Water Resour. Manag. 2015, 29, 663–678. [Google Scholar] [CrossRef]
- Dumont, A.; Mayor, B.; López-Gunn, E. Is the Rebound Effect or Jevons Paradox a Useful Concept for better Management of Water Resources? Insights from the Irrigation Modernisation Process in Spain. Aquat. Procedia 2013, 1, 64–76. [Google Scholar] [CrossRef]
- Simons, G.W.H.; Bastiaanssen, W.G.M.; Immerzeel, W.W. Water reuse in river basins with multiple users: A literature review. J. Hydrol. 2015, 522, 558–571. [Google Scholar] [CrossRef]
- Wiener, M.J.; Jafvert, C.T.; Nies, L.F. The assessment of water use and reuse through reported data: A US case study. Sci. Total Environ. 2016, 539, 70–77. [Google Scholar] [CrossRef] [PubMed]
- Van Chinh, L. Return Flow and Reuse of Drainage Water in a Rice-Based Irrigation and Drainage Area in the Red River Basin, Vietnam; University of Copenhagen: Copenhagen, Denmark, 2012; ISBN 9788776115371. [Google Scholar]
- Hafeez, M.M.; Bouman, B.A.M.; Van de Giesen, N.; Vlek, P. Scale effects on water use and water productivity in a rice-based irrigation system (UPRIIS) in the Philippines. Agric. Water Manag. 2007, 92, 81–89. [Google Scholar] [CrossRef]
- Simons, G.; Bastiaanssen, W.; Ngô, L.A.; Hain, C.R.; Anderson, M.; Senay, G. Integrating global satellite-derived data products as a pre-analysis for hydrological modelling studies: A case study for the Red River Basin. Remote Sens. 2016, 8, 279. [Google Scholar] [CrossRef]
- Vogels, M.F.A.; De Jong, S.M.; Sterk, G.; Wanders, N.; Bierkens, M.F.P.; Addink, E.A. An object-based image analysis approach to assess irrigation-water consumption from MODIS products in Ethiopia. Int. J. Appl. Earth Obs. Geoinf. 2020, 88, 102067. [Google Scholar] [CrossRef]
- Simons, G.W.H.; Bastiaanssen, W.G.M.; Cheema, M.J.M.; Ahmad, B.; Immerzeel, W.W. A novel method to quantify consumed fractions and non-consumptive use of irrigation water: Application to the Indus Basin Irrigation System of Pakistan. Agric. Water Manag. 2020, 236, 106174. [Google Scholar] [CrossRef]
- van Eekelen, M.W.; Bastiaanssen, W.G.M.; Jarmain, C.; Jackson, B.; Ferreira, F.; van der Zaag, P.; Saraiva Okello, A.; Bosch, J.; Dye, P.; Bastidas-Obando, E.; et al. A novel approach to estimate direct and indirect water withdrawals from satellite measurements: A case study from the Incomati basin. Agric. Ecosyst. Environ. 2015, 200, 126–142. [Google Scholar] [CrossRef]
- Mohan, S.; Vijayalakshmi, D.P. Prediction of irrigation return flows through a hierarchical modeling approach. Agric. Water Manag. 2009, 96, 233–246. [Google Scholar] [CrossRef]
- Hu, Q.; Yang, Y.; Han, S.; Yang, Y.; Ai, Z.; Wang, J.; Ma, F. Identifying changes in irrigation return flow with gradually intensified water-saving technology using HYDRUS for regional water resources management. Agric. Water Manag. 2017, 194, 33–47. [Google Scholar] [CrossRef]
- Chien, C.P.; Fang, W.T. Modeling irrigation return flow for the return flow reuse system in paddy fields. Paddy Water Environ. 2012, 10, 187–196. [Google Scholar] [CrossRef]
- Wu, D.; Cui, Y.; Wang, Y.; Chen, M.; Luo, Y.; Zhang, L. Reuse of return flows and its scale effect in irrigation systems based on modified SWAT model. Agric. Water Manag. 2019, 213, 280–288. [Google Scholar] [CrossRef]
- Wu, D.; Cui, Y.; Luo, Y. Irrigation efficiency and water-saving potential considering reuse of return flow. Agric. Water Manag. 2019, 221, 519–527. [Google Scholar] [CrossRef]
- Leibundgut, C.; Maloszewski, P.; Külls, C. Tracers in Hydrology; John Wiley & Sons: Oxford, UK, 2009; ISBN 9780470518854. [Google Scholar]
- Vallet-Coulomb, C.; Séraphin, P.; Gonçalvès, J.; Radakovitch, O.; Cognard-Plancq, A.L.; Crespy, A.; Babic, M.; Charron, F. Irrigation return flows in a mediterranean aquifer inferred from combined chloride and stable isotopes mass balances. Appl. Geochem. 2017, 86, 92–104. [Google Scholar] [CrossRef]
- Beard, J.E.; Bierkens, M.F.P.; Bartholomeus, R.P. Following the Water: Characterising de facto Wastewater Reuse in Agriculture in the Netherlands. Sustainability 2019, 11, 5936. [Google Scholar] [CrossRef]
- CHS. Plan Hidrológico de la Cuenca del Segura, 2015–2021. In Confederación Hidrográfica del Segura, Ministério Medioambiente, Madrid; CHS: Traverse, MI, USA, 2015; p. 226. [Google Scholar]
- Castejón-Porcel, G.; Espín-Sánchez, D.; Ruiz-Álvarez, V.; García-Marín, R.; Moreno-Muñoz, D. Runoff water as a resource in the Campo de Cartagena (region of Murcia): Current possibilities for use and benefits. Water (Switzerland) 2018, 10, 456. [Google Scholar] [CrossRef]
- Martınez-Paz, J.M.; Gomariz-Castillo, F.; Pellicer-Martinez, F. Appraisal of the water footprint of irrigated agriculture in a semi-arid area: The Segura River Basin. PLoS ONE 2018, 13, e0206852. [Google Scholar] [CrossRef]
- Aldaya, M.M.; Custodio, E.; Llamas, R.; Fernández, M.F.; García, J.; Ródenas, M.Á. An academic analysis with recommendations for water management and planning at the basin scale: A review of water planning in the Segura River Basin. Sci. Total Environ. 2019, 662, 755–768. [Google Scholar] [CrossRef] [PubMed]
- Sanchis Ibor, C.; García Mollá, M.; Avellà Reus, L.; Genovés, J.C. Reaching the limits of water resources mobilisation: Irrigation development in the Segura River Basin, Spain. Water Altern. 2011, 4, 256–278. [Google Scholar]
- Morote, A.-F.; Olcina, J.; Hernandez, M. The Use of Non-Conventional Water Resources as a Means of Adaptation to Drought and Climate Change in Semi-Arid Regions: South-Eastern Spain. Water 2019, 11, 93. [Google Scholar] [CrossRef]
- Uche, J.; Martínez-Gracia, A.; Carmona, U. Life cycle assessment of the supply and use of water in the Segura Basin. Int. J. Life Cycle Assess. 2014, 19, 688–704. [Google Scholar] [CrossRef]
- Perry, C. Accounting for water use: Terminology and implications for saving water and increasing production. Agric. Water Manag. 2011, 98, 1840–1846. [Google Scholar] [CrossRef]
- Falkenmark, M.; Rockström, J. The New Blue and Green Water Paradigm: Breaking New Ground for Water Resources Planning and Management. J. Water Resour. Plan. Manag. 2006, 132, 129–132. [Google Scholar] [CrossRef]
- Yates, D.N.; Sieber, J.; Purkey, D.R.; Huber-Lee, A. WEAP21—A Demand-, Priority-, and Preference-Driven Water Planning Model Part 1: Model Characteristics. Water Int. 2005, 30, 487–500. [Google Scholar] [CrossRef]
- Miraji, M.; Liu, J.; Zheng, C. The Impacts of Water Demand and Its Implications for Future Surface Water Resource Management. Water (Switzerland) 2019, 11, 1280. [Google Scholar]
- Salomón-Sirolesi, M.; Farinós-Dasí, J. A new water governance model aimed at supply-demand management for irrigation and land development in the Mendoza River Basin, Argentina. Water (Switzerland) 2019, 11, 463. [Google Scholar] [CrossRef]
- Gedefaw, M.; Wang, H.; Yan, D.; Qin, T.; Wang, K.; Girma, A.; Batsuren, D.; Abiyu, A. Water resources allocation systems under irrigation expansion and climate change scenario in Awash River Basin of Ethiopia. Water (Switzerland) 2019, 11, 1966. [Google Scholar] [CrossRef]
- CHS. Plan Hidrológico de la Cuenca del Segura 2009/2015; CHS: Traverse, MI, USA, 2013. [Google Scholar]
- Andreu, J.; Capilla, J.; Sanchis, E. AQUATOOL, a generalized decision-support system for water resources planning and operational management. J. Hydrol. 1996, 177, 269–291. [Google Scholar] [CrossRef]
- Andreu Alvarez, J.; Solera Solera, A.; Capilla Romá, J.; Ferrer Polo, J. Modelo Simges de Simulación y Gestión de los Recursos Hídricos, Incluyendo Utilización Conjunta; Univ. Politécnica Val: Valencia, Spain, 2007. [Google Scholar]
- Hunink, J.; Simons, G.; Suárez-Almiñana, S.; Solera, A.; Andreu, J.; Giuliani, M.; Zamberletti, P.; Grillakis, M.; Koutroulis, A.; Tsanis, I.; et al. A simplified water accounting procedure to assess climate change impact on water resources for agriculture across different European river basins. Water (Switzerland) 2019, 11, 1976. [Google Scholar] [CrossRef]
- Contreras, S.; Hunink, J.E. Water Accounting at the Basin Scale: Water Use and Supply (2000–2010) in the Segura River Basin Using the SEEA Framework; FutureWater: Cartagena, Spain, 2015. [Google Scholar]
- Pérez-Blanco, C.D.; Essenfelder, A.H.; Gutiérrez-Martín, C. A tale of two rivers: Integrated hydro-economic modeling for the evaluation of trading opportunities and return flow externalities in inter-basin agricultural water markets. J. Hydrol. 2020, 584, 124676. [Google Scholar] [CrossRef]
- Pellicer-Martínez, F.; Martínez-Paz, J.M. Climate change effects on the hydrology of the headwaters of the Tagus River: Implications for the management of the Tagus-Segura transfer. Hydrol. Earth Syst. Sci. 2018, 22, 6473–6491. [Google Scholar] [CrossRef]
- Trapote Jaume, A.; Roca Roca, J.F.; Melgarejo Moreno, J. Azudes y acueductos del sistema de riego tradicional de la Vega Baja del Segura (Alicante, España). Investig. Geográficas 2015, 14198. [Google Scholar] [CrossRef]
- Molle, F.; Gaafar, I.; El-Agha, D.E.; Rap, E. The Nile delta’s water and salt balances and implications for management. Agric. Water Manag. 2018, 197, 110–121. [Google Scholar] [CrossRef]
- Karimov, A.; Smakhtin, V.; Mavlonov, A.; Gracheva, I. Water “banking” in Fergana valley aquifers-A solution to water allocation in the Syrdarya river basin? Agric. Water Manag. 2010, 97, 1461–1468. [Google Scholar] [CrossRef]
- Ricart, S.; Rico, A.M. Assessing technical and social driving factors of water reuse in agriculture: A review on risks, regulation and the yuck factor. Agric. Water Manag. 2019, 217, 426–439. [Google Scholar] [CrossRef]
- Gonçalves, J.M.; Ferreira, S.; Nunes, M.; Eugénio, R.; Amador, P.; Filipe, O.; Duarte, I.M.; Teixeira, M.; Vasconcelos, T.; Oliveira, F.; et al. Developing Irrigation Management at District Scale Based on Water Monitoring: Study on Lis Valley, Portugal. AgriEngineering 2020, 2, 78–95. [Google Scholar] [CrossRef]
- Karimi, P.; Bastiaanssen, W.G.M.; Molden, D. Water Accounting Plus (WA+)—A water accounting procedure for complex river basins based on satellite measurements. Hydrol. Earth Syst. Sci. 2013, 17, 2459–2472. [Google Scholar] [CrossRef]
© 2020 by the authors. Licensee MDPI, Basel, Switzerland. This article is an open access article distributed under the terms and conditions of the Creative Commons Attribution (CC BY) license (http://creativecommons.org/licenses/by/4.0/).