1. Introduction
A water distribution system (WDS) has long been considered one of the most important types of infrastructure; its function is to provide consumers with a safe and sufficient water supply with adequate pressure and quality. Since a WDS directly affects the quality of human life and overall economy, assessing its performance is essential for efficient system operation and management (O&M). This performance assessment can be used to identify the need for improvement or repair of the system. In addition, the results of a performance assessment under various abnormal conditions can contribute to the decision-making process of policymakers by establishing measures to reduce damage and quantifying the damage reduction effect. A number of studies have been conducted on performance assessment, and performance indicators (PIs) have been developed for WDS O&M in some countries [
1,
2,
3,
4]. PIs play a key role in the setting of objectives and development of effective countermeasures by providing an objective and reliable standard for assessment [
5].
The International Water Association (IWA) [
6] investigated and proposed PIs for assessing a WDS from multiple perspectives, including as water conveyance/transport systems and drainage/water supply networks. These PIs consider water resources, personnel, physical and operating characteristics, quality of service, and economics. However, it is difficult to collect data for some PIs, and there is a practical limit to applying all of the proposed PIs. Therefore, previous studies have developed PIs to assess a specific aspect of the WDS performance for better O&M [
7,
8,
9]. Marques and Monteiro [
7] assessed the operating performance of a WDS and presented 50 PIs, including some that could reflect economic factors. Jun [
8] applied the concept of segmentation to considering the effects of pipe bursts and proposed seven PIs for assessing WDS efficiency. The Japan Water Technology Research Center (JWRC) [
9] proposed a method for assessing measures to improve a WDS. However, only a few studies have focused on developing PIs to assess the WDS performance under emergency water supply conditions.
Emergency water supply conditions are often considered in WDS design; most studies assume pipe burst and fire flow conditions as emergency events [
10,
11,
12,
13,
14,
15]. Cullinane et al. [
14] developed a nonlinear optimization model for sizing WDS pipes to minimize the total system cost under the constraint of hydraulic availability (i.e., ability of the WDS to deliver the required quantity of water under failure conditions). They located the fire flow at the farthest node from the source to quantify the availability index. Jung et al. [
15] compared two different designs obtained from two different optimization approaches under fire flow and pipe burst conditions for post-optimization analysis. However, the above studies only focused on simulating the emergency event itself, even though the countermeasures performed by the water utility affect the hydraulic conditions of the WDS more significantly.
Emergency interconnected operation (EIO) between adjacent blocks in a WDS is one of the most effective countermeasures of a water utility when abnormal conditions (e.g., suspended water supply, pipe burst) occur at a certain location. Here, EIO refers to operating the emergency pipes interconnecting blocks to supply an area where the source fails to meet consumer demand. Previous studies have assessed the effectiveness of EIO at preventing abnormal conditions in a WDS [
16,
17]. Walski [
16] empirically investigated the necessity of EIO in a WDS to ensure high reliability. Scarpa et al. [
17] proposed a district partitioning method based on graph theory that first subdivides a WDS into elementary district metering areas and then progressively unites them to form “macro isolated districts” considering proximity and resilience performance.
For better WDS O&M, calculating a reliable PI that accurately represents the states of consumers under both normal and abnormal conditions is essential. However, previously proposed PIs have been based on ratios calculated from numerical values for the system configuration, capacity, and services without the consideration of consumer satisfaction with the system O&M. Such detailed indicators are inadequate for making multifaceted assessments of the overall system, and they are insufficient for assessing the performance of different configurations of a system. In addition, because the function of a WDS is to provide a water supply that satisfies consumer demands, an assessment that reflects the level of appreciation from the viewpoint of actual consumers is required.
In this study, a water supply performance indicator (WSPI) is developed for assessing the hydraulic performance of a WDS considering consumer usability and satisfaction. A fuzzy function is used to reflect the consumer satisfaction with the water supply level, and the consumer satisfaction can be adjusted by setting the variables of the fuzzy function. The proposed WSPI is calculated with a hydraulic analysis model based on data from an actual WDS; it can be used to assess the water supply capacity of each node and the entire WDS. The WSPI can be applied to an advanced pressure-driven analysis (A-PDA) model to assess the performance of a WDS under various abnormal conditions. As an example of its practical application, the proposed WSPI was used to assess the effectiveness of EIO for an actual WDS in six different suspended water supply scenarios.
2. Methodology
This section provides details on calculating the proposed WSPI and the application of the hydraulic analysis model.
2.1. Water Supply Performance Indicator
The proposed WSPI uses a fuzzy function to assess the supply capacity under EIO conditions. The WSPI is calculated according to the hydraulic analysis results and the weight of each supply node; it can be used to assess the supply performance of a WDS.
2.1.1. Fuzzy Membership Performance Measure
Fuzzy set theory can be used to classify objects with a membership function while compensating for errors in the existing dichotomous framework of thinking. This is a new form of artificial intelligence theory where human language is expressed with a computer, and objects are assessed similarly to how humans think [
18,
19]. If a membership function is defined as having a value between 0 and 1, the membership status of partially true or partially false can be expressed, and the corresponding value represents the corresponding object. A membership function can be defined in various forms according to the characteristics of the object and data.
In this study, the fuzzy membership performance measure (FMPM) was developed to indicate the consumer satisfaction level with the water availability. In order to reflect time-varying consumer satisfaction, a fuzzy large membership function is used [
18]. FMPM can be used to assess the satisfaction level with the available supply for each individual node in a WDS:
where
and
are the spread and midpoint values of the curve (or graph) that determine the shape of the function, and
x is the ratio of the available quantity of water
to the required demand
for each individual node.
x represents the percentage of the consumer demand that can be provided under emergency water supply conditions. When there are no problems,
x = 1 (i.e., water is supplied as requested by consumers). Less water is provided as
x decreases. The values of
and
can be changed according to the opinions of experts and operators, and the function type and implication change according to the assigned values. The spread is inversely proportional to the sigmoid variance of the function; a larger value indicates an increasingly linear function. The midpoint indicates the center point of the graph, which moves with the midpoint.
Figure 1 shows how the form of the graph changes according to the variable settings. The value assigned to the fuzzy function (i.e.,
x-axis) is the ratio of the available supply to the required demand in a WDS, and the value calculated by the fuzzy function (i.e.,
y-axis) is the level of consumer satisfaction. This leads to the following interpretation.
The spread value can be interpreted as the sensitivity of consumers to changes in the available supply volume.
Figure 1a shows a sigmoid form with a gentle slope compared to that in
Figure 1b (slope becomes steeper as
gets bigger); this can be interpreted to indicate less sensitivity to changes in the supply availability. The midpoint value represents consumers’ satisfaction to indicate optimism or pessimism (midpoint of the curve moves to the right as
gets bigger). In
Figure 1b, the center point of the sigmoid is biased to the right compared to that in
Figure 1a; this shows that the satisfaction dropped to its lowest value even when the supply rate was about 70%. This indicates that a larger center point value indicates increasingly pessimistic consumers.
These characteristics of the fuzzy large membership function can be used to consider different kinds of consumer satisfaction (e.g., degree of satisfaction with the water supply). For example, if the available supply–demand ratio at a specific node decreases from 100% to 90% and 50% because of a problem in a water supply facility, the drop in satisfaction will differ. At a supply–demand ratio of 90%, the consumer is highly likely to feel no significant difference or discomfort compared to a supply–demand ratio of 100%. However, if the supply–demand ratio falls to 50%, the consumer is highly likely to feel considerable discomfort. In this case, it is difficult to assess whether the usability or satisfaction experienced by the actual consumers also decreased to 50%. Depending on the consumer, the satisfaction level may be greater or less than 50%. The difference in satisfaction level for a WDS with a supply–demand ratio of 50% may be very different. The fuzzy large membership function can adequately reflect this difference.
Although the fuzzy membership function in this study is formulated with respect to water availability (the quantity of water to be supplied), similar functions could be constructed to quantify consumer’s satisfaction regarding the level of pressure and/or water quality under different types of emergence condition (e.g., discoloration). In addition, another advantage of using the fuzzy member approach is its potential to be expanded to assess user’s comprehensive satisfaction to multiple factors, i.e., water quantity, quality, and pressure.
In addition, FMPM is assessed according to the range and color classification presented in
Table 1. This classification system can be used to map FMPM values by color and thus help visualize the supply level and extent of each range from a spatial perspective. This color mapping approach can be used to assess the extent of the supply for the entire area of concern. In the case of EIO, this approach can be used to identify the range and area that need additional supply for improved design and management.
2.1.2. Fuzzy Membership Performance Measure for the Entire Supplied Area
Since FMPM only represents the performance of individual nodes (i.e., a certain area of aggregated households), a new PI called FMPM for the entire supplied area (FMPME) was also developed in this study. FMPME assesses the water supply condition for an entire supplied area (e.g., block in a WDS) by using weight factors for each individual node:
where
is the spread,
is the midpoint,
x is the ratio of available supply to required demand,
is the weight factor,
is the number of nodes in the supplied area, and
is the demand at the
ith node.
To assess the performance over the entire supplied area, the total demand of individual nodes needs to be considered. This is because even for equal values of the supply–demand ratio, there may be considerable differences in the actual absolute capacity available. A small FMPM with a large demand will have a much bigger impact on the supplied area than in a region with low demand. FMPME can be used to assess the overall supply performance of a WDS. If the WDS can fully meet the demand for the entire network, it will have an FMPME value of 1.
2.2. Hydraulic Analysis Model for Water Distribution System
Two hydraulic analysis models are commonly used for WDSs: demand-driven analysis (DDA) and pressure-driven analysis (PDA). DDA considers demands at all nodes as a fixed factor and is highly reliable for the hydraulic analysis of a WDS under normal conditions with no particular problems. However, DDA estimates hydraulic parameters (e.g., nodal pressure, pipe flow) under the assumption that every nodal demand is fully satisfied under any condition. This means that its application under abnormal conditions results in unrealistic results such as negative pressure.
To solve these problems, PDA adopts the head–node outflow relation (HOR) equation in DDA to consider the correlation between the nodal pressure and available supply discharge. Unlike DDA, PDA also considers nodal demands as a variable that can change according to the computed nodal pressure. Nodal demands are fully supplied when the nodal pressure exceeds the minimum required pressure, while the demands are adjusted with the HOR equation otherwise. Therefore, PDA is more applicable than DDA for obtaining realistic results under various abnormal conditions.
However, both DDA and PDA estimate hydraulic parameters under the assumption of an infinite supply at every source (e.g., tank, reservoir). Under this assumption, the source is considered to have an infinite size with a specific water level and thus can supply an infinite amount of water. This assumption is relatively valid under normal conditions, but it is invalid for simulation cases with an abrupt increase in demand (e.g., fire flow) or EIO, where the reservoir storage capacity and available supply should be considered. In other words, they assume an infinite supply capacity for demand nodes within the range that satisfies hydraulic conditions even when supply is insufficient or impossible because of insufficient storage at the actual source. Therefore, this study used advanced pressure-driven analysis (A-PDA), which is a hydraulic analysis model that can simulate abnormal situations related to storage at the source [
20].
Lee et al. [
20] proposed A-PDA to adopt the concept of a finite source for the existing PDA model. In addition to the reservoir source of existing hydraulic analysis models, the new hydraulic analysis model includes a new type of source called a limited reservoir. An equation was introduced to express the relationship between the water level and storage capacity of the source, which was neglected by previous hydraulic analysis models [
21]. To consider the inflow volume to the source and the hourly change, the inflow volume and inflow pattern were added to the model as variables. Thus, the new model can be used to consider the residual storage capacity and inflow volume over time for a source, and the source depletion status and depletion time can be simulated as well.
Table 2 outlines the differences and characteristics of the limited reservoir compared to the reservoir and tank, which are the source types of existing hydraulic analysis models. The most notable difference is that the limited reservoir can consider the capacity and level for storage. The existing reservoir maintains the initial level under all conditions. However, the limited reservoir can be used to simulate cases where the water level rises when the inflow is greater than the outflow and decreases when the inflow is less than the outflow. Importantly, it can simulate patterns in which supply to the entire system is not possible because of source depletion when the outflow is significantly higher than the inflow.
3. Study Network: A City in South Korea
The proposed FMPM was applied to a real WDS in “A city” in South Korea. The study network is a loop-dominated network comprising three reservoirs, 1492 nodes, 1937 pipes, eight pumps, eight pressure reduction valves (PRVs), and 2055 flow control valves (FCVs); it covers an area of about 56.29 km
2. As of 2018, three distribution reservoirs are supplying water to 84,672 households.
Figure 2 shows the blocks that each distribution reservoir is responsible for supplying. If a problem occurs in a specific reservoir and the water supply is disrupted, EIO is used to supply water between blocks through previously installed emergency pipes. These pipes are closed under normal conditions; in emergencies, they are opened to facilitate EIO. There are 11 emergency pipes interconnecting blocks: 10 emergency pipes between Block 1 and Block 2 and one emergency pipe between Block 2 and Block 3. There used to be a point in the study network where both Block 1 and Block 2 shared operation, but the operation of this point has recently been assigned to Block 1.
In this study, six scenarios were considered where the water supply was suspended from a reservoir in the study network, and EIO was conducted from the other two reservoirs. The scenarios are presented in
Table 3. To simulate a water suspension reservoir, the source pipe was changed to the closed state to block the water supply, and the hypothetical valves of the emergency pipes were opened for EIO from the adjacent reservoirs. Two different demand conditions are considered that represent normal and peak consumption time. These different conditions are to examine how FMPM results change over time.
4. Results
4.1. Setting Variables for the Fuzzy Large Membership Function
The fuzzy large membership function presented in
Section 2 was used to calculate FMPM at each node. By adjusting the spread
and midpoint
, PIs were developed to reflect the consumer satisfaction.
is proportional to the sensitivity of consumers to changes in the available supply against demand, and
is inversely proportional to consumer optimism. The values of the FMPM were calculated in the range of 0 to 1, and they represented the level of satisfaction considering usability by the consumers.
Table 4 presents three variable combinations that were considered to assess the EIO performance of the study network from various viewpoints.
Figure 3 graphs the proposed variable combinations. C1 represented consumers with the most positive satisfaction, who showed 100% satisfaction even when the supply was only 20% of the demand (
Table 4). C3 represented consumers with the most negative satisfaction, who showed the lowest satisfaction even when the supply was 70% of the demand.
4.2. Six Different Scenarios
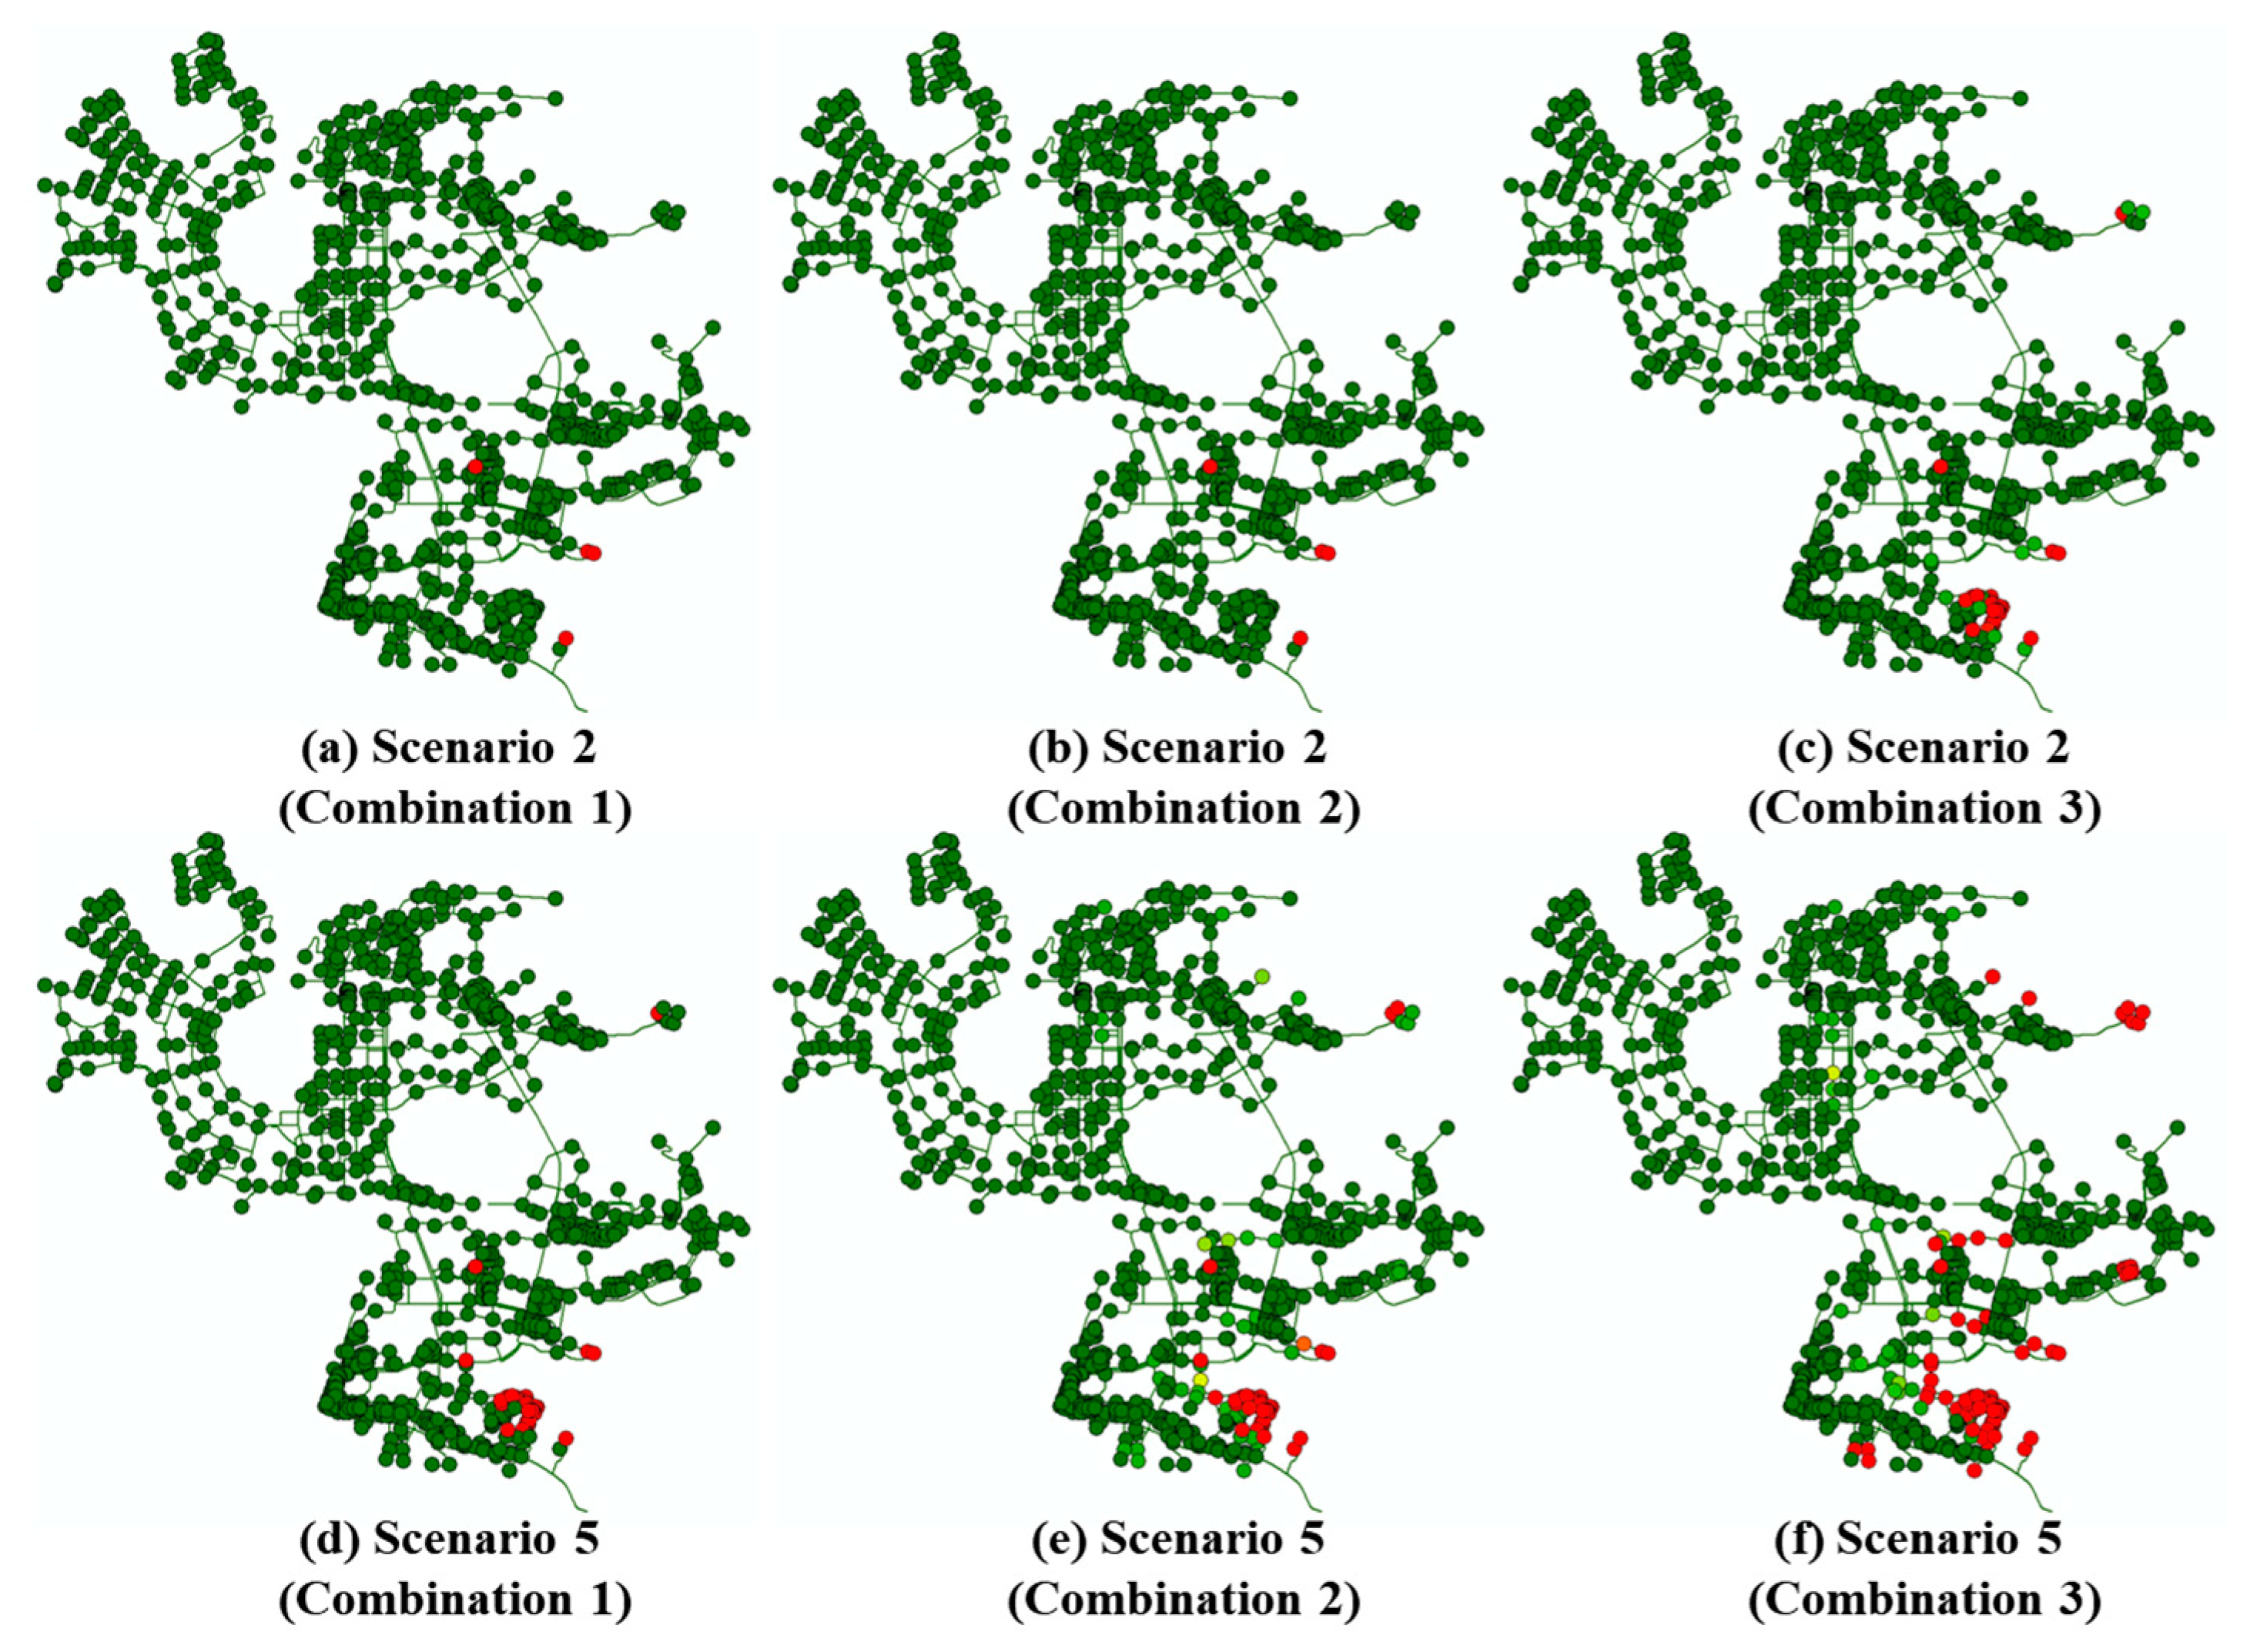
FMPM was used to assess the EIO performance of the study network in six different scenarios (S1–S6). In each scenario, one block was assumed to be under emergency water supply conditions (i.e., no water supply from the corresponding source), and the block was supplied from the other two sources. Two different times were considered to assess the FMPM behavior under different demand conditions: normal (7:00) and peak demand (8:00) (
Table 3). FMPM values were calculated for each node based on the simulation results with the A-PDA model and represented the consumer satisfaction with water usability. These values were mapped onto the study network based on the color scheme presented in
Table 1 (green represents high consumer satisfaction, while red shows the opposite).
Figure 4 shows the FMPM results for S1 and S4, where RES1 was under emergency supply conditions and the demands of Block 1 were supplied from RES2 and RES3 through EIO. The FMPM values ranged from 0 to 1, and the supply performance for each node was mapped according to the color scheme. Red nodes were very poorly supplied, while green nodes indicated satisfied consumers. This FMPM color mapping approach helps visualize the available supply for each area and assess the EIO performance in spatial terms. Moreover, blocks urgently requiring an additional water supply can be easily recognized in real time. This approach not only provides better WDS O&M planning in emergency conditions but also can help increase the resilience of the system by minimizing damage within a short time.
For both S1 and S4, the number of poorly supplied nodes of Block 1 dramatically increased when the consumer satisfaction changed from optimistic to pessimistic (i.e., C1 to C3). The satisfaction of consumers with the available water supply differed depending on their satisfaction toward water availability.
Figure 4 shows that optimistic consumers exhibited a high level of satisfaction even with a lower supply–demand ratio, whereas pessimistic consumers showed a significant reduction in satisfaction even if the supply–demand ratio decreased only slightly. This suggests that the FMPM value may differ greatly depending on the consumers satisfaction even at the same supply–demand ratio. Nodes with a significantly higher or lower supply–demand ratio showed little change with different variable combinations. However, nodes with a limited available supply–demand ratio depending on the pressure (i.e., boundary area between Block 1 and Block 2) showed changes in the FMPM value depending on the combinations. FMPM can be used to identify easily differences in consumer satisfaction to the water supply. This information can help WDS operators prioritize specific areas where civil complaints or petitions occur frequently.
The comparison of S1 and S4 shows different FMPM patterns according to the WDS demand condition. For C1, the FMPM pattern showed almost no changes with different demand conditions. A large number of nodes in Block 1 showed a change in FMPM as the demand increased. Under peak demand conditions, larger head losses occurred because more water flowed in the pipes and provided lower pressure. The reduction in available water supply reduced consumer satisfaction.
Figure 4 shows a bigger change in the FMPM pattern for pessimistic consumers as the demand conditions changed. Therefore, areas with more pessimistic consumers should be prioritized to improve the EIO performance.
Figure 5 shows that unlike S1 and S4, only a few nodes showed a decrease in FMPM when RES2 was under emergency conditions (
Figure 5). This is because Block 2 has a much lower elevation than the adjacent blocks (
Figure 2). This helped consumers in Block 2 receive water with a high satisfaction level from the sources of neighboring blocks when its supply source failed. Interestingly, some consumers in Block 1 had lower satisfaction with the water supply compared with consumers in Block 2 even though the problem was not in their block. Since much of the demand in Block 2 was provided from RES1 owing to the large elevation difference, a cascading effect occurred where some locations in Block 1 suffered water supply problems owing to the emergency conditions in the adjacent block. The cascading effect became more significant as the demand of each node increased and consumers became more pessimistic.
When RES3 failed to supply enough water and EIO took place, some nodes in Block 3 had a small FMPM, especially those at higher elevations (
Figure 6). If water is supplied with a similar energy head, the pressure head is smaller for nodes with a larger elevation head. A similar supply–demand ratio for an individual node with a lower nodal pressure results in a smaller FMPM. Therefore, for a WDS with significant differences in elevation, consumers at high elevations should be prioritized over those at low elevations.
4.3. Performance Measure under Emergency Operation
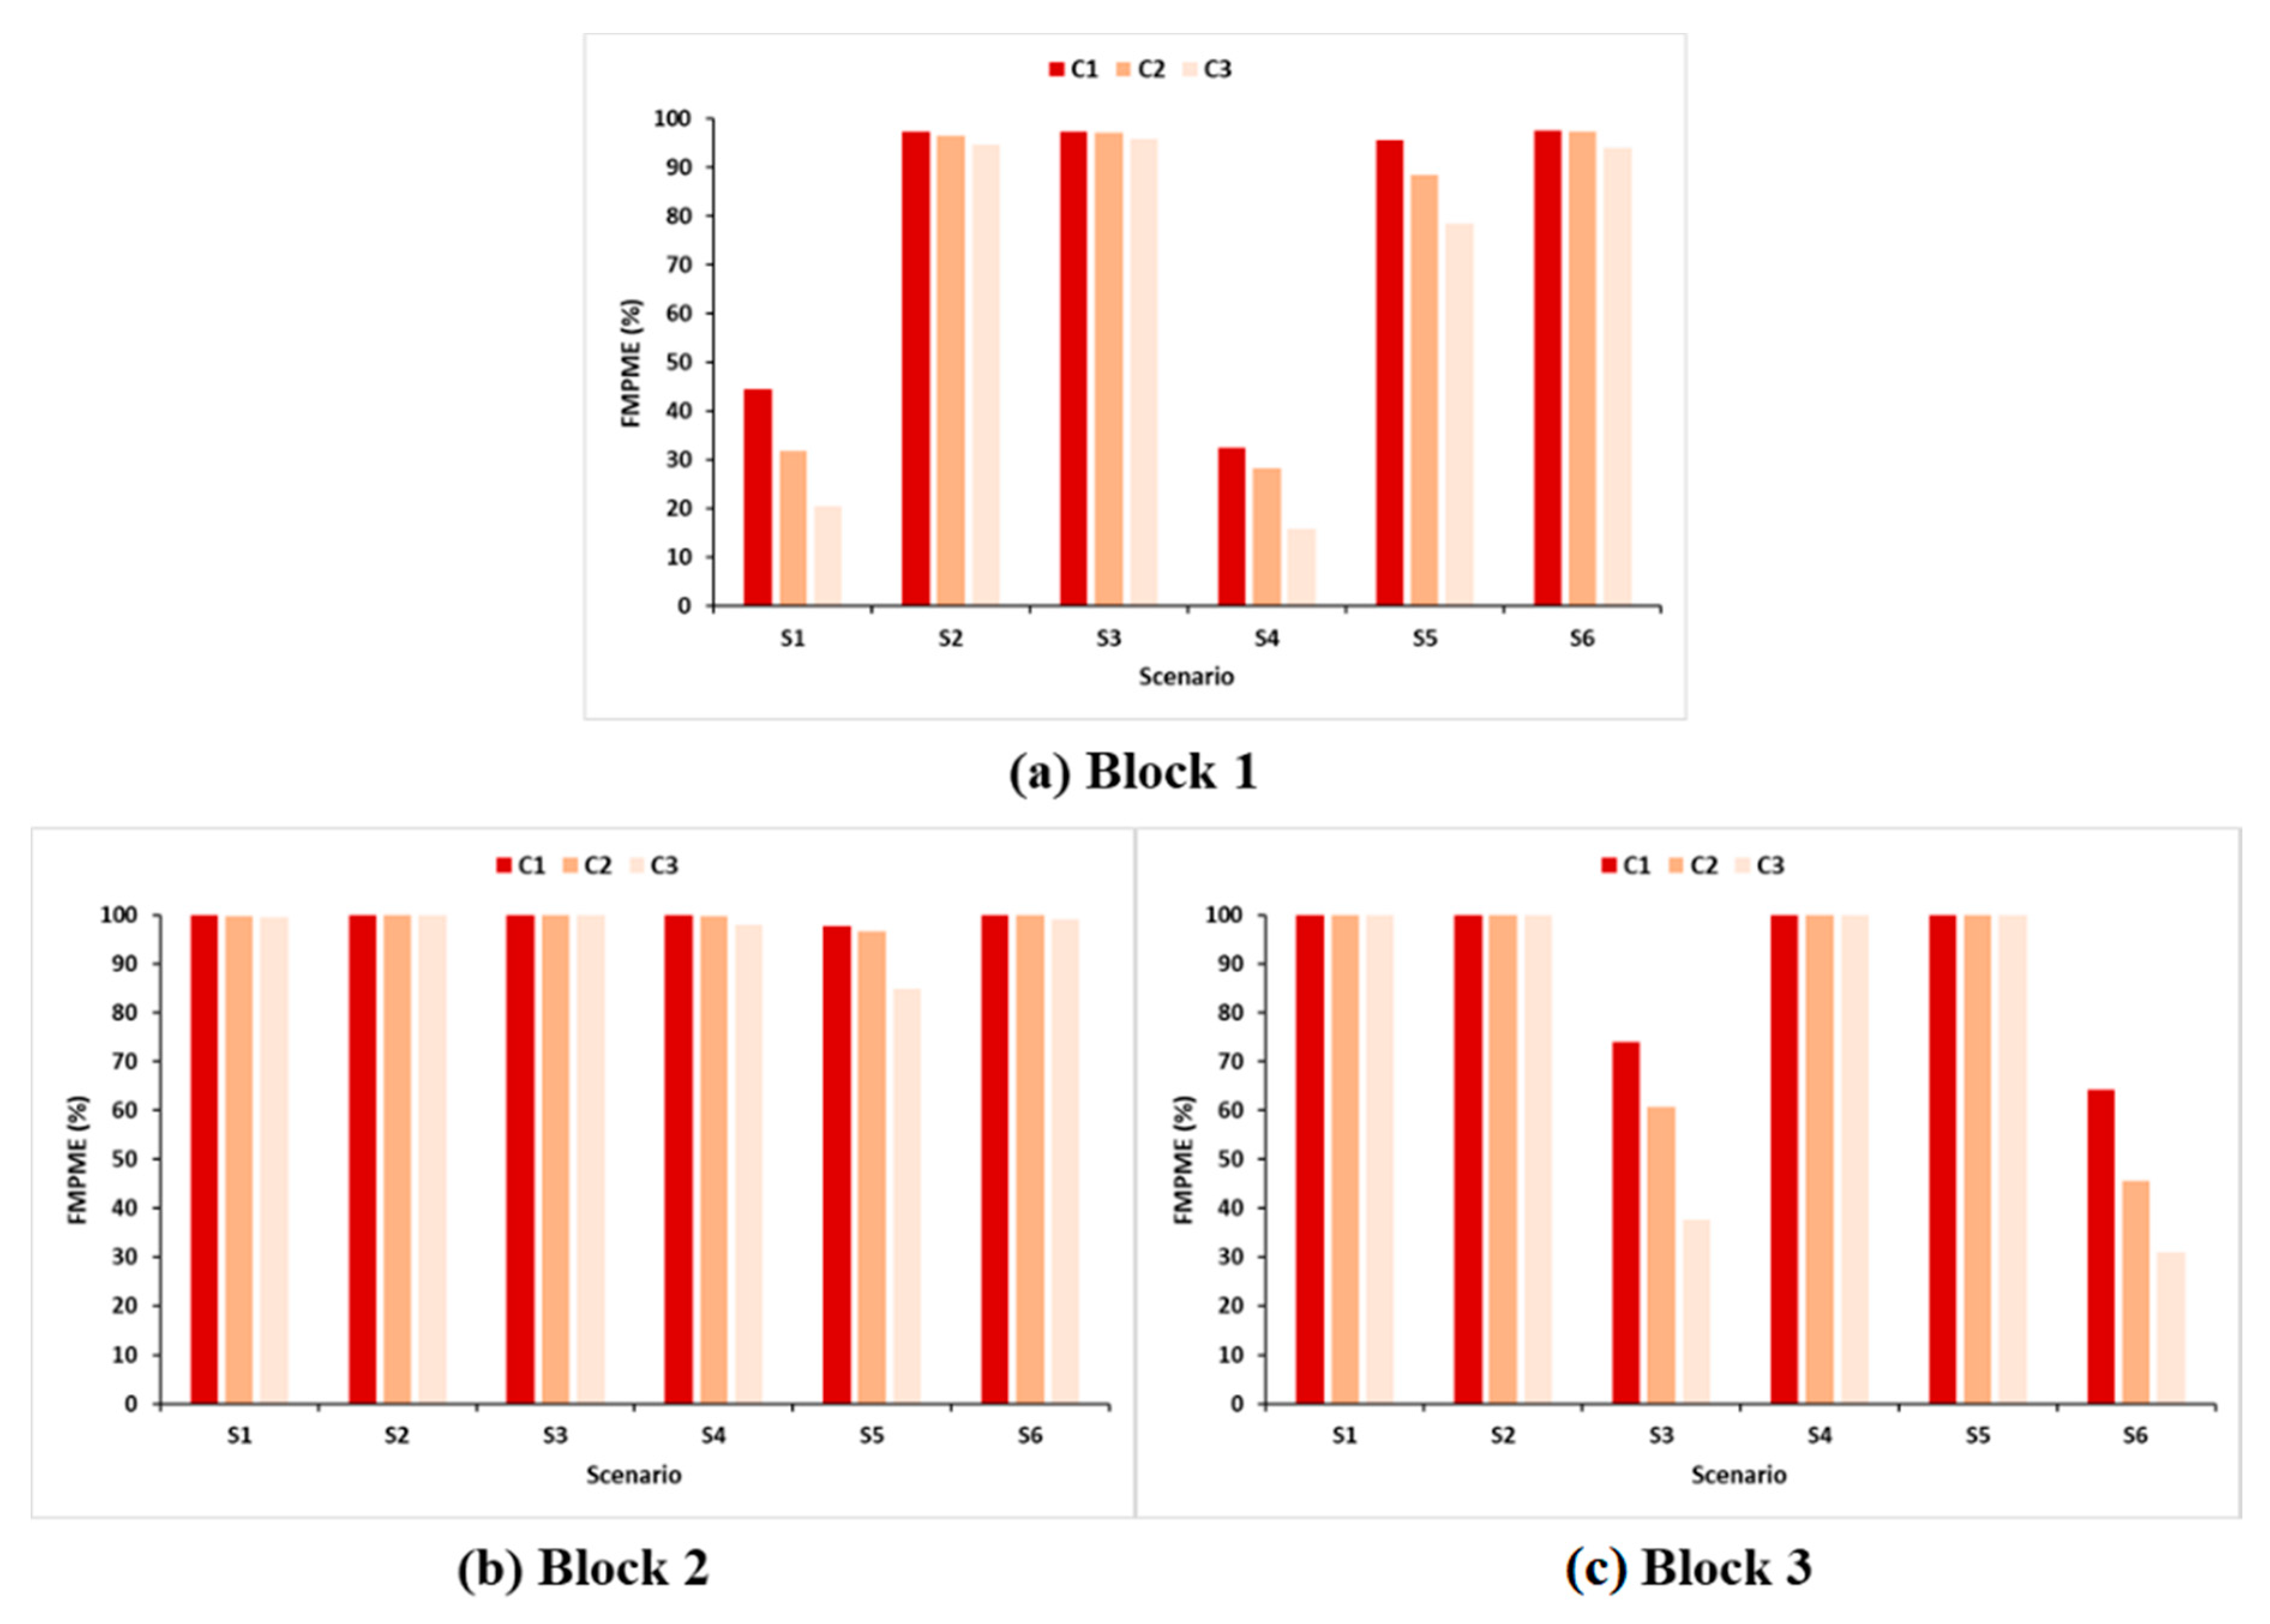
FMPME values were calculated for different scenarios to assess the EIO performance when a block was under emergency water supply conditions.
Table 5 presents the FMPME results for each scenario with different blocks and combinations.
As discussed in
Section 4.2, a significant cascading effect occurred in Block 1 for all scenarios. Since all nodes in Block 1 had a much higher elevation than those in Block 2 and Block 3, RES1 was more likely to supply water to areas where their source failed. For example, if RES3 was under emergency water supply conditions, RES1 supplied more water than RES2, even though the latter was closer to RES3. This is demonstrated by the FMPME results for S3 and S6. Block 1 had a smaller FMPME than Block 2, even though it was not adjacent to Block 3. The higher elevation of Block 1 led RES1 to supply water to Block 3, which reduced the satisfaction of its own consumers. The cascading effect was also observed for S2 and S5; only RES1 provided EIO for Block 2, and no support was provided from Block 3 (FMPME of Block 3 was 100% when its source was operating normally). This clearly demonstrates that reservoirs at higher elevations are more responsible for WDS EIO. Therefore, to improve the satisfaction with the water supply (i.e., increase FMPM) under emergency water supply conditions, an energy head can be added to the reservoir (e.g., install operating pumps) to increase the available supply Equation (1).
Figure 7 shows the changes in FMPME for each block in all scenarios. As noted earlier, the FMPME of Block 1 changed in all scenarios and decreased dramatically when the supply source failed. RES1 was at a high elevation, which resulted in a large difference in satisfaction as the consumer satisfaction become more pessimistic. In contrast, the FMPME remained the same for Block 2 in almost all scenarios except for S5. Block 2 was at a much lower elevation than the adjacent blocks, and consumers still received a satisfactory supply even when their reservoir failed. Instead, some consumers in Block 1 suffered because of the cascading effect. Since consumers in Block 1 can be dissatisfied with this effect, the operator of Block 2 may want to compensate and help Block 1.
4.4. Performance Measure under Normal Operation
The FMPME values were calculated without EIO when a block was under emergency water supply conditions. The absolute difference in FMPME with and without EIO was calculated for each block, as presented in
Table 6.
In Block 2, the FMPME was nearly 100% with EIO in all scenarios except for S5, while the satisfaction level with the water supply changed dramatically without EIO. This indicates the effectiveness of EIO, which increased the FMPME in areas where the supply source failed. In S2, decreasing the FMPME for Block 1 by 5% helped supply consumers in Block 2 very well with EIO. Without EIO, the highly satisfactory supply was not provided, and FMPME decreased to about 20%. These big changes in FMPME were observed for all scenarios. Therefore, EIO is essential for minimizing the severity of supply failure due to emergency water supply conditions and supplying consumers very well. This will also help increase the resilience of a WDS under other abnormal conditions (e.g., pipe burst, fire flow).
5. Summary and Conclusions
In this study, a new performance indicator was developed for a water distribution system that is called FMPM to assess the EIO performance under emergency water supply conditions. The indicator is calculated with a fuzzy large membership function to consider different consumer satisfaction (i.e., the degree of consumer satisfaction with the supplied demand). The variables (, ) of the function can be set to different values to reflect a more optimistic or pessimistic satisfaction. FMPM was calculated with an advanced network simulation technique, which is more appropriate than other hydraulic analysis models for simulating abnormal conditions (e.g., suspended water supply). In addition, a color mapping approach was introduced that maps the system with colors representing FMPM. FMPM was applied to assessing six different scenarios under two demand conditions (normal and peak demand) and three emergency water supply conditions for the A city network in South Korea. Three different combinations of fuzzy large membership function variables were considered to investigate the effect of consumer satisfaction on FMPM. The major findings are as follows.
First, the impact of different consumer satisfaction with the water supply was examined. With more pessimistic consumers, poorly supplied areas showed a dramatic increase in FMPM for the same scenario. Compared to optimistic consumers, a small change in the available supply significantly decreased the FMPM of pessimistic consumers. Therefore, areas with frequent complaints should be prioritized to improve the EIO performance.
Then, the cascading effect was analyzed, where a block not under emergency conditions suffered from a less satisfactory supply because of EIO with adjacent areas. The blocks in the study network had different hydraulic features; the center area had an extremely low elevation, while the elevation increased toward the east and west. This big difference in elevations caused some high-elevation areas to be poorly supplied even though their reservoir was operating normally, while low-elevation areas experienced no stress under emergency conditions. This cascading effect became more significant as the node demands increased and consumers became more pessimistic.
Finally, the effectiveness of EIO was investigated by comparing the FMPM results with and without this countermeasure. The cascading effect due to EIO reduced the FMPM in some areas, but the decrease was minor compared to the change in FMPM without EIO. Thus, EIO is clearly essential to minimize the performance degradation of a water distribution system under emergency conditions. Sacrificing some consumers’ satisfaction significantly helped prevent serious problems for others (e.g., long-term suspension of the water supply).
In order to apply the proposed fuzzy-function-based performance indicator in practice, a utility first needs to determine the shape of the fuzzy function used, i.e., the function’s parameters, which could be derived from a survey of customers in the service area from different socio-economic groups and service areas. Note that the proposed performance indicator and visualization method can be applied to any network.
This study had several limitations that should be addressed in future research. First, the correlation between the cascading effect and network characteristics (e.g., average pipe length, average pipe diameter) of each block can be examined. Second, other types of emergency water supply conditions, such as a suspended water supply at smaller spatial scales (e.g., a segment) and fire flow condition, can be considered and compared to the results of reservoir supply suspension.


