1. Introduction
Fat, oil, and grease (FOG) in wastewater are discharged from restaurants and food processing factories. FOG impacts the performance of wastewater treatment facilities [
1], and the treated wastewater quality. Furthermore, FOG causes blockages in sewer and sewer pipes. Recently, a severe problem of blockage of the sewer pipes was observed by FOG deposits in London [
2]. The direct discharge of FOG into wastewater sewage is not permitted in most municipalities. Specifically, 30 mg/L or less in Japan and 60 mg/L or less in Singapore are the regulations for oil contamination of wastewater. Therefore, it is imperative to reduce the concentration of animal fats and vegetable oils in wastewater using grease traps and/or oil collecting equipment. A grease trap requires routine maintenance to sustain the adequate performance of the oil-water separation process. However, many grease traps are poorly maintained, resulting in costly repairs and health problems after a certain period [
3].
Sewer pipe blockage by FOG is significant concern around the world and requires extensive research on the FOG deposition from wastewater. The distance from the FOG sources to the deposition points in the lower sewer pipe is approximately 50 to 200 m. Besides, FOG deposits affect 25.0 to 37.5% of wastewater overflow in sewage [
4]. About 60% of sewer blockages in Hong Kong are caused by FOG deposits [
5]. In 2004, the U.S. Environmental Protection Agency (EPA) reported that approximately 3 to 10 billion gallons of untreated wastewater were discharged, and about 50% of sewage blockages are caused by FOG deposits in sewer pipes [
6]. Environmental problems have been reported due to FOG deposits on sewer pipes that are flushed away by heavy rain and drifted ashore to Tokyo Bay. In addition, if a business causes sewer blockage and can be identified, it must pay the required high cost of recovery. In this regard, sewer blockage by FOG deposits is a significant concern for Japanese businesses [
7]. Up to 70% of the sanitary sewage overflows that occur in Malaysia are caused by FOG. In 2010 alone, the wastewater municipality in Malaysia received a total of 22,184 blockage inquiries [
8]. The concentration of FOG in wastewater from restaurants in Thailand ranged from 730 to 1100 mg/L. Besides, this high concentration of FOG is from the effluents of fast-food restaurants [
9]. Oil and grease have been identified as the major components causing beach pollution in both Sydney and Cartagena de Indias [
10]. Thus, the problems and accidents involving sewer blockage due to FOG can occur anywhere in the world.
Moreover, very few research studies have been conducted to explain the mechanism of sewer pipe blockages due to the FOG deposition. According to the analytical results from the FOG samples, the main component was composed of high concentrations of palmitic acid and calcium [
4]. From the FOG characteristics, significant increases in the Ca
+ content are observed, and the proportion of oil in FOG deposits as water hardness increases [
11]. When 1 g oil was added to 1 L of calcium chloride solution at pH 9, FOG deposits were observed on the 28th day. Oil was converted to free fatty acids by alkali hydrolysis forming FOG deposits with Ca [
12]. The metal soap formation indicated the mechanism of blockages inside the sewer pipe due to FOG deposition, hydrolysis of natural fat, minerals in wastewater from concrete sewer pipes, and oxidants in the wastewater [
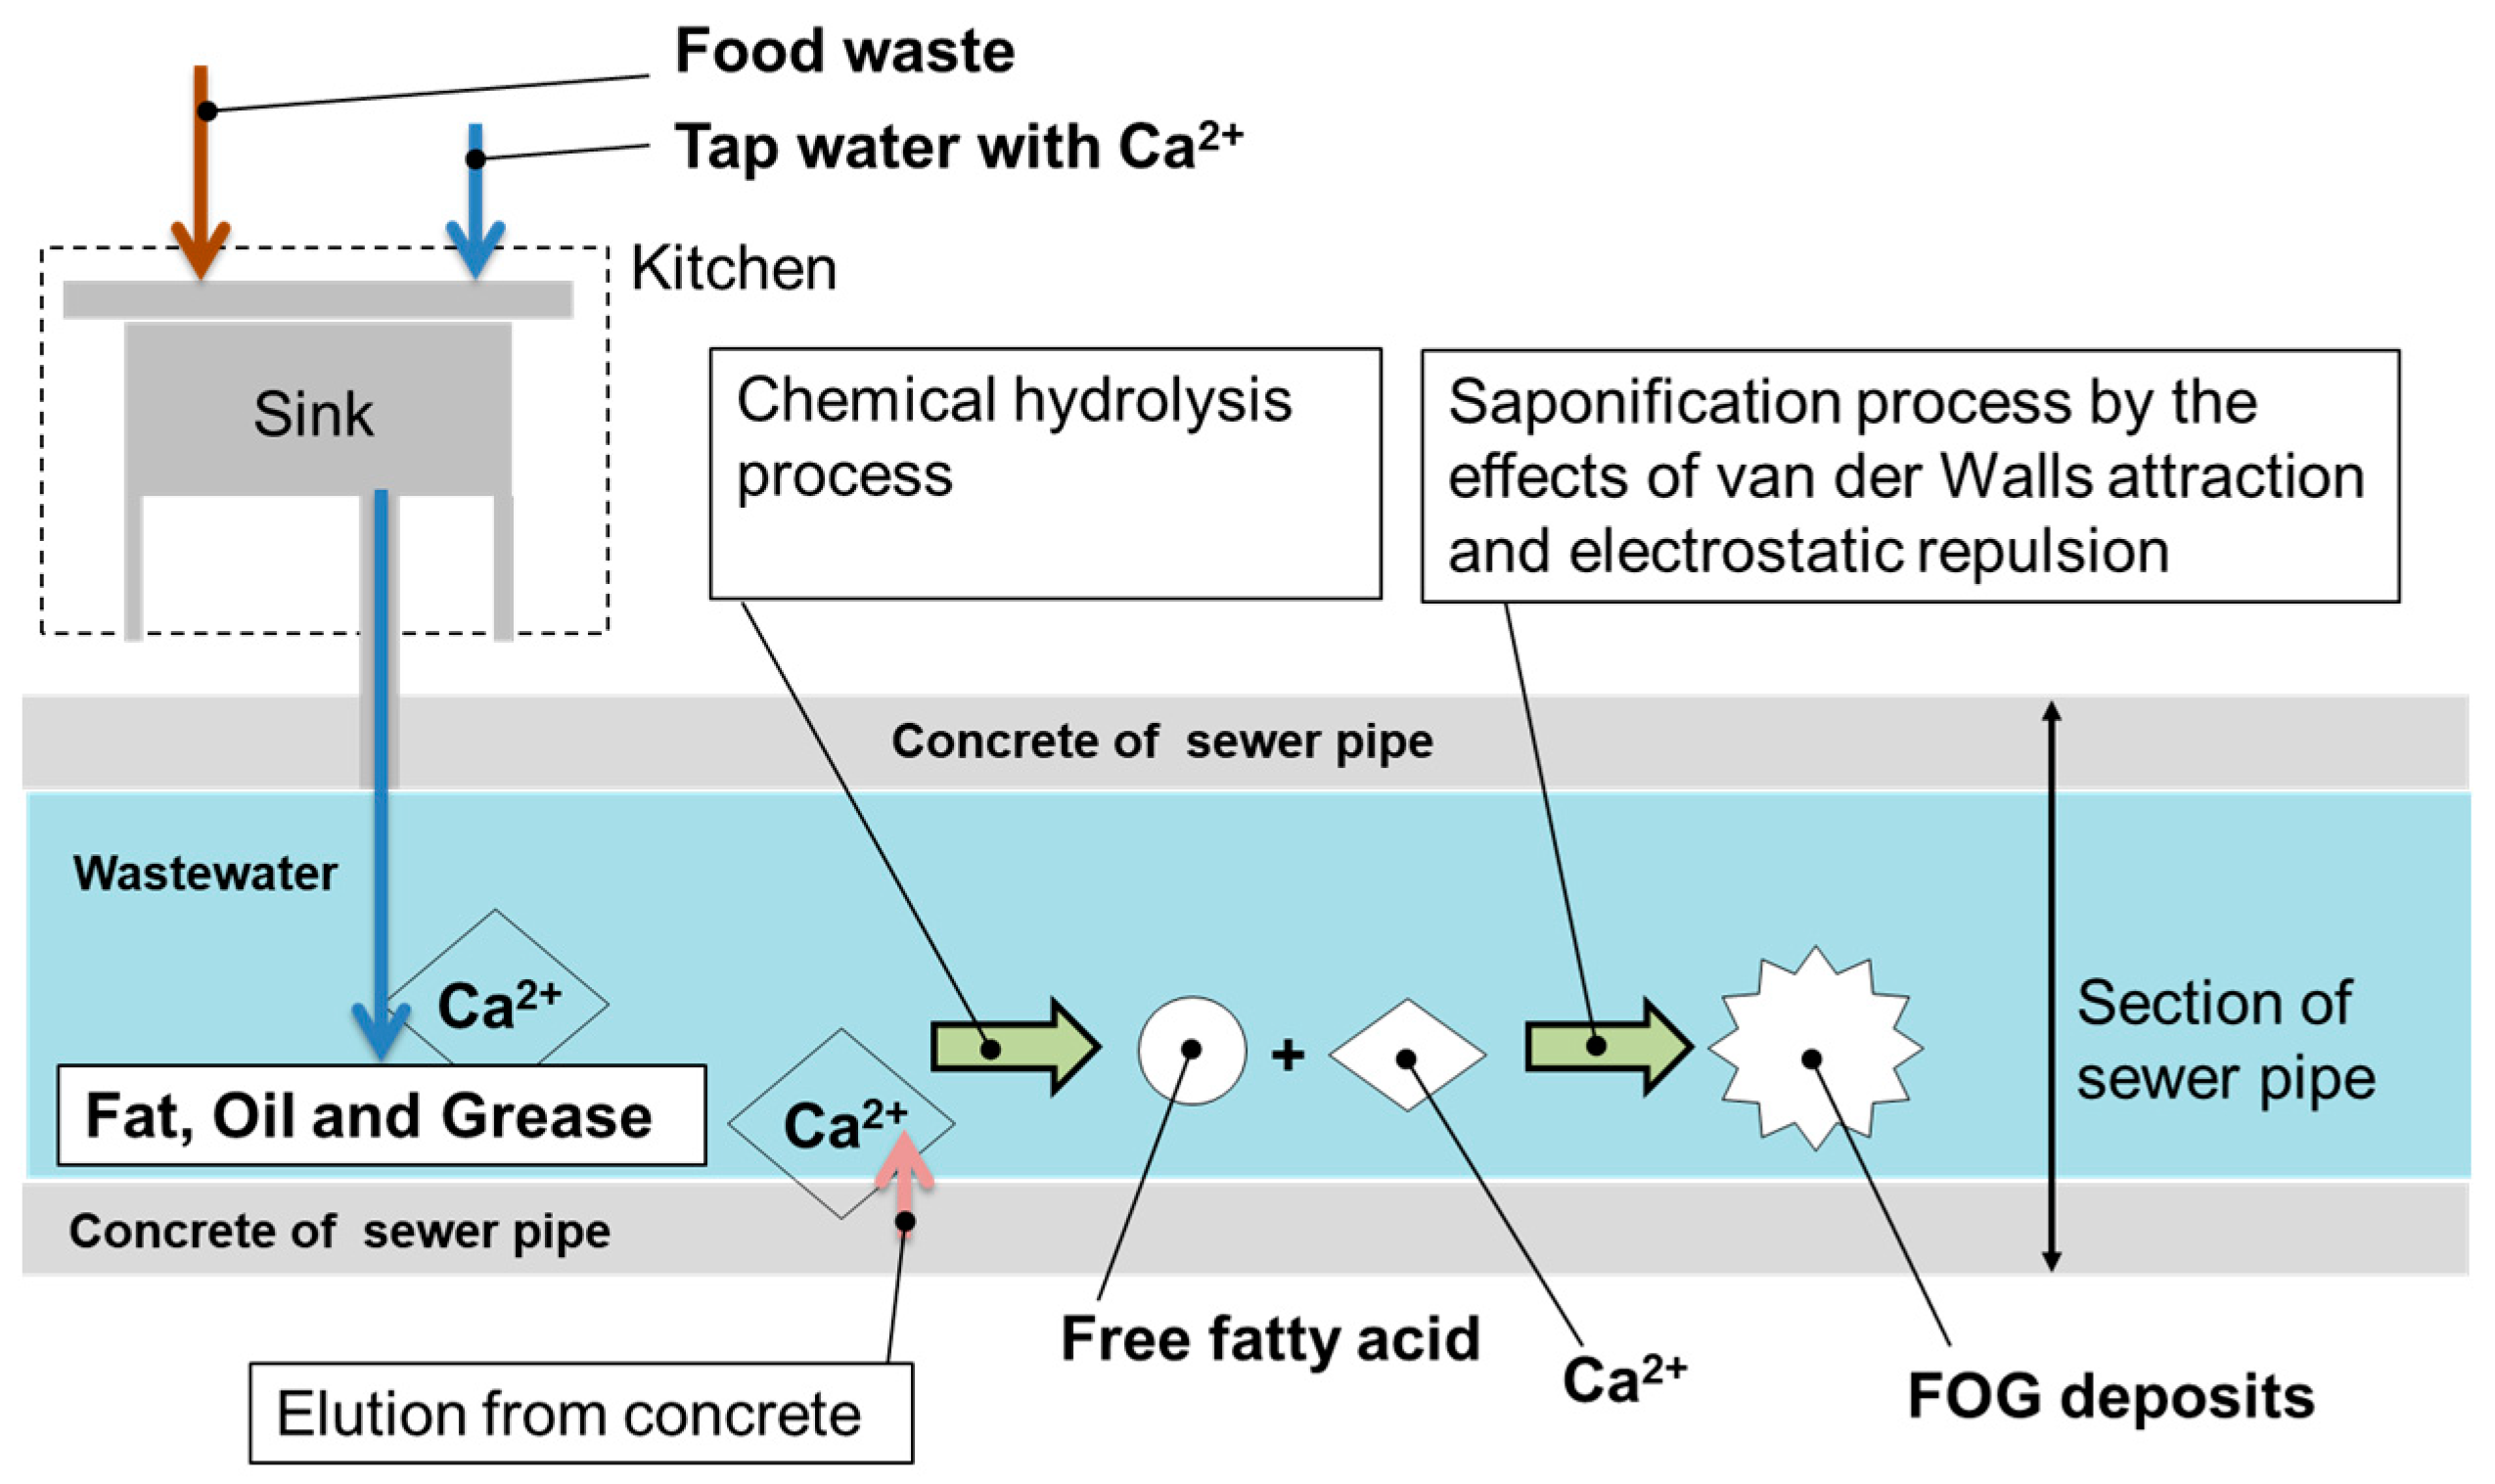
13]. Free fatty acids promote saponification (COO
−) discharged from the kitchen and calcium (Ca
2+) eluted from the concrete sewer, and the FOG deposit due to the effects of Van der Waals attraction and electrostatic repulsion. FOG deposits are reproduced by mixing the two major components (COO
− and Ca
2+) under laboratory conditions [
12]. The proposed mechanism of FOG deposit formation is shown in
Figure 1.
Wastewater discharges from restaurants and food processing factories have suspended solids (SS), including carbohydrates and proteins in addition to oil and fat. Alkaline detergents are also used in dishwashers. Organics or chemical substances such as detergents in wastewater are the main factors contributing to blockages in sewer pipes. There are multiple effects such as SS or oil and fat in wastewater, the velocity of wastewater, and the condition inside the wall of the sewer pipe. However, the blockage mechanism in the sewer pipe has not been elucidated accurately to enable the determination of a feasible solution. Previous studies have focused on understanding the phenomena related to blockage and dealing with individual physical-chemical and biological treatments. There is an urgent need to understand the blockage mechanism for new types of FOG and SS to find an effective solution for preventing blockage and wastewater treatment for food industries, fast food restaurants, and households.
Therefore, the purpose of this research is to determine the reason for blockage at the lab scale and clarify the mechanism of blockage formation in the sewer pipe due to FOG deposition and SS through wastewater flows from the viewpoint of physical and/or chemical conditions. This approach will help to quantify pipe blockage in the sewer by wastewater due to oil from restaurants or food processing factories. A blockage inside the sewer pipe can be understood to occur due to SS and FOG deposition as demonstrated using a simulated experiment of sewer pipe blockage with a reproducible diameter and inclination of the pipe, which is commonly used in the sewerage system in Japan.
2. Materials and Methods
2.1. Equipment for the Simulated Experiment of Sewer Pipe Blockage
FOG deposits, SS, wastewater temperature, wastewater speed, and microorganisms interact to cause blockage of sewer systems in kitchens, restaurants, and food factories. The simulated experiment for sewer pipe blockage was conducted using the artificial equipment involving sewer pipes to find the direct relationship between the interaction of FOG deposit and SS and the blockage in sewer pipes.
Transparent unplasticized polyvinyl chloride pipes (uPVC pipe,
ϕ = 50 mm) and 1% pipe inclination were used for the sewer pipes of the equipment. A screening mesh made of plastic with openings of 5 mm was set between the final parts of the sewer pipe to create blockages in the sewer pipe easily. The equipment was set up in an experimental room with a room temperature of 20 °C. A pump was installed to circulate the simulated wastewater in the equipment. The pump was operated intermittently, with a pumping-on time of 30 min and a pumping-off time of 30 min (total circulated volume 60 L/time). The experiment was performed at a velocity of 8 L/min for simulated wastewater. As a result, the velocity of the wastewater was too high to check the blockage in the sewer pipe. There was a possibility of blockage in the sewer pipe where the wastewater flow was weak. Previous studies have reported that the blockage in sewer pipes occurred at a point away from the FOG source [
4]. Hence, the adopted velocity of the simulated wastewater was 2 L/min. Four cameras were set to observe the flow of change for simulated wastewater in the sewer pipe (
Figure 2).
2.2. Combination of Simulated Wastewater
Tap water (SS concentration 0 mg/L, Ca
2+ concentration 18 mg/L, oil concentration 0 mg/L), lauric acid (C
12H
24O
2) as saturated and unsaturated fatty acids for FOG deposit and florisil as SS of vegetable scrap were used to prepare 20 L of simulated wastewater for the experiment. Lauric acid is also included in commercial detergents for dishwashers or soaps [
14].
Three types of simulated wastewater were used: Case L & F (lauric acid and florisil), Case F (florisil), and Case L (lauric acid). The concentrations of lauric acid and florisil were simulated in general kitchen wastewater using a disposer performance test in Japan [
15]. These concentrations were adjusted to 1000 mg/L lauric acid and 1750 mg/L florisil concentration. Ca
2+ was included in the tap water as a mineral. The temperature in simulated wastewater was maintained at 40 to 45 °C during the experiment. The reasons were that the melting point of lauric acid was approximately 45 °C, the simulated wastewater was supposed to be similar to kitchen wastewater from the restaurant, and according to our experience, kitchen wastewater has a temperature of approximately 40 °C. The temperature was maintained during the experiment using a small heater. Simulated wastewater is shown in
Table 1. The physical properties of lauric acid [
16] and florisil [
17] used in this experiment are shown in
Table 2.
2.3. Experimental Procedure to Simulate Sewer Pipe Blockage
The experimental conditions of the velocity or temperature of the simulated wastewater and other parameters are listed in
Table 3. There are cases where wastewater flows continuously in actual sites. Although the experiment was performed in batch type, the operation of the equipment was brought closer to the real site under the experimental conditions shown in
Table 3.
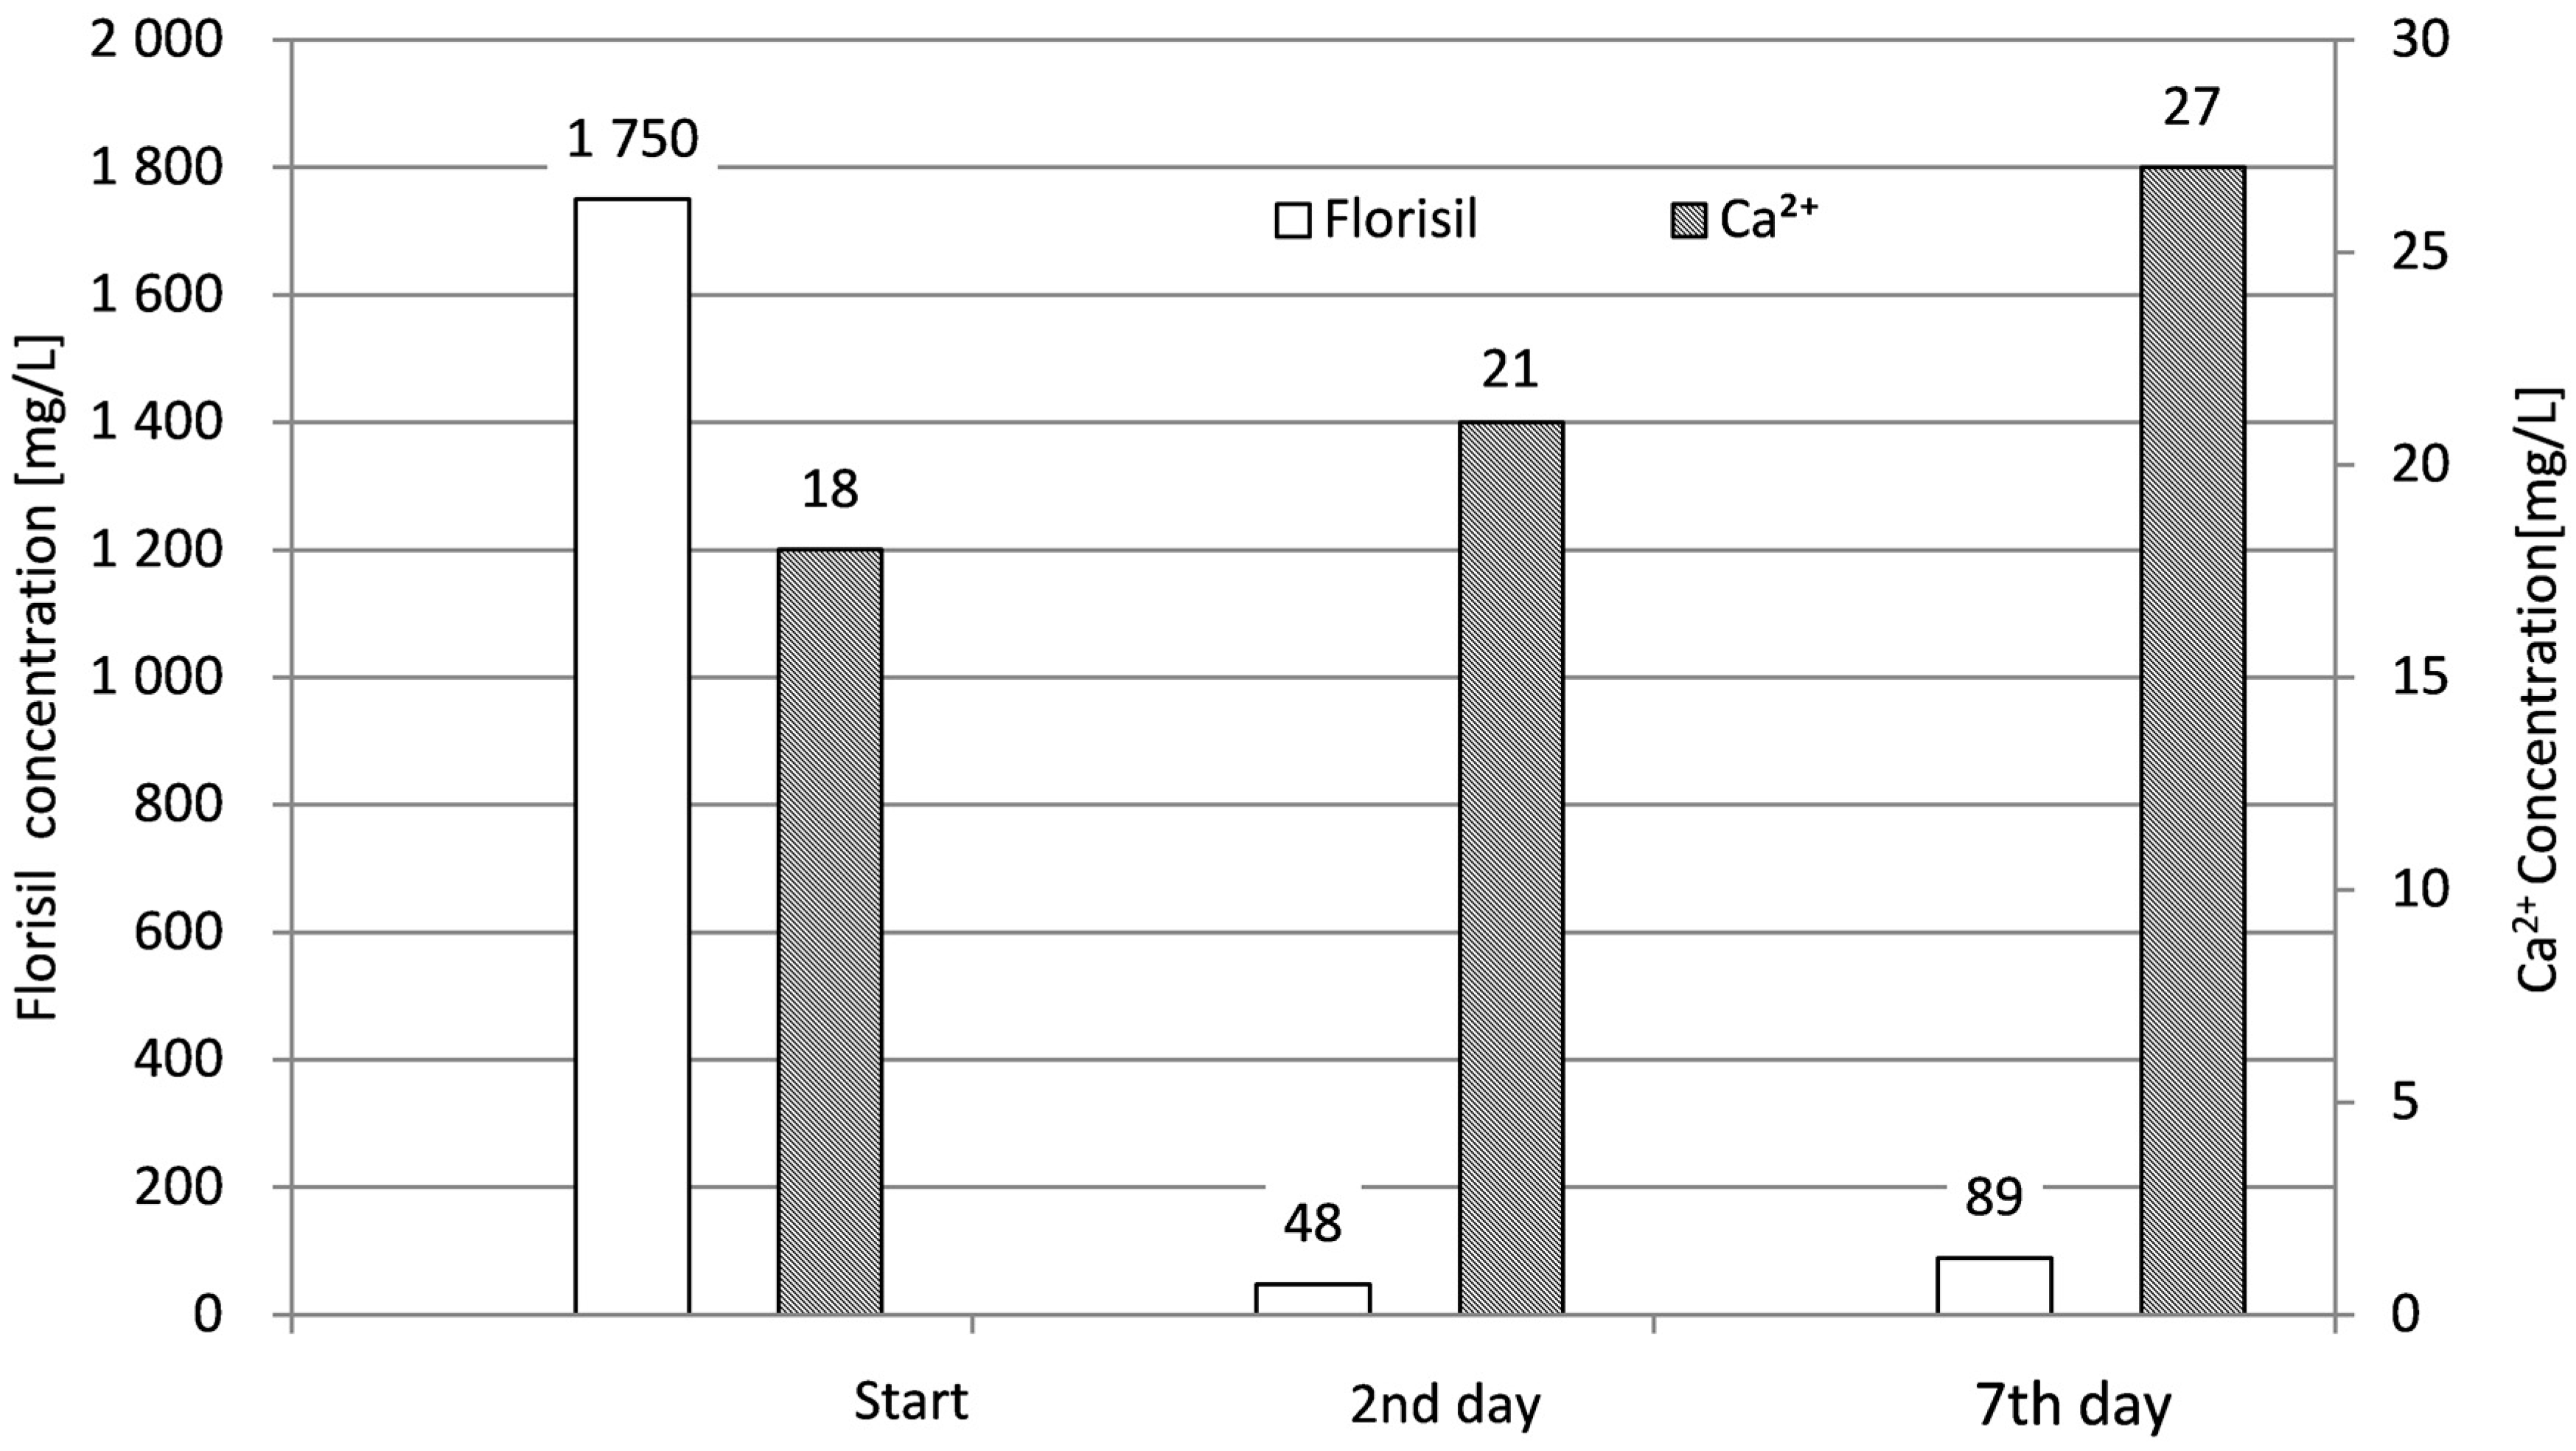
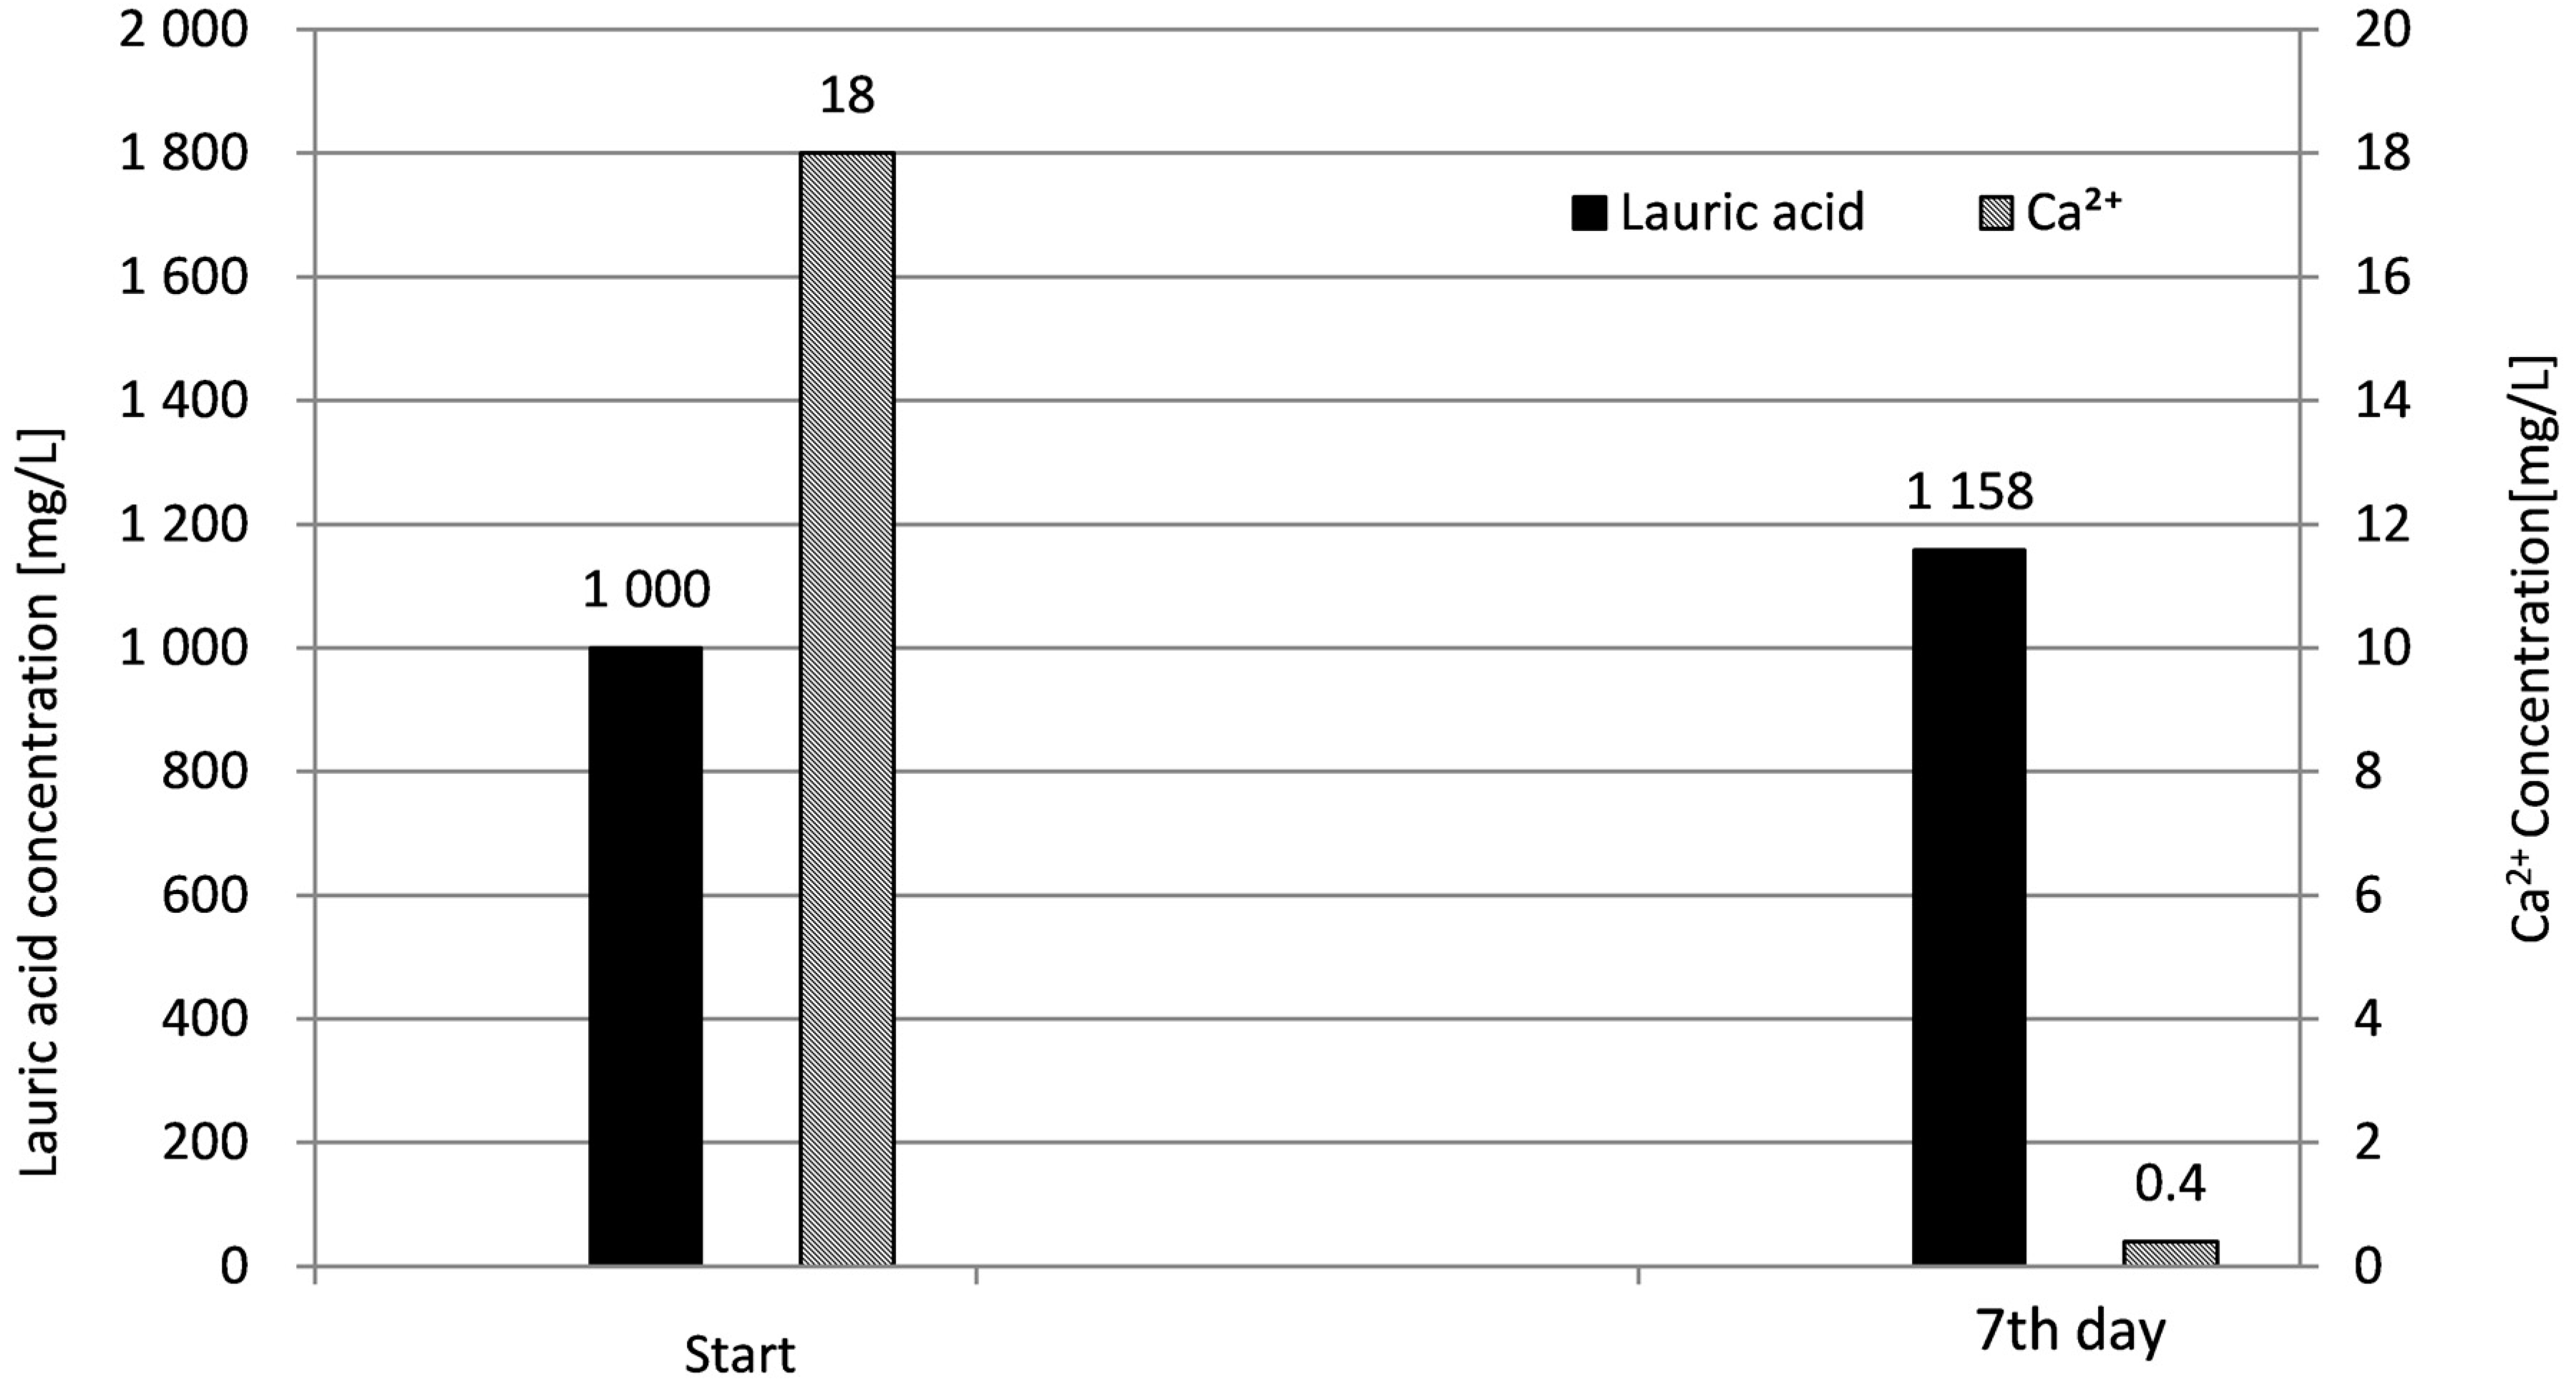
Seven days was set as the operating period. Images were taken at each 10 min interval to observe changes, deposition, and adhesion inside the sewer pipe. Low concentrations of lauric acid and florisil were reported for the wastewater quality on the 2nd day. During this period, the need to add lauric acid and florisil was assessed to cause a blockage. Then, lauric acid and florisil of additional half of the amount (lauric acid 10 g and florisil 17.5 g) were added into the wastewater on the 2nd day of the experiment. Besides, tap water was added until the amount of simulated wastewater reached 20 L to compensate for the evaporated wastewater. The concentrations of lauric acid, florisil, and Ca2+ were analyzed on the 1st, 2nd, and 7th day. FOG deposits were formed on the sewer pipe on the 5th day, and therefore the wastewater quality was not analyzed to consider how sampling affected the blockage. This experiment included water quality analysis and was performed twice to confirm the reproducibility of the findings.
The lauric acid concentration was analyzed by adding 60 mL of hexane to 1 L of simulated wastewater, stirring the simulated wastewater at 250 rpm for 10 min, extracting the hexane layer, and volatilizing hexane completely at 80 °C. The concentration was calculated by dividing the lauric acid weight by the amount of the sample. In the analysis of the concentration of florisil, 200 mL of simulated wastewater using glass fiber filter paper (pore size one μm), whose weight was measured, was filtered, and the filter paper was dried at 110 °C for 2 h and weighed again. The concentration was calculated by dividing the measured weight by the amount of sample water. The concentration of Ca2+ in tap water was measured by adding 2 mL of hydrochloric acid (1 + 1) to the simulated wastewater filtered using a membrane filter (pore size 0.45 μm), and then topping up the sample to 100 mL and adding 10 mL of lanthanum (La, 50 g/L). This solution was then analyzed by atomic absorption spectrometry.
4. Discussion
4.1. Discussion on the Experimental Results
Formation of FOG deposits by He et al. (2013) [
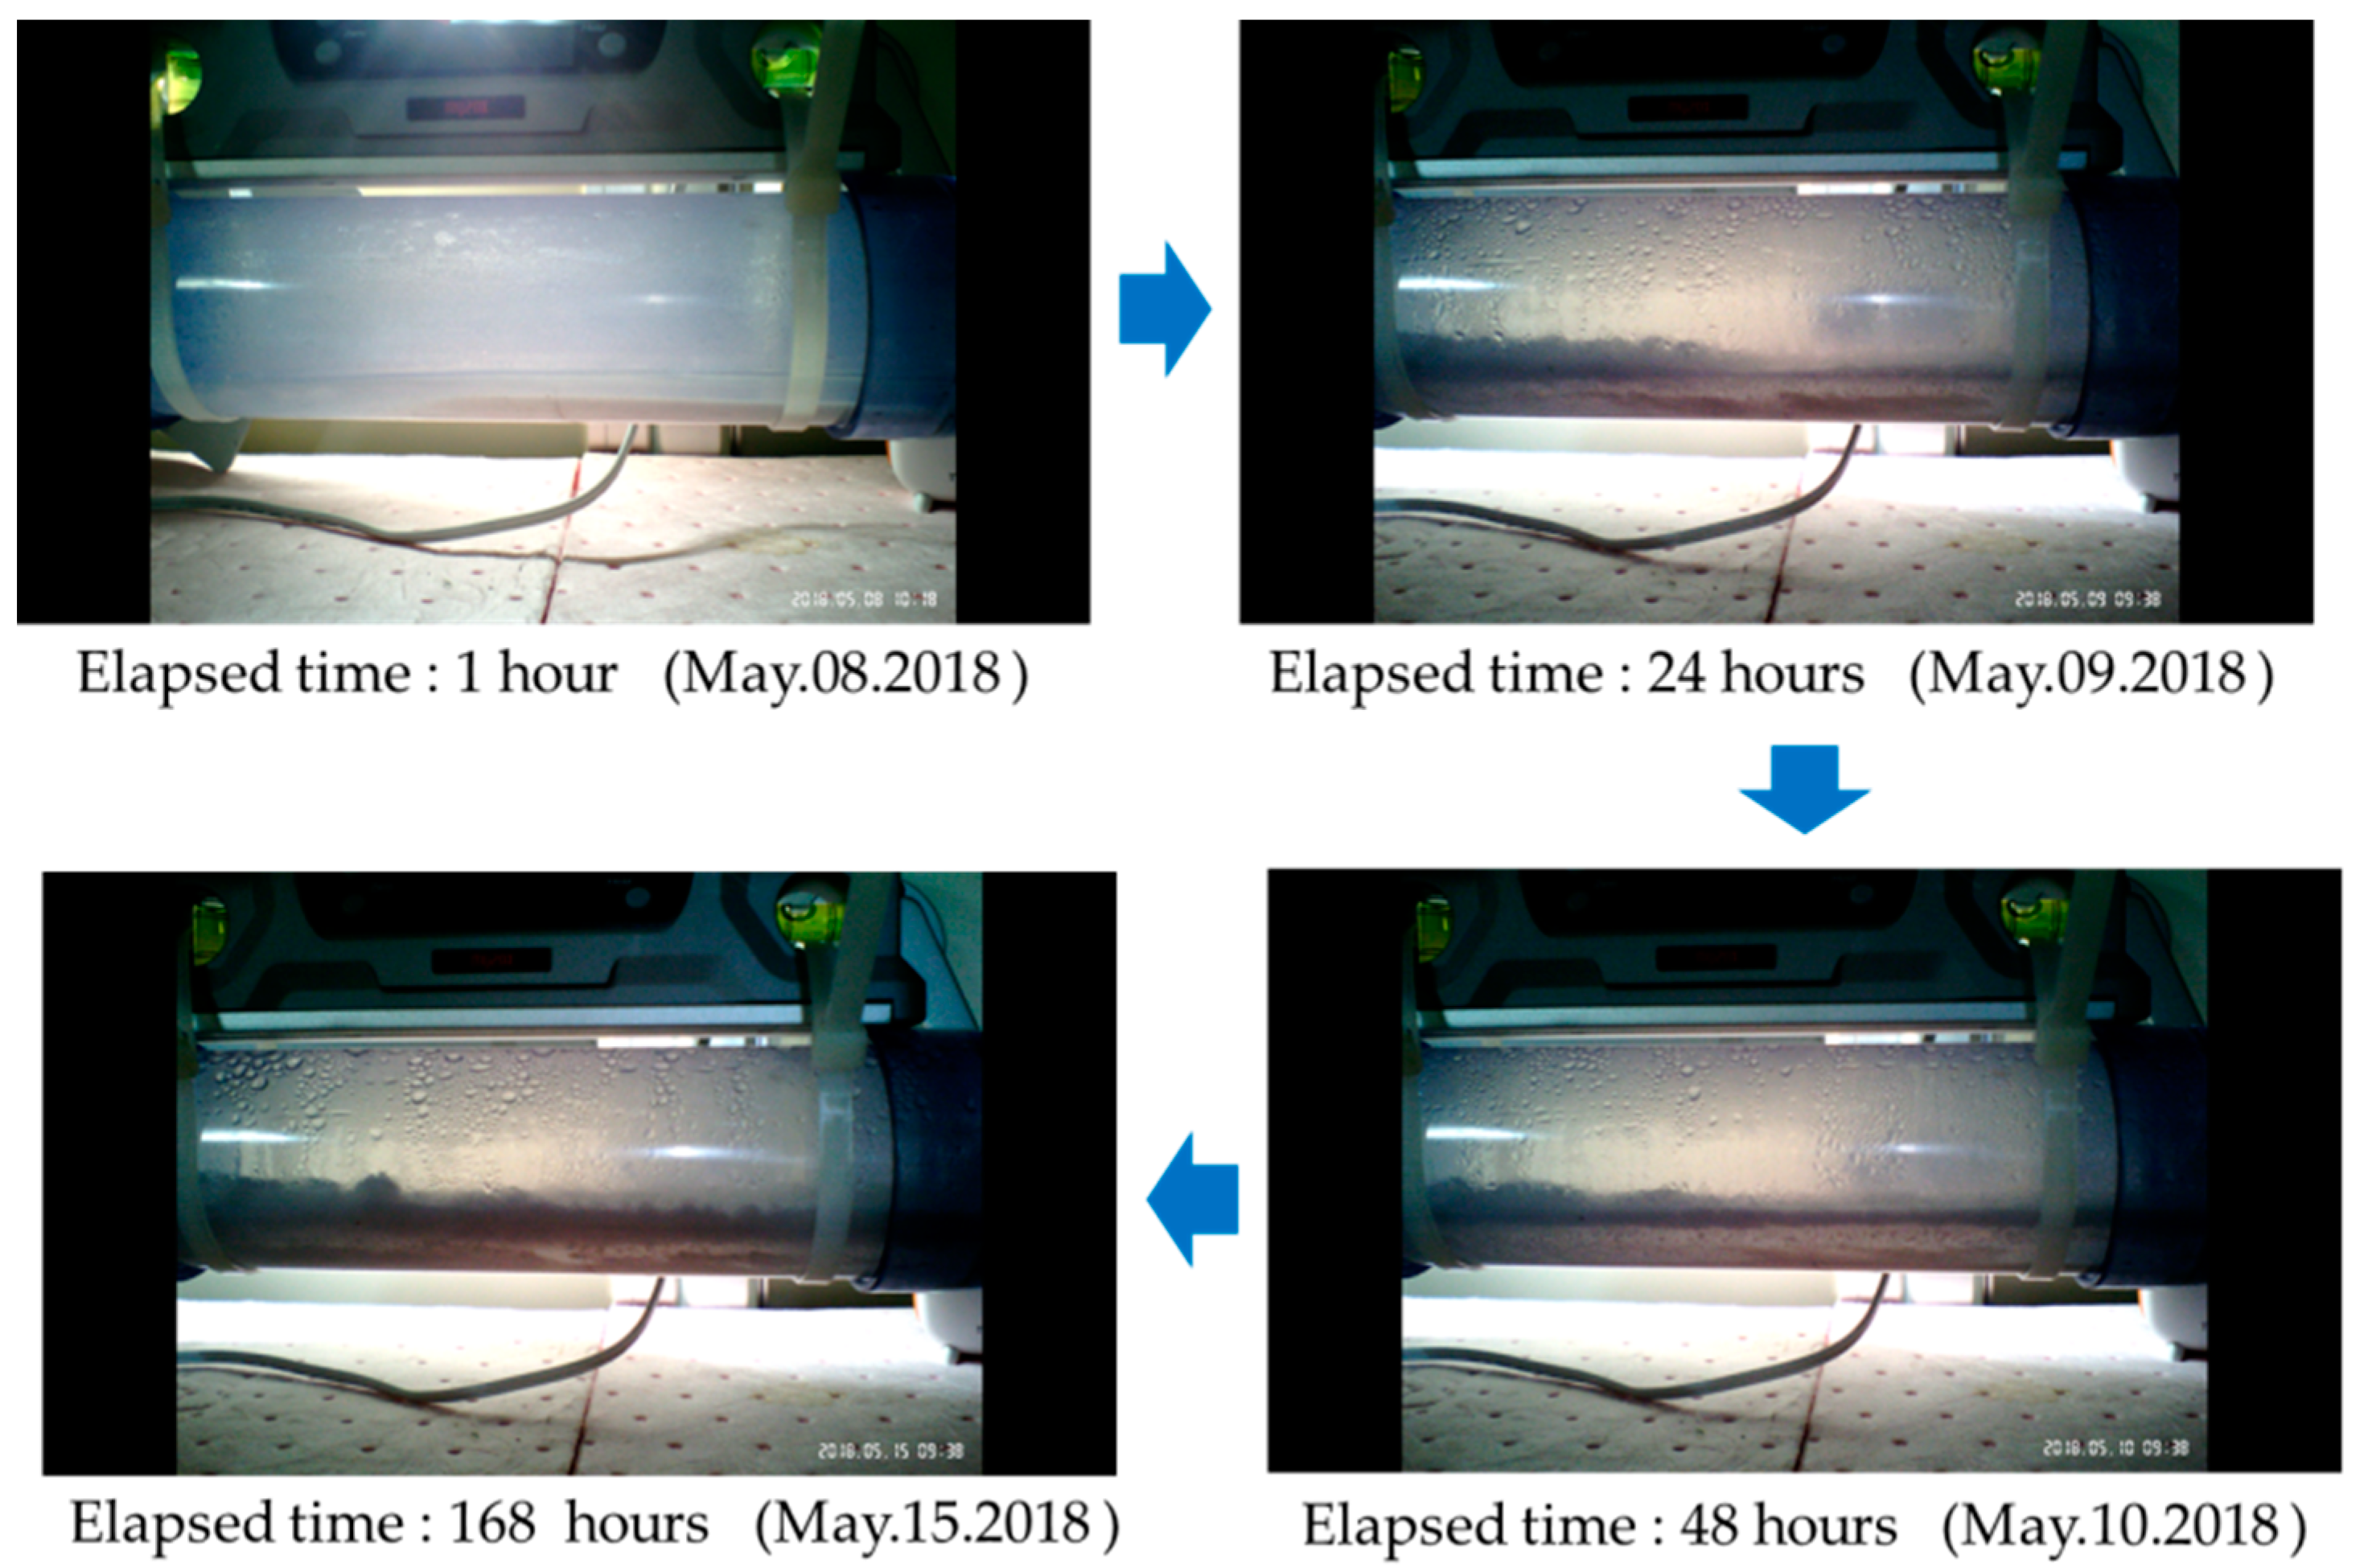
12] was confirmed after 2 days in the laboratory using the grease interceptor wastewater mixed with Ca concentration of 50 mg/L. The FOG deposition and FOG adhesion on the sewer pipe was observed 48 h after the start of the experiment. Therefore, the speed of formation of FOG deposits in this experiment was comparable with the result reported by He et al. (2011) [
18].
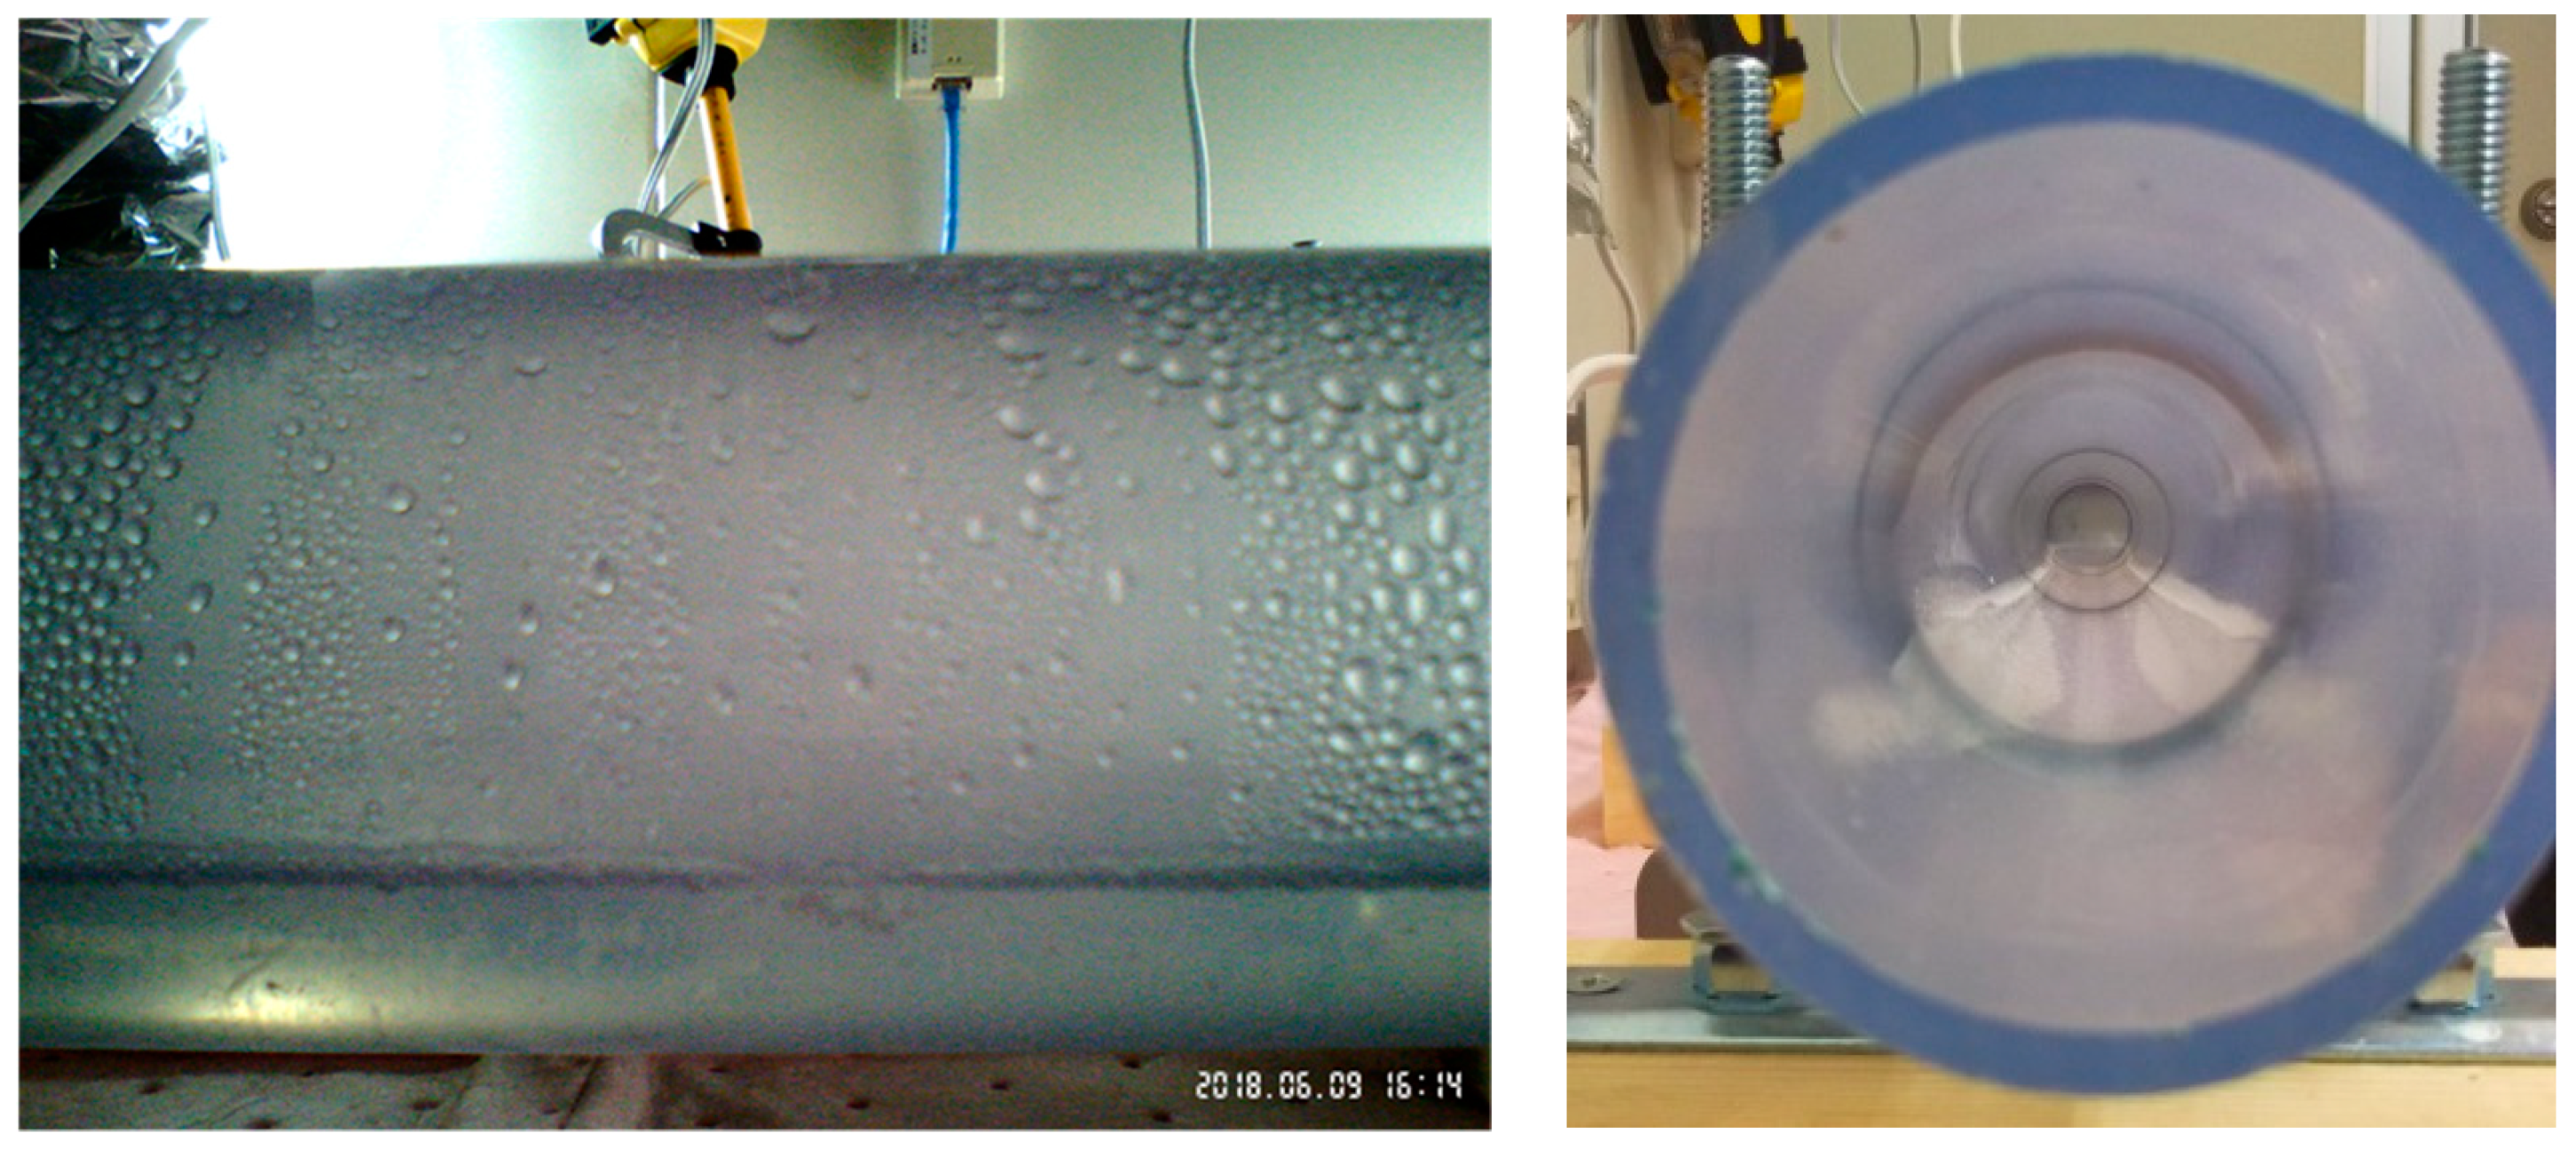
Clogging in the sewer pipe was observed in Case L & F and was not observed in Case L and Case F. FOG deposition and FOG adhesion in the pipe were observed at the points 2 and 4. On the other hand, at the observation point 3, FOG deposits were observed to adhere to the sidewall of the sewer pipe but did not form any deposits. The deposition of florisil at the bottom of the sewer pipe was observed before FOG deposition at the observation points 2 and 4. However, this was not observed at the point 3. Thus, the FOG deposits flowing were not caught by florisil and did not deposit at the bottom of the sewer pipe of observation point 3. The blockage was not observed when FOG deposits were not detected by florisil like Case L and observation point 3. From the above, solutions of blockage include removing SS before wastewater started flowing into the sewer pipe and/or introducing a new sewer pipe which can cancel SS deposit on the bottom.
Moreover, Case L & F was conducted twice, and the results of water quality and blockage in the sewer pipe were the same in both experiments. Therefore, this experiment was stable and showed reproducibility of the blockage in the sewer pipe.
Considering that the amount of water required for wastewater quality analysis affects the experimental results, the wastewater quality analysis was not performed each day during the experiment. However, an increase in the amount of FOG deposition was observed with progress of the time in Case L & F. Neither FOG deposition nor FOG adhesion on the pipe was observed on the 2nd day in Case L. However, a small amount of FOG deposition and FOG adhesion to the pipe was observed on the 7th day.
From the above, it was estimated that the saponification of lauric acid and Ca2+ proceeded over time, and the concentrations of lauric acid and Ca2+ gradually decreased. On the other hand, in Case F, since the deposition of florisil was observed immediately after the start of the experiment, it was estimated that the florisil concentration decreased shortly after the addition of florisil, and then became constant.
The evaporation of simulated wastewater was maintained between 40 and 45 °C, which led to an increase in the concentration of lauric acid, florisil, and Ca
2+. In the actual site, the temperature of kitchen wastewater flows at an approximate temperature of 40 °C or more and fatty acid, SS, and Ca
2+ are concentrated by the evaporation of wastewater in the sewer pipe. Therefore, wastewater temperature is a critical factor that influences the blockage in the sewer pipe. Moreover, fatty acids become more viscous as the temperature decreases [
19]. Therefore, in the vicinity of the wastewater source, the temperature of the wastewater did not decrease and the fatty acid had a low viscosity. However, away from the wastewater source, the temperature of the wastewater was dropped, and the viscosity of fatty acids increased, which made it easier for the fatty acids to adsorb on the SS and/or the side surfaces of sewer pipes, resulting in easier clogging.
4.2. Sewer Pipe Blockage Mechanism
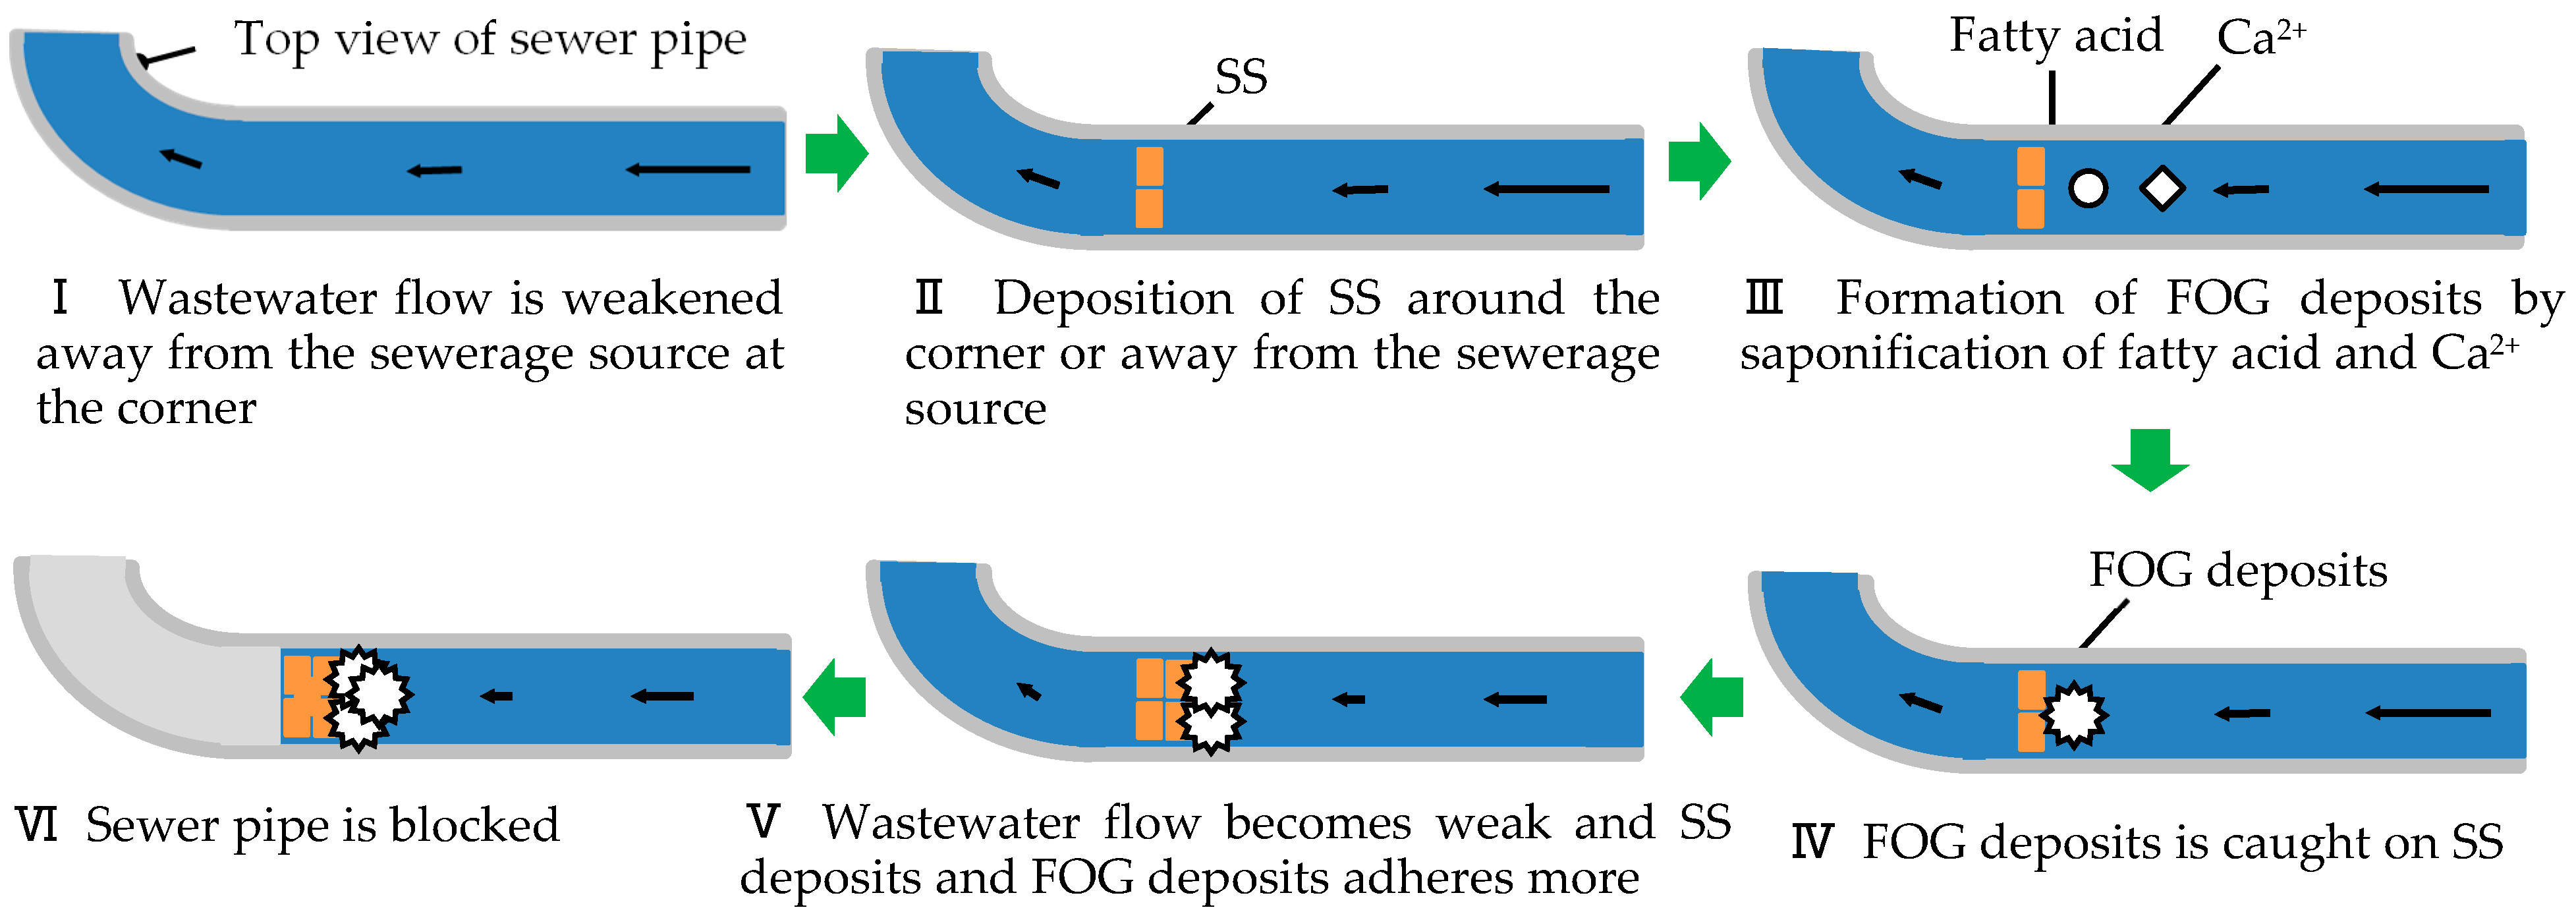
The blockage mechanism inside the sewer pipe by SS and FOG deposits from the saponification of fatty acids and Ca
2+ can be explained as follows: first, the water flow is weakened away from the sewerage source at the corners of the sewer pipe; second, SS is deposited because of the weakening of the flow; third, FOG depositions occur due to the saponification of fatty acid and Ca
2+ in wastewater; fourth, FOG deposition is accelerated due to catching on SS and adhering to the sewer pipe; and fifth, wastewater flow becomes weak, and deposition of SS and FOG adhesion increases. Finally, sewer pipe blockage occurs. The blockage mechanism in the sewer pipe is observed from experimental results as shown in
Figure 10.
From the experimental results, it was concluded that the blockage could be prevented by combining the three elements: lauric acid, Ca
2+, and florisil. It has been shown that the FOG deposits with the highest SS concentration had the highest oil content, and old sewers with gentle slopes have a possible accumulation of SS and/or FOG and contribute to their high concentrations in the wastewater [
11]. Therefore, the blockage mechanism observed in this experiment result can simulate blockage incidents and already reported by FOG deposits at the actual sites.
4.3. Future Subject
The approximate cost of restoration from the blockage of the sewer pipe is 1000 to 10,000 USD in Japan. Therefore, the economic losses for businesses and administrations is substantial. In this regard, understanding of the sewer pipe blockage mechanism is very important to improve these situations and decrease the additional cost for wastewater management.
In the actual sites, various factors such as the use of dish-washing detergents, changing of wastewater temperature, different particle size SS, and various types of fatty acids are acting in combination with each other. This experimental condition is the ideal condition consisting of a kind of fatty acid and SS, and it is only one of these factors thought to affect sewer pipe blockage. However, it is expected that the findings of this study will lead to the elucidation of the sewer pipe blockage mechanism occurring at the actual site.
