1. Introduction
Fish farming in the aquaculture industry is commonly done through cages. These are structures constituted by a buoyant frame that, afloat in the sea, supports a cell formed by nets in whose interior the species to be cultivated is confined. The exposure of the nets to the marine currents generates forces in the structure, and in the anchoring elements for structural stability. Likewise, the nets are forced by the flow, which influences their wear and increases the possibility of fish escape, whose effects can be harmful and irremediable in the ecosystem. The high impact that this represents, in terms of economic costs and environmental risks, has motivated a large number of investigations of numerical modeling and experimental work, to characterize the hydrodynamic forces that are generated due to the interaction of the flow with the nets [
1,
2,
3,
4,
5,
6,
7,
8].
The hydrodynamic forces of the flow on the nets are given, primarily, by the drag force. They are usually characterized in terms of the drag coefficient, which is a parameter that summarizes the characteristics of the nets and the flow-net interactions. From the perspective of experimental work, the problem is measuring the drag force for a given flow condition, a methodology that allows calculating the drag coefficient of the net [
1,
2,
3,
4,
5,
6,
7,
8].
Some of the experiments performed to determine the flow force on the cage use small scale physical models of the centers [
9,
10]. In these cases, the models contemplate all the structural components that are in real operations: frames, anchors, weights, etc. Other studies use nets with three-dimensional arrangements, as is the case of the works of [
2,
11,
12,
13], which study the force that resists a cage of the cylindrical type. Through experiments of this style, it is possible to perform more refined analyses that incorporate studies of the hydrodynamics of the flow around the nets [
11,
14] or to study the complete response presented by the physical model against a request for hydrodynamic drag [
9,
10]. Usually, this three-dimensional arrangement is used to validate the numerical models made for the prototype or the physical model.
On the other hand, during the operation of a cultivation center, the prolonged exposure of the nets to the marine waters causes seaweed and other types of organisms to adhere to their surfaces. These species are known as fouling organisms, and their presence causes major problems for the operations of the centers because they increase the exposed areas of the nets, which induces an increase in the drag force they resist [
2,
5,
6].
Laboratory work is generally carried out in large tanks, which mainly attempts to eliminate the edge effects that the walls and/or the bottom of the tank could generate on the flow around the nets. Besides, depending on how the installation recreates the flow over the nets, the length of the tank can also play an important role. The reported facilities use recirculation channels to recreate the currents [
5,
6,
7,
11,
15]. These simulate the flow by the use of centrifugal pumps or employ towing tanks [
2,
3,
4,
9,
10,
13,
16,
17], where the flow is recreated by moving the net along the tank using a carriage-type towing mechanism. In this case, the length of the channel must be large enough to ensure that the tow car reaches a constant speed.
The vast majority of studies use load cells to register forces. These are devices equipped with a strain gauge type sensor that perceives stresses of the tension/compression type by changing the resistance of the sensor. This change is transmitted as an electrical signal, and, through a data acquisition system, it is possible to perform the transformation of this signal strength by calibration, thereby obtaining the force. There are different types of cells on the market, and consequently, this variability can also be seen in the experimental studies. Some studies [
10,
13] use the simplest load cell model, which is the single-point type, which perceives only compression type stresses, while others use the “s” types [
3,
4,
9], which perceive tension and compression stresses. A more refined type of this type of equipment, which has been used in other studies, corresponds to the six-components sensors [
7,
11,
15] that are capable of perceiving tension/compression stresses in the three axes considering a Cartesian reference system, and the bending moments in these axes. The differences in type, number, and distribution of cells can be explained mainly due to the research objectives, the nature of the experimental setup, and the economic costs associated with the acquisition of this equipment.
This research proposes an experimental setup that allows measurements of the drag force that is exerted on flat nets for different flow conditions, to obtain the value of the drag coefficient of the nets. The experiments contemplate the use of two different types of nets utilized in the operation of a farming center: (1) the fish net, which is responsible for containing the fish, and (2) the sea lion net, which protects the fish cage from natural predators, such as the sea lion. The objective of the experimental work is to determine the drag coefficient of these two nets, for the clean situation and real operating conditions, with fouling on the nets. The centers in Chile require knowing when to change the nets in a one-year operation. Although the nets in Chile are periodically replaced, they tend to accumulate a significant amount of biofouling; therefore, the fouling experimentally tested here reaches higher values than those that can be found in the literature. In addition to the above, it is proposed to determine the drag coefficient on a system composed of two sea lion nets, which simulates the configuration that exists in a cultivation center during a cage cleaning process. As indicated above, the fouling adhered to the nets increases the drag force, and under operational conditions, its presence is controlled by periodic changes of dirty nets to clean nets. During the process of changing the nets, both of them are present in the cage. Therefore, another point by which the experiments reported here are unique is the double sea lion net with fouling.
The flow conditions of this article correspond to six different speeds in a range between 0.3 and 2.5 m/s, to characterize the speeds of the currents of the southern channels of the Aysén region of Chile, for normal conditions [
18] and extreme conditions [
19], which are responsible for forcing the nets that make up the cultivation centers. In Chile, fish farming is predominantly carried out in the Aysén Region, given that its ecosystem is suitable for the cultivation of high demand species. The cultivation centers operate in the open sea and are mostly located in the southern channels of the region.
The experiments carried out considered two cases: the determination of normal and tangential drag forces, which are two types of different forcing to which the cultivation centers are exposed; the results were translated to characteristic values of the drag coefficients for clean and fouling nets. We have not found in the literature cases in which tangential drag forces with fouling have been experimentally tested. Thus, this is another point in which the article is innovative.
2. Conceptual Framework
Determining the drag coefficient on flat nets usually focuses on experimental work to measure the drag force
perceived by the nets due to exposure to a flow [
1,
2,
3,
4,
5,
6,
7]. This force is a function of the density of the fluid
, the projected normal area
A, the velocity of approximation of the flow to the net
V, and a drag coefficient
. It is given by:
From the previous equation, the drag coefficient is computed from:
This coefficient is a function of the characteristics of the flow around the nets, the type of net used, and the orientation of the net concerning the velocity of approximation of the flow. The drag coefficient depends on the Reynolds number:
where
is the kinematic viscosity of the fluid, and
D is a characteristic length of the problem. Although the presence of fouling increases the effective diameter of the net, the effect of the additional thickness is assigned as a contribution of the solidity index, and the net thread diameter is commonly used as the characteristic length [
12].
The nets are made from several cylindrical fiber elements. These vary according to the diameter of the thread, the orientation of the grid defined by its threads, the presence or absence of knots, and the materials with which they are manufactured. The characteristics of the nets are described based on the solidity index (or strength)
[
1,
2,
3,
4,
5,
6,
7,
8]. This is defined as the ratio between the effective area occupied by the set of threads and knots (if they exist) and the total area covered by the net—that is:
where
is the total projected area of the region that is occupied by the net, and
is the effective area that the net material occupies to the total projected area.
On the other hand, the presence of fouling is understood as an increase in the area of the nets exposed to the flow, which is interpreted as a growth of the solidity index and drag force [
3,
5,
6]. Additionally, the presence of a second, additional net is interpreted as a growth of the solidity of the net. Generally, the hydrodynamic behavior of clean and fouling nets is described from the solidity index [
2,
3,
4,
5,
6,
8], and its effect on the drag coefficient can be seen directly or indirectly in terms of the characteristic area
A used for solving Equation (
2). In this study, we chose to use the total projected area of the region that is occupied by the net,
, as a characteristic area, and consequently, the drag coefficient is calculated from:
where Equation (
5) is a relation that depends on the solidity index,
, and the Reynolds number,
. The relation (
5) is a calculation approach that has been used in other studies that determine the drag coefficient on nets with fouling [
3,
5], which allows us to visualize more clearly the effect that the solidity index has on the drag coefficient value.
Another relevant factor in the calculation of the drag coefficients of the nets corresponds to the angle of attack of the flow to the net,
. If the flow is perpendicular, the attack angle is
, and the drag force strikes normal to the net. In this case, the drag coefficient given by Equation (
5) is denoted by
and corresponds to the normal drag coefficient of the net. If the flow is parallel to the net, the associated angle is
, and the value of the drag coefficient is denoted by
, which corresponds to the tangential drag coefficient of the net. Studies on flat nets report that the tangential drag force is around 30% of the normal drag force, and in general, the drag force on the net is reduced as the angle of attack is reduced [
1,
2,
5,
8,
20].
Thus, although it is expected that the normal drag coefficient values are greater than the tangential ones (), the computation of the latter has several advantages. For instance, (i) empirically establish the ratio between and accounting for different types of nets (fish and sea lion nets) with a wide range of solidity index (captured by the variation of the fouling levels and the presence of a second net); (ii) both coefficients are crucial for force predictions in numerical simulations on highly flexible nets subjected to uniform pressure; (iii) the damping matrix in a finite element formulation scheme of the dynamic response of a net depends on both coefficients; and (iv) account for the effects of currents on force predictions that are not normal to the surface under study.
Reports suggest the need to incorporate studies of fluid mechanics [
4,
5,
15], since factors such as the interactions between the threads of the nets, rugosity, or local disturbances in the net due to the presence of fouling, can alter the drag coefficient, and are variables that do not properly address the solidity index. Despite that, and from the perspective of experimental work,
and
provide a practical way to determine the drag coefficients of the nets.
3. Experimental Work
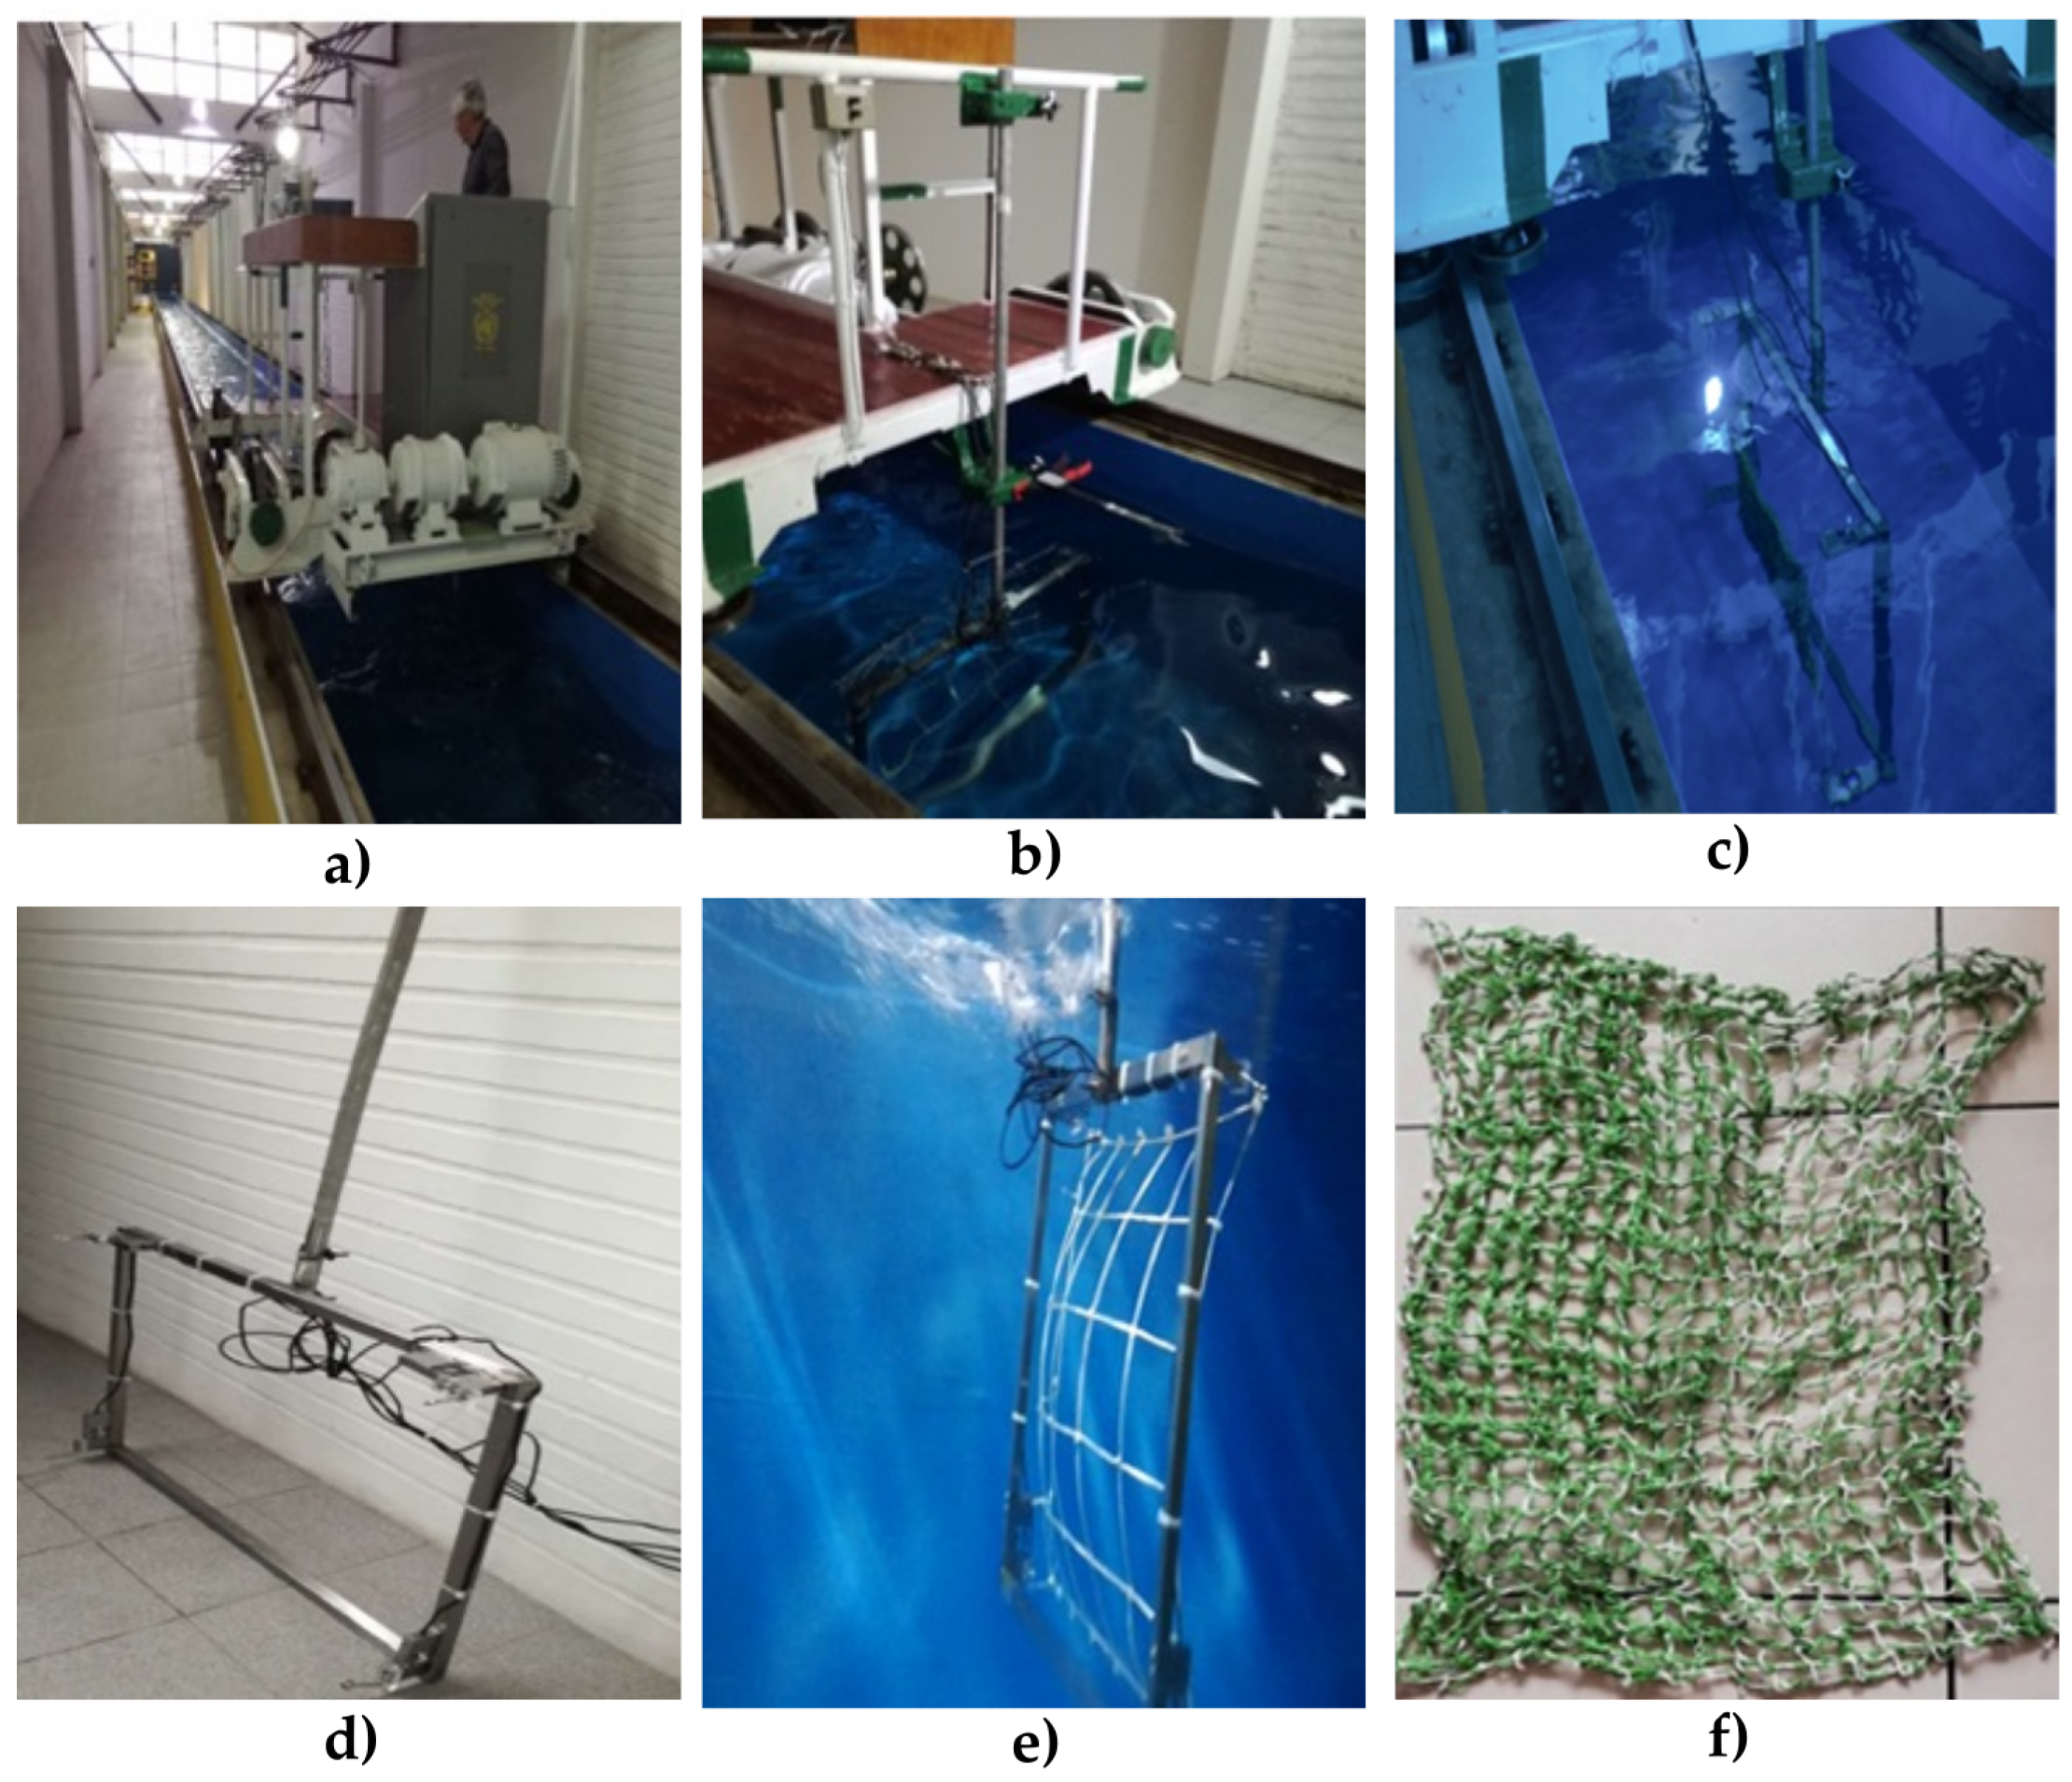
Experiments to measure hydrodynamic drag force on clean and fouling nets were carried out at the Chilean National Institute of Hydraulics. The facility has a 75 m long tank, with a 1.5 m × 1.5 m cross-section on which a carriage is arranged (
Figure 1a), which can travel at a constant speed in a range of 0.05–3.5 m/s over the tank. At the rear of the carriage is a racket-type stainless steel frame (
Figure 1d), which is completely submerged in the center of the tank and that held the nets to be studied (
Figure 1b,c). The movement of the carriage and the structure recreated the hydrodynamic forces of the flow over the nets (
Figure 1e).
The drag force was measured using Scaime brand AK12 model load cells, each of them with a load capacity up to 12 kg (117.6 N). These load cells correspond to a single-point type and are designed to measure forces by means of the compression of a strain-gauge sensor. The sensor compression is expressed as an electrical signal that is interpreted as force through a data acquisition system. As load cells are designed to work in compression, these must be located on the frame with the stress direction of their strain-gauge sensors oriented in the flow direction.
Four load cells were employed for the experiments. These were distributed in the corners of the racket. The load cells were used to record forces but also to attach the net to the frame. The net attachment was done by using hooks on each load cell, which allowed the net to be adjusted using plastic ties. The hooks were not fixed and could be placed in different positions of the load cells, and their height could also be defined, allowing them to control the net tension.
In each cell, the hook that held the net had to be placed in the position just above the strain-gauge sensor, in order to provide a configuration where the net could be attached in front of the load cells. Once the load cells were installed on the racket, they were calibrated through a standard methodology, supported by the provider, which includes the use of known weights.
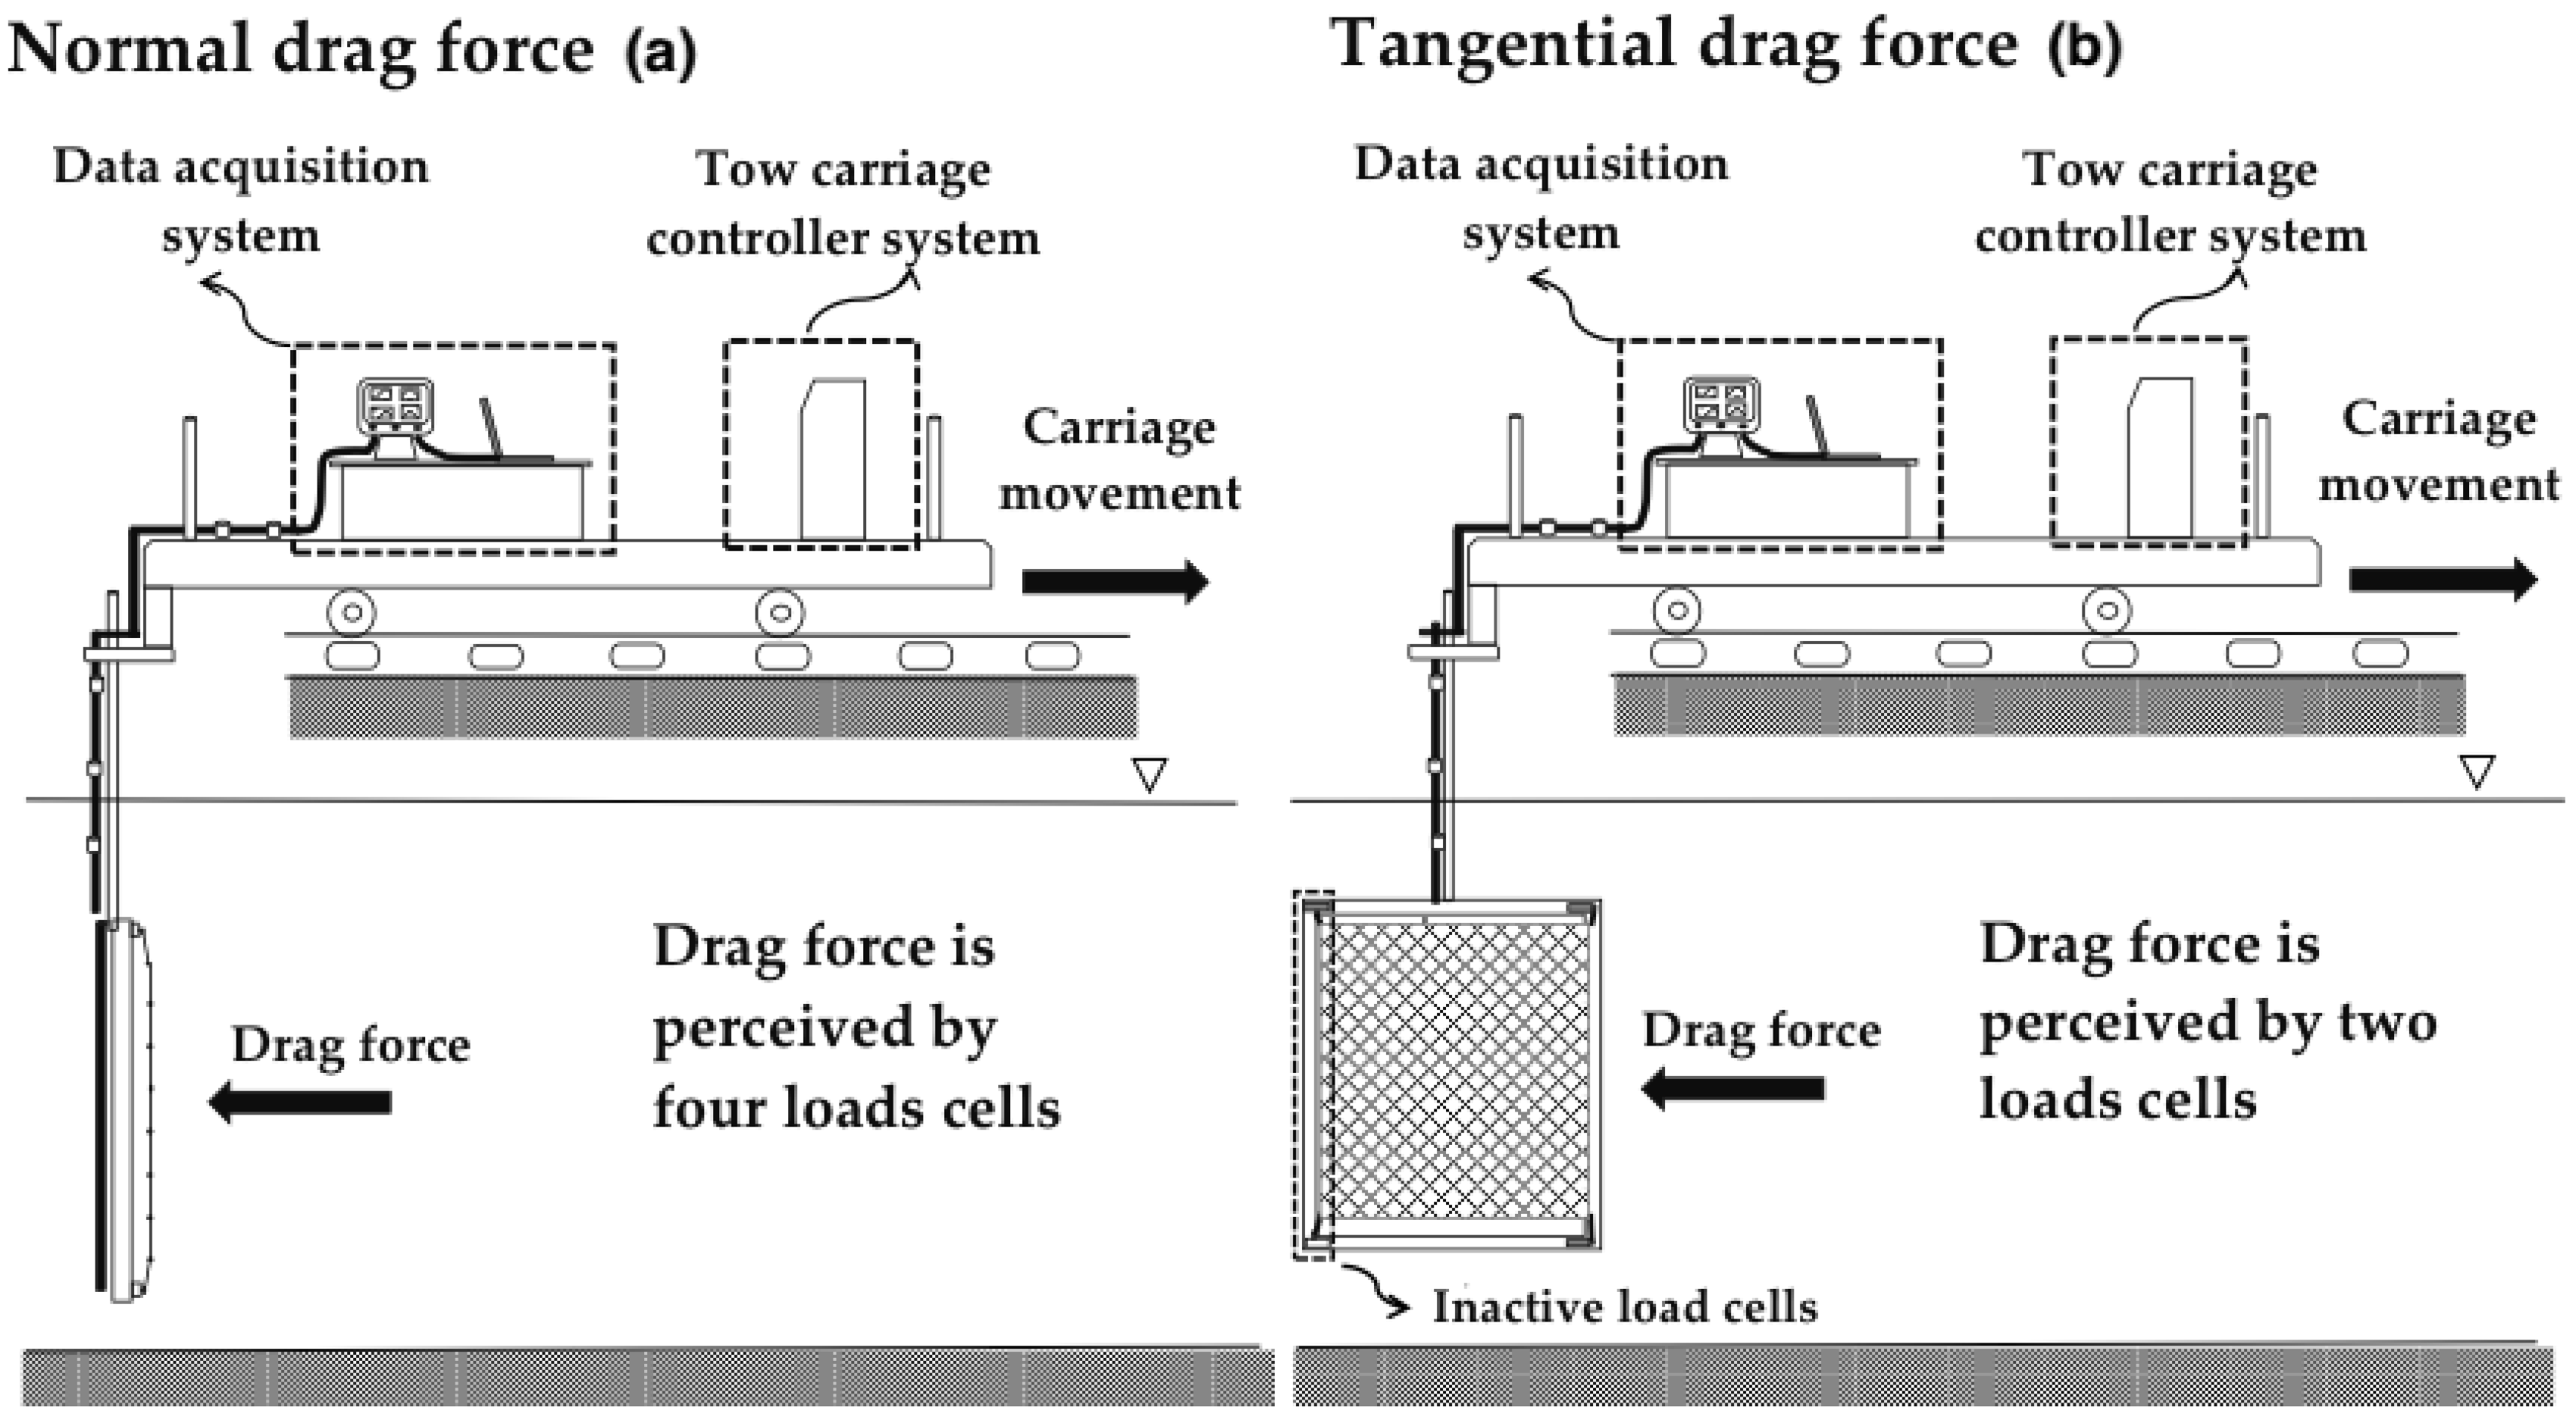
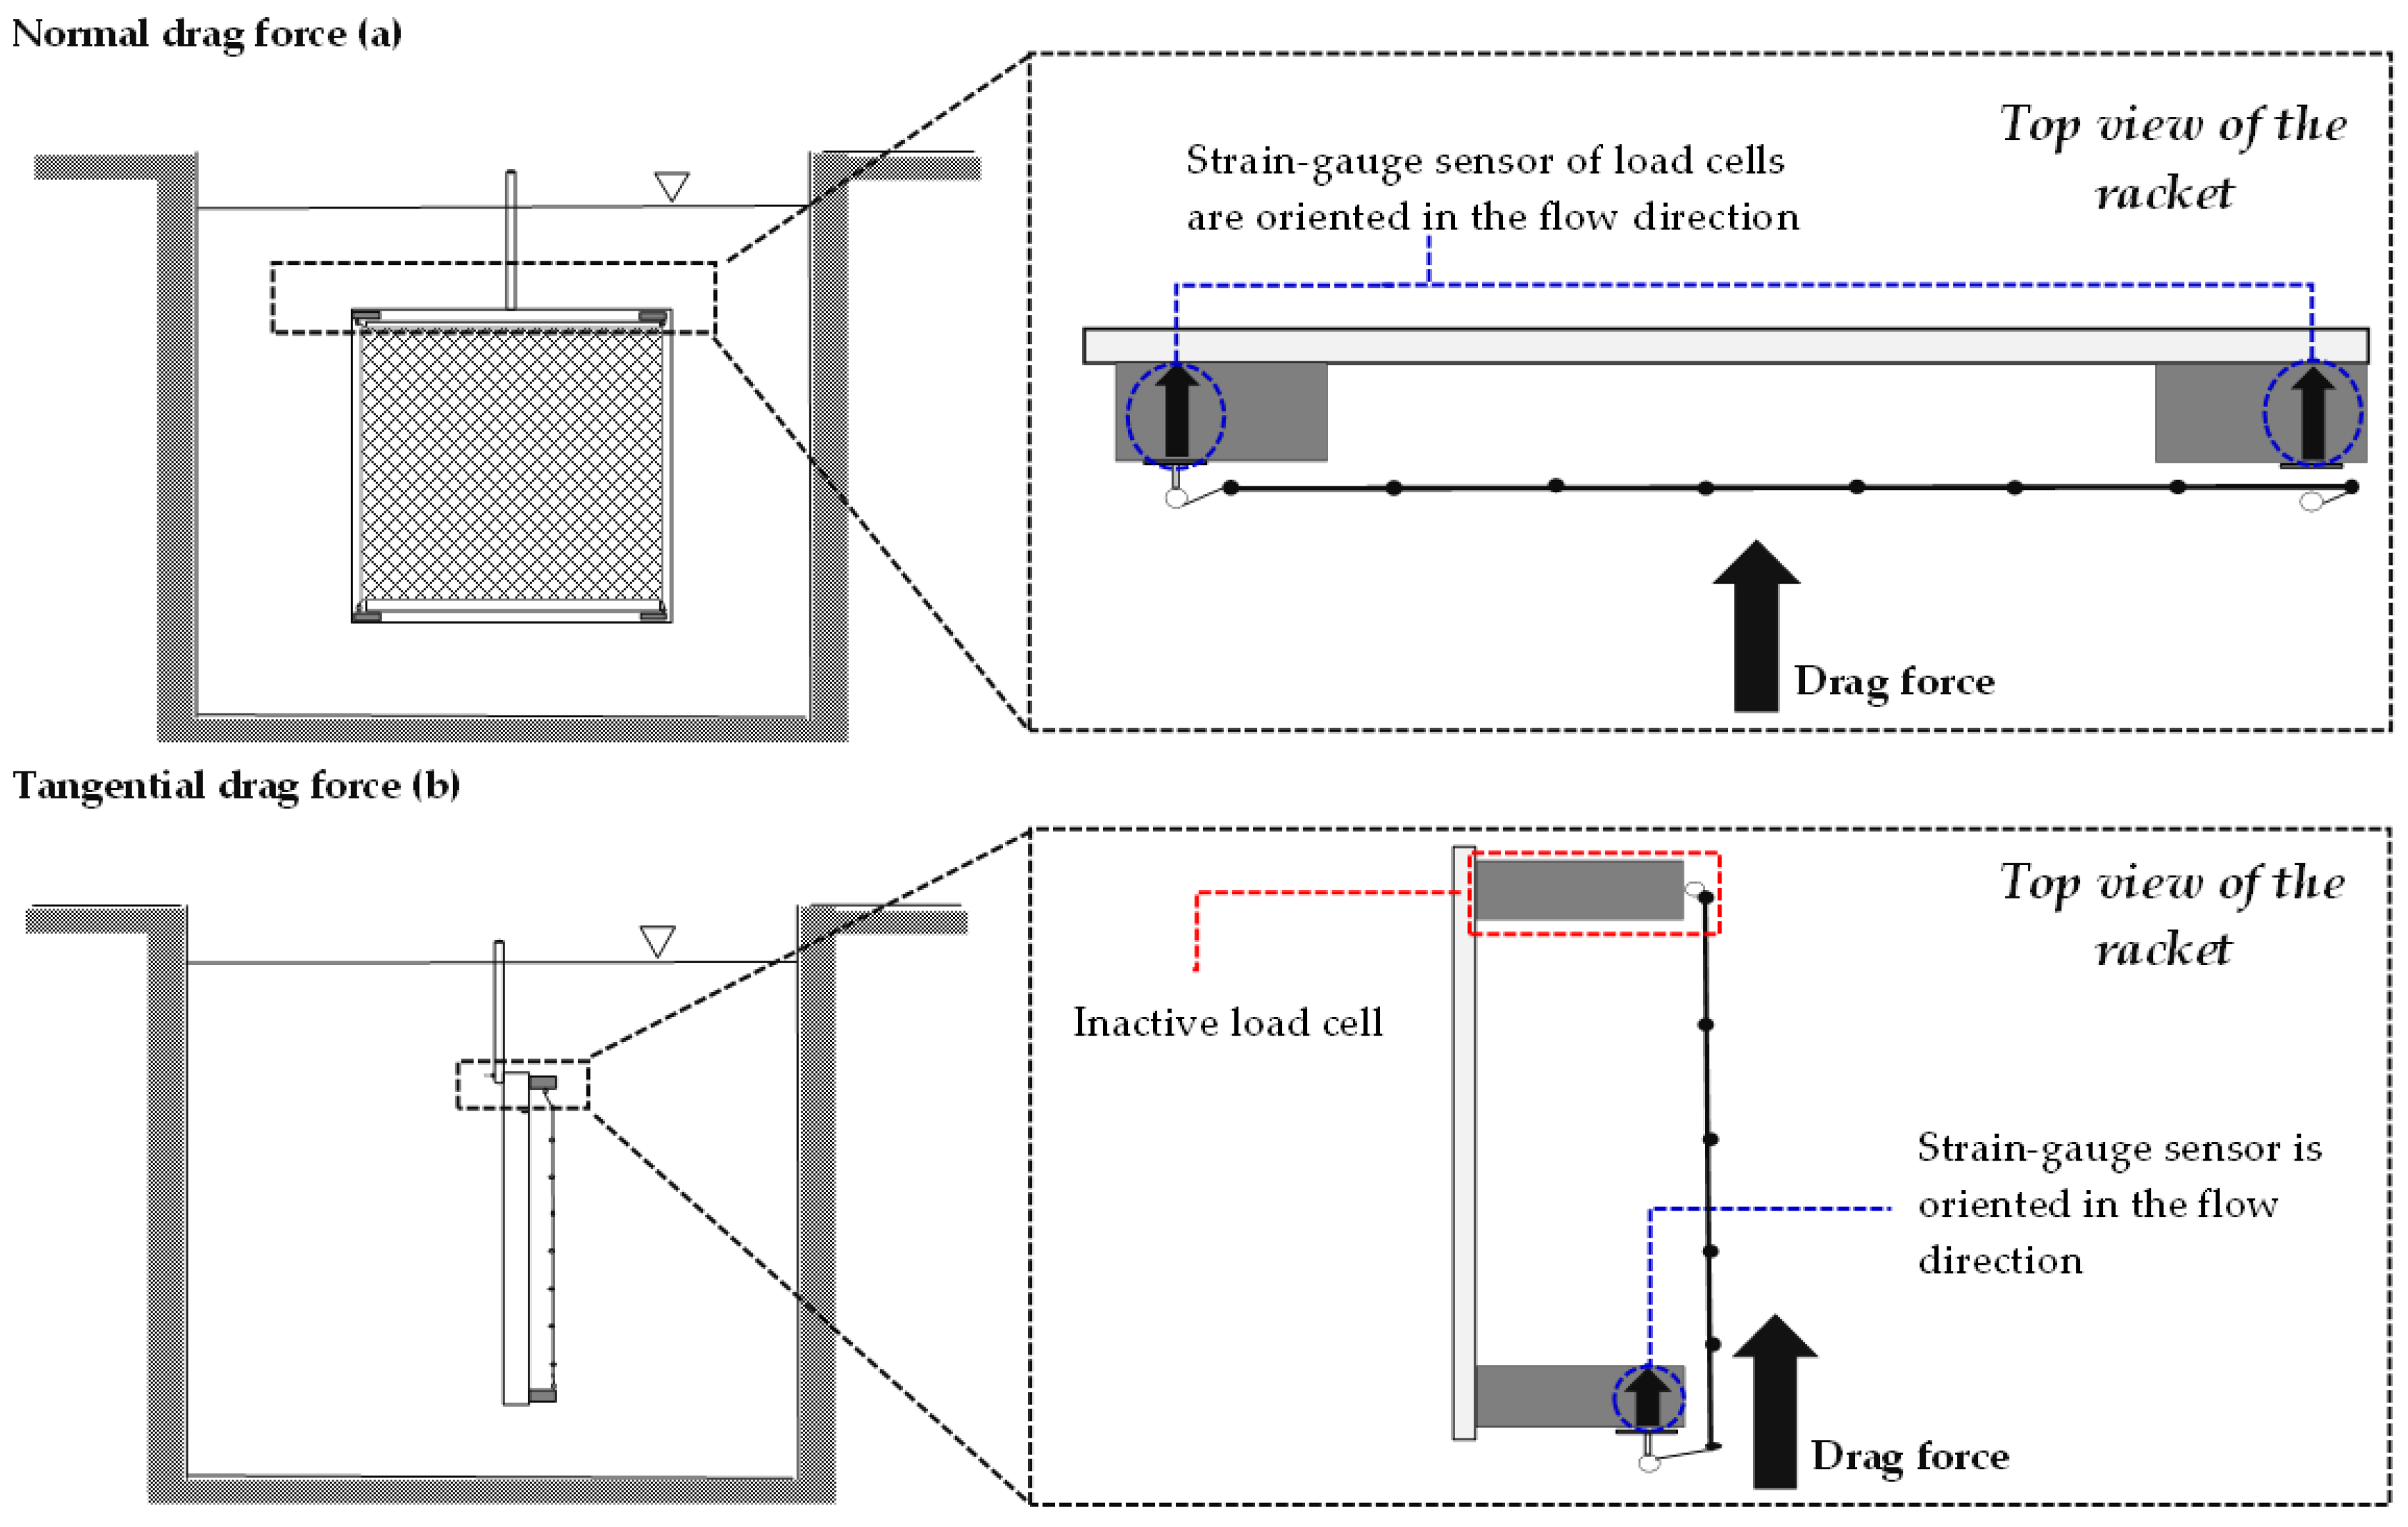
Since the orientation of the racket changes between the normal and tangential drag force cases, the load cell arrangement defined for both cases also changed. For the normal case, the four load cells were exposed to the flow (
Figure 1b and
Figure 2a). When the drag force was exerted over the net, this was transmitted and distributed into the four load cells. The net was tied relatively tensely from its four attachment points (
Figure 3a).
For the tangential case, two load cells were exposed to the flow (
Figure 1c and
Figure 2b). The net was subjected tension at the support points provided by the cells on the face exposed to the flow. For this, it was kept loose on the opposite face. That way, no additional stress effects were generated by fixing the network to the load cells that register the forces. The fastening of the net, on the face exposed to the flow, was carried out to ensure that the net remained tied on the load cell sensor. Thus, when the tangential drag force was applied on the net, it was transmitted and distributed over the two load cells located on the front face. Meanwhile, the load cells located in the back provided support and were inactive during the experiments (
Figure 3b).
It is important to note that the arrangement given by the coupling of the nets, the hooks, and the load cells was done to eliminate the deflection in the corners that could produce errors in the experimental data. This consideration was made possible by the adjustable hook positions, providing the opportunity to establish such a net hold where the force applied by the flow on it could be transmitted to the load cells exposed to the flow. Then, once this holding state was established, the racket with the net was submerged into the tank.
As result of the net tension in the hooks, a non-zero value could be registered by the load cells when the racket was under water. These values settled at zero at the beginning of the experiment using the data acquisition system.
Data acquisition was performed using a Model 128 Enterprice Force Gauge, manufactured by Rice Lake. This equipment has four channels, each equipped with a digital display, which receives the signals perceived by the load cells. The equipment samples data at a rate that is set by software in a range of 7.5 to 960 Hz and allows the information to be stored directly via a USB connection to a computer (
Figure 2).
The nets tested correspond to nylon meshes, which from now on will be denoted as the fish net and sea lion net, which are nets used in fish farming centers of the aquaculture industry in Chile. The fish net (
Figure 1f) was a diamond-type net without knots, with an opening angle of
, a thread diameter of 2.5 mm, and a grid spacing equal to
. The sea lion net (
Figure 1e) was a square type net with knots, a thread diameter of 5 mm, and an opening
. The image in
Figure 1f, corresponds to a fish net with 45% fouling.
To characterize the presence of fouling in the nets, 2 mm diameter polyethylene ropes were used, which were braided over the nets to increase their solid area (
Figure 1f), thereby increasing the solidity indexes of the nets. The use of synthetic materials to represent organic material is based on previous studies of drag force on nets and cylinders [
12,
16,
21], which indicate that these recreate hydrodynamic conditions similar to those of the real fouling, as long as these reproduce their roughness, size, and stiffness. Additionally, it is important to consider that preserving organic material in the laboratory, outside natural conditions, can strongly alter fouling characteristics [
12,
22].
The experiments performed considered two case studies: (i) determination of the normal drag force of the net and (ii) determination of the drag force tangential to the net. In the first case, the racket was oriented perpendicularly to the direction of the flow, while in the second, the net was oriented parallel to the flow (
Figure 3).
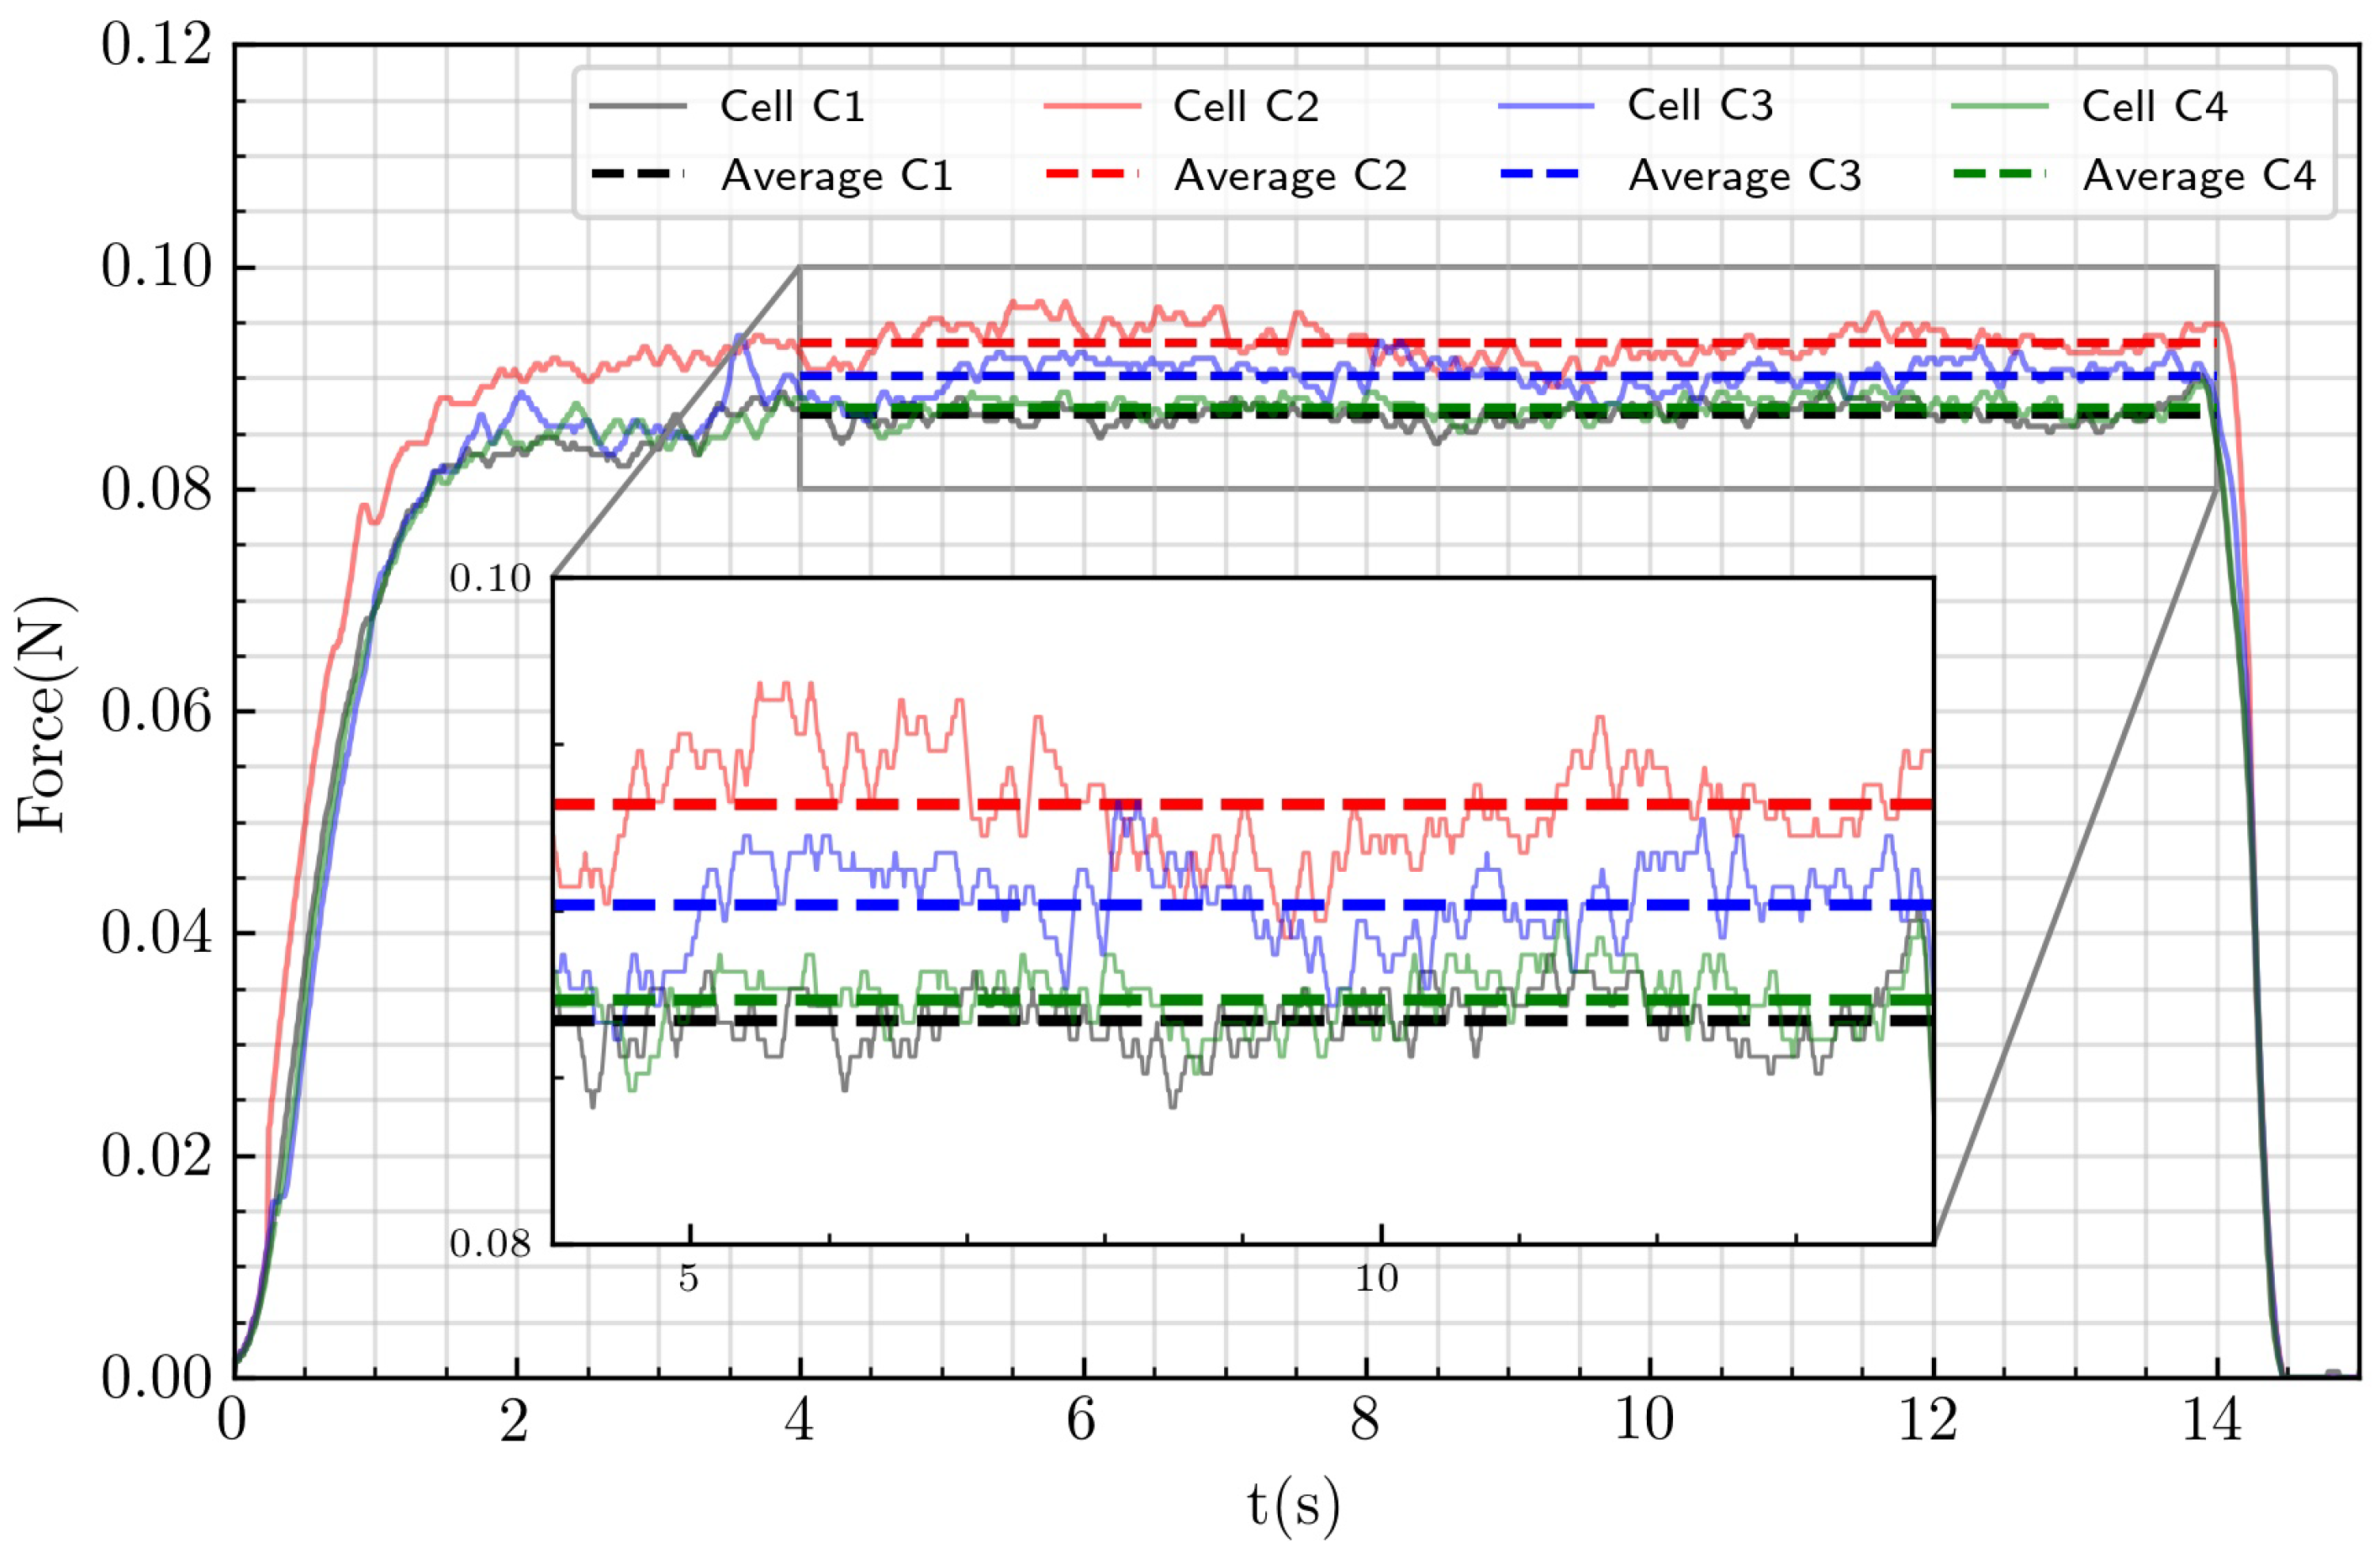
By the mechanical control of the carriage, a speed value was set. The carriage began to move until the speed reached a constant value. Simultaneously, the load cells perceived the force that the flow exerted on the net. When the constant speed was reached, the results were stored on a laptop at a rate of 100 Hz. An example of the data obtained in a typical experiment is shown in
Figure 4.
The solidity of the nets was determined using photographs taken of clean and fouling nets, according to the methodology proposed by [
3,
5,
22]. Using a binarization of the image, the effective area that was occupied by the net to that of the total region occupied by its threads was determined.
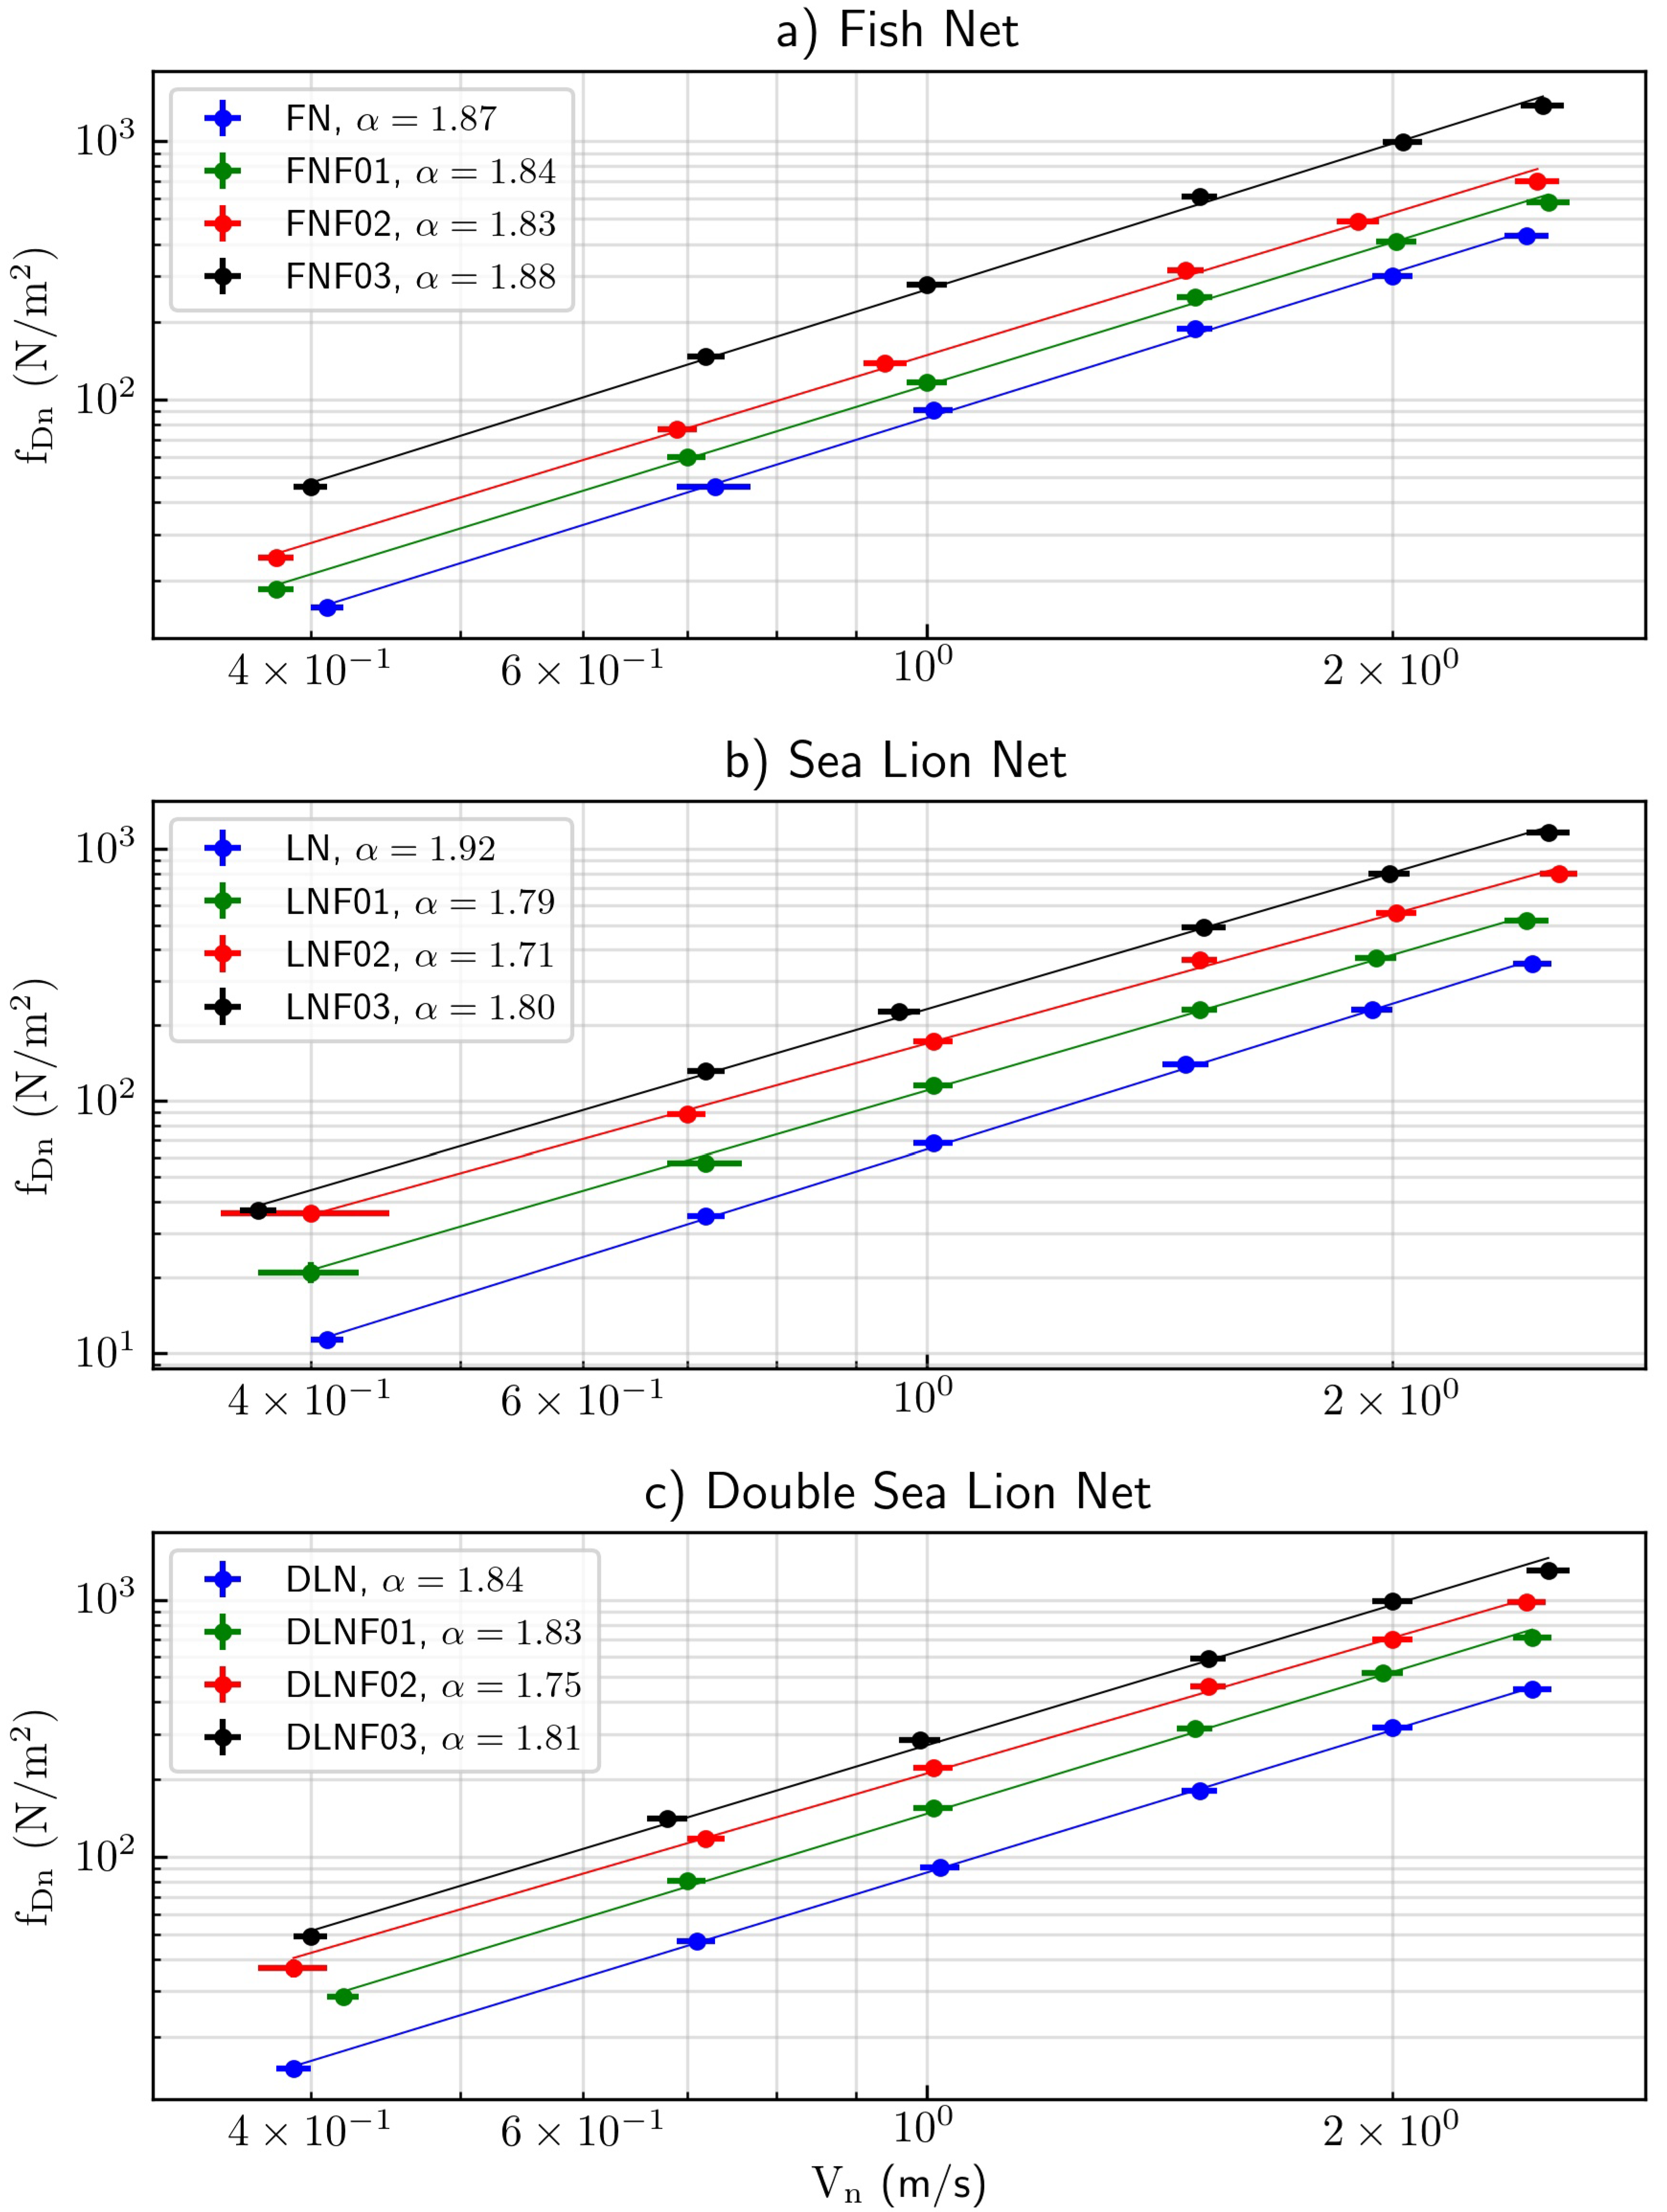
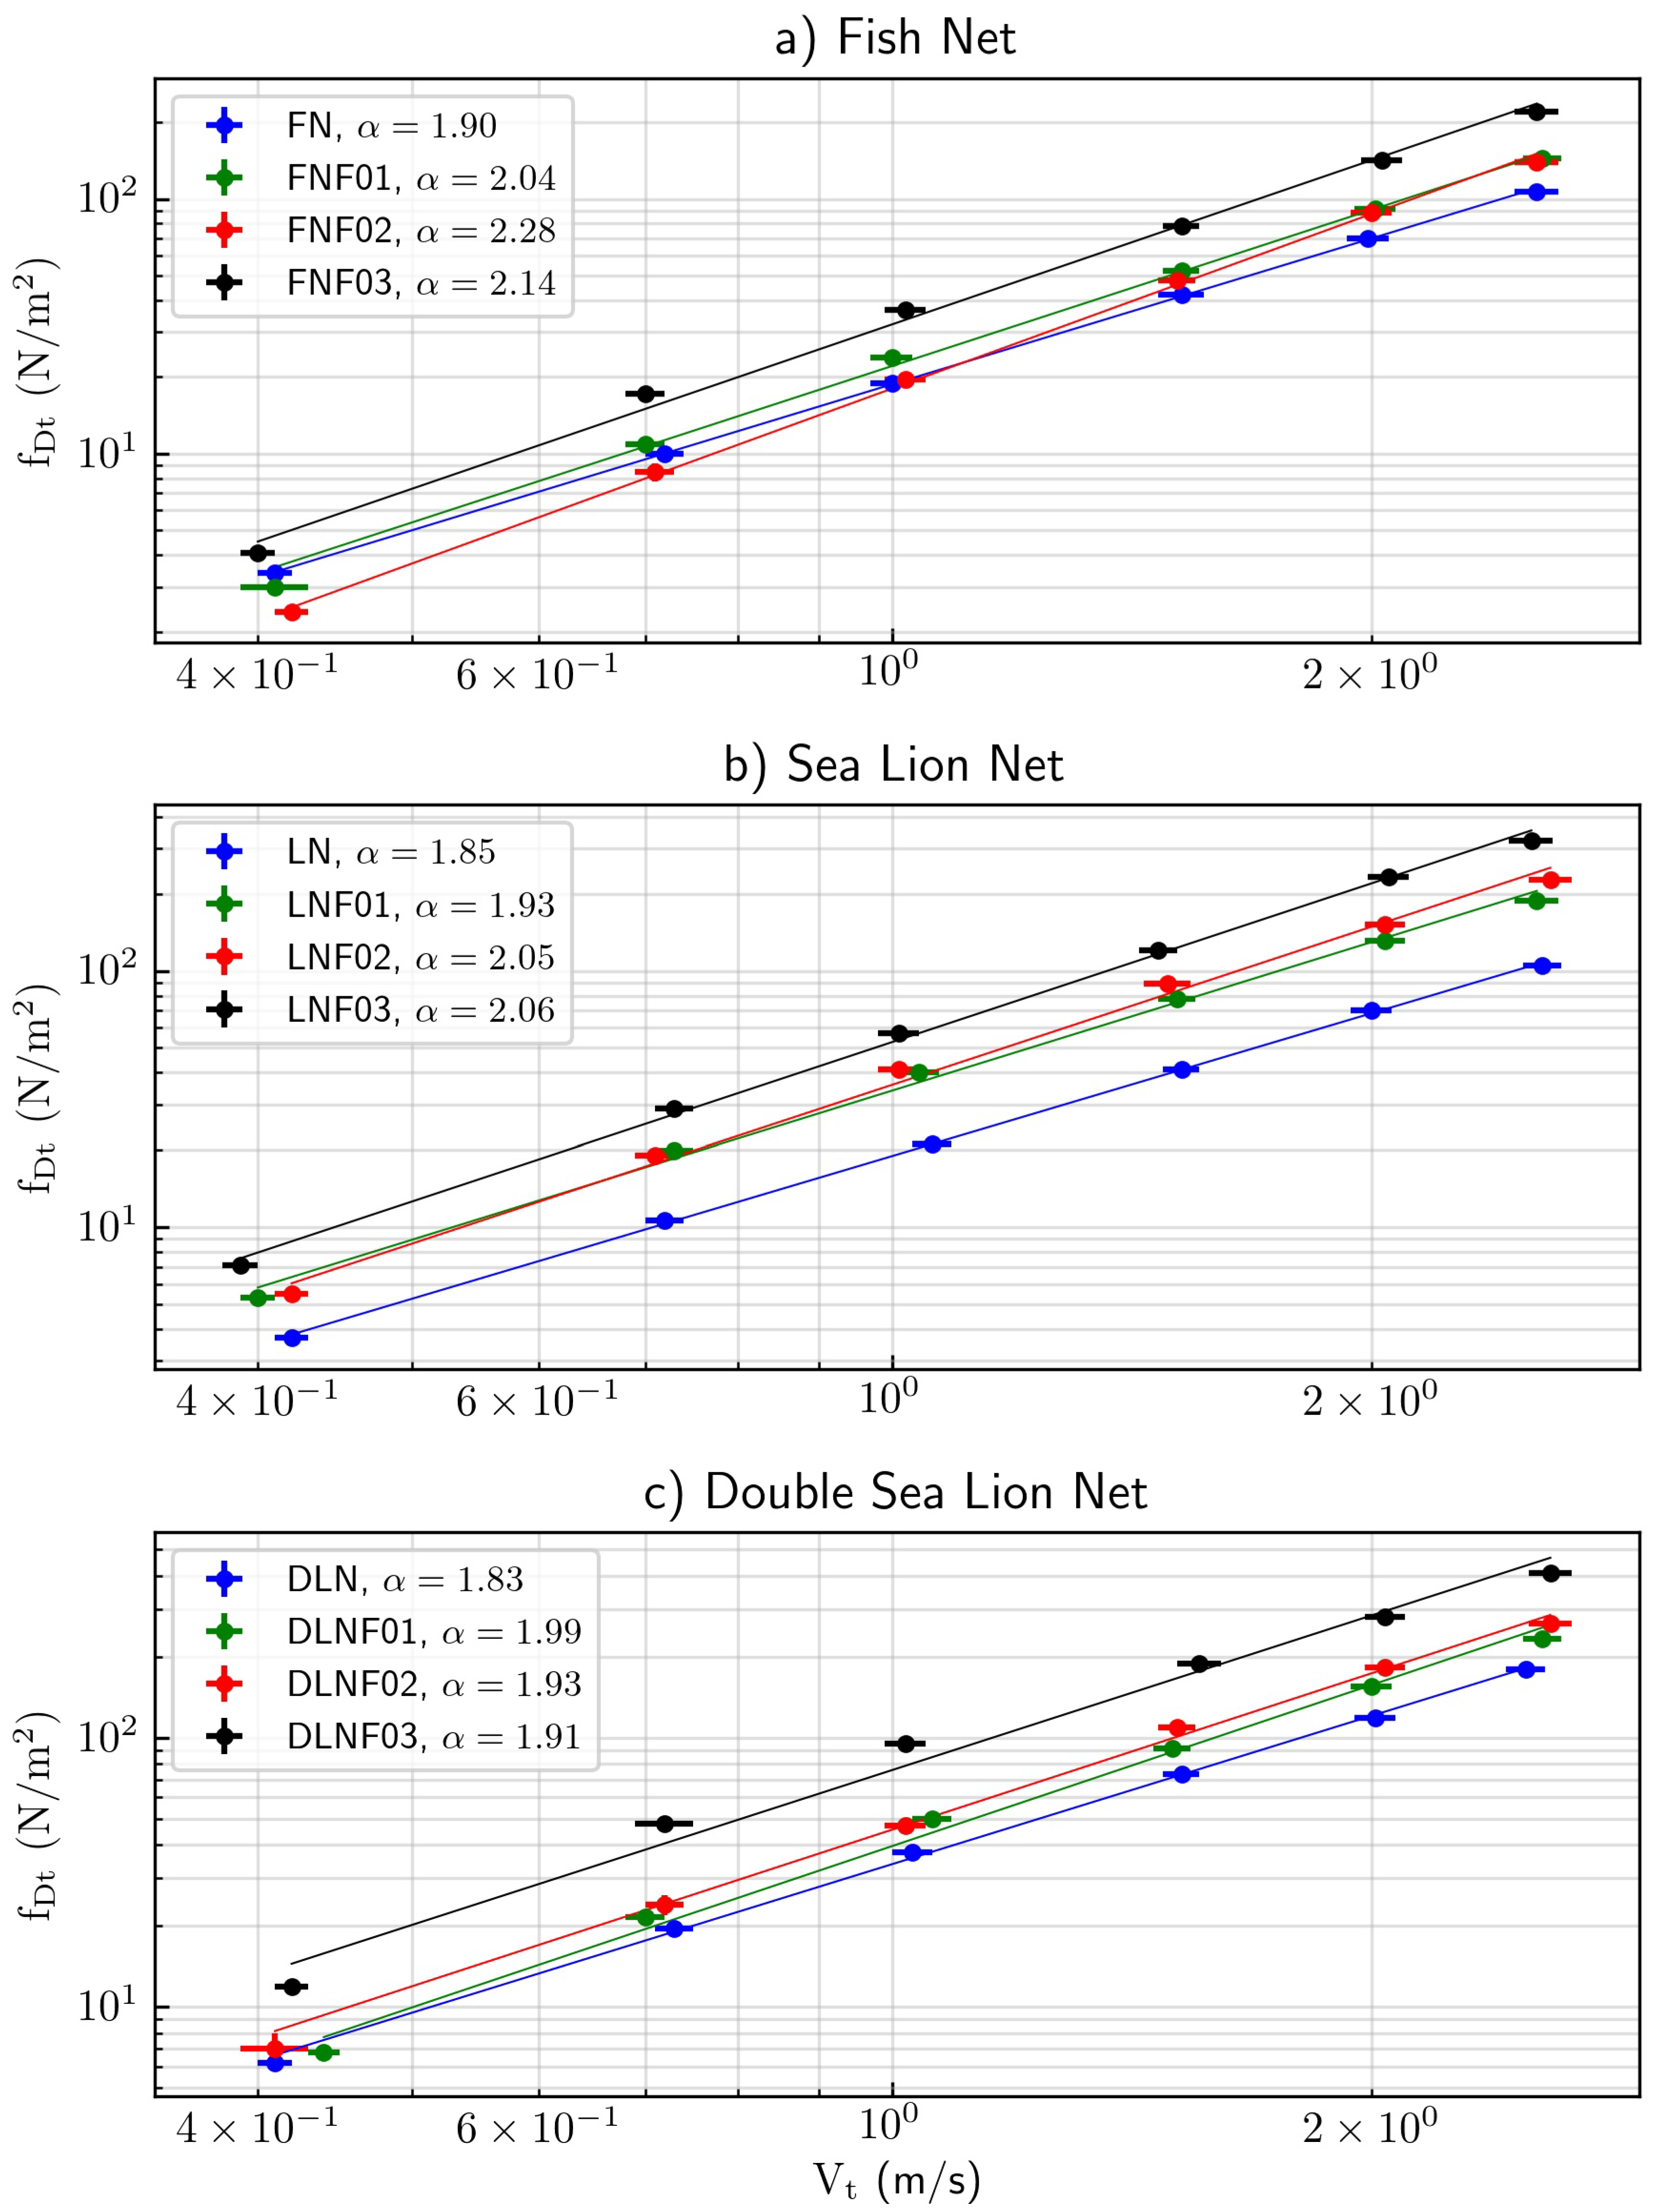
The normal and tangential drag forces on the fish and sea lion nets were determined for four scenarios: the clean situation and three situations with fouling. For the latter cases, fouling increased the solid area of the clean net by 30%, 45%, and 60% of the total area that was occupied by its threads. Additionally, the drag force exerted on a system composed of the sea lion net in question and an additional clean sea lion net was determined, a configuration that realized a condition of real operation of nets in a cultivation center. The presence of an additional clean sea lion net translates into an increase in the solidity index.
Table 1 shows a summary of the cases studied. It indicates the type of net, its calculated solidity index, and the notation with which it will be referred to in subsequent sections.
Each of the nets in
Table 1 was tested for six different speeds: 0.4, 0.7, 1.0, 1.5, 2.0, and 2.5 m/s, in the cases of normal and tangential drag forces respectively. Speeds between 0.4 and 1 m/s simulated currents under normal climatic conditions in the southern channels of the Aysén Region [
18]. Speeds between 1.5 and 2.5 m/s simulated currents associated with extreme events such as “tidal currents” [
19]. Each speed was tested three times, and the characteristic values of the speed and drag force were obtained from the arithmetic averages of these data. The speed of the carriage was obtained by measuring the time the carriage traveled a known distance of 10 m (data that were recorded with a laser sensor). Errors of the speed and drag force were propagated for these operations and to the average of the data of the three values, according to the standard procedures of error analysis [
23].
For clean and fouling situations F01 and F02, the total area of the region occupied by the sea lion net threads was 0.663 m
, and for the fish net, this value was 0.729 m
. For the condition with fouling F03, the total areas were reduced to 0.332 m
and 0.365 m
, respectively (
Table 1). This was because nets of half the size of the previous cases were used since a larger size for this degree of fouling would have exceed the maximum capacity of the load cells.
5. Discussion
In Chile, it is usual for nets to accumulate a significant amount of biofouling, which is why they are usually subjected to cleaning cycles. Although the technical literature provides drag coefficient values for the design under these conditions, until now, there have been no studies for the particular and representative conditions of the Chilean reality. These experiments sought to bridge this gap, particularly the combination of sea lion and fish nets together.
To know the distribution of the forces in the nets due to sea flow, and the particular forces of each mooring line, some authors have suggested the use of CFD models [
25,
26,
27]. For the use of these models, the decomposition of the drag coefficient into a normal and tangential components is relevant. In this way, this study has sought to contribute reference values for these two parameters.
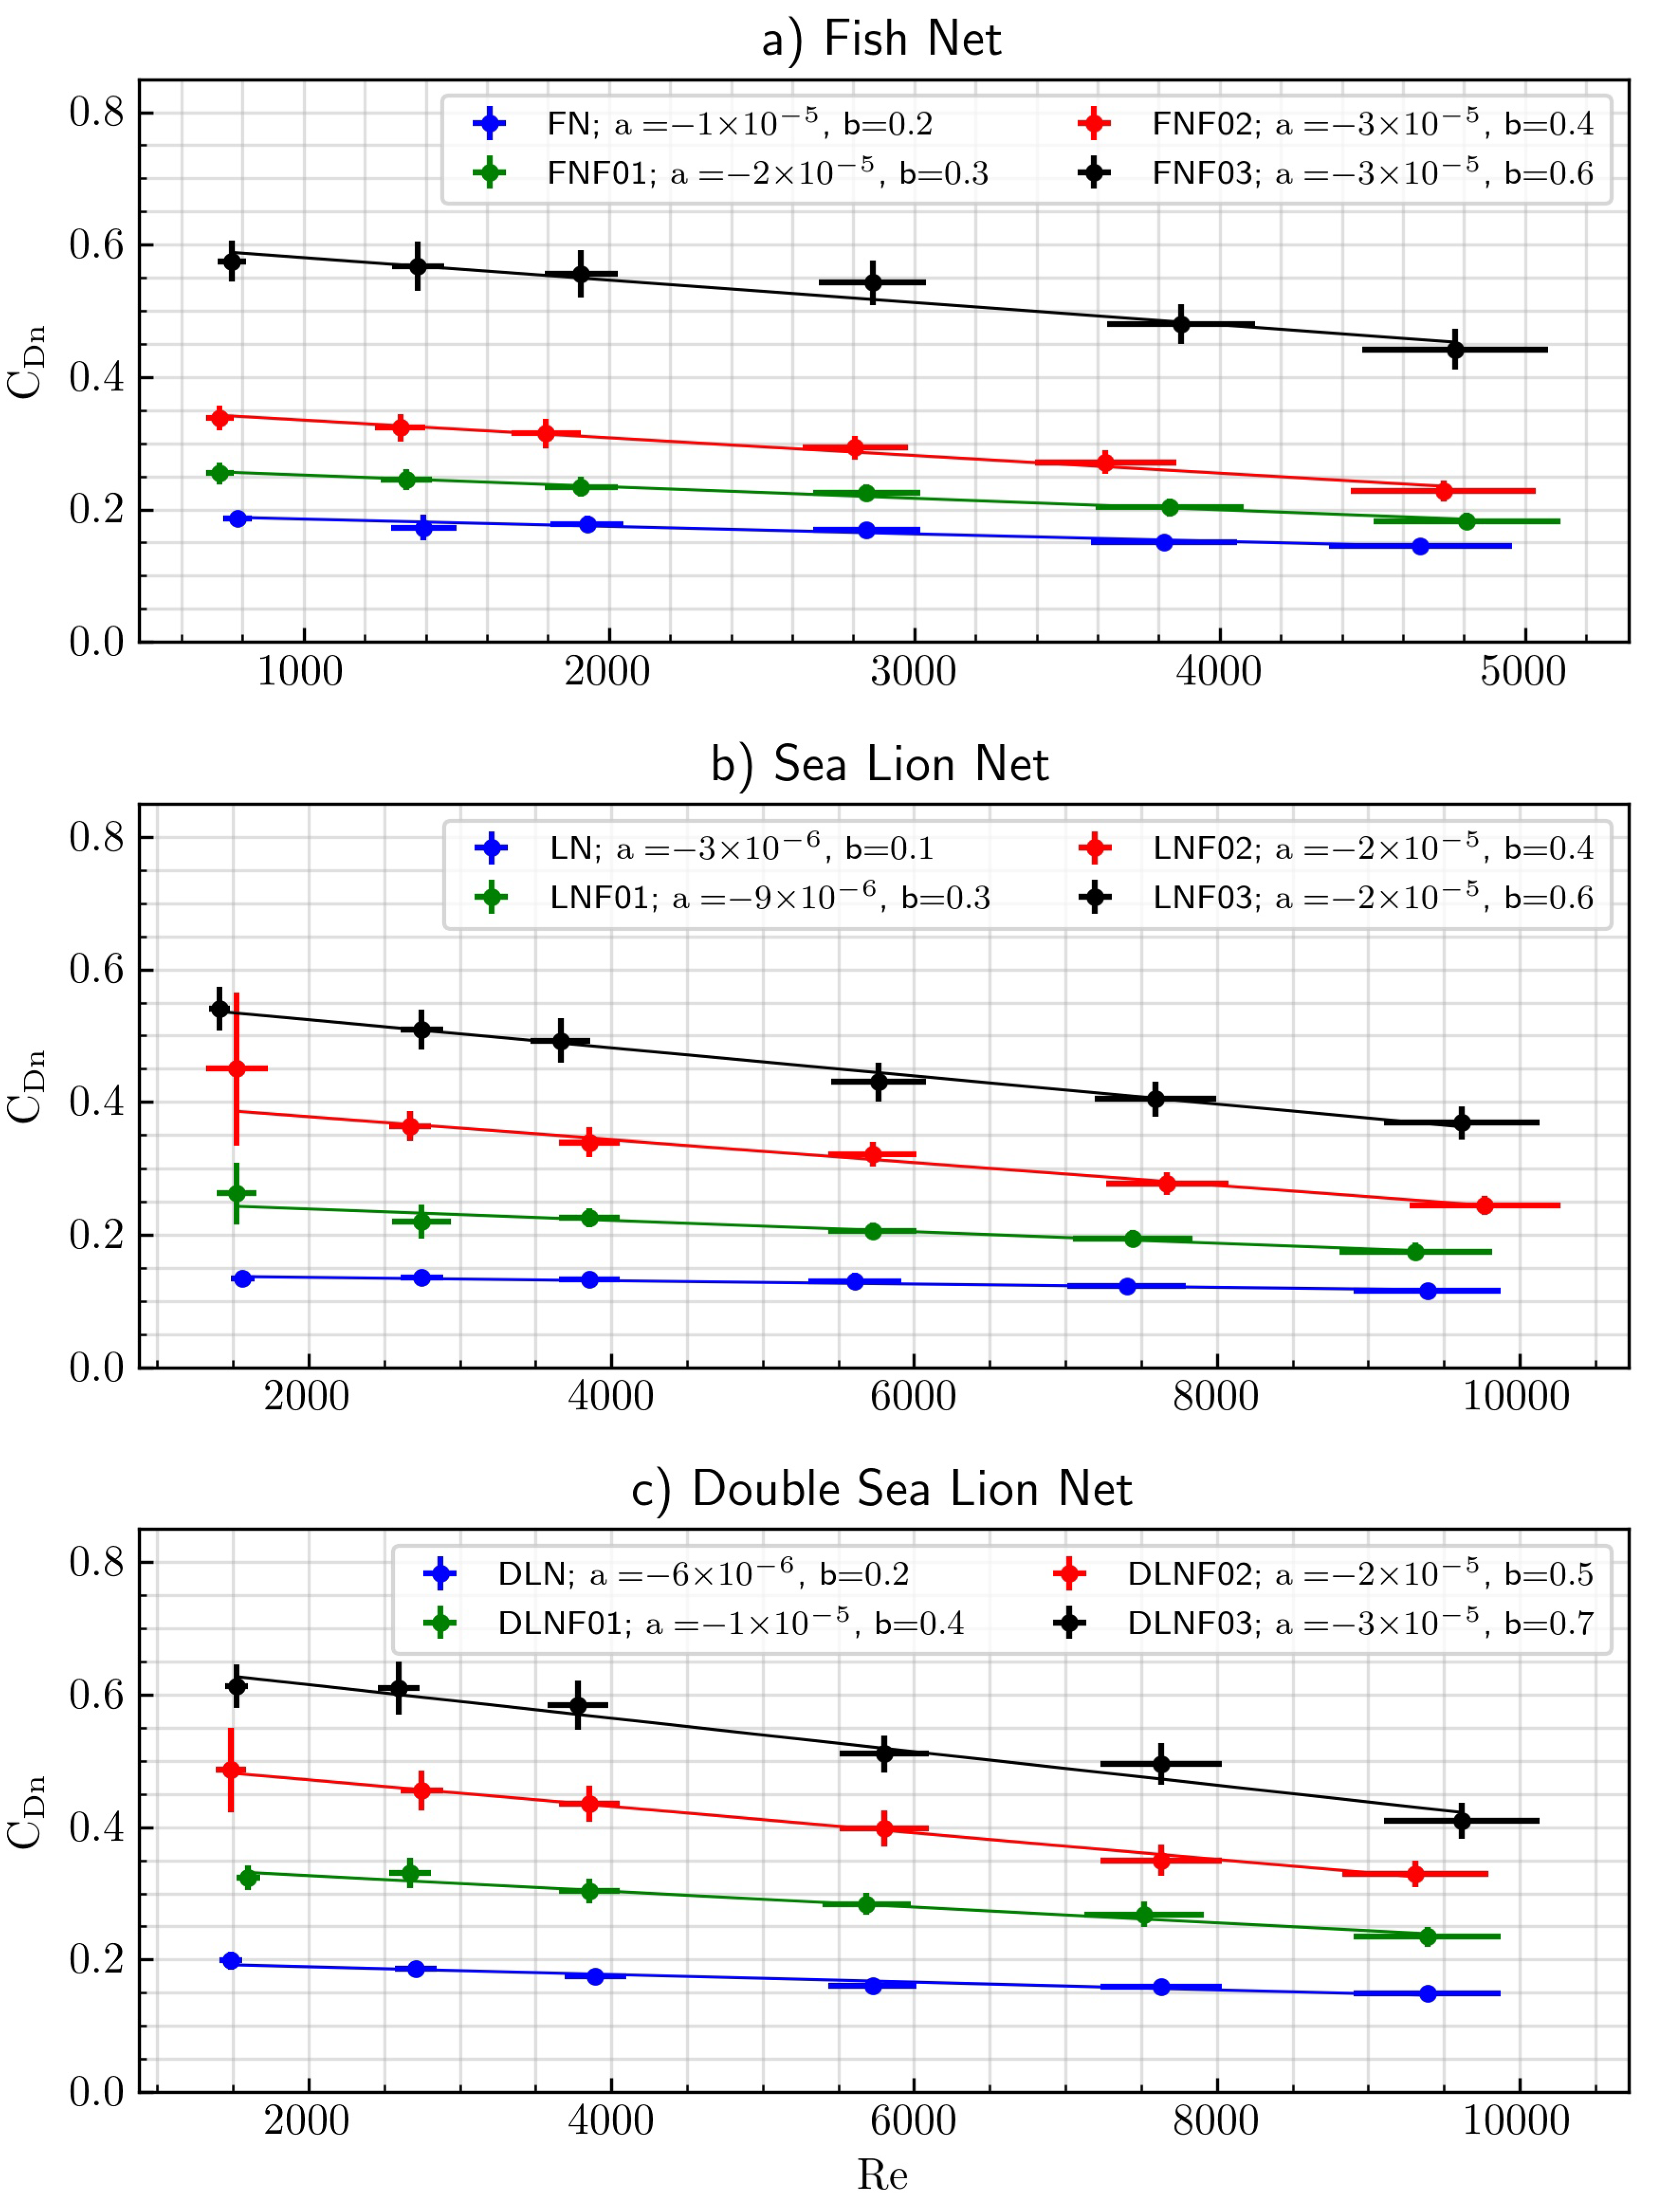
5.1. Normal Drag Coefficient in Clean Nets
In the experiments of clean nets of this article, the normal drag coefficient was weakly dependent on the Reynolds number. The range of
, based on the net thread diameter, was
–
. For this range of values of
, the drag coefficient of a cylinder (i.e.,
in our definition) is also weakly dependent on
, with a value slightly higher than 1 [
28]. Liu et al. [
29] showed the effects of the separation on the drag coefficients of two cylinders aligned with the flow at
. Although the value of
is higher than that of our experiments, the drag coefficient is almost independent of
, and it becomes independent of the cylinder separation at
, where
is the separation between the cylinders and
D their diameter. The total drag is the addition of that for both cylinders. Extrapolating this result to the nets tested in this article, three conclusions arise for the clean nets: (i) the proper length scales are the thread diameter
D, and the spacing
, which according to the approach given in this article, is given by the solidity index; (ii) it is not unreasonable to extrapolate the conclusion that for clean nets with threads sufficiently separated, the total drag is the result of the addition of the effect of several cylinders; (iii) within the range of Reynolds numbers tested, for each cylinder, there is a weak dependency of the drag coefficient on
, and the drag coefficient associated with several cylinders in tandem will also have a weak dependency on
.
There is consensus that the normal drag coefficient of nets decreases weakly as the Reynolds number increases [
2,
7,
15]. Le Bris and Marichal [
1] experimentally determined the coefficient
for braided nets with knots and found that for a low solidity index (
), the results of their experiment showed the value of 1.36; however, they did not report on the Reynolds number from their experiment. Other authors who have experimented with braided nets have found similar results to those of [
1]. Swift et al. [
3] found values of
around 1.45; the solidity index was 0.121; and the Reynolds numbers were, approximately, 500–1700. The net thread was braided spectra, and the intersections were knotless. In the experiments of [
2], the
value fluctuated between 1.3 and 1.8, the solidity index varied from 0.128 to 0.223, and the Reynolds numbers were, approximately, 170–1440; but they did not indicate what type of net thread they used. In the experiments of [
15] made with polyethylene braided nets,
values ranged between 1.1 and 1.6, the solidity index varied from 0.103 to 0.250, and the Reynolds numbers were, approximately, 500–5000. It is important to note that in addition to the material used, the most notable difference between these studies is that they all used nets of different characteristics (size; pattern; braided or monofilament; net intersections being knotless or with knots) even if they got similar solidity indexes.
For the clean fish net in the present experiments, the value varied with Reynolds numbers between 0.7 and 0.9, smaller than the review presented previously; the clean sea lion net fluctuated between 1.2 and 1.4, narrowly at the lowest values presented previously. The clean fish net had an value of 0.220, larger than that of the clean sea lion net, whose value was 0.098. Recall that the nets tested in this study correspond to the fish and sea lion nets used in the aquaculture centers of Aysén, Chile. The sea lion net had a diameter of 5 mm, and its grid was the square type with knots with an opening of 150 mm. The fish net had a diameter of 2.5 mm and was of the square-diamond type without knots, with an opening angle of and grid separation equal to 30 mm. The material of both nets was nylon. That is, the net material was a monofilament, as opposed to the braided net material from the review presented previously. Thus, the fish net had less resistance (or drag coefficient) than all the nets from the previous review, because it was a monofilament and also had no knots. The sea lion net was a monofilament but was knotted and had a slightly lower than the other nets from the previous review.
Therefore, intrinsically, all nets are hydrodynamically different because the different characteristics they use, whether the material is a monofilament or is braided, and whether the net is with or without knots, features that are not represented by the solidity index . Hence, drag coefficients should also be different.
5.2. Normal Drag Coefficient in Nets with Fouling
From the point of view of hydrodynamic forces, a higher solidity index is associated with an increase in drag force perceived by the nets and the presence of fouling is understood as an increase in the area of the net exposed to the flow, which is interpreted as a growth of the solidity index and drag force [
3,
5,
6].
From the perspective of experimental work to reproduce the fouling, two ways are usually used: use samples of organisms taken in situ [
3,
6], or reproduce it using artificial elements [
12,
16]. The advantage of the first method is that it allows you to recreate more accurately the state in which the nets are in given natural conditions; however, depending on the type of species, preserving them such condition outside the marine environment can be a tremendously difficult job. Lader et al. [
12] indicated that hydroids quickly change in contact with air. In experiments to quantify the amount of fouling present on a net, Gansel et al. [
22] indicated that there are important differences between the measurements made with the hydroids with the seawater and those made in the air. Besides, considering that the experiments are carried out in controlled spaces, the presence of these organisms can disturb the environment, which does not make their use feasible. When referring to synthetic materials, the literature shows a wide variety of options, which depend mainly on the type of species with which one works. There are more than 200 different types of fouling [
30], and they can be of the type algae or mollusks. In the experiments with nets presented in [
12], braids of polyethylene were used to simulate hydroids. However, because measuring the stiffness of hydroids in natural environments is extremely difficult, the results presented must be observed considering that the stiffness of synthetic materials may not be the same as natural ones and that an analogy is only made by visual comparison.
Thus, the percentage of obstruction affects the drag independently of the type of fouling that produces it. Therefore, the drag coefficients determined by this article are valid for fouling composed of mytilids (mussels), filamentous algae, or a combination of both. The observed effect of the presence of mytilids in the nets corresponded to a thickening of the threads that form the net. When representing fouling in nets with braided polyethylene ropes, as was done in this article, the thickening effect is reproduced, and given the rigidity of the material and the generation of knots, small mytilids can even be represented.
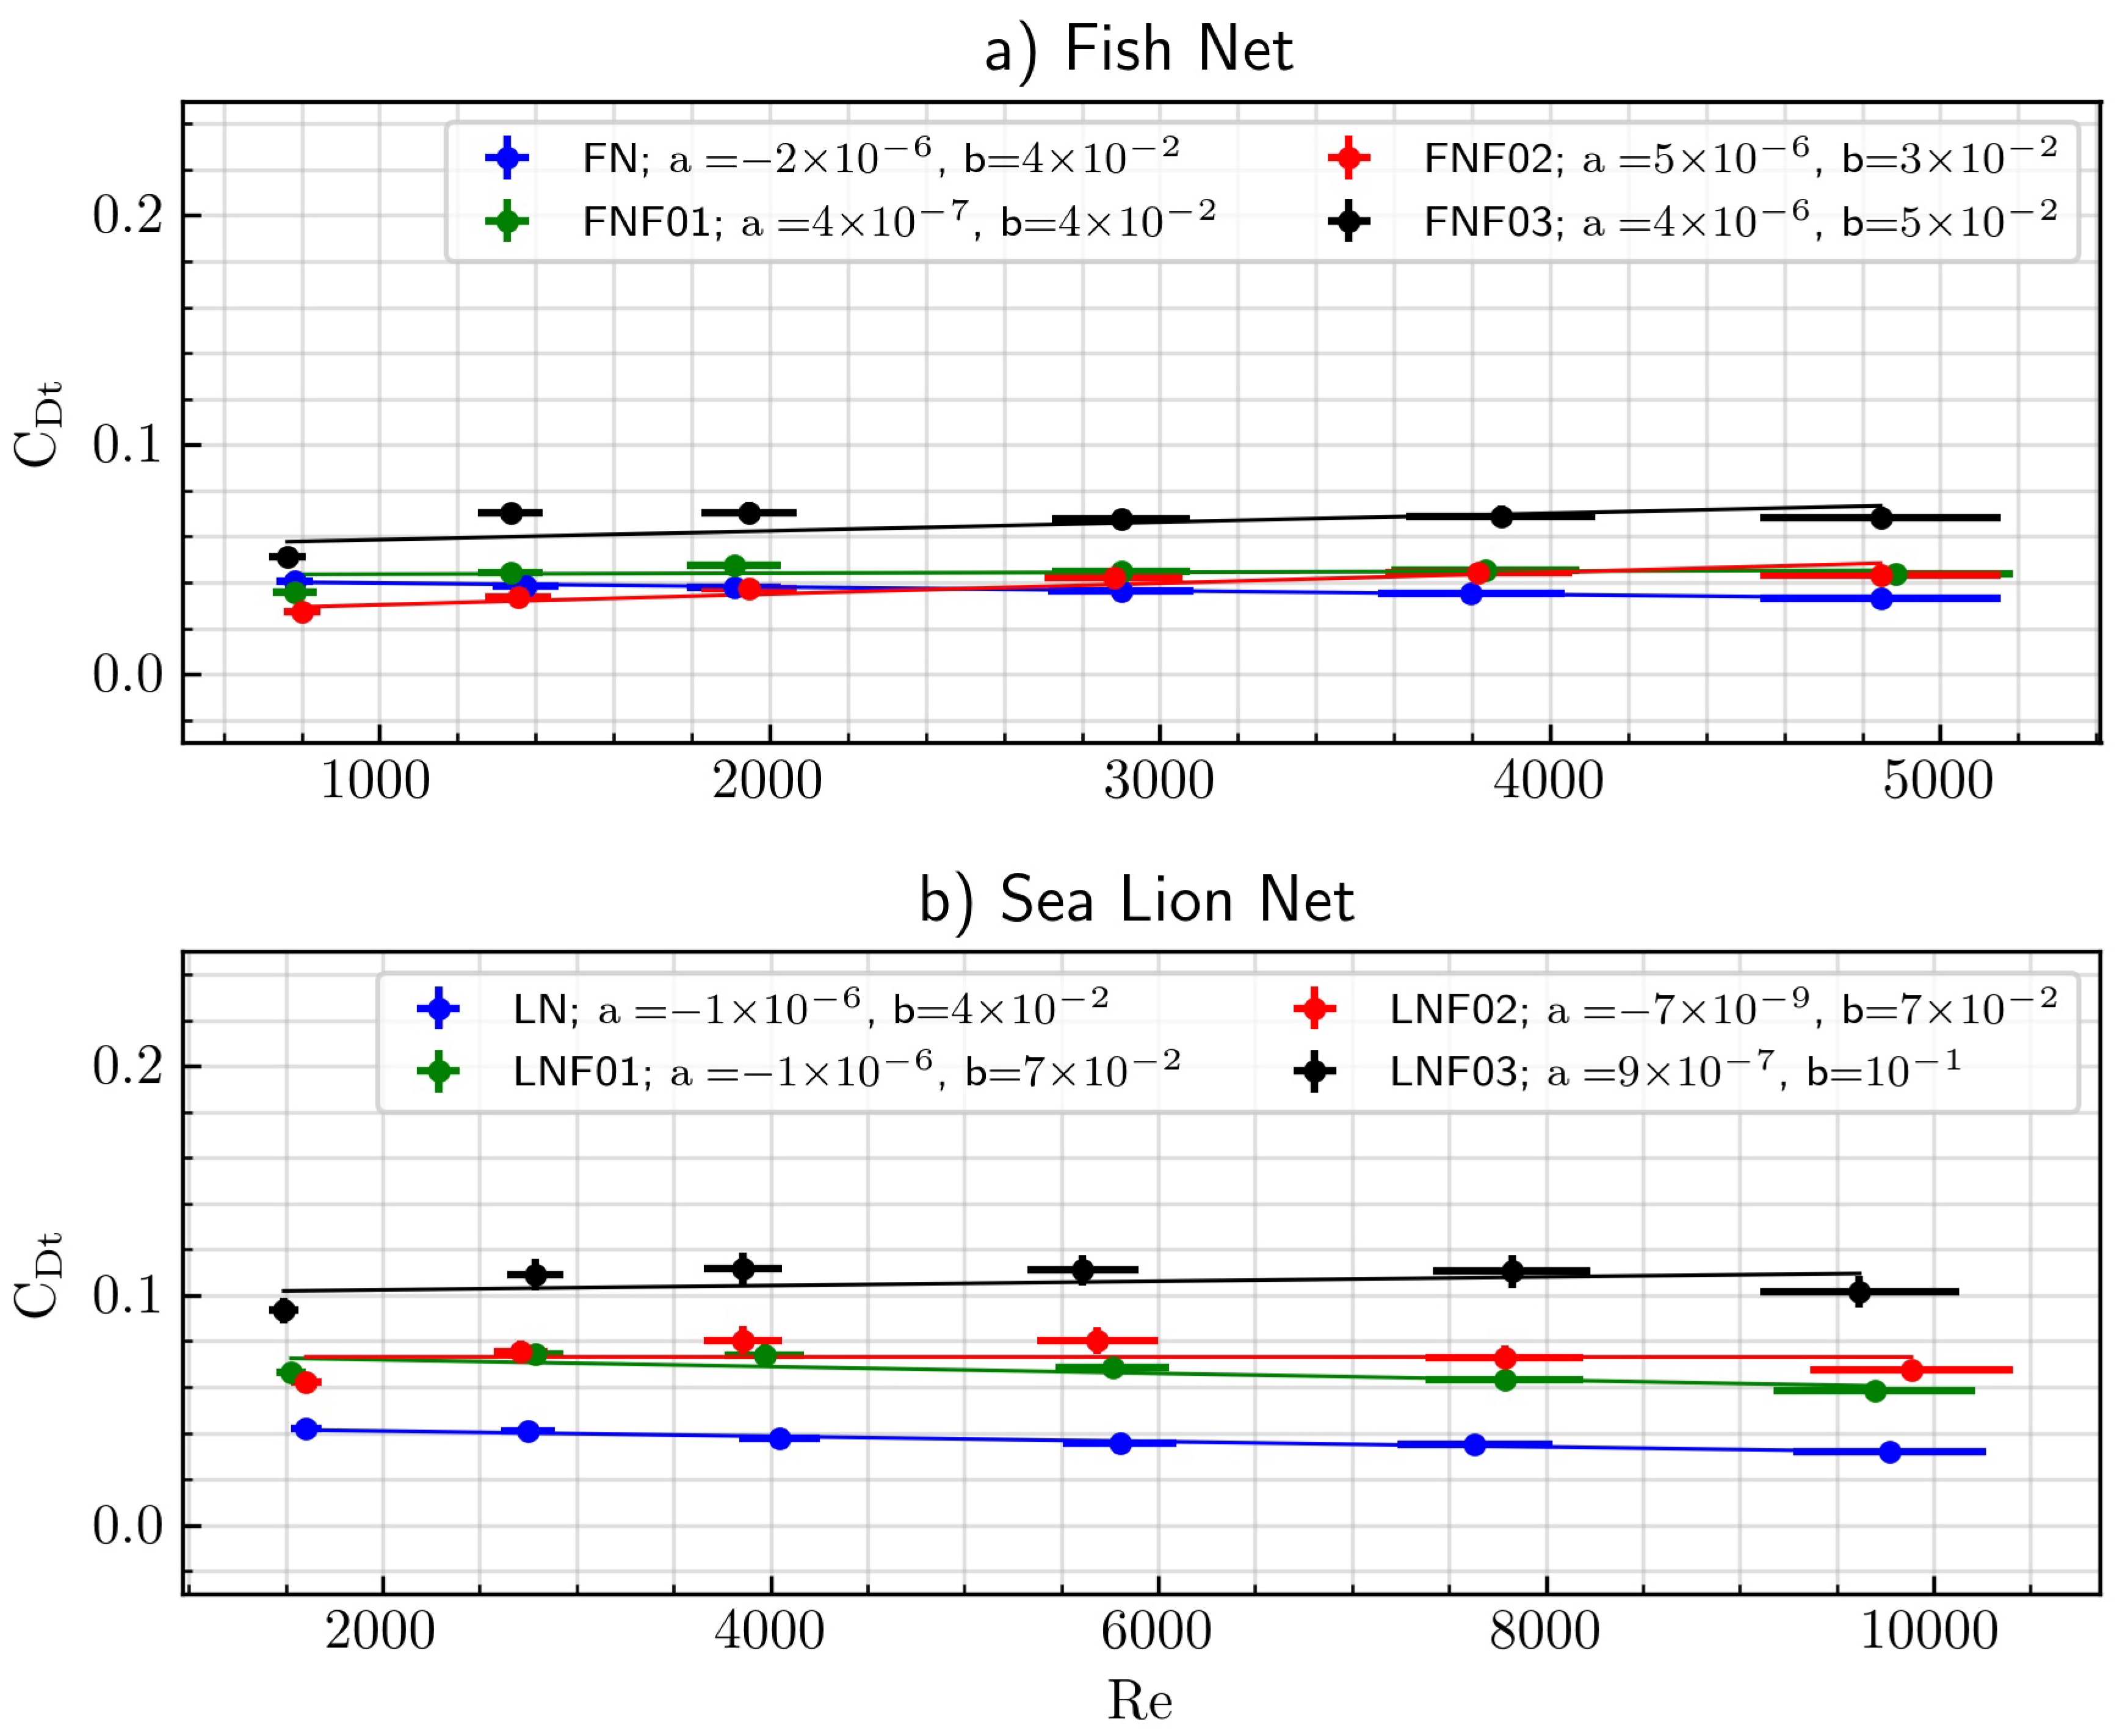
5.3. Tangencial Drag Coefficient in Clean Nets
An interesting topic of research would have been to compare the fish or sea lion nets tangential drag with the drag resulting from the development of the boundary layer, for the classic Prandtl–Blasius configuration. Two facts make the problem different. The flow does not approach a plate with negligible thickness, and the existence of regions of empty space in the plate. We are aware of only one experimental study that analyzed a configuration that can be considered close to the flow parallel to the net, i.e., the article presented by [
31]. The plate used by them had a thickness
= 12.4 mm, and had perforations of different diameters, but all with the same porosity, equal to 0.4 (corresponding to
= 0.6 in our notation). The Reynolds number was defined in terms of the thickness of the plate,
, which was in the range 2700 to 7100, almost the same as that of our research. The drag coefficient defined by [
31] is given by
, where
H is the height of the plate. Since the tangential drag coefficient
used in our study was based on
, where
is the length of the net, the following relation holds:
. Thus, both drag coefficients differ only in a coefficient, and the results obtained by [
31] can be compared qualitatively with ours. Despite the dispersion of the data, their data present a fairly constant value of the drag coefficient, independent of
. In this way, [
31] support our results regarding the almost independent behavior of
with
. Besides, it is reinforced that the net thread diameter is the appropriate length scale to define the Reynolds number.
Thus, the main scale of the tangential drag force is the diameter of the thread. A secondary scale is the grid spacing. In any case, to investigate the composed scale, we would need many nets with the same diameter but variable grid spacing and many different diameters but equal grid spacing. That research exceeds the objectives of this article.
5.4. Tangential Drag Coefficient in Nets with Fouling
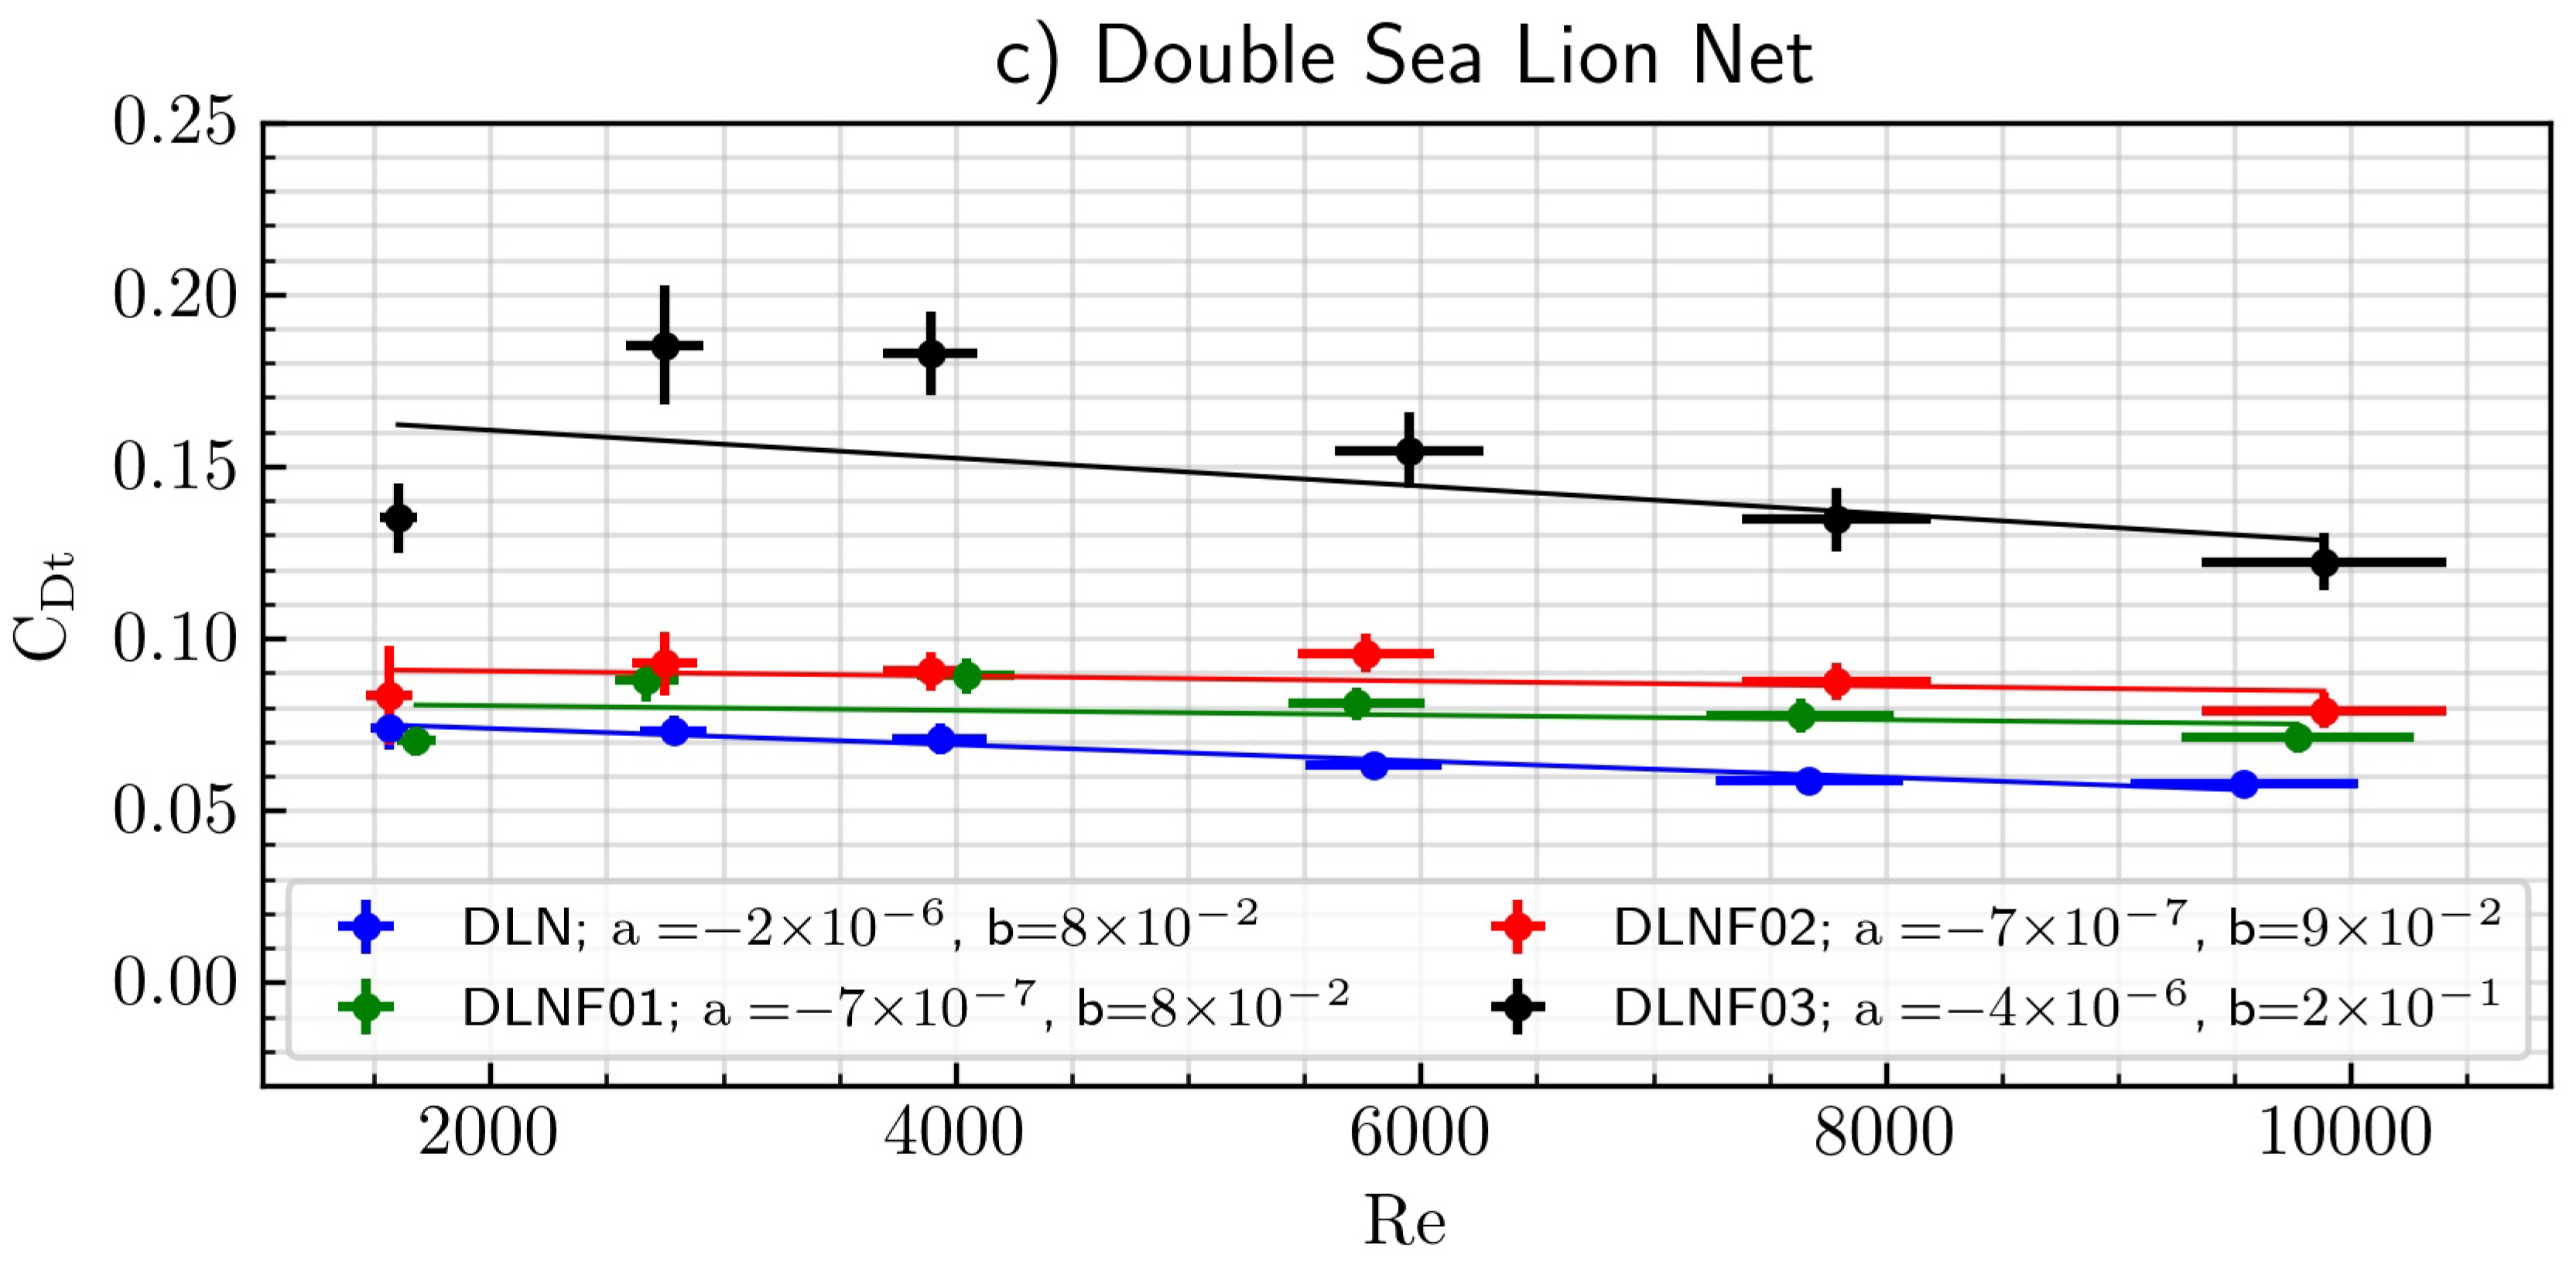
In the experiments of nets with fouling of this article, the tangential drag coefficients are independent of the Reynolds number in the range of 1000 to 5000 for fish nets and 2000 to 10,000 for the sea lion nets, with the only exception of the double sea lion net with F03. In the case of the double sea lion with F03 (), the tangential drag coefficient decreases with the Reynolds number.
For the fish nets, the tangential drag coefficients do not have a noticeable dependence with the solidity index, except for the F03 level of fouling. In the case of the F03 fish net, which has the biggest value of , the tangential drag coefficient is greater than the other cases. For the sea lion nets, the tangential drag coefficients have a linear increase with the solidity index, except for the net with the F03 fouling level, which does not clearly follow this trend.
In summary, the drag coefficient tends to increase in magnitude with the presence of fouling, without generating an appreciable change in its dependence on the Reynolds number for low fouling levels. Extreme values of this parameter (such as those reported in the cases FNF03, LNF03, and DLNF03) show a possible change in this behavior that cannot be explained with the measurements made.
6. Conclusions
Experiments in a laboratory tank have provided measurements of the normal and tangential drag forces exerted on flat nets for different flow conditions. From these forces, the nets’ drag coefficients, normal and tangential to the flow, have been obtained as functions of the Reynolds number and the solidity index of the nets. The experiments used two types of nets employed in the operation of a cultivation center: the fish net and the sea lion net, for the clean situation and real operating conditions, with fouling adhered to the nets. Additionally, a system composed of two sea lion nets was used, which simulated the configuration that exists in a cultivation center during a cage cleaning process. Polyethylene ropes were used to characterize the presence of fouling in the nets, which were braided over the nets to increase their exposed area, increasing the solidity index of the net.
For the clean fish net in the present experiments, the value varied with Reynolds numbers between 0.7 and 0.9, smaller than in the literature review, while values of clean sea lion net varied between 1.2 and 1.4, narrowly the lowest values presented in the literature review. The material of both nets was monofilament nylon, although the sea lion net had knots, while the fish net did not. Thus, the fish net had a lesser drag coefficient than all the nets from the review cited here. The sea lion net was monofilament but was knotted and had a slightly lower than the other nets from the review cited here. Therefore, intrinsically, all nets were hydrodynamically different because of their particular features—whether the material was monofilament or was braided, and whether the net was with or without knots, things that the solidity index does not include. Hence, drag coefficients should have also been different.
From the point of view of hydrodynamic forces, a higher solidity index is associated with an increase in drag force perceived by the nets and the presence of fouling is understood as an increase in the area of the nets exposed to the flow, which is interpreted as a growth of the solidity index and drag force. The drag coefficients determined by this article are valid for fouling composed of small bivalve mollusks adhered to the threads of the net, filamentous algae, and a combination of both.
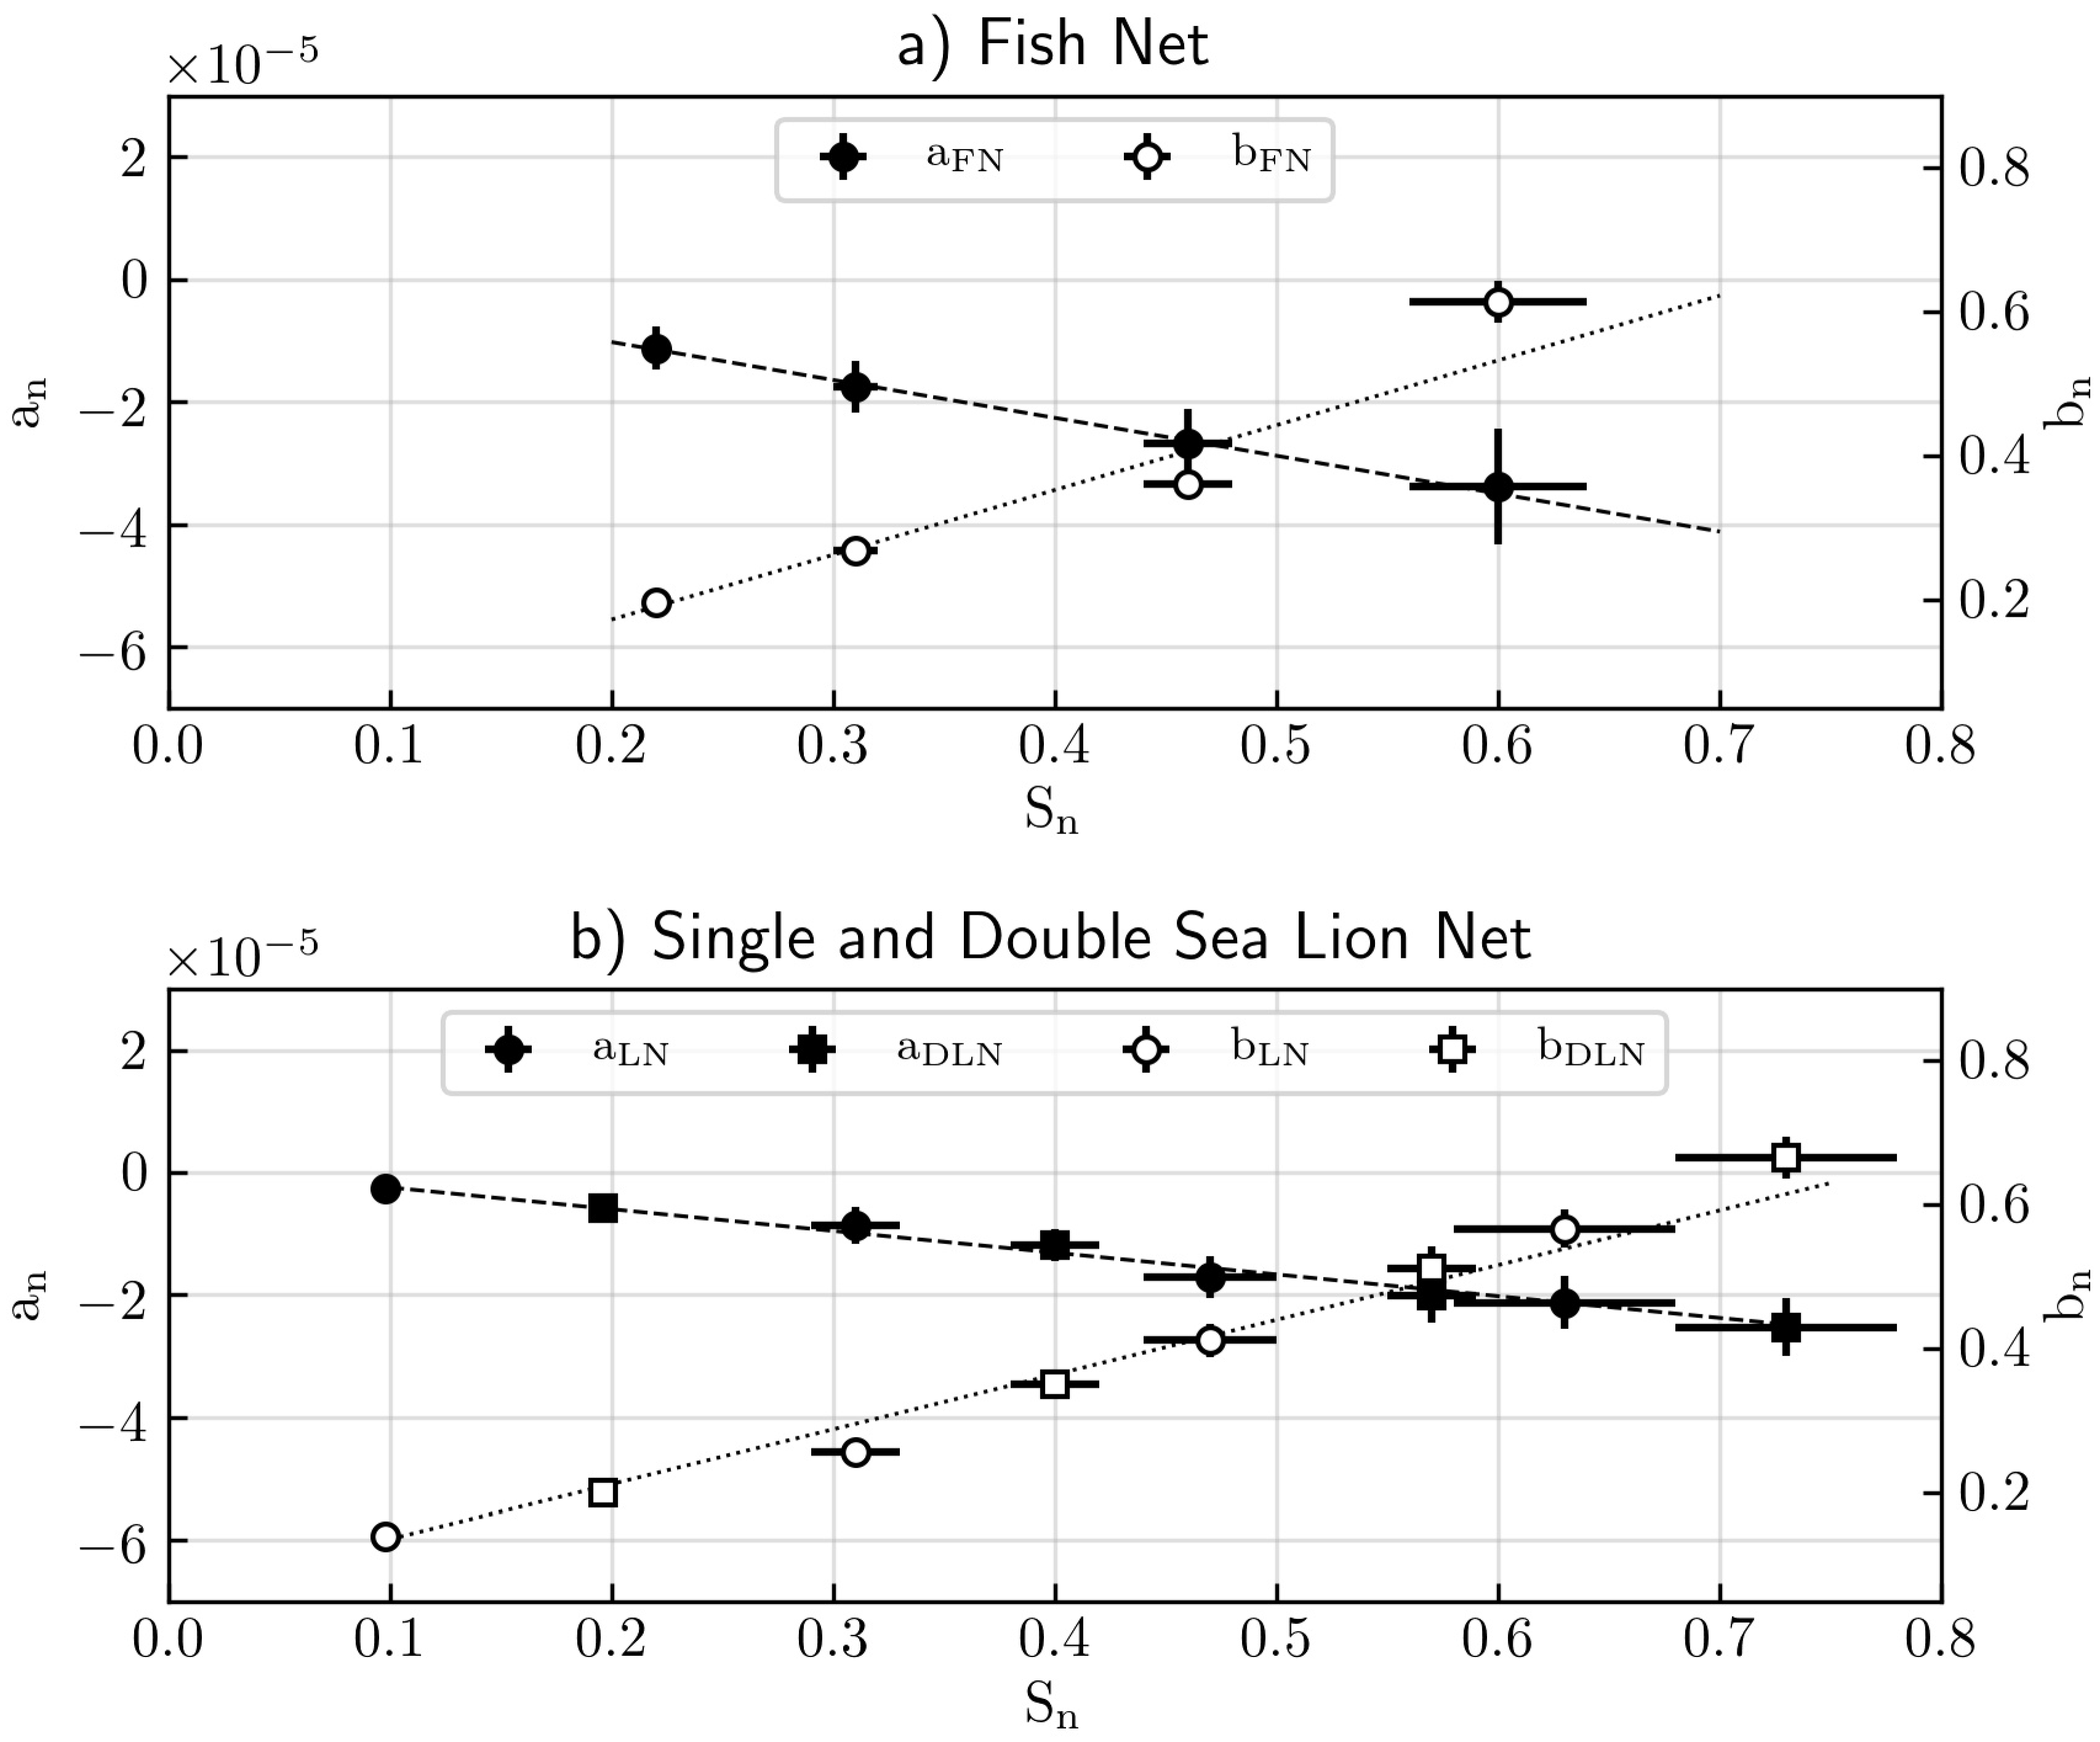
The normal drag coefficient value decreases as the Reynolds number increases for the same solidity index, an effect that is much more pronounced in nets with higher solidity indexes. The trend of the data shows that the increase in the solidity index, due to the presence of fouling or a second net, increases the value of the normal drag coefficient for the same Reynolds number. That is a result which has been verified in previous studies using fouling nets. The Reynolds number does not have a effect on the tangential drag coefficients, although the solidity index does in part. For the sea lion nets, the growth of the solidity index due to the presence of fouling or a second net, increases the value of the tangential drag coefficient, with respect to the fish net case. This increase is much more noticeable as the solidity index increases, although it does not show an effect as pronounced as in the case of the normal drag coefficient. This behavior is also recovered when the tangential drag coefficient results of the fish net are observed. For this net, the presence of fouling is seen as an increase in the value of the drag coefficient of the fish net with respect to its clean case, but only for the case of extreme fouling or solidity index.
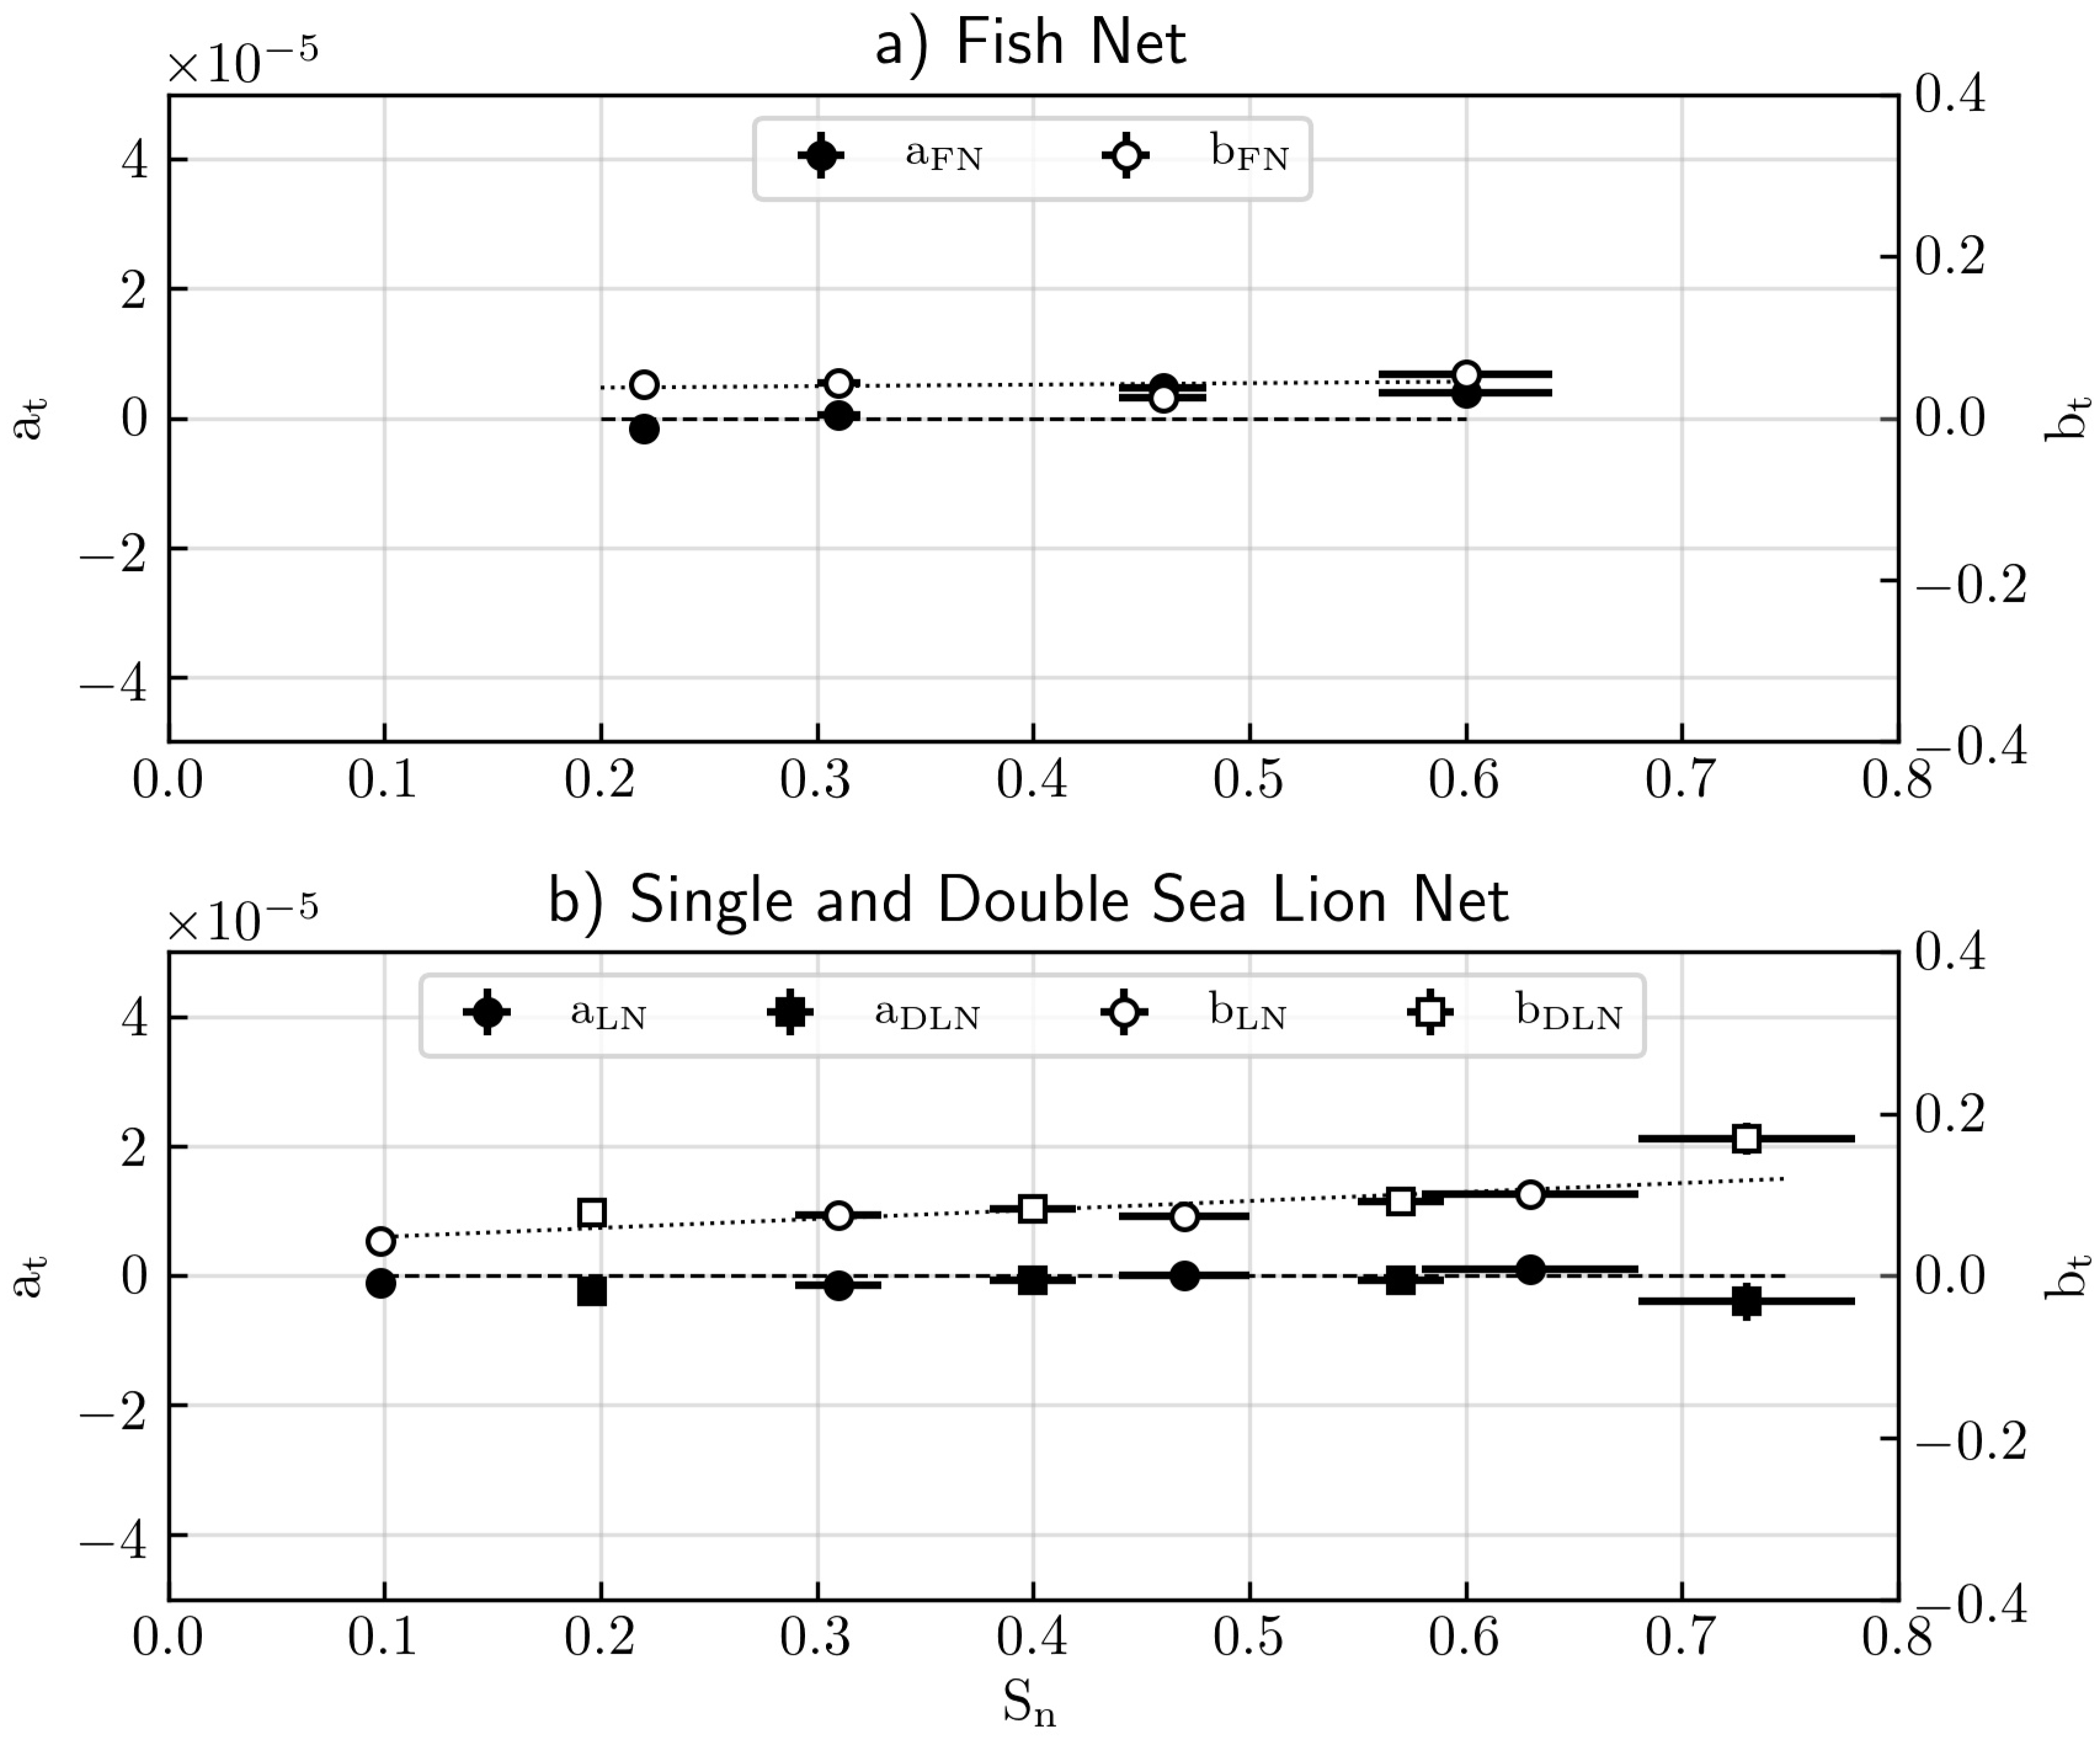
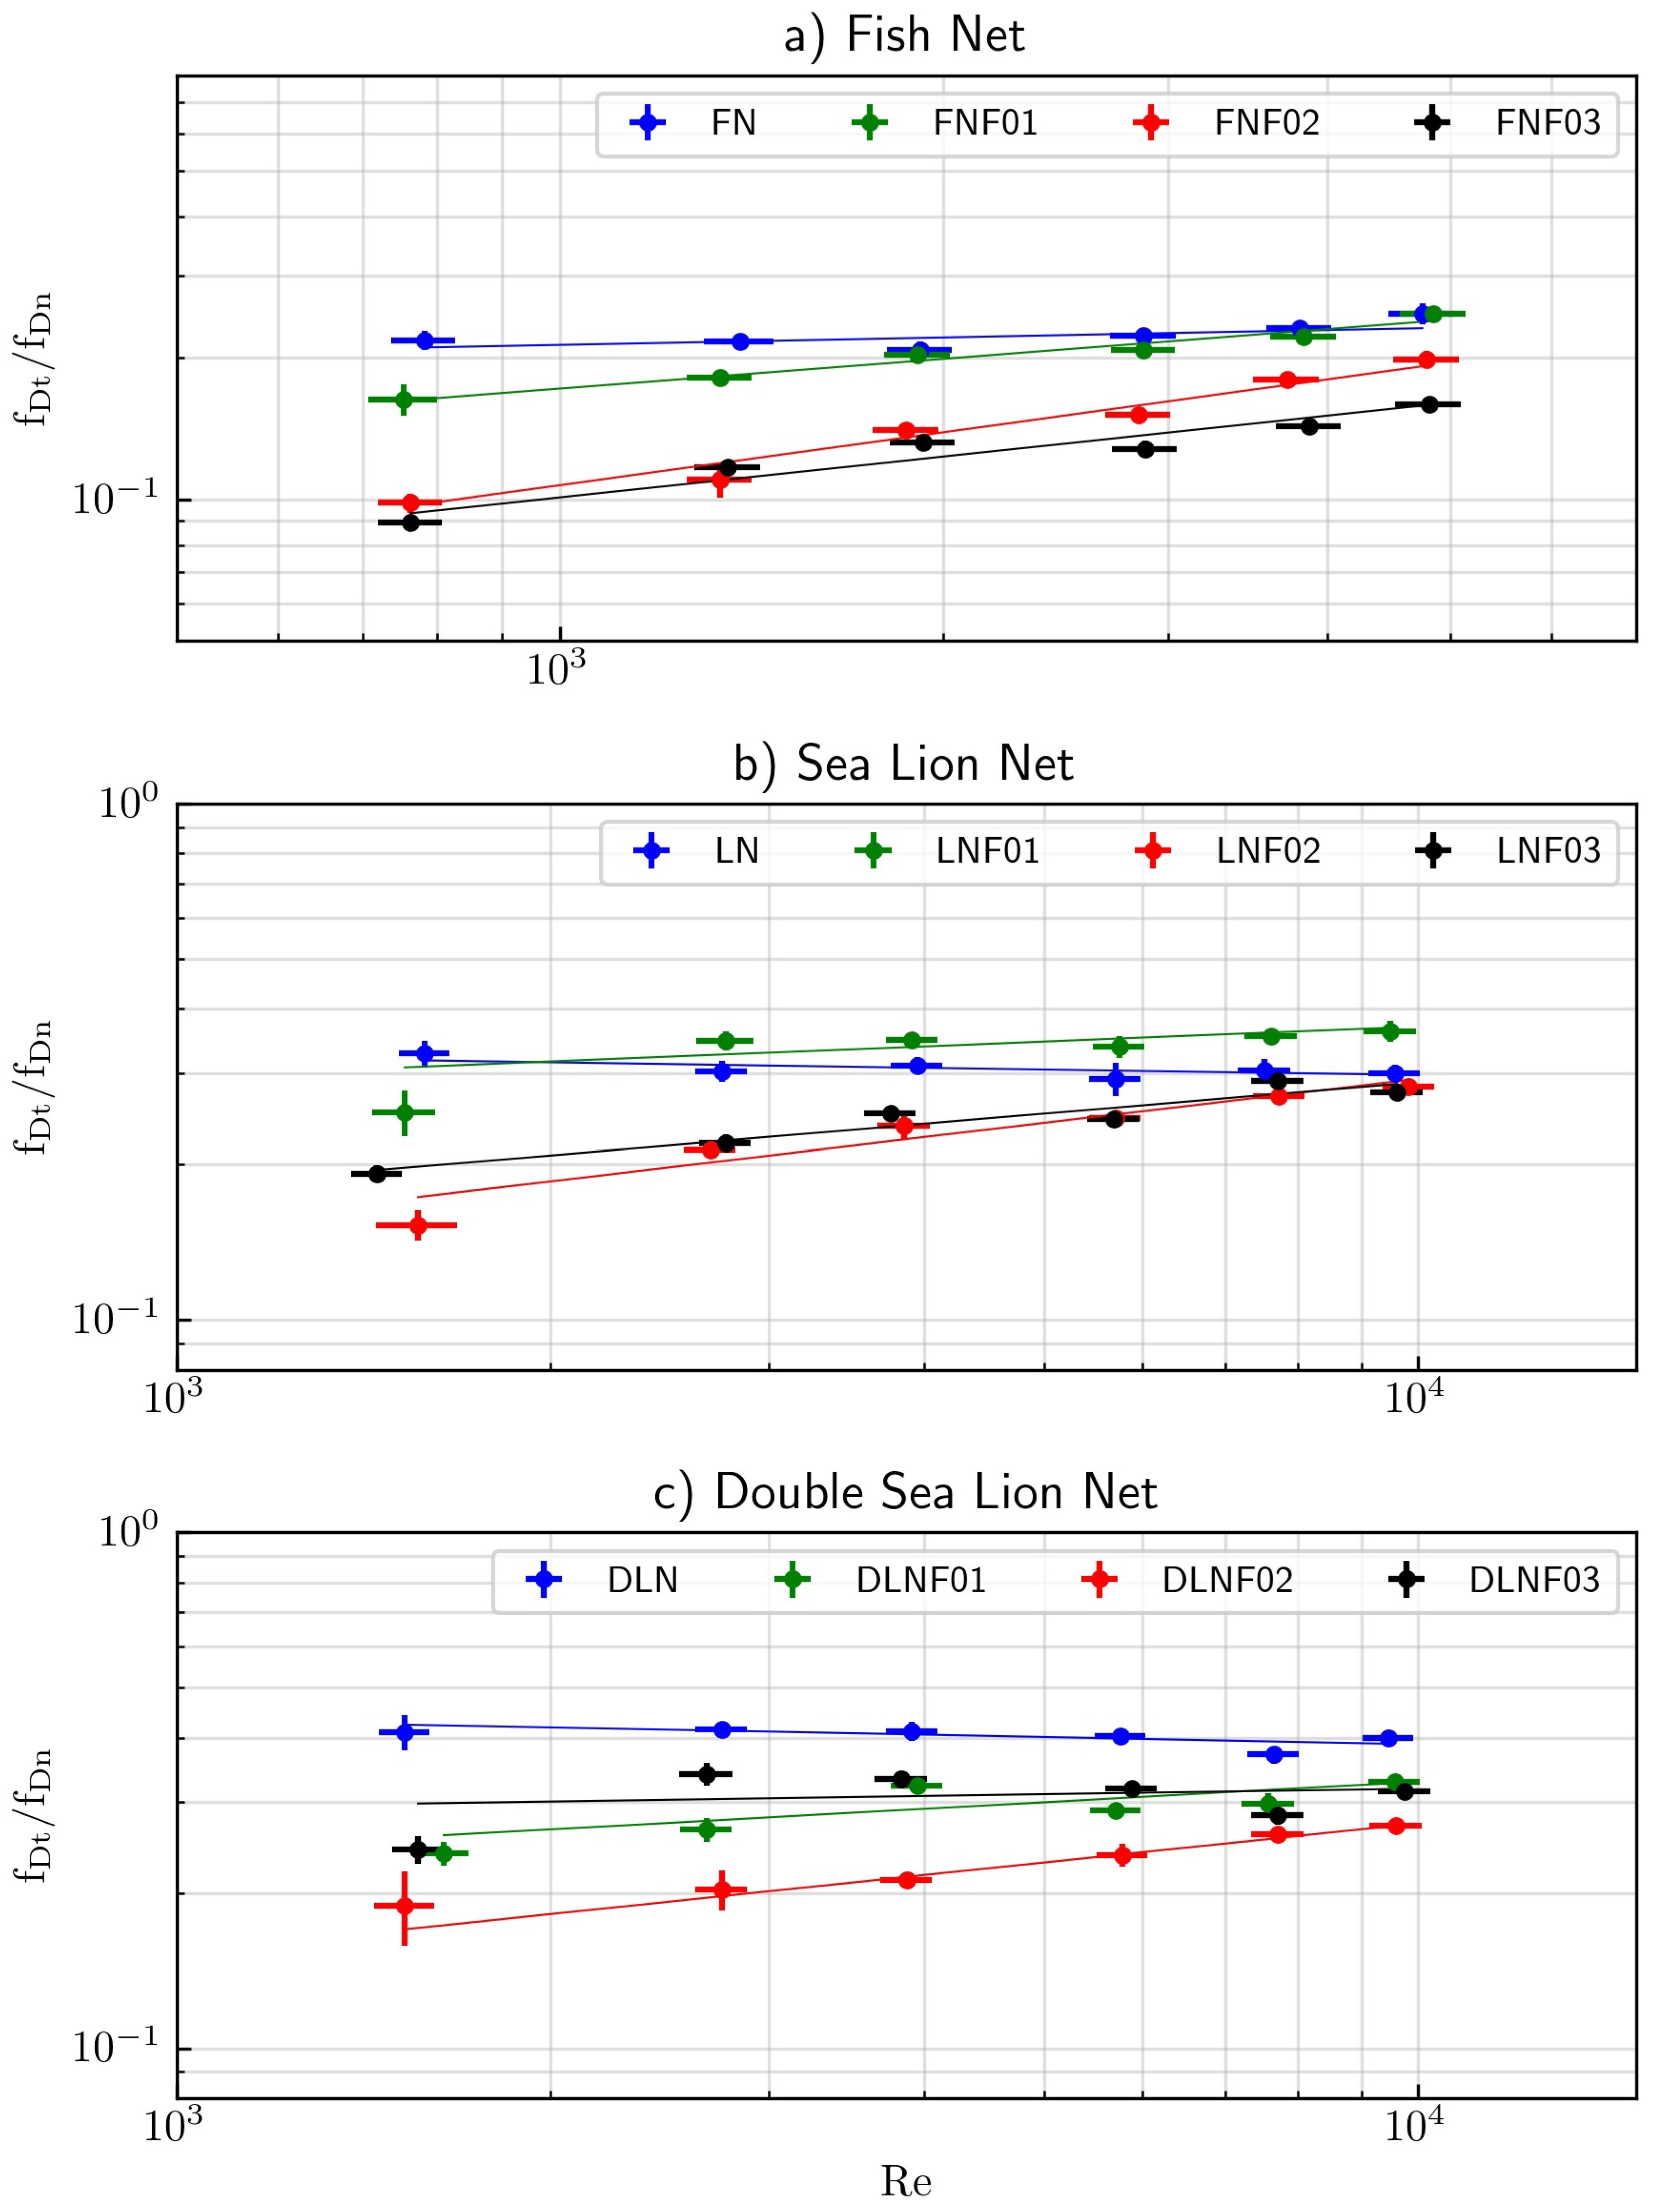
The experiments carried out considered the determination of equations of the normal and tangential drag coefficients as functions of the Reynolds number and the solidity index separately. For the normal drag coefficient, the equations are linear with the Reynolds number, and the coefficients of the equations are linear with the solidity index. The equation for the fish net is not the same as that for the single and double sea lion nets since they are different from the fluid mechanics point of view. The equations are not so accurate for the tangential drag coefficient. The Reynolds number is not a relevant parameter for this coefficient and neither is the solidity index for the fish net, but the coefficient grows slightly with for single and double sea lion nets with fouling. Extreme values of the solidity index (for fish, and single or double sea lion nets) show a possible change in the behavior of the tangential drag coefficient, which cannot be explained with the measurements made. The literature review on the drag forces of nets reports that the tangential drag force is around 30% of the normal drag force. This value is approximately an average value of the ratio for the sea lion net and is larger than for the clean fish net in this article.
Fish farming is predominantly carried out where the ecosystem is suitable for the cultivation of high demand species in the market. The flow conditions of this article correspond to velocities between 0.3 and 2.5 m/s, to characterize the speeds of the currents that are responsible for forcing the nets that make up the cultivation centers under normal and extreme climatic conditions in the southern channels of the Aysén Region of Chile.

 ,
, 


