Abstract
The fast economic development of the People’s Republic of China has created an increasing demand for usable land, resulting in large-scale land reclamations along the coastal zone. One of these regions is Tongzhou Bay (Jiangsu coast), a region characterized by large intertidal mudflats and deep tidal channels with potential for the development of agri-aquaculture and the construction of a deep-sea port. However, these intertidal mudflats also provide vital ecosystem services and support many wildlife species, including several endangered migratory shorebirds within the East Asian–Australasian Flyway. With increasing realization of the importance of maintaining such ecological values, a more integrated coastal development strategy is needed. This study aims to develop a sustainable integrated design for the Tongzhou Bay port, following a “Building with Nature” approach. We use a morphodynamic model to compute habitat suitability for two shorebird species (Great Knot Calidris tenuirostris and Bar-tailed Godwit Limosa lapponica). Several port configurations were developed on the basis of three design criteria: (1) create area for future port development, whilst (2) preserving existing high-value ecotopes for shorebirds and (3) enhance the natural accretion rate of such ecotopes. Simulation results showed a clear difference in siltation patterns, preservation and enhancement of preferred ecotopes. This work therefore demonstrates the potential and importance of morphological and habitat suitability modelling when designing large-scale reclamations and port constructions, especially in dynamic areas such as Tongzhou Bay.
1. Introduction
Coastal habitats around the world have great ecological importance as well as economic potential. As a consequence of the increased human pressure, especially over the last few centuries, there have been huge losses to coastal wetlands [1]. China, with a net growth of 6.7% in GDP in 2016, is the most rapidly developing country in the world. Here, 43.3% of the total population lives in the coastal provinces, often close to valuable wetland areas, which results in increased pressure to reclaim the wetlands. This increased demand for usable land has invited widespread coastal reclamation and resulted in the loss of coastal wetlands along the Yellow Sea and East China Sea [2,3]. This threat of natural system modifications [4] in the Yellow Sea are impacting migratory shorebirds populations of the East Asian-Australasian Flyway [2,5,6,7], since thousands of migratory shorebirds stop and refuel at these coastal wetlands during their migration [8,9,10]. For certain species of migratory shorebirds, the Yellow Sea is the crucial and only staging area during their long migration. An example is the Bar-tailed Godwit Limosa lapponica, for which the Yellow Sea is their first stop after a 6000–10,000 km non-stop flight from Australia or New Zealand, and after refueling for about 40 days there, they fly again non-stop for 4000–6000 km to reach their breeding grounds in Alaska or high arctic Russia [11].
The muddy coastlines bordering the Yellow sea are shaped by complex sedimentation and erosion processes in response to waves and currents, and react strongly to changes therein [12,13]. Large port developments will therefore affect the morphodynamic processes and morphology of the coast [14,15,16]. As earlier construction works within the Yellow and Yangtze Rivers also reduced sediment supply towards Yellow Sea intertidal areas, reducing accretion rates [17], the sedimentary habitats along the coast (saltmarshes and mudflats) will be greatly impacted. These changes in the mudflat habitats could have a negative impact on migratory waterbirds and other wildlife [18].
Over the last decade, the planning and realization of coastal infrastructural projects has started to incorporate socio-economic and natural perspectives, a design process which is referred to as “Building with Nature” (BwN) [19]. Such an approach could help solve a current conflict in coastal development at the Jiangsu coast. Along the Southern Yellow Sea (SYS) between Shandong province in the north and the Yangtze river estuary in the south, the Jiangsu coastline stretches over 994 km and now hosts several main national ports including Lianyungang, Nanjing, Zhenjiang, Nantong and Suzhou, along with several important regional ports. With initiatives for further economic development, there is an increasing demand for usable land and coastal port capacity [3,20,21,22]. As such, the development of the Jiangsu coastal zone is part of the national development strategy and include plans to develop two new deep sea ports at Jianggang and Tongzhou Bay on the southern Jiangsu coast [23]. However, this coastline provides key intertidal habitats for many shorebird species in the East Asian-Australasian Flyway [5,24,25], and the proposed development of Tongzhou Bay would strongly interfere with the habitat required by migratory shorebirds [5]. In 2013, construction on the first phase, the Tongzhou Bay port at the Yaosha-Lengjiasha shoals, was started [26]. The reduced tidal flat area increases pressure on the ecosystem and have raised ecological concerns. A more sustainable integrated approach is required for such coastal developments [21,27].
In this contribution, taking the development of the Tongzhou Bay port as a case study, we demonstrate how the “Building with Nature” concept can be used to more sustainably designed land reclamations. To quantify and validate habitat response to port development at Tongzhou bay, we elaborate further on the work of Muller et al. [28], who developed a hydrodynamic model to form a ecotope map for Tongzhou bay. We expand on this approach by combining hydro- and morphodynamic modelling and shorebird distributions. Shorebirds, specialized inhabitants of intertidal flats worldwide [29,30], are very useful integrative indicators of the state and the ecological quality of intertidal areas [31]. We used distributional data generated from satellite tracking of individuals of two shorebird species, the Bar-tailed Godwit and Great Knot Calidris tenuirostris. These two species were selected as their populations are declining and threatened by habitat loss and degradation in their staging areas in the Yellow Sea [6,7]. They are widely distributed in the East Asian-Australasian Flyway and previous studies have established their dependence on the Yellow Sea for refuel during their migration [11,32]. Moreover, they have different habitat and diet requirements, with the Great Knot mainly feeding on hard-shelled molluscs [33,34] and the Bar-tailed Godwit feeding on a variety of prey including polychaete worms, molluscs and crustaceans [25,35,36,37]. The ecotope use of these two species can be illustrative for which ecotopes are important for approximately 30 other shorebird species that occur at the Jiangsu coast (see [5,8,24]). Subsequently, several alternative port configurations are developed and simulated for the effect on morphology and habitat development. Finally, conclusions are drawn from these alternative designs for the Tongzhou Bay testcase, demonstrating the effectiveness of this systematic approach.
Methodologies to quantify such alternative designs are still largely under development. We expand on an approach by Muller et al. [28], who quantified the impact of designs on wetland habitat by constructing an ecotope map. In this paper, we develop an interactive ecotope map in which the morphodynamic response of the environment to an intervention (siltation, erosion) is also accounted for.
2. Methods for Sustainable Coastal Development
Water infrastructure works, such as port development, river deepening and land reclamations, are essential for economic development. However, such interventions also impact ecology and geomorphology (e.g., van Maren et al. [38]; Wang et al. [39]; Winterwerp et al. [40]). The traditional method to deal with such adverse impacts was to evaluate positive and negative effects on long and short term and intensify dredging legislation. Traditional port design primarily focuses on primary objectives, e.g., the accessibility for vessels and connection with the hinterland [41]. Impact on nature and ecosystems is often limited to an inventory of the risks and designating compensation. Moreover, this often conflicts with environmental legislation and results in delays [42]. This fairly passive approach toward infrastructural development is changing, however. In the last decade, significant steps have been taken in more integrated dredging and reclamation activities (e.g., port development, with contemporary cases in the Netherlands [43,44,45]) and elsewhere [46]. Here, economic development is combined with not only compensating, but also creating larger opportunities for wetland ecosystems. It is increasingly realised that water infrastructure development can also positively influence the environment (through, e.g., Building with Nature solutions; [19]).
Traditionally, designs were evaluated for their performance, focusing on operational objectives in terms of hydrology. However, a lack of knowledge regrading sediment transport and the relation of these processes to local and regional geomorphology resulted in negative effects on engineering performance (e.g., higher siltation rates in channels and harbour basins) and ecosystems (e.g., loss of habitat). Water infrastructure projects are part of a system (e.g., ecosystem) and the projects will both affect and be affected by the processes operating within that system. Integrating the concept of sustainability into our infrastructure projects will help us identify opportunities to cooperate and collaborate with natural processes, rather than seek to control them. The BwN program [19,47] implements this approach by allowing natural processes to contribute to objectives in the design process. This requires profound knowledge of the system and the parameters and key indicators on the state of a system that we want to change, i.e., a natural system, coral, mudflats or socio-economic state.
The original design for Tongzhou Bay port was the total reclamation of intertidal flat, resulting in a dramatic loss of high-value ecotopes and inevitable loss of important habitat. Moreover, the current wetland ecosystem is already under pressure due to declining wetland habitat from past reclamations activities [48]. In order to come up with more integrated alternative designs, we define the following criteria: (1) the design should provide a well exploitable area for port development (e.g., close to natural channels and over shallow easy-reclaimable shoals), and (2) simultaneously maintain crucial wetland habitat, providing vital ecosystem services and (3) enhance natural accumulation of these habitats to fully support the wetland ecosystem. For the port design, we were guided by various designs that were made (taking into account potential port layouts, economic viability assessments, port accessibility such as approach channels, turning basins and connectivity with the hinterland [26,49]).
3. Study Area
3.1. The Jiangsu Coast and Tongzhou Bay
The Jiangsu coast is influenced by two distinct large-scale tidal circulations. These are the anti-clockwise rotary tidal wave in the northern part of the Southern Yellow Sea (SYS) and the progressive tidal wave in the SYS coming from the Pacific, converging at Jiangang [50,51,52,53] creating a “rope-skipping pattern” [54,55]. These patterns are mostly governed by the shape and dimensions of the Bohai, Yellow and East China Seas [56] and are negligibly influenced by the nearby Yangtze river [57]. Near Tongzhou Bay, the semi-diurnal tide has a tidal range of 3.9 m (measured at Lüsi station; [54,56]).
Confined by parallel intertidal ridges, tidal currents in the channels are nearly bilinear with average flow velocities of 1.0~1.2 m/s [55]. The mean velocities during flood and ebb current do not differ significantly [58]. Due to the complex topography between ridges and channels, waves have a limited fetch and only limitedly propagate into the tidal channels, and local wave heights are therefore small [59,60,61]. The wind and wave field varies seasonally, with larger wave heights during winter than in summer [62]. Although waves are important for re-entrainment and higher suspended sediment concentrations (SSC) in winter than in summer [55,63], they are too small to substantially influence long-term geomorphodynamics (as reflected in the tide-dominated large-scale morphology).
The Jiangsu coast can be divided into two distinct geomorphological zones: the northern Abandoned Yellow River Delta (AYD) and the fan-shaped Radial Sand Ridges (RSR) in the south (Figure 1b). The AYD is a typical river–wave dominated delta that was formed by the large fine-grained sediment load carried by the Yellow river, until the river shifted its course towards the Bohai sea in 1855 AD [64]. Upon abandonment and continuing until the present, the former delta started to erode. The RSR consist of a large fan-shaped radiate system of mudflats and channels that vary from 2m to 20m deep [51]. Sediments were deposited here by the Paleo-Yangtze River Estuary [65,66,67]. As the Yangtze shifted south, the former river courses gradually became tidal channels and tidal currents reworked sandy deposits into long extensive shoals. The combination of abundant sediment supply, large-scale tidal currents create and maintain the typical sand ridge field at the Jiangsu coast [50,53]. The RSR system is in an overall trend of accretion, partly resulting from sediment supply from the AYD [68,69], maintaining a typical convex-up cross-shore profile [57,70,71].
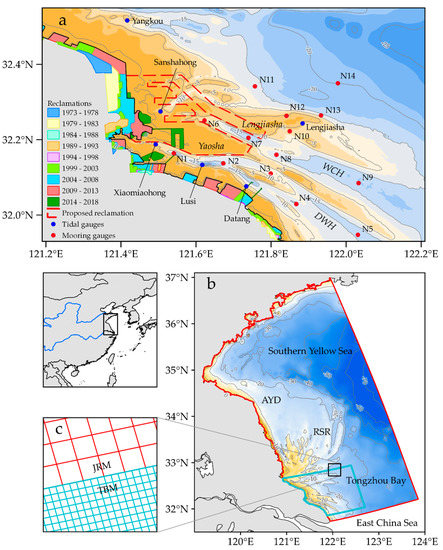
Figure 1.
Study area with: (a) Regional setting of shoals and channels at Tongzhou Bay situated at the southern Jiangsu coast. Indicated are past reclamation activities, including the outline of the proposed Tongzhou Bay port (red dashed line) [49]. Measurement locations at Tongzhou Bay, where M-stations (blue) are waterlevel gauges and N-stations (red) measured current velocity and direction and sediment concentration among others; (b) Computational domains of the Jiangsu Regional Model (red) and Tongzhou Bay Model (blue); (c) A close-up of the grid domain shows the coupling and different resolutions between the two “online” coupled grids of the Jiangsu coast (JRM) and Tongzhou Bay (TBM).
Tongzhou Bay (Figure 1) is located in the southern part of the RSR. It is characterized by a deep tidal Dawanghong (DWH) and Wangcanghong (WCH) channel, which continue into the Xiaomiaohong (XMH) and Sanshahong (SSH) channel, respectively. The channels are intersected by narrow tidal ridges, extending into larger shoals such as the Yaosha shoal and Lengjiasha shoal further landward.
The grain size of sediments along the Jiangsu coast increases in the offshore direction with clayey silt or clay predominantly deposited near the Mean High Water (MHW) line, (sandy) silt along the coastline (3.9~62.5 μm) and fine sand more offshore (125~250 μm) [72,73,74,75]. The tidal flats in the Southern RSR and Tongzhou Bay are wider with finer sediments than in the Northern RSR, as most of the finer material originates for the Yangtze sub-aqueous delta instead of the AYD [74,76]. The southern deflection of the present-day Yangtze River plume results in a limited influence of fresh river-borne sediments at the Southern RSR [17,77].
3.2. Ecotope Classification
Since ecotopes describe the relation between the abiotic system and biotic elements (in this case: migratory birds), they are often used as tools in determining maintenance and habitat development policies [78]. Ecotopes are defined by basic hydrodynamic properties (flooding frequency and salinity) and sediment characteristics (mud content). These abiotic parameters vary in time and space, especially in response to an intervention. However, such modifications in abiotic parameters can be predicted with state-of-the-art geomorphological models. In order to predict the impact of interventions on ecotopes, an existing and well-validated model is used and extended with a morphological module (Section 4.1). We will first describe the ecotopes in more detail hereafter.
Ecotopes in the Tongzhou Bay system are quantified using the ZES.1 method [78], developed for saline open waters ecosystems in the Netherlands, but also applied for the complete Wadden Sea covering the coastline of Germany and Denmark as well [79]. The Bouma et al. [78] classification scheme is based on the flooding frequency, substrate, salinity, and flow velocity. However, the analysis of available field data [49,57] revealed only small variations in salinity as well as a homogenous soft substrate over the Tongzhou Bay domain, and therefore we simplify their classification scheme by omitting subdivisions based on salinity and substrate. Depth classification is based on tidal data (I), such as Mean High Water Spring (MHWS) and Mean Low Water Spring (MLWS). An additional depth sub classification (II) is based on a certain depth below MLWS, consistent to Bouma et. al. [78]—see Figure 2. The flow velocity distinguishes low-energy from high-energy waters with a threshold value of 0.8 m/s. This value approximates conditions for the initiation of bed forms, signaling a change in ecotope distribution in the Wadden Sea [78,79]. The classification based on the dryfall period is largely consistent with ZES.1 method, although a lower limit of the high-range littoral of 60% was chosen to better match bird habitat field observations [32,80]. By assigning a color scheme to each ecotope (Figure 2), an ecotope distribution map can be drawn.
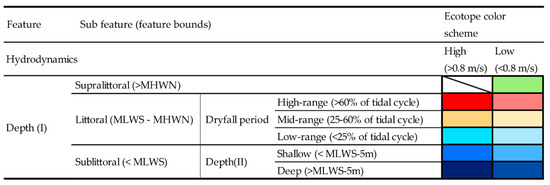
Figure 2.
Ecotope feature classes and feature bounds.
3.3. Shorebird Distribution
An ecotope only describes a potential niche for the possible occurrence of a certain habitat, and therefore the ecotope map needs to validated with field observations of certain species (Section 5.1). For this purpose, we use the distributional data of the two selected shorebird species, the Bar-tailed Godwits and Great Knots. These data were acquired through tracking of individual birds by satellite-tags (5 g and 9.5 g solar Platform Terminal Transmitters, Microwave Telemetry, MD, USA) from their northwest Australian “non-breeding” areas, Roebuck Bay (17.98° S, 122.31° E and Eighty Mile Beach (19.40° S, 121.27° E) (for details on tag deployment, see [32]). We analyze 317 location fixes obtained between April 2015 and May 2018 within the study area, collected from the 13 tracked Bar-tailed Godwits and four tracked Great Knots which stopped there during their migration. We first retain the locations in the class 3, 2, 1 and A and remove locations of class B as those have an error radius that is too large for the size of our study area [81]. We then select locations collected during low and mid-tide, i.e., when water level is lower than the 70% quantile of a sample of predicted water level (every 10 min for a month) of the study area, assuming that this is the period when the birds are feeding during the tidal-cycle. From these locations we select those that are at least 15 min apart from one another. If there are more than one location within 15 min, we select the point with highest accuracy, or the earliest point in the case of ties. Next, we estimate Kernel Density home ranges from these locations for each species, using the “Heatmap” plugin in QGIS 2.18.11 [82]. The radius of each point is two times the published 68% percentile error radius [81] and is weighted by the inverse of this radius. Thus, each point has the same “heat”, but is more concentrated (for class 3 locations) or spread out (for the less precise class 2, 1 and A locations).
4. Tongzhou Bay Morphodynamic Model
4.1. Setup
The applied hydrodynamic model is presented by Muller et al. [28], and for details on grid design and bed levels (Figure 1) we refer thereto. We do briefly reiterate the hydrodynamic model results and subsequently extend the model with a morphodynamic module. The hydro- and morphodynamics at Tongzhou Bay are quantified using the Delft3D numerical model [83]. Delft3D solves the Reynolds-averaged Navier–Stokes equations, under the shallow water and the Boussinesq assumption on a staggered grid by a finite difference scheme. The long-term morphologic development of the Jiangsu coast and Tongzhou bay is mainly driven by tidal flows [53,55]. Waves have only a minor effect, which is confirmed by sensitivity simulations with a SWAN-based wave model, but not reported here.
The whole model application includes the Jiangsu coast (JRM domain) to resolve large-scale tidal dynamics, and is refined near Tongzhou Bay (TBM domain) through domain decomposition (Figure 1b).The JRM is driven by a series of astronomical tides at its two open boundaries. These were derived from a set of 13 tidal harmonic components from a large-scale tidal wave model of the Bohai, Yellow and East China Sea for a full morphological year time-series [56].
The JRM was set-up with four sediment fractions (16, 45, 90 and 180 μm, resembling fine silt, silt, very fine sand and fine sand respectively), following [84]. An extra cohesive fraction was added to account for finer suspended material prevalent in the shallow coastal waters of Jiangsu coast. Sediment transport is calculated using an adaptation of the transport formulas of van Rijn [85,86] by Yao et al. [84]. Cohesive sediment transport was modelled using the Partheniades [87] erosion equation and a permanent deposition flux.
At the two open boundaries of the JRM, a constant sediment concentration is prescribed: a constant sediment concentration of 0.5 mg/L and 20 mg/L at the eastern boundary and a linear decreasing concentration of 3 mg/L and 200 mg/L (from 0 > zb > −30 m, where zb is the bedlevel) to 0.5 mg/L and 20 mg/L (offshore) at the southern boundary for the 16 μm and cohesive fraction respectively. This was carried out to account for the higher concentrations of fine sediments near the coast that are normally caused by larger residual nearshore currents. Equilibrium sediment concentrations were prescribed for the coarser sand fractions. A 1.5 m thick sediment layer was prescribed at the bed: a thin layer (0.02) m of cohesive sediment and 25% of the remaining 1.48 m for each of the other four fractions. All fractions are vertically mixed in the bed.
The model was calibrated for the period 3 February to 3 March 2012. An initial sediment concentration was prescribed that resembled conditions similar to 2 months of spin-up: 200 mg/L for the cohesive fraction (and zero for sand and silt). During simulation of the different port configurations, the model is set to run for 20 morphological years using a MorFac acceleration technique [88].
The performance of the model was validated by comparing the water level, tidal current velocity, direction and the sediment concentration calculated and measured during spring and neap tidal conditions from 22 to 23 February 2012 (spring tide) and 29 February to 1 March 2012 (neap tide) at 14 mooring stations and six tidal gauges at Tongzhou Bay (Figure 1a).
The model performance was quantified by computing Model Efficiency (ME) and bias (PB). The Nash–Sutcliffe Model Efficiency coefficient [89] is defined as:
where m is the measured value; p is the predicted or calculated value by the model; is the mean measured value and Δm is the error in the measurements, as introduced by van Rijn et al. [90]. The model performance can be classified as#excellent (ME > 0.65), very good (0.5 > ME > 0.65), good (0.2 > ME > 0.5) or poor (ME < 0.2) [91,92].
The bias (expressed in percentages) is given by:
where the numerator can either be in case of and if . The absolute value of the percentage bias is classified in four classes: excellent (|PB| < 10%), very good (10% <|PB| < 20%), good (20%< |PB| < 40%) and poor (|PB| > 40%) [91,92].
4.2. Validation
A large number of model runs were executed as part of a model calibration procedure not reported here. Instead, we only present the agreement between data and calibrated model run, focussing on (1) waterlevels, (2) flow velocity and SSC, and (3) ecotope distribution.
Waterlevels were collected at six tidal gauges. The model agreement with these data is excellent based on Model Efficiency scores (ME > 0.65) and good (Xiaomiaohong and Datang station) to very good (other stations) based on the model bias—see Figure 3.
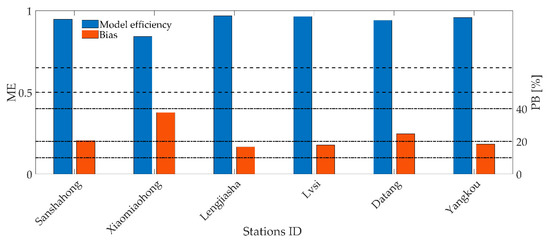
Figure 3.
Model Efficiency and Percentage Bias for the calculated waterlevels at the six tidal gauges.
Current velocity and SSC were measured at 14 moorings for two consecutive tidal cycles during both spring and during neap. The agreement of the model with the current velocity, magnitude, and SSC is synthesized in Figure 4. The magnitude of the current velocity is slightly better resolved than its direction based on the Model Efficiency (nine stations excellent for magnitude, four for direction). The model bias, however, indicates the direction is better resolved (most stations classified as “very good”) than the magnitude (mostly “good”). Stations N10, N12, and N13 provide a cluster of stations performing more poorly than the other stations (albeit still “good” according to both verification metrics). This could be related to errors in the bathymetric data (for which computed velocities are very sensitive) or complex local hydrodynamics. The flow velocity and direction is most poor reproduced at station N6 (scoring “poor”): here, significantly lower flow velocities were measured during ebb (peak flow of < 0.3 m/s) than computed. Station N6 is located in a relatively narrow channel, and therefore the flow velocity varies spatially. When the flow varies greatly on the scale of grid cell size, the model cannot accurately reproduce the observed flow velocity.
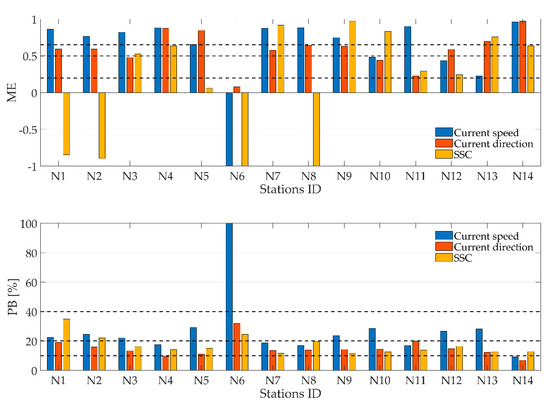
Figure 4.
Model efficiency and bias in percentages for the calculated current velocity, direction and suspended sediment concentration at the 14 mooring stations.
The accuracy of the computed SSC varies more among the various station than the hydrodynamics based for the Model Efficiency. At the upper reaches or shallower sections of the channels (i.e., N1, N2, N6 and N8) the model performance is “poor” (ME = −0.2–−0.5). In this case, the model overestimates the concentrations compared to the measured values. The model bias, however, suggests that the computed sediment concentration is at least as accurate as the computed hydrodynamics.
The data–model agreement of a relatively poorly performing station (N1, XMH) and a well-performing station (N7, SSH) is explored in more detail in the time domain (Figure 5) for spring-neap and intra-tidal variability. The data show that tidal currents at both stations are (1) fairly symmetric (the ebb current velocity is comparable to the flood current velocity) and (2) the spring tidal current velocity is typically twice as high during spring tide than during neap tide. The modelled current velocity reveals the same patterns, which is important for modelling sediments. Although some deviations exist between the data and the model, there is no systematic ebb-flood asymmetry (as in the data).
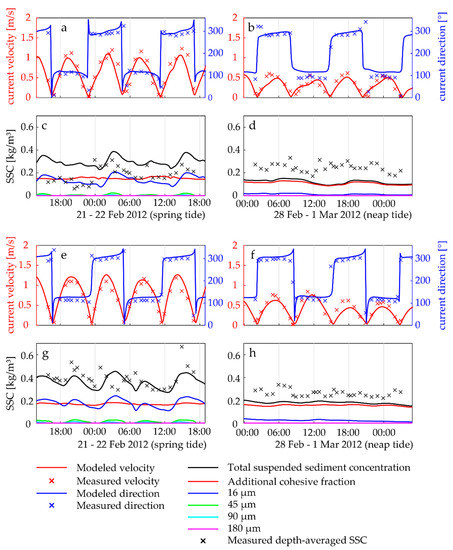
Figure 5.
Calculated and measured current velocities, direction and suspended sediment concentration at monitoring stations N1 (a–d) and N7 (e–h), located at the upper Xiaomiaohong inlet and Sanshahong inlet, respectively. The left panels correspond to spring tidal conditions (21 February 2012 until 22 February 2012), the right panels correspond to neap tide conditions (28 February 2012 until 1 March 2012).
The measured suspended sediment concentrations vary typically between 150 and 300 mg/L, which are typical values for the Jiangsu coast and Tongzhou Bay [55,59]. SSC varies fairly little over the tidal cycle—especially during neap tides. This suggests the presence of a slow-settling sediment fraction of which the sediment concentration is fairly independent of the hydrodynamics, providing a background sediment concentration. During spring tide, a tidally varying sediment concentration is superimposed on this background concentration, as more sediments are resuspended from the bed. This background concentration was the motivation for adding a cohesive sediment fraction to the model of Yao et al. [84]. The concentration modelled agrees better with the data during spring than during neap tide. At station N1, the measured concentration during neap tide is higher than during spring tide. The reasons for the higher neap tide concentrations are probably related to higher wind velocities during neap tide conditions (up to+m/s) than during spring tide conditions. The measured SSC at station N7 is higher during spring than during neap, and also better reproduced by the model (except for a slight underestimation of neap tide SSC). The model also suggests that the bulk of the suspended sediment is the fine cohesive sediment fraction and the fine silt fraction (spring tide only).
In absence of morphological data for calibration, we analyze the resulting sediment transport patterns phenomenologically. The total depth-averaged suspended sediment transport was retrieved for four consecutive spring-neap cycles with a 1-h interval (Figure 6). The net bedload transport was several orders smaller than the net suspended transport and therefore not included in the analysis. Mean suspended transport is directed through XMH and SSH, showing a net import of sediment through the tidal channels. Inside SSH, the suspended transport becomes segregated. A large part of the suspended material crosses over the lower parts of the Lengjiasha shoal and a smaller part is transported up the Sanshahong channel. Although, smaller than the transport rates in the tidal channel, a northward flux over Yaosha suggests most of the sediment supply comes from the Xiaomiaohong channel.
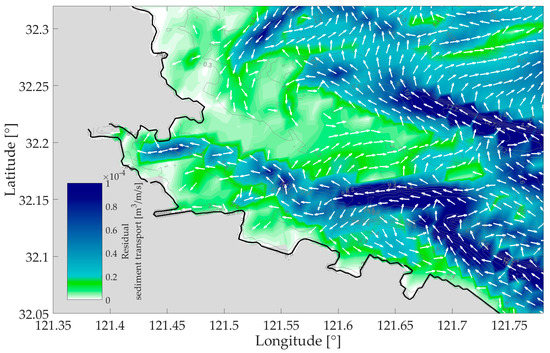
Figure 6.
Calculated mean total sediment transport at Yaosha for four consecutive spring-neap cycles. To illustrate the significant mean transport over Yaosha, a lower transports rate limit is included of 7.0 × 10⁻⁶ m3/m/s.
5. Ecotope Distribution
5.1. Initial Conditions
The model output is converted into an ecotope map (Figure 7) using the definitions summarized in Figure 2. The main color scale indicates the littoral zones, whereas the low and high hydrodynamic conditions are represented by lower or darker shading. The stronger hydrodynamic conditions roughly coincide with the overall bathymetry of the channels. The Yaosha shoal ranges from low-range littoral at the outer edges up to high-range and supralittoral close towards the current seawall.
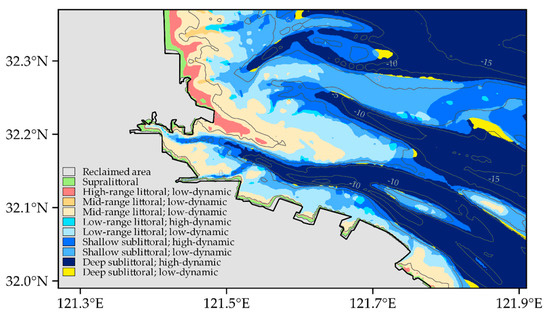
Figure 7.
Ecotope map of Tongzhou Bay corresponding to 2012, adapted from Muller et al. [28].
To determine ecotopes important for the two shorebird species (Bar-tailed Godwit and Great Knot), we analyse the satellite-tracked distributional data in two spatial scales. First, to show the areas where these species generally occurred within the entire study area, the 90% Kernel density contours, representing the home range of the species, are calculated and overlaid onto the ecotope classifications (Figure 8). Bar-tailed Godwit and Great Knot occur mostly in the mid-range low dynamic littoral zone, with 30% and 35% of their 90% home range areas overlapping with this ecotope type (Figure 9).
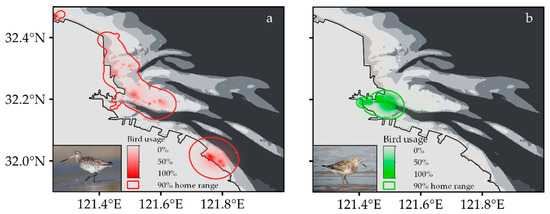
Figure 8.
Ecotope map of Tongzhou Bay overlaid with Kernel density home ranges generated from satellite-tracking data of the (a) Bar-tailed Godwit and (b) Great Knot.
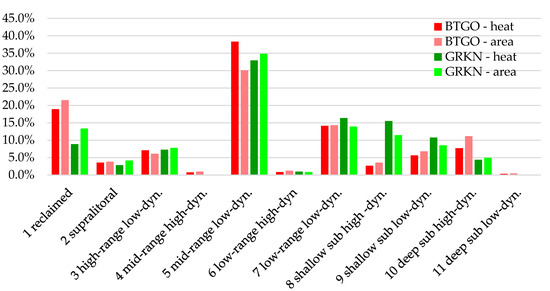
Figure 9.
Percentage of “heat” (Kernel density) and area of the 90% home range overlapping with each type of ecotope for Bar-tailed Godwit (BTGO) and Great Knot (GRKN).
Second, to show ecotopes that are more intensely-used within the 90% home range, we calculate, of the total “heat” (i.e., the sum of Kernel density in each output raster cell) within the 90% home range, the percentage that falls in each ecotope. The “heat” thus reflects the density of bird occurrence at that raster cell. For a specific ecotope, if the percentage of “heat” that falls within it equals the percentage of area, it means that the birds use the ecotope in proportion to its area. If the percentage of “heat” is higher than the percentage of area, it reflects that birds prefer to utilize those ecotopes, and vice versa. Put together, Bar-tailed Godwit occurs mostly in the mid-range low dynamic littoral zone and select for it (38% heat vs. 30% area). While 22% of their 90% home range overlap with the reclaimed zone, it was selected against with only 19% of the heat falls within that ecotope. The low-range low-dynamic littoral zone was used in proportion to its area (14%), and Godwits also show a slight preference for the high-range low-dynamic ecotope (7% heat vs. 6% area). For Great Knots, besides the mid-range ecotope, they show a preference for low-range (17% heat vs. 15% area) and shallow-subtidal range ecotopes (26% heat vs. 20% area).
This species difference resembles visual observations in areas along the Jiangsu coasts [5,25]. While the mid-range littoral zone is important for these species, the other zones occurring in its proximity are also important. The difference in intensity of use of ecotopes between the two species reflect that the higher (high and mid-range) littoral zones and the lower (low-range and shallow subtidal) littoral zones possibly supporting different sets of species that differ in prey preferences and foraging tactics.
5.2. Alternative Port Configurations
The originally proposed Tongzhou Bay port (Figure 1) will result in the total reclamation of the earlier established high-value ecotopes and an inevitable loss of important habitat. To come to more sustainable alternatives, the BwN recipe is followed by applying the previously gained insight from initial ecotope distribution and driving natural mechanisms, e.g., model results on transport and siltation patterns, which yield the desired transition in ecotope distribution over time.
Three alternative designs for the Tongzhou Bay port are examined, these are alterations in overall shape, extent and use of offshore terminals based on the original port design. All configurations consist of the partial reclamation of the Yaosha shoal, where configuration v1 and v2 both reclaim the northside of Yaosha. The concept of the design is to capture the landward sediment transport though XMH over the southside of Yaosha and increase local siltation at the shoal. Configuration v2 is disconnected from the shoreline, creating a bypass for flow and transports along the reclamation. The third configuration v3, consists of the reclamation of the southern Yaosha shoal. Situated adjacent to the XMH channel, it provides good marine and hinterland accessibility for port development, as well as preserving the initial high-value ecotope at Yaosha. Conversely, this configuration would block the transport from XMH and yield less sedimentation at the shoal.
The impact of these designs on siltation patterns and ecotope distribution was simulated using the Tongzhou Bay model over a period of 20 years (Figure 10). A reference case was defined for the validated 2012 situation, in which no reclamation activity takes place (other than the pre-2012 reclamations). Each variant is assessed on their performance in enhancing the natural growth of the earlier established high-value ecotopes relative to the reference case. Although we do show results of all computed ecotope developments, we only discuss the littoral classification (i.e., supra-, high/mid/low-range littoral and shallow/sub littoral) as these are relevant for shorebirds. The initial and final area of each ecotope of each configuration and reference case are retrieved (Table 1), including the net gains or losses at the end of the simulation, due to direct loss to infrastructure or indirect loss due to temporal turnover of ecotopes. These net gains and losses of ecotope are further examined by gathering the net cumulative growth over time for each configuration (Figure 10).
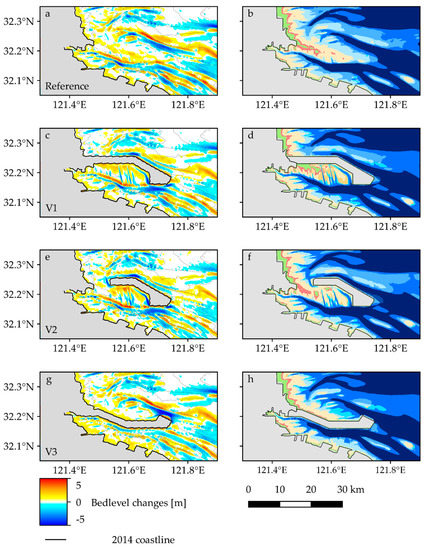
Figure 10.
Left: Total siltation for 20 years of morphological development without further reclamations (a) and configuration v1 (c), v2 (e) and v3 (g). Right: Ecotope distribution after 20 years of development for the reference case (b) and configuration v1 (d), v2 (f) and v3 (h).

Table 1.
Total ecotope area [ha] at the start (2012) and end (2031) of the simulation for the reference case and each configuration. The total net cumulative growth or decline during this period for each case is shown between brackets.
For the reference case, strong sedimentation takes place at the higher elevated intertidal areas and the southern edges of Yaosha and Lengjiasha and erosion in the adjacent tidal channels, making tidal flat edges progressively steeper (Figure 10a). Unfortunately, no historic data are available to setup nor validate a morphological hindcast. However, this steepening of the mudflat is also observed at similar mudflats along the Jiangsu coast, which is driven by (longshore) tidal currents [59,93]. Additionally, the Yaosha shoal–channel system indeed migrates southward [94] (similar to other channel-shoal systems along the Jiangsu coast [95,96]). The siltation at the center of Yaosha can also be seen in the increase of supralittoral at the center of Yaosha (Figure 10b). Comparing the growth rate, the increase of supralittoral (+2282 ha) and mid-range littoral (+991 ha) is much stronger than high-range littoral (+126 ha) (Table 1, Figure 11). As can be observed, the high-range littoral converts faster into supralittoral than it gains from mid-range littoral.
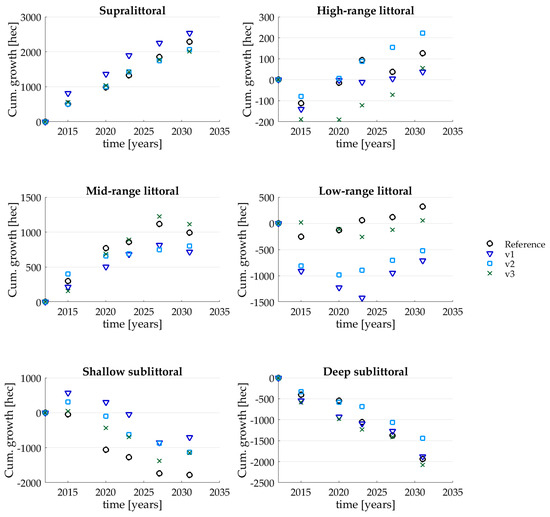
Figure 11.
Net cumulative ecotope growth during 20 years for v1, v2, v3 and the reference case.
For configuration v1, the connected reclamation leads to higher siltation rates compared to the reference case, with most of the siltation shifting to the backside of Yoasha along the reclamation (Figure 10c). As a consequence, the mid-range littoral develops into high-range littoral and supralittoral and yields a larger growth of supralittoral (+2537 ha), relative to the reference case. The other surrounding intertidal areas do not show significant ecotope transition. However, strong erosion patterns can also be observed at the shoal itself (Figure 10d). This scouring of the shoal and along the edges of the reclamation is driven by a concentrated return flow during ebb. This can also be recognized in the development of high-dynamic sublittoral and an eventual smaller growth of mid-range littoral (+715 ha), compared to the reference case (Table 1, Figure 11).
Configuration v2 shows similar results compared to v1, including higher siltation and development of high-range and supralittoral at the center of Yaosha, as well as the development of ebb-tidal channels (Figure 10e). However, due to the disconnected reclamation from the shoreline, the tide generates higher flow velocities over the shoal during high tide and local siltation rates are therefore lower. This effect is also notable by comparing the transition of mid-range littoral into high-range and supralittoral for v1 and v2. Due to the disconnection with the mainland, ecotope development tends to stabilize at high-range littoral (Figure 10f). As such, v2 yields less growth in supralittoral (+2067 ha) and a larger area of high-range littoral (+222 ha) is gained (Table 1, Figure 11).
Although configuration v3 is similar to v2, the siltation rates of Yoasha shoal are lower and less of the mid-range littoral grows into high-range littoral (+55 ha) and supralittoral (+2012 ha), compared with the reference case and other configurations (Table 1, Figure 11). However, higher siltation is predicted at the southern banks of XMH and erosion rates within the channel are lower (Figure 10g). This can be readily explained with the reduction in the tidal prism in the mudflat-channel system and subsequent reductions in tidal flow velocities. The higher siltation rates at the southside are further recognizable by low-range littoral transitioned into mid-range littoral (Figure 10h), yielding a higher growth (+1110 ha) relative to the reference case (Table 1, Figure 11).
6. Discussion
In this study, we characterized the preferred ecotopes of the two shorebird species, the Great Knot and Bar-tailed Godwit, and we demonstrated the effect of different port designs on promoting the preservation and enhancement of their preferred ecotopes. However, we should be aware that ecotopes (as defined in this study by hydrodynamic conditions) could only characterize a main abiotic determinant of the habitat suitability for these species. Intertidal habitats serve as foraging sites for migratory shorebirds, and ultimately migratory shorebirds need a high density of good quality prey in these sites for fueling up for their migration [34,97]. Although habitats with the right abiotic features are crucial to support a high density of prey organisms, processes that determine prey densities, such as the settlement of the larvae of the prey species, could still have a large impact on prey densities. The relationship between hydrodynamic conditions and sediment properties and prey densities is complex and largely unknown. One example is in Yalu Jiang Estuary, Liaoning, China, where densities of the main prey of the Great Knot and the Bar-tailed Godwit, Potamocorbula laevis, have collapsed and one suspected cause is the changes in hydrodynamic conditions and sediment characteristics caused by a port development adjacent to the site [98]. Moreover, there are other factors determining habitat suitability, such as danger of predation, competition with other species, the level of disturbances in roosts and distances between suitable roosts and foraging sites [99]. In particular, the current preferred ecotopes (mid-tidal zone) happens to be close to the current seawall. Since shorebirds in the study area used aquacultural ponds with shallow water close to the seawall as roosting habitats during high tide, the current ecotope preferences might also be partly driven by their proximity to suitable roosting habitats, because shorebirds tend to forage at habitats close to their roosts, so they can conserve energy in daily commuting [99]. Therefore, our recommended port design would be only the first step towards the conservation of these species. Once the intertidal mudflats with the right abiotic conditions are created, settlement of larvae of the main prey of shorebirds, i.e., certain species of benthic macroinvertebrates (worms and shellfish) can be monitored. And, if necessary, artificial seeding and the translocation of shellfish stocks originating from other mudflats, which are very common aquaculture practices in China [100], could be carried out. Moreover, reducing human disturbances and creating suitable roosting sites close to the foraging habitats could be the next steps to improve habitat quality for migratory shorebirds in the study area.
This contribution presents a new approach for the coastal management of the Jiangsu coast. For this large stretch of coast that has high ecological value, the current method would allow for a more sustainable port design with better insight into the combination of design requirements. Moreover, we see many opportunities for further improvement. The ecotope–species comparison could be expanded with more species of birds of variable ecological requirements, and even other taxa on lower trophic levels. A further improvement could be to use the bird distributional data to determine the boundary values of the parameters (hydrodynamics, depth) of the ecotopes, to create a species-specific “ecotope”/“species-tope”. One way to achieve this is to integrate tools in the ecological literature, such as species distribution models [101], into our current approach. This allows for the direct calculation of how much preferable habitat of a species is lost/gained for each port design. Additionally, this contribution did not use all requirements for future potential port development reclamation. Including a broader set of requirements will lead to more robust solutions, and other options such as recreational needs can also be incorporated.
7. Conclusions
In this study, we propose and follow a novel approach to engineer new sustainable solutions for coastal infrastructure development and applied it to the Tongzhou Bay port case. System knowledge was acquired in the form of hydro-morphodynamical modelling, ecotope distribution and unique bird spatial distributional data. Gaining a better understanding of the natural dynamics and ecosystem services led to a potential solution that would not only allow for further port development, but also enhance the natural growth of valuable habitat. The following conclusions are made:
- 1.
- Full reclamation of the main shoal (as originally planned) will result in the loss of high-value ecotopes and the populations of birds utilizing them. Partial reclamation of the shoal will reduce the loss of valuable ecotopes, especially when accounting for morphological feedbacks. Partially reclaiming the south side of the shoal, for instance, leads to a reduction in currents and transport fluxes whereas partial reclamation of the north side strengthens siltation rates (which is positive for habitat suitability).
- 2.
- In order to increase the accuracy of the created ecotope map, it is recommended to increase the set of abiotic features and data sources for the ecotope classification and subsequent validation. More input of ecological and societal needs will increase the potential of the alternative design. Relevant and consistent measuring campaigns are important to achieve a better insight.
- 3.
- The BwN approach allows for multi-value design, where economic–social and natural needs can be included at an early stage. Multidisciplinary cooperation between different specialties will lead to a more successful end solution in terms of sustainability and societal support.
Author Contributions
Conceptualization, J.R.M.M., Y.-C.C., T.P., Y.-p.C., S.G.J.A., J.-f.T., Z.G., Z.B.W. and D.S.v.M.; Data curation, J.R.M.M., Y.-C.C., C.J.H. and J.-f.T.; Formal analysis, J.R.M.M. and Y.-C.C.; Funding acquisition, J.R.M.M., Y.-P.C., S.G.J.A., Z.G. and Z.B.W.; Investigation, J.R.M.M. and Y.-C.C.; Methodology, J.R.M.M. and Y.-C.C.; Project administration, J.R.M.M.; Resources, T.P., S.G.J.A., C.J.H. and J.-f.T.; Supervision, Y.-P.C., S.G.J.A., J.-f.T., Z.G., Z.B.W. and D.S.v.M.; Validation, D.S.v.M.; Visualization, J.R.M.M.; Writing—original draft, J.R.M.M., Y.-C.C. and D.S.v.M.; Writing—review & editing, J.R.M.M., Y.-C.C., T.P., Y.-P.C., S.G.J.A., J.-f.T., Z.G., Z.B.W. and D.S.v.M. All authors have read and agreed to the published version of the manuscript.
Funding
This research was funded by the National Key Research and Development Program of China, grant number 2017YFC0405401 and the Science and Technology Project of Traffic and Transportation in Jiangsu Province, grant number 2017ZX01.
Acknowledgments
The authors would like to acknowledge Chang-kuan Zhang, Zeng Zhou, and Ao Chu at Hohai University, who contributed importantly to the data analysis and model development. The satellite tracking was funded by the Spinoza Premium 2014 awarded by the Netherlands Organization for Scientific Research (NWO) to T.P., by the MAVA Foundation, Switzerland, with additional support from NWO TOP-project “Shorebirds in Space”, WWF-Netherlands and BirdLife Netherlands. We acknowledged the Yawuru People via the offices of Nyamba Buru Yawuru Limited for permission to catch birds on the shores of Roebuck Bay, Broome, Western Australia, traditional lands of the Yawuru people. Y.-C.C. was supported by private donors through the Ubbo Emmius Fund of the University of Groningen (fundraising by Tienke Koning and Wilfred Mohr), by the Spinoza Premium 2014 to T.P. and by the University of Groningen. The financial support by the Lamminga Foundation to J.R.M.M. is also greatly acknowledged. We thank the three anonymous reviewers for there critical and constructive comments.
Conflicts of Interest
The authors declare no conflict of interest.
References
- Davidson, N.C. How much wetland has the world lost? Long-term and recent trends in global wetland area. Mar. Freshw. Res. 2014, 65, 934–941. [Google Scholar] [CrossRef]
- Ma, Z.; Melville, D.S.; Liu, J.; Chen, Y.; Yang, H.; Ren, W.; Zhang, Z.; Piersma, T.; Li, B. Rethinking China’s new great wall. Science 2014, 346, 912–914. [Google Scholar] [CrossRef] [PubMed]
- Chen, Y.; Dong, J.; Xiao, X.; Ma, Z.; Tan, K.; Melville, D.; Li, B.; Lu, H.; Liu, J.; Liu, F. Effects of reclamation and natural changes on coastal wetlands bordering China’s Yellow Sea from 1984 to 2015. Land Degrad. Dev. 2019, 30, 1533–1544. [Google Scholar] [CrossRef]
- Salafsky, N.; Salzer, D.; Stattersfield, A.J.; Hilton-Taylor, C.; Neugarten, R.; Butchart, S.H.M.; Collen, B.; Cox, N.; Master, L.L.; O’Connor, S.; et al. A Standard Lexicon for Biodiversity Conservation: Unified Classifications of Threats and Actions. Conserv. Biol. 2008, 22, 897–911. [Google Scholar] [CrossRef] [PubMed]
- Piersma, T.; Chan, Y.-C.; Mu, T.; Hassell, C.J.; David, S.; Peng, H.-B.; Ma, Z.; Zhang, Z.; Wilcove, D.S. Loss of habitat leads to loss of birds: Reflections on the Jiangsu, China, coastal development plans. Wader Study 2017, 124, 93–98. [Google Scholar] [CrossRef]
- Piersma, T.; Lok, T.; Chen, Y.; Hassel, C.J.; Yang, H.Y.; Boyle, A.; Slaymaker, M.; Chan, Y.C.; Melville, D.S.; Zhang, Z.W.; et al. Simultaneous declines in summer survival of three shorebird species signals a flyway at risk. J. Appl. Ecol. 2016, 53, 479–490. [Google Scholar] [CrossRef]
- Studds, C.E.; Kendall, B.E.; Murray, N.J.; Wilson, H.B.; Rogers, D.I.; Clemens, R.S.; Milton, D.A. Rapid population decline in migratory shorebirds relying on Yellow Sea tidal mudflats as stopover sites. Nat. Commun. 2017, 8, 14895. [Google Scholar] [CrossRef]
- Barter, M.A. Shorebirds of the Yellow Sea: Importance, Threats and Conservation Status; Wetlands International: Canberra, Australia, 2002. [Google Scholar]
- MacKinnon, J.; Verkuil, Y.I.; Murray, N. IUCN Situation Analysis on East and Southeast Asian Intertidal Habitats, with Particular Reference to the Yellow Sea (Including the Bohai Sea), Occasional Paper of the IUCN Species Survival Commission No. 47; IUCN: Gland, Switzerland; Cambridge, UK, 2012. [Google Scholar]
- Bai, Q.; Chen, J.; Chen, Z.; Dong, G.; Dong, J.; Dong, W.; Wing, V.; Fu, K.; Han, Y.; Lu, G.; et al. Identification of coastal wetlands of international importance for waterbirds: A review of China Coastal Waterbird Surveys 2005–2013. Avian Res. 2015, 6, 12. [Google Scholar] [CrossRef]
- Battley, P.F.; Warnock, N.; Tibbitts, T.L.; Gill, R.E.; Piersma, T.; Hassell, C.J.; Douglas, D.C.; Mulcahy, D.M.; Gartell, B.D.; Schuckard, R.; et al. Contrasting extreme long-distance migration patterns in bar-tailed godwits Limosa lapponica. J. Avian Biol. 2012, 43, 21–32. [Google Scholar] [CrossRef]
- Liu, X.; Gao, S.; Wang, Y. Modeling profile shape evolution for accreting tidal flats composed of mud and sand: A case study of the central Jiangsu coast, China. Cont. Shelf Res. 2011, 31, 1750–1760. [Google Scholar] [CrossRef]
- Roberts, W.; Le Hir, P.; Whitehouse, R.J.S. Investigation using simple mathematical models of the effect of tidal currents and waves on the profile shape of intertidal mudflats. Cont. Shelf Res. 2000, 20, 1079–1097. [Google Scholar] [CrossRef]
- Li, X.; Zhang, L.; Ji, C.; Liu, H.; Huang, Q. Spatiotemporal changes of Jiangsu coastline: A remote sensing and GIS approach. Geogr. Res. 2014, 33, 414–426. [Google Scholar] [CrossRef]
- Song, D.; Wang, X.H.; Zhu, X.; Bao, X. Modeling studies of the far-field effects of tidal flat reclamation on tidal dynamics in the East China Seas. Estuar. Coast. Shelf Sci. 2013, 133, 147–160. [Google Scholar] [CrossRef]
- Zhu, Q.; Wang, Y.P.; Ni, W.; Gao, J.; Li, M.; Yang, L.; Gong, X.; Gao, S. Effects of intertidal reclamation on tides and potential environmental risks: A numerical study for the southern Yellow Sea. Environ. Earth Sci. 2016, 75. [Google Scholar] [CrossRef]
- Deng, B.; Wu, H.; Yang, S.; Zhang, J. Longshore suspended sediment transport and its implications for submarine erosion off the Yangtze River Estuary. Estuar. Coast. Shelf Sci. 2017, 190, 1–10. [Google Scholar] [CrossRef]
- Yang, H.-Y.; Chen, B.; Barter, M.A.; Piersma, T.; Zhou, C.-F.; Li, F.-S.; Zhang, Z.-W. Impacts of tidal land reclamation in Bohai Bay, China: Ongoing losses of critical Yellow Sea waterbird staging and wintering sites. Bird Conserv. Int. 2011, 21, 241–259. [Google Scholar] [CrossRef]
- de Vriend, H.J.; van Koningsveld, M.; Aarninkhof, S.G.J.; de Vries, M.B.; Baptist, M.J. Sustainable hydraulic engineering through building with nature. J. Hydro-Environ. Res. 2014, 9, 159–171. [Google Scholar] [CrossRef]
- Wang, F.; Wall, G. Mudflat development in Jiangsu Province, China: Practices and experiences. Ocean Coast. Manag. 2010, 53, 691–699. [Google Scholar] [CrossRef]
- Wang, W.; Liu, H.; Li, Y.; Su, J. Development and management of land reclamation in China. Ocean Coast. Manag. 2014, 102, 415–425. [Google Scholar] [CrossRef]
- Zhao, S.; Liu, Y.; Li, M.; Sun, C.; Zhou, M.; Zhang, H. Analysis of Jiangsu tidal flats reclamation from 1974 to 2012 using remote sensing. China Ocean Eng. 2015, 29, 143–154. [Google Scholar] [CrossRef]
- Zhang, C.K.; Chen, J. Master plan of tidal flat reclamation along Jiangsu coastal zone. In Proceedings of the 6th International Conference on Asian and Pacific Coasts, Hong Kong, China, 14–16 December 2011; pp. 139–146. [Google Scholar]
- Peng, H.-B.; Anderson, G.Q.A.; Chang, Q.; Choi, C.-Y.; Chowdhury, S.U.; Clark, N.A.; Gan, X.; Hearn, R.D.; Li, J.; Lappo, E.G.; et al. The intertidal wetlands of southern Jiangsu Province, China—Globally important for Spoon-billed Sandpipers and other threatened waterbirds, but facing multiple serious threats. Bird Conserv. Int. 2017, 27, 305–322. [Google Scholar] [CrossRef]
- Mu, T.; Wilcove, D.S. Upper tidal flats are disproportionately important for the conservation of migratory shorebirds. Proc. R. Soc. B 2020, 287. [Google Scholar] [CrossRef] [PubMed]
- Huang, L.; Zhang, W. Layout scheme of the first and second harbor basin in Tongzhou Bay Port. China Harb. Eng. 2017, 37, 39–43. [Google Scholar] [CrossRef]
- Liang, S.; Pearson, S.; Wu, W.; Ma, Y.; Qiao, L.; Wang, X.H.; Li, J.; Wang, X. Research and integrated coastal zone management in rapidly developing estuarine harbours: A review to inform sustainment of functions in Jiaozhou Bay, China. Ocean Coast. Manag. 2015, 116, 470–477. [Google Scholar] [CrossRef]
- Muller, J.R.M.; Chen, Y.; Aarninkhof, S.G.J.; Chan, Y.-C.; Piersma, T.; van Maren, D.S.; Tao, J.; Wang, Z.B.; Gong, Z. Ecological impact of land reclamation on Jiangsu coast (China): A novel ecotope assessment for Tongzhou Bay. Water Sci. Eng. 2020, 13, 57–64. [Google Scholar] [CrossRef]
- van de Kam, J.; Battley, P.F.; McCaffery, B.J.; Rogers, D.I.; Hong, J.S.; Moores, N.; Yu, Y.-K.; Lewis, J.; Piersma, T. Invisible Connections: Why Migrating Shorebirds Need the Yellow Sea; CSIRO Publishing: Melbourne, Austria, 2010. [Google Scholar]
- van de Kam, J.; Ens, B.J.; Piersma, T.; Zwarts, L. Shorebirds: An Illustrated Behavioural Ecology; KNNV Publishers: Utrecht, The Netherlands, 2004. [Google Scholar]
- Mathot, K.J.; Piersma, T.; Elner, R.W. Shorebirds as Indicators and Integrators of Mudflat Ecology; Beninger, P., Ed.; Springer: Cham, Switzerland, 2018; pp. 309–338. [Google Scholar]
- Chan, Y.-C.; Tibbitts, T.L.; Lok, T.; Hassell, C.J.; Peng, H.-B.; Ma, Z.; Zhang, Z.; Piersma, T. Filling knowledge gaps in a threatened shorebird flyway through satellite tracking. J. Appl. Ecol. 2019, 56, 2305–2315. [Google Scholar] [CrossRef]
- Zhang, S.-D.; Ma, Z.; Choi, C.-Y.; Peng, H.-B.; Melville, D.S.; Zhao, T.-T.; Bai, Q.-Q.; Liu, W.-L.; Chan, Y.-C.; van Gils, J.A.; et al. Morphological and digestive adjustments buffer performance: How staging shorebirds cope with severe food declines. Ecol. Evol. 2019, 9, 3868–3878. [Google Scholar] [CrossRef]
- Choi, C.-Y.; Battley, P.F.; Potter, M.A.; Ma, Z.; Melville, D.S.; Sukkaewmanee, P. How migratory shorebirds selectively exploit prey at a staging site dominated by a single prey species. Auk 2017, 134, 76–91. [Google Scholar] [CrossRef]
- Duijns, S.; Hidayati, N.A.; Piersma, T. Bar-tailed Godwits Limosa l. lapponica eat polychaete worms wherever they winter in Europe. Bird Study 2013, 60, 509–517. [Google Scholar] [CrossRef][Green Version]
- Duijns, S.; Piersma, T. Interference competition in a sexually dimorphic shorebird: Prey behaviour explains intraspecific competition. Anim. Behav. 2014, 92, 195–201. [Google Scholar] [CrossRef]
- Rakhimberdiev, E.; Duijns, S.; Karagicheva, J.; Camphuysen, C.J.; Castricum, V.R.S.; Dekinga, A.; Dekker, R.; Gavrilov, A.; ten Horn, J.; Jukema, J.; et al. Food abundance at refuelling sites can mitigate Arctic warming effects on a migratory bird. Nat. Commun. 2018, 9. [Google Scholar] [CrossRef]
- van Maren, D.S.; Oost, A.P.; Wang, Z.B.; Vos, P.C. The effect of land reclamations and sediment extraction on the suspended sediment concentration in the Ems Estuary. Mar. Geol. 2016, 376, 147–157. [Google Scholar] [CrossRef]
- Wang, Z.B.; van Maren, D.S.; Ding, P.X.; Yang, S.L.; van Prooijen, B.C.; de Vet, P.L.M.; Winterwerp, J.C.; de Vriend, H.J.; Stive, M.J.F.; He, Q. Human impacts on morphodynamic thresholds in estuarine systems. Cont. Shelf Res. 2015, 111, 174–183. [Google Scholar] [CrossRef]
- Winterwerp, J.C.; Wang, Z.B.; van Braeckel, A.; van Holland, G.; Kösters, F. Man-induced regime shifts in small estuaries—II: A comparison of rivers. Ocean Dyn. 2013, 63, 1293–1306. [Google Scholar] [CrossRef]
- IADC. Facts about Building with Nature; IADC: Voorburg, The Netherlands, 2010. [Google Scholar]
- Mink, F.J. Maritime Infrastructure and Marine Coastal Zones—Issues with the Habitats Directives, European Dredging Association Paper 06-0347; European Dredging Association: Brussels, Belgium, 2007. [Google Scholar]
- Baptist, M.J.; van Eekelen, E.; Dankers, P.J.T.; Grasmeijer, B.; van Kessel, T.; van Maren, D.S. Working with Nature in Wadden Sea ports. In Proceedings of the Coasts & Ports 2017 Conference, Cairns, Australia, 21–23 June 2017. [Google Scholar]
- Port of Rotterdam Authority. Maasvlakte 2—The sustainable Port; Port of Rotterdam Authority: Rotterdam, The Netherlands, 2008. [Google Scholar]
- Fordeyn, J.; Van der Biest, K.; Lemey, E.; Boerema, A.; Meire, P. An ecosystem services assessment of the Prins Hendrik Zanddijk. Terra Aqua 2019, 157, 31–46. [Google Scholar]
- Laboyrie, H.P.; van Koningsveld, M.; Aarninkhof, S.G.J.; Van Parys, M.; Lee, M.; Jensen, M.; Csiti, A.; Kolman, R. Dredging for Sustainable Infrastructure; CEDA/IADC: The Hague, The Netherlands, 2018. [Google Scholar]
- de Vriend, H.J.; van Koningsveld, M. Building with Nature: Thinking, Acting and Interacting Differently; EcoShape, Building with Nature: Dordrecht, The Netherlands, 2012. [Google Scholar]
- Cui, B. Impact of Large-scale Reclamation on Coastal Wetlands and Implications for Ecological Restoration, Compensation, and Sustainable Exploitation Framework. Bull. Chin. Acad. Sci. 2017, 32, 418–425. [Google Scholar] [CrossRef]
- CCCC Third Harbor Consultants Co. Ltd. Hydrological Analysis Report of Tongzhou Qianwan Planning; CCCC Third Harbor Consultants Co. Ltd.: Shanghai, China, 2012. [Google Scholar]
- Liu, Z.; Huang, Y.; Zhang, Q. Tidal current ridges in the southwestern Yellow Sea. J. Sediment. Res. 1989, 59, 432437. [Google Scholar]
- Wang, Y.; Zhu, D.; You, K.; Pan, S.; Zhu, X.; Zou, X. Evolution of radiative sand ridge field of the South Yellow Sea and its sedimentary characteristics. Sci. China Ser. D: Earth Sci. 1999, 42, 97–112. [Google Scholar] [CrossRef]
- Yan, Y.; Zhu, Y.; Xue, H. Hydromechanics for the formation and development of radial sandbanks—Plane characteristics of tidal flow. Sci. China Ser. D: Earth Sci. 1999, 42, 13–21. [Google Scholar] [CrossRef]
- Zhang, C.; Zhang, D.; Zhang, J.; Wang, Z. Tidal current-induced formation—Storm-induced change—Tidal current-induced recovery. Sci. China Ser. D Earth Sci. 1999, 42, 1–12. [Google Scholar] [CrossRef]
- Kang, Y. Maximum tidal range analysis of radial sand ridges in the southern Yellow Sea. Indian J. Geo-Mar. Sci. 2015, 44, 971–976. [Google Scholar]
- Xing, F.; Wang, Y.P.; Wang, H.V. Tidal hydrodynamics and fine-grained sediment transport on the radial sand ridge system in the southern Yellow Sea. Mar. Geol. 2012, 291, 192–210. [Google Scholar] [CrossRef]
- Su, M.; Yao, P.; Wang, Z.B.; Zhang, C.K.; Stive, M.J.F. Tidal Wave Propagation in the Yellow Sea. Coast. Eng. J. 2015, 57, 1550008. [Google Scholar] [CrossRef]
- Yao, P. Tidal and Sediment Dynamics in a Fine-Grained Coastal Region: A Case Study of the Jiangsu Coast. Ph.D. Thseis, Delft University of Technology, Delft, The Netherlands, 2016. [Google Scholar]
- Chen, K. Study on Characteristics of Flow and Sediment for Xiaomiaohong Tide Inlet in Radial Sand Ridges. Appl. Mech. Mater. 2013, 405–408, 1385–1389. [Google Scholar] [CrossRef]
- Wang, Y.P.; Gao, S.; Jia, J.; Thompson, C.E.L.; Gao, J.; Yang, Y. Sediment transport over an accretional intertidal flat with influences of reclamation, Jiangsu coast, China. Mar. Geol. 2012, 291–294, 147–161. [Google Scholar] [CrossRef]
- Xiong, J.; Wang, X.H.; Wang, Y.P.; Chen, J.; Shi, B.; Gao, J.; Yang, Y.; Yu, Q.; Li, M.; Yang, L.; et al. Reprint of Mechanisms of maintaining high suspended sediment concentration over tide-dominated offshore shoals in the southern Yellow Sea. Estuar. Coast. Shelf Sci. 2017, 191, 221–233. [Google Scholar] [CrossRef]
- Yang, B.; Feng, W.; Zhang, Y. Wave characteristics at the south part of the radial sand ridges of the Southern Yellow Sea. China Ocean Eng. 2014, 28, 317–330. [Google Scholar] [CrossRef]
- Chen, Y.; Xie, D.; Zhang, C.; Qian, X. Estimation of long-term wave statistics in the East China Sea. J. Coast. Res. 2013, 65, 177–182. [Google Scholar] [CrossRef]
- Wang, X.H.; Qiao, F.; Lu, J.; Gong, F. The turbidity maxima of the northern Jiangsu shoal-water in the Yellow Sea, China. Estuar. Coast. Shelf Sci. 2011, 93, 202–211. [Google Scholar] [CrossRef]
- Su, M.; Yao, P.; Wang, Z.B.; Zhang, C.K.; Stive, M.J.F. Exploratory morphodynamic hindcast of the evolution of the abandoned Yellow River delta, 1578–1855CE. Mar. Geol. 2017, 383, 99–119. [Google Scholar] [CrossRef]
- Wang, Y.; Zhang, Y.; Zou, X.; Zhu, D.; Piper, D. The sand ridge field of the South Yellow Sea: Origin by river–sea interaction. Mar. Geol. 2012, 291–294, 132–146. [Google Scholar] [CrossRef]
- Zhu, Y.; Chang, R. On the relationships between the radial tidal current field and the radial sand ridges in the southern Yellow Sea: A numerical simulation. Geo-Mar. Lett. 2001, 21, 59–65. [Google Scholar] [CrossRef]
- Zhu, Y.; Chen, Q. On the origin of the Radial Sand Ridges in the Southern Yellow Sea: Results from the modeling of the paleoradial tidal current fields off the Paleo-Yangtze River Estuary and Northern Jiangsu Coast. J. Coast. Res. 2005, 216, 1245–1256. [Google Scholar] [CrossRef]
- Su, M.; Yao, P.; Wang, Z.B.; Zhang, C.K.; Stive, M.J.F. Exploratory morphodynamic modeling of the evolution of the Jiangsu coast, China, since 1855: Contributions of old Yellow River-derived sediment. Mar. Geol. 2017, 390, 306–320. [Google Scholar] [CrossRef]
- Zhou, L.; Liu, J.; Saito, Y.; Zhang, Z.; Chu, H.; Hu, G. Coastal erosion as a major sediment supplier to continental shelves: Example from the abandoned Old Huanghe (Yellow River) delta. Cont. Shelf Res. 2014, 82, 43–59. [Google Scholar] [CrossRef]
- Gao, M.; Xu, L.; Li, G. The study of scoring and silting evolution of radiative sand ridge field of the south Yellow Sea in support of DEM. Mar. Sci. Bull. 2009, 28, 168–176. [Google Scholar]
- Li, C.; Zhang, J.; Deng, B. Holocene regression and the tidal radial sand ridge system formation in the Jiangsu coastal zone, east China. Mar. Geol. 2001, 173, 97–120. [Google Scholar] [CrossRef]
- Fan, D. Open-Coast Tidal Flats. In Principles of Tidal Sedimentology; Davis, R.A., Dalrymple, R.W., Eds.; Springer: Dordrecht, The Netherlands, 2012; pp. 187–229. [Google Scholar]
- Sun, Z.; Wang, F.; Yin, Y.; Li, G.; Ge, S.; Xu, Q. Sedimentary environment evolution of Lanshayang tidal channel within the radial sand ridges, Southern Yellow Sea. J. Nanjing Univ. Nat. Sci. 2014, 50, 553–563. [Google Scholar] [CrossRef]
- Wang, X.; Ke, X. Grain-size characteristics of the extant tidal flat sediments along the Jiangsu coast, China. Sediment. Geol. 1997, 112, 105–122. [Google Scholar] [CrossRef]
- Zhu, Y.; Chang, R. Preliminary study of the dynamic origin of the distribution pattern of bottom sediments on the continental shelves of the Bohai Sea, Yellow Sea and East China Sea. Estuar. Coast. Shelf Sci. 2000, 51, 663–680. [Google Scholar] [CrossRef]
- Lee, H.J.; Chough, S.K. Sediment distribution, dispersal and budget in the Yellow Sea. Mar. Geol. 1989, 87, 195–205. [Google Scholar] [CrossRef]
- Liu, J.P.; Xu, K.H.; Li, A.C.; Milliman, J.D.; Velozzi, D.M.; Xiao, S.B.; Yang, Z.S. Flux and fate of Yangtze River sediment delivered to the East China Sea. Geomorphology 2007, 85, 208–224. [Google Scholar] [CrossRef]
- Bouma, H.; de Jong, D.J.; Twisk, F.; Wolfstein, K. Zoute wateren EcotopenStelsel (ZES.1). Voor Het in Kaart Brengen van het Potentiële Voorkomen van Levensgemeenschappen in Zoute en Brakke Rijkswateren; Ministerie van Verkeer en Waterstaat: Middelburg, The Netherlands, 2005. [Google Scholar]
- Baptist, M.J.; van der Wal, J.T.; Folmer, E.O.; Gräwe, U.; Elschot, K. An ecotope map of the trilateral Wadden Sea. J. Sea Res. 2019, 152, 101761. [Google Scholar] [CrossRef]
- Chan, Y.-C.; Peng, H.-B.; Han, Y.X.; Chung, S.S.W.; Li, J.; Zhang, L.; Piersma, T. Conserving unprotected important coastal habitats in the Yellow Sea: Shorebird occurrence, distribution and food resources at Lianyungang. Glob. Ecol. Conserv. 2019, 20, e00724. [Google Scholar] [CrossRef]
- Douglas, D.C.; Weinzierl, R.; Davidson, S.C.; Kays, R.; Wikelski, M.; Bohrer, G. Moderating Argos location errors in animal tracking data. Methods Ecol. Evol. 2012, 3, 999–1007. [Google Scholar] [CrossRef]
- QGIS Development Team. QGIS Geographic Information System; Open Source Geospatial Foundation: Beaverton, OR, USA, 2009. [Google Scholar]
- Lesser, G.R.; Roelvink, J.A.; van Kester, J.A.T.M.; Stelling, G.S. Development and validation of a three-dimensional morphological model. Coast. Eng. 2004, 51, 883–915. [Google Scholar] [CrossRef]
- Yao, P.; Su, M.; Wang, Z.; van Rijn, L.C.; Zhang, C.; Chen, Y.; Stive, M.J.F. Experiment inspired numerical modeling of sediment concentration over sand-silt mixtures. Coast. Eng. 2015, 105, 75–89. [Google Scholar] [CrossRef]
- van Rijn, L.C. Unified View of Sediment Transport by Currents and Waves. I: Initiation of Motion, Bed Roughness, and Bed-Load Transport. J. Hydraul. Eng. 2007, 133, 649–667. [Google Scholar] [CrossRef]
- van Rijn, L.C. Unified View of Sediment Transport by Currents and Waves. II: Suspended Transport. J. Hydraul. Eng. 2007, 133, 668–689. [Google Scholar] [CrossRef]
- Partheniades, E. Erosion and Deposition of Cohesive Soils. J. Hydraul. Div. 1965, 91, 105–139. [Google Scholar]
- Ranasinghe, R.; Swinkels, C.; Luijendijk, A.; Roelvink, D.; Bosboom, J.; Stive, M.; Walstra, D. Morphodynamic upscaling with the MORFAC approach: Dependencies and sensitivities. Coast. Eng. 2011, 58, 806–811. [Google Scholar] [CrossRef]
- Nash, J.E.; Sutcliffe, J.V. River flow forecasting through conceptual models part I—A discussion of principles. J. Hydrol. 1970, 10, 282–290. [Google Scholar] [CrossRef]
- van Rijn, L.C.; Walstra, D.J.R.; Grasmeijer, B.; Sutherland, J.; Pan, S.; Sierra, J.P. The predictability of cross-shore bed evolution of sandy beaches at the time scale of storms and seasons using process-based Profile models. Coast. Eng. 2003, 47, 295–327. [Google Scholar] [CrossRef]
- Allen, J.I.; Somerfield, P.J.; Gilbert, F.J. Quantifying uncertainty in high-resolution coupled hydrodynamic-ecosystem models. J. Mar. Syst. 2007, 64, 3–14. [Google Scholar] [CrossRef]
- Henriksen, H.J.; Troldborg, L.; Nyegaard, P.; Sonnenborg, T.O.; Refsgaard, J.C.; Madsen, B. Methodology for construction, calibration and validation of a national hydrological model for Denmark. J. Hydrol. 2003, 280, 52–71. [Google Scholar] [CrossRef]
- Gong, Z.; Wang, Z.; Stive, M.J.F.; Zhang, C.; Chu, A. Process-Based Morphodynamic Modeling of a Schematized Mudflat Dominated by a Long-Shore Tidal Current at the Central Jiangsu Coast, China. J. Coast. Res. 2012, 285, 1381–1392. [Google Scholar] [CrossRef]
- Wu, J.; Xu, M.; Liu, B. Study on tidal flat evolution trend in the Yao sandbank area based on remote sensing. Coast. Eng. J. 2016, 35, 19–31. [Google Scholar] [CrossRef]
- Chen, K.; Zheng, J.; Zhang, C.; Wang, N.; Zhou, C. The evolution characteristics of main waterways and their control mechanism in the radial sand ridges of the southern Yellow Sea. Acta Oceanol. Sin. 2017, 36, 91–98. [Google Scholar] [CrossRef]
- Ding, X.R.; Kang, Y.Y.; Ge, X.P.; Li, Q.; Zhang, T.T. Tidal flat evolution analysis using remote sensing on Tiaozini flat of the radial sand ridges. J. Hohai Univ. Nat. Sci. 2011, 39, 231–236. [Google Scholar] [CrossRef]
- Yang, H.-Y.; Chen, B.; Ma, Z.; Hua, N.; Van Gils, J.A.; Zhang, Z.-W.; Piersma, T. Economic design in a long-distance migrating molluscivore: How fast-fuelling red knots in Bohai Bay, China, get away with small gizzards. J. Exp. Biol. 2013, 216, 3627–3636. [Google Scholar] [CrossRef]
- Zhang, S.-D.; Ma, Z.; Choi, C.-Y.; Peng, H.-B.; Bai, Q.-Q.; Liu, W.-L.; Tan, K.; Melville, D.S.; He, P.; Chan, Y.-C.; et al. Persistent use of a shorebird staging site in the Yellow Sea despite severe declines in food resources implies a lack of alternatives. Bird Conserv. Int. 2018, 28, 534–548. [Google Scholar] [CrossRef]
- Rogers, D.I.; Piersma, T.; Hassell, C.J. Roost availability may constrain shorebird distribution: Exploring the energetic costs of roosting and disturbance around a tropical bay. Biol. Conserv. 2006, 133, 225–235. [Google Scholar] [CrossRef]
- Mao, Y.; Lin, F.; Fang, J.; Fang, J.; Li, J.; Du, M. Bivalve Production in China. In Goods and Services of Marine Bivalves; Smaal, A.C., Ferreira, J.G., Grant, J., Petersen, J.K., Strand, Ø., Eds.; Springer International Publishing: Cham, Switzerland, 2019; pp. 51–72. ISBN 978-3-319-96776-9.101. [Google Scholar]
- Elith, J.; Leathwick, J.R. Species distribution models: Ecological explanation and prediction across space and time. Annu. Rev. Ecol. Evol. Syst. 2009, 40, 677–697. [Google Scholar] [CrossRef]


© 2020 by the authors. Licensee MDPI, Basel, Switzerland. This article is an open access article distributed under the terms and conditions of the Creative Commons Attribution (CC BY) license (http://creativecommons.org/licenses/by/4.0/).