1. Introduction
Flood hazards are the most frequent natural disaster in the world and have become intensified due to global warming [
1,
2]. Flood control measures including engineering measures (e.g., dam and flood storage area construction) and non-engineering measures (e.g., reservoir operation), have been used to reduce the loss of lives and property from risks related to floods [
3]. Optimal flood control operation of reservoirs is one of the most important and efficient non-engineering measures [
4], which can enhance the basin flood control capacity. At present, many scholars have carried out a lot of research on optimal flood control operation model construction and optimization algorithms.
Many optimal flood control operation models have been proposed for different objectives. There has been some research on flood control operation for multi-reservoir systems in which the concentration has been on minimization of flood peaks at the downstream flood control points and minimizing the maximal reservoir water level [
5,
6,
7,
8]. Some research concentrates on the dynamic flood limiting water level to address the conflict between flood control and reservoir benefit [
9,
10,
11,
12]. Some other research addresses flood risk assessment and minimizing the flood control risk for cascade reservoirs [
13,
14,
15]. However, most research has mainly focused on optimizing the flood control operation for multi-reservoir systems such as parallel and cascade reservoirs. Few studies have been carried out on complex flood control systems. Comparing with the multi-reservoir systems, a complex flood control system is composed of other water projects (e.g., navigation-power junctions and flood storage areas), local flows, and flood control points, besides reservoirs. Therefore, optimizing the flood control operation of the complex flood control system needs to consider more factors including operation of water projects, the hydraulic connection between reservoirs, and time-lag issues caused by flood routing during the optimal operation periods.
The optimization algorithms include modern intelligence algorithms and traditional optimization methods, which have been widely used to conduct optimal reservoir operation [
16]. Modern intelligence algorithms including Genetic Algorithms (GA) [
17,
18,
19], Particle Swarm Optimization (PSO) [
20,
21,
22], Immune Algorithm [
23,
24], and other novel optimal algorithms such as Gravity Search Algorithm [
25], Water Cycle Algorithm (WCA) [
26,
27], etc. can be combined with simulation models to search for the optimal reservoir operation. The traditional optimization methods including Linear Programming (LP) [
28,
29,
30] and Dynamic Programming (DP) [
31,
32,
33] are also widely used. However, when the number of reservoirs rises, the computation scale of DP increases greatly, which is called the “curse of dimensionality” and this limits the application of DP. To deal with the dimensionality problems, modified DP algorithms such as Discrete Differential Dynamic Programming (DDDP) [
34,
35], Dynamic Programming Successive Approximation (DPSA) [
36], and Progressive Optimality Algorithm (POA) [
37,
38,
39] have been widely used to find the optimal or near-optimal reservoir release hydrographs.
With the number of reservoirs rising, the number of decision variables and constraints increases and hydraulic connection of multi-reservoir systems becomes more complex, which makes it difficult for a single traditional optimization method or modern intelligence algorithm to optimize reservoir operation [
3]. In addition, the results of modern intelligence algorithms are not stable because of randomness in the iteration, which makes them difficult to use in practical application. In this case, some scholars have proposed methods such as allocating flood storage capacity [
40] or aggregating multi-reservoirs into a virtual reservoir [
41] to simplify the optimal operation model of multi-reservoir systems, but these methods do not reflect the hydraulic connection between reservoirs [
3] or consider the impact of other water project operations on flood peaks in the downstream areas. Some scholars have proposed hybrid optimal algorithms to investigate the optimization of multiple reservoir operation. Wan et al. [
42], based on PSO and POA, proposed a novel optimization method called Progressive Reservoir Algorithm-Particle Swarm Optimization (PRA-PSO) for multi-reservoir optimal operation in an inter-basin water transfer system. Zhang et al. [
16] combined POA with DPSA, proposing an optimization method called modified Progressive Optimality Algorithm-Successive Approximation (POA-SA), and applied this method to tackle optimal flood control operation of a multi-reservoir system considering time-lags caused by Muskingum flood routing.
This study established an optimal flood control operation model of the complex flood control system, which considered hydraulic connection between reservoirs and operation of other water projects (e.g., navigation-power junctions and flood storage areas). The objective of the whole model was to minimize the flood peak at the flood control points. A hybrid algorithm of DP and POA called DP-POA [
3] integrated with the simulation model was applied to optimize this flood control operation model. The middle and lower reaches of Ganjiang River, China, were selected as a case study.
2. Optimization Model and Methodology
2.1. Optimization Model of Complex Flood Control System
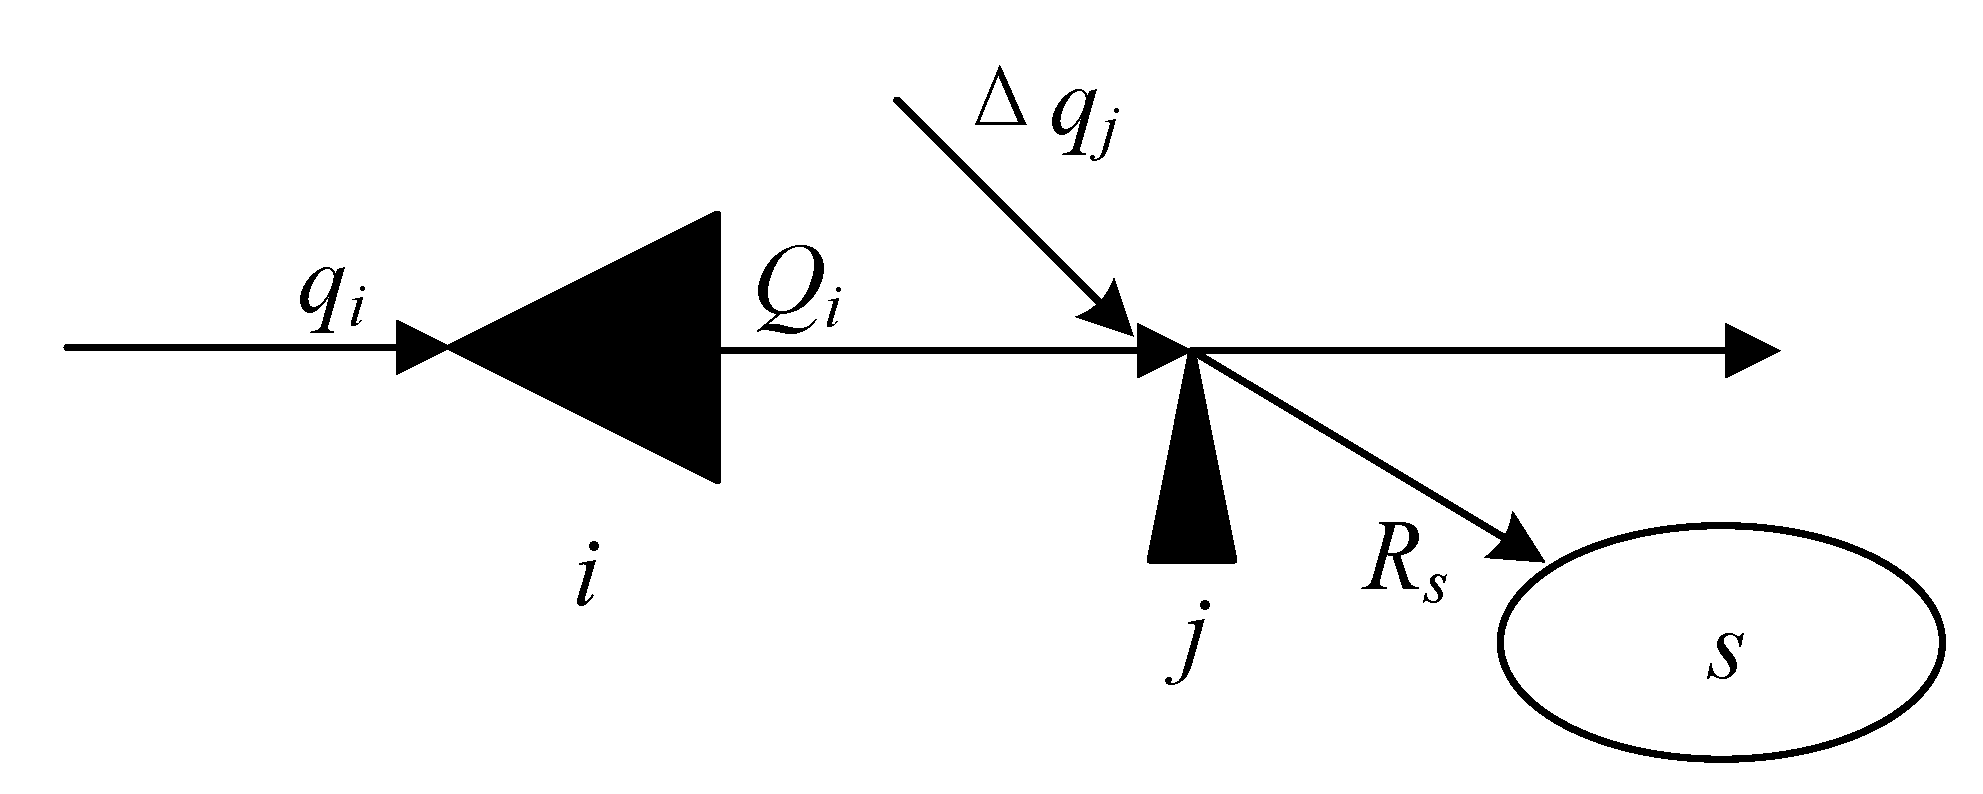
Take a complex flood control system composed of reservoirs, navigation-power junctions, flood storage areas, local flows, and flood control points for an example. Assume that there are
I cascade water projects (including reservoirs and navigation-power junctions),
J flood control points, and
S flood storage areas, and the skeleton diagram of the sub flood control system composed of the
ith water project, the
jth flood control points, and the
sth flood storage area is shown in
Figure 1. The hydraulic connection during time period,
t, is calculated as follows:
where
Qi(
t),
qi(
t),
Vi(
t) are the discharge, inflow, and water storage of the
ith water project during time period,
t, respectively;
τi is the time-lags of discharge from the
ith water project flood routing to the
jth flood control point;
Qj(
t) is the streamflow of the
jth flood control point during time period,
t; Δ
qj(
t) is the local flow of the
jth flood control point during time period,
t;
Rs(
t) is the flood diversion volume of the
sth flood storage area during time period,
t;
ψi(·) is the flood control operation rule of the
ith water projects;
φj(·) is the flood routing function between the
ith water project and the
jth flood control point;
ρs(·) is the flood control operation rule of the
sth flood storage area.
Figure 1 and Equation (1) show the complex hydraulic connection and operation of water projects in the sub flood control system. Comparing with a single reservoir flood control system, the complex flood control system needs to consider multi-reservoir joint operation, flood routing, and local flow of the flood control point; comparing with the multi-reservoir system, it needs to consider operation of other water projects besides reservoirs.
2.1.1. Objective Function
In this study, the objective function was to maximize the decrement rate of the flood peak at the flood control points. There were three flood control points needing to be protected by the flood control system, so this was a multi-objective optimization problem. Therefore, assigning weights for each flood control point could turn this into a single-objective optimization problem. The objective function was as follow:
where
N is the number of flood control points; α
i is the weight coefficient for the
jth flood control point;
Qpj is the flood peak at the
jth flood control point without flood control operation; and
Qfj is the flood peak at the
jth flood control point using optimal flood control operation.
2.1.2. Constraints
The constraints were as follows:
- (1)
Water balance equation:
where
qi(
t) and
qi(
t + 1) are the inflow of the
ith reservoir during time period,
t and
t + 1, respectively;
Qi(
t) and
Qi(
t + 1) are the discharge of the
ith reservoir during time period,
t and
t + 1, respectively; Δ
t is the time interval; and
Vi(
t) and
Vi(
t + 1) are the initial and final storage of the
ith reservoir at time period,
t.
- (2)
Reservoir water level limits:
where
Zimin and
Zimax are the minimal and maximal water level of the
ith reservoir during the operation period, respectively;
Zi(
t) is the water level of the
ith reservoir during the time period,
t.
- (3)
Boundary conditions:
where
Zi,start is the water level of the
ith reservoir at the initial time period;
Zi,end is the water level of the
ith reservoir at the final time period.
- (4)
Reservoir discharge limits:
where
Qimax[
Zi(
t)] is the maximal discharge of the
ith reservoir when the water level of the
ith reservoir is
Zi(
t) during time period,
t.
Qimin is the minimum discharge of the
ith reservoir.
- (5)
Discharge variation limits:
where Δ
Qi is the allowable discharge variation of the
ith reservoir between adjacent time periods.
- (6)
Flood routing constraints using the Muskingum method:
where
Qhdm(
t) is the streamflow of the down section of the
mth sub-river during the time period,
t;
Ihdm(
t) is the streamflow of the upper section of the
mth river during the time period,
t;
Qqm(
t) is the local flow of the
mth sub-river;
C0m,
C1m,
C2m means the Muskingum method coefficients of the
mth sub-river, respectively.
- (7)
Other water projects’ constraints:
Other water projects such as navigation-power junctions and flood storage areas, affect flood routing by flood detention. This study simulates their operation according to their flood control rules for these constraints.
- (a)
Constraints of navigation-power junctions:
Navigation-power junctions do not function as flood control for the lack of flood control storage capacity. However, to reduce the submergence loss in the reservoir area, the navigation-power junctions are required to lower the water level and open all the discharge gates when encountering large flood events. The flood control operation rules of navigation-power junctions can be generalized into four stages as follows:
- (I)
Power generation stage
When the inflow is small, the main purpose of the navigation-power junction is power generation, and discharge is equal to the inflow. This can be calculated as:
where
Qnj,k(
t) and
qnj,k(
t) are inflow and discharge of the
kth navigation-power junction during time period,
t, respectively;
Znj,k(
t) is the water level of the
kth navigation-power junction during time period,
t;
Znl,k is the normal pool level of the
kth navigation-power junction.
- (II)
Water level reduction stage
When the inflow continues increasing, the outflow is increased gradually, which can be calculated as:
where Δ
Qd,k is discharge increment of the
kth navigation-power junction and
qnj,kmax is the maximal discharge volume of the
kth navigation-power junction when all the discharge gates are opened, which can be calculated as:
where
Znj,kmin is the minimum water level of the
kth navigation-power junction during the flood control operation period;
φnj,k(·) is the relationship curve of water level and reservoir capacity of the
kth navigation-power junction;
ψnj,k(·) is the relationship curve of water level and discharge of the
kth navigation-power junction, which is similar to the relationship of water level and streamflow in the natural river channel.
- (III)
All discharge gates opened stage
When the inflow of the navigation-power junction is too large, all the discharge gates are opened, and the water level is close to that of the natural river, which can be calculated as:
where
fnj,k[
qnj,k(
t)] is the relationship of water level and streamflow in the natural river channel.
- (IV)
Water storage stage
In the falling limb, the water level will rise to the normal pool level, which can be calculated as:
where Δ
Qr,k is the discharge reduction of the
kth navigation-power junction.
- (b)
Constraints of the flood storage area:
The flood control operation of flood storage areas can be generalized as follows:
where
Qd,s(
t) and
Qu,s(
t) are streamflow of the
sth flood storage area before and after flood diversion during time period,
t;
ρs(
Qu,s(
t)) means flood diversion streamflow according to flood control rules of the
sth flood storage area during time period,
t;
L is the indicative flow for the use of the
sth flood storage area;
W(
t) is the water storage volume of the
sth flood storage area during time period,
t;
Qmax and
Wmax are the maximum flood diversion discharge and maximum water storage volume, respectively.
- (8)
Non-negative constraints:
All the variables are non-negative.
2.2. Optimization Methods
DP is a very efficient optimization method to minimize the discharge peak of a single reservoir system. However, considering difficulties such as the “curse of dimensionality”, time-lag issues, other water projects operation, and hydraulic connection, DP cannot be used to optimize flood control operation of this complex system. POA can alleviate these difficulties, but its final optimal results are influenced by the initial solutions [
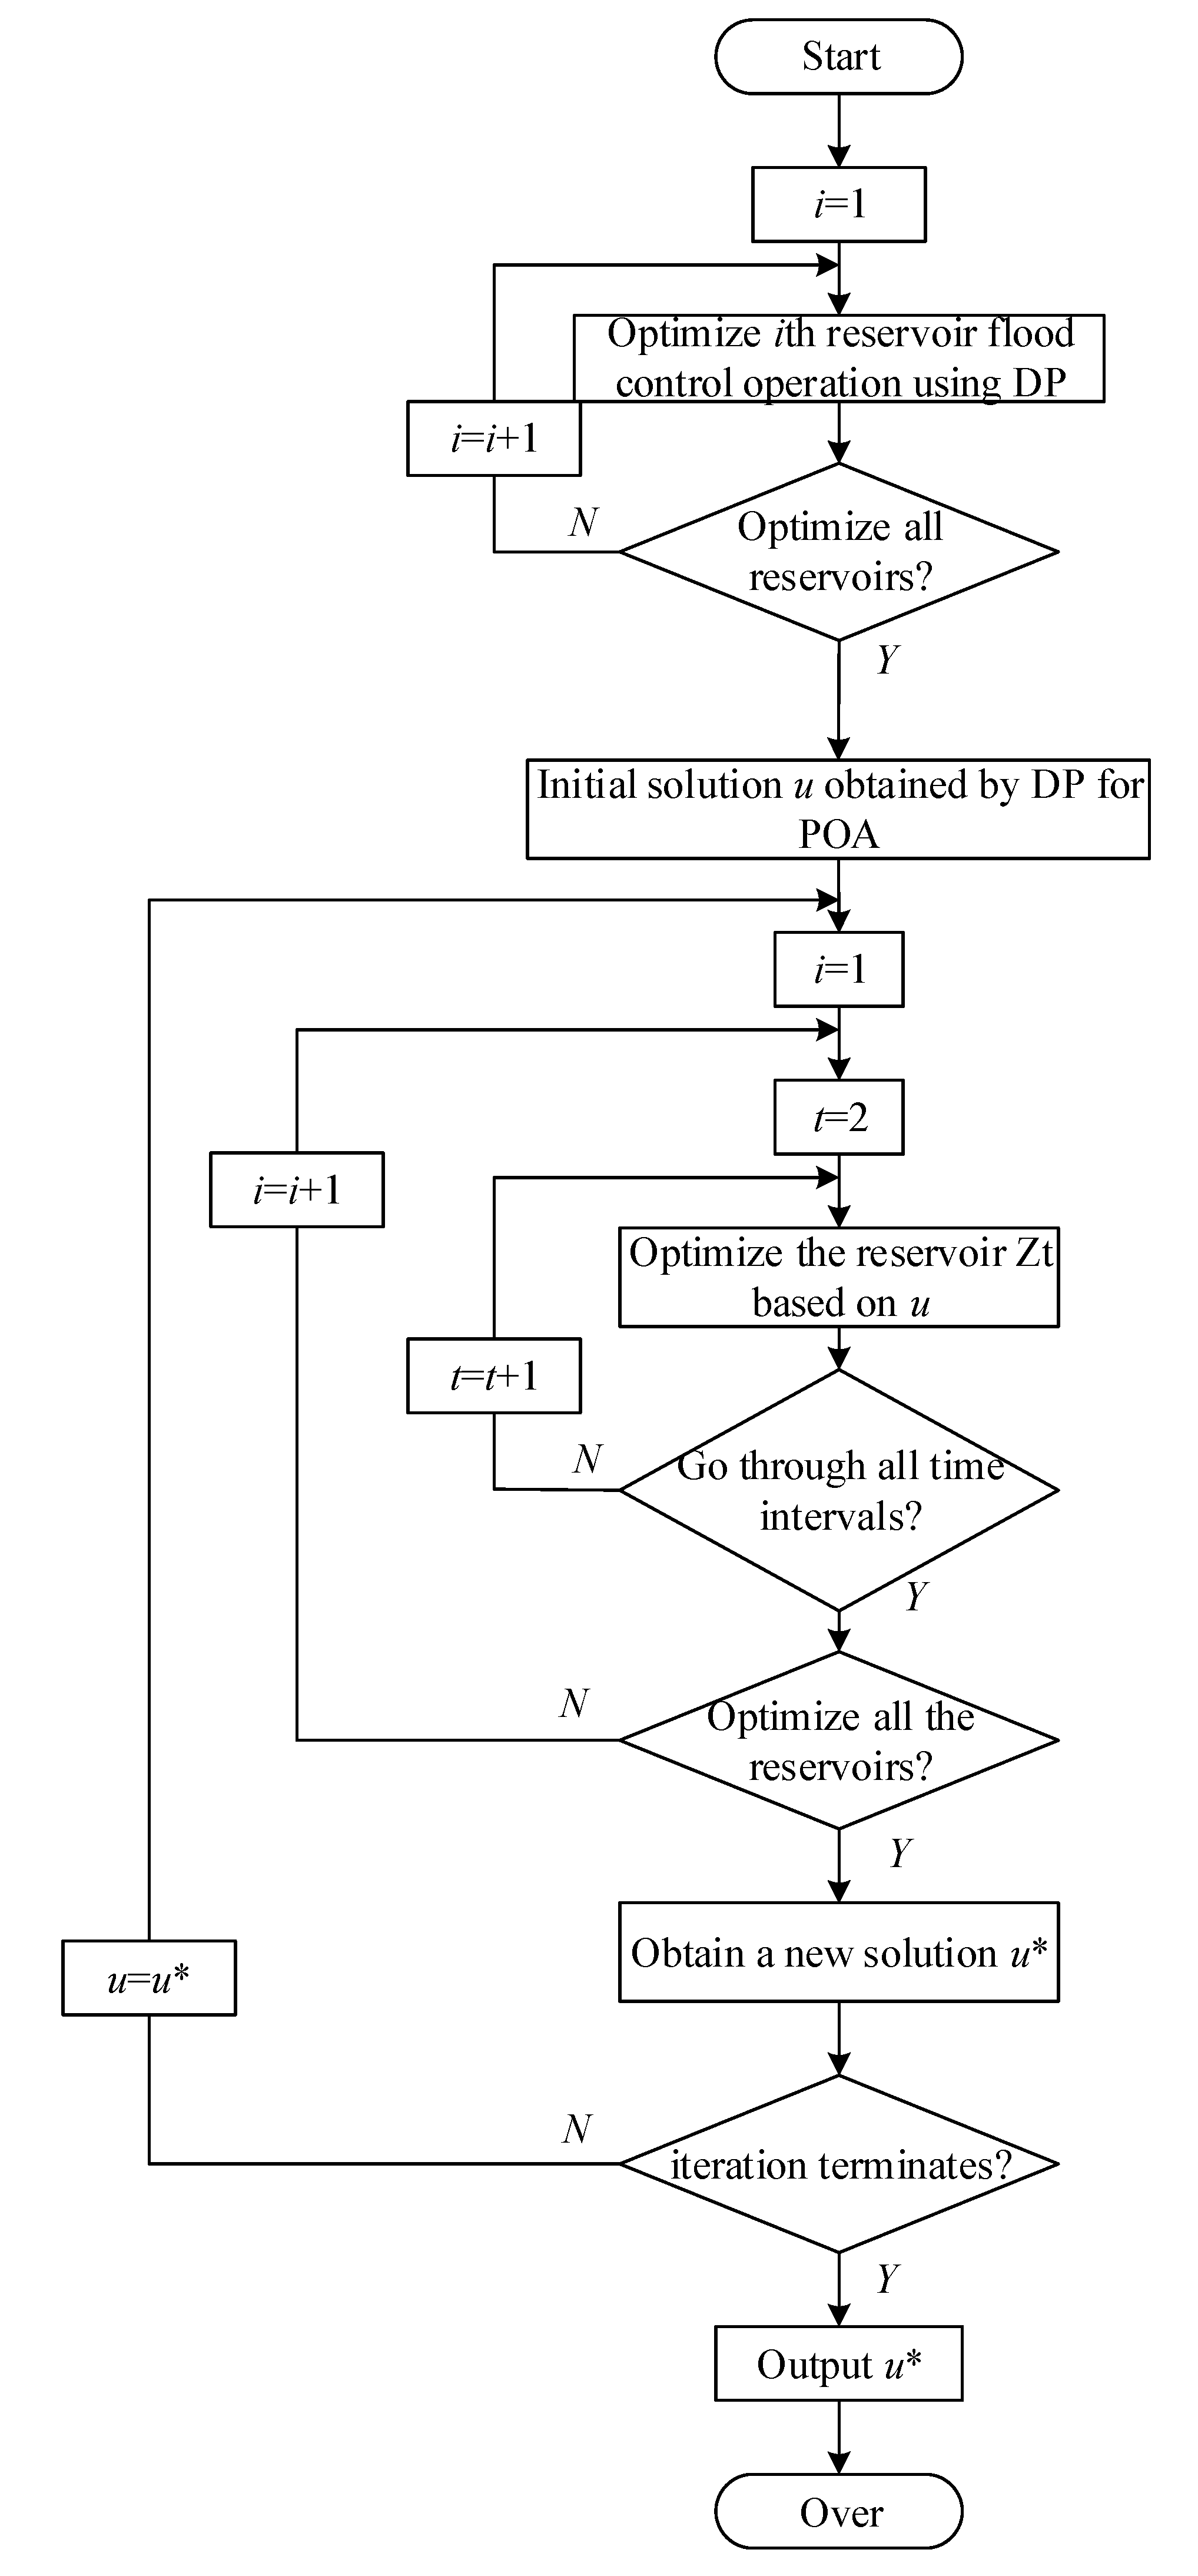
3]. In this case, DP-POA, a hybrid optimization algorithm of DP and POA [
3] combined with the simulation model was applied to find the optimal operation polices for the complex flood control system, in which DP is used first to obtain the initial solutions for POA. The processes of DP-POA are as follows:
Step 1: input the data of reservoirs, flood hydrographs, flood control operation rules of other water projects, and so on. Set the total iteration number = K.
Step 2: decompose the optimal cascade-reservoirs flood control operation into optimal multiple single-reservoir flood operation and optimize the each single-reservoir flood control operation using DP. When using DP, the sub-objective function for each reservoir can be as follows:
where
Qi(
t) is the release of the
ith reservoir during the time period,
t;
T = the number of the time periods. Constraints are similar to Equations (3)–(7).
Step 3: based on DP, the initial solution u = {Z1(1),…, Zi(t + 1),…, Zi(T + 1),…, ZM(1),…, ZM(T + 1)} is obtained. Here, M is the total number of reservoirs. Set iteration k = 1 and the reservoir number i = 1.
Step 4: using POA to update the initial status of the ith reservoir from time period, t = 2 to T, according to Equation (2). The reservoir number i = i + 1.
Step 5: if i < M, then go to Step 4 until i = M; else, obtain the updated optimal solution u* = {Z1*(1),…, Zi*(t + 1),…, Zi*(T + 1),…, ZM*(1),…, ZM*(T + 1)}. Replace the initial solution u with u*. Then the iteration k = k + 1.
Step 6: if the iteration k < K, then go to Step 4; else output the u*, and the optimization is completed.
For Steps 3 and 4, because the water level of each reservoir during each time period, t, is certain, this means the discharge of each reservoir can be calculated according to Equation (3) and flood hydrographs of flood control points can be also simulated using Equation (8).
The procedure of DP-POA is shown in the
Figure 2.
3. Study Area and Data
3.1. Study Area
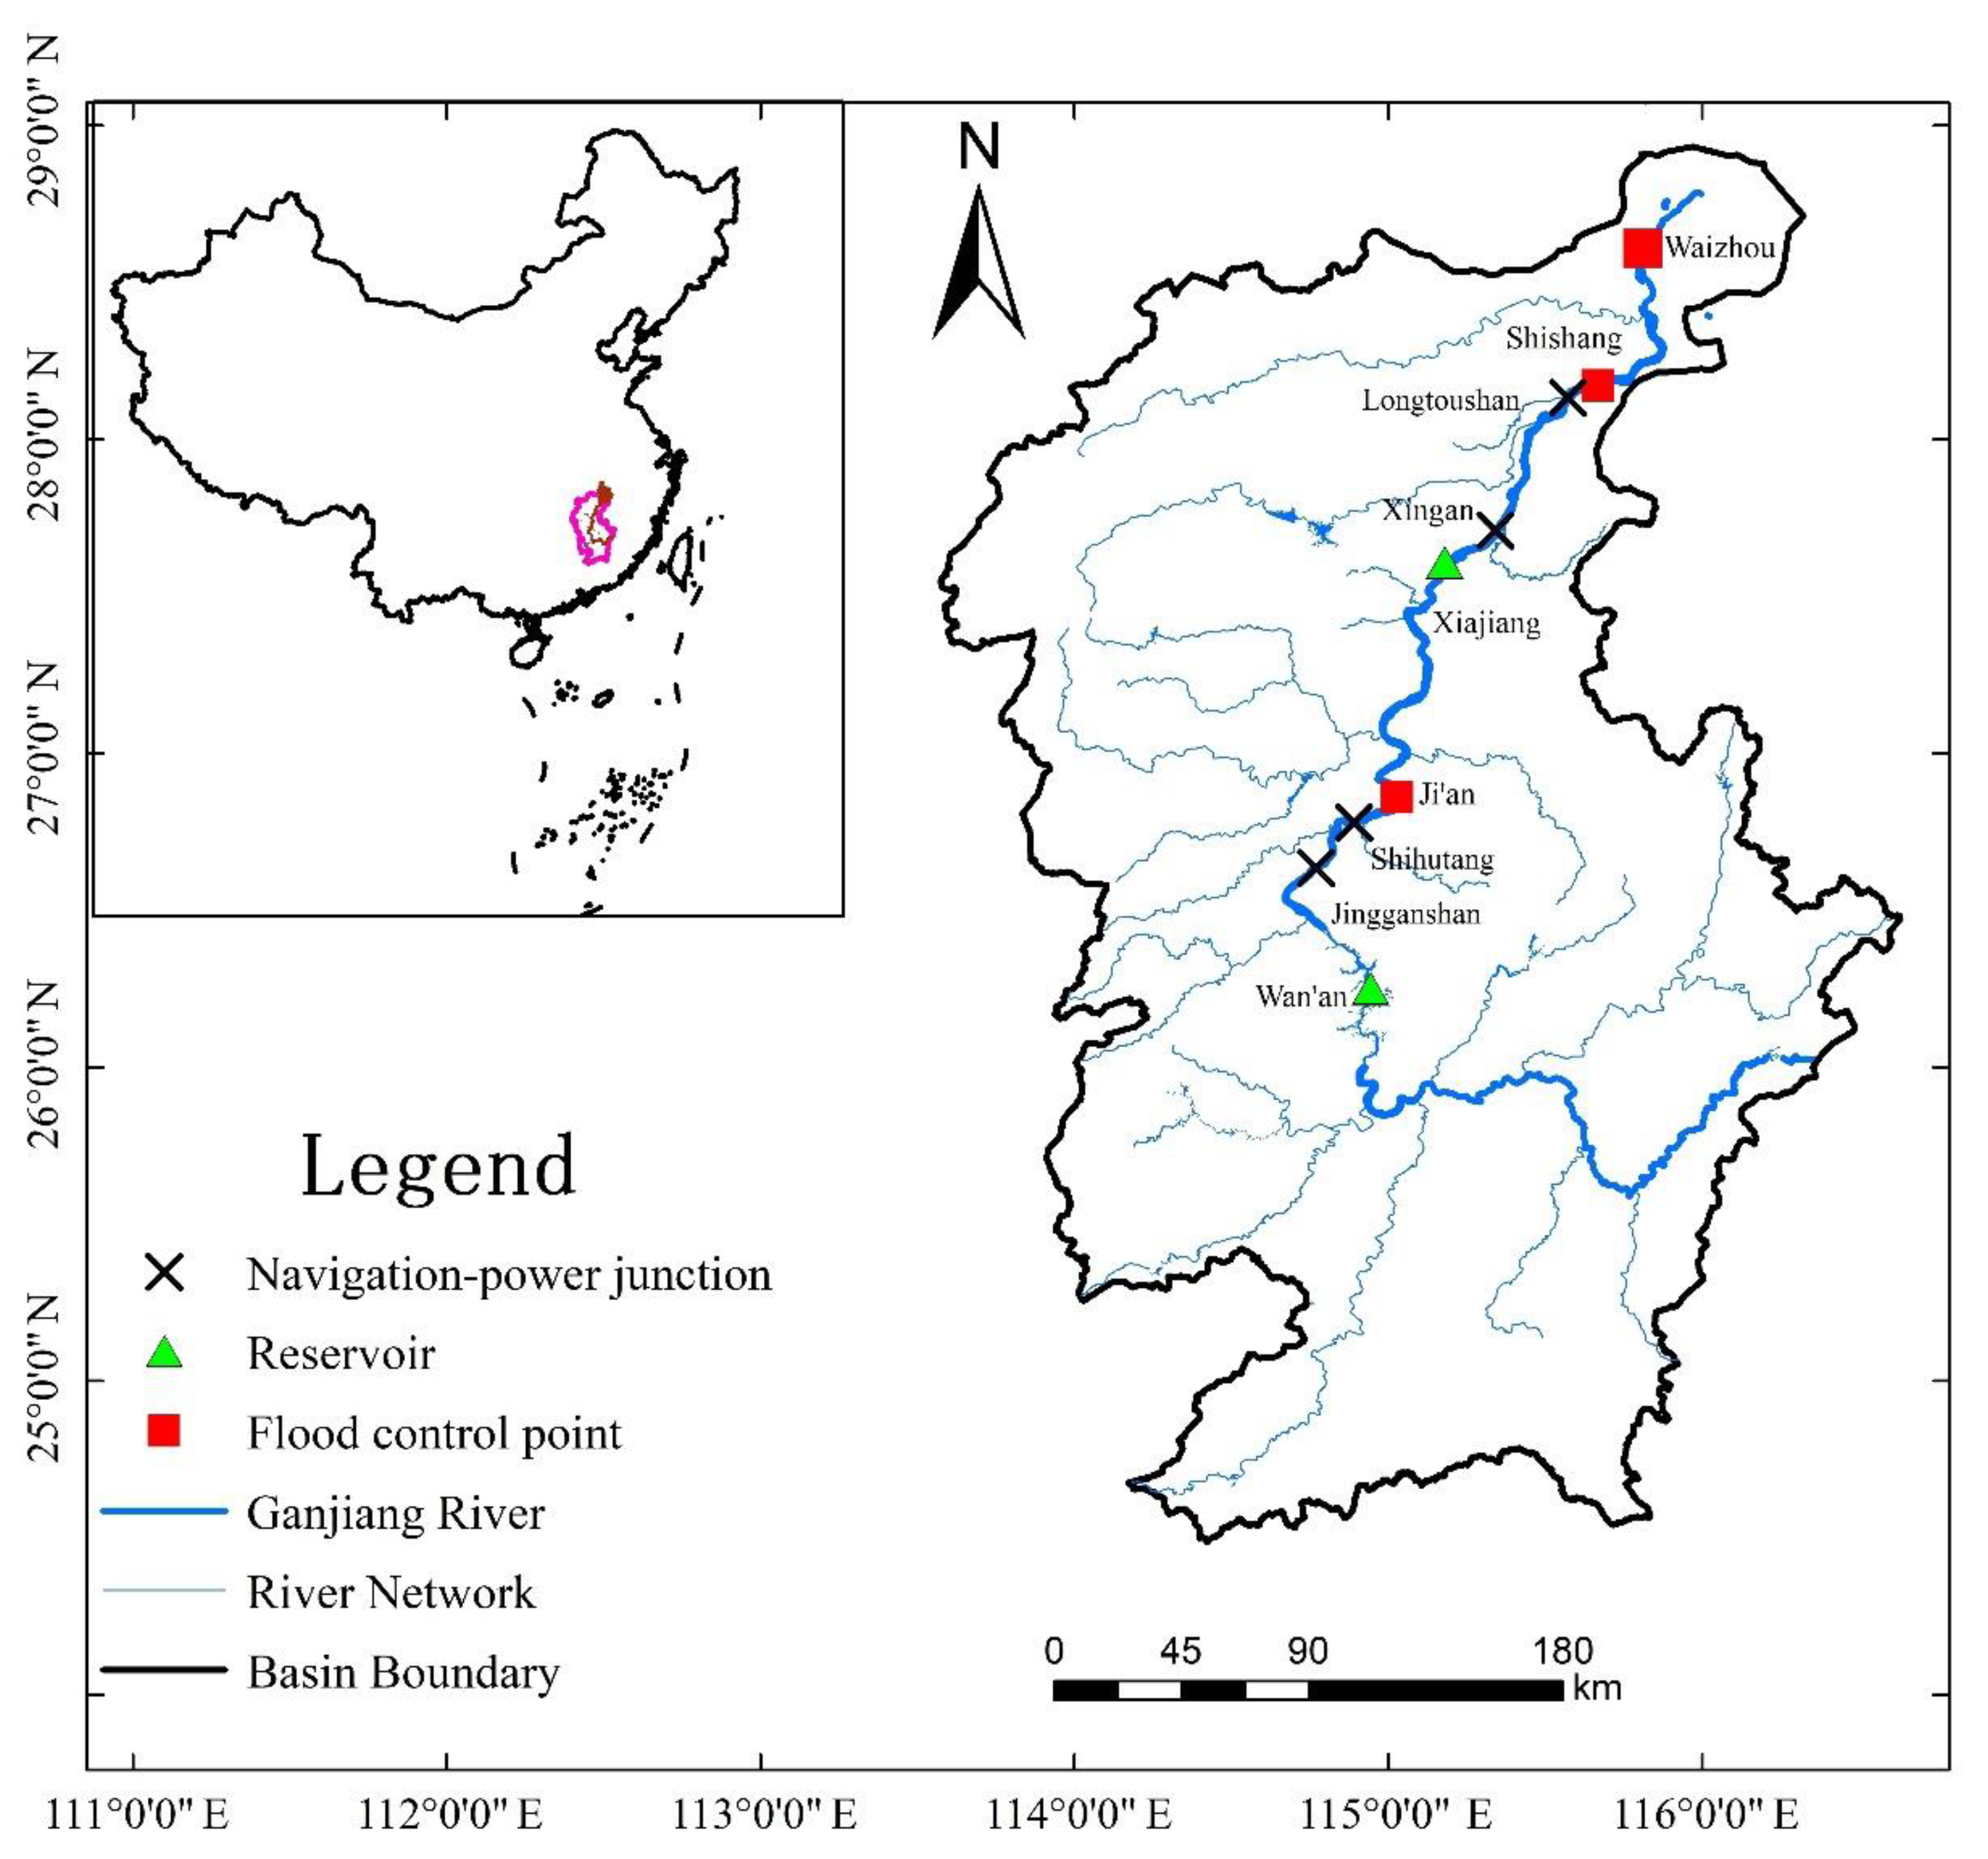
The Ganjiang River located in the south part of the middle reaches of the Yangtze River is the largest river of the Poyang Lake basin, with a length of 766 km and basin area of 83,500 km
2 (
Figure 3). This basin is situated in the subtropical humid monsoon climate zone with mean annual discharge of 2130 m
3/s and mean annual precipitation of approximately 1400–1800 mm [
43]. Runoff in the flood season from April to June, accounts for more than half of the annual runoff [
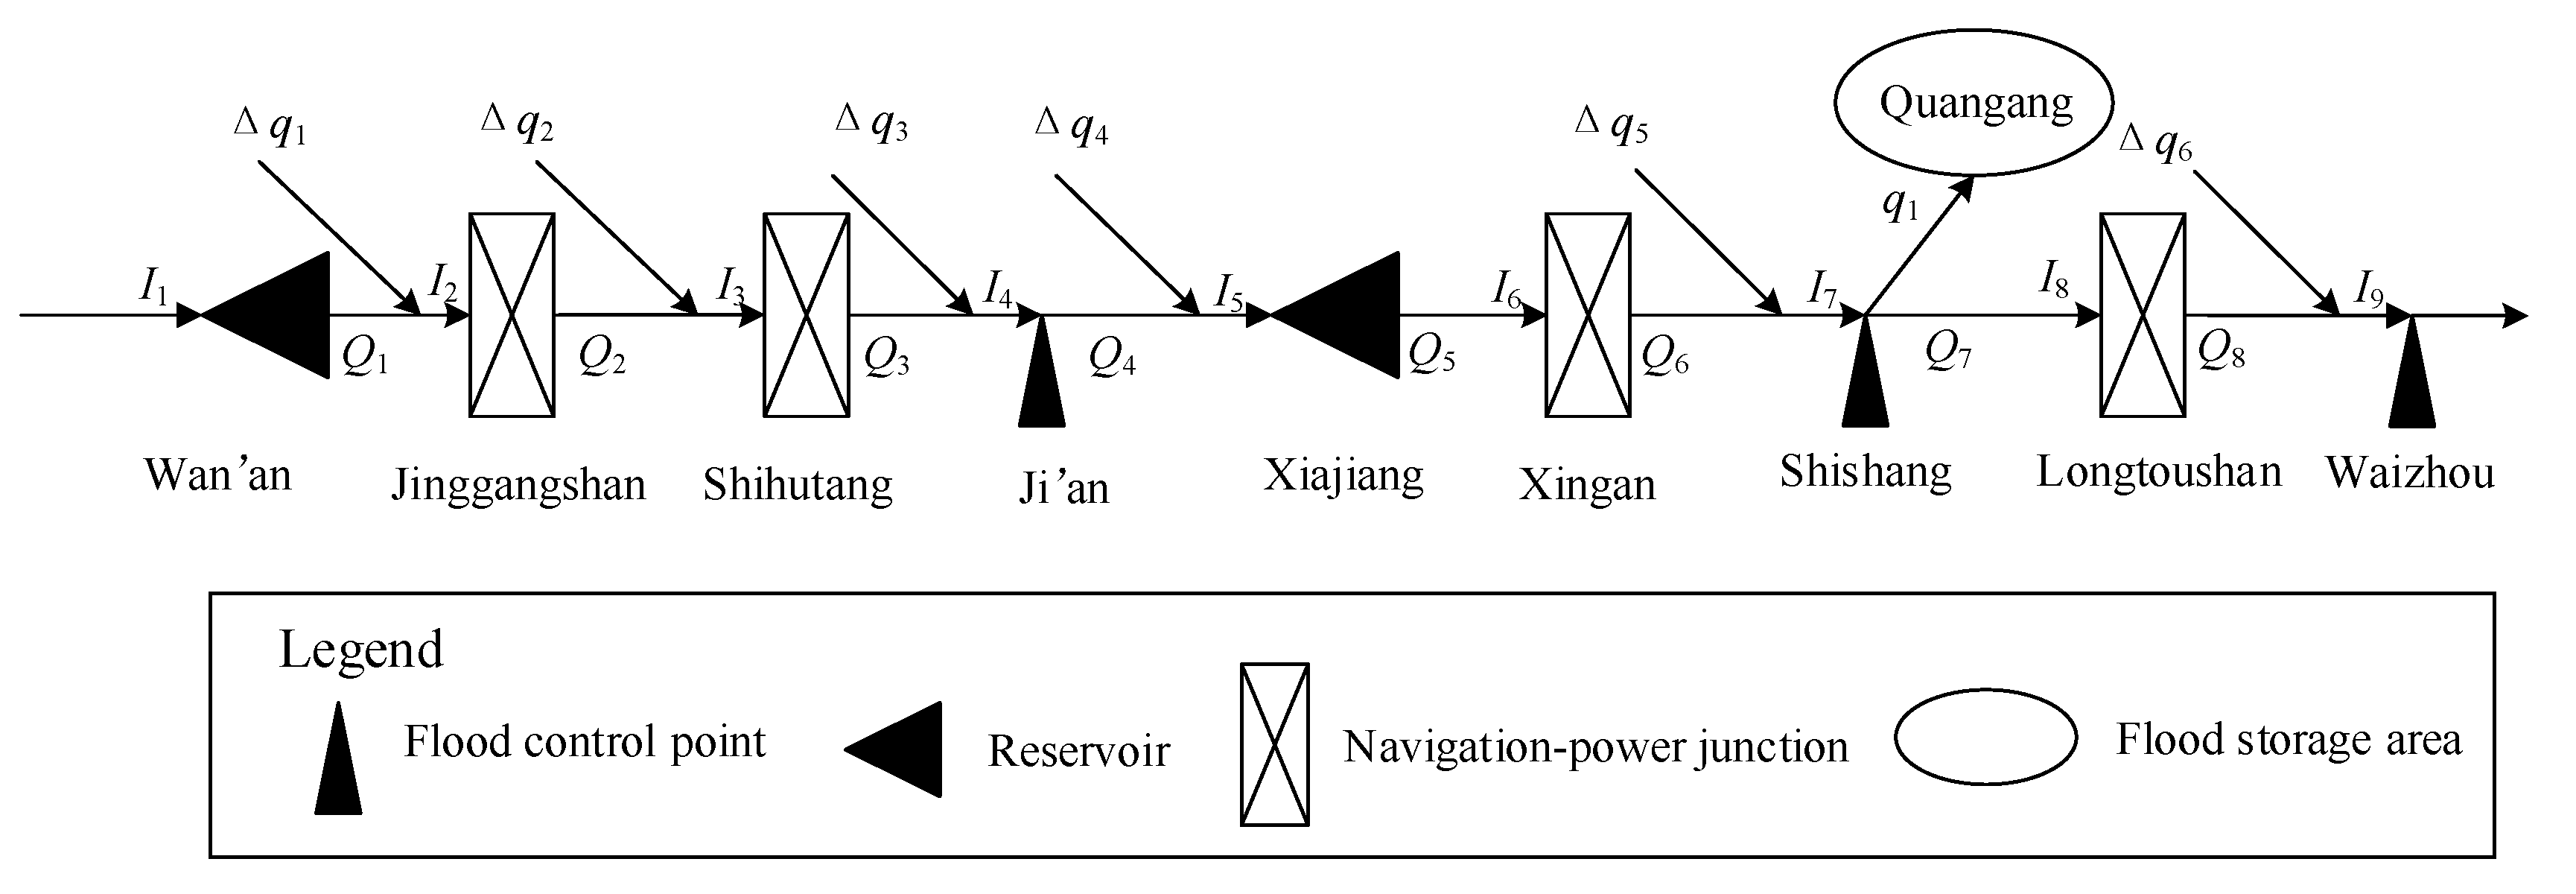
44]. The Ganjiang River has a great influence on the social and economic development of Jiangxi Province, China. However, flood disasters frequently happen in the middle and lower reaches of the Ganjiang River, which harm human lives and property and threaten the safety of society. In addition, more and more water projects have been built in the middle and lower reaches of Ganjiang River, making the hydraulic connection complex and it is worth researching on optimal flood control operation to reduce the loss of flood disasters.
The middle and lower reaches of Ganjiang River flood control system is composed of two-stage cascade reservoirs, four navigation-power junctions, a flood storage area, five local inflows, and three flood control points. The two-stage cascade reservoirs, consisting of Wan’an reservoir and Xiajiang Reservoir, play a major role in the flood control in the middle and lower reaches of the Ganjiang River. Wan’an reservoir, until now, is the largest reservoir in the Jiangxi Province, China, with a total storage of 22.16 × 10
8 m
3 [
45]. Xiajiang reservoir is the second largest reservoir in the Jiangxi province with a storage capacity of 11.87 × 10
8 m
3. Quangang flood storage area, with a storage capacity of 8.35 × 10
8 m
3, located in the lower reaches of Ganjiang River, helps protect flood control points Shishang and Waizhou through flood diversion. The two navigation-power junctions, Jinggangshan and Shihutang, are situated between Wan’an reservoir and Ji’an flood control point. The other navigation-power junctions, Xingan and Longtoushan, are located between the Xiajiang reservoir and Shishang flood control point. The skeleton of the middle and lower reaches of Ganjiang River flood control system is shown in
Figure 4. The characteristic parameters of these reservoirs and navigation-power junctions are listed in
Table 1.
3.2. Input Data
The middle and lower reaches of the Ganjiang River are divided into eight stream segments by reservoirs, navigation-power junctions, and flood control points. The study used the Muskingum method [
46] for flood routing between the stream segments. Different stream segments have different Muskingum coefficients, which are calibrated by the historical flood data and provided by the Jiangxi Provincial Institute of Water Sciences. The time interval, Δ
t, is 6 h. These Muskingum coefficients are listed in
Table 2.
The conventional flood control operation rules of the Wan’an and Xiajiang reservoirs are listed in
Table 3 and
Table 4.
Six flood hydrographs (namely those from 1961, 1968, 1973, 1994, 1998, and 2010) were selected as typical flood hydrographs. Then all the typical flood hydrographs were magnified to design flood hydrographs with 20-year, 50-year, 100-year, 200-year, 300-year, and 500-year return periods using the peak ratio of the Waizhou station.
All data including flood control operation rules of water projects, the reservoir characteristics, flood hydrographs, and Muskingum method coefficients mentioned were provided by the Jiangxi Provincial Institute of Water Sciences and were used as input data for the optimal flood control model.
4. Results
This study applied DP-POA to optimize flood control operation and compared the results with the results from conventional flood control operations. There are three flood control points in the complex flood control system. In this study, the significance of these flood control points was assumed to be the same, so the weighting coefficient for each flood control point was equal, which is 1/3. The number of discrete points between the maximal and minimal water level of Wan’an and Xiajiang reservoirs was 100. The water level of Wan’an and Xiajiang reservoirs at the initial and final time period was equal to their flood limited water level. The maximal and minimal water level during the optimal flood control operation was equal to those of the conventional operation.
4.1. Flood Peak Reduction of Flood Control Points
Table 5 and
Table 6 list the values (average of six years) of maximal water level and flood peak reduction of Wan’an–Xiajiang cascade reservoirs during the operation period using conventional flood control operation and DP-POA, respectively.
Table 7,
Table 8 and
Table 9 list the flood peak reduction (average of six years) at the Ji’an, Shishang, and Waizhou flood control points using conventional flood control operation and DP-POA, respectively.
Table 5 and
Table 6 show that the maximal water level of the Xiajiang reservoir is equal to its flood limited water level for the typical and the designed 20-year return period flood. This is because the flood peak of the Xiajiang reservoir is less than 20,000 m
3/s and its discharge is equal to inflow. For the same designed return period floods, the flood peak reduction of the Wan’an reservoir using DP-POA was larger than that using conventional flood control operation, which means optimization method can make full use of flood control capacity to reduce flood peak.
Table 5 shows that the flood peak reduction of the Xiajiang reservoir increases as designed return periods increase from 50 years to 200 years. While for designed floods with 300-year and 500-year return periods, the flood peak reduction of the Xiajiang reservoir decreased from 1819 to 1339 m
3/s. This is because flood peak reduction listed in
Table 5 and
Table 6 is the average value of six years. When flood peak is larger, greater storage of the reservoir is used to detain the inflow without exceeding the acceptable safety level of the reservoir. However, the flood peaks of some designed floods were too large for the Xiajiang reservoir and the discharge was equal to the inflow for the safety of the reservoir, which means that flood peak reduction was zero. For example, the flood peak reduction of the Xiajiang reservoir was zero only for “1961” designed floods with 300-year return periods, while for designed floods with 500-year return periods, the flood peak reduction of “1961”, “1968”, and ”1994” was zero. Therefore, the average flood peak reduction of the Xiajiang reservoir for designed floods with 500-year return periods was less than that for designed floods with 300-year return periods.
Table 7,
Table 8 and
Table 9 show that the DP-POA can obtain larger flood peak reduction of flood control points comparing with conventional flood control operation for all the designed return period floods. The Ji’an flood control point is located between the Wan’an and Xiajiang reservoir and its flood peak is mainly influenced by the operation of upstream Wan’an reservoir. The flood peak reduction of Ji’an flood control point using the conventional operation ranges from 365 to 1500 m
3/s while it increases by 1041~1498 m
3/s using DP-POA. The Shishang flood control point is located in the downstream of Xiajiang reservoir and its flood peak is mainly reduced by the operation of the Wan’an-Xiajiang cascade reservoirs and Quangang flood storage area. Comparing with the conventional operation, DP-POA can increase flood peak reduction of Shishang flood control point by 584~1151 m
3/s. The Waizhou flood control point is the outlet of the Ganjiang River. DP-POA can decrease its flood peak by 1080~4809 m
3/s while the conventional operation can decrease the flood peak by 747~4063 m
3/s. Considering that the maximal water level using DP-POA is equal to that using the conventional operation, these results indicate that DP-POA is more efficient in making full use of the flood control capacity of reservoirs to reduce the flood peak of flood control points.
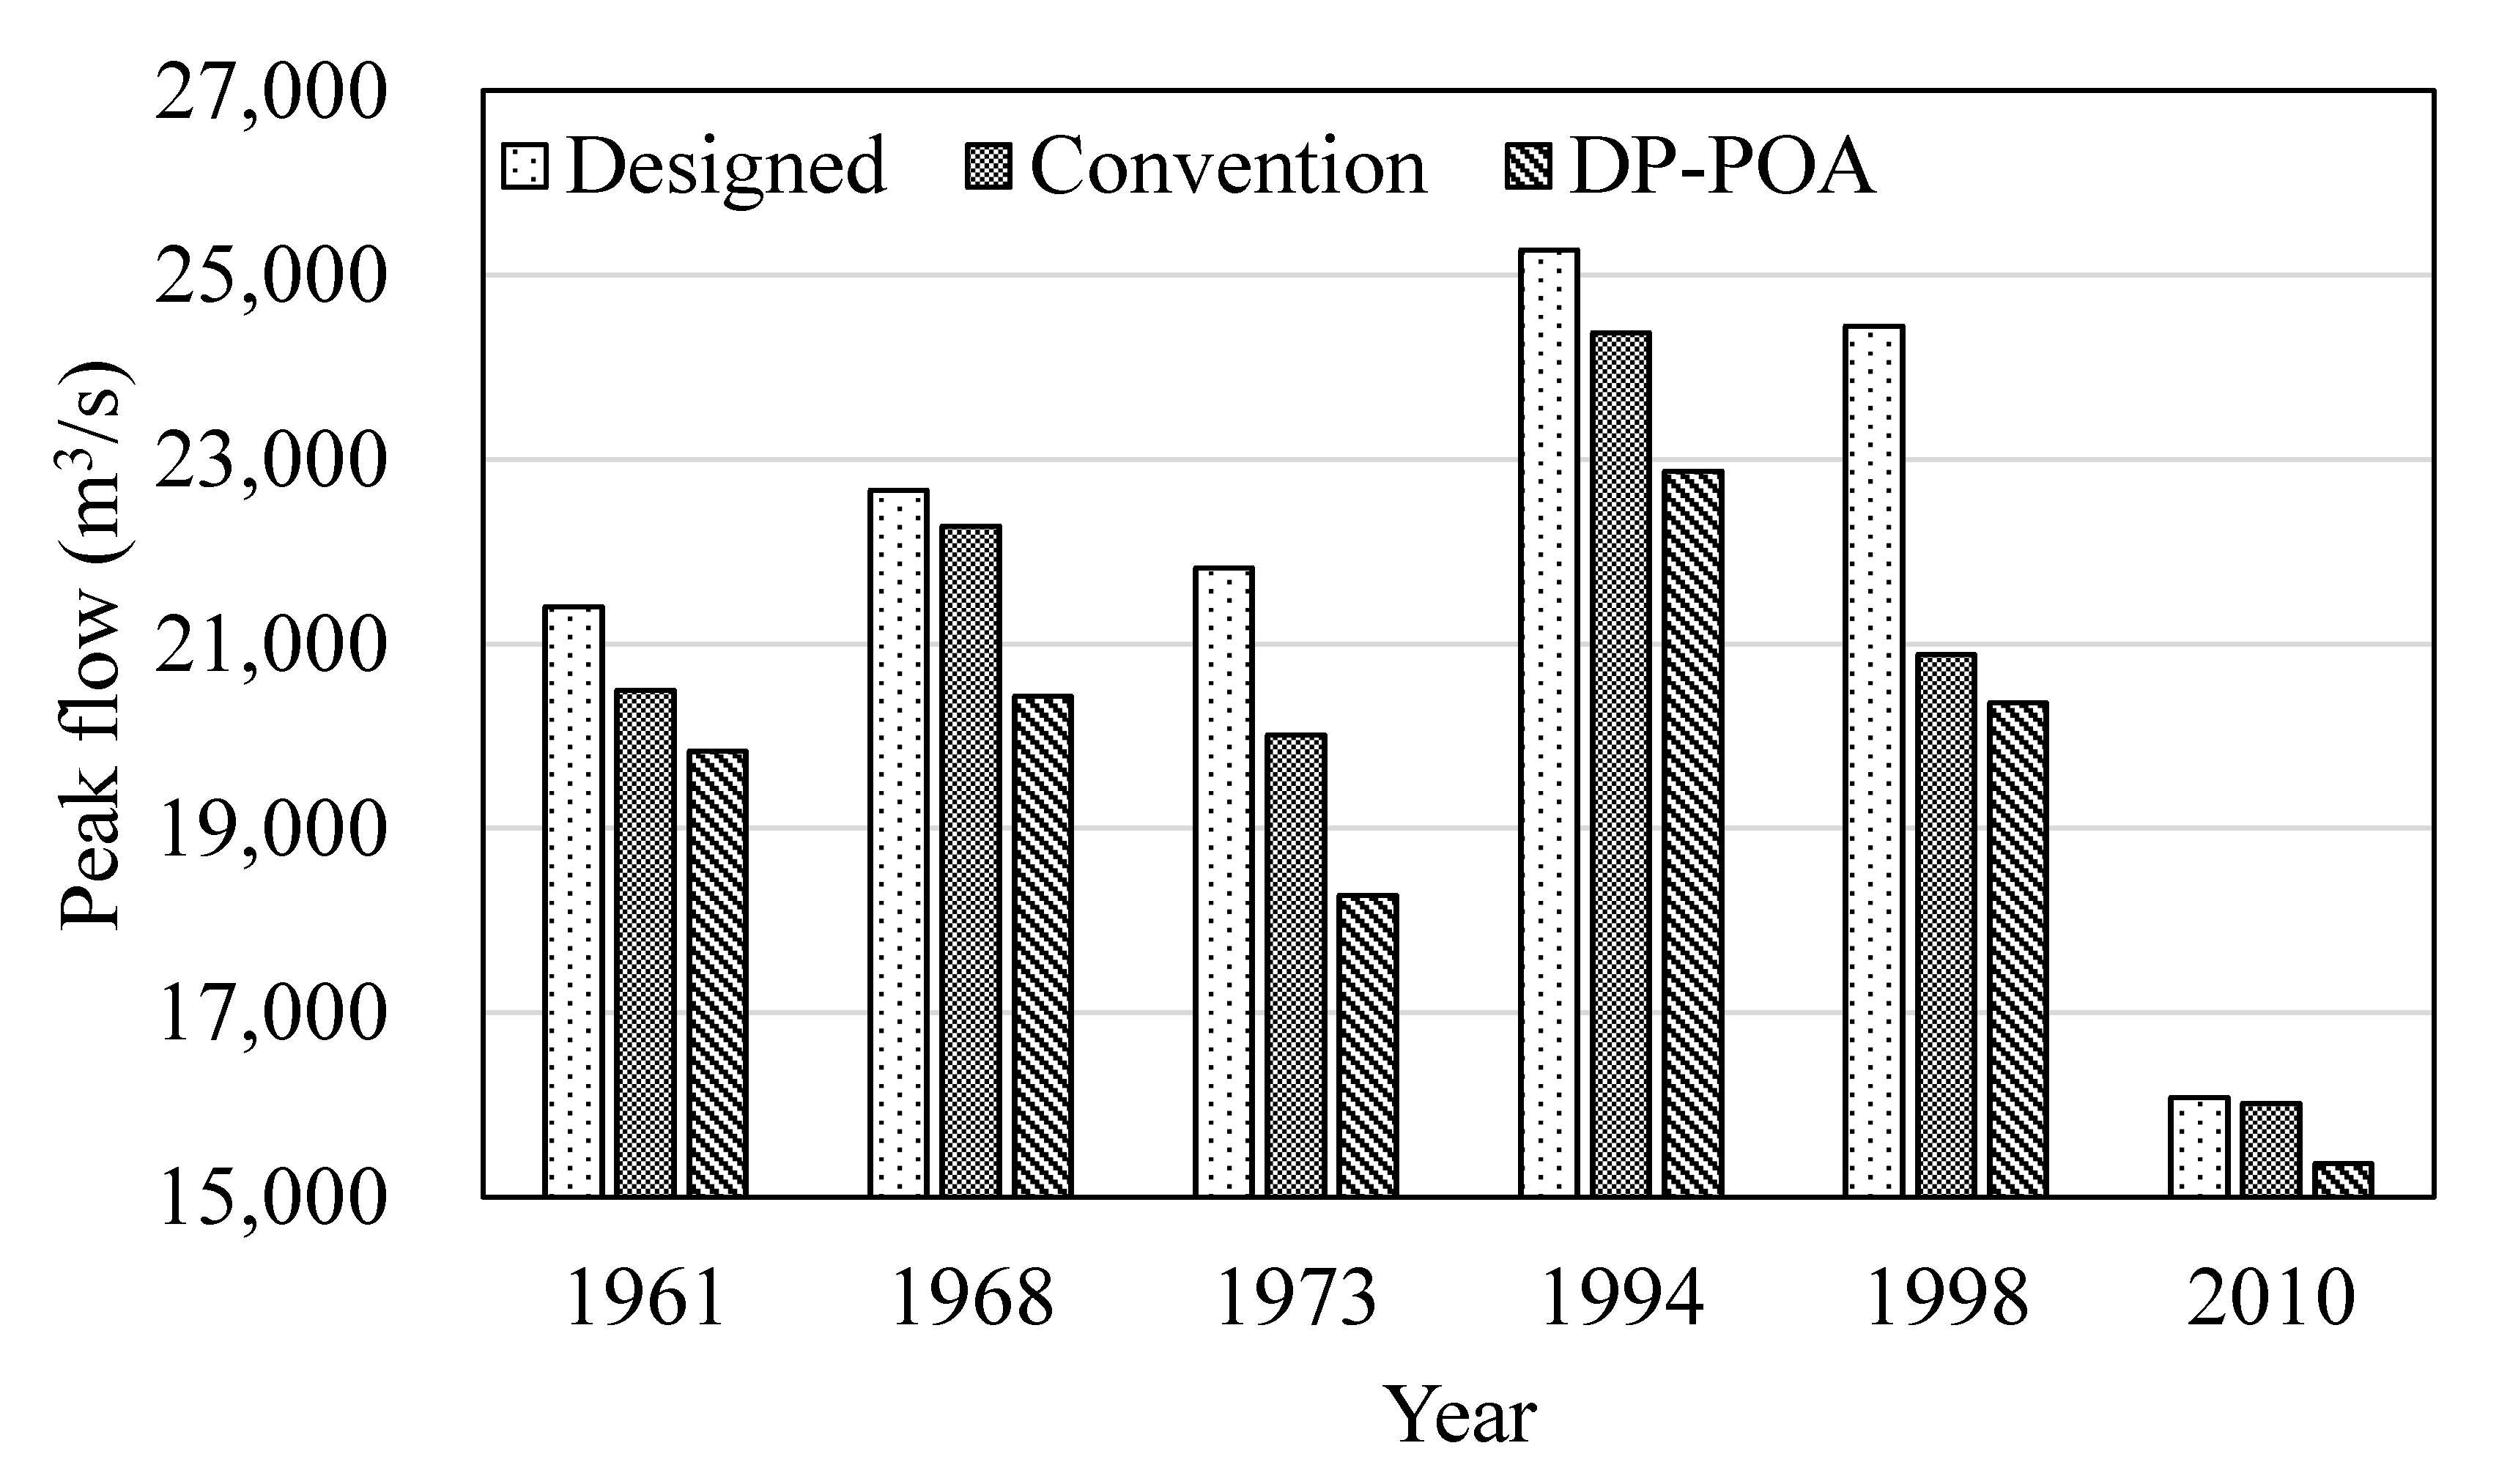
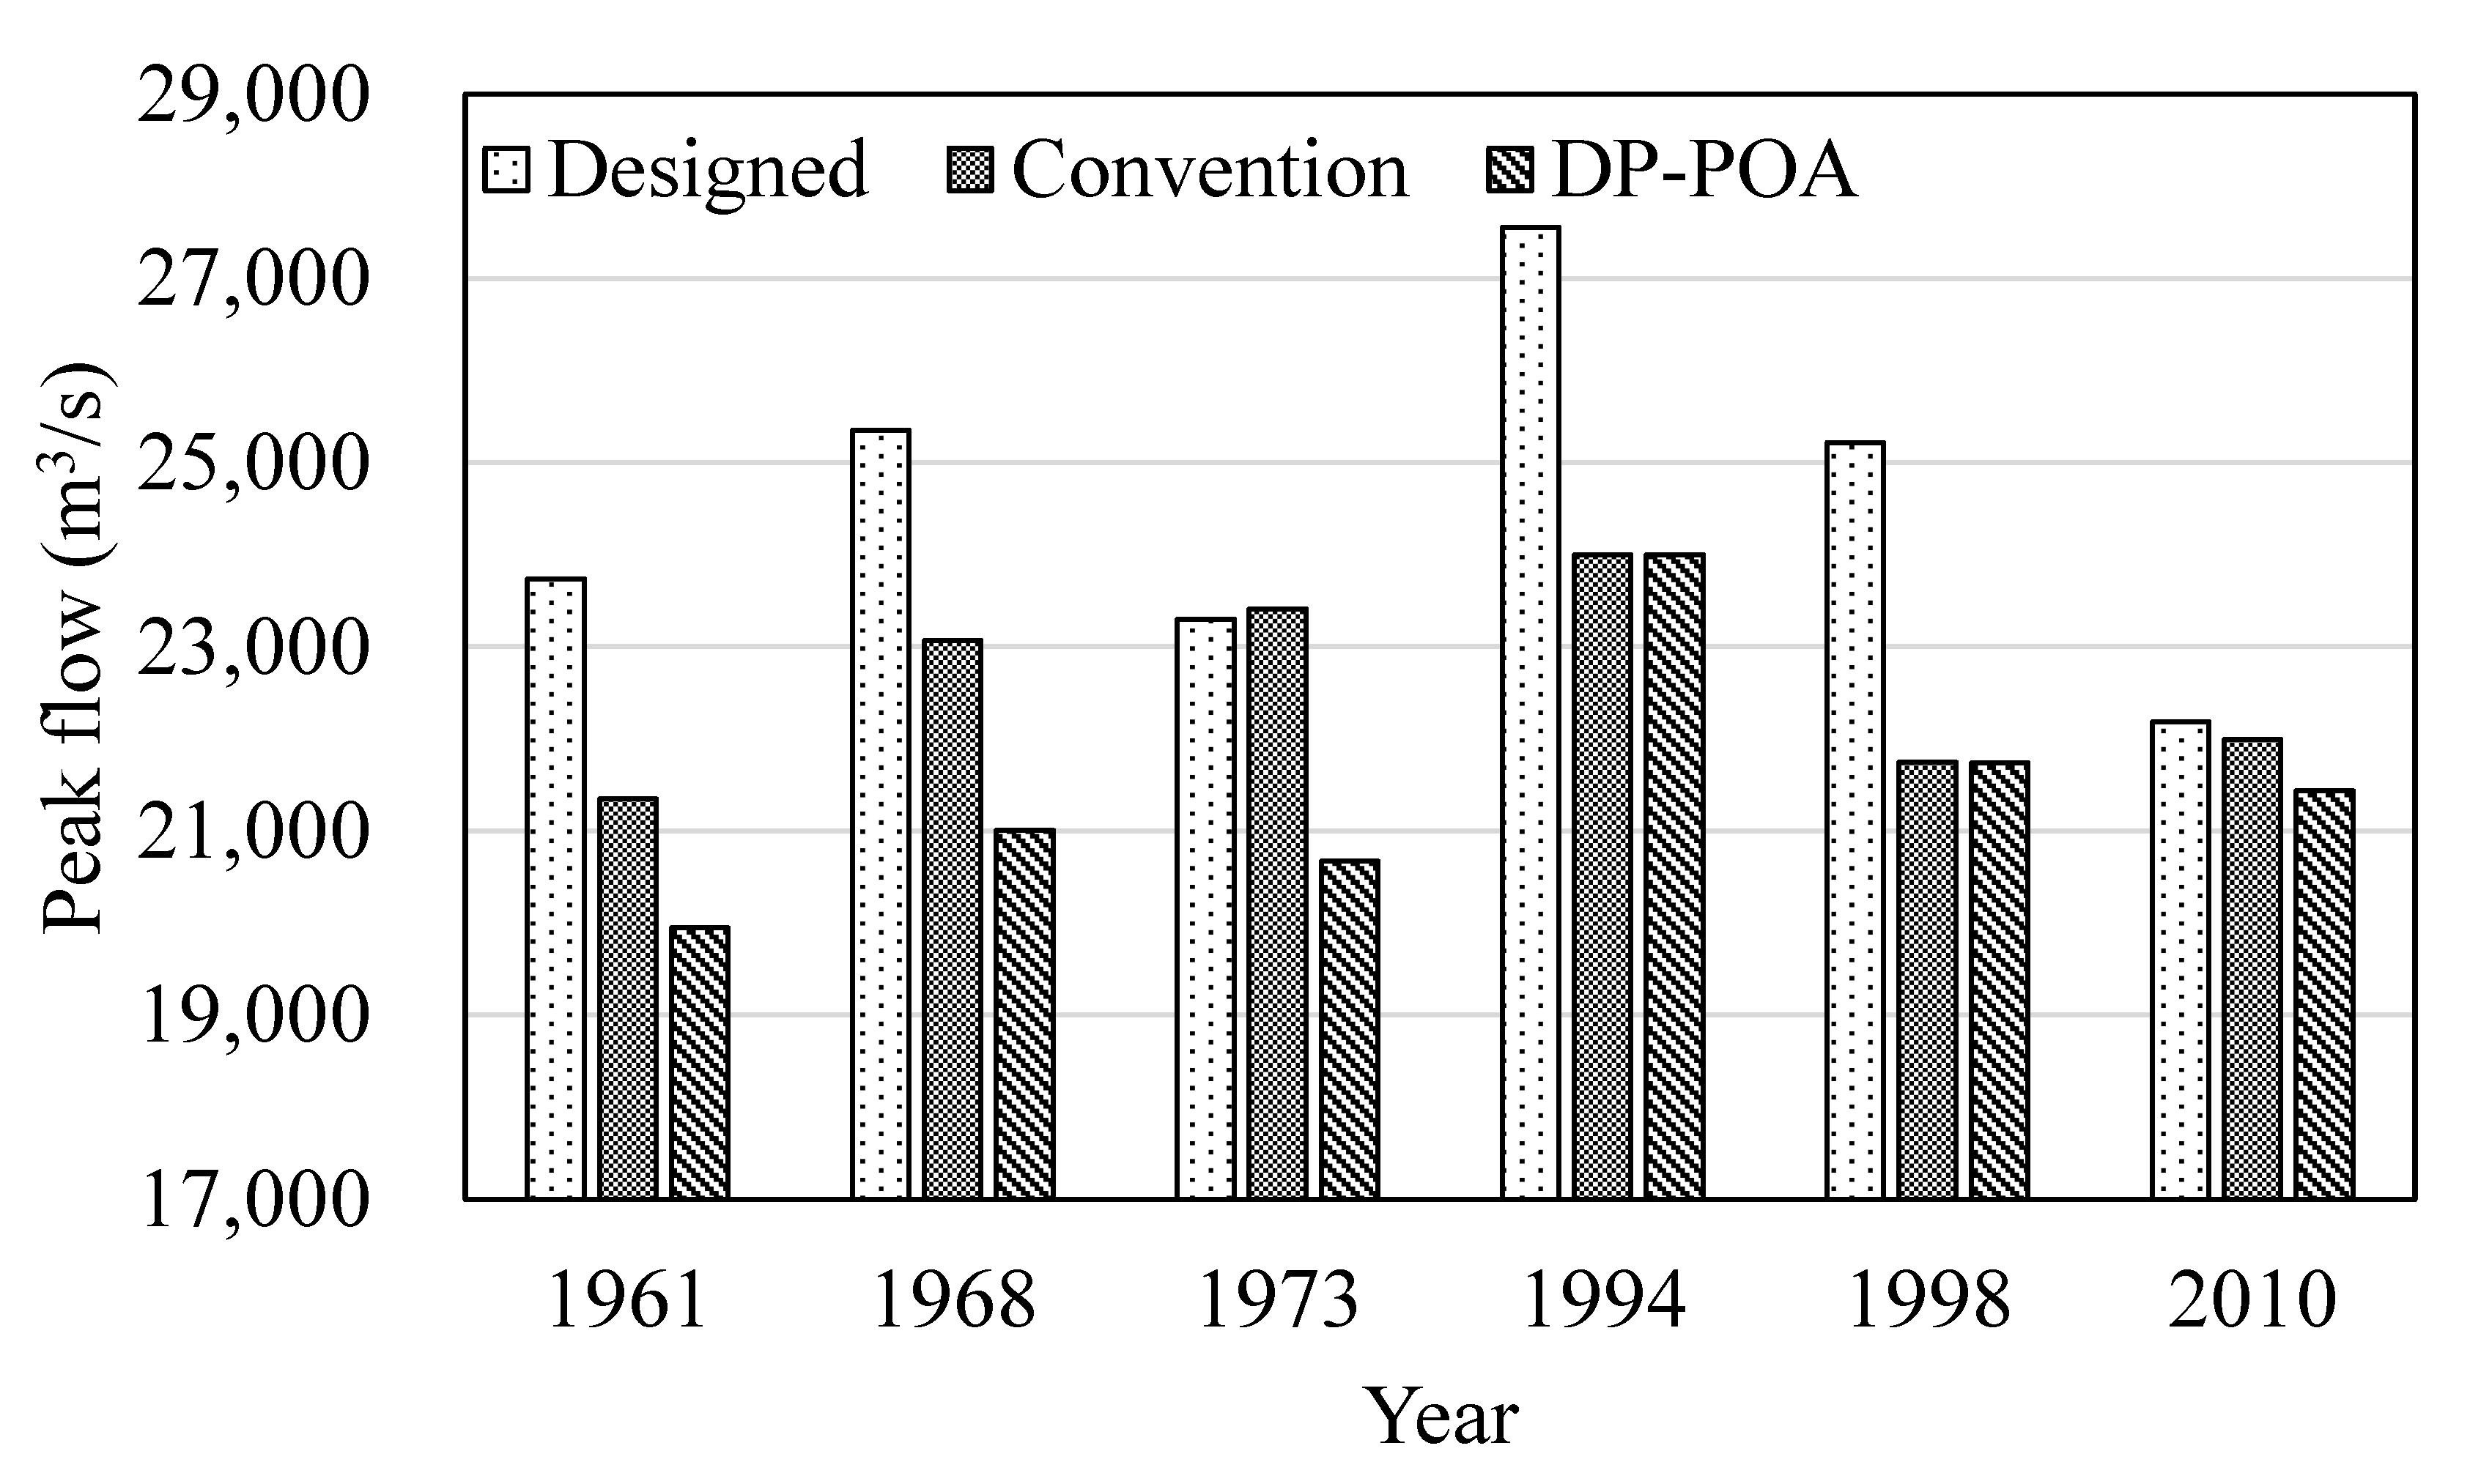
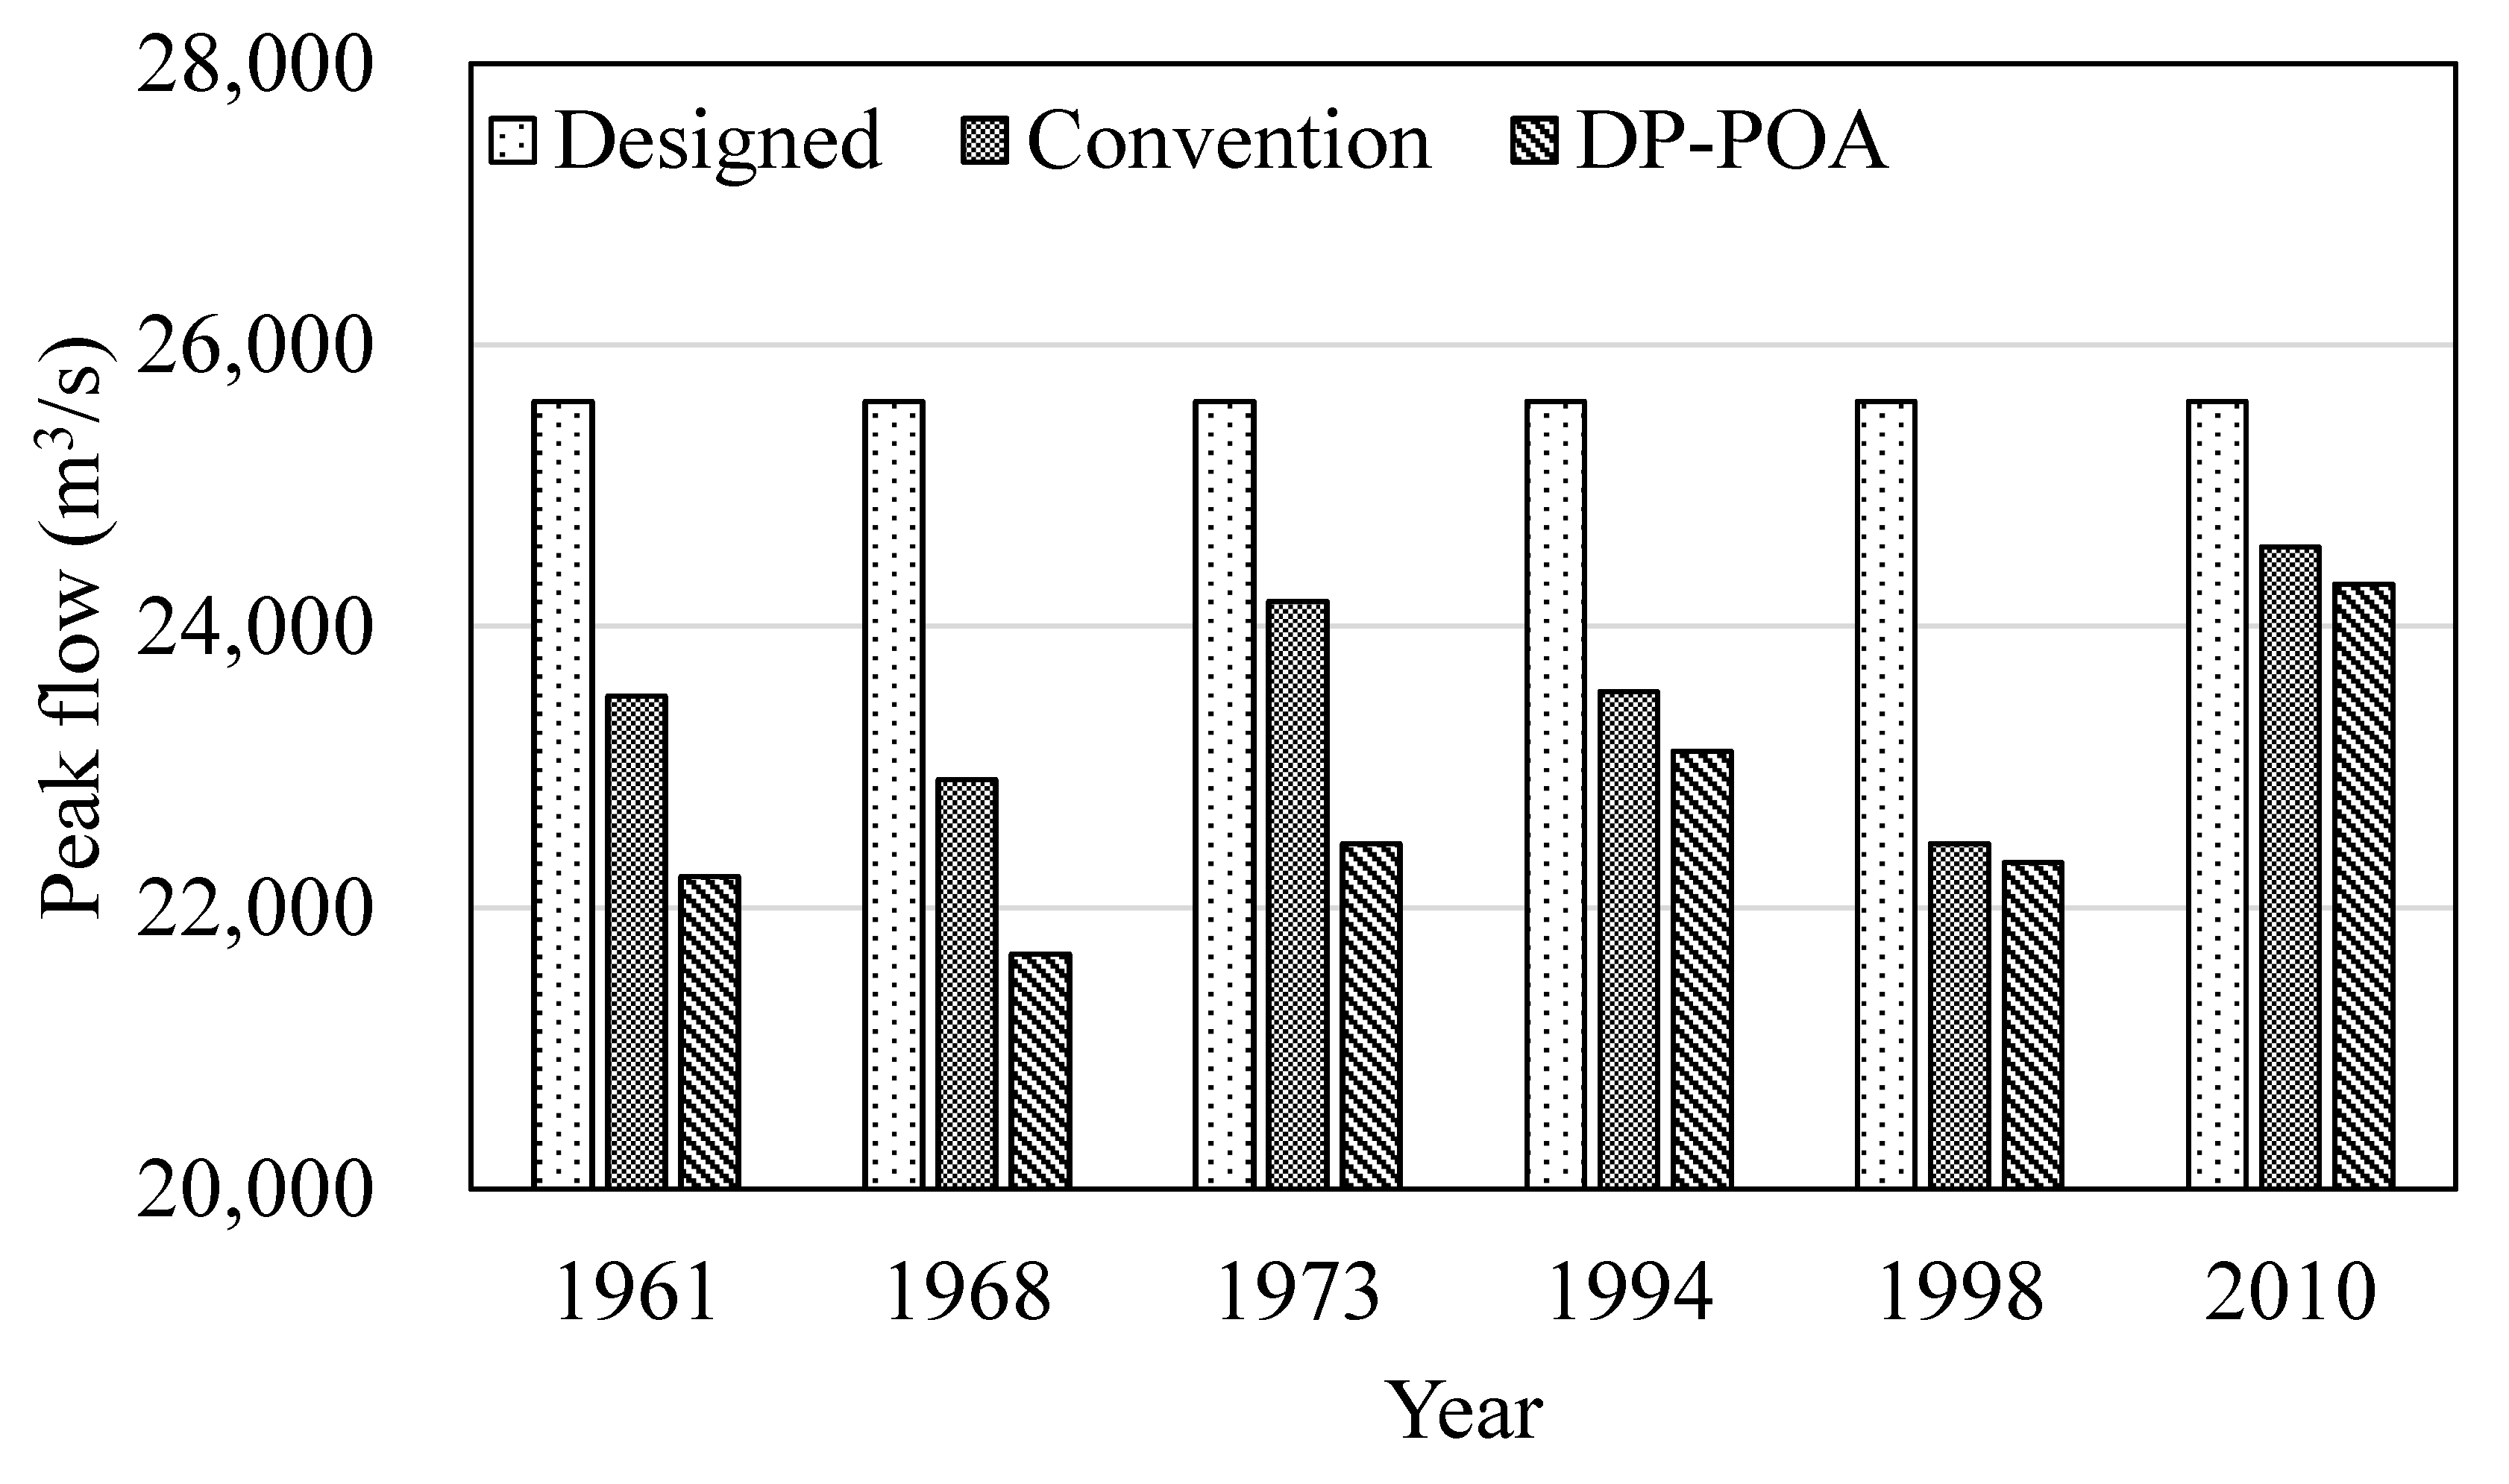
Figure 5,
Figure 6 and
Figure 7 show the 100-year return period flood peaks of Ji’an, Shishang, and Waizhou flood control points using conventional and optimal flood control operation for different typical years. Because of utilization of the Quangang flood storage area, the “1994” flood peak of the Shishang flood control point was 24,000 m
3/s whenever using conventional or optimal operation. Except for that, other flood peaks of three flood control points using DP-POA were smaller than those using the conventional operation.
4.2. Flood Diversion Volume of the Flood Storage Area
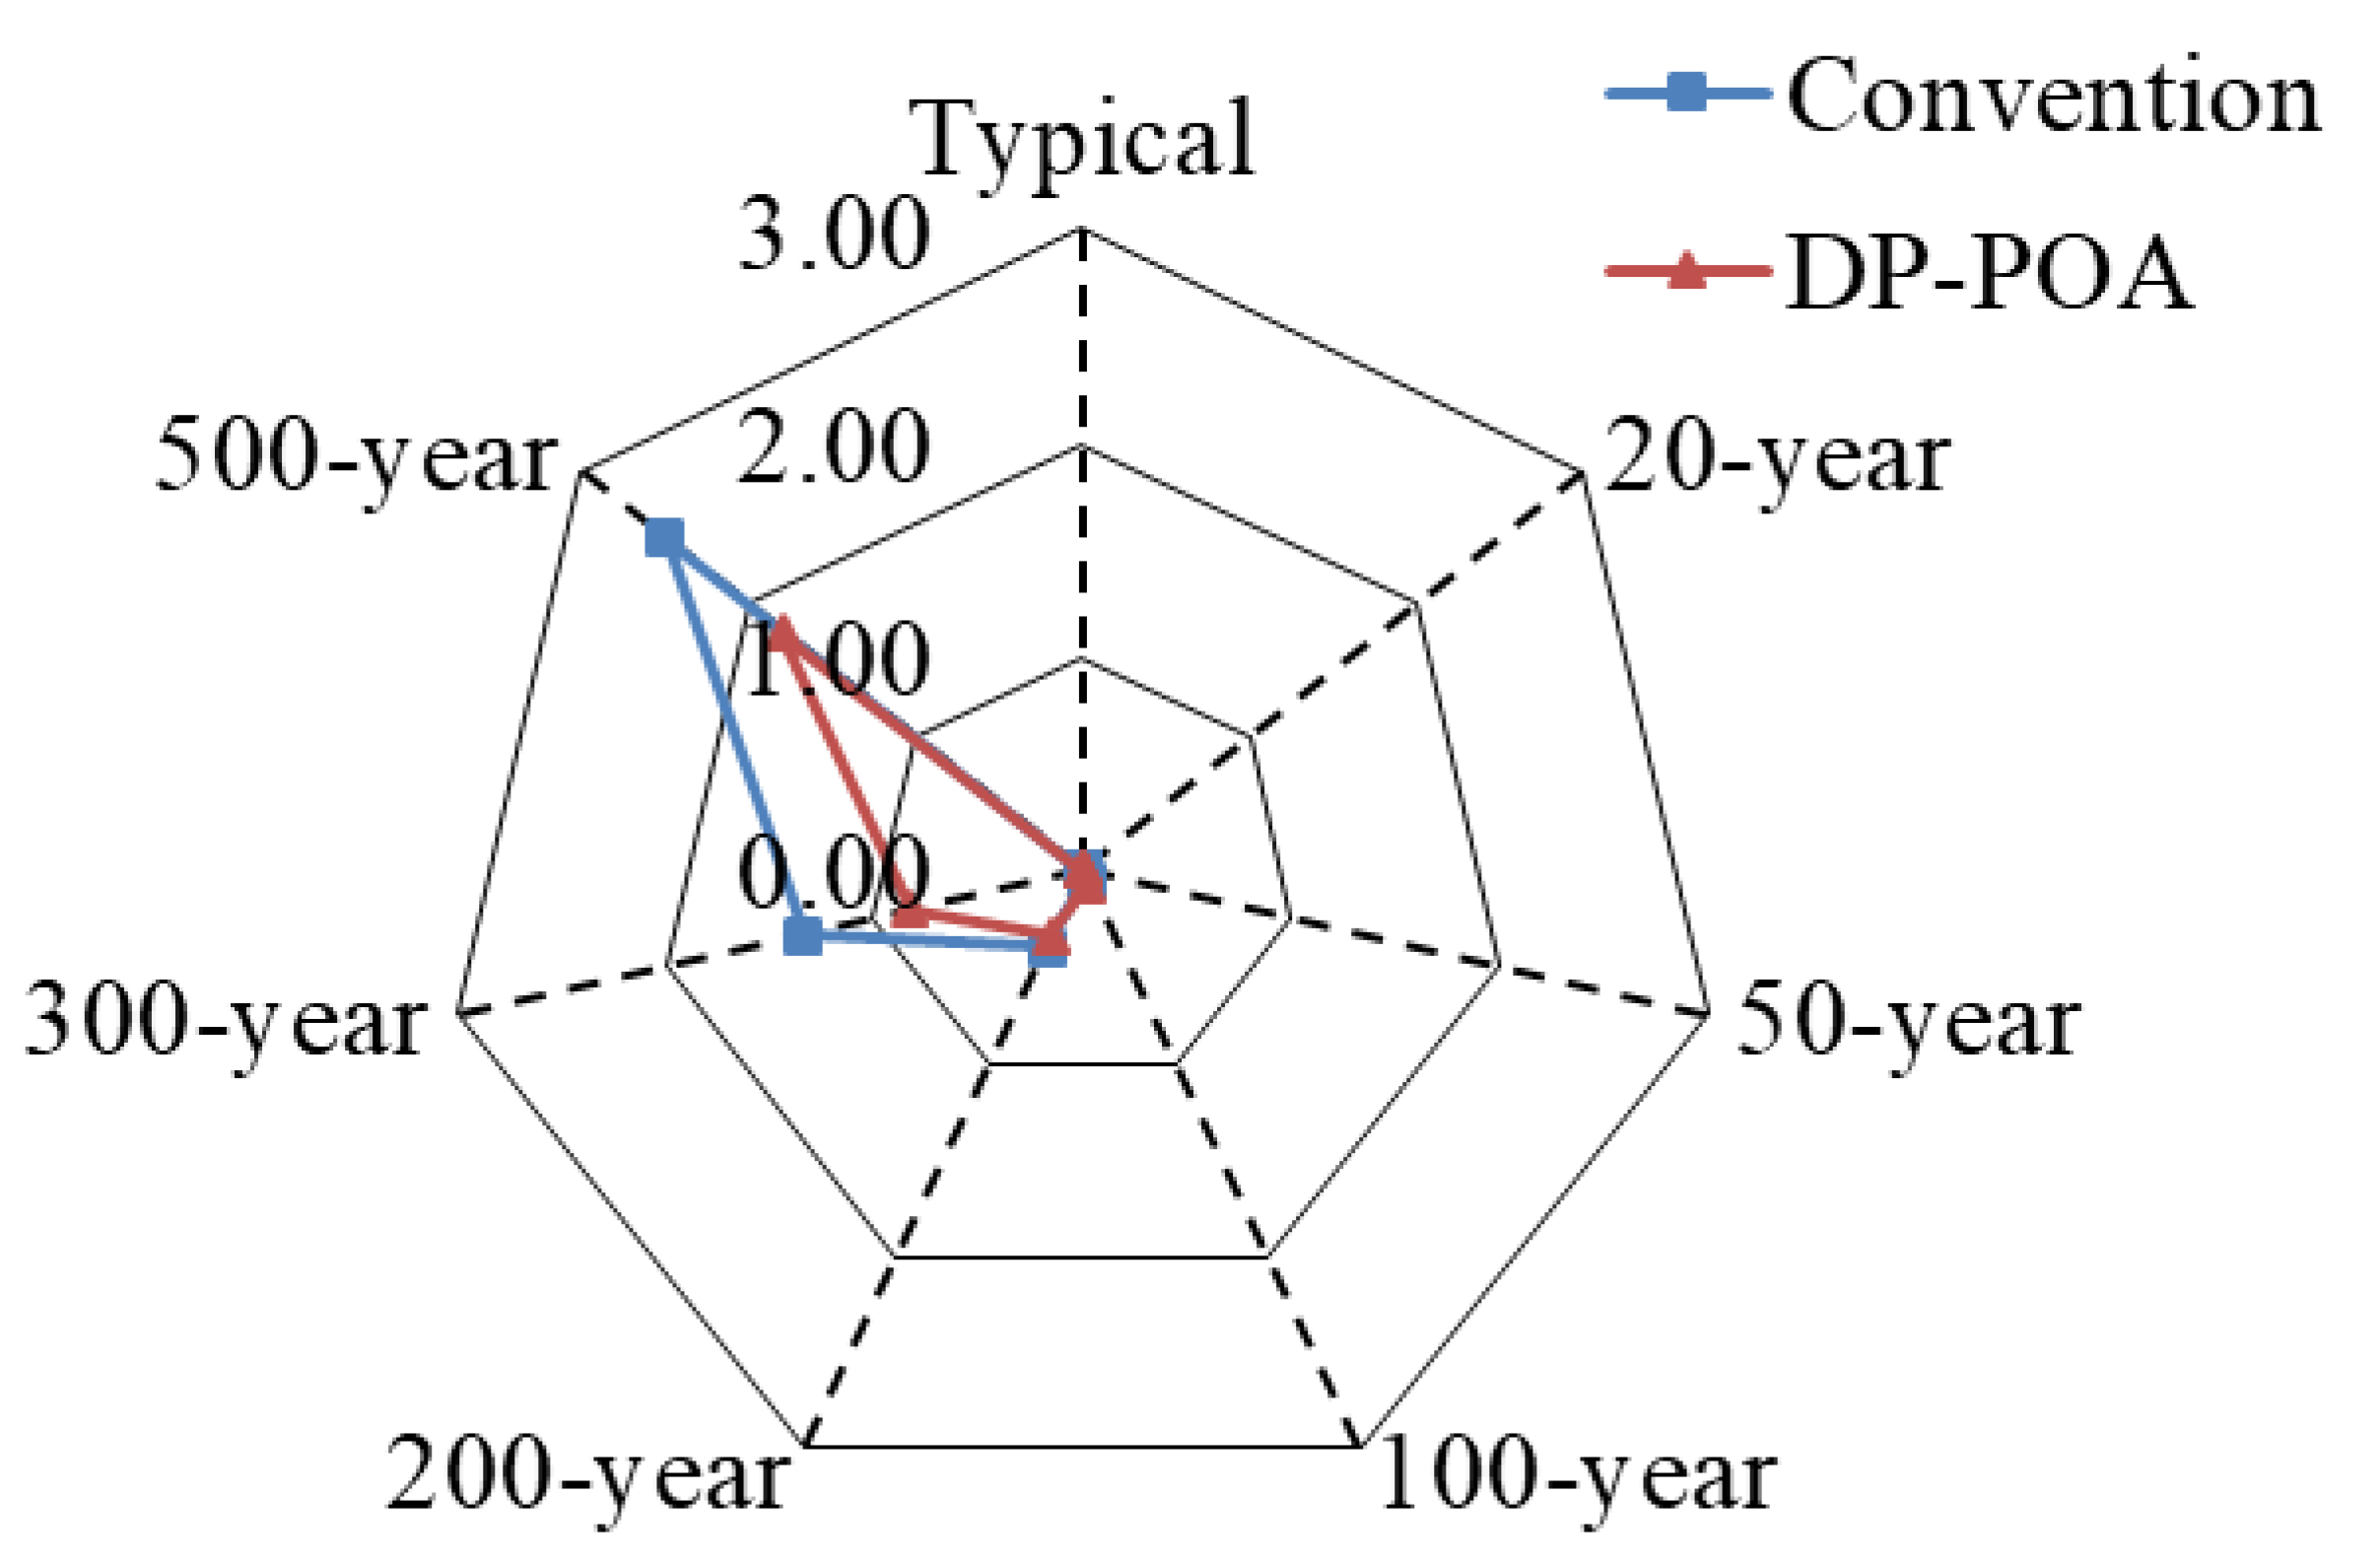
Figure 8 shows the flood diversion volume (average of six years) of typical and designed floods using the conventional operation and DP-POA at the Quangang flood storage area.
Figure 8 shows that the flood diversion volume using the conventional operation and DP-POA increased as the designed flood peak (the return period) increased. For typical floods and designed floods with 20-year and 50-year return periods, the flood diversion volume using the conventional operation was zero. For designed floods with 100-year, 200-year, 300-year, and 500-year return periods, the flood diversion volume using the conventional operation ranges from 0.04 × 10
8 to 2.49 × 10
8 m
3. Comparing with the conventional operation, the flood diversion volume using DP-POA was smaller. For typical floods and designed floods with 20-year, 50-year, and 100-year return periods, the flood diversion volume of the optimal operation was zero. For designed floods with 200-year, 300-year, and 500-year return periods, the flood diversion volume turned from 0.33 × 10
8 m
3 to 1.79 × 10
8 m
3. This means that DP-POA can retain more storage capacity and it is safe for operation in the Quangang flood storage area.
4.3. Flood Control Operation Process of Reservoirs
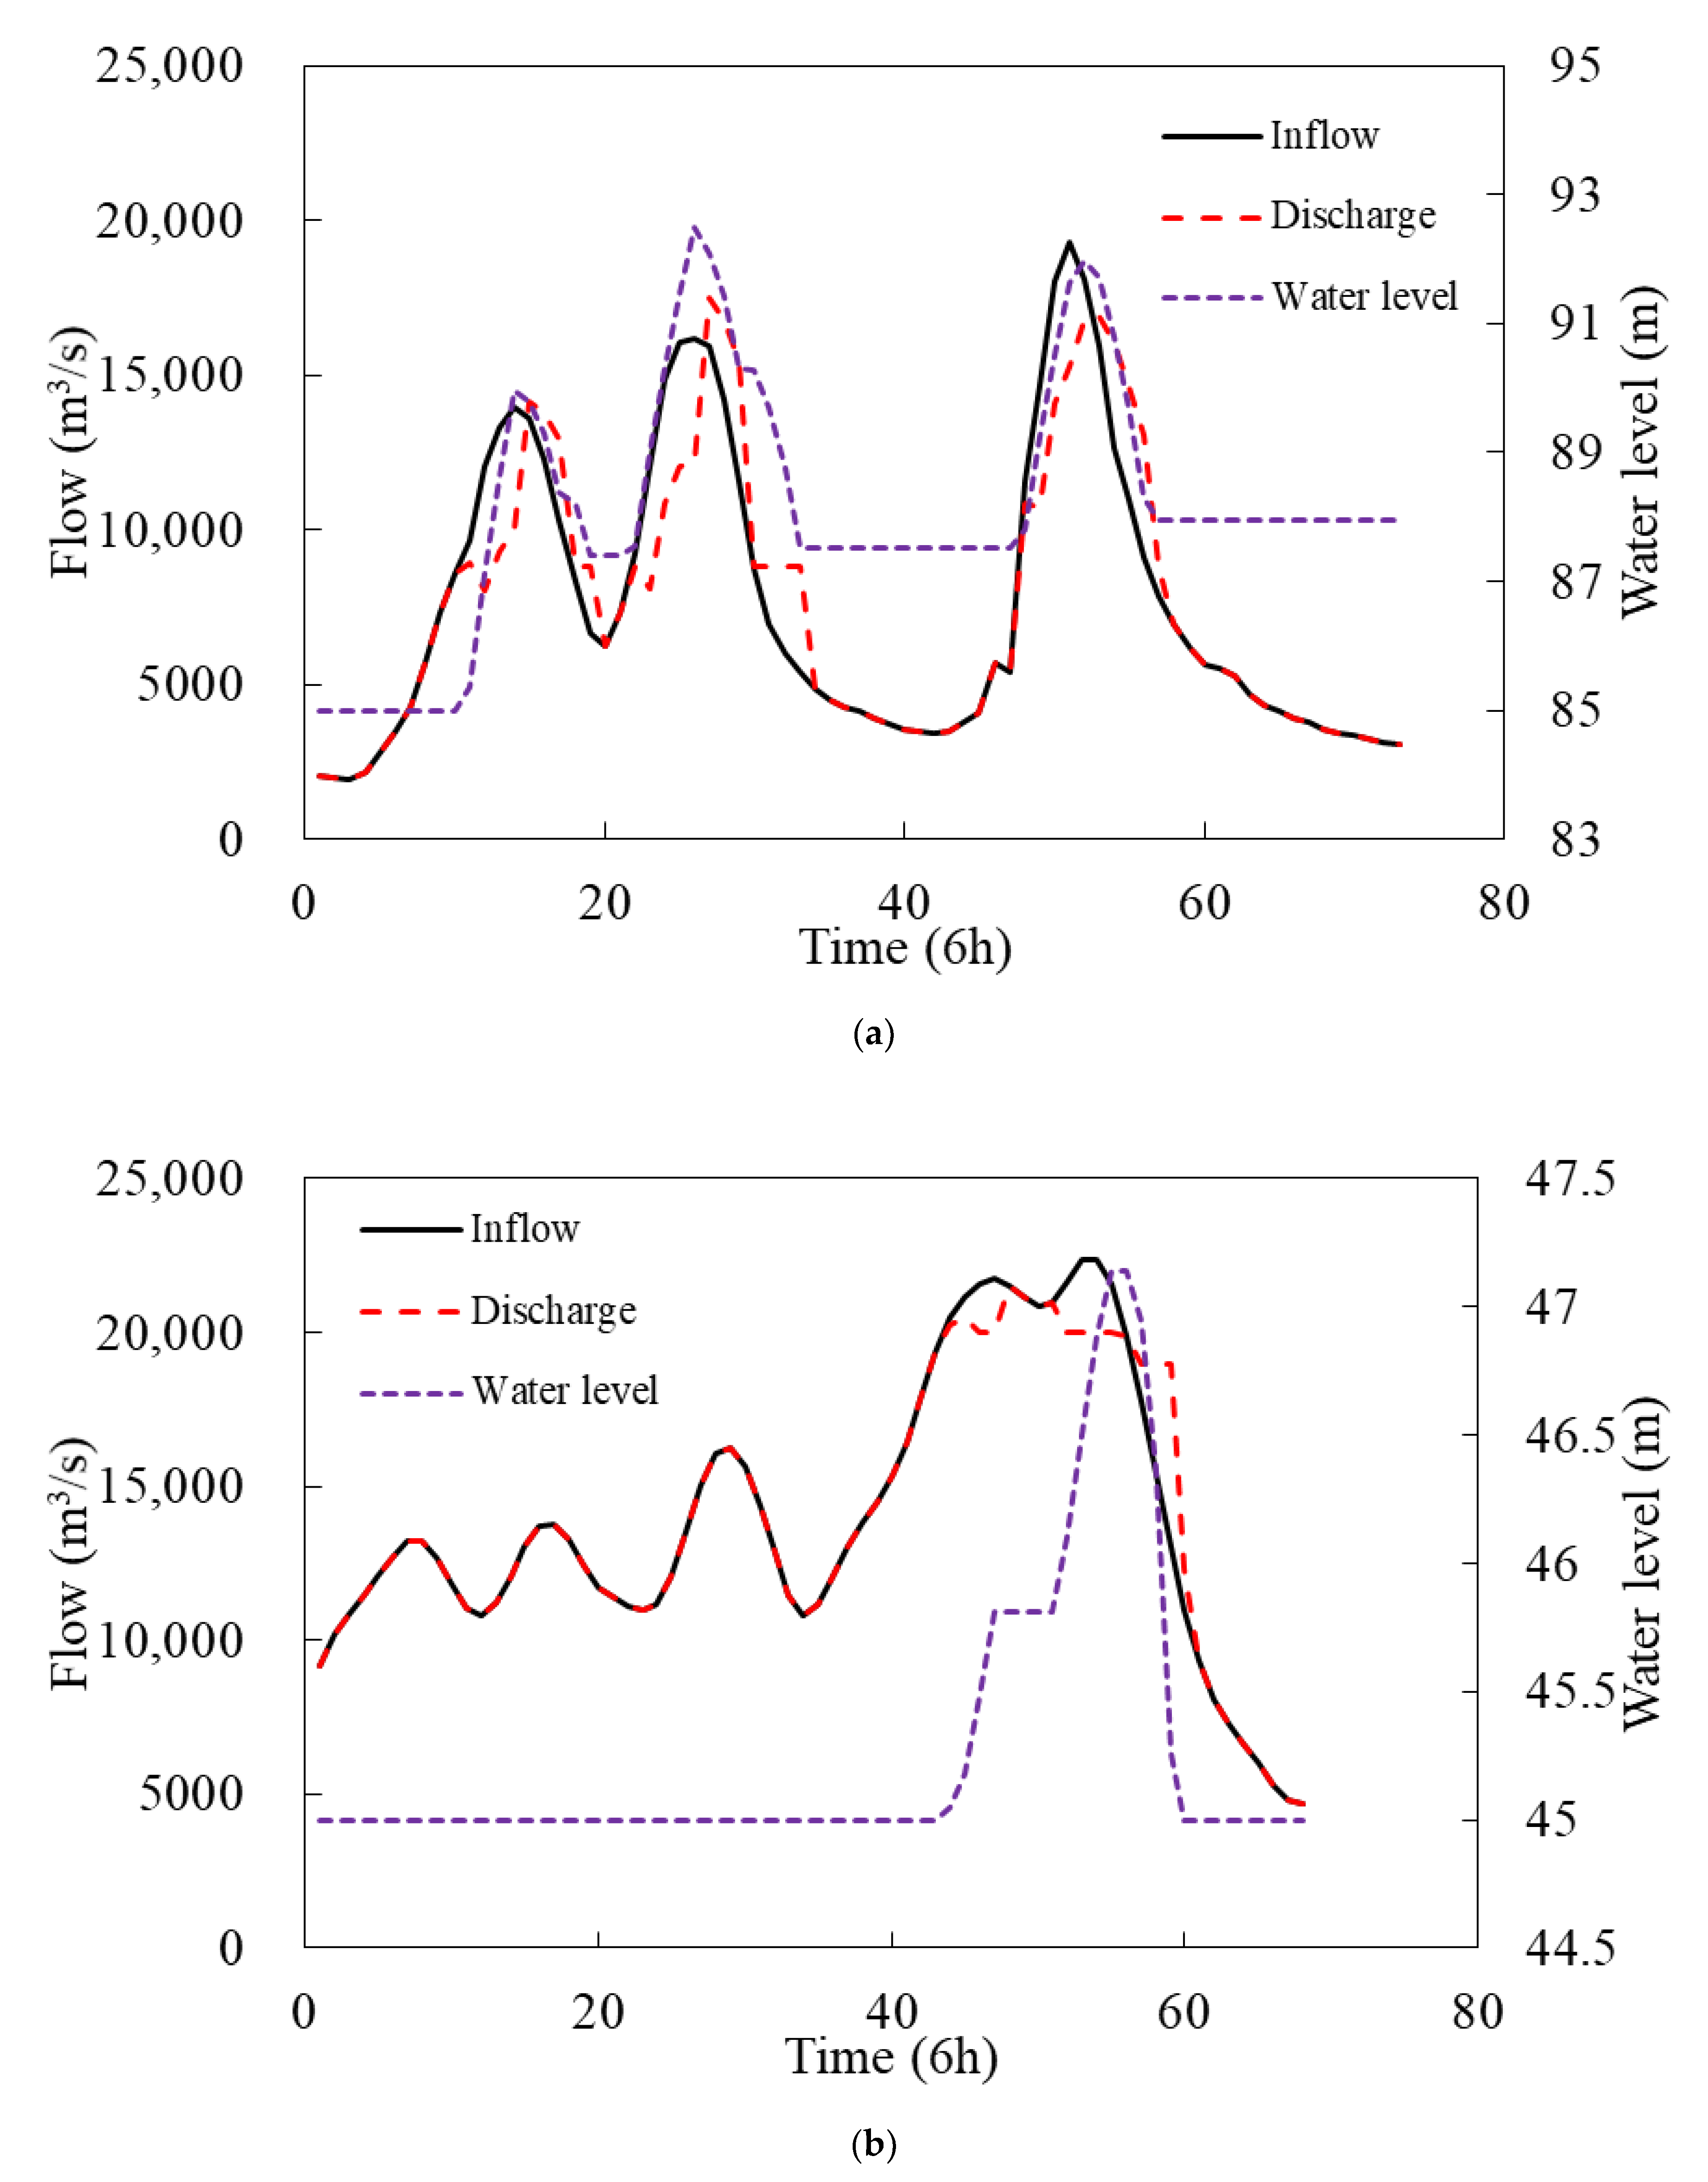
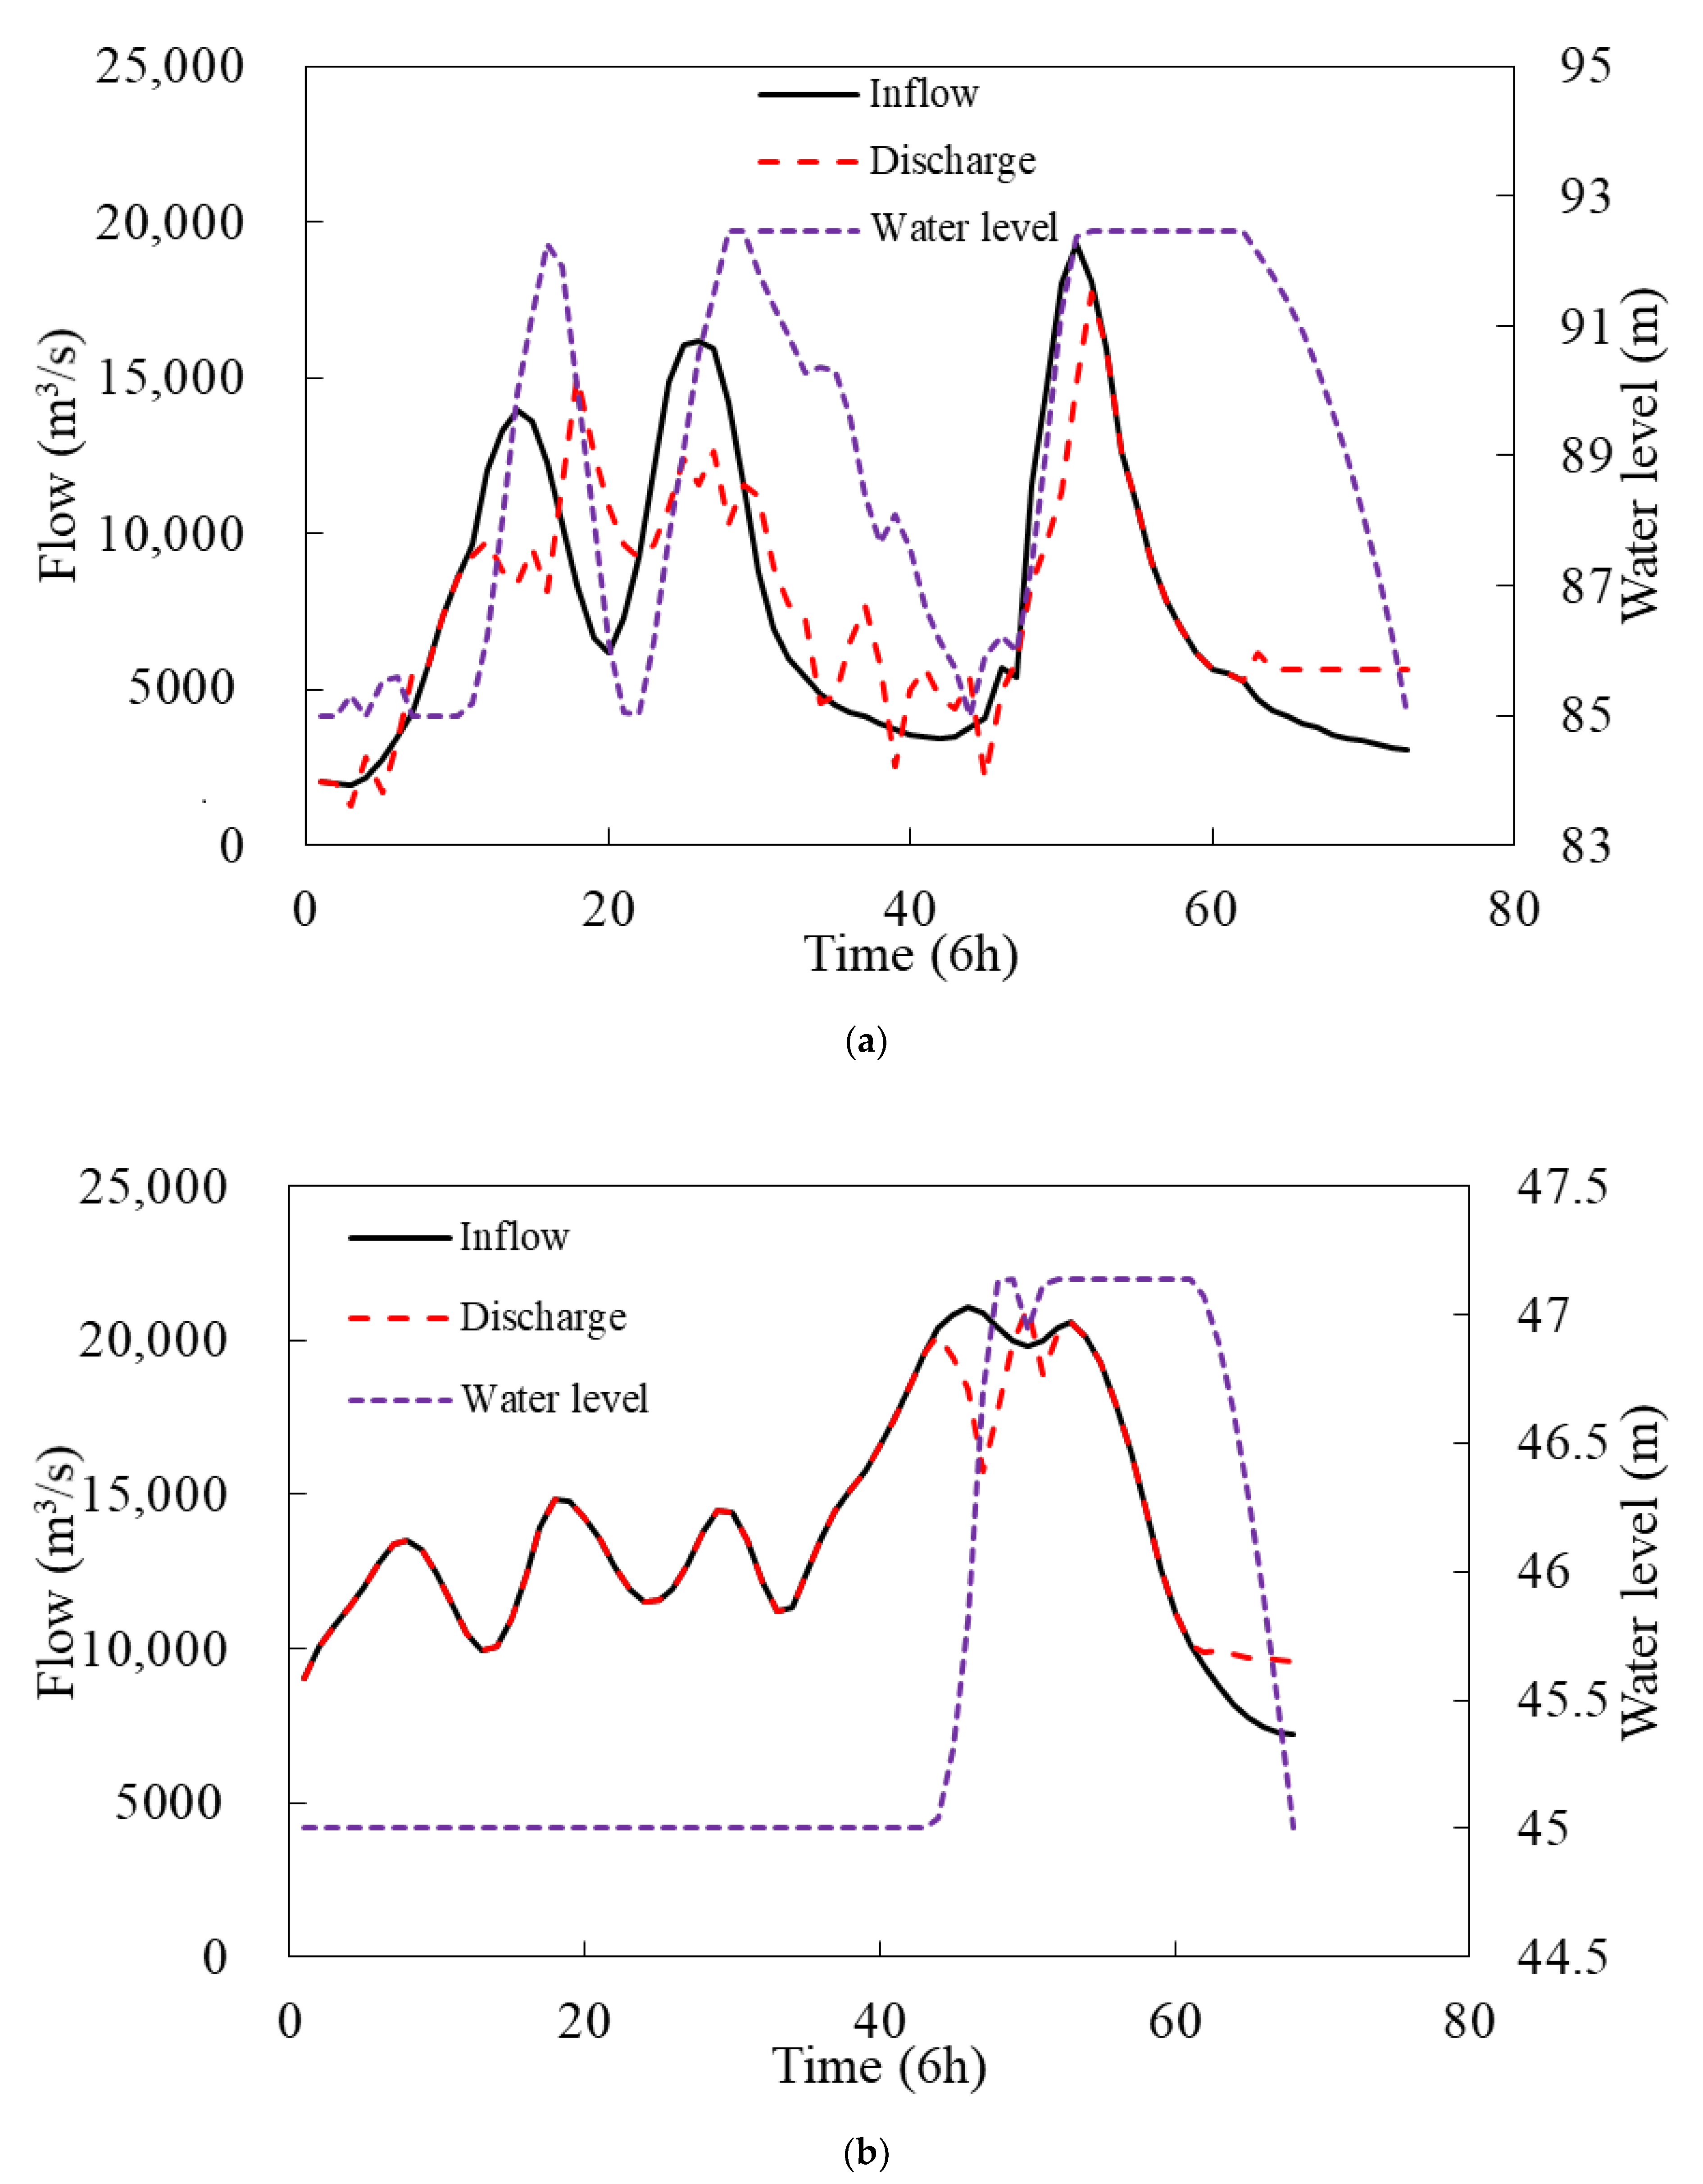
This study selected the “1961” flood with a 100-year return period for the further analysis of the conventional and optimal flood control operation for the Wan’an–Xiajiang cascade reservoirs.
Figure 9 and
Figure 10 show conventional and optimal flood control operation of Wan’an–Xiajiang cascade reservoirs.
Figure 9a and
Figure 10 show that there are three peaks in the flood hydrograph of the Wan’an reservoir. The maximal flood peak occurs during the 51st time period. As shown in
Figure 9a, before the occurrence of the maximal flood peak, the water level of the Wan’an reservoir using the conventional operation rose gradually from 85.0 to 87.5 m, which means the partial flood control capacity was occupied by the first two flood peaks. As shown in
Figure 10a, DP-POA can reduce the first two flood peaks greatly compared with the conventional operation and decrease the water level of the Wan’an reservoir from 92.48 to 85.0 m before the occurrence of the maximal flood peak, which indicates that greater flood control capacity is retained to reduce flow from the 48th to 52nd time period.
Figure 9b and
Figure 10b show that the inflow of the Xiajiang reservoir fluctuates before the occurrence of the maximal flood peak. The maximal inflow peak of the Xiajiang reservoir using the conventional operation was 22,344 m
3/s, which occurs at the 53rd time period. However because DP-POA optimizes the discharge of the Wan’an reservoir, the maximal inflow peak of the Xiajiang reservoir using DP-POA was reduced to 21,060 m
3/s, which is even smaller than the discharge of the Xiajiang reservoir using the conventional operation. In addition, DP-POA did not reduce the inflow peak of the Xiajiang reservoir. Comparing the occurrence time of inflow peak with that of discharge peak, it is shown that DP-POA delays the occurrence time of flood peak from the 46th time period to the 50th time period. This indicates that DP-POA can consider the downstream local flow and delay occurrence time of the discharge peak to avoid encountering downstream flood peak.
5. Discussions and Limitations
The optimal flood control operation model and optimization method is deterministic without random factors. Therefore, the optimal flood control operation results of typical and designed floods were stable and could give some guidance on improving conventional flood control operation rules of the Wan’an–Xiajiang cascade reservoirs. When applied in practical flood control operation, if the flood forecast is accurate and the flood forecast period is long enough, the flood hydrograph of the Wan’an and Xiajiang reservoir and all the local flows can be determined. DP-POA can be applied to find optimal flood control operation polices. For example, if the flood forecast period is 10 days, assuming the computing time interval is 6 h, then the flood hydrograph is determined, and the number of the streamflow value is 40. Then DP-POA can be used to optimize discharge of the Wan’an–Xiajiang cascade reservoirs and the water level during each time period is obtained. Considering that DP-POA in this study is programmed with C++ language, it does not take too much time to optimize the flood control operation. Then reservoirs operators can adjust the opening of spillway gates according to the optimal discharge polices in time. However, many uncertainties including flood forecast error and the uncertainties in the discharge capacity curve and water level-storage curve have not been considered, and stochastic modeling, which may better address these uncertainties, will be researched in future study.
This study turned the multi-objective optimization problem into a single-objective optimization problem by assigning the same weighting coefficients for each flood control point turning. It is obvious that the flood peak reduction of the flood control point will be larger if its assigned weight is larger. The sensitive analysis of weighting coefficients and relationship of flood peak reduction of these flood control points will be further researched in future. In addition, it is feasible to redo this study work in future if some external influences such as climate change and human activities can be quantified. The input data such as flood hydrographs, flood routing parameters, characteristics parameters of reservoirs can be recalibrated considering climate change and human activity. Then the similar deterministic flood control model can be established, and DP-POA can be used to find optimal results. If these influences are uncertain or hard to determine, stochastic frameworks and flood risk assessment models are better for the uncertain problems. Moreover, there are two kinds of flood control operation rules in practical flood control operation. One is the conventional flood control operation rules, which are obtained by flood regulating calculation for historical floods and designed flood with different return periods. The other is real-time flood control operation rules, which are obtained according to flood forecast information. Adjusting the given operation rules on an hourly or perhaps daily basis concerns real-time and flood forecast information. This is not considered in this study, and it will be researched in future.
6. Conclusions
Based on the objective of minimizing the maximum streamflow of downstream flood control points, this study established an optimal flood control operation model for a complex flood control system composed of cascade reservoirs, navigation-power junctions, flood storage areas, local flow, and flood control points. An optimal method called DP-POA was used to optimize flood control operation of reservoirs and the Muskingum method was applied for flood routing. A complex flood control system in the middle and lower reaches of the Ganjiang River was selected as a case study, and the conclusions could be drawn as follows:
(1) The optimal flood control operation problem with time-lag issues, multistage and multidimensional decision variables can be effectively solved by DP-POA. DP-POA outperforms the conventional flood control operation in reducing the flood peaks of the downstream flood control points and flood diversion volume of the flood storage area.
(2) For the typical floods and designed floods with 20-year return period, because the flood peak of the Xiajiang reservoir is less than 20,000 m3/s, its discharge is equal to its inflow and the flood diversion volume of the Quangang flood storage area is zero. This means flood peaks of downstream flood control points are mainly reduced by operation of the Wan’an reservoir. For larger floods, such as designed floods with 50-year, 100-year, 200-year, 300-year, and 500-year return periods, the joint flood control operation of the Wan’an-Xiajiang cascade reservoirs and Quangang flood storage area can greatly reduce flood peak of downstream flood control points.
(3) The flood peak reduction of Ji’an, Shishang, and Waizhou flood control points using optimal flood control operation is 1491~2541, 1102~5359, and 1080~4809 m3/s, respectively for typical floods and designed floods with 20-year, 50-year, 100-year, 200-year, 300-year, and 500-year return periods, which is a great progress comparing with the conventional operation. Considering that the maximal water level of Wan’an–Xiajiang cascade reservoirs during the periods of conventional and optimal operation is the same, this means DP-POA was more efficient in making full of flood control storage of reservoirs.
(4) Comparing with the conventional operation, the flood diversion volume of the Quangang flood storage area using DP-POA was smaller for the same designed floods. The maximum flood diversion volume using the conventional operation was 2.49 × 10⁸ m3, while the corresponding value of DP-POA was only 1.79 × 10⁸ m3. The greater the storage retained, the safer it is for the operation of the flood storage area.
(5) For flood hydrographs with more than one flood peak, DP-POA can reduce the water level of reservoirs before the occurrence of the maximal flood peak, retaining more flood control capacity to help reduce flood peak of downstream flood control points.


