Article

Water Use Inequality and Efficiency Assessments in the Yangtze River Economic Delta of China

1
School of Environment, Beijing Normal University, Beijing 100875, China
2
Department of Geography and Environmental Science, the University of Reading, Reading RG6 6AB, UK
*
Author to whom correspondence should be addressed.
Water 2020, 12(6), 1709; https://doi.org/10.3390/w12061709
Submission received: 9 May 2020 / Revised: 2 June 2020 / Accepted: 12 June 2020 / Published: 15 June 2020
(This article belongs to the Section Water Resources Management, Policy and Governance)

Abstract

:
The Yangtze River Economic Delta (YRED) faces inequality in water use in large proportions due to rapid industrialization. This study adopted the Gini coefficient and Global Moran’s index to calculate inequality, its spatial spread and water use efficiency of cities in the YRED and categorized them into types based on the spatial spread of inequality. In general, inequality is reducing, but water use efficiency is poor. Inequality was rated 0–1; zero being the highest equality while 1 indicates the highest inequality. There is relatively high inequality (0.4–0.5) in Shanghai, Suzhou and Hefei. Most cities (20), however, showed equality (below 0.2). Nine (9) cities showed relative equality (0.2–0.3), while Wuxi, Bengbu and Zhenjiang were neutral (0.3–0.4). No city scored above 0.5. Water use efficiency in the majority of cities was poor. Only 11 out of 35 cities scored more than 50% efficiency. Poor irrigation, income and industrial water demand are the factors driving inefficiency and inequality. The categorization of cities into groups produced nine city types according to the spatial disposition of inequality. A combined effort to formulate policies targeting improved water use efficiency, reduced industrial consumption and improved irrigation, tailored towards the specific situation of each city type, would eliminate inequality.

1. Introduction

Water is crucial for sustainable growth and development. Water resources and the services they provide affect a wide range of socio-economic factors including growth, poverty reduction and sustainable environmental protection [1]. From human and environmental health to food and energy security, water plays a pivotal role in contributing to improvements in the social well-being and economic growth of a population [2]. Due to its indispensability, the United Nations has specified a code on water use, which states that every human has the right to safe, clean, affordable and accessible water [3,4]. However, many people around the globe do not have access to sufficient water due to inequality [1]. Inequality results in some sections of cities getting more water than they need while others get less, usually, by natural or artificial creation, to engender social stratification in water use. Inequality in water use in many parts of the world is not measured hence water resources managers in those areas are unable to quantify its magnitude [4]. Knowing the magnitude of inequality is critical to understanding the imbalance of water use and helpful in balancing all the competing demands in the water use chain to ensure sustainable access for everyone, particularly the vulnerable, poor rural settlers in deprived parts of high growing population countries, such as China.
Undeniably, although China is currently ranked sixth in global freshwater resources by volume, the available annual per capita water is 2100 m3, which is less than the world average [5,6,7,8]. Additionally, China’s gross domestic product (GDP) output per cubic meter of water use is only one-third of the world average. In the Yangtze River Economic Delta (YRED), water resources are unevenly distributed, making it difficult to locally balance supply and demand [9]. Furthermore, the existence of a weak water management system in the YRED that is particularly inefficient in achieving equal allocation of water due to political and socio-economic pressures has brought untold challenges to water users and worsened inequality [10,11]. The level of inequality is also affected by an inconsistency in local socio-economic needs of water that exacerbates the risk of water shortages and crises in sub-cities [11,12].
The topmost body responsible for legislation of water policy in the YRED is the People’s Congress, which formulates national laws to address different uses of water, including rules on distribution and supply [10]. Within the body of the national laws, the state council is the unit responsible for regulating water management by using different administrative departments at the national level and different branches of government at the provincial level. In principle, national laws set the rules and regulations on how water is distributed, while the local government determines how the laws and rules are implemented. This framework of water management from national to local government, though complete, is complicated and fragmented, thereby making effective management of water resources at different levels a big challenge [10]. The Chinese government has taken actions to re-organize the complexity and bureaucracy endemic in the water management framework, but there are still difficulties with multiple agencies overlapping in functions [9]. Ultimately, the bigger questions of how to eliminate inequality and improve water use efficiency persist in water management frameworks in China.
Despite these challenges in water management and the insufficient water resources, the YRED is expanding in population growth and development. As a result of sustained growth, competition for water in domestic, industrial and municipal use has tripled [6,7,8] and worsened the already existing inequality in water use in agriculture, waste management, domestic and industrial consumption [6,7,13]. Inequality is said to exist or occur when resources of a society are distributed unequally, typically, through rules of allocation that engender specific patterns along lines of socially defined categories of persons [14]. Inequality in resource allocation can exist when there are insufficient of the resource coupled with high demand [15,16]. Like electricity supply, water supply in China is a service provided by state agencies. Similar to electricity, inequality in water supply is a common feature in parts of the YRED. Highly industrialized cities, such as Shanghai in the YRED, place a huge demand for water that cannot be denied due to their net contribution to GDP [11]. In other parts, agricultural irrigation is also one of the main drivers of inequality as well as level of education [11].
Inequality can be measured using various statistical tools. The Theil index is a common parameter used to measure economic inequality and racial segregation [17]. It is often described as the redundancy in information theory and estimated as the maximum possible entropy of data minus the observed entropy [18]. As a special case of the generalized entropy index, the Theil index can be viewed as a measure of redundancy, isolation, lack of diversity, inequality, segregation, non-randomness and compressibility [19]. However, it does not directly compare across populations with different sizes or group structures as desired in the YRED and is mathematically complex. The Atkinson index is another measure of inequality commonly used in welfare-based income inequality measurement [20]. It measures the percentage of income that a given society will have to forego to have a more equal distribution of income among citizens [19]. Atkinson’s measure relies on the degree of social dislike to inequality where a higher value requires greater social utility or willingness by individuals to accept smaller incomes to reach a more equal share for all [20]. It can be decomposed into within and between-group inequality, can provide welfare implications for alternative policies and allow the user to include some normative content to the analysis [20]. However, the Atkinson index requires exhaustive data use and does not present a standard for a reasonable level of inequality such as is needed in inequality measurement in the YRED [19]. The Hoover Index, also known as Robin Hood Index, Schutz index or Pietra ratio is a measure of inequality that shows the proportion of all income, which would have to be redistributed to achieve a state of perfect equality [17,18,19]. In other words, the index estimates the amount of total income that has to be redistributed from households above the mean to those below the mean to achieve equality in income allocation [17]. It measures only absolute values and cannot cover a wide range of populations of different sizes. The Gini coefficient is a common parameter used in measuring inequality of income [21]. It was developed by the Italian statistician Corrado Gini and is a reliable measure of income inequality. It has also lately been used in CO2 emissions measurement and water use inequality calculation [22,23]. It is normally calculated from a randomly sequenced sized data as the relative mean difference. In other words, the mean difference between every possible pair of individuals divided by the mean size gives the Gini coefficient. The Gini coefficient is the preferred choice of tool for inequality measurement in this study over other methods because it presents its calculation by ratio analysis rather than variable representation [24]. Furthermore, it can easily be interpreted and used to compare variables across a wider geographic range, such as the YRED. It also satisfies the principle of anonymity, scale independence, as well as population independence. Finally, it can be decomposed into different components, based on which the main contributions and drivers of inequality can be identified. Like the other methods, the Gini coefficient, however, is a relative measure that fails to capture absolute measurements, but knowledge of the absolute scale of inequality is sufficient for formulating cutting-edge water use policies in the YRED.
Many studies have used the Gini coefficient in inequality calculation. Cullis and Van Koppen [25] used the Gini coefficient to measure inequality in water use in the Oliphant’s River catchment area of South Africa in a double-versioned Gini calculation, using water use registration data, water use estimates and water use census. In the first step of inequality assessment, they measured the distribution of the allocation of direct water use in rural areas. In the second stage, they calculated the distribution of indirect benefits of water use in the form of direct employment. They further assessed the impacts of different policy scenarios using the Gini. They then concluded that to reduce the Gini will require doubling the amount of water allocated to rural households, which would enable each household to meet its basic water needs of 50 liters per person per day and irrigate 1000 square meters (m2). Megan et al. [26] used the Gini coefficient to calculate spatial inequality in water access in South Africa. In their study, the Gini indicated relative inequality (0.36), which was driven by social factors, such as access to income and water. Yang et al. [27] used the Gini coefficient to calculate inequality in access to safe drinking water by using survey data to estimate household socio-economic status indices in seven countries. Their results indicate that Ethiopia, Nigeria and Nicaragua suffer significant amounts of inequality largely driven by the income of water users. Wang et al. [28] used the Gini coefficient to calculate inequality in water use in the Yellow River of China by developing a dual domestic water use structure model. Their study shows a decreasing trend in the Gini coefficient of domestic water use in the Yellow River basin, indicating that domestic water use is becoming more equitable in the basin. In conclusion, they proved that the Gini coefficient can be used in effective water management. Studies by Malakar and Patwardhan [29] using the Gini coefficient and Theil index to evaluate inequality in water supply in India indicate that there exists a disparity in water supply among different cities and households, which could be a result of infrastructural limits, access to natural water or poor policy formulation. Morales-Novelo et al. [30] used the Gini coefficient and Lorenz curve to estimate inequality in water use in Mexico City by measuring water consumption among households. Their results show that drinking water presents a regressive distribution and favors high-income earning households, while in smaller degrees, benefit the poorest households in the city. In summary, though Gini captures only relative measurements, it is still a good indicator for measuring inequality in water use. Water distribution, water use efficiency, education level, industrial structure, government influence, income and level of technology are the main drivers of inequality.
Although studies described in the previous paragraphs demonstrated extensive use of the Gini coefficient in inequality measurement, none has investigated the spatial autocorrelation of inequality using the Moran’s index. Many studies merely calculate inequality and measure its drivers, but do not delve deeper into showing the spatial autocorrelation of inequality and study its spatial layout in cities to understand the more specific nature of city and sub-city autocorrelation of inequality. More work needs to be done investigating the autocorrelation of inequality and categorize it into levels according to spatial clustering of water consumption. How inequality spatially exists in cities needs to be known so that management will know specific areas to target in mitigating inequality. With the help of the Global Moran index, this study investigates the spatial spread of water use inequality by studying water consumption data, which will give an indication of high or low spots water consumption and inform whether inequality has agglomerated at some parts of cities, or is uniformly spread within the city. The Global Moran’s index is a spatial autocorrelation tool that measures spatial autocorrelation based on both feature locations and feature values at the same time [31]. In simple language, it measures how clustered or dispersed objects are to each other [31]. In this study, the Moran’s index will determine how close or scattered inequality of water use exists in various cities. Drivers of inequality including water use efficiency, industrial structure and government influence are largely not measured in previous studies to compare with inequality. This study measured water use efficiency because it has the biggest effect as a driver of water use inequality in the YRED [32]. As we measure the spatial distribution of inequality using the Global Moran’s Index, we combined it with the quantitative pattern of inequality measured using the Gini coefficient to categorize cities into types regarding the spatial distribution of inequality in the various cities to formulate more specific and effective mitigation policies.
The YRED is the socio-economic powerhouse of China. Its contribution to China’s GDP is about 45% of the country’s total. The region produces significant amounts of goods that are essential to various industries especially the food and energy sector. However, this quest for regional development and contribution to national production has led to an unprecedented use of water resources [32]. YRED currently uses 47% (323 billion m3) of China’s total national water and discharges 43% (323 billion m3) of the total national wastewater. Over the past five years, the YRED’s water consumption has been increasing at a compound annual growth (CAGR) of 1.03% faster than the national CAGR (0.9%), while water use efficiency has only improved slightly [10]. Furthermore, industrial water use per unit of industrial value-added in the YRED, in 2017, was 24.9% higher than the national average [32]. If agricultural water use in the YRED is added to industrial water use, the overall water use per unit of GDP falls to 4.6% lower than the national average, but this value is still lower when compared to developed countries like Canada and the USA. The stretch of the industry in water use has amplified water use inequality in the YRED to an uneasy level leading to water-stress. To achieve the aim of attaining equal use of water resources will require an integrated approach necessitating unity to invoke the interplay of political, social, economic and administrative systems in a collective and collaborative working machine that can ensure equitable delivery and efficient use of water in cities and homes. Equality can be achieved at domestic homes, as well as agricultural and industrial sectors by improving water distribution and efficiency use in crop production and industrial manufacture. Figure A1 in the appendix shows sectoral water consumption in the YRED.
The YRED at present requires more water resources management research to unearth the water use challenges faced as a result of massive water consumption. At present, only a few studies have discussed the economics of water use in the YRED and none has quantified the inequality of water use. Feng et al. [11] looked at water use and allocation, pollution control and economic development in the YRED. In their study, significant discussions and recommendations were made about water distribution and use, but nothing about the inequality of water use was discussed. Feifei and Juan [33] estimated the scale and structure of water trade patterns and the topological characteristics of the water transfer network in the YRED. Their study revealed cities, such as Shanghai, Jiangsu, Zhejiang, Anhui and Jiangxi as being predominant in the water transfer network, while Hubei, Jiangxi, Hunan and Anhui act as important bridges of water transfer. Feng et al. [32] also studied the economics of water use, transfer and allocation in the YRED—and how these can influence businesses within the zone, but inequality in water use is presently not studied.
This paper sets to investigate inequality in water use in the YRED using the Gini coefficient and Lorenz curve as well as the Global Moran’s Index. Secondly, water use efficiency will be calculated to measure its magnitude as a driver of inequality in the YRED. Furthermore, cities will be categorized into types concerning the level of clustering or the spread of inequality within. Understanding the dimensions of inequality will be useful in studying water use challenges and helpful in forming policies to relieve the challenge of intercity and interprovincial water use imbalance in the YRED. Water distribution and use parameters have a wide range of connectivity to the development and marketing of other goods and services and the application of such concepts will be useful in improving sustainable regional and national development. The specific objectives of the study are:
  • to calculate inequality in water use;
  • to calculate the water use efficiency of cities in the YRED;
  • to categorize cities into types concerning the spatial spread of inequality.

2. Materials and Methods
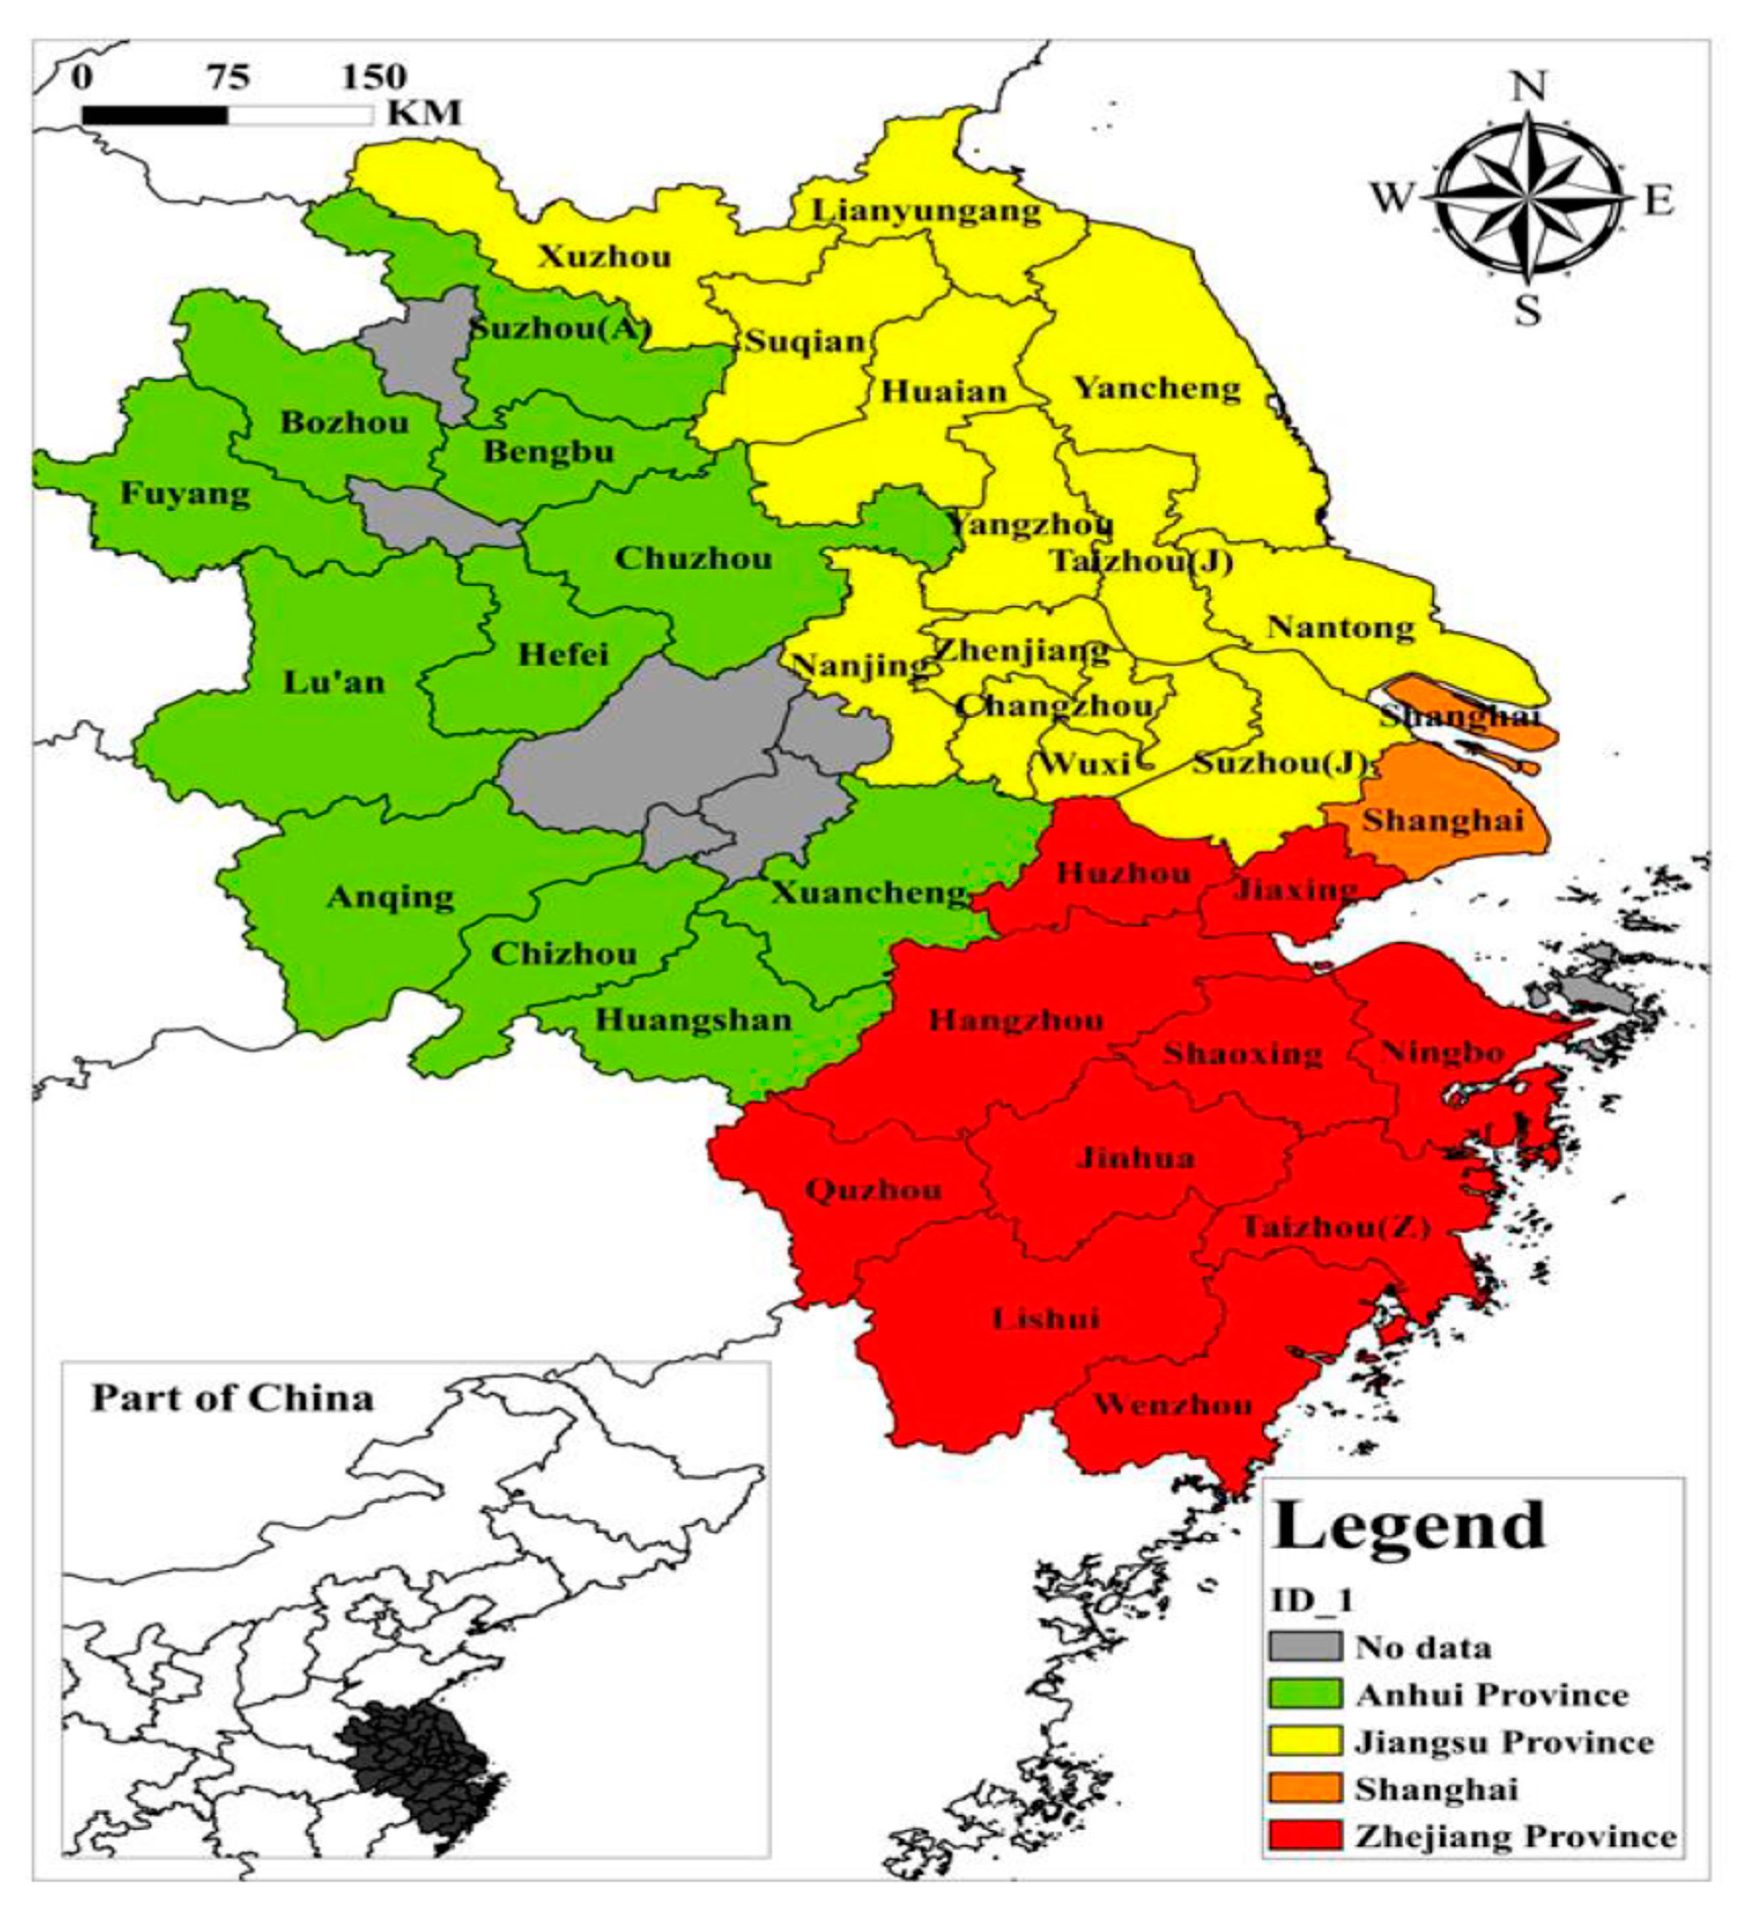
The YRED is the study area that covers approximately 2.05 million km2. A map of the YRED is shown in Figure 1. The region has 46% of China’s total water resources and is a strategic water source as well as an important base for clean energy generation. The Yangtze River is one of the largest and longest Rivers in Asia. It originates in the Tibet–Qinghai Plateau (Headwater Reach), passes through the mountainous provinces of Sichuan, Yunan and Chongqing (Upper Reach), flows into the central plain (Middle Reach), into the Lower Plain (Lower Reach) and finally empties into the East China sea in Shanghai (Estuary). The YRED over the years has developed to be one of the most economically supportive regions of China. It covers 11 provincial-level administrative regions including Yunnan, Guizhou, Sichuan, Shanghai, Jiangsu, Zhejiang, Anhui, Jiangxi, Hubei, Hunan and Chongqing from East to West and the YRED urban agglomeration in the middle reaches of the Yangtze River, as well as the Chengdu–Chongqing urban agglomeration. The eastern part of the belt includes Shanghai, Jiangsu and Zhejiang. This constitutes the core component of the YRED and is the most economically developed part of the delta. The central region includes Hubei, Hunan, Jiangxi and Anhui. This part has abundant natural resources and is convenient for transportation. It also doubles as a hub for grain production and big potential for industrial development. The western region includes Chongqing, Sichuan, Yunnan and Guizhou. There are huge hydropower, mineral and wildlife reserves in this region. Despite the unmatched potential for economic expansion, significant environmental challenges are facing the sustainable existence of resources and the economic growth of the YRED. At the beginning of 2014, the state council of China developed and implemented a national policy to oversee the sustainable development of the YRED. Various governmental agencies and departments have been tasked to work on ambitious projects targeting transportation by water, air and land, and urban development sectors to be improved by 2020 and 2030. Nevertheless, environmental and ecological deterioration, as well as water stress still impact the YRED, particularly water distribution imbalance [11,23]. Table 1 shows cities in the YRED arranged according to the province they belong.

2.1. Source of Data

In China, data on water resources use and distribution are normally retrieved from Statistical Yearbooks of Water Resources Bulletins. However, data from Statistical Yearbooks are normally on the city level, while not targeting sub-cities and villages. Singh and Kumah [34] indicated that the choice of input data depends on the output of interest. In this study, to formulate more targeted and localized policies, sub-city level data are required. We collected data close to the year of study to minimize uncertainties. As a result, the data in this study are 2015 data obtained from the Water Resources Planning and Management Department in the local government of cities in the YRED. To further eliminate uncertainties, after we collected the data, we compared them to that of the same cities obtained from the China National Water Resources Bulletin. When a City’s data varied, we tracked back to collect data from previous years and standardized them to eliminate errors [34]. The types of water consumption data collected included agricultural water, industrial water, domestic water and ecological water. Agricultural water includes irrigation water, water use in aquaculture, as well as in livestock and poultry rearing. Industrial water includes both fire and non-fire nuclear power generation. Domestic water comprises urban domestic and rural domestic, which together makes-up residential water, water in the construction industry, as well as tertiary water. Ecological environmental water strictly refers to urban water. Gross Domestic Product (GDP) and city population data were also used in the calculation.

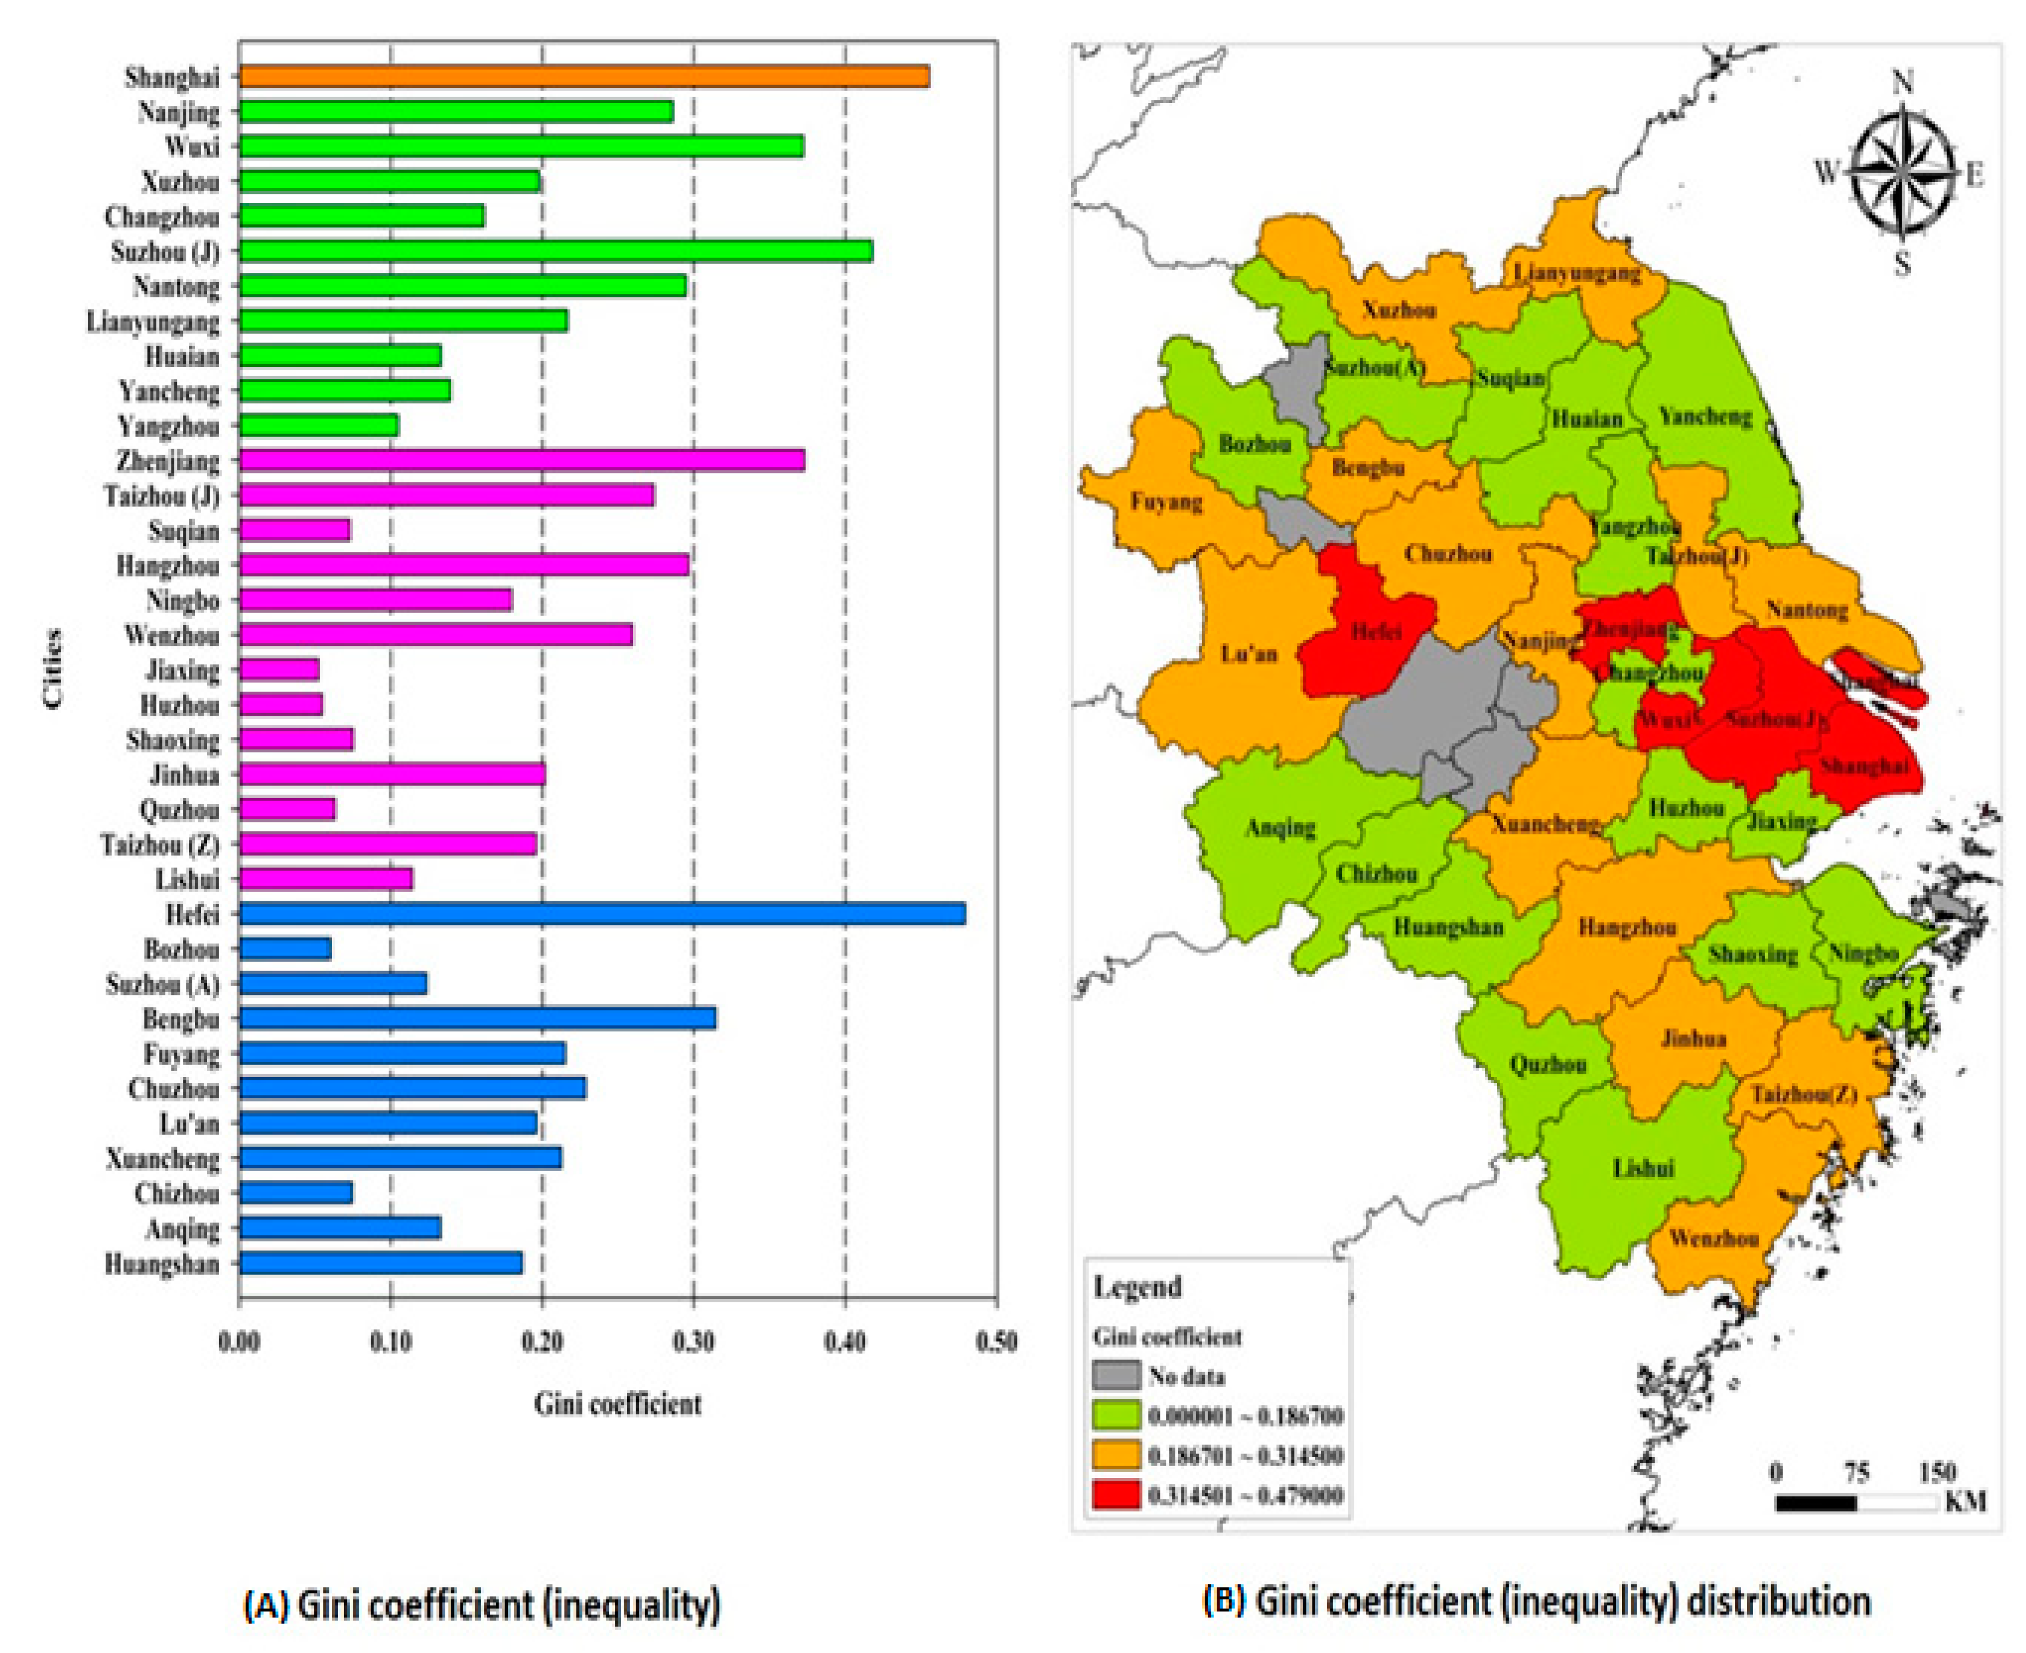
2.2. Measuring Inequality with the Gini Coefficient

In this study, inequality in water use is defined as any occurrence of the unequal allocation of water resources, either through state regulation, natural existence of water resources, or any other attribute that is artificially created, or if in natural existence, is purposely allowed to engender patterns of social stratification of people regarding water use. Inequality was measured with the Gini coefficient, which is a popular indicator for measuring the distribution of resources. It is famous for measuring income and land inequality but has recently been applied to measure water use inequality and CO2 emissions [22,23,24]. The general Gini equation is often given as follows:
G i n i = 1 μ N ( N 1 ) i > j   j   | y i y j |  
Where Gini is the Gini index, μ is the mean of the variables (city’s water consumption); N is the total number of observations; yi and yj are water consumption values. In numerical value, the maximum Gini Coefficient is ‘1’ while the minimum is ‘0’. Literally, the closer the Gini coefficient is to ‘0’, the more equal the resources distribution, while when approaching ‘1’, the higher the inequality in resource distribution. A Gini Coefficient of ‘1’ indicates absolute inequality in resource allocation. Usually, when the Gini coefficient is below 0.2 means “high equality”, 0.2–0.3 means “relative equality”, 0.3–0.4 means “neutral”, 0.4–0.5 means “relative inequality” and above 0.5 means “high inequality”. The Lorenz curve is often used with the Gini coefficient to perfectly determine the level of inequality in resource allocation. As explained earlier, the mathematical definition of the Gini coefficient is the ratio of the areas on the Lorenz curve. Assuming the area enclosed by the diagonal and the two axes is SA + B. If the range of the coordinate’s axis is 0–1, then the area of SA + B is 0.5 The Gini coefficient can be defined as (SA + B − SB)/SA + B. In this study we assumed that the function of the Lorenz curve is LC = αPβ. Then by regression analysis using water consumption data, we acquired the value for α and β for each city. Suppose the values of α is x and β, y, the area SB can be calculated by the formula:
S B = 0 1   x p y d P = x y + 1  
Gini coefficient can then be expressed as:
S A + B S B S A + B = 1 2 x y + 1  
Where x is the water consumption values and y is the city level population. With Equation (2), we fitted the Lorenz curve for individual 35 cities by regression analysis using Python 3.6 coded on the ArcGIS platform (Appendix A), to calculate the Gini coefficient. In fitting the Lorenz curve, water consumption data on the y-axis is plotted against the city population size on the x-axis (provided in supplementary material). Therefore, the points on the curve indicate city level water consumption. The area between the line of equality and the Lorenz curve is estimated. The ratio of the area enclosed by the equality line and the Lorenz curve divided by the area under the equality line gives the Gini coefficient.

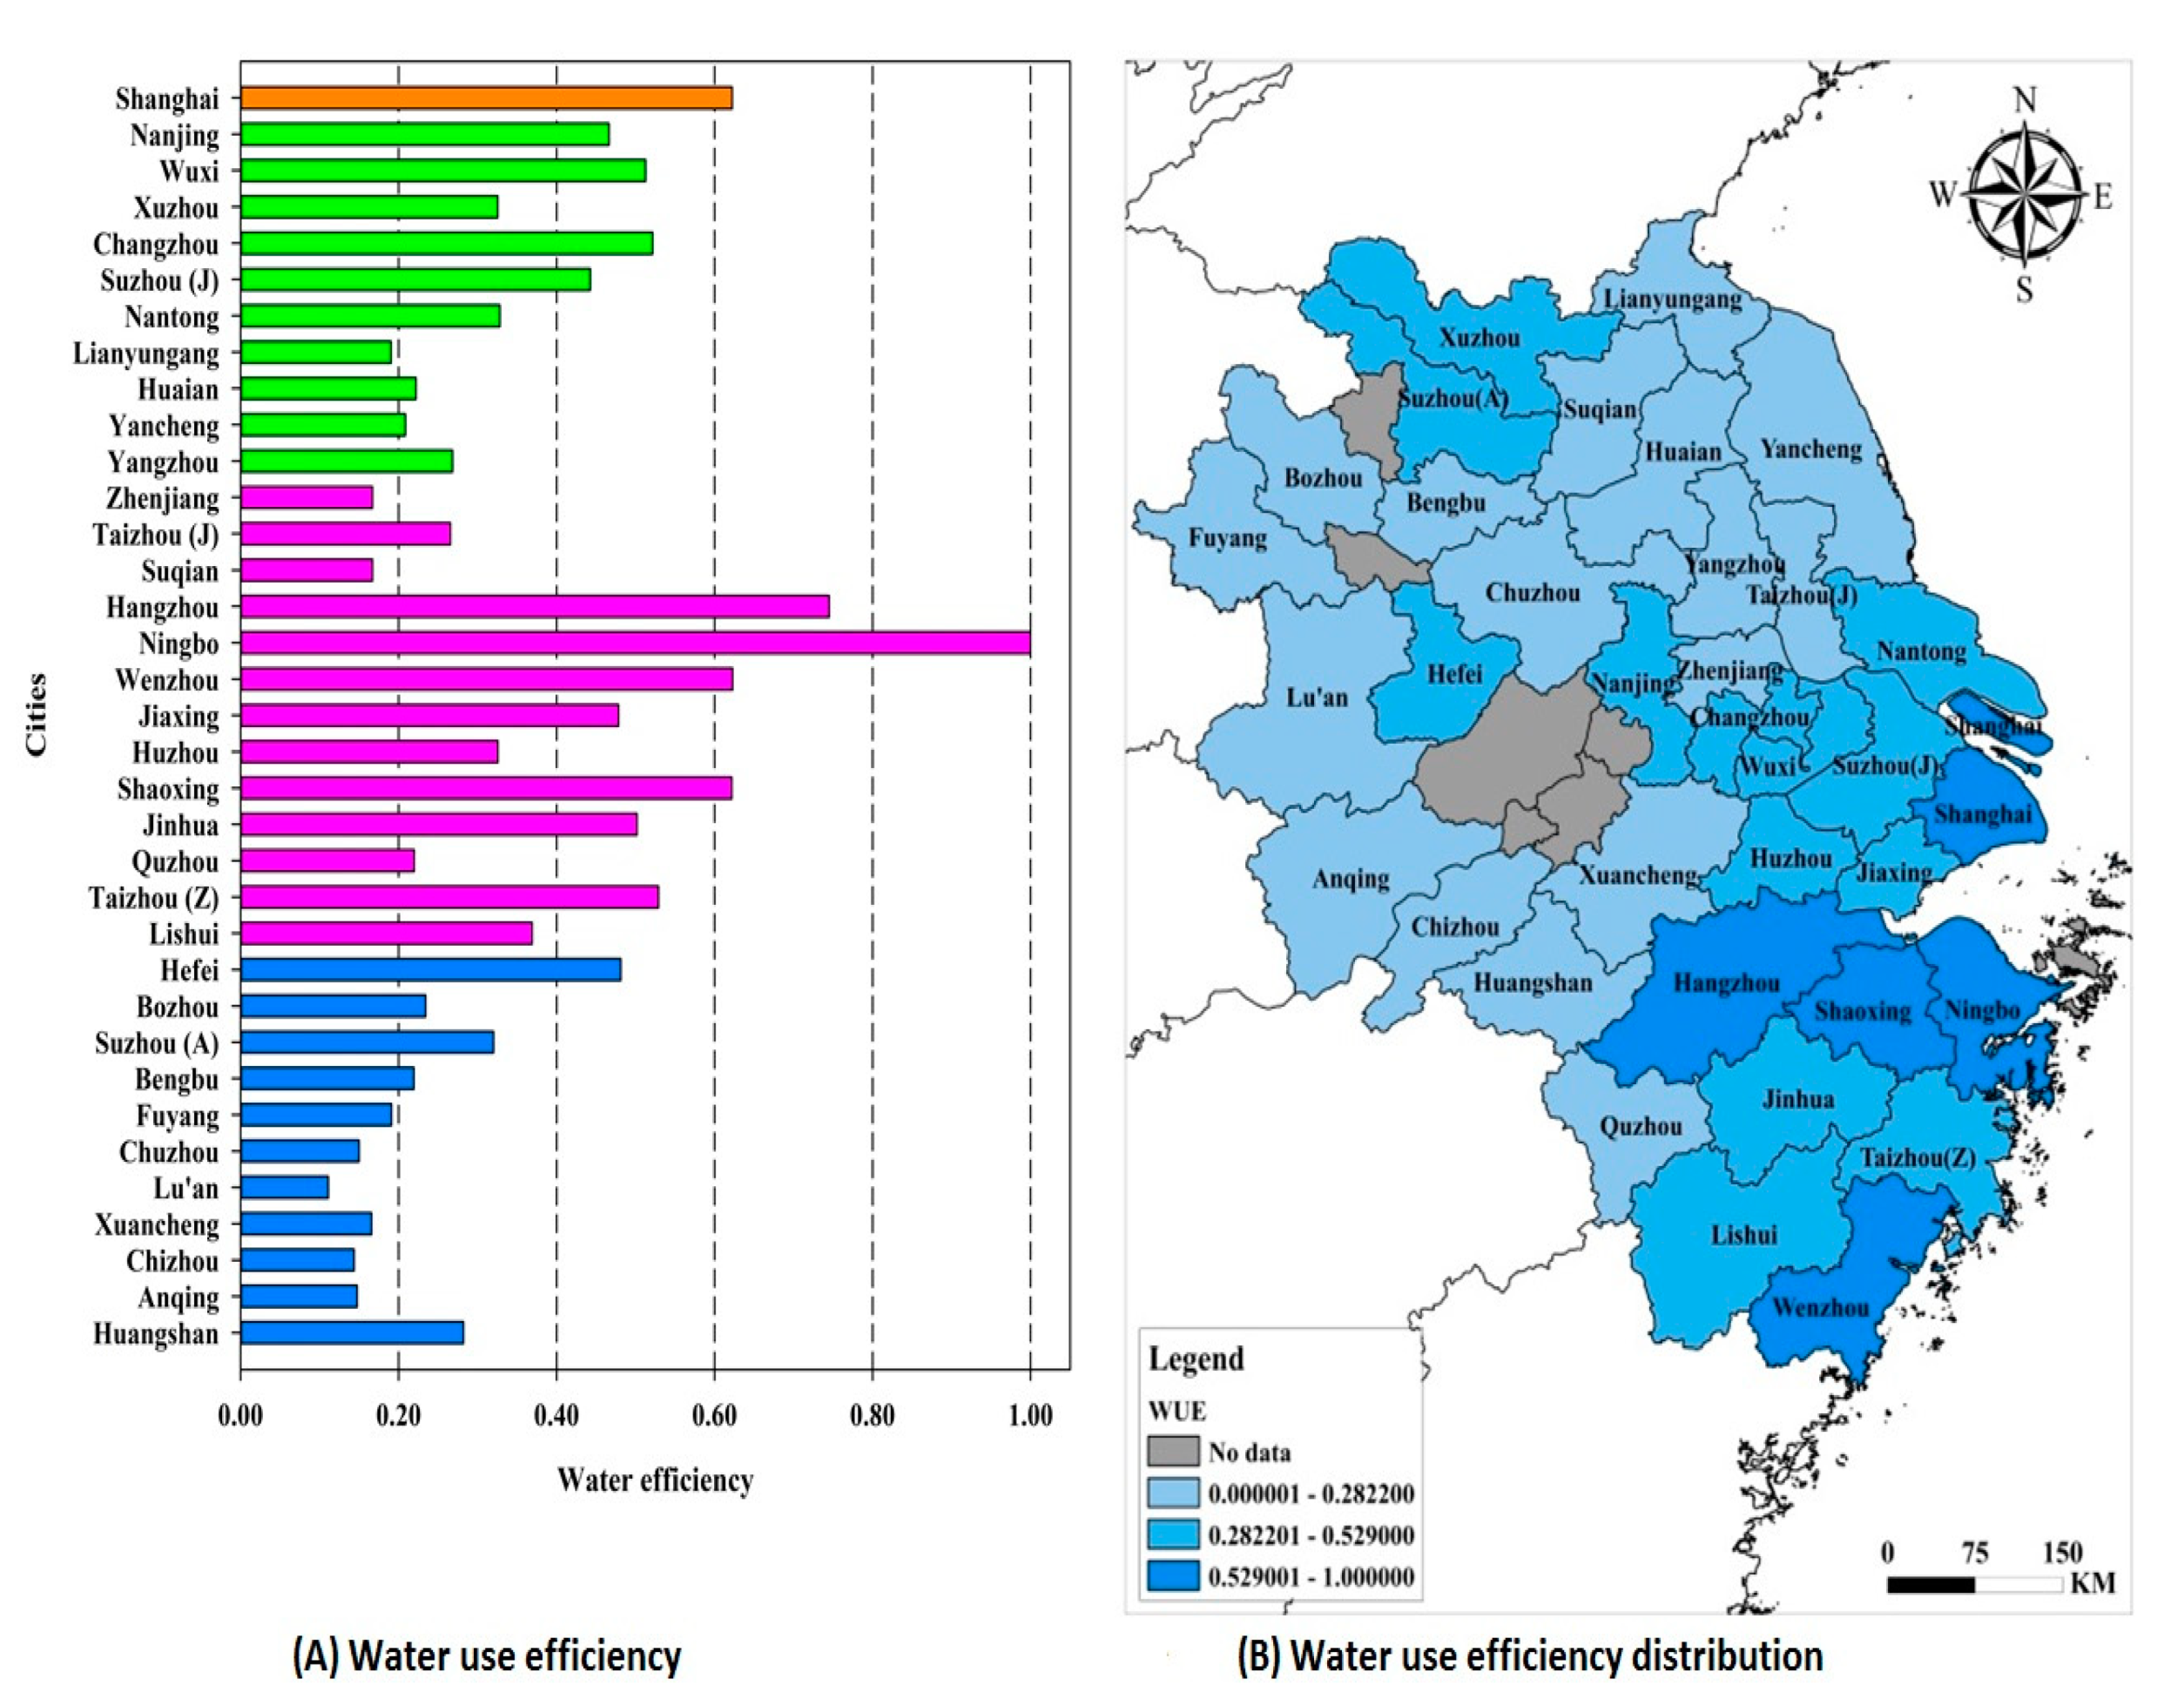
2.3. Water Efficiency Calculation

Water use efficiency simply means using the best minimal amount of water to accomplish a function, task, or result. It means doing more with less water. Water use efficiency in this study is defined as water consumption per 100 million yuan (CNY) GDP. The water use efficiency was calculated in excel using the following formula:
Water efficiency i = GDP i (100 million yuan)/total water consumption (ten thousand m3)
Standardization:
Water efficiency = Water efficiency i/ Water efficiency Max.
Calculation of water use efficiency is provided online as supplementary material named ‘water consumption and GDP data 2015’.

2.4. The Global Moran’s Index

Moran’s index is a measure of spatial autocorrelation [31]. In this study, it was used to estimate the spatial autocorrelation of water consumption. It is mathematically defined as:
I = N i = 1 N   j = 1 N w i j × i = 1 N   j = 1 N   w i j × ( x j x ¯ ) × ( x i x ¯ ) i = 1 N   ( x i x ¯ ) 2  
Where i or j denotes any of the regions; N denotes the total number of regions; x ¯ denotes the average value of an attribute x i ; w i , j denotes the spatial weight between region i and region j ; w i , j is 1 if the two regions are neighbors otherwise w i , j is 0. Global Moran’s index is denoted by I ; Z I denotes the score of the Global Moran’s Index. Under Z-Score standardization and the weight structure showed above, the Moran’s index can be further simplified as:
I = 1 n 1 i = 1 n w z i × z i  
The Global Moran’s Index generally ranges in value between −1 and 1. When the Moran’s index is greater than 0, it means the elements are spatially related positively. The further away from 0, the stronger the clustering. On the other hand, if Moran’s index is lower than 0, it signifies a negative spatial relationship among all the elements and the further away below zero, the greater the internal diversity in the distribution of the elements. The index was calculated by spatial autocorrelation analysis of water consumption data in the ArcGIS 10.2 toolbox. By another definition, Moran’s I is simply the slope of the regression line between z and wz [31]. When the Moran’s I is close to −1, then the units with bigger and smaller magnitude tend to be close to each other.

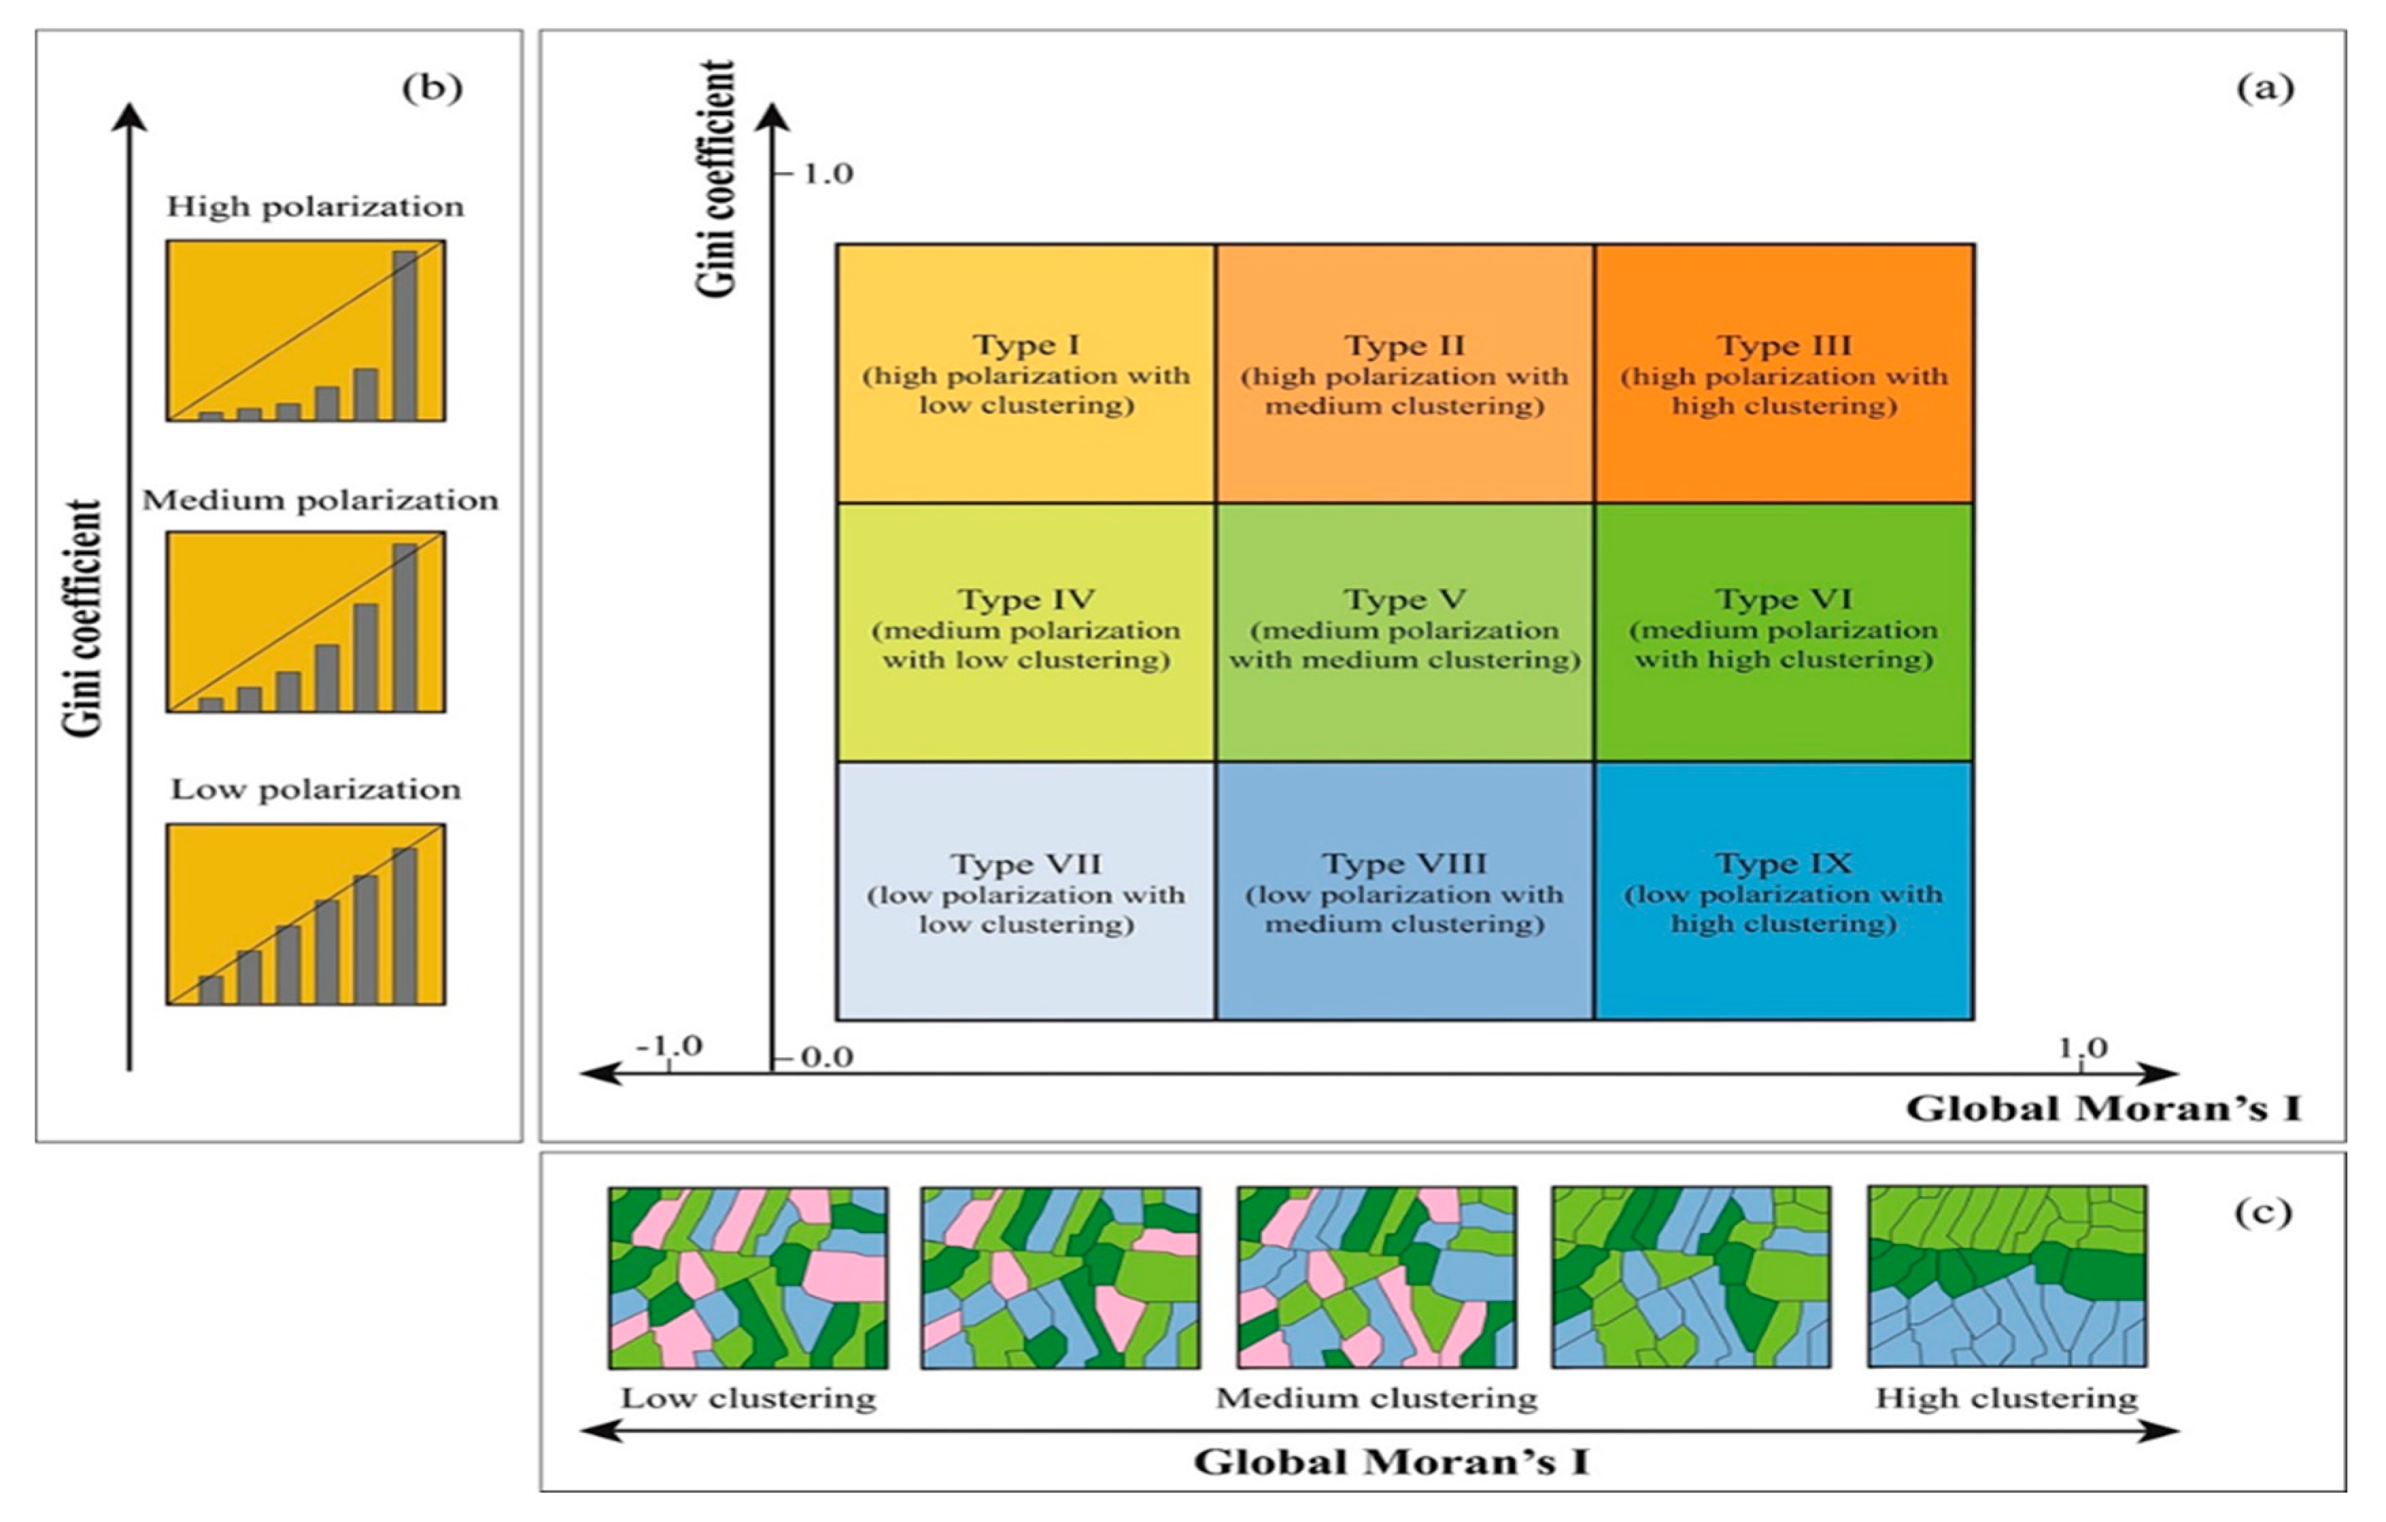
2.5. Method of Classification

This study used the Jenks [35,36] optimization method also known as the Jenks natural breaks classification to classify cities into types using the Gini and Moran values. The Jenks classification is a data clustering method designed to determine the best arrangement of values into different classes. This is achieved by minimizing each class’s average deviation from the class meanwhile maximizing each class’s deviation from the means of the other groups. In other words, the method seeks to reduce the variance within classes and maximize the variance between classes. We used an iterative process by repeating calculations using breaks in the data set to determine which set of breaks has the smallest in-class variance. After dividing the data into a 3 × 3 group, we calculated the sum of squared deviations from the class means (SDCM). We also calculated the sum of squared deviations from the array mean (SDAM). After inspecting each SDCM, we then moved one unit from a class with a larger SDCM to an adjacent class with a lower SDCM. New class deviations were then calculated and the process repeated until the sum of the within-class deviations reached a minimal level. Finally, the goodness of variance fit (GVF) was calculated. GVF is defined as (SDAM-SDCM) / SDAM. GVF ranges from 0 (worst fit) to 1 (perfect fit). The map is then drawn, which closely resembles a chessboard (Figure 2).

3. Results and Discussion

3.1. Water Use Efficiency

Water use efficiency was rated on a scale 0–1 (Figure 3A). One (1) denotes perfect efficient use of water while zero (0) denotes the worst use efficiency. The results of water use efficiency (Figure 3A) show that Ningbo is the best efficient water user among the 35 cities. Hangzhou scored the second-highest, 0.75. Wenzhou, Shaoxing and Shanghai scored 0.62. The distribution of water use efficiency is shown in Figure 3B. Apart from Shanghai, the remaining cities including Ningbo, Wenzhou and Shaoxing appear at the eastern corner. Historically, Ningbo has a traditional water management system that has survived hundreds of years. The existence of Ta Shan Weir and other historic water infrastructure at Ningbo is the reason for effective water management in both households and departments [37]. Ta Shan Weir is Ningbo’s ancient water management structure that has been modernized and adopted into current water supply systems. At the present level, the Ningbo Water Supply Company has improved water production, distribution and use with modern techniques and management systems that have effectively improved water use efficiency. Shanghai is reported in other studies to have high water use efficiency because of its modern water management structures both in production and use [38]. With water-efficient showers, water closets and sensors on taps, modern cities like Ningbo, Shanghai, Hangzhou, Wenzhou and Shaoxing have improved their water use efficiency.
The water use efficiency of Lu’an and Chizhou are the lowest, 0.11 and 0.19, respectively (Figure 3A). Both Lu’an and Chizhou are agricultural cities that practice open flood irrigation over drip or sprinkler irrigation. Flood irrigation system requires the use of high volumes of water thus bringing down the water use efficiency of both cities [38,39]. The abundance of water resources in both cities affects individual efforts at water conservation [40]. It must be stressed that in the case of Lu’an and Chizhou residents certainly wasted water because of abundance. Moreover, the absence of up-to-date water-saving technological equipment in most homes at Lu’an and Chizhou resulted in poor water use efficiency [41]. The water use efficiency distribution within the YRED shows an agglomeration of cities that recorded high water use efficiency. As shown in Figure 3B, Shaoxing, Ningbo, Hangzhou, Wenzhou and Shanghai are located at the South East. Cities with the second highest water use efficiency are distributed evenly within the selected zone and the same can be said about cities with the lowest water use efficiency.

3.2. Inequality in Water Use

The results of inequality show that Hefei, Shanghai and Suzhou showed relative inequality (0.4–0.5) (Figure 4A). Relative inequality means there is a significant level of inequality that engenders patterns of social stratification of people regarding water use. The majority (twenty) of the cities show high equality (below 0.2). Nine (9) cities show relative equality. Wuxi, Bengbu and Zhejiang are neutral (0.3–0.4). No city showed high inequality (0.5 or above). The distribution of inequality in the zone is shown in Figure 4B. Using the Gini coefficient to explain inequality with Shanghai as a case study, it simply means that 55% (Gini 0.45) of domestic water users in Shanghai only get about 178 liters of water per person a day, which is the per capita average water consumption in China in 2015, while the remaining 45% use all the remaining water. The high inequality in Shanghai, Hefei, Suzhou, Zhenjiang and Wuxi can be attributed to a build-up of intensive water consumers in industrialized hubs of these cities. This suggests that inequality in these cities is caused by the consumption of a few users. Thus for mitigation, we have to target a few places (using the Moran’s index) but not the whole city.
According to previous studies, the main drivers of inequality include water use efficiency, real water use, economic level, natural water availability and the spatial distribution of natural water endowment [5]. This study measured only water use efficiency because it is the single largest contributor to inequality in the YRED [11]. Literature from previous studies [11,32,33] was used to explain the other drivers. To put drivers of inequality into perspective, Hefei, Shanghai, Suzhou and Wuxi are highly industrialized cities with high economic levels. More affluent cities generally have bigger industrial and tertiary water footprints and high water consumption values (Appendix B). The presence of industries presents a great rigidity in water demand that cannot be denied. A higher standard of living in more affluent cities must be supported by the consumption of industrial and tertiary products; hence, the industries must consume a lot of water to produce goods. Poor water use efficiency in the agricultural sector affects equality. In this study, water use efficiency in the agricultural sector affected the Gini coefficient, because water wasted due to poor irrigation systems raised the Gini coefficient in some cities.
Furthermore, comparing the results of other studies [37,41,42,43,44,45] suggests that the transfer of virtual water at both inter-province and inter-city levels of the study area can affect inequality to a large extend. In other words, inequality could have been wider. Virtual water is the value derived in water use by consuming a product whose manufacture involved the use of water. The volume of virtual water consumed is equal to the amount of water used in producing the product. Virtual water was estimated by comparing total value goods transferred from the industrialized cities to the consumers and vice versa. Existing studies have stressed that water-deficient regions are always driven by the consumption from water abundant regions leading to a more unsustainable direction of water flow [41]. Studies by Feifei and Juan [33] suggested that large scale economic and property manufacturing industries, in cities such as Shanghai, Zhejiang and Hefei, led to high values of production-based and consumption-based virtual water volume. Shanghai and Zhejiang are net water importers. The main reason for the relatively large consumption-based virtual water volume of Shanghai is as a result of their larger GDP, more developed status and dense population. On the other hand, it is reported that cities such as Siquan are large net virtual water exporters [33]. The net effect of virtual water transfer is that it covers the real nature of water use inequality, minimizing the actual level of the inequality in virtual water transfers [42,45,46,47,48,49]. Figure 4B shows the distribution of inequality within the selected zone.

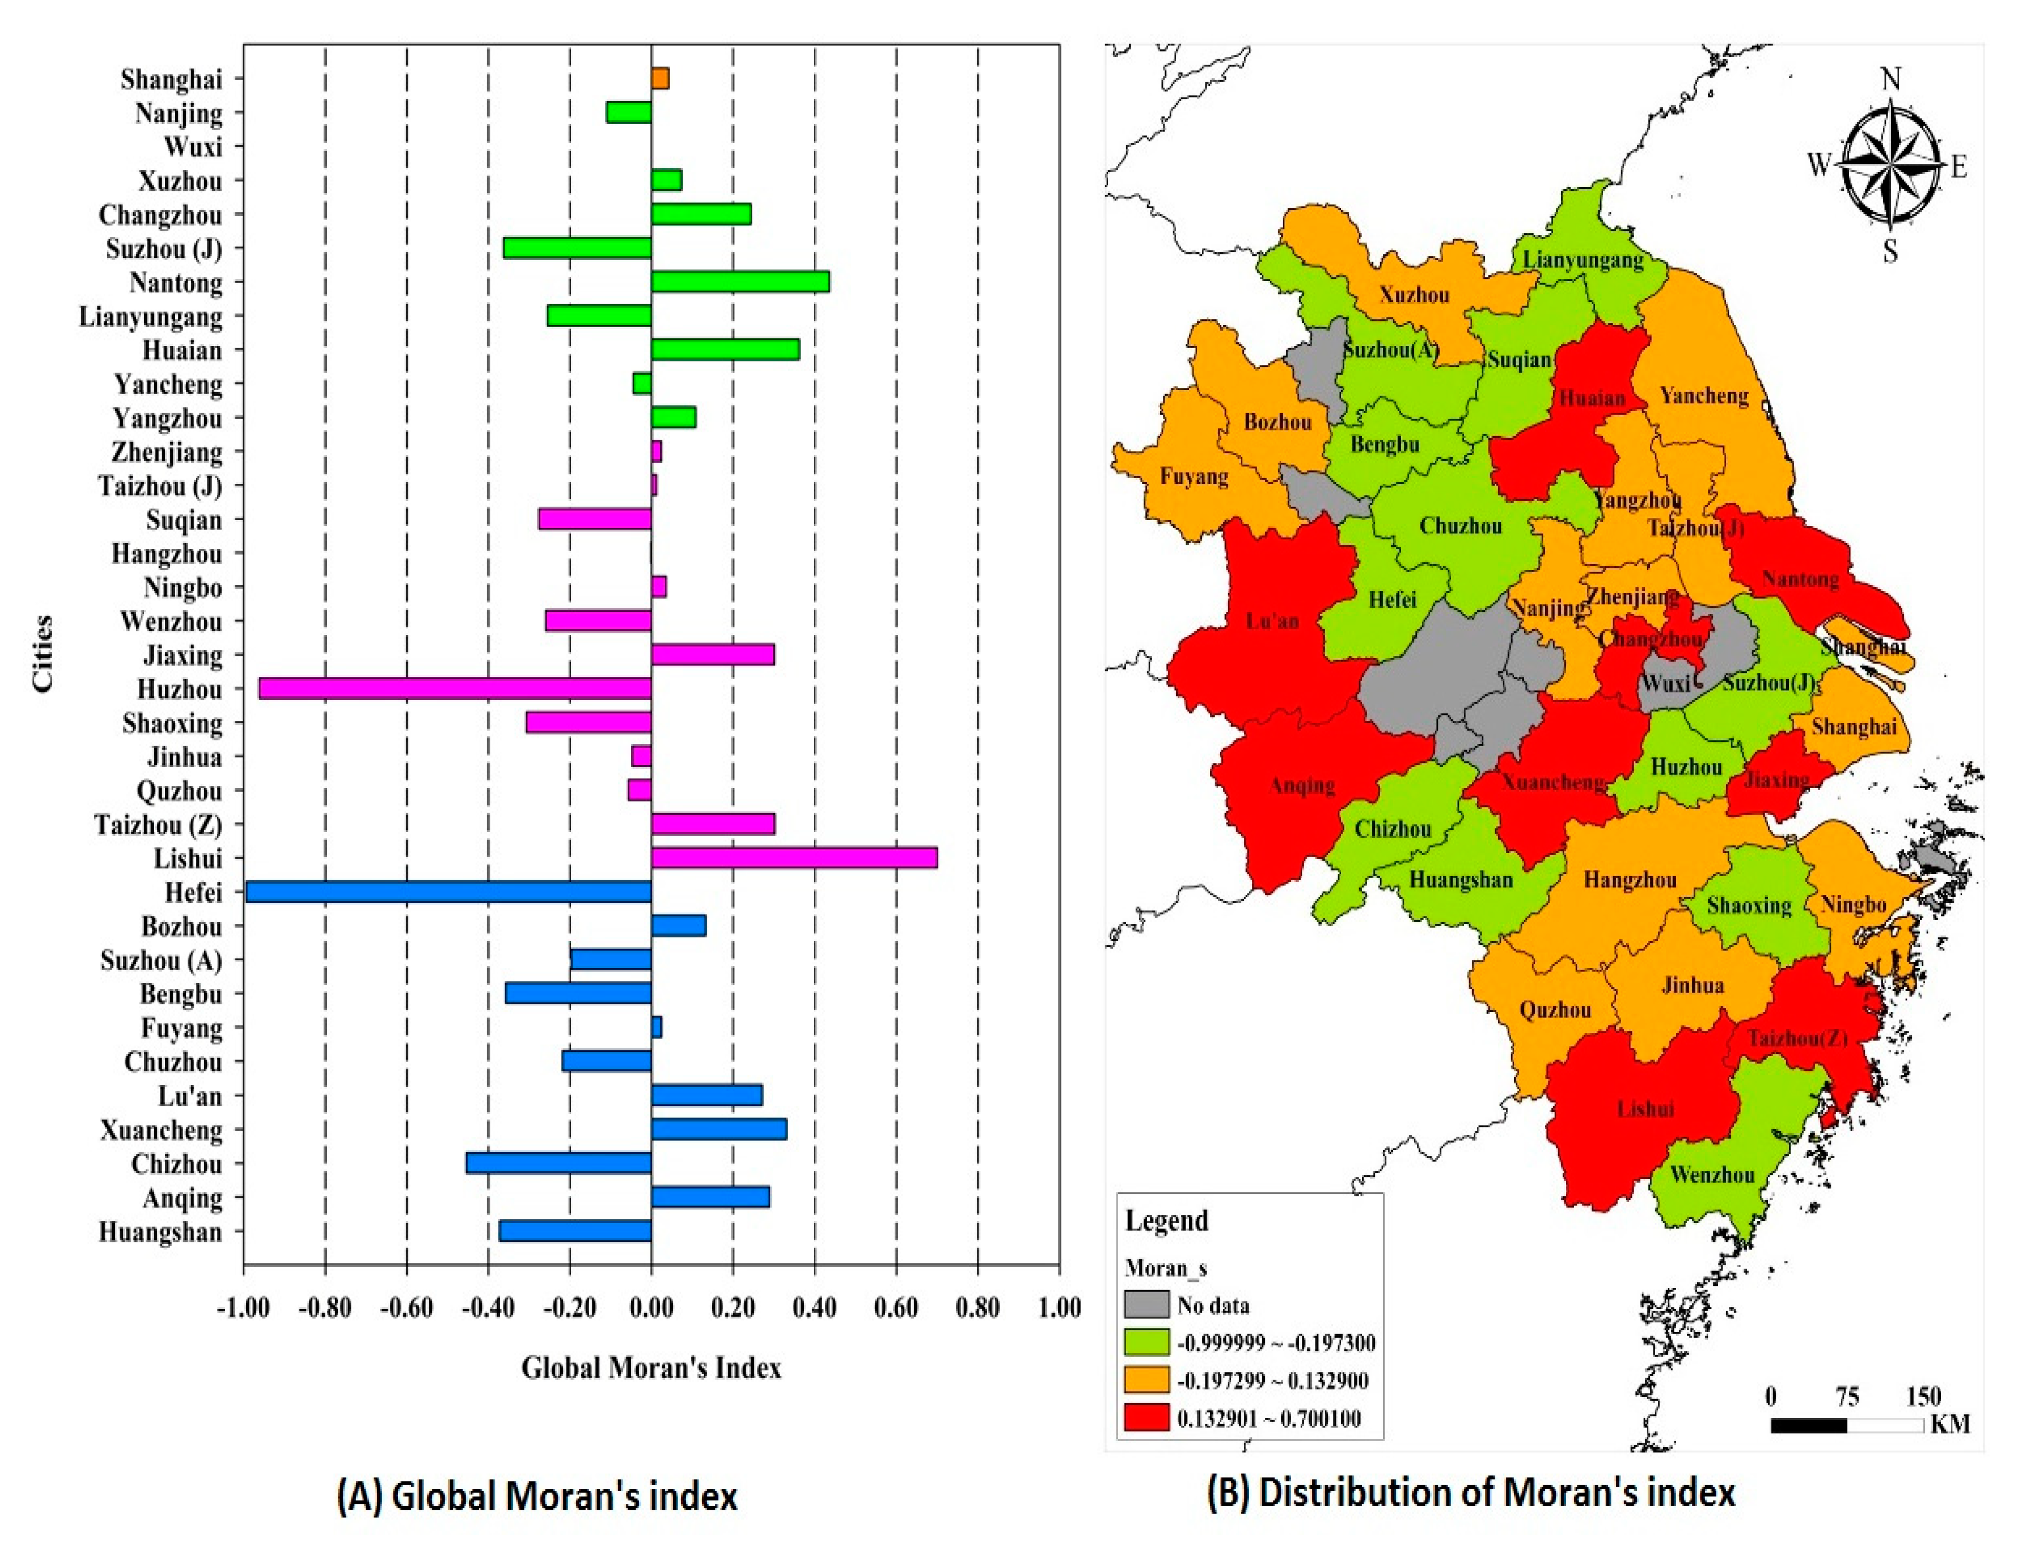
3.3. Global Moran’s Index

Results of the global Moran’s index suggest that seventeen (17) cities have a positive Moran’s index (Figure 5A), Lishui being the most clustered city type. This means that inequality of water use in these cities is clustered at a few places; therefore, policies must target these few places. Sixteen (16) cities have a negative Moran’s index meaning that inequality is spread across the cities. In other words, these cities though with similar water consumption patterns have the inequality scattered across the city, therefore policies should target many locations.
Figure 5B shows the distribution of the Global Moran’s index. It can be seen that regions with high Moran’s index are evenly scattered within the zone. The figure is like that of a sandwich. High Moran index figures are sandwiched between medium and low (and vice versa). Cities with medium global Moran’s index are spread within the study zone with a few such as Yancheng, Yangzhou, Taizhou, Zhenjiang and Nanjing clustered at the north/south tip, while others such as Quzhou, Jinhua and Hanzhou appear down south. The remaining such as Bozhou and Fuyang also spread out at the North-West and the same can be said of cities having low Moran’s index. Lianyungang, Suqian, Hefei, Chuzhou, Bengbu, Suzhou appear up in the northern and central zones while Chizhou, Huanshang, Wenzhou, Shaoxing are down the south. Spatial characteristics played an important role in interpreting the water use inequality relationships and were useful in generating water resources management strategies. Though the auto-correlation is significant, the clustering of water use could also be a result of other factors including geography, historical development and land use policies (i.e., zoning). However, a close cross-examination of city social structure and other studies [10,32,33,47,48,49] indicates that water use is the more pronounced reason.

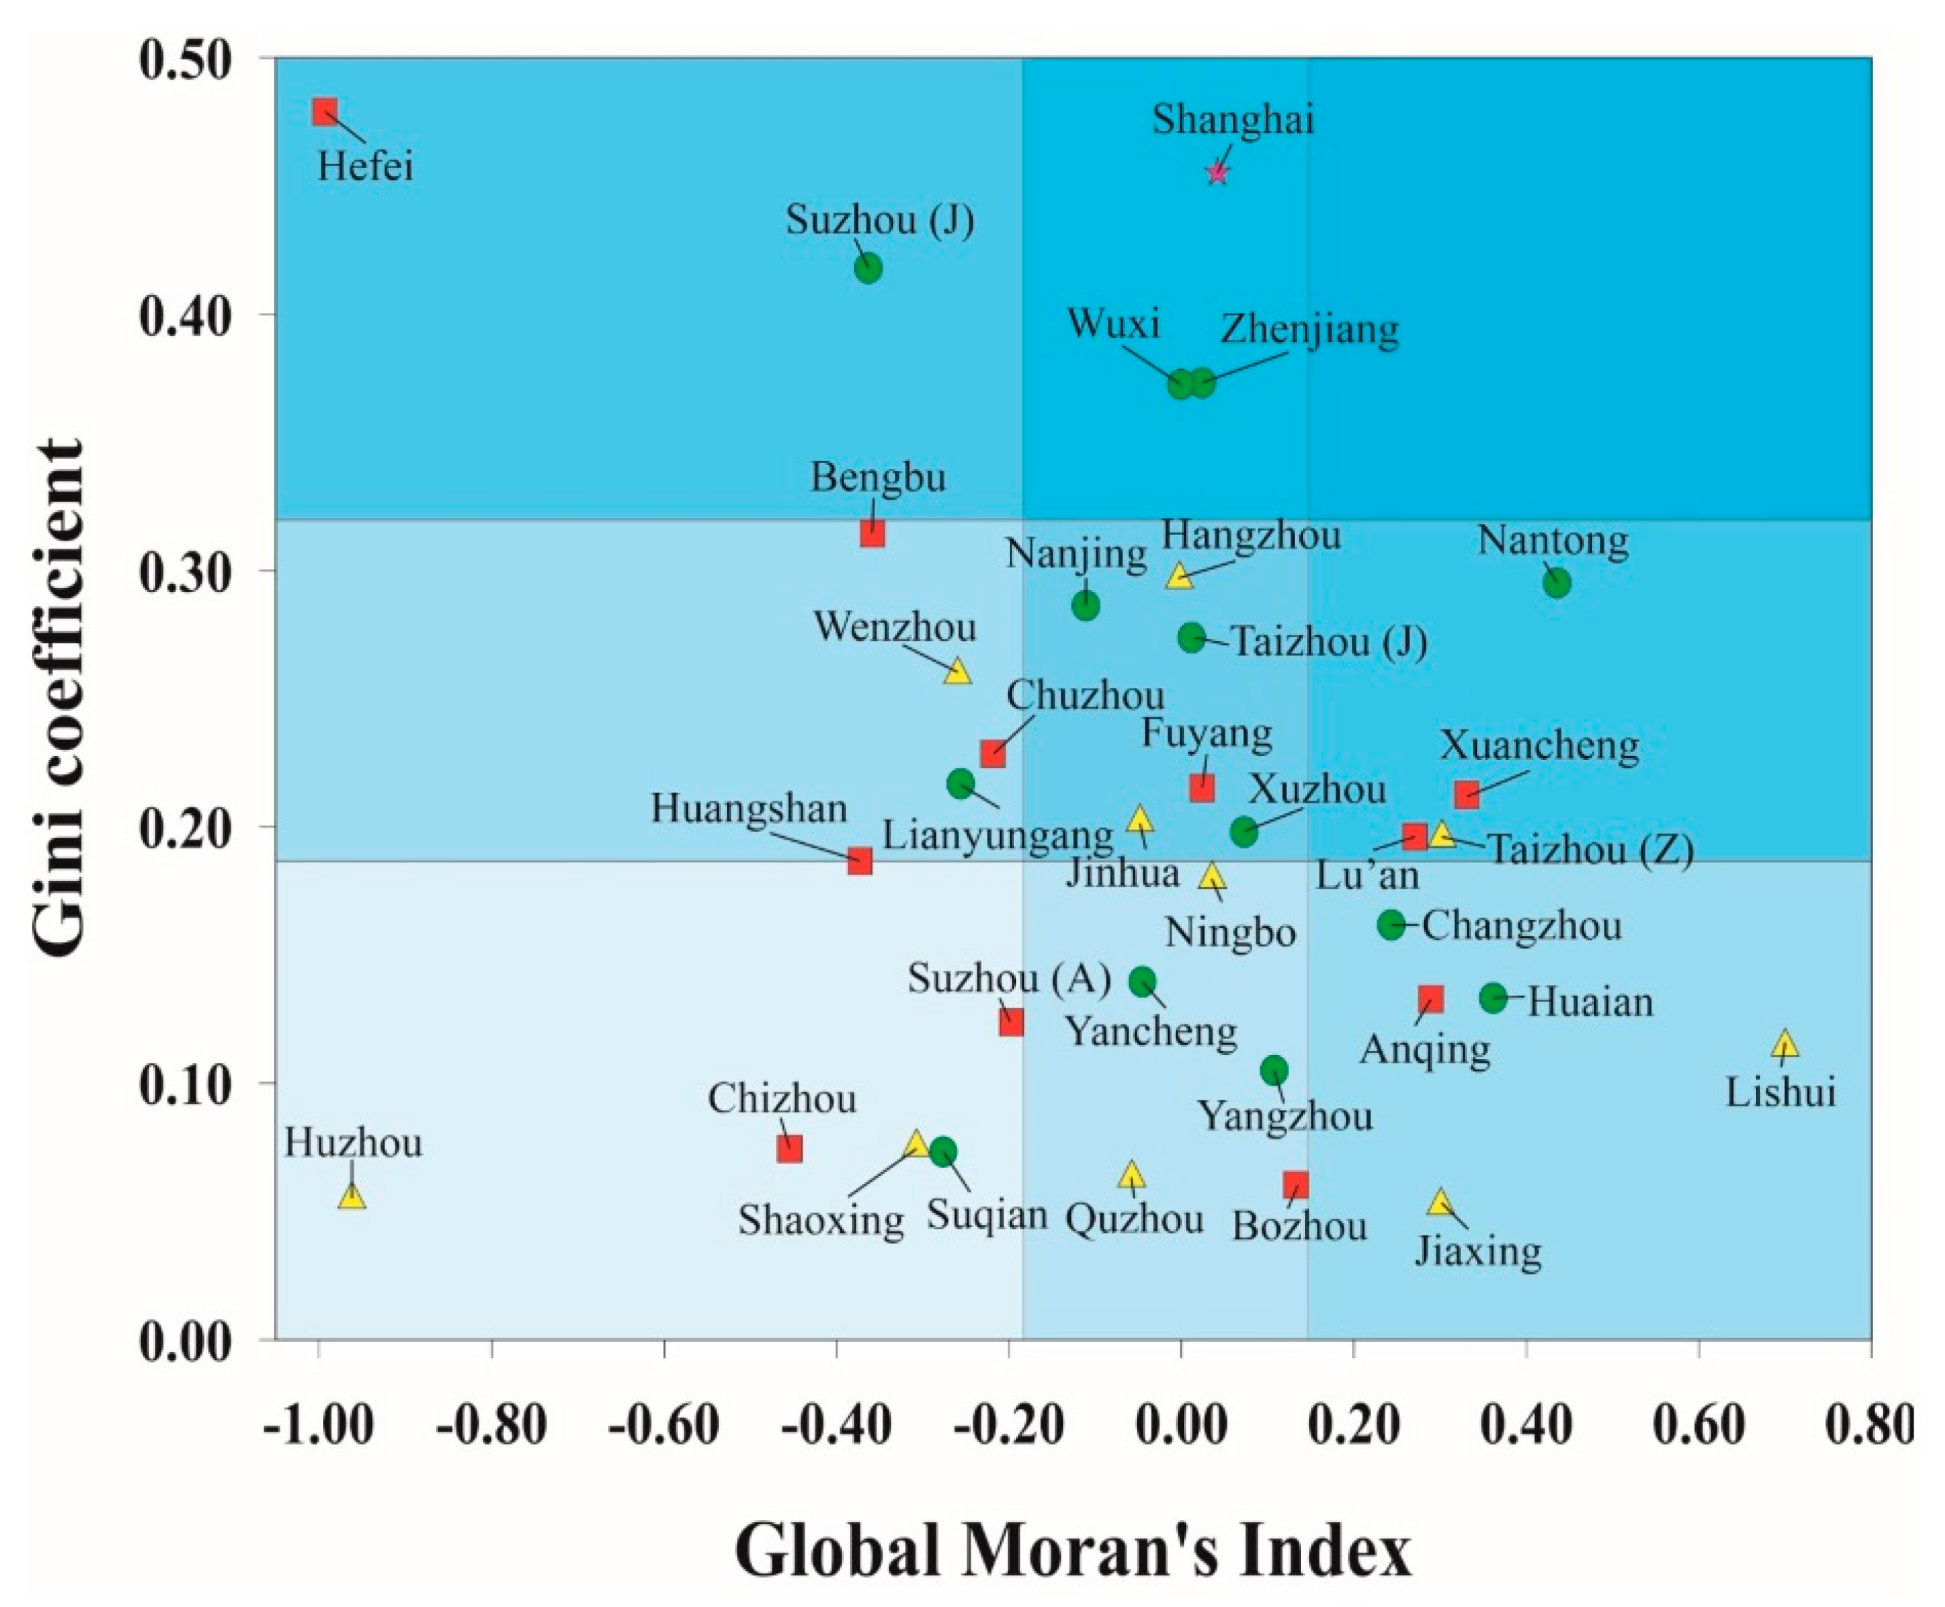
3.4. City Type Grouping According to Gini and Moran’s Index

Based on classification using natural breaks (refer to Section 2.5, Figure 2), the 35 cities are shown in Figure 6. As explained earlier, the Gini coefficient and Moran’s index among the cities are categorized into nine types (refer to Figure 2, Table 2). In Figure 6, each quadrilateral represents a type of city. As shown, all quadrilaterals except type III contain one or more cities. Most of the cities belong in type V (medium polarization with medium clustering), which contains Hangzhou, Nanjing, Taizhou, Fuyang, Xuzhou and Jinhua. Chizhou, Shaoxing, Suqian, Suzhou and Huzhou are in type VII. Ningbo, Yancheng, Yangzhou, Bozhou and Quzhou are in type VIII, while Changzhou, Huaian, Anqing, Lishui and Jiaxing in type IX. Type II (high polarization with medium clustering) has three cities including shanghai Wuxi and Zhenjiang. Type I has Hefei and Suzhou. Type IV includes Bengbu, Wenzhou, Chuzhou and Lianyungang while Nantong, Xuancheng, Taizhou and Lu’an are in type VI. Huangshan city fell in no particular category but lies on the border between category IV and VII.
The breaking points on the grids are defined by natural breaks according to Jenk’s [36] approach. The purposes of the breaks or boundaries are to ensure a minimum within-group difference and a maximum between groups difference, which produces nine grids unevenly dimensioned. It is clear to see that the top three cities with the highest water consumption are Shanghai, Hefei and Suzhou. By contrast, Jiaxing, Quzhou and Bozhou have low consumption values. Cities with higher consumption (high Gini) should be treated as priority by implementing long term mitigation measures in elimination inequality (reducing their water consumption) through improving water use efficiency. There is at least one city in each city type. Most of the cities belong in city-type V, which means that these cities share a common consumption and similar spatial distribution. For each city type, we refer to Table 2 for its explanation and Table 3 for specific recommendations.
To formulate more specific city level policies or take management decisions to eliminate inequality, the following recommendations in Table 3 should be followed.

4. Conclusions

The study has demonstrated that the Gini coefficient and Moran’s index can be used to calculate inequality and display its spatial autocorrelation. Within the YRED, there is no high inequality, which suggests that the inequality margin is not too wide and is reducing. However, presently, there are significant amounts of relative inequality in Shanghai, Hefei and Suzhou, which means that these cities’ level of inequality engenders patterns of social stratification of people regarding water use. Water use efficiency throughout the YRED was poor. Only 11 out of 35 cities scored more than 50% in water use efficiency. Poor irrigation technology and high industrial demand were the most significant factors causing inefficiency and inequality. City reclassification according to Gini and Moran’s index produced 9 city types defined by the spatial spread of inequality. City types I, IV and VII have dispersed inequality; therefore, policies for these cities must target many places. Types II, VIII and V have medium clustering of inequality. Policies for these cities type must target several places. Type III, VII and IX have highly clustered inequality, therefore, policies for this type of cities must target the few clustered locations. Since Shanghai, Hefei and Suzhou are the largest industrial hubs in the YRED and biggest contributors to inequality, we single them out for more recommendation. In formulating policies to eliminate the relative inequality in these three cities, the following scenarios, which are specific to them, must be considered: (i) Shanghai, Hefei and Suzhou cumulatively contribute largely to China’s GDP and will continue to place high demands for water to sustain their industries. (ii) Industrial products manufactured from these cities using water are consumed in water-stressed areas and the value of water used in manufacture is gained through consumption in the form of virtual water in water-stressed regions. This compensates the high water demand (inequality); therefore, water-stressed units around the three cities and other parts of the YRED at present can withstand the inequality due to value gained in consuming industrial products manufactured using water. To attain a win-win situation, a combined effort to reduce industrial water demand without affecting industrial production and reduce irrigation waste of water will provide enough water to supply water-stressed cities and reduce the inequality within the YRED.

Supplementary Materials

The following are available online at https://www.mdpi.com/2073-4441/12/6/1709/s1, as supplementary material: water efficiency calculation in excel named, ‘Water consumption and GDP data of 2015’.

Author Contributions

Conceptualization, P.B. and X.Y methodology, P.B.; software, D.B.; validation, P.B., X.Y. and D.B.; formal analysis, X.Y.; investigation, X.Y.; resources, X.Y; data curation, X.Y.; writing—original draft preparation, P.B.; writing—review and editing, P.B.; visualization, D.B.; supervision, X.Y.; project administration, X.Y.; funding acquisition, X.Y. All authors have read and agreed to the published version of the manuscript.

Funding

This research was funded by the National Key Research Program of China (grant numbers. 2017YFC0506603, 2016YFC0401305); the State Key Program of National Natural Science of China (grant number. 41530635); and the Project of National Natural Foundation of China (grant number. 51679007).

Acknowledgments

Thanks to all authors for their efforts in conducting this research.

Conflicts of Interest

The authors declare no conflict of interest.

Appendix A. Gini Coefficient Calculation Program (Example for Shanghai City)

import numpy as np
from matplotlib import pyplot as pl
pl.rcParams[’font.sans-serif’] = [’SimHei’]
pl.rcParams[’axes.unicode_minus’] = False
fig, ax = pl.subplots()
def gini():wealths = [
0.0675642677660354,
0.0579189784185699,
0.0312095340097584,
0.0281468599459833,
0.04134466]
cum_wealths = np.cumsum(sorted(np.append(wealths, 0)))
sum_wealths = cum_wealths [−1]
xarray = np.array(range(0, len(cum_wealths))) / np.float(len(cum_wealths) − 1)
upper = xarray
yarray = cum_wealths / sum_wealths
ax.plot (xarray, yarray)
ax.plot (xarray, upper)
pl.text (0.20, 0.85, "Shanghai", size = 20, ha = "center", va = "center",bbox = dict (boxstyle = "round",ec = (1., 1., 1.),fc = (0.5, 1.0, 0.8),))
pl.show ()
B = np.trapz (yarray, x=xarray)
A = 0.5 − B
G = A / (A + B)
print (G) gini().

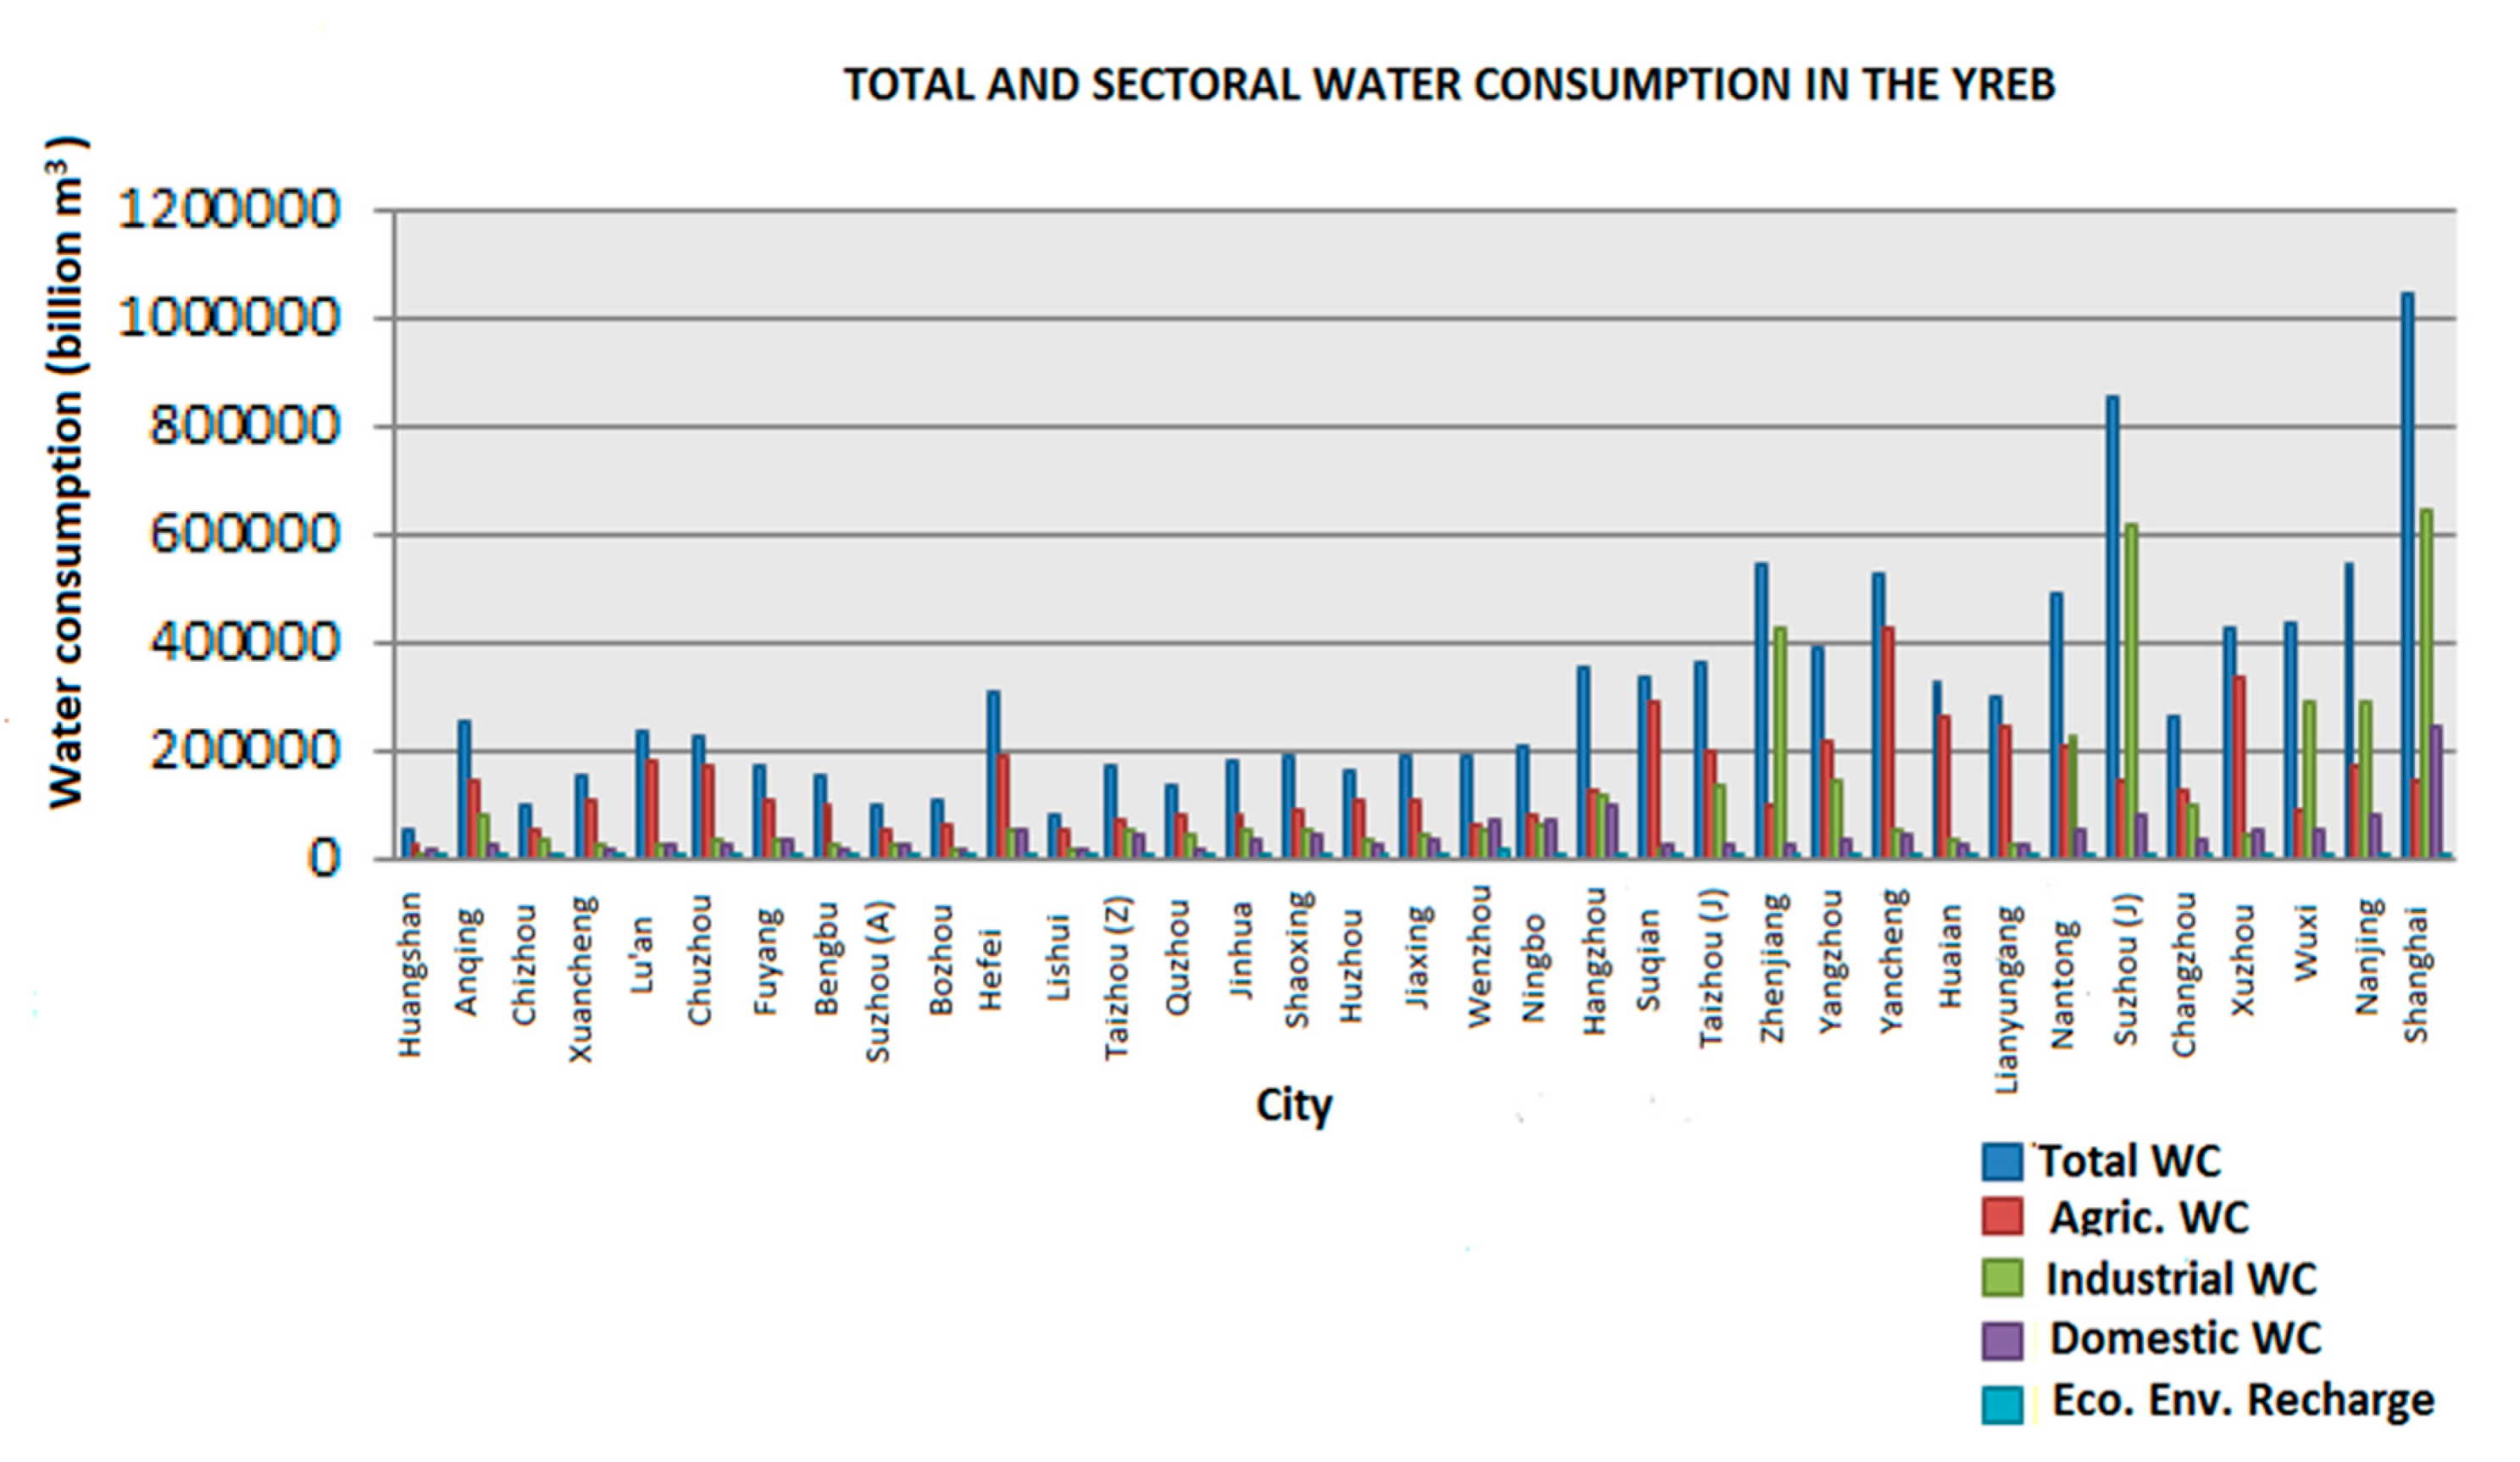
Appendix B. Water Consumption of the Selected Cities in 2015

Figure A1. Water Consumption of cities in the YRED. Note, ‘WC’ is water consumption, ‘Eco’. is Ecological and ‘Env’. is Environmental.
Water 12 01709 g0a1

References

  1. UN Water-United Nations Water. Water Scarcity. Available online: https://www.unwater.org/water-facts/scarcity/ (accessed on 29 May 2020).
  2. Jones, A.Q.; Dewey, C.E.; Dore, K.; Majowicz, S.E.; Walter-Toews, D. Drinking Water Consumption Patterns of residents in a Canadian Community. J. Water Health 2006, 4, 125–138. [Google Scholar] [CrossRef] [Green Version]
  3. UN Water-United Nations Water. Expanding Water Supply Capacity in China. Available online: https://www.unwater.org/expanding-water-supply-capacity-china/ (accessed on 29 May 2020).
  4. UN ESCWA-United Nations Economic and Social Commission for Western Asia. Overcoming Population Vulnerability to Water Scarcity in the Arab Region. Population and Development Report 2015, 7. Available online: https://www.unescwa.org/publications/arab-population-vulnerability-water-scarcity/ (accessed on 29 May 2020).
  5. Siao, S.; Chuanglin, F.; Jinyan, L. Spatial Inequality of Water footprint in China; A detailed decomposition of Inequality from water use types and drivers. J. Hydrol. 2017, 553, 398–407. [Google Scholar]
  6. Xia, J.; Zhang, L.; Liu, C.M.; Yu, J.J. Towards better water security in North China Water. Water Resour. Manag. 2007, 21, 233–247. [Google Scholar] [CrossRef]
  7. Yong, J. China’s Water Security: Current Status, emerging challenges and Future prospects. J. Environ. Manag. 2009, 90, 3185–3196. [Google Scholar]
  8. Jiang, Y. China’s Water Security: Current status, emerging challenges and future prospects. Environ. Sci. Policy 2015, 54, 106–125. [Google Scholar] [CrossRef]
  9. Thomas, B.U.; Zhuang, J.; Emmanuel, C.A.; Samuel, M.O. China’s Water Situation; the supply of water and the pattern of its usage. Int. J. Sustain. Built Environ. 2017, 6, 491–500. [Google Scholar]
  10. Wouters, P.; Hu, D.; Zhang, J.; Tarlock, D.; Andrews-Speed, P. The new development of water law in China. Researchgate 2004, 243, 225–232. [Google Scholar]
  11. Feng, H.; Debra, T.; Yuanchao, X. Yangtze Water Risks Hotspots and Growth. China’s Water Risk. 2019. Available online: http://www.chinawaterrisk.org/wp-content/ (accessed on 29 May 2020).
  12. Fan, H.; Huang, H.; Zeng, T. Impacts of Anthropogenic Activity on the recent evolution of the Huanghe (Yellow) River Delta. J. Coast. Res. 2006, 22, 919–929. [Google Scholar] [CrossRef]
  13. Cai, X.; Ringler, C. Balancing Agricultural and Environmental water needs in China: Alternative Scenarios and Policy Options. Water Policy 2007, 9, 95–108. [Google Scholar] [CrossRef]
  14. Cowell, F.A.; Flachaire, E. Income distribution and inequality measurement: The problem of extreme values. J. Econom. 2007, 141, 1044–1072. [Google Scholar] [CrossRef] [Green Version]
  15. Jethoo, A.S.; Poonia, M.P. Water Consumption Pattern of Jaipur City (India). Int. J. Environ. Sci. Technol. 2011, 2, 152–155. [Google Scholar]
  16. UN OHCHR-United Nations High Commissioner for Human Rights. Fact Sheet No. 35. The Right to Water. UN Office of the High Commissioner for Human Rights. Available online: https://www.refworld.org/docid/ (accessed on 29 May 2020).
  17. Kaplow, L. Why Measure Inequality? J. Econ. Inequal. 2005, 3, 65–79. [Google Scholar] [CrossRef]
  18. Allison, P.D. Measure of Inequality. Am. Sociol. Rev. 1978, 43, 865–880. [Google Scholar] [CrossRef]
  19. Atkinson, A.B. Measurement of Inequality. J. Econ. Theory 1970, 2, 244–263. [Google Scholar] [CrossRef]
  20. Bellù, L.G.; Liberati, P. Policy Impacts on Inequality: Welfare Based Measures of Inequality—The Atkinson Index’. Food and Agriculture Organization of the United Nations. Available online: http://www.fao.org/3/a-am344e.pdf (accessed on 28 May 2020).
  21. Litchfield, J.A. Inequality: Methods and Tools Text from the World Bank Poverty. Am. J. Rural Dev. 2013, 1, 6–14. [Google Scholar]
  22. Can, C.; Yuli, S.; Jianghua, L.; Xiang, Y.; Hongtao, W.; Zhen, W. CO2 emissions and their spatial patterns of Xinjiang Cities in China. Appl. Energy 2019, 252, 113473. [Google Scholar]
  23. Clarke-Sather, A.; Qu, J.S.; Wang, Q.; Zeng, J.J.; Li, Y. Carbon Inequality at the Sub-national scale: A case study of provincial-level inequality in CO2 emissions in China 1997–2007. Energy Policy 2011, 39, 5420–5428. [Google Scholar] [CrossRef]
  24. Wiemer, S.; Daniele, C. Handbook of Income Distribution; Elsevier: North-Holland, the Netherlands, 2015; pp. 1535–1727. [Google Scholar]
  25. Cullis, J.; Van Koppen, B. Applying the Gini Coefficient to Measure Inequality of Water use in the Olifants River Water Management Area, South Africa; IWMI Research Report 113; International Water Management Institute: Colombo, Sri Lanka, 2007; 25p. [Google Scholar]
  26. Megan, J.C.; Richard, M.B.; James, D.S.C.; Mark, G.N. Spatial inequality in water access and water use in South Africa. Water Policy 2018, 20, 37–52. [Google Scholar]
  27. Yang, H.; Bain, R.; Bartram, J.; Grundy, S.; Pedley, S.; Wright, J. Water Safety and Inequality in Access to Drinking-water between Rich and Poor Households. Environ. Sci. Technol. 2013, 47, 1222–1236. [Google Scholar] [CrossRef]
  28. Wang, X.; Zhang, J.; Shahid, S.; ElMahdi, A.; He, R.; Wang, X.; Mahtab, A. Gini coefficient to assess equity in domestic water supply in the Yellow River. Mitig. Adapt. Strateg. Glob. Chang. 2011, 17, 65–75. [Google Scholar] [CrossRef]
  29. Malakar, K.; Mishra, T.; Patwardhan, A. Inequality in water supply in India: An assessment using the Gini and Theil indices. Environ. Dev. Sustain. 2017, 20, 841–864. [Google Scholar] [CrossRef]
  30. Morales-Novelo, J.A.; Rodríguez-Tapia, L.; Revollo-Fernández, D.A. Inequality in Access to Drinking Water and Subsidies between Low and High-Income Households in Mexico City. Water 2018, 10, 1023. [Google Scholar] [CrossRef] [Green Version]
  31. Moran, P.A. Notes on continuous stochastic phenomena. Biometrika 1950, 37, 17–23. [Google Scholar] [CrossRef] [PubMed]
  32. Feng, H.; Debra, T.; Qian, Y.; Xiaolan, Z. Water-Nomics of The Yangtze River Economic Belt: Strategies & recommendations for green development along the river. Researchgate 2016, 5, 96–102. [Google Scholar]
  33. Feifei, T.; Jun, B. An inquiry into the water transfer network of the Yangtze River Economic Belt in China. J. Clean. Prod. 2018, 176, 288–297. [Google Scholar]
  34. Singh, G.; Kumar, E. Input data scale impacts on modelling output results: A review. J. Spat. Hydrol. 2017, 13, 235–241. [Google Scholar]
  35. Geary, R.C. The contiguity ratio and statistical mapping. Inc. Stat. 1954, 5, 115–146. [Google Scholar] [CrossRef]
  36. Jenks, G.F. The data model concept in statistical mapping. Int. Yearb. Cartogr. 1967, 7, 186–190. [Google Scholar]
  37. Jim, F.; Yu-ting, T.; Faith, C. The development of water management within Ningbo, Zhejiang, China. In Proceedings of the 2013 IAHR World Conference, Chengdu, China, 3 January 2013. [Google Scholar]
  38. Guangyao, D.; Lu, L.; Yana, S. Provincial water use efficiency measurement and factor analysis in China: Based on the SBM-DEA model. Ecol. Indic. 2016, 69, 12–18. [Google Scholar]
  39. Li, J.; Ma, X. Econometric analysis of industrial water use efficiency in China. Environ. Dev. Sustain. 2015, 17, 1209–1226. [Google Scholar] [CrossRef]
  40. Zyadin, A. Water Shortage in MENA region: An interdisciplinary overview and suite of practical solutions. J. Water Resour. Prot. 2013, 5, 49–58. [Google Scholar] [CrossRef] [Green Version]
  41. Zhao, F.M.; Wan, D.H.; Ma, Z.Y. Virtual water analysis of the main crops in Kunming based on Cropwat. J. Agric. Sci. 2017, 45, 56–61. [Google Scholar]
  42. Goswami, P.; Nishad, S.N. Virtual water trade and time scales for loss of water sustainability: A comparative regional analysis. Sci. Rep. 2015, 5, 3–25. [Google Scholar] [CrossRef] [PubMed] [Green Version]
  43. Jiang, Y.; Cai, W.; Du, P.; Pan, W.; Wang, C. Virtual Water in interprovincial trade with implications for China’s water policy. J. Clean. Prod. 2015, 87, 655–665. [Google Scholar] [CrossRef]
  44. Wang, Z.; Huang, K.; Yang, S.; Yu, Y. An input-output approach to evaluate the water footprint and the virtual water trade of Beijing China. J. Clean. Prod. 2013, 42, 172–179. [Google Scholar] [CrossRef]
  45. Yizhi, W.; Hiroyuki, S.; Edward, L.; Yoshiro, H.; Guoping, M. A study of Shanghai’s development strategy to 2020. Reg. Sci. Policy Pract. 2013, 5, 183–200. [Google Scholar]
  46. Tong, L.; Xiaohua, Y.; Leihua, G.; Boyang, S. A three-Stage Hybrid Model for Space-Time Analysis of Water Resources Carrying Capacity: A Case Study of Jilin Province, China. Water 2020, 12, 426. [Google Scholar]
  47. Qirui, X.; Xiaohua, Y.; Feifei, W. A three-stage hybrid model for the regional assessment, spatial pattern analysis and source apportionment of the land resources comprehensive supporting capacity in the Yangtze River Delta urban agglomeration. Sci. Total Environ. 2020, 711, 1–18. [Google Scholar]
  48. Boyang, S.; Xiaohua, Y.; Yipeng, Z.; Xiaojuan, C. Evaluation of Water Use Efficiency of 31 Provinces and Municipalities in China Using Multi-Level Entropy Weight Method Synthesized Indexes and Data Envelopment Analysis. Sustainability 2019, 11, 4556. [Google Scholar]
  49. Boyang, S.; Xiaohua, Y. Simulation of Water Resources Carrying Capacity in Xiong’an New Area Based on System Dynamics Model. Water 2019, 11, 1085. [Google Scholar]
Figure 1. Study area showing the YRED.
Water 12 01709 g001
Figure 2. City type classification according to Jenks. Sub-figure (a) is city type categories, (b) is polarization level and (c) is level of clustering.
Water 12 01709 g002
Figure 3. Water use efficiency (A) and distribution (B).
Water 12 01709 g003
Figure 4. Inequality level (A) and distribution (B).
Water 12 01709 g004
Figure 5. Global Moran’s index of cities (A) and its distribution (B).
Water 12 01709 g005
Figure 6. Reclassification of city types according to the spatial spread of inequality.
Water 12 01709 g006
Table 1. Cities in the Yangtze River Economic Delta (YRED).
RegionProvinceSelected Cities
UpstreamChongqingChangzhou
MidstreamHubeiSuizhou
DownstreamAnhuiHefei, Bozhou, Chuzhou,
Lu’an, Anqing, Huangshan,
Fuyang, Bengbu, Chizhou and
Xuancheng
JiangsuNanjing, Suzhou, Changzhou,
Huaian, Lianyungang,
Nantong, Suqian, Taizhou,
Wuxi, Xuzhou, Yancheng,
Yangzhou and Zhenjiang
ZhejiangHangzhou, Jiaxing, Huzhou,
Jinhua, Lishui, Ningbo,
Quzhou, Shaoxing, Wenzhou,
Shanghai
Note: The YRED is normally divided into 3 parts: Upstream, Middle stream and Downstream.
Table 2. Explanation of city types.
Type of InequalityExplanation
Type IHigh inequality with low clustering
Type IIHigh inequality with medium clustering
Type IIIHigh inequality with high clustering
Type IVMedium inequality with low clustering
Type VMedium inequality with medium clustering
Type VIMedium inequality with high clustering
Type VIILow inequality with low clustering
Type VIIILow inequality with medium clustering
Type VILow inequality with high clustering
Note: The inequality is based on the categorization done in Section 2.5.
Table 3. Recommendations for various city types.
City TypeCitiesRecommendation
IHefei, SuzhouFocus on many water areas to reduce inequality.
IIShanghai, Wuxi, ZhejiangFocus on several areas (industries) to eliminate inequality
IIINo cityFocus on a few sectors or clustered settlements to eliminate inequality
IVBengbu, Wenzhou, Chuzhou, LianyungangFocus on many areas
to eliminate inequality
VNanjing, Hangzhou,
Taizhou, Fuyang, Xuzhou, Jinhua
Focus on several areas to eliminate inequality
VIHangzhou, Nanjing, Fuyang, Xuzhou, Taizhou, Jinhua, NantongFocus on several water areas to eliminate inequality
VIISuqian, Suzhou,
Chizhou, Shaoxing, Huzhou
Focus on a few areas to eliminate the inequality
VIIINingbo, Yancheng, Yangzhou, Quzhou, BozhouFocus on many areas to illuminate inequality.
IXChangzhou, Huaian, Anqing, Lishui, JiaxingFocus on few areas to illuminate inequality

