Article

Influence of Historical Climate Patterns on Streamflow and Water Demand in Wales, UK

by
Richard J. H. Dallison
*,
Sopan D. Patil
and
A. Prysor Williams
School of Natural Sciences, Bangor University, Bangor, Gwynedd LL57 2UW, UK
*
Author to whom correspondence should be addressed.
Water 2020, 12(6), 1684; https://doi.org/10.3390/w12061684
Submission received: 7 May 2020 / Revised: 8 June 2020 / Accepted: 10 June 2020 / Published: 12 June 2020
(This article belongs to the Section Water Use and Scarcity)

Abstract

:
Ensuring reliable drinking water supplies is anticipated to be a key future challenge facing water service providers due to fluctuations in rainfall patterns and water demand caused by climate change. This study investigates historical trends and relationships between precipitation, air temperature and streamflow in five catchments in Wales, before correlating these with actual total abstraction data provided by the water company, to give insight into the supply-demand balance. Changes in seasonal and annual averages, as well as extreme events, are assessed for a 34-year period (1982–2015) and a breakpoint analysis is performed to better understand how climate has already changed and what this might mean for the future of water supply. Results show a north-south divide in changes in extreme temperature and streamflow; a strong warming trend in autumn average temperatures across Wales (Sen’s slope range: 0.38–0.41, p <0.05), but little change in precipitation. Abstraction, as a proxy for overall water demand, is shown to be positively correlated to temperature (Spearman’s ρ value range: 0.094–0.403, p <0.01; Pearson’s r value range 0.073–0.369, p <0.01) in four of five catchments. Our study provides new insight into the relationship between abstraction volume and hydroclimatic factors and highlights the need for catchment-scale water resource planning that accounts for hydroclimatic variations over small spatial distances, as these nuances can be vital.

1. Introduction

Water service providers face a vast array of challenges and uncertainties when planning their future operations and services. Brown et al. [1] compiled a list of 94 priority research questions for the UK water sector, in which the impact of climate change on water quantity was ranked as the second most important question. Their work also highlighted the need to better understand the drivers of water demand, both domestic and commercial, in order to improve future demand forecasting. Previous work on the characterization of hydroclimatic trends in the UK suggests that precipitation and streamflows have become more seasonal, a pattern that is expected to continue [2,3,4]. A study by Christiersen et al. [5] showed, using UK Climate Predictions 2009 (UKCP09) data, that by the late 2020s, increases in winter precipitation levels are likely to be more prominent in northern and western parts of the UK, while decreases in summer flows will be seen more generally across the whole country. Similarly, a hydrological modelling study by Prudhomme et al. [6] showed that summer precipitation and streamflows will decrease across the UK by varying amounts for the period 2040–2069; whereas future winter precipitation and streamflows showed an upward trend, especially for Wales. Extreme precipitation events are also projected to become more seasonal in the UK, with longer duration and more intense rainfall events in winter becoming more common [3]. Mayes [7] suggested that these anticipated changes will not be uniform across the UK, and current rainfall gradients are likely to be accentuated, i.e., the south getting dryer in summer and the north getting wetter in winter.
Regional scale understanding of water resource provision in the UK is particularly important because water supply is under the control of individual water companies that serve separate regions of varying sizes, populations, and physical characteristics. For instance, in south-east England, which is already a water stressed area, studies on future hydroclimatic trends suggest that summer streamflow levels will continue longer into autumn, with overall summer flow levels declining also. Furthermore, winter streamflows will increase and continue longer into spring, leading to accentuated seasonality in terms of season longevity and flow volumes [8,9,10,11,12]. However, an increase in winter precipitation will do little to combat summer shortages if no further storage capacity is developed soon [13]. Borgomeo et al. [14] suggested that, due to the combined effect of climate change and significant predicted population growth, the London water supply zone urgently required both supply and demand-side interventions if the current standard of water provision is to continue. In Scotland, although winter precipitation is predicted to increase in the future, a lower percentage of it will fall as snow [15,16]. This will make catchments more responsive to winter precipitation and increase the pressure on water managers to deal with larger discharge events [17]. For summer precipitation and streamflows, Blenkinsop & Fowler [18] noted that Scotland has a limited amount of groundwater storage capacity, which heightens the drought risk from any reduction in non-winter precipitation. In Wales, studies suggest that winter and summer season characteristics, e.g., wet winters and dry summers, will be exacerbated, especially in winter [19,20,21].
In this study, we use Wales as a case study region, a country often viewed as abundant in water resources, receiving some of the highest average annual rainfall totals in the UK [22], but which in reality does have zones of water deficit [23]. Wales is also important due to its role as an exporter of water to major metropolitan areas in England. Dŵr Cymru Welsh Water (DCWW), the major water service provider for Wales, has over 20 bulk water trades, the largest of which supplies 360 million liters per year to Severn Trent Water for distribution around Birmingham [23,24].
Past studies on water resources in Wales have predominantly been conducted either as part of UK-wide research [2,3,4,19,25,26,27], or with a focus on the combined England and Wales region [11,28]. When focusing specifically on the area covering Wales, Fowler & Wilby [19] projected a much larger magnitude of increase in winter flows from the 1960–1990 average to thirty-year averages centered on 2025, 2055 and 2085, than the corresponding decreases in summer precipitation. Dixon et al. [20] showed a significant upward trend across 56 Welsh and West Midlands catchments between 1962–2001 for winter high flow values, but no significant changes in the mean annual values. Conflictingly, Macdonald et al. [29], demonstrated that during the period 1973–2002, there was no significant change in the seasonality of rainfall across 30 catchments in Wales, which they proved to have a significant link to streamflows; however, they did show that the frequency of occurrence of extreme precipitation events in Wales had increased during the study period. These contrasting results highlight the need for careful consideration when selecting study period length and timeframe due to the potential impact on trend analysis results and projections.
Up until recently, supply-side measures to tackle water scarcity and to manage water resources have traditionally been the main path towards a reliable sustainable future water network. However, it has increasingly been recognized over the past decade that demand-side interventions should also play a role as an adaptation measure [30]. For this to be a viable option, further work is needed to understand the relationship between prevailing and antecedent weather conditions, and demand for water in the UK. Several studies have looked at the general interplay between the two in the UK [31,32,33,34], and abroad [35,36,37]. This interplay has been under research since at least as far back as the 1990s, with Herrington [32] stating that at the time, up to 40% of total consumption in summer can be due to garden watering, which is obviously highly affected by the prevailing weather conditions. Goodchild [38] used summer daily domestic water demand data (55% of UK piped water supply at the time) from 41 domestic properties and daily meteorological data to develop a demand prediction model. The model included ten weather variables to account for current and antecedent conditions; evapotranspiration, days since rain, and temperature were all important functions. This modelling work projected a 2.1% increase in average summer 7-day household demand by the 2020s. More recently, Parker & Wilby [39] reviewed domestic water demand in the UK and noted the lack of studies on weather and climate. It is also important to look not only at domestic demand, but also industrial, agricultural and non-revenue water use (e.g. leakage), as they all influence the long-term sustainability of water supply.
In this study, we look at the implications of past trends in hydroclimatic data on two of the problems identified by Brown et al. [1]: (1) impact of climate variations on water availability and (2) understanding the factors affecting water demand. The first problem has been addressed by assessing trends in seasonal and annual average climate and streamflow data as well extreme event frequency and magnitude, using Mann-Kendall trend analysis and breakpoint analysis. We have addressed the second problem by investigating the historical links between hydroclimatic factors and total water demand, using actual abstraction data provided by DCWW as a proxy for demand. To our knowledge, this is one of the first studies conducted independently of a water service provider to utilize actual abstraction data provided by a water service provider in this manner in the United Kingdom. The reliance on Wales for water supply in other regions, combined with a potentially inaccurate assumption of national water abundance in Wales, makes the region a crucial area of study in terms of water management and water supply availability. Our research has therefore been undertaken in order to provide information for future water resource planning and policy decisions, as well as future research. It is hoped that this will be achieved by providing evidence of the long-term trends and links between prevailing weather and flow conditions, as well as total demand for water in Wales.

2. Data and Methods

2.1. Study Catchments

Our study focusses on the rivers Clwyd and Conwy in the north, the Dyfi in the west, and the Teifi and Tywi in the south of Wales (Figure 1). We selected these catchments due to them being among the largest systems within the region, encompassing a range of Land Use/Land Cover (LULC), and exhibiting a variety of different catchment characteristics. Furthermore, the catchments are also mostly encompassed within DCWW’s water supply zone (Figure 1), and all have multiple surface water abstraction locations licensed to DCWW for use for public water supply. Brief catchments descriptions have been provided below and key comparative details about each are given in Table 1. Figures for LULC in the catchments were calculated from 2012 CORINE Landcover data (Copernicus Land Monitoring Data), while the catchment size, longest stream length, elevation and slope values were calculated using the 5 m Digital Elevation Model (DEM) data provided by Ordnance Survey.
In terms of LULC, the Clwyd, Teifi, and Tywi are dominated by agricultural land use (Figure 1); while the largest proportion of LULC in Conwy and Dyfi is scrubland (mainly in the form of moors and heathland in Conwy, and natural grasslands in Dyfi). Agricultural land in all study catchments is mostly pastureland, however, Clwyd does have a larger proportion of its total LULC as arable land (10.4%). Forested land in all catchments is mainly coniferous, except in Conwy where there is an equal proportion of coniferous and mixed forest (5.1% LULC each) and 3% broadleaf forest. The bedrock geology is predominantly mudstone, siltstone and sandstone in all five catchments, ranging from about 60% in Conwy and Clwyd, 73% in Tywi, and over 85% in Dyfi and Teifi. The catchments range in area covered from 1363 km2 at the Tywi to less than half of that for the Conwy (564 km2). The steepest catchment is the Dyfi, with an average slope of 14.2 degrees, being largely in the south of the Snowdonia region, while the Teifi in the south is the least steep catchment, with an average slope of 6.6 degrees.

2.2. Data

Hydrological and meteorological data for all five study catchments was obtained for the longest complete period possible for all datasets, that being the 34-year period from 1 October 1981 to 30 September 2015 (except flow data for the Dyfi, which was only available to 5 May 2014). Daily precipitation and air temperature data were obtained from the Centre for Ecology and Hydrology’s (CEH) Climate, Hydrology and Ecology research Support System (CHESS) dataset. The mean value of all of the 1 km grids contained within each catchment was taken for each day for both precipitation and temperature, giving a daily average value for each variable for each catchment. Daily streamflow data for the catchments was obtained from CEH’s National River Flow Archive dataset; gauging station locations are shown in Figure 1.
Daily water abstraction volumes were obtained from DCWW, which is the main water supply company for this region. However, these data were only available for a five-year period from 1 January 2012 to 30 September 2016. Therefore, comparison of the water abstraction data with the hydroclimatic data could only be completed for the overlapping dates between the datasets, 1 January 2012 to 30 September 2015. The daily water abstraction data was provided for 22 abstraction locations within the five study catchments and has been used as a proxy for overall demand across the network for all consumers, as well as leakage.

2.3. Trend Analysis

We selected the nonparametric Mann-Kendall (MK) test [40,41] to detect any consistent trends in the hydroclimatic data over time. The decision to use a nonparametric test was taken due to the nature of both climate and hydrology data generally being non-normally distributed and displaying seasonality, which goes against the assumption of constant distribution [42]. Moreover, hydrology data often displays auto-correlation, making it unsuitable for parametric testing [43]. The MK test maintains the sequential order of the data and calculates Kendall’s tau (a measure of association between two samples) between each value and all values proceeding it, to test for a monotonic increase or decrease relationship in the data over time [44]. MK has also been successfully applied to similar hydroclimatic data in various locations globally [45,46,47,48] so was deemed suitable for use in this study. Details on the specific equations relating to the MK test can be found in Jaiswal et al. [49].
Long-term average trends in the datasets were examined by analyzing seasonal and annual averages for each catchment; where winter is December to February; spring is March to May; summer is June to August; autumn is September to November; and where, for example, the 1982 hydrological year runs from 1 October 1981 to 30 September 1982. For the abstraction data, we have taken the sum of abstractions in each catchment, with trend analysis being performed on this value, in order that the results are comparable to the hydroclimatic factors analyzed. We also examined trends in the frequency and magnitude of extreme events relating to hydroclimatic factors. This was achieved firstly by analysis of trends in maximum and minimum temperatures; maximum one day precipitation total and cumulative rainfall totals; and maximum and minimum average one day streamflow volumes. Secondly, we undertook an analysis of “events over threshold”, in order to establish whether there are generally more or less extreme weather events per year/season over the study period. This was completed by taking the 5th and 95th percentile values of a whole dataset (seasonally and annually) and analyzing the number of times in each year and season that that value is surpassed (95th percentile) or not reached (5th percentile) for temperature, and surpassing the 95th percentile only for precipitation. The MK test was applied with Sen’s slope estimator [50] in order to estimate the size and direction of trends in the data; Hamed and Rao’s method of auto-correlation correction was also applied in order to remove any apparent trend which the data exhibits with itself over time [43].
In order to detect any sudden changes in the hydroclimatic data, we carried out a breakpoint analysis on the seasonal/annual average and extreme event data. This analysis was completed using two well-established methods, the Standard Normal Homogeneity Test (SNHT) method [51,52] and the Pettitt method [53]. These two methods were used to ensure the widest possible detection of breaks in the data; with the SNHT being more accurate at detecting breaks at the start and end of time series, and the Pettitt method being more reliable in the middle [54,55]. If annual values of the variable being tested are identically distributed and independent, both methods accept the null hypothesis. The alternative hypothesis (that there is a change point in the series) will be accepted however, if a shift in the value of the mean has occurred [54]. Both methods are also location specific, so will identify the year at which the mean changed within the time series. For further information on the equations that drive the two methods, we suggest Hänsel et al. [54] and Jaiswal et al. [49].

2.4. Correlation Analysis of Hydroclimatic and Abstraction Data

In order to investigate the relationship between the three hydroclimatic factors and water abstraction we calculated both Pearson’s & Spearman’s rank correlation coefficients. The analysis was performed for each catchment with daily and monthly average temperature, precipitation and streamflow all being compared separately to daily and monthly total abstraction volume. We calculated Pearson’s coefficient values (r) using Equation (1):
r =   n i = 1 ( h c i h c ¯ ) ( a b s i abs ¯ ) (   n i = 1 ( h c i h c ¯ ) 2 ) (   n i = 1 ( a b s i abs ¯ ) 2 )
where h c i refers to the daily average hydroclimatic variables studied, a b s i refers to daily total abstraction volume, and h c ¯ & abs ¯ represent the mean of the entire respective datasets. The non-parametric Spearman’s correlation coefficient (ρ) was calculated using Equation (2), a modified version of Pearson’s correlation coefficient which calculates correlation between ranks, as opposed to raw data:
ρ =   n i = 1 ( R ( h c i ) R ( h c ) ¯ ) ( R ( a b s i ) R ( abs ) ¯ ) (   n i = 1 ( R ( h c i ) R ( h c ) ¯ ) 2 ) (   n i = 1 ( R ( a b s i ) R ( abs ) ¯ ) 2 )
where R ( h c i ) refers to the rank of the daily average hydroclimatic variables studied, R ( a b s i ) refers to the rank of the daily total abstraction volume, and R ( h c ) ¯ & R ( abs ) ¯ represent the mean rank of the entire respective datasets.

3. Results

Our results indicate a north-south divide when looking at extreme temperature and streamflow changes. Additionally, a strong warming trend in average autumn temperatures across Wales is observed, however little change in precipitation is seen. Abstraction, as a proxy for overall water demand, is strongly positively correlated to temperature in all catchments and negatively with streamflow and precipitation in all catchments except the Dyfi. Below we provide a detailed breakdown and explanation of these results.

3.1. Trend and Breakpoint Analysis

3.1.1. Precipitation

We found no significant trends during MK analysis or breakpoint analysis of annual and seasonal precipitation averages in any of the five catchments for the study period; but Sen’s slope indicator values do suggest a slight decrease in average spring precipitation across all catchments. In addition, only two significant trends were present in terms of extreme precipitation events; the first is a decrease in total cumulative spring precipitation in the Clwyd catchment throughout the period (Tau = −0.184, p = 0.040; Sen’s Slope = −1.196). The second is a decrease in the number of extreme wet autumn days in the Teifi catchment (Tau = −0.593, p = 0.003; Sen’s Slope = −0.138). Although both of these trends are mirrored in the other catchments, those trends are not statistically significant, highlighting the need to study individual catchments to account for varying characteristics. Additionally, the Pettitt breakpoint analysis showed a marked increase in winter cumulative precipitation in the Conwy after 1989 (p = 0.040), the mean for the post 1989 period increasing by 13.4% compared to the pre-1989 period.

3.1.2. Temperature

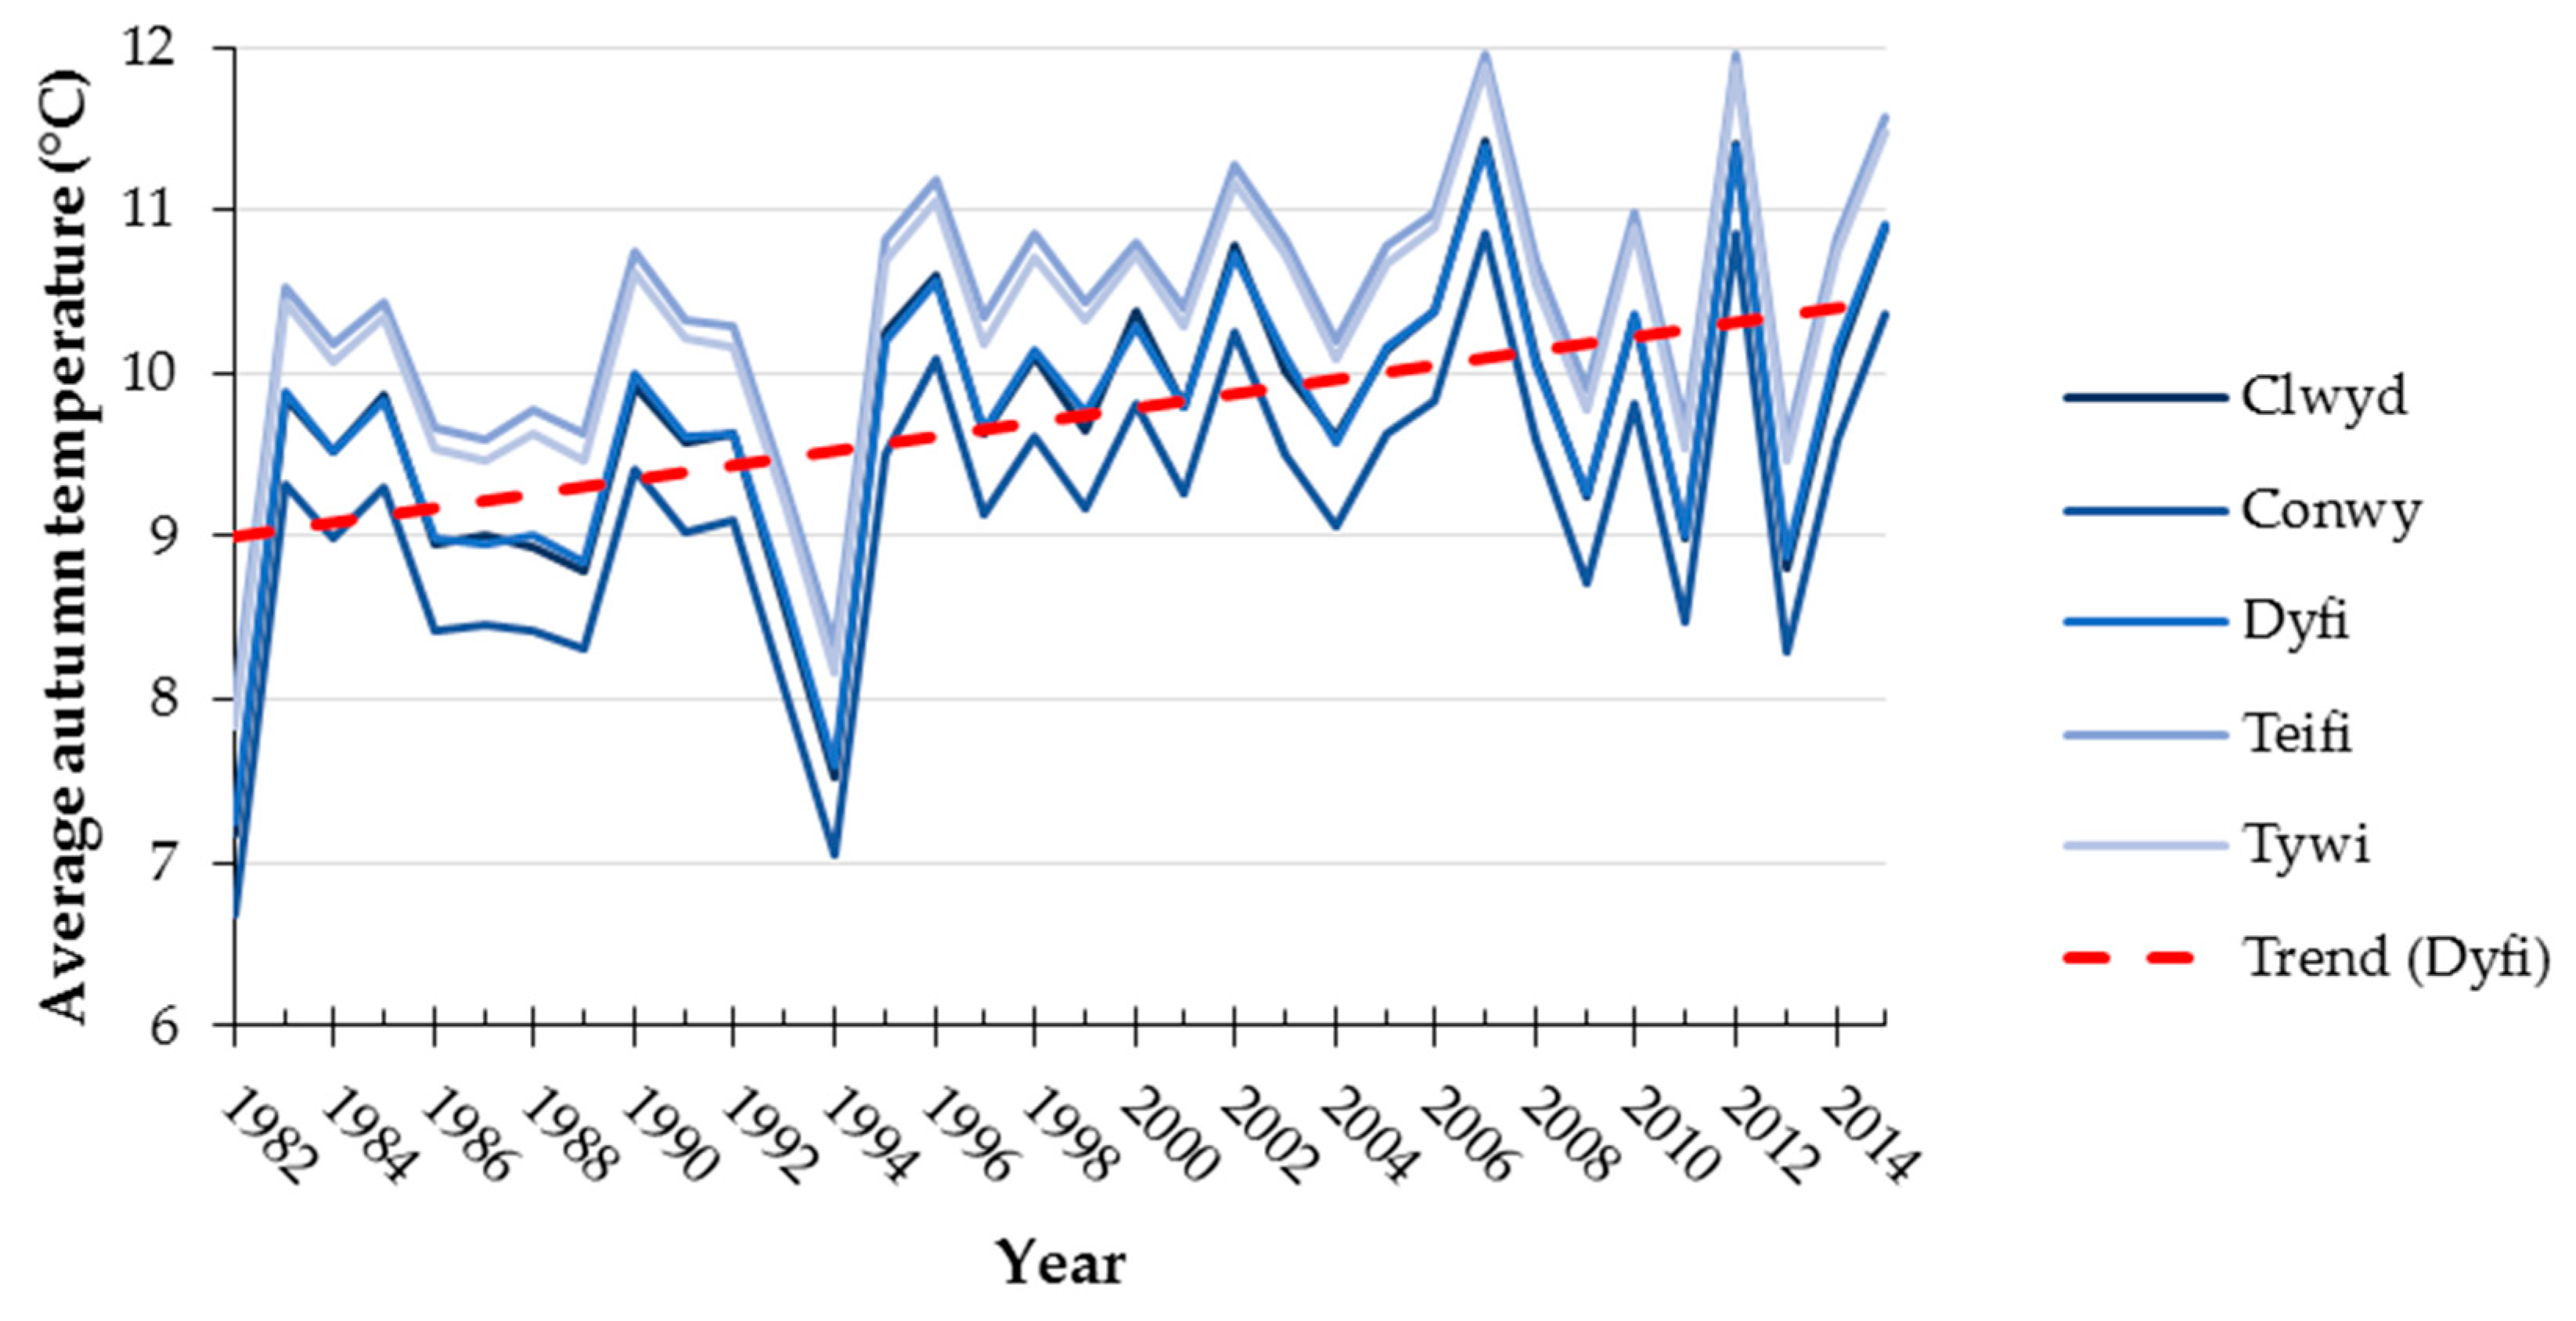
Unlike precipitation, air temperature data does display significant trends in Wales over the course of the study period. In all catchments, we observe a warming trend in average autumn temperature (Figure 2); the rate of increase is marginally higher in the two north Wales catchments compared to the two in the south of the country (Table 2). These findings correlate with both the Pettitt and SNHT breakpoint analysis in all catchments, which shows a step increase in autumn temperatures in 1994, with the percentage change in pre- and post-1994 mean temperatures being larger in the north (Table 3). We found no significant trends in the MK analysis of annual, winter, spring or summer datasets, however when looking at the breakpoint analysis, further changes are seen. In the two most northerly catchments, winter temperatures show a break and increase under SNHT analysis in 1987 (p = 0.042 & 0.048 for the Clwyd and Conwy respectively). All catchments also show a breakpoint increase in average spring temperatures in 1987 and annual average temperatures in 1988, both under SNHT analysis.
When looking at extreme temperature events, the three most southerly catchments, the Dyfi, Teifi and Tywi, display both a decrease in the number of hottest days annually (days above the whole dataset 95th percentile; Figure 3), as well as decrease in the number of coldest summer days (days below the summer dataset 5th percentile; Figure 4) across the period; suggesting a narrowing of temperature ranges, especially in summer. The Conwy catchment in the north also displays the latter trend of fewer of the coldest summer days (Table 4). This narrowing of temperature ranges has however, not been abrupt enough to cause a breakpoint in the data, with no significant changes seen.

3.1.3. Streamflow

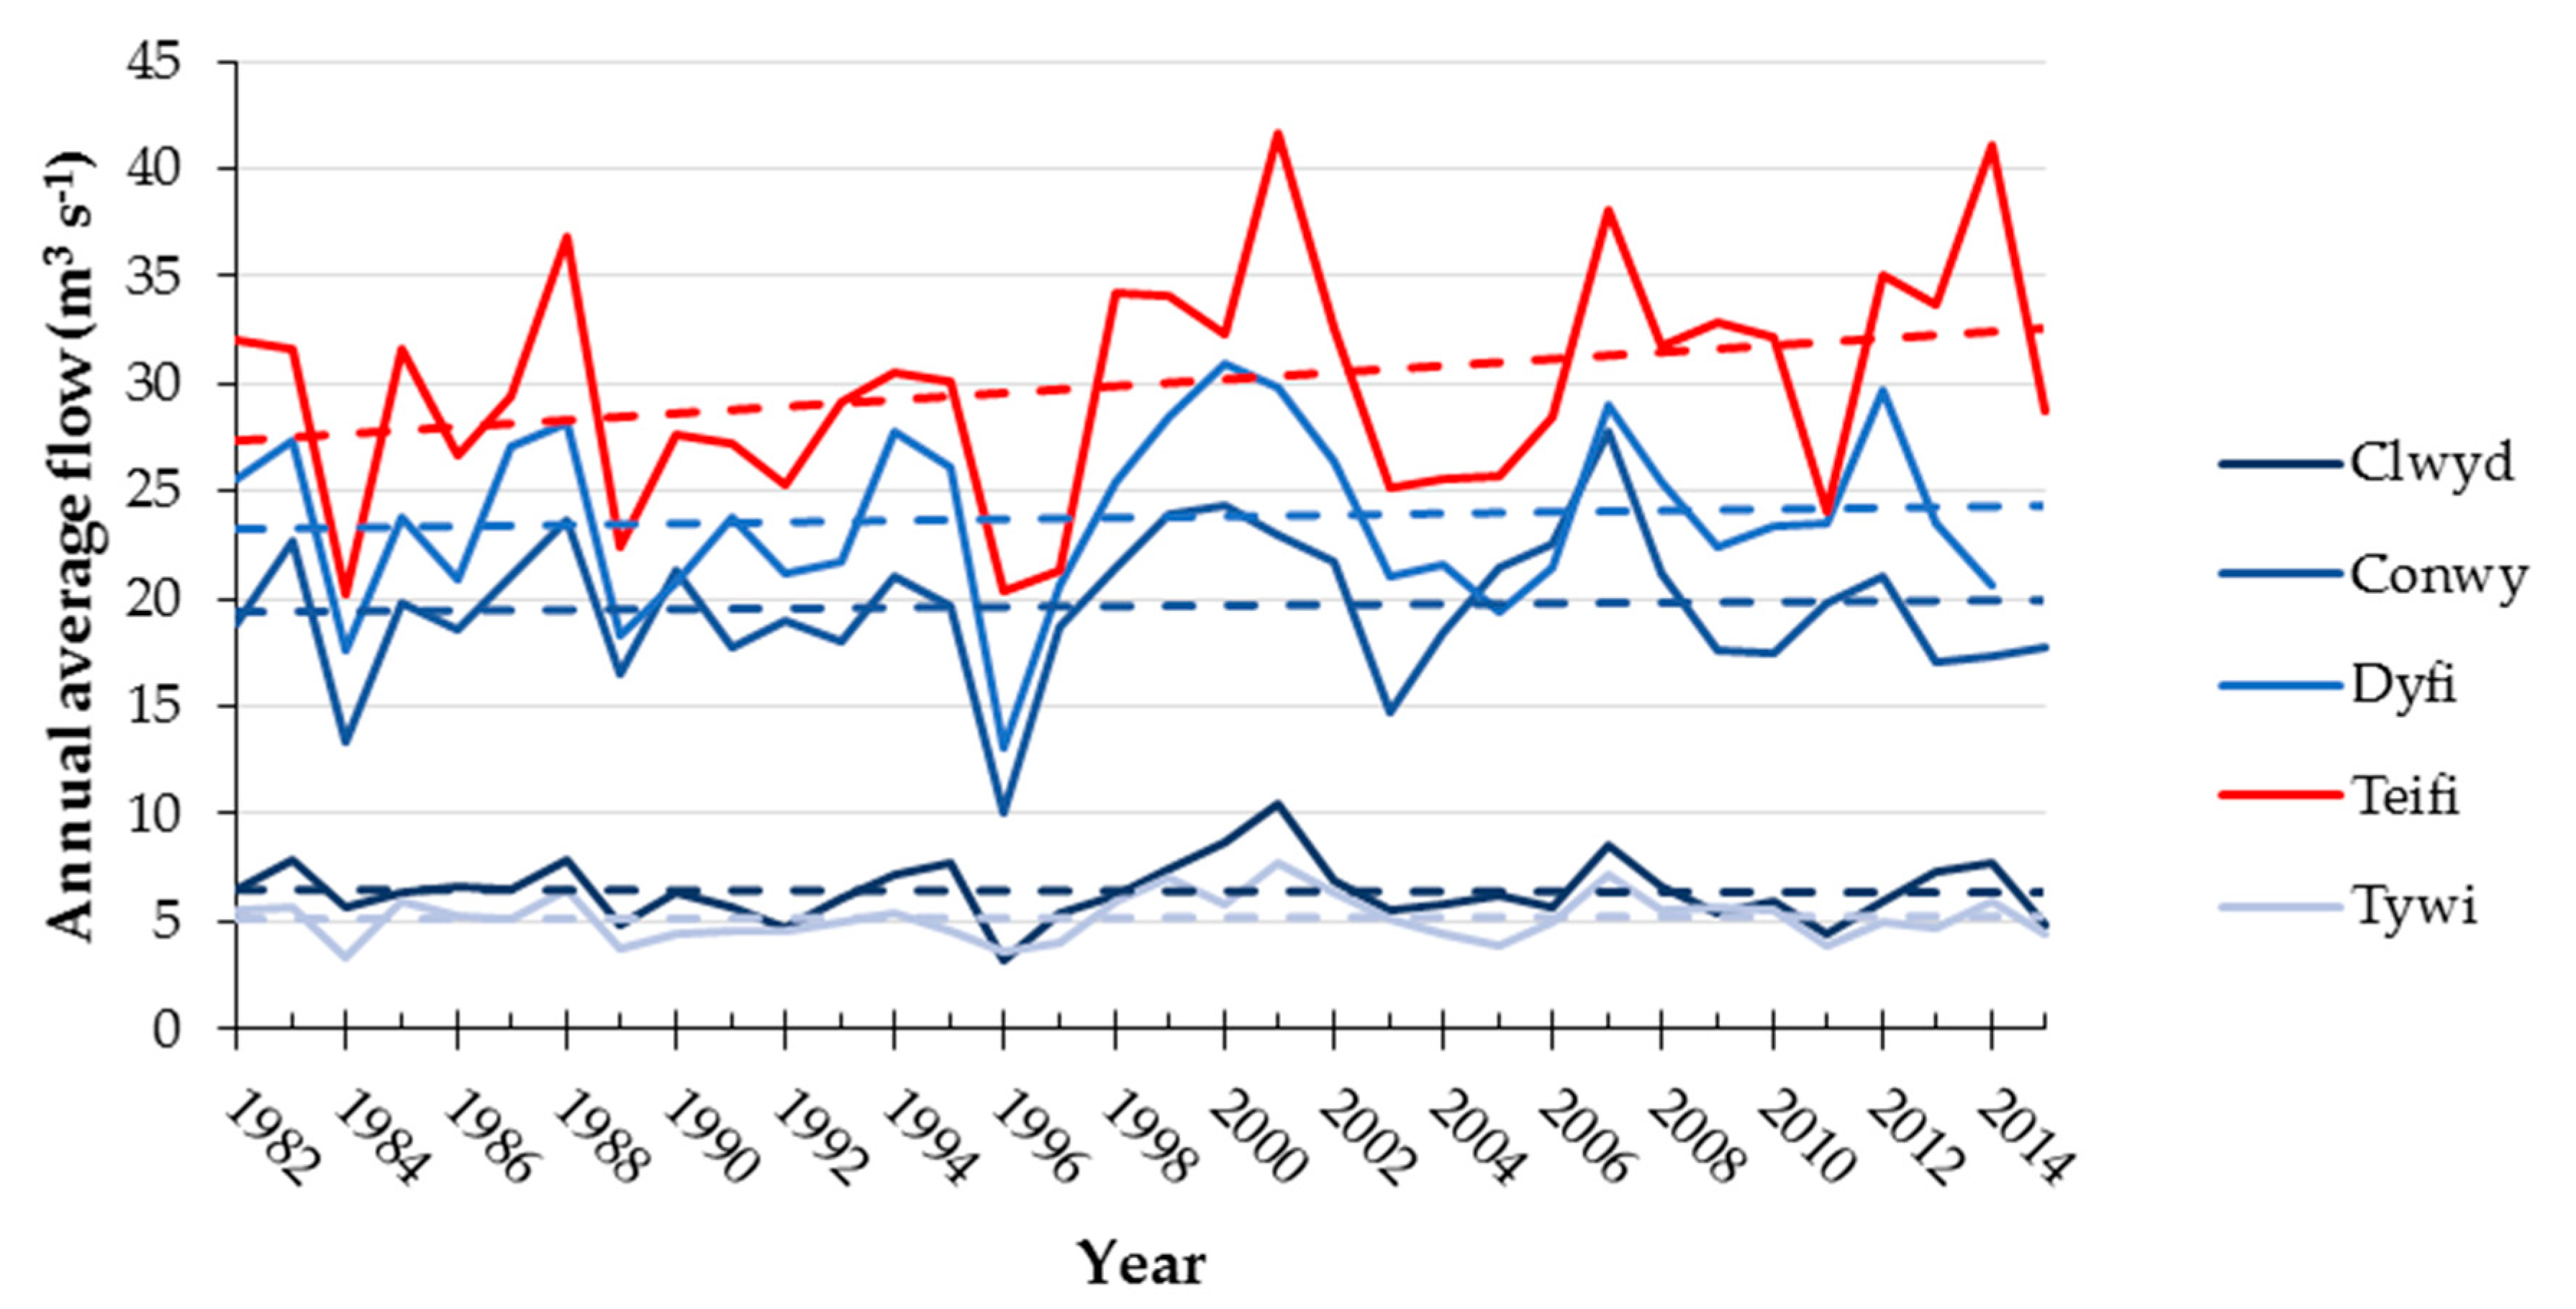
We observe only one statistically significant trend in seasonal and annual average streamflow data, this being in annual flows in the Teifi; here a significant increase in average annual flow (Figure 5) is detected over the study period (Tau = 0.240; Sen’s slope = 0.204; p = 0.044). The Teifi also shows the only observed breakpoint in the average flow data, that being a step increase in winter flow in 2013 (p = 0.019) the mean for the post 2013 period increasing by 63.0% compared to the pre-2013 period. We found various trends in terms of extreme events in streamflow in Wales (Table 5); once again the three most southerly catchments show similar trends, in this instance, an increase in volume of the annual and summer one day minimum flow volume. The Conwy shows an increase in winter minimum flow volume, along with an increase in the maximum summer flow, while the Clwyd displays an increase in annual maximum flow volume.

3.2. Correlation Analysis of Hydroclimatic and Abstraction Data

When looking at the daily actual abstraction data (1 January 2012 to 30 September 2015) under both correlation coefficient tests, all catchments display a positive relationship between air temperature and volume of water abstracted (Table 6), except for the Dyfi, which shows the reverse trend. All catchments, except the Dyfi, also show a statistically significant negative correlation between precipitation and volume of water abstracted, and consequently a negative relationship between streamflow and abstraction volume (Table 6). In order to investigate the situation for Wales as a whole, we have also included in Table 6 the correlation results for total daily and monthly abstraction volume in all five catchments with average daily/monthly temperature, total daily/monthly rainfall volume, and total daily/monthly streamflow volume, for all five catchments combined. The correlations seen in this dataset are consistent with those seen in most individual catchments. In addition, all catchments also display a positive relationship between streamflow and precipitation, and a negative one between streamflow and air temperature.
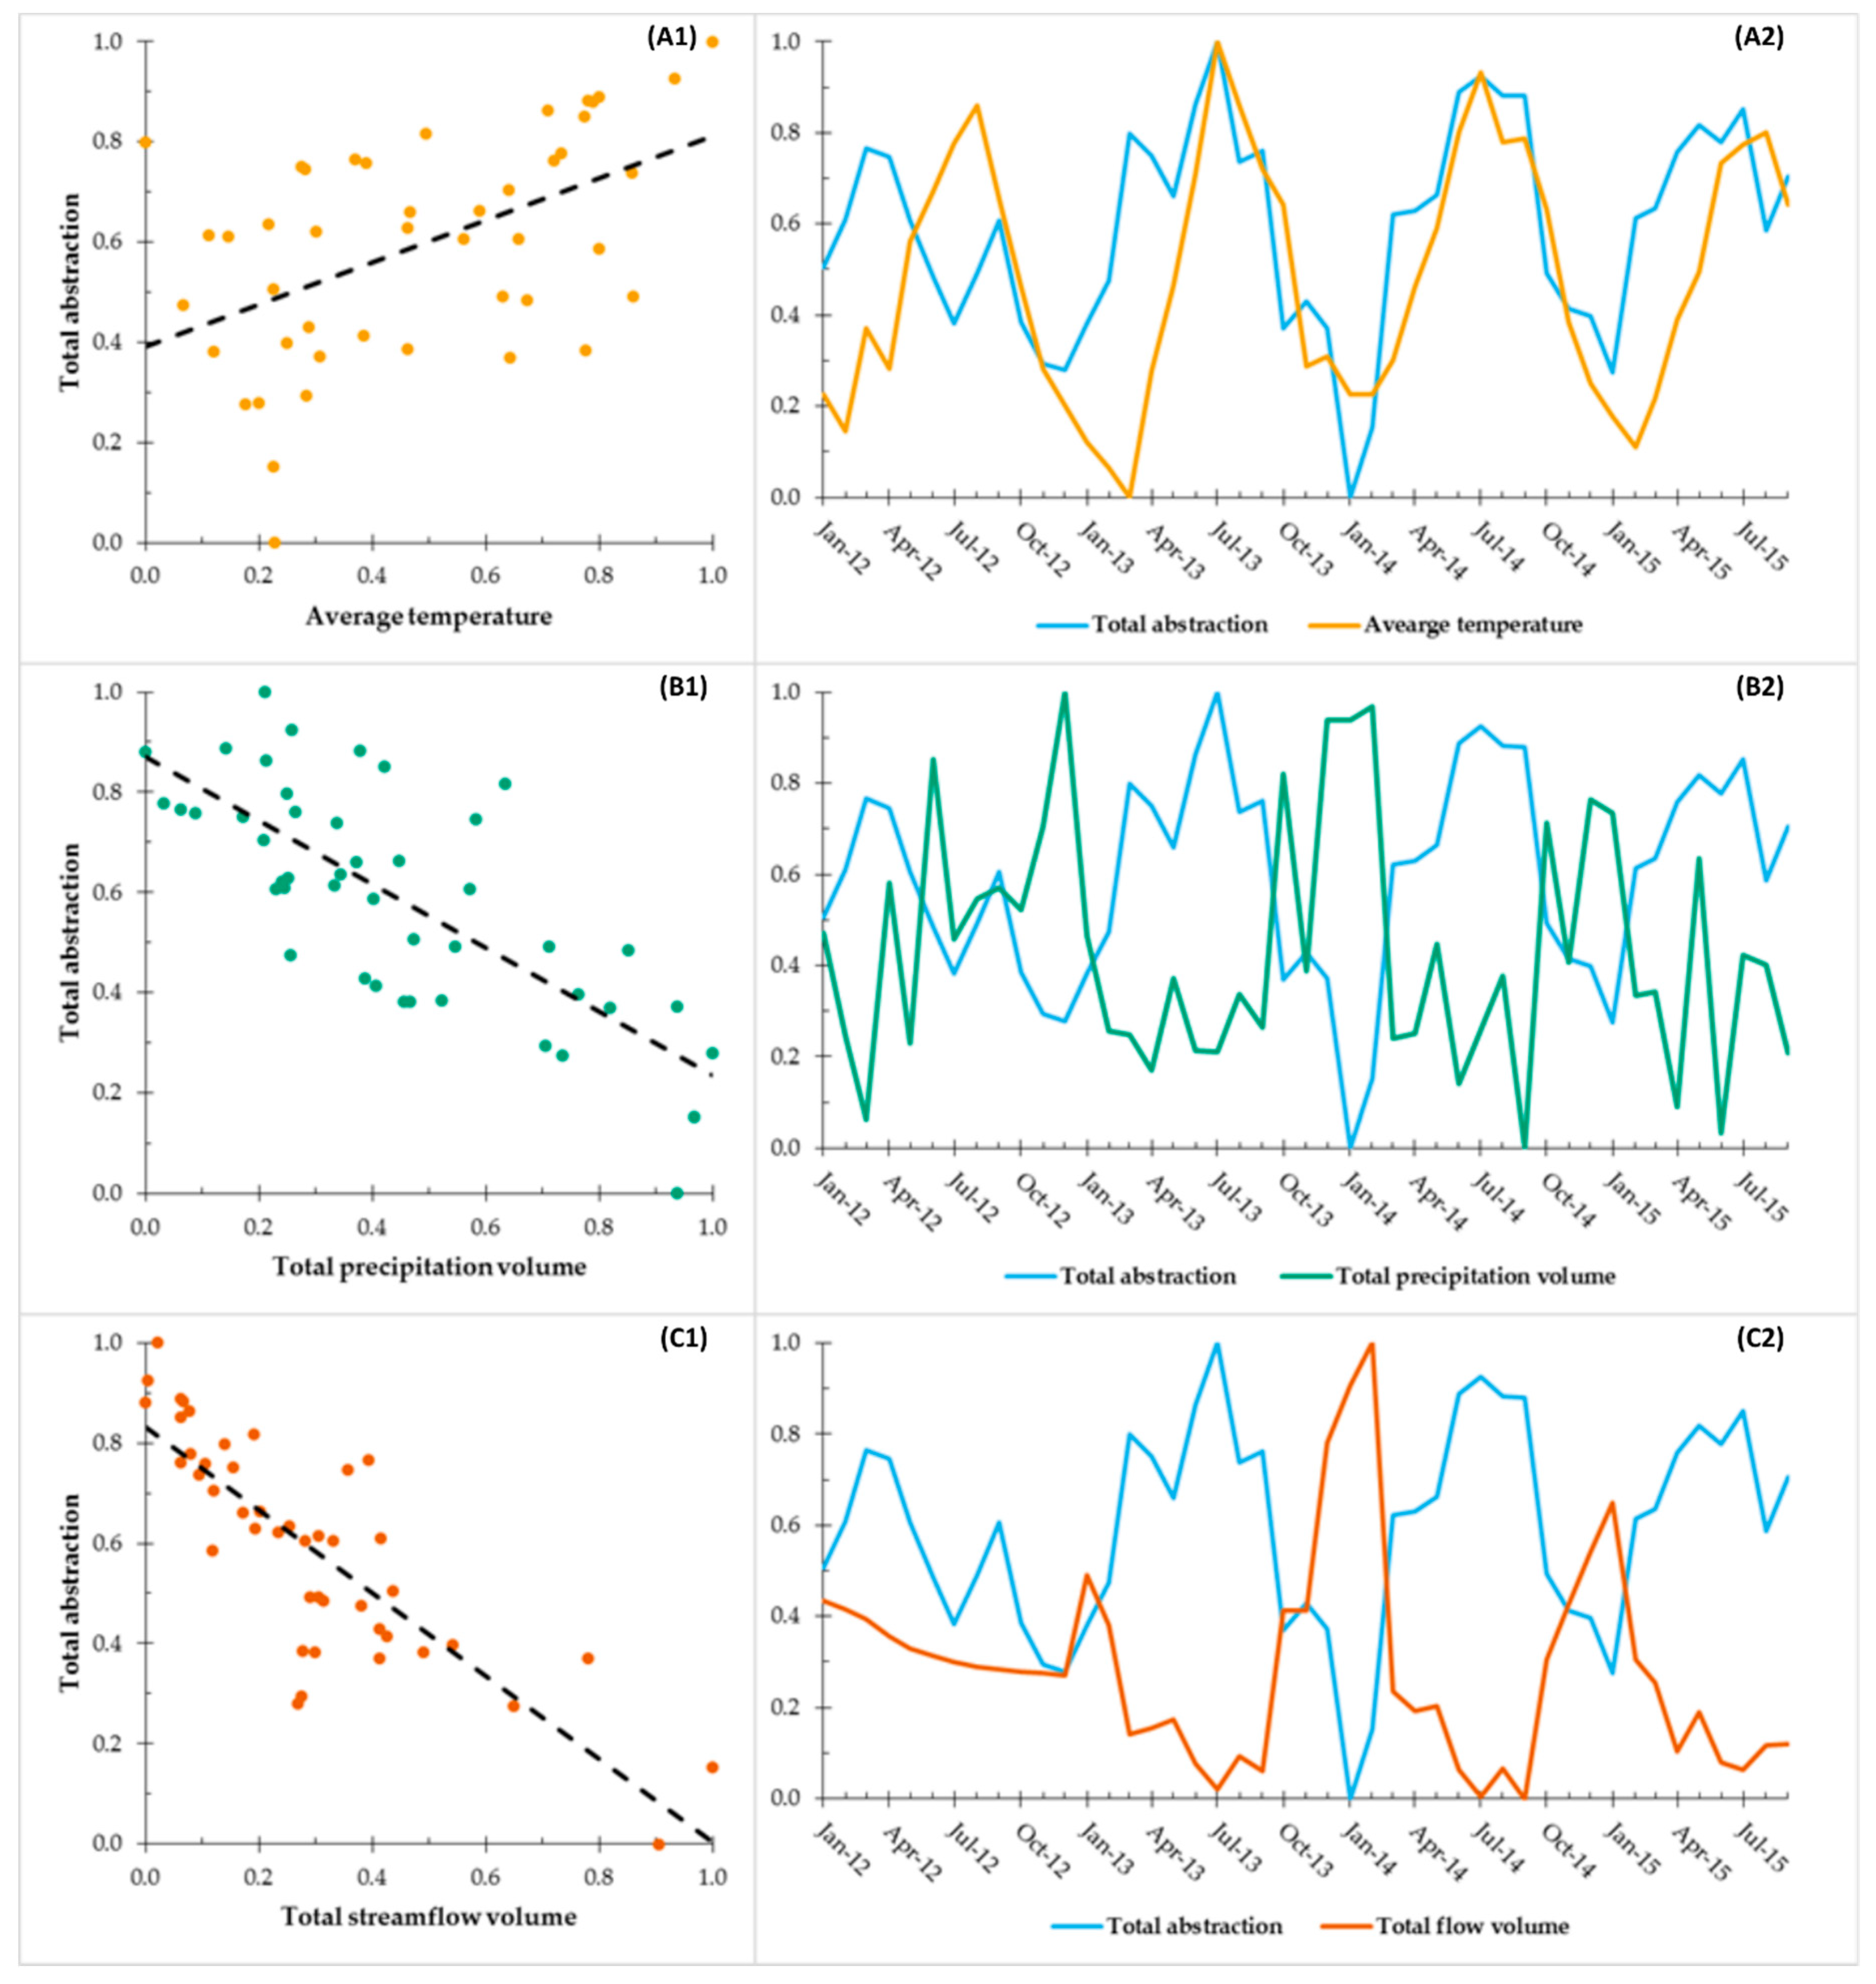
Figure 6 shows the aforementioned combined data at a daily time-step from all catchments which has been normalized to each factor’s maximum and minimum dataset value. Clear relationships between the hydroclimatic factors and actual abstraction data are observed. When looking at temperature, a positive correlation can be seen in the scatter plot, while the time series plot clearly also shows a large amount of consistency between the average temperature and total water abstraction volume. Arguably the clearest trend seen in the scatter plots is total streamflow volume and total actual abstraction volume, showing a negative correlation. This can also be seen in the time series plot that clearly shows drops in abstraction volume at times of largest flow volumes. Generally, the weakest correlations shown in Table 6 relate to precipitation and actual abstraction, the same is true for the graphs presented in Figure 6. Although peaks in precipitation do tend to coincide with a drop in abstraction, there is much more noise in the precipitation dataset, which makes these relationships more difficult to pinpoint.
The correlations and relationships seen in the daily data are made more evident when looking at the combined normalized monthly data, as shown in Figure 7. Clear negative trends can be seen between total abstraction volume with both total precipitation and total streamflow volume, when looking at scatter and time series line graphs. Clear peaks in abstraction can be seen at time of lowest streamflow and precipitation levels, and vice versa. Temperature and total abstraction are shown to also be broadly in-line when looking at the time series plot, with a clear positive trend shown when looking at the scatter data.

4. Discussion

4.1. Hydroclimatic Trends

The results of the trend, breakpoint, and correlation analyses, show a selection of spatially varying changes across the five catchments over the 34-year study period. Wales has a maritime climate which is strongly influenced by the North Atlantic Oscillation (NAO), a major cause of atmospheric circulation variability in the north Atlantic region [20,56]. This is important to consider when analyzing changes that have occurred across all catchments. NAO displays year-to-year and longer-term variability, therefore breakpoints in temperature, precipitation, and streamflow data that occur across all five catchments and likely to be rooted in changes in NAO. However, when explaining changes that affect a subset of the catchments, it is likely that catchment characteristics in terms of topography, LULC and surrounding landscapes have had an impact by interacting with these large scale meteorological processes [57]. The breakpoint analysis is a prime example of this interplay, a combination of NAO, climate change and other non-climate/weather related changes at a catchment and national level are likely to have impacted on the climatology breaks shown. No single factor accounts for all of breaks shown across the catchments. While a change in NAO is likely to have been a key driver, other factors such as LULC change and climate variations may well have had an impact on spreading the breakpoints out over the range of approximately 7 years shown (1987–1994).
When looking at both temperature and streamflows, a north-south divide in results can often be seen. Taking the extreme events results for streamflows as an example, it can be seen that in the two northerly catchments, the Clwyd and Conwy, the largest annual one-day discharge events have become larger over the study period. Meanwhile the two most southerly catchments, the Teifi and Tywi, have seen the smallest one-day flow values becoming larger, in particular when looking annually and at summer flows. These results are consistent with the findings of Dixon et al. [20] who showed that in the period 1977–2001, summer minimum flow volume values had increased significantly in south Wales catchments, but not the north—mainly due to the more mountainous terrain of north Wales (Figure 1). Furthermore, increases in the lowest summer flow values were also seen in Osborn and Hulme [58], and were linked to increased light summer rainfall over the period. The Dyfi catchment in mid-Wales shows a combination of these two patterns with maximum and minimum one day flows increasing in the summer and annually, showing a shift to generally wetter summers over the period, again corresponding to the reasoning and results put forward in Dixon et al. [20] for mid-Wales. These results are also consistent with the mean catchment slope data shown earlier (Table 2) with the Dyfi and Conwy in particular being the steepest catchments, and arguably the flashiest, of the five studied. This factor may well contribute to the increase in summer maximum flows observed over the study period.
It is interesting to note that the aforementioned changes in streamflows occur despite a lack of corresponding statistically significant change in annual or seasonal average precipitation, an observation also made by Macdonald et al. [29]. This mismatch of significant trends between precipitation volumes and streamflows is surprising, as the two factors are correlated significantly in all catchments, suggesting that flows in the catchments are highly sensitive to very small changes in precipitation. Similarly, the only significant trend seen in extreme precipitation events, a decreasing trend in cumulative spring rainfall in the Clwyd, does not relate to a corresponding change in average or extreme spring streamflows during the study period. Although not analyzed in this study, it is also possible that changing LULC during the study period could have had an effect on streamflows, independent of precipitation. Changes in agricultural land use in particular could have a large impact in the study catchments, affecting processes such as water infiltration and runoff [59]. Between the early 1980s and the late 2000s there was an increase in the amount of agricultural land classified as permanent grassland and rough grazing, despite overall agricultural land area remaining relatively stable [60]. From the late 2000s to present, the total amount of agricultural land has grown to its highest level since World War II, with the vast majority of this being for grazing [60]. Furthermore, forest cover has been continually increased throughout the study period, with greater planting taking place at the start of the study period and the rate steadily declining throughout [61]. Forested land also impacts on the connectivity of river flows and precipitation, with processes such as evapotranspiration and interception storage diverting water from, or delayed water reaching rivers [59]. This could once again explain some of the mismatch between significant precipitation and streamflow trends.
Changes in seasonal and annual averages, as well as extreme events are most observed in temperature, for the factors studied. Once again, a north-south divide can be seen in parts of these results, with the three southernmost catchments displaying a decrease in both the annual number of days that are hotter than the dataset 95th percentile, and the number of summer days that are colder than the dataset 5th percentile. These two changes suggest a narrowing of the temperature ranges in these catchments, with less extreme hot days annually and less extreme cold days in the summer. These findings are in line with wider UK research such as Dessai & Hulme [62] who showed, via the Central England Temperature record, that annual average summer temperatures increased between 1960–2007 when compared to a 1961–1990 mean. Nesbitt et al. [63] also presented a trend for summer days becoming warmer over the period 1954 to 2012 for south-east and south-central UK, as did Luterbacher et al. [64] for the period 1977 to 2003. Annual NAO index has been largely negative on average throughout the study period, especially so in the latter two thirds (Figure 8). Negative NAO has been linked to colder maximum temperatures [56], while climate change has been causing increasing summer temperatures on average. These two factors combined could be contributing to the narrowing temperature range observed, with NAO bringing down the maximum, and climate change bringing up the minimum. Furthermore, in all catchments, an increase in average autumn temperatures across the study period has been observed, with this being slightly more pronounced in the two north Wales catchments. All of the observed trends also fit with general UK observations of a greater degree of warming in the south of the country than the north, and the exacerbation of the temperature gradient between them. Furthermore, the north-south divide also fits when considering the surrounding geography of the catchments, the mountainous Snowdonia region lies just to the south of the two most northerly catchments, heavily influencing the climate here and causing local variation in the weather that is brought in from the Atlantic [20].

4.2. Weather and Demand for Water

When looking at the correlations between daily and monthly total abstraction data and hydroclimatic factors, it is clear that both average temperature and precipitation volume play a crucial role in influencing the total amount of water abstracted; volumes abstracted increasing in higher temperatures, and decreasing on wetter days. Given that the data takes account for total abstraction volume, these relationships are not surprising, as it is likely that on hotter days there will be both more domestic demand (more showers, car washing, garden watering etc.), as well as higher demand from agriculture, in particular for water for livestock in the catchments studied. The opposite is true for wetter days, which reduce the agricultural demand from public water supplies and reduce domestic demand, especially for water use on external areas of a property. These overall relationships do fit with other work that has sought to quantify the relationship between climate variables and domestic demand, both in the UK and abroad. Slavíková et al. [66] showed that in the Czech Republic, air temperature relative to the season average, accounted for the most variability in residential water consumption. Similarly in the UK, Goodchild [38] showed that domestic water demand in 41 houses in an Essex case study correlated with an R2 value of 0.44 with days when maximum temperatures were over 25 °C. Additionally, total daily sunshine hours were shown to have a stronger correlation with demand, having an R2 value of 0.53 [38]. Work by Xenochristou et al. [67] also found that sunshine hours and air temperature were the most influential weather variables on domestic demand, along with humidity.
However, using total abstraction volumes as a proxy for demand does present some challenges. For example, factors such as the usage of water internally, within water treatment works, as well as network water leakage, may mask or alter observed trends in the dataset. In addition, it is difficult to apportion the total abstraction volume to different user groups, such as domestic, industrial and agricultural on a daily basis. Furthermore, different user groups may have different relationships with weather conditions, for example Massoud et al. [68] showed for California’s Central Valley, that while agricultural demand increased in dryer years, precipitation volume had little impact on urban water demand. Additionally, we recognize that the comparison period between the hydroclimatic factors and abstraction data is relatively short in this study, at four years. This does not give the opportunity to investigate relationships such as the effect of prolonged drought on water use, or other longer terms patterns. Nevertheless, the overall abstraction data does give a baseline relationship to work with when considering the impact of future climate change on total water demand.

4.3. Study Implications

Our study has shown that the climate of Wales has changed since the early 1980s, and that this will have contributed to both the supply and demand of water in the region. On the basis of the results found, it is clear that these changes have been more keenly felt in terms of average air temperatures than precipitation volumes; this applies to both annual and seasonal averages as well as extreme events. When looking at the impact that these climatic changes have had on streamflows it can be seen that seasonal and annual average flows have remained largely unchanged, instead it is extreme flow events that have been more greatly affected. These changes occur with a north-south divide, with the largest annual flow events getting larger in the north, and the south becoming less dry in the summer when looking at the very lowest flows. These changes could have important impacts if they are continued into the future, with implications not only for water supply, but also in terms of water resource management, to prevent flooding and other related natural disasters. Furthermore, large industrial users as well as applications such as hydroelectric developments could be impacted by changes in river regime. In particular the viability of some small scale hydroelectric installations could be called in to question in some areas due to changing streamflow characteristics and flow duration curves, further emphasizing the importance of a solid understanding of the relationship between, and emerging trends in, hydroclimatic factors.
Climate change induced alterations in the future timing, quantity and quality of water available for supply, as well as policy relating to adaptation and management methods to cope with these predicted changes, needs to be further researched for Wales. In particular, hydrological modelling studies comparing current baseline streamflow (such as that presented in this paper) to future streamflow under various climate change scenarios, could prove to be particularly useful. This work is crucial to better inform future water supply-demand dynamic assessments, water resource management, and adaption planning. This is especially true if projected increases in the reoccurrence, duration, and intensity of extreme events under future climate change, as suggested in other research [69,70,71,72,73], are correct. This suggested research would also go some way to addressing some of the aforementioned priority research questions laid out in Brown et al. [1]; but must however also keep in mind the cost and practicality of adaptation measures, in order to ensure both a continued unbroken water supply service, and affordable water for all. More broadly, this research has shown the need to research and understand historical trends and future projections of hydroclimatic factors at local, catchment levels. This is clear when looking at the presented differences in observed trends seen over small spatial distances, due to changing land characteristics, and it is these nuances that are vital to incorporate in to future planning for any industry that relies on surface water abstraction.

5. Conclusions

This research has highlighted the potential for water scarcity problems even in a relatively water-rich region such as Wales. For example, with observed trends such as warmer average autumn temperatures providing for potentially greater water use in the season, the pressures on summer water supply could in the future extend further into the autumn. Although potentially increased demand could be countered by a trend of the largest discharge events becoming larger in the north of Wales, and summers becoming less dry in the south of Wales, any increase in flow is of little use if the capacity to store this additional water is not sufficient to make use of it.
Finally, we suggest that further research should focus on how future climate change will affect the relationship between weather factors, streamflow, and water demand, both in Wales and globally. For example, research concerning “trigger temperatures” for significant increases in water use, or the effect of long-term higher than averages temperatures on water demand, would aid understanding of the finer detail of the dynamic between hydroclimatic factors and total water abstracted. We also hope that this paper will set a frame onto which future climate change research focusing on surface waters, and the future provision of water services can be built; being one of the first steps in securing the long-term sustainability of water supply services in the region and further afield.

Author Contributions

Conceptualization, R.J.H.D., S.D.P. and A.P.W.; Data curation, R.J.H.D.; Formal analysis, R.J.H.D.; Investigation, R.J.H.D.; Methodology, R.J.H.D.; Supervision, S.D.P. and A.P.W.; Writing—original draft, R.J.H.D.; Writing—review & editing, S.D.P. and A.P.W. All authors have read and agreed to the published version of the manuscript.

Funding

This study was conducted as part of the Dŵr Uisce project, which aims at improving the long-term sustainability of water supply, treatment and end-use in Ireland and Wales. The project has been supported by the European Regional Development Fund (ERDF) through the Interreg Ireland-Wales Co-operation Programme 2014-2020. The work has been used as a case study for Dŵr Uisce Work Package 7 “Climate Change”, and forms part of a study assessing the impact of future climate change on water supply in Wales.

Acknowledgments

The authors would like to thank Dŵr Cymru Welsh Water for the provision of actual abstraction volume data for the catchments studied. We also thank two anonymous reviewers for their comments and helpful suggestions, which have improved the paper.

Conflicts of Interest

The authors declare no conflict of interest.

References

  1. Brown, L.E.; Mitchell, G.; Holden, J.; Folkard, A.; Wright, N.; Beharry-Borg, N.; Berry, G.; Brierley, B.; Chapman, P.; Clarke, S.J.; et al. Priority water research questions as determined by UK practitioners and policy makers. Sci. Total. Environ. 2010, 409, 256–266. [Google Scholar] [CrossRef] [PubMed]
  2. Watts, G.; Battarbee, R.W.; Bloomfield, J.P.; Crossman, J.; Daccache, A.; Durance, I.; Elliott, J.A.; Garner, G.; Hannaford, J.; Hannah, D.M.; et al. Climate change and water in the UK–Past changes and future prospects. Prog. Phys. Geogr. 2015, 39, 6–28. [Google Scholar] [CrossRef]
  3. Suggitt, A.; Maclean, I.; Critchlow, R.; Beale, C.; Rowcroft, P.; White, C. Aggregate Assessment of Climate Change Impacts on the Goods and Benefits Provided by the UK’s Natural Assets; AECOM Limited: London, UK, 2015. [Google Scholar]
  4. Whitehead, P.G.; Wilby, R.L.; Battarbee, R.W.; Kernan, M.; Wade, A. A review of the potential impacts of climate change on surface water quality. Hydrol. Sci. J. 2009, 54, 101–123. [Google Scholar] [CrossRef]
  5. Christierson, B.V.; Vidal, J.-P.; Wade, S.D. Using UKCP09 probabilistic climate information for UK water resource planning. J. Hydrol. 2012, 424–425, 48–67. [Google Scholar] [CrossRef] [Green Version]
  6. Prudhomme, C.; Young, A.; Watts, G.; Haxton, T.; Crooks, S.; Williamson, J.; Davies, H.; Dadson, S.; Allen, S. The drying up of Britain? A national estimate of changes in seasonal river flows from 11 Regional Climate Model simulations. Hydrol. Process. 2012, 26, 1115–1118. [Google Scholar] [CrossRef] [Green Version]
  7. Mayes, J. Changing regional climatic gradients in the United Kingdom. Geogr. J. 2000, 166, 125–138. [Google Scholar] [CrossRef]
  8. Diaz-Nieto, J.; Wilby, R.L. A comparison of statistical downscaling and climate change factor methods: Impacts on low flows in the River Thames, United Kingdom. Clim. Chang. 2005, 69, 245–268. [Google Scholar] [CrossRef]
  9. Wilby, R.L.; Harris, I. A framework for assessing uncertainties in climate change impacts: Low-flow scenarios for the River Thames, UK. Water Resour. Res. 2006, 42, 02419. [Google Scholar] [CrossRef]
  10. Wilby, R.L.; Whitehead, P.G.; Wade, A.J.; Butterfield, D.; Davis, R.J.; Watts, G. Integrated modelling of climate change impacts on water resources and quality in a lowland catchment: River Kennet, UK. J. Hydrol. 2006, 330, 204–220. [Google Scholar] [CrossRef]
  11. Arnell, N.W. Incorporating climate change into water resources planning in England and wales. J. Am. Water Resour. Assoc. 2011, 47, 541–549. [Google Scholar] [CrossRef]
  12. Cloke, H.L.; Jeffers, C.; Wetterhall, F.; Byrne, T.; Lowe, J.; Pappenberger, F. Climate impacts on river flow: Projections for the Medway catchment, UK, with UKCP09 and CATCHMOD. Hydrol. Process. 2010, 24, 3476–3489. [Google Scholar] [CrossRef]
  13. Whitehead, P.G.; Crossman, J.; Balana, B.B.; Futter, M.; Comber, S.; Jin, L.; Skuras, D.; Wade, A.J.; Bowes, M.J.; Read, D.S. A cost-effectiveness analysis of water security and water quality: Impacts of climate and land-use change on the River Thames system. Philos. Trans. R. Soc. A Math. Phys. Eng. Sci. 2013, 371, 20120413. [Google Scholar] [CrossRef] [PubMed] [Green Version]
  14. Borgomeo, E.; Hall, J.W.; Fung, F.; Watts, G.; Colquhoun, K.; Lambert, C. Risk-based water resources planning: Incorporating probabilistic nonstationary climate uncertainties. Water Resour. Res. 2014, 50, 6850–6873. [Google Scholar] [CrossRef]
  15. Capell, R.; Tetzlaff, D.; Soulsby, C. Will catchment characteristics moderate the projected effects of climate change on flow regimes in the Scottish Highlands? Hydrol. Process. 2013, 27, 687–699. [Google Scholar] [CrossRef]
  16. Capell, R.; Tetzlaff, D.; Essery, R.; Soulsby, C. Projecting climate change impacts on stream flow regimes with tracer-aided runoff models-preliminary assessment of heterogeneity at the mesoscale. Hydrol. Process. 2014, 28, 545–558. [Google Scholar] [CrossRef]
  17. Baggaley, N.J.; Langan, S.J.; Futter, M.N.; Potts, J.M.; Dunn, S.M. Long-term trends in hydro-climatology of a major Scottish mountain river. Sci. Total. Environ. 2009, 407, 4633–4641. [Google Scholar] [CrossRef]
  18. Blenkinsop, S.; Fowler, H.J. Changes in drought frequency, severity and duration for the British Isles projected by the PRUDENCE regional climate models. J. Hydrol. 2007, 342, 50–71. [Google Scholar] [CrossRef]
  19. Fowler, H.J.; Wilby, R.L. Detecting changes in seasonal precipitation extremes using regional climate model projections: Implications for managing fluvial flood risk. Water Resour. Res. 2010, 46, 03525. [Google Scholar] [CrossRef] [Green Version]
  20. Dixon, H.; Lawler, D.M.; Shamseldin, A.Y. Streamflow trends in western Britain. Geophys. Res. Lett. 2006, 33, 19406. [Google Scholar] [CrossRef]
  21. Thompson, J.R.; Iravani, H.; Clilverd, H.M.; Sayer, C.D.; Heppell, C.M.; Axmacher, J.C. Simulation of the hydrological impacts of climate change on a restored floodplain. Hydrol. Sci. J. 2017, 62, 2482–2510. [Google Scholar] [CrossRef] [Green Version]
  22. MET Office. UK Climate Averages. Available online: http://www.metoffice.gov.uk/public/weather/climate#?region=wales (accessed on 28 May 2020).
  23. DCWW. Trading and Procurement Code; Dŵr Cymru Welsh Water: Treharris, Wales, 2016. [Google Scholar]
  24. Warren, A.J.; Holman, I. Evaluating the effects of climate change on the water resources for the city of Birmingham, UK. Water Environ. J. 2012, 26, 361–370. [Google Scholar] [CrossRef] [Green Version]
  25. Prudhomme, C.; Jakob, D.; Svensson, C. Uncertainty and climate change impact on the flood regime of small UK catchments. J. Hydrol. 2003, 277, 1–23. [Google Scholar] [CrossRef]
  26. Hannaford, J. Climate-driven changes in UK river flows: A review of the evidence. Prog. Phys. Geogr. 2015, 39, 29–48. [Google Scholar] [CrossRef] [Green Version]
  27. Burt, T.P.; Howden, N.J.K.; Worrall, F. The changing water cycle: Hydroclimatic extremes in the British Isles. Wiley Interdiscip. Rev. Water 2016, 3, 854–870. [Google Scholar] [CrossRef] [Green Version]
  28. Henriques, C.; Garnett, K.; Weatherhead, E.K.; Lickorish, F.A.; Forrow, D.; Delgado, J. The future water environment—Using scenarios to explore the significant water management challenges in England and Wales to 2050. Sci. Total Environ. 2015, 512–513, 381–396. [Google Scholar] [CrossRef] [PubMed]
  29. Macdonald, N.; Phillips, I.D.; Mayle, G. Spatial and temporal variability of flood seasonality in Wales. Hydrol. Process. 2010, 24, 1806–1820. [Google Scholar] [CrossRef]
  30. NIC. Preparing for a Drier Future: England’s Water Infrastructure Needs; National Infrastructure Committee: London, UK, 2018.
  31. Butler, D.; Memon, F. Water Demand Management, 1st ed.; IWA Publishing: London, UK, 2006. [Google Scholar]
  32. Herrington, P.R. Climate Change and the Demand for Water; Her Majesty’s Stationery Office: London, UK, 1996. [Google Scholar]
  33. Downing, T.E.; Butterfield, R.E.; Edmunds, B.; Knox, J.W.; Moss, S.; Piper, B.S.; Weaterhead, E.K. Climate Change and Demand for Water; Stockholm Environment Institute: Oxford, UK, 2003. [Google Scholar]
  34. Browne, A.; Medd, W.; Anderson, B. Developing novel approaches to tracking domestic water demand under uncertainty—A reflection on the “up scaling” of social science approaches in the United Kingdom. Water Resour. Manag. 2013, 27, 1037–1038. [Google Scholar] [CrossRef] [Green Version]
  35. Balling, R.C.; Gober, P. Climate variability and residential water use in the city of Phoenix, Arizona. J. Appl. Meteorol. Climatol. 2007, 46, 1130–1137. [Google Scholar] [CrossRef]
  36. Gutzler, D.S.; Nims, J.S. Interannual variability of water demand and summer climate in Albuquerque, New Mexico. J. Appl. Meteorol. 2005, 44, 1777–1787. [Google Scholar] [CrossRef]
  37. Chang, H.; Praskievicz, S.; Parandvash, H. Sensitivity of urban water consumption to weather and climate variability at multiple temporal scales: The case of Portland, Oregon. Int. J. Geospat. Environ. Res. 2014, 1, 7. [Google Scholar]
  38. Goodchild, C.W. Modelling the impact of climate change on domestic water demand. Water Environ. J. 2003, 17, 8–12. [Google Scholar] [CrossRef]
  39. Parker, J.; Wilby, R.L. Quantifying household water demand: A review of theory and practice in the UK. Water Resour. Manag. 2013, 27, 981–1011. [Google Scholar] [CrossRef] [Green Version]
  40. Mann, H.B. Nonparametric Tests Against Trend. Econometrica 1945, 13, 245–259. [Google Scholar] [CrossRef]
  41. Kendall, M.G. Rank Correlation Methods, 3rd ed.; Griffin Publishers: London, UK, 1975. [Google Scholar]
  42. Kundzewics, Z.W.; Robson, A.J. Change detection in hydrological records-A review of the methodology. Hydrol. Sci. J. 2004, 49, 7–19. [Google Scholar] [CrossRef]
  43. Hamed, K.H.; Ramachandra Rao, A. A modified Mann-Kendall trend test for autocorrelated data. J. Hydrol. 1998, 204, 182–196. [Google Scholar] [CrossRef]
  44. Helsel, D.R.; Hirsch, R.M. Statistical Methods in Water Resources; United States Geological Survey: Reston, VA, USA, 2002.
  45. Mwangi, H.M.; Julich, S.; Patil, S.D.; McDonald, M.A.; Feger, K.-H. Relative contribution of land use change and climate variability on discharge of upper Mara River, Kenya. J. Hydrol. Reg. Stud. 2016, 5, 244–260. [Google Scholar] [CrossRef] [Green Version]
  46. Murphy, C.; Harrigan, S.; Hall, J.; Wilby, R.L. Climate-driven trends in mean and high flows from a network of reference stations in Ireland. Hydrol. Sci. J. 2013, 58, 755–772. [Google Scholar] [CrossRef]
  47. Basarin, B.; Lukić, T.; Pavić, D.; Wilby, R.L. Trends and multi-annual variability of water temperatures in the river Danube, Serbia. Hydrol. Process. 2016, 30, 3315–3329. [Google Scholar] [CrossRef] [Green Version]
  48. Hajani, E.; Rahman, A.; Ishak, E. Trends in extreme rainfall in the state of New South Wales, Australia. Hydrol. Sci. J. 2017, 62, 2160–2174. [Google Scholar] [CrossRef]
  49. Jaiswal, R.K.; Lohani, A.K.; Tiwari, H.L. Statistical analysis for change detection and trend assessment in climatological parameters. Environ. Process. 2015, 2, 729–749. [Google Scholar] [CrossRef] [Green Version]
  50. Sen, P.K. Estimates of the regression coefficient based on Kendall’s Tau. J. Am. Stat. Assoc. 1968, 63, 1379. [Google Scholar] [CrossRef]
  51. Alexandersson, H. A homogeneity test applied to precipitation data. J. Climatol. 1986, 6, 661–675. [Google Scholar] [CrossRef]
  52. Alexandersson, H.; Moberg, A. Homogenization of Swedish temperature data. Part I: Homogeneity test for linear trends. Int. J. Climatol. 1997, 17, 25–34. [Google Scholar] [CrossRef]
  53. Pettitt, A.N. A non-parametric approach to the change-point problem. J. R. Stat. Soc. Ser. C (Appl. Stat.) 1979, 28, 126. [Google Scholar] [CrossRef]
  54. Hänsel, S.; Medeiros, D.M.; Matschullat, J.; Petta, R.A.; de Mendonça Silva, I. Assessing homogeneity and climate variability of temperature and precipitation series in the capitals of North-Eastern Brazil. Front. Earth Sci. 2016, 4, 389. [Google Scholar] [CrossRef] [Green Version]
  55. Hawkins, D.M. Testing a sequence of observations for a shift in location. J. Am. Stat. Assoc. 1977, 72, 180–186. [Google Scholar] [CrossRef]
  56. Beranova, R.; Huth, R. Time variations of the relationships between the North Atlantic Oscillation and European winter temperature and precipitation. Stud. Geophys. Geod. 2007, 51, 575–590. [Google Scholar] [CrossRef]
  57. West, H.; Quinn, N.; Horswell, M. Regional rainfall response to the North Atlantic Oscillation (NAO) across Great Britain. Hydrol. Res. 2019, 50, 1549–1563. [Google Scholar] [CrossRef] [Green Version]
  58. Osborn, T.J.; Hulme, M. Evidence for trends in heavy rainfall events over the UK. Philos. Trans. R. Soc. London. Ser. A Math. Phys. Eng. Sci. 2002, 360, 1313–1325. [Google Scholar] [CrossRef]
  59. Wheater, H.; Evans, E. Land use, water management and future flood risk. Land Use Policy 2009, 26, S251–S264. [Google Scholar] [CrossRef]
  60. Welsh Government. June 2019 Survey of Agriculture and Horticulture: Results for Wales; Welsh Government: Cardiff, Wales, 2019.
  61. Welsh Government. Woodlands for Wales Indicators 2014-15; Welsh Government: Cardiff, Wales, 2015.
  62. Dessai, S.; Hulme, M. How do UK climate scenarios compare with recent observations? Atmos. Sci. Lett. 2008, 9, 189–195. [Google Scholar] [CrossRef]
  63. Nesbitt, A.; Kemp, B.; Steele, C.; Lovett, A.; Dorling, S. Impact of recent climate change and weather variability on the viability of UK viticulture-combining weather and climate records with producers’ perspectives. Aust. J. Grape Wine Res. 2016, 22, 324–335. [Google Scholar] [CrossRef] [Green Version]
  64. Luterbacher, J. European seasonal and annual temperature variability, trends, and extremes since 1500. Science 2004, 303, 1499–1503. [Google Scholar] [CrossRef] [PubMed] [Green Version]
  65. Osborn, T.J. Winter 2009/2010 temperatures and a record-breaking North Atlantic Oscillation index. Weather 2011, 66, 19–21. [Google Scholar] [CrossRef]
  66. Slavíková, L.; Malý, V.; Rost, M.; Petružela, L.; Vojáček, O. Impacts of climate variables on residential water consumption in the Czech Republic. Water Resour. Manag. 2013, 27, 365–379. [Google Scholar] [CrossRef]
  67. Xenochristou, M.; Kapelan, Z.; Hutton, C. Using smart demand-metering data and customer characteristics to investigate influence of weather on water consumption in the UK. J. Water Resour. Plan. Manag. 2020, 146, 04019073. [Google Scholar] [CrossRef]
  68. Massoud, E.C.; Purdy, A.J.; Miro, M.E.; Famiglietti, J.S. Projecting groundwater storage changes in California’s Central Valley. Sci. Rep. 2018, 8, 12917. [Google Scholar] [CrossRef]
  69. Met Office. UK Climate Projections: Headline Findings; Met Office: Exeter, UK, 2019.
  70. Betts, R.A.; Alfieri, L.; Bradshaw, C.; Caesar, J.; Feyen, L.; Friedlingstein, P.; Gohar, L.; Koutroulis, A.; Lewis, K.; Morfopoulos, C.; et al. Changes in climate extremes, fresh water availability and vulnerability to food insecurity projected at 1.5 °C and 2 °C global warming with a higher-resolution global climate model. Philos. Trans. R. Soc. A Math. Phys. Eng. Sci. 2018, 376, 20160452. [Google Scholar] [CrossRef] [PubMed]
  71. King, A.D.; Karoly, D.J. Climate extremes in Europe at 1.5 and 2 degrees of global warming. Environ. Res. Lett. 2017, 12, 114031. [Google Scholar] [CrossRef]
  72. Slingo, J. The Recent Storms and Floods in the UK; Met Office: Exeter, UK, 2014.
  73. Harkness, C.; Semenov, M.; Areal, F.; Senapati, N.; Trnka, M.; Balek, J.; Bishop, J. Adverse weather conditions for UK wheat production under climate change. Agric. For. Meteorol. 2020, 282–283, 107862. [Google Scholar] [CrossRef] [PubMed]
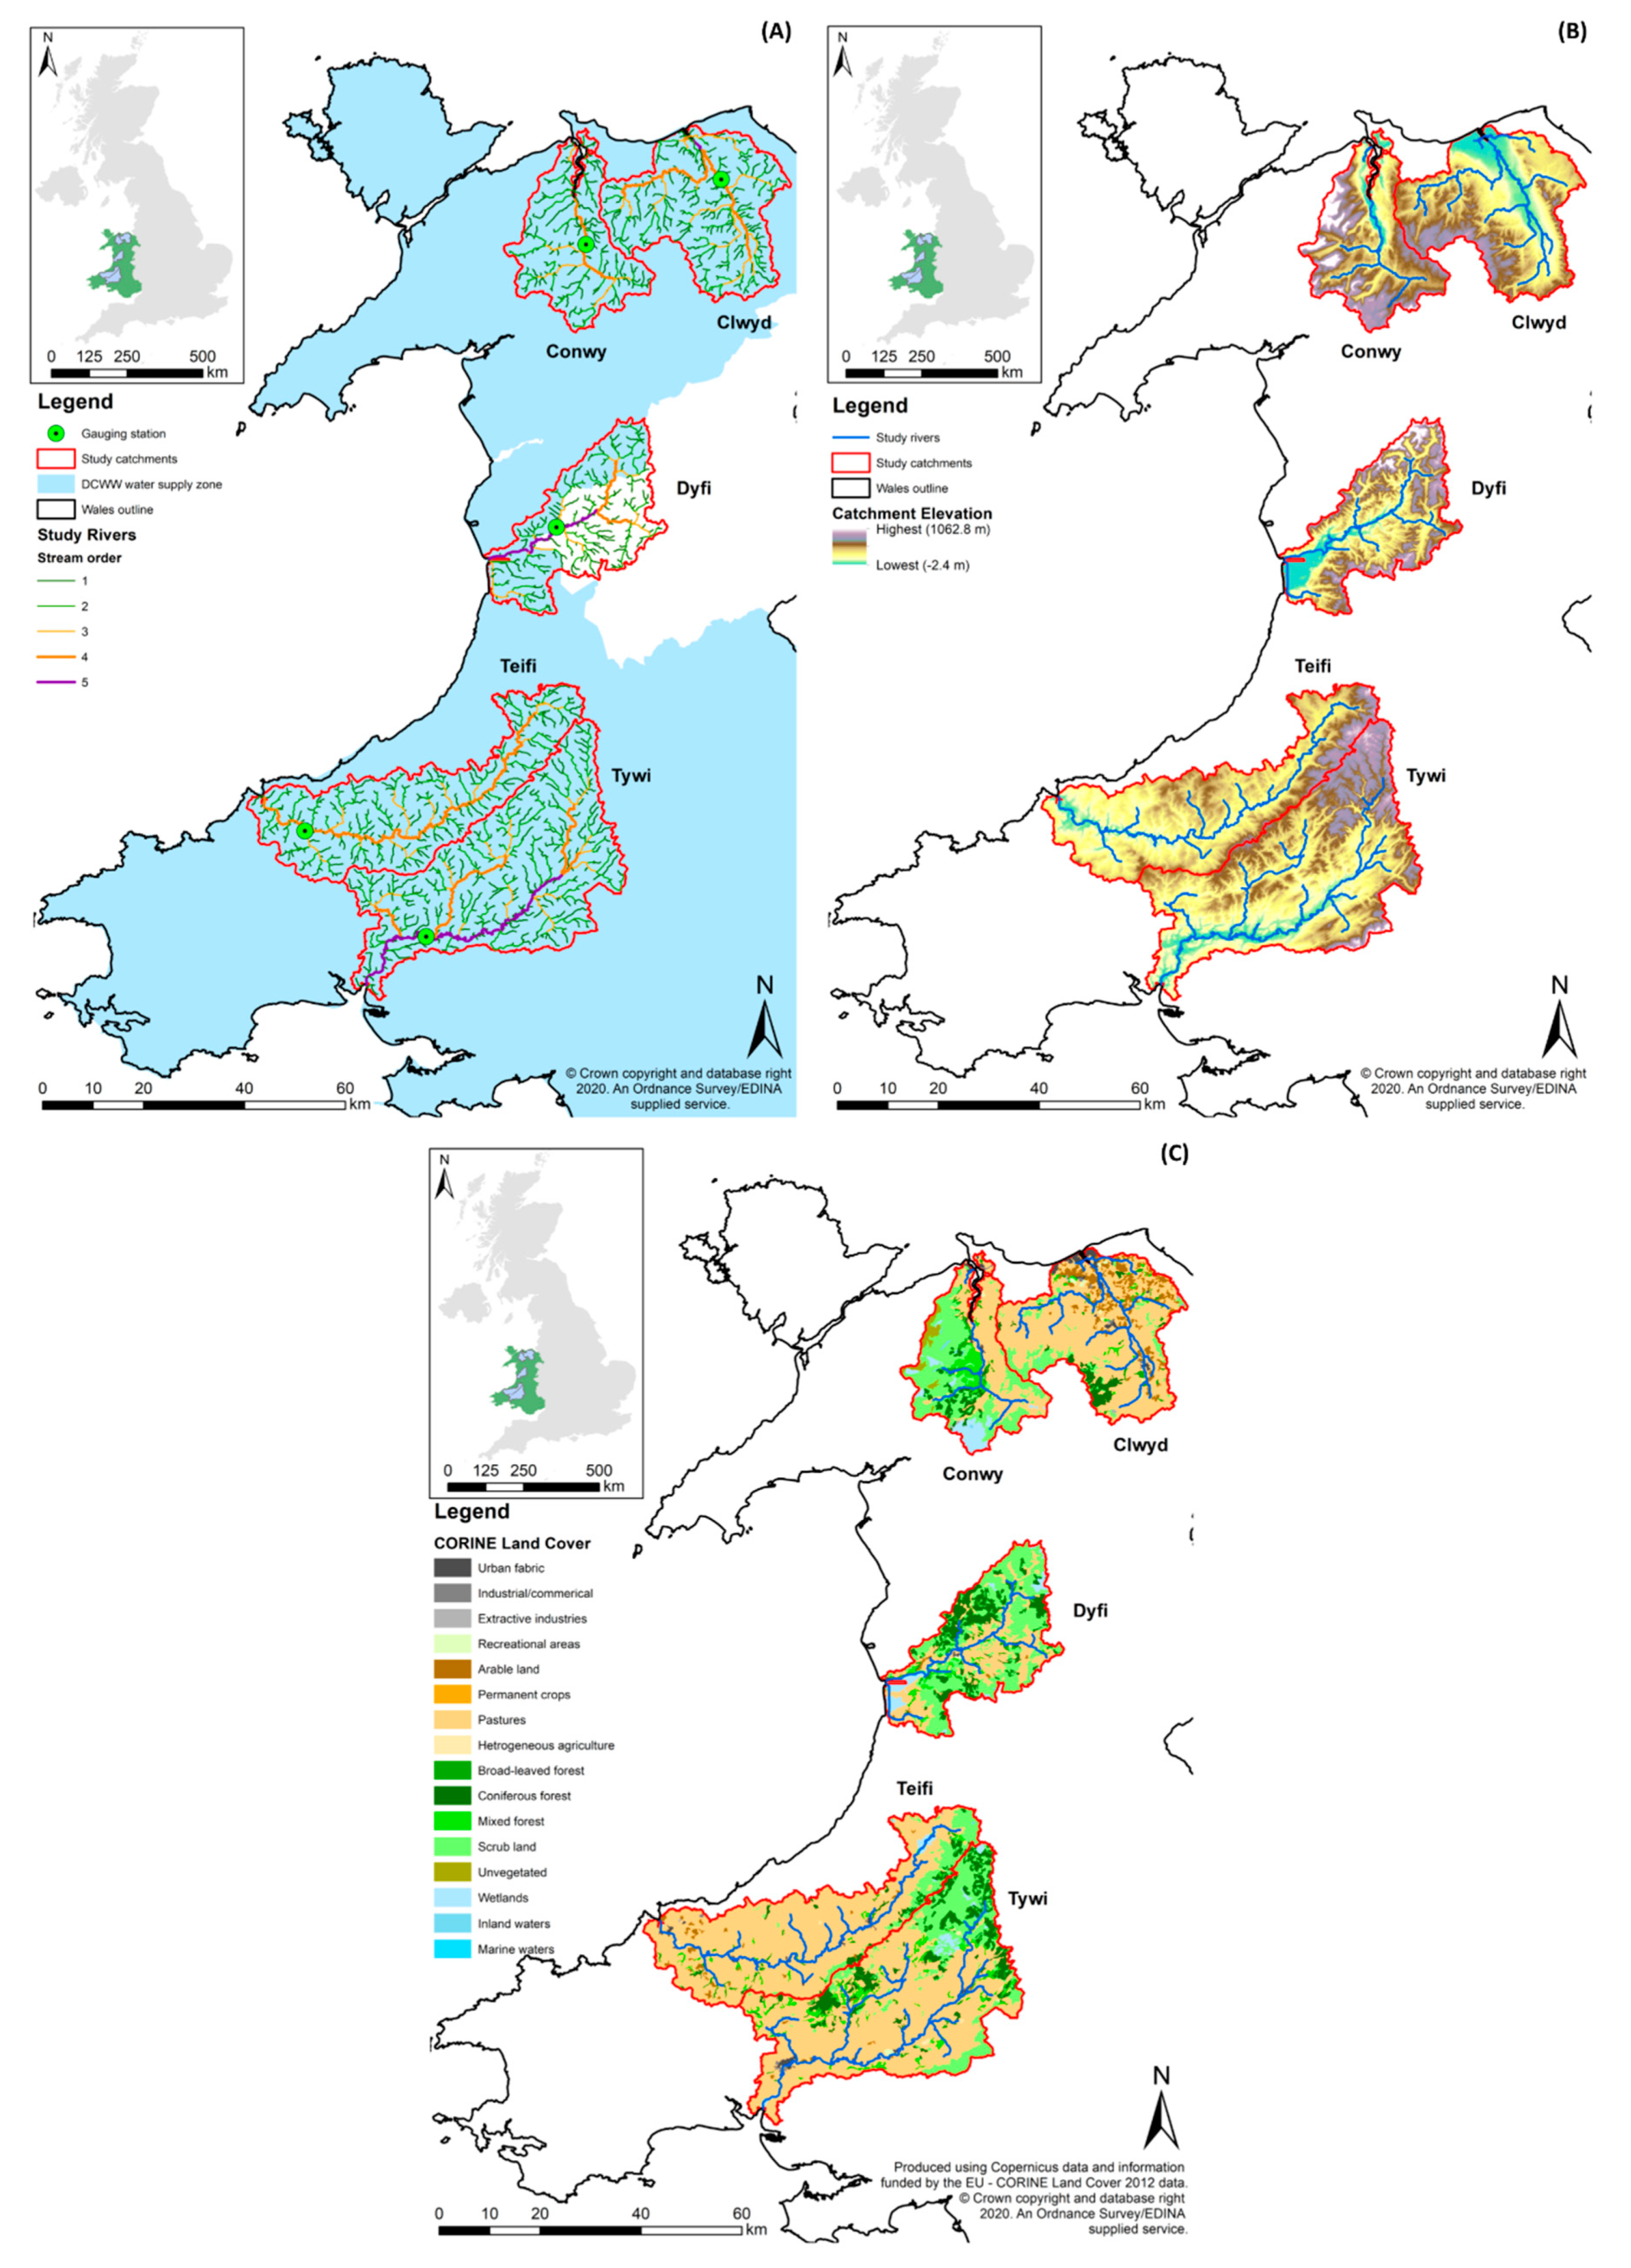
Figure 1. (A) Catchments; streams (formation threshold of 1 km2); stream order (derived by Strahler method); and gauging station locations. (B) Catchment elevation. (C) Catchment land use/land cover derived from CORINE Land Cover data.
Water 12 01684 g001
Figure 2. Warming trend in average autumn temperatures displayed in all catchments. Linear trend for the Dyfi catchment shown with red dashed line to exemplify the linear trend in all catchments.
Water 12 01684 g002
Figure 3. Number of occurrences annually where daily average temperature is greater than the 95th percentile temperature value for the full 34-year dataset. Linear trend for the Teifi catchment shown with red dashed line to exemplify the linear trend in all three catchments.
Water 12 01684 g003
Figure 4. Number of occurrences during summer where daily average temperature is less than the 5th percentile temperature value for the full 34-year summer dataset. Linear trend for the Teifi catchment shown with red dashed line to exemplify the linear trend in all three catchments.
Water 12 01684 g004
Figure 5. Annual average streamflows for all study catchments, with linear trend lines also shown (dashed lines). The only statistically significant trend, an increase in streamflow in the Teifi catchment, is highlighted in red.
Water 12 01684 g005
Figure 6. Normalized daily hydroclimatic data compared with normalized daily abstraction data for the period 1 January 2012 to 30 September 2015, for all study catchments combined. (A1, B1, C1) Paired comparison, with black dashed lines representing trend direction; (A2, B2, C2) time series comparison. Combined data is based on an average across all catchments for temperature, while precipitation, streamflow and abstraction volumes are all total volumes summed from all catchments.
Water 12 01684 g006
Figure 7. Normalized monthly hydroclimatic data compared with normalized monthly abstraction data for the period January 2012 to September 2015, for all study catchments combined. (A1,B1,C1) Paired comparison, with black dashed lines representing trend direction; (A2,B2,C2) time series comparison. Combined data is based on an average across all catchments for temperature, while precipitation, streamflow and abstraction volumes are all total volumes summed from all catchments.
Water 12 01684 g007
Figure 8. Annual NAO index 1825–2019 relative to the 1951–1980 average index value (0 on this plot). Our study period has been highlighted in yellow; updated and adapted from Osborn [65].
Water 12 01684 g008
Table 1. Key study catchments details. Catchment area, main channel length, and slope data derived from Ordnance Survey provided 5 m digital elevation model; land use/land cover data derived from 2012 CORINE Landcover data.
RiverCatchment Area (km2)Main Channel Length (km)Mean Catchment Slope (degrees)Catchment Land Use/Land Cover (%)
UrbanAgriculturalForestScrub *Wetland
Clwyd803357.13.780.37.28.80.0
Conwy5644310.71.632.313.240.77.9
Dyfi6764214.20.430.620.143.25.1
Teifi1011806.60.983.15.59.51.1
Tywi13631099.20.764.616.017.11.3
* Scrub-designated land includes land cover such as natural grasslands, transitional woodland-shrub, moors and heathlands.
Table 2. Mann-Kendall trend analysis and Sen’s slope indicator results for average autumn air temperatures trends (1981–2015) in each of the five study catchments. Values for Kendall’s Tau underlined are significant at p <0.05, and those in bold are significant at p <0.01.
RiverKendall’s TauSen’s Slope
Clwyd0.3370.041
Conwy0.3480.040
Dyfi0.3440.038
Teifi0.3370.038
Tywi0.3440.038
Table 3. Pettitt and SNHT method breakpoint analysis statistics for shown stepped increase in annual average autumn temperatures since 1994 in all study catchments.
RiverPettitt p-ValueSNHT p-Value% Change in 1994–2015 Mean from 1982–1993 Mean
Clwyd0.0010.009+12.2%
Conwy0.0020.008+12.7%
Dyfi0.0030.011+11.8%
Teifi0.0020.010+10.3%
Tywi0.0030.010+10.6%
Table 4. Statistically significant Mann-Kendall trend analysis and Sen’s slope indicator results for extreme temperature events (1982–2015) for all catchments. No significant trends were found in the Clwyd catchment. Values for Kendall’s Tau underlined are significant at p <0.05.
RiverFactorKendall’s TauSen’s Slope
ConwyNumber of summer days below temperature dataset 5th percentile−0.271−0.125
DyfiNumber of days annually above temperature dataset 95th percentile−0.165−0.250
Number of summer days below temperature dataset 5th percentile−0.260−0.133
TeifiNumber of days annually above temperature dataset 95th percentile−0.173−0.250
Number of summer days below temperature dataset 5th percentile−0.269−0.143
TywiNumber of days annually above temperature dataset 95th percentile−0.191−0.286
Number of summer days below temperature dataset 5th percentile−0.266−0.136
Table 5. Mann-Kendall trend analysis and Sen’s slope indicator results for statistically significant trends in extreme streamflow events (1982–2015). Values for Kendall’s Tau underlined are significant at p < 0.05, and those in bold are significant at p < 0.01
RiverFactorKendall’s TauSen’s Slope
ClwydAnnual one day maximum0.2390.406
ConwySummer one day maximum0.2521.882
Winter one day minimum0.1930.030
DyfiSummer one day maximum0.2221.341
Annual one day maximum0.1841.238
Spring one day minimum0.3390.065
Summer one day minimum0.3170.048
Annual one day minimum0.3550.045
TeifiWinter one day maximum0.2692.037
Spring one day minimum0.2370.071
Summer one day minimum0.2370.059
Annual one day minimum0.2540.056
TywiAutumn one day minimum0.2390.019
Summer one day minimum0.3480.012
Annual one day minimum0.3200.011
Table 6. Pearson’s and Spearman’s rank correlation coefficient results for daily and monthly abstraction data with hydroclimatic factors (2012–2015). Statistics relating to a combined analysis of total daily/monthly abstraction in all catchments with average daily/monthly temperature, total streamflow volume and total precipitation volume across all catchments is also provide. Values for r and ρ underlined are significant at p < 0.05, and those in bold are significant at p < 0.01.
RiverHydroclimatic VariableDailyMonthly
Pearson’s rSpearman’s ρPearson’s rSpearman’s ρ
ClwydTemperature0.3690.4030.6190.665
Precipitation−0.181−0.225−0.509−0.485
Streamflow−0.615−0.553−0.868−0.808
ConwyTemperature0.1970.1970.2790.248
Precipitation−0.111−0.182−0.415−0.381
Streamflow−0.169−0.298−0.389−0.429
DyfiTemperature−0.398−0.404−0.372−0.250
Precipitation−0.054−0.140-0.171−0.250
Streamflow0.0120.0180.055−0.014
TeifiTemperature0.0730.0940.0940.125
Precipitation−0.073−0.082−0.147−0.256
Streamflow−0.117−0.235−0.148−0.374
TywiTemperature0.1770.2180.4850.482
Precipitation−0.165−0.202−0.768−0.724
Streamflow−0.509−0.559−0.942−0.961
CombinedTemperature0.2070.2520.5040.489
Precipitation−0.190−0.223−0.755−0.729
Streamflow−0.547−0.581−0.925−0.943