A Case Study on Settling Process in Inclined-Tube Gravity Sedimentation Tank for Drip Irrigation with the Yellow River Water


Abstract
1. Introduction
- (1)
- To prove that the inclined-tube gravity sedimentation tank is more effective than the sedimentation tank with a conventional structure on the fine sediment removal.
- (2)
- To investigate the settling process of the inclined-tube gravity sedimentation tank in detail, and provide a direction for subsequent structural optimization of the tanks.
2. Experimental Setup and Procedure
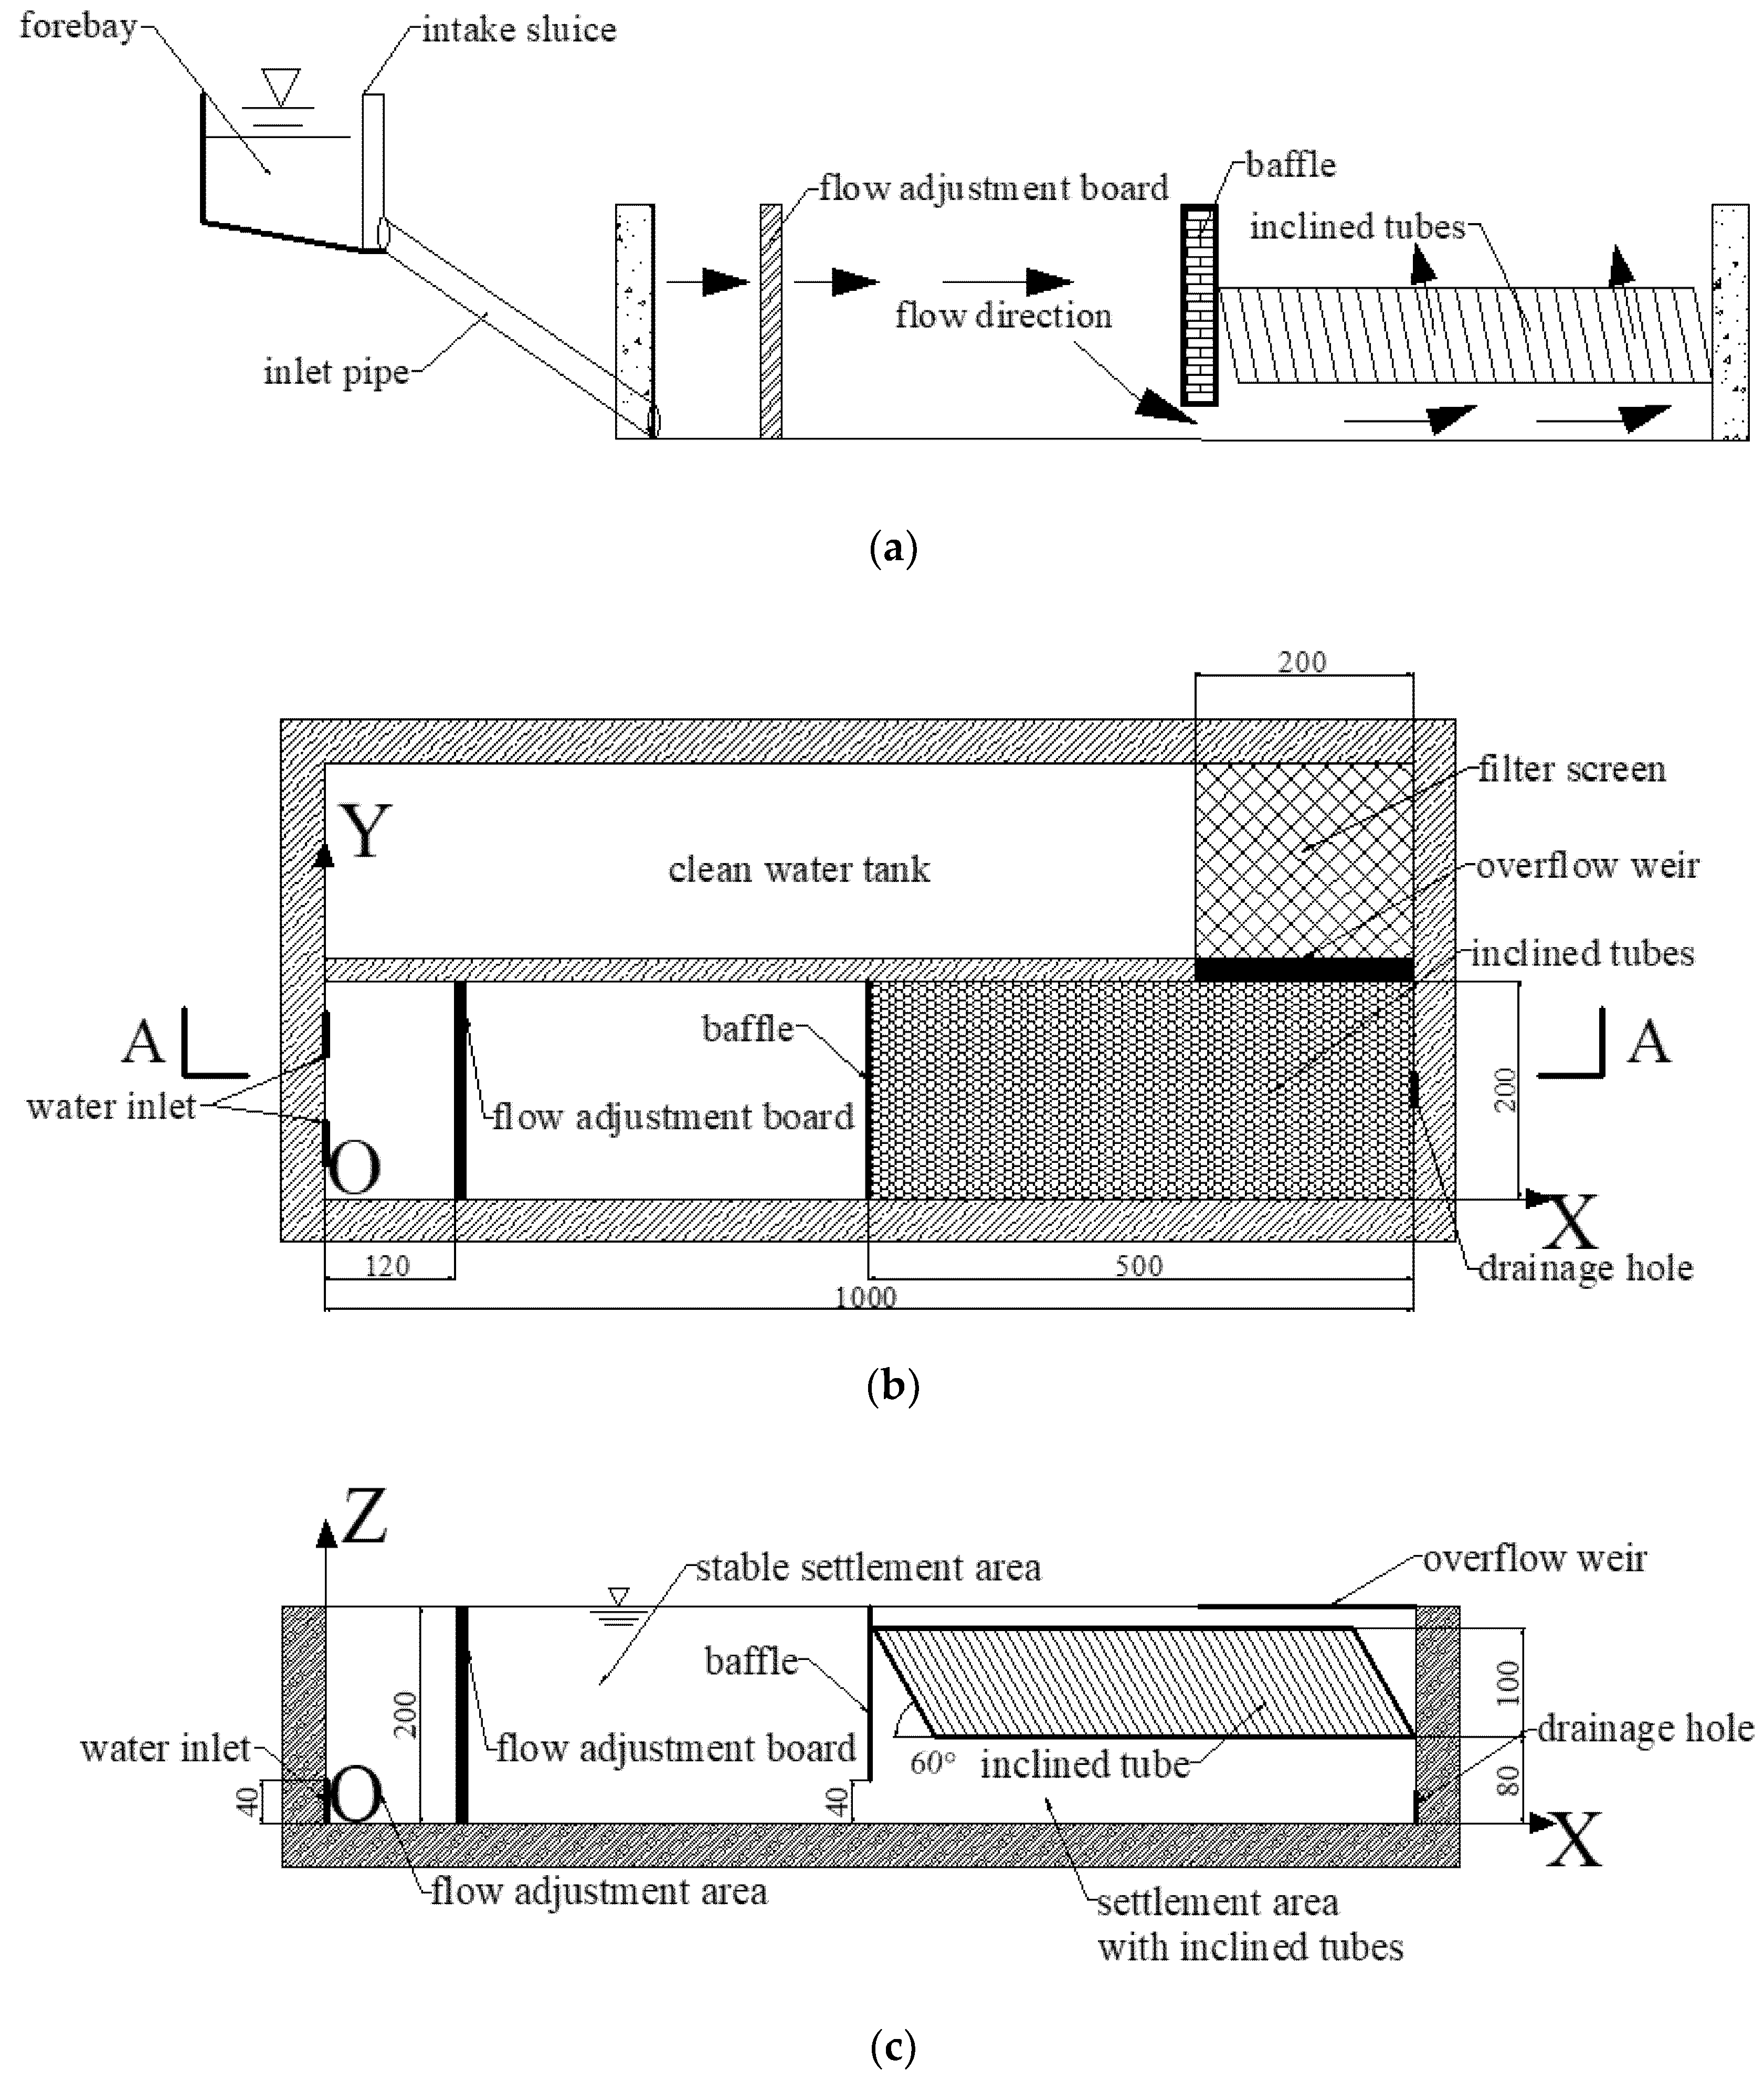
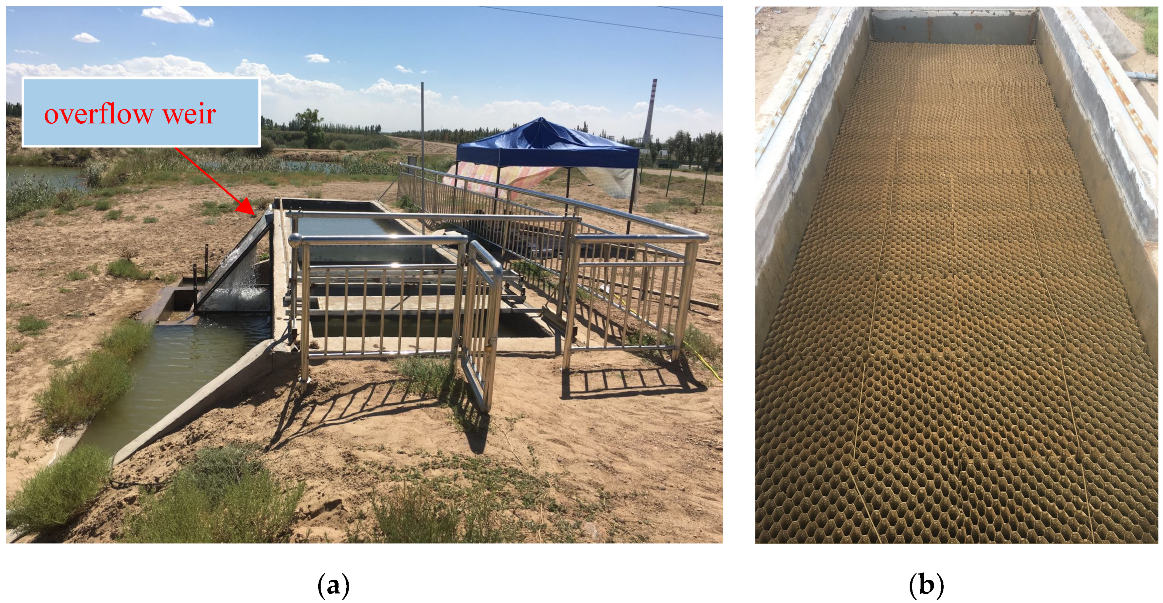
2.1. Configuration of Inclined-Tube Gravity Sedimentation Tank
2.2. Experiment Establishment
2.2.1. Case 1
2.2.2. Case 2
2.3. Measurement
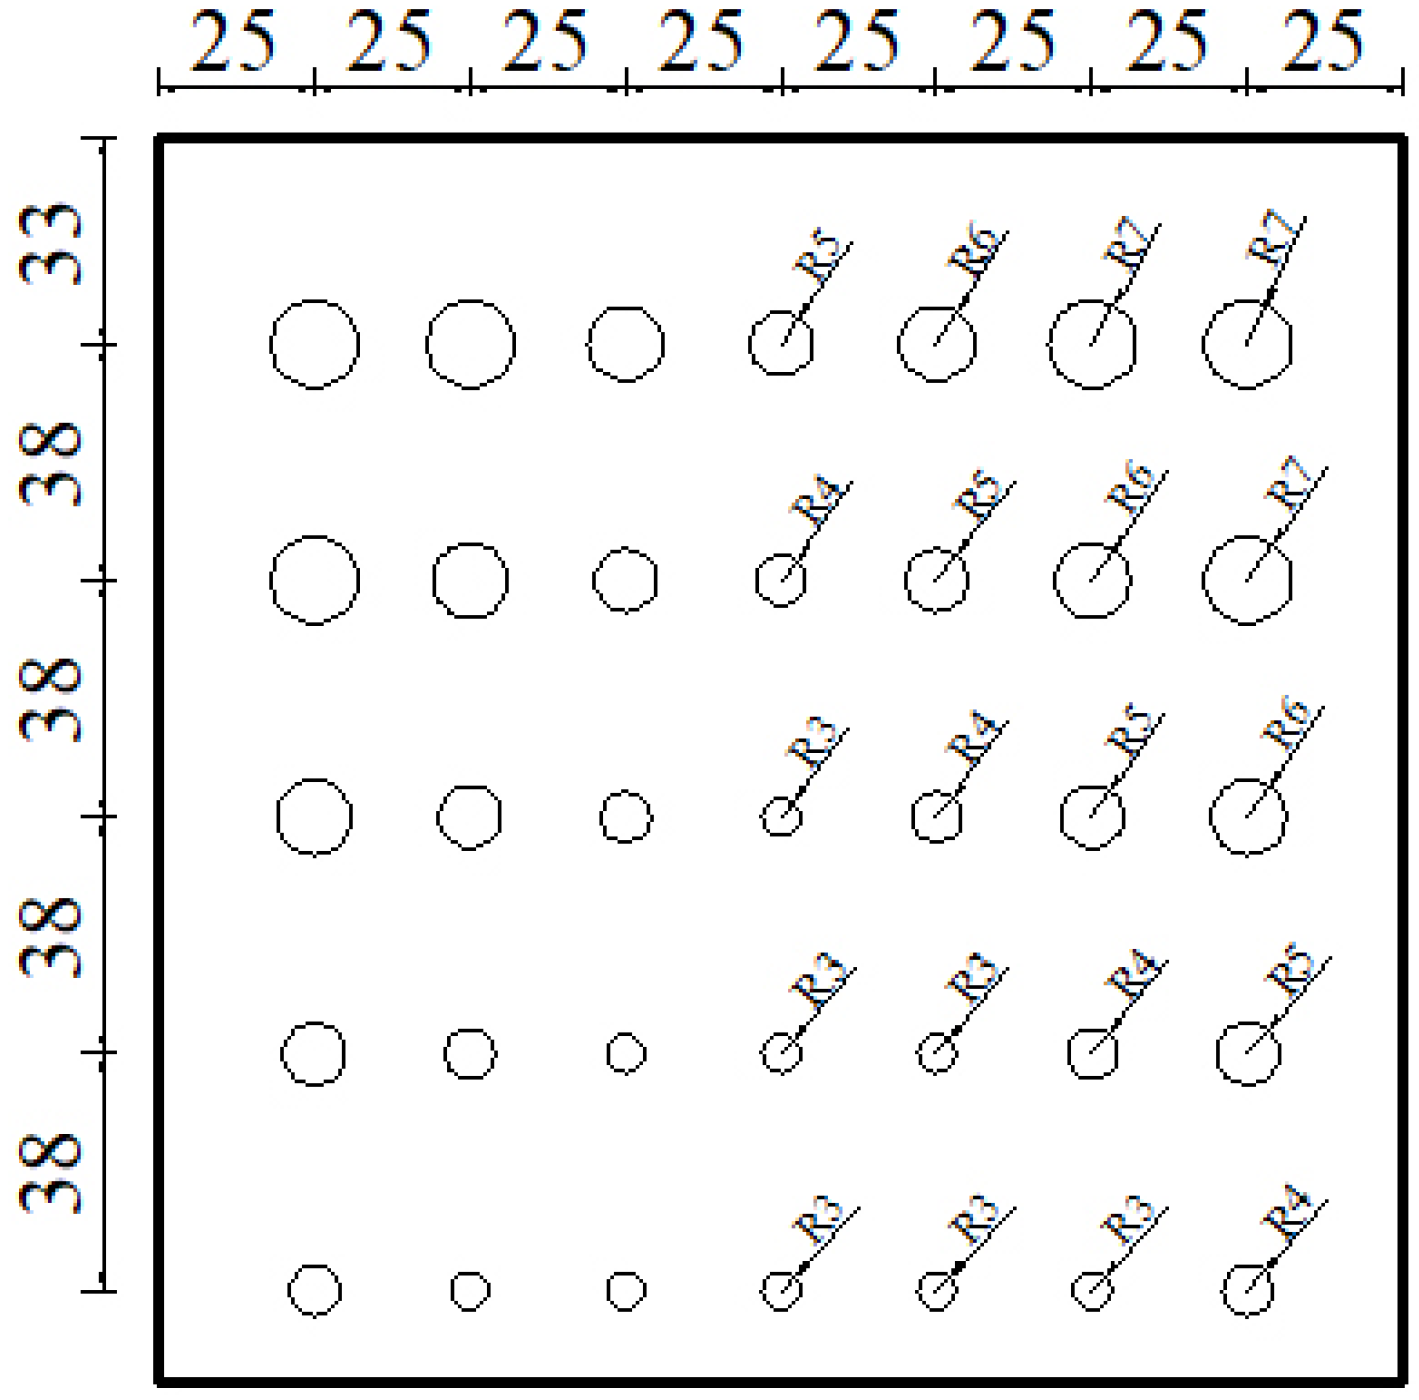
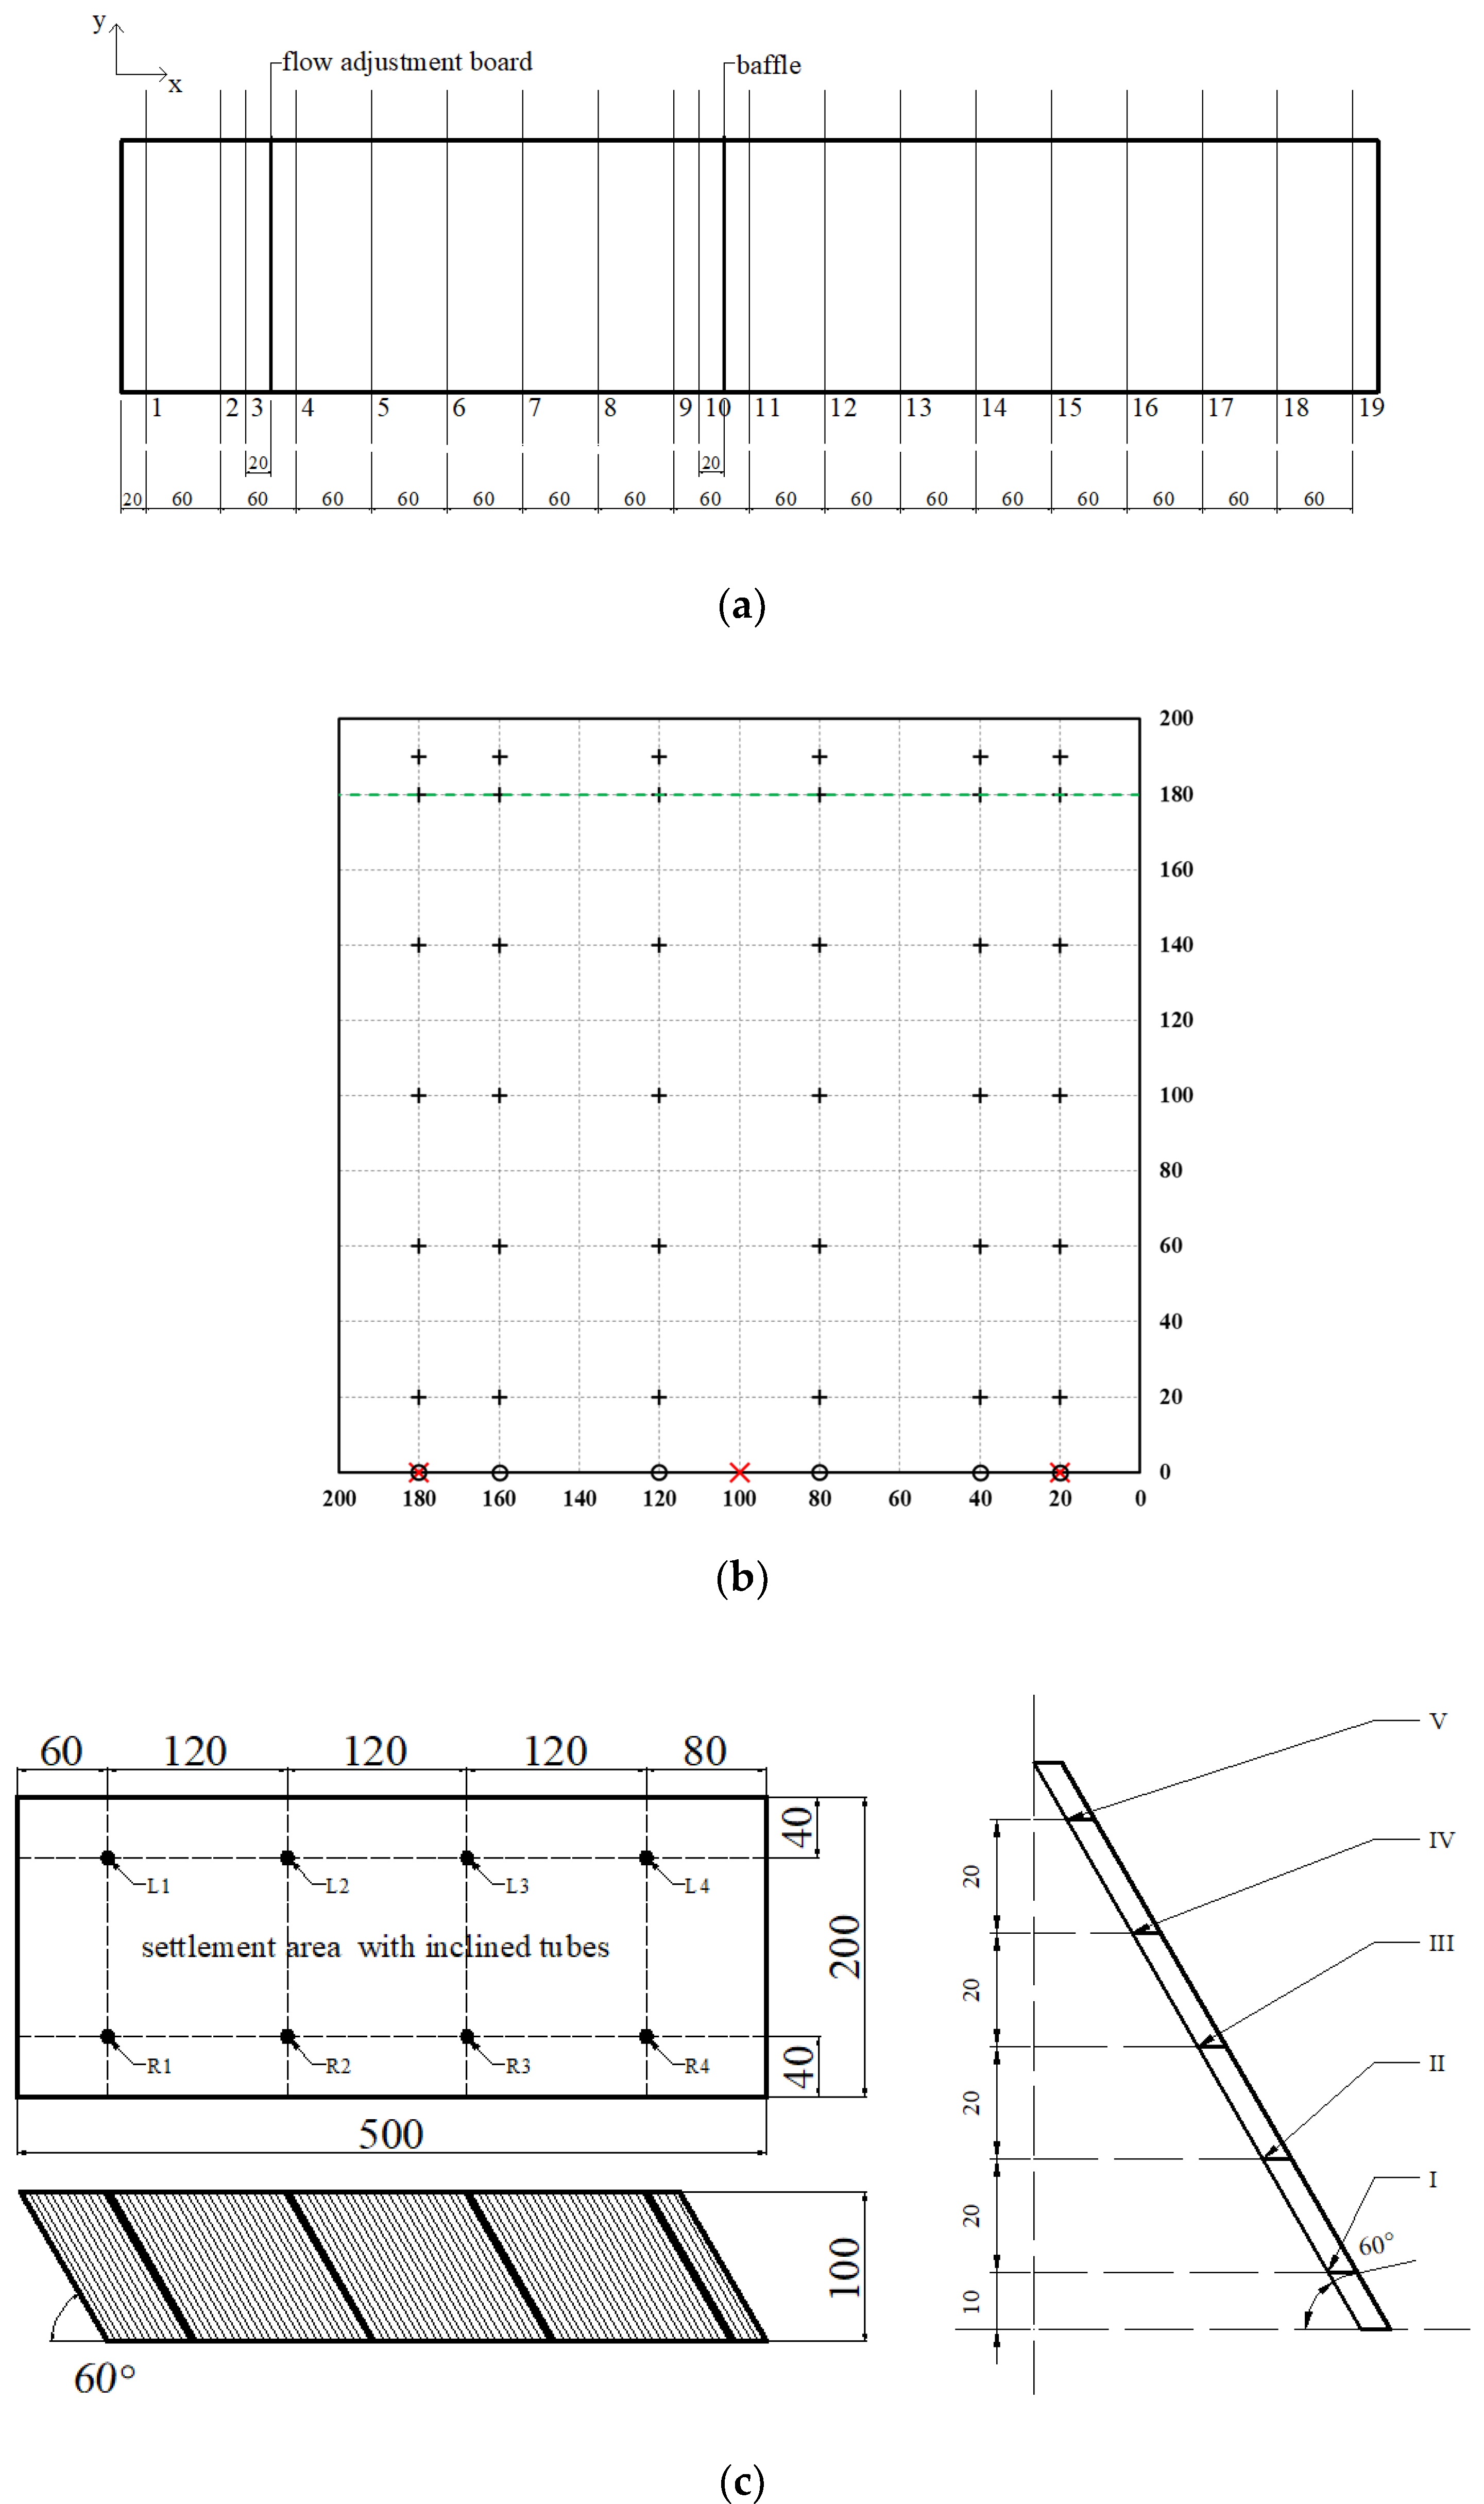
2.3.1. Measurement Locations
2.3.2. Measurement Methods
2.3.3. Calculation Method
3. Result and Analysis
3.1. Sediment Concentration Distribution
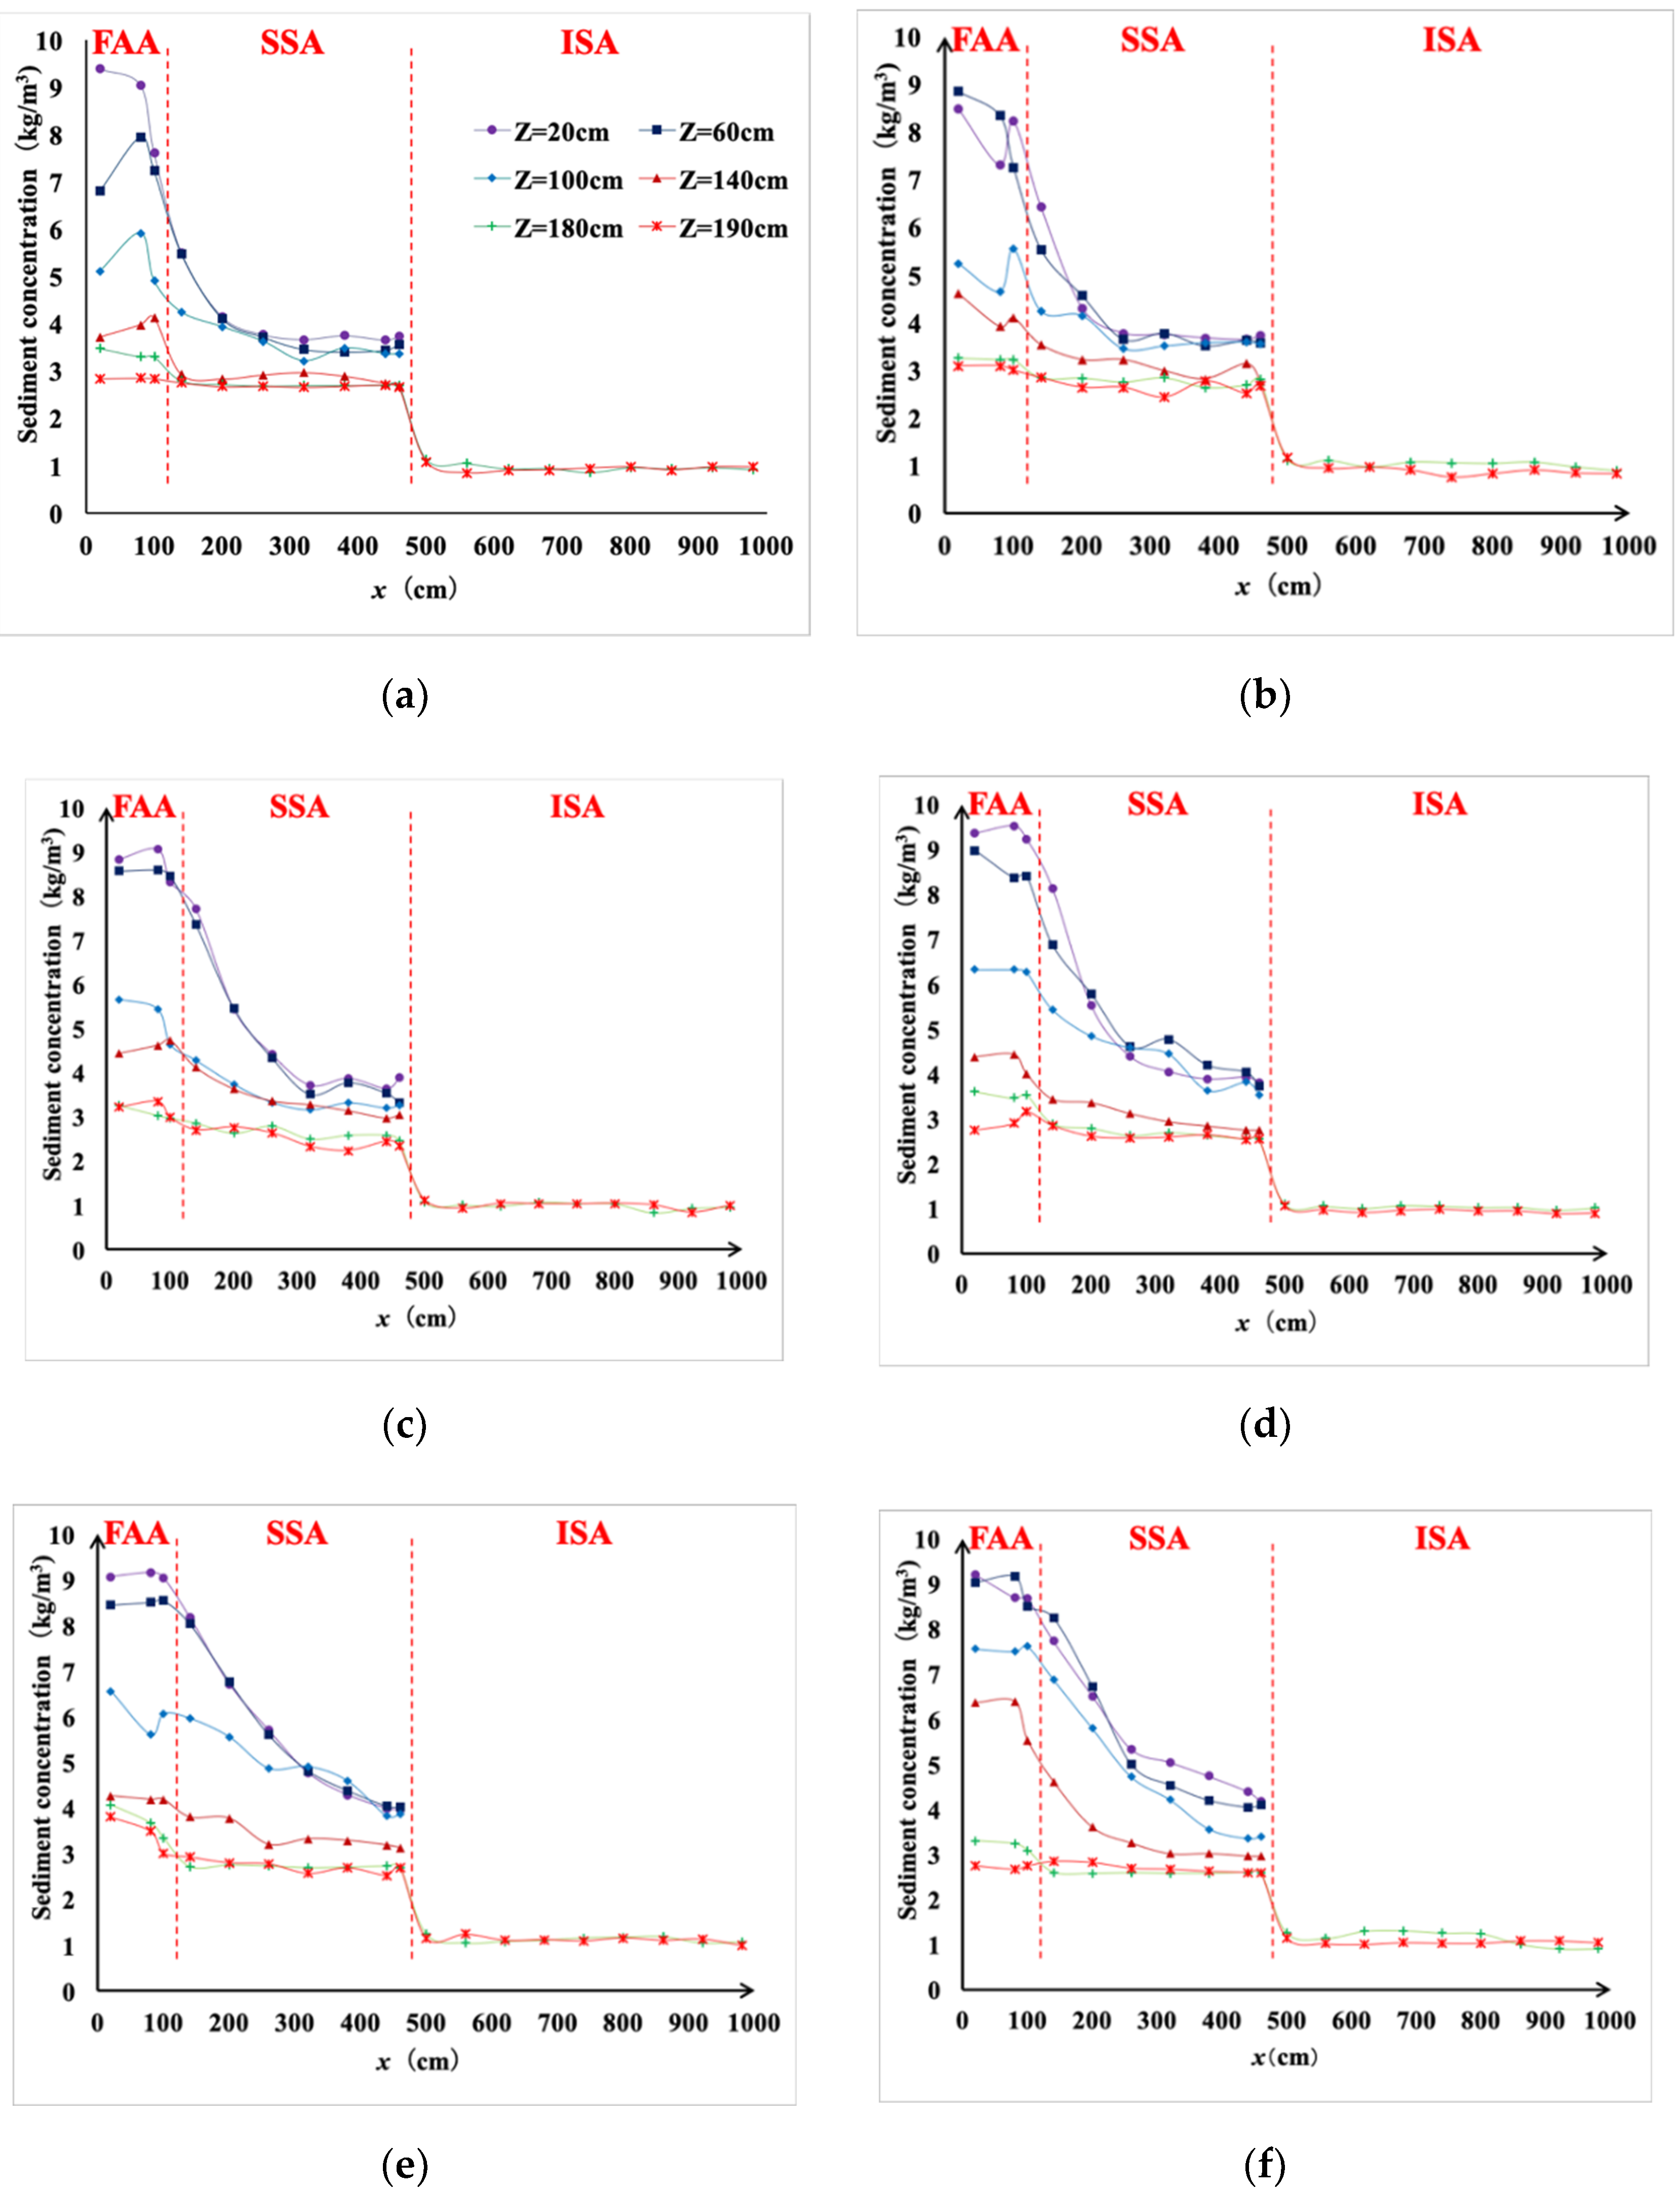
3.1.1. Case 1
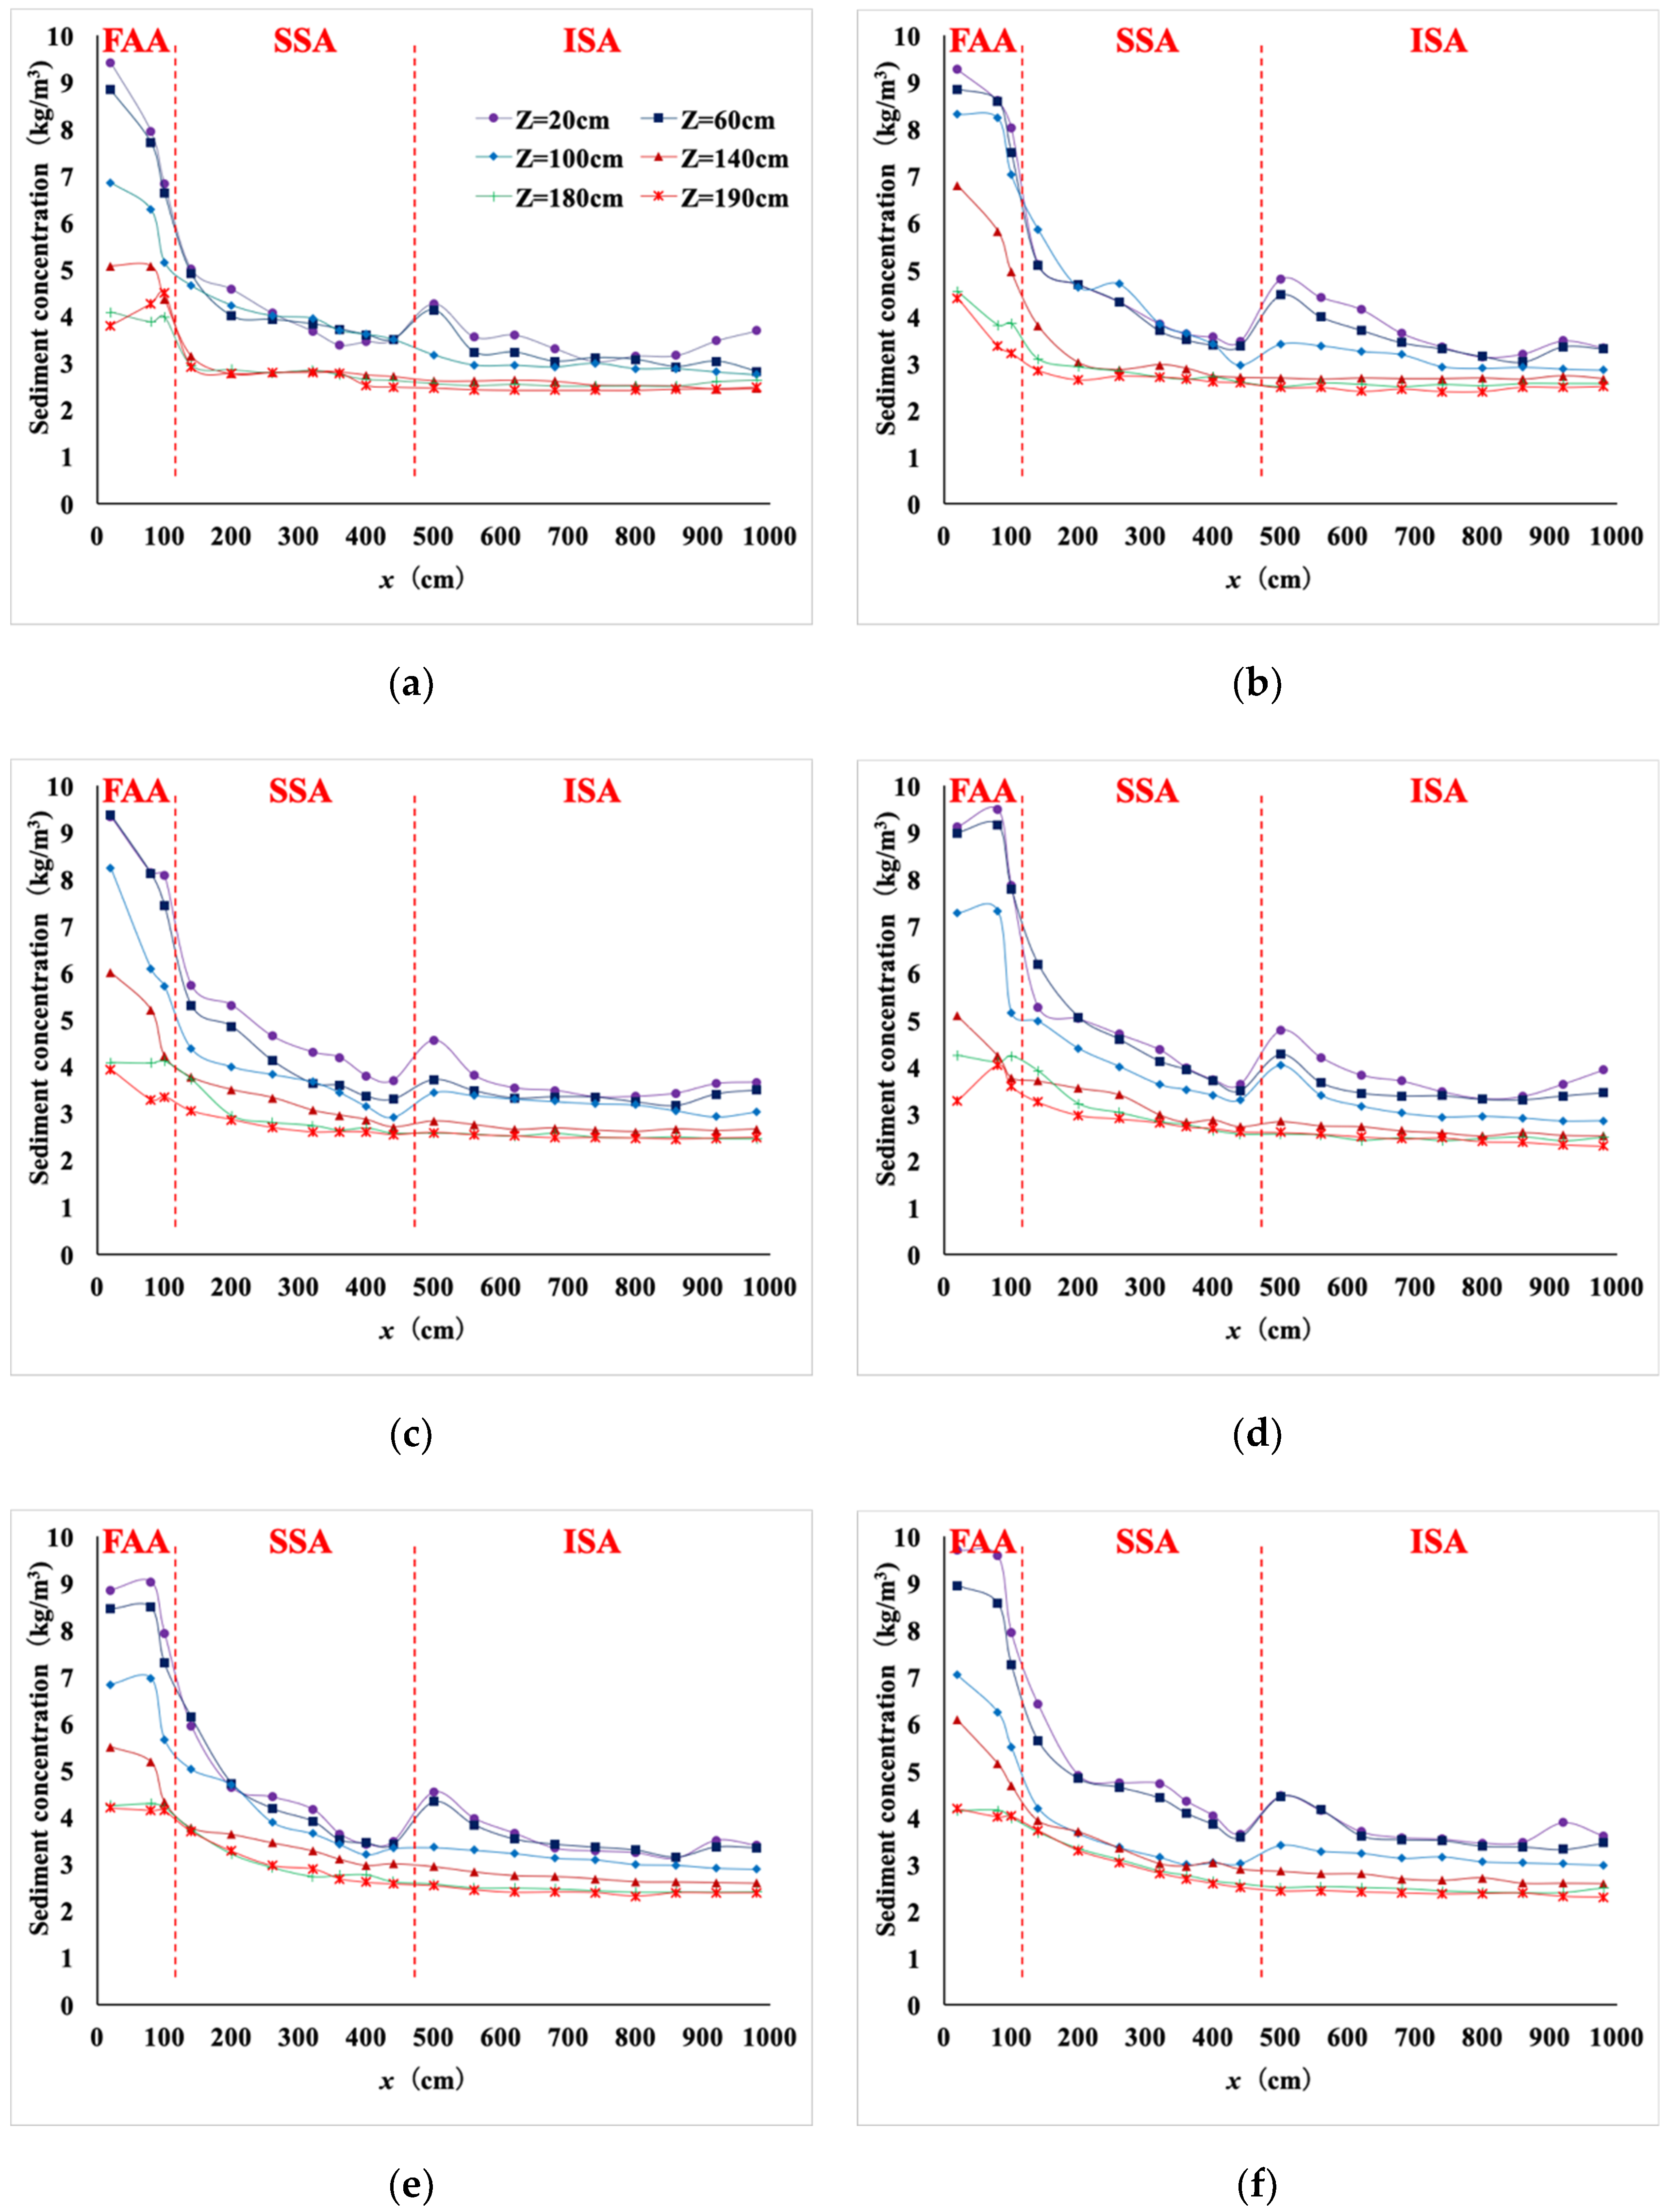
3.1.2. Case 2
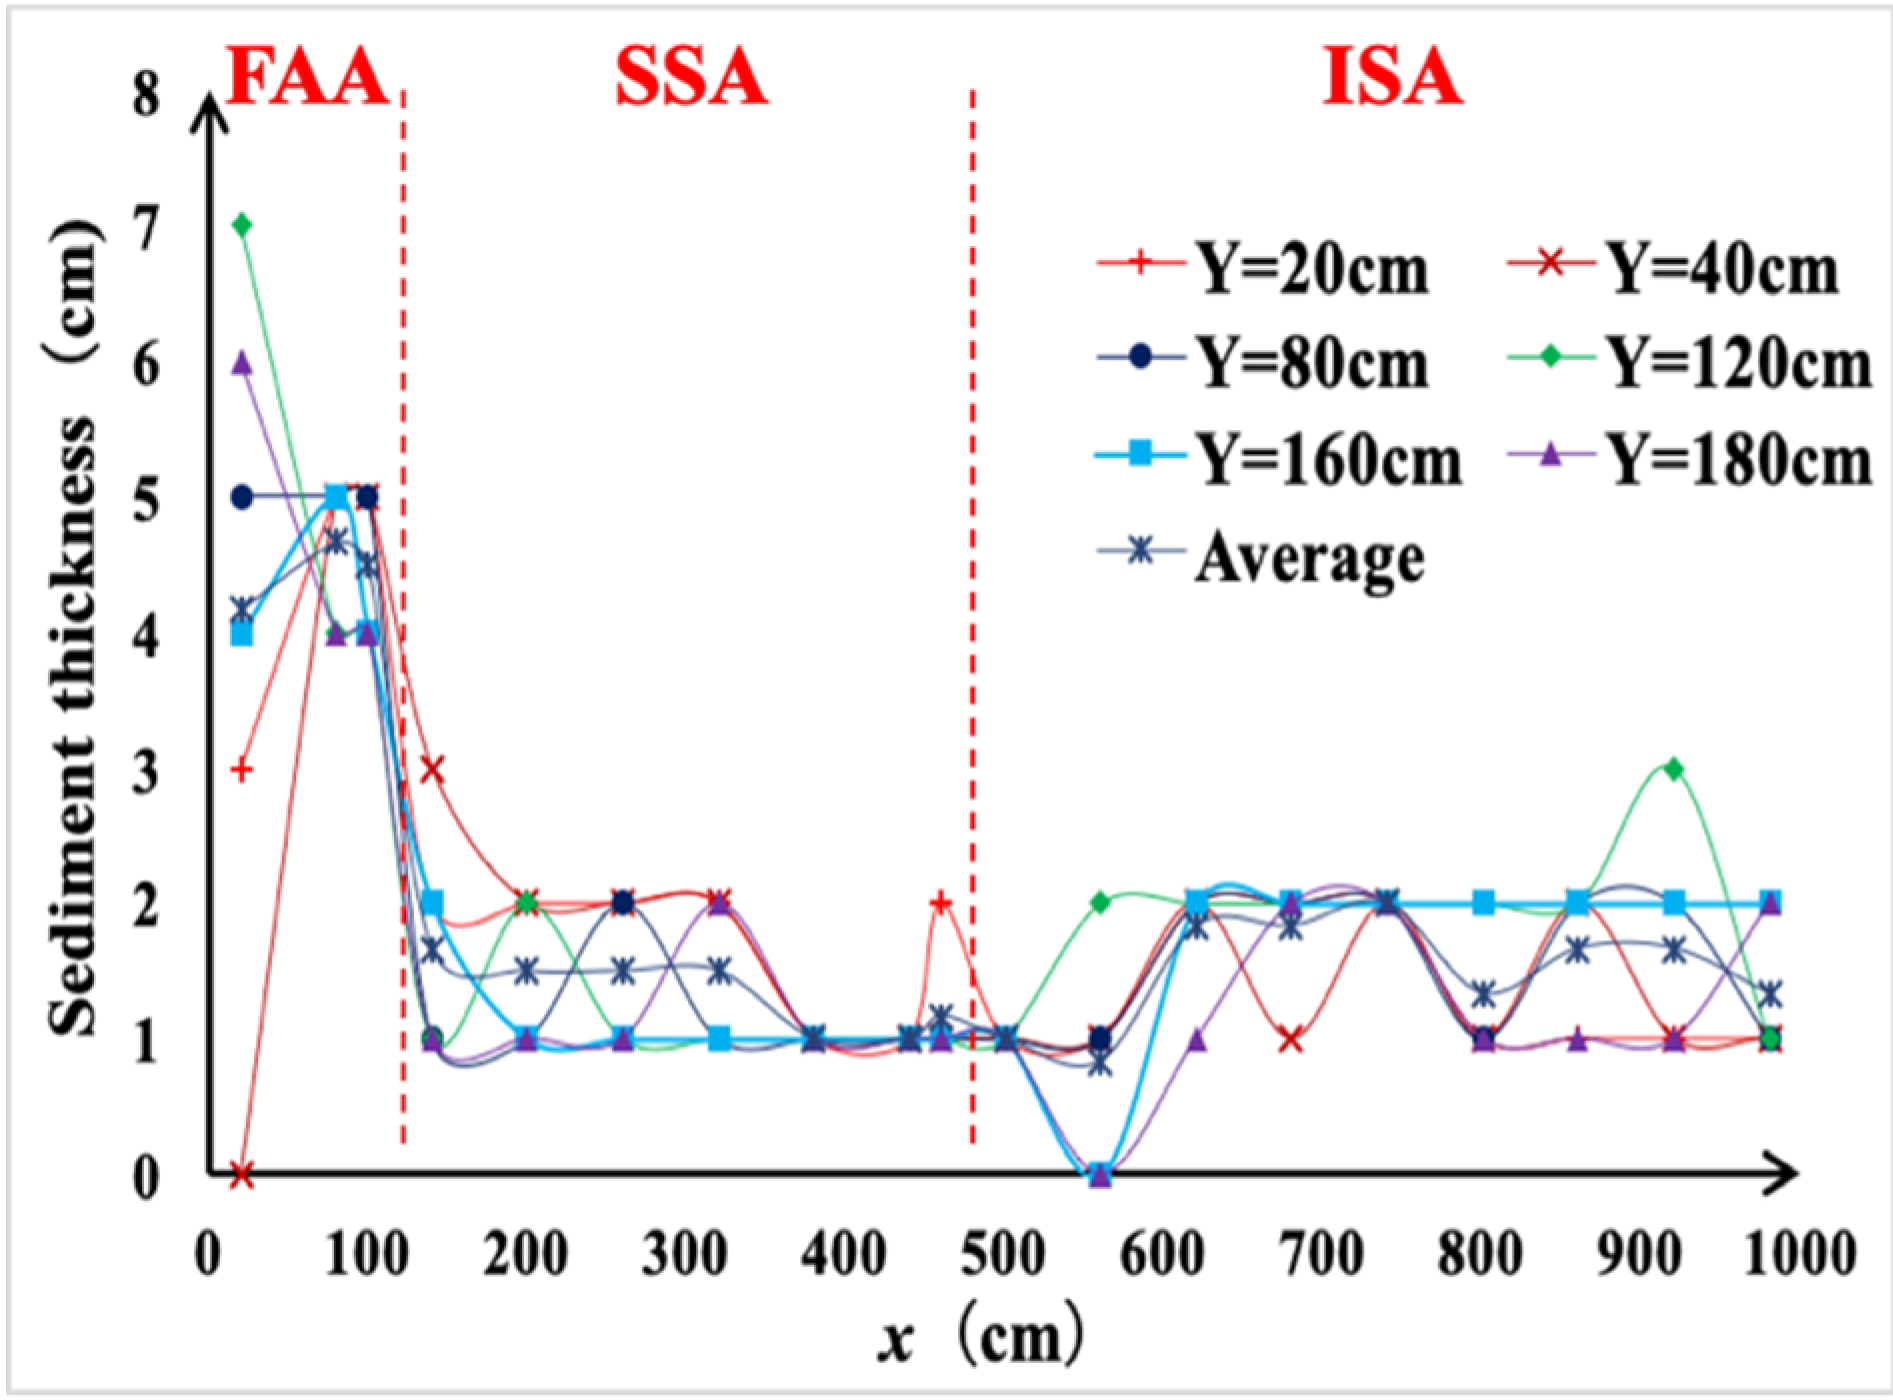
3.2. Sediment Thickness at the Bottom of the Tank
3.3. Sediment Size Grading at Different Locations in the Tank
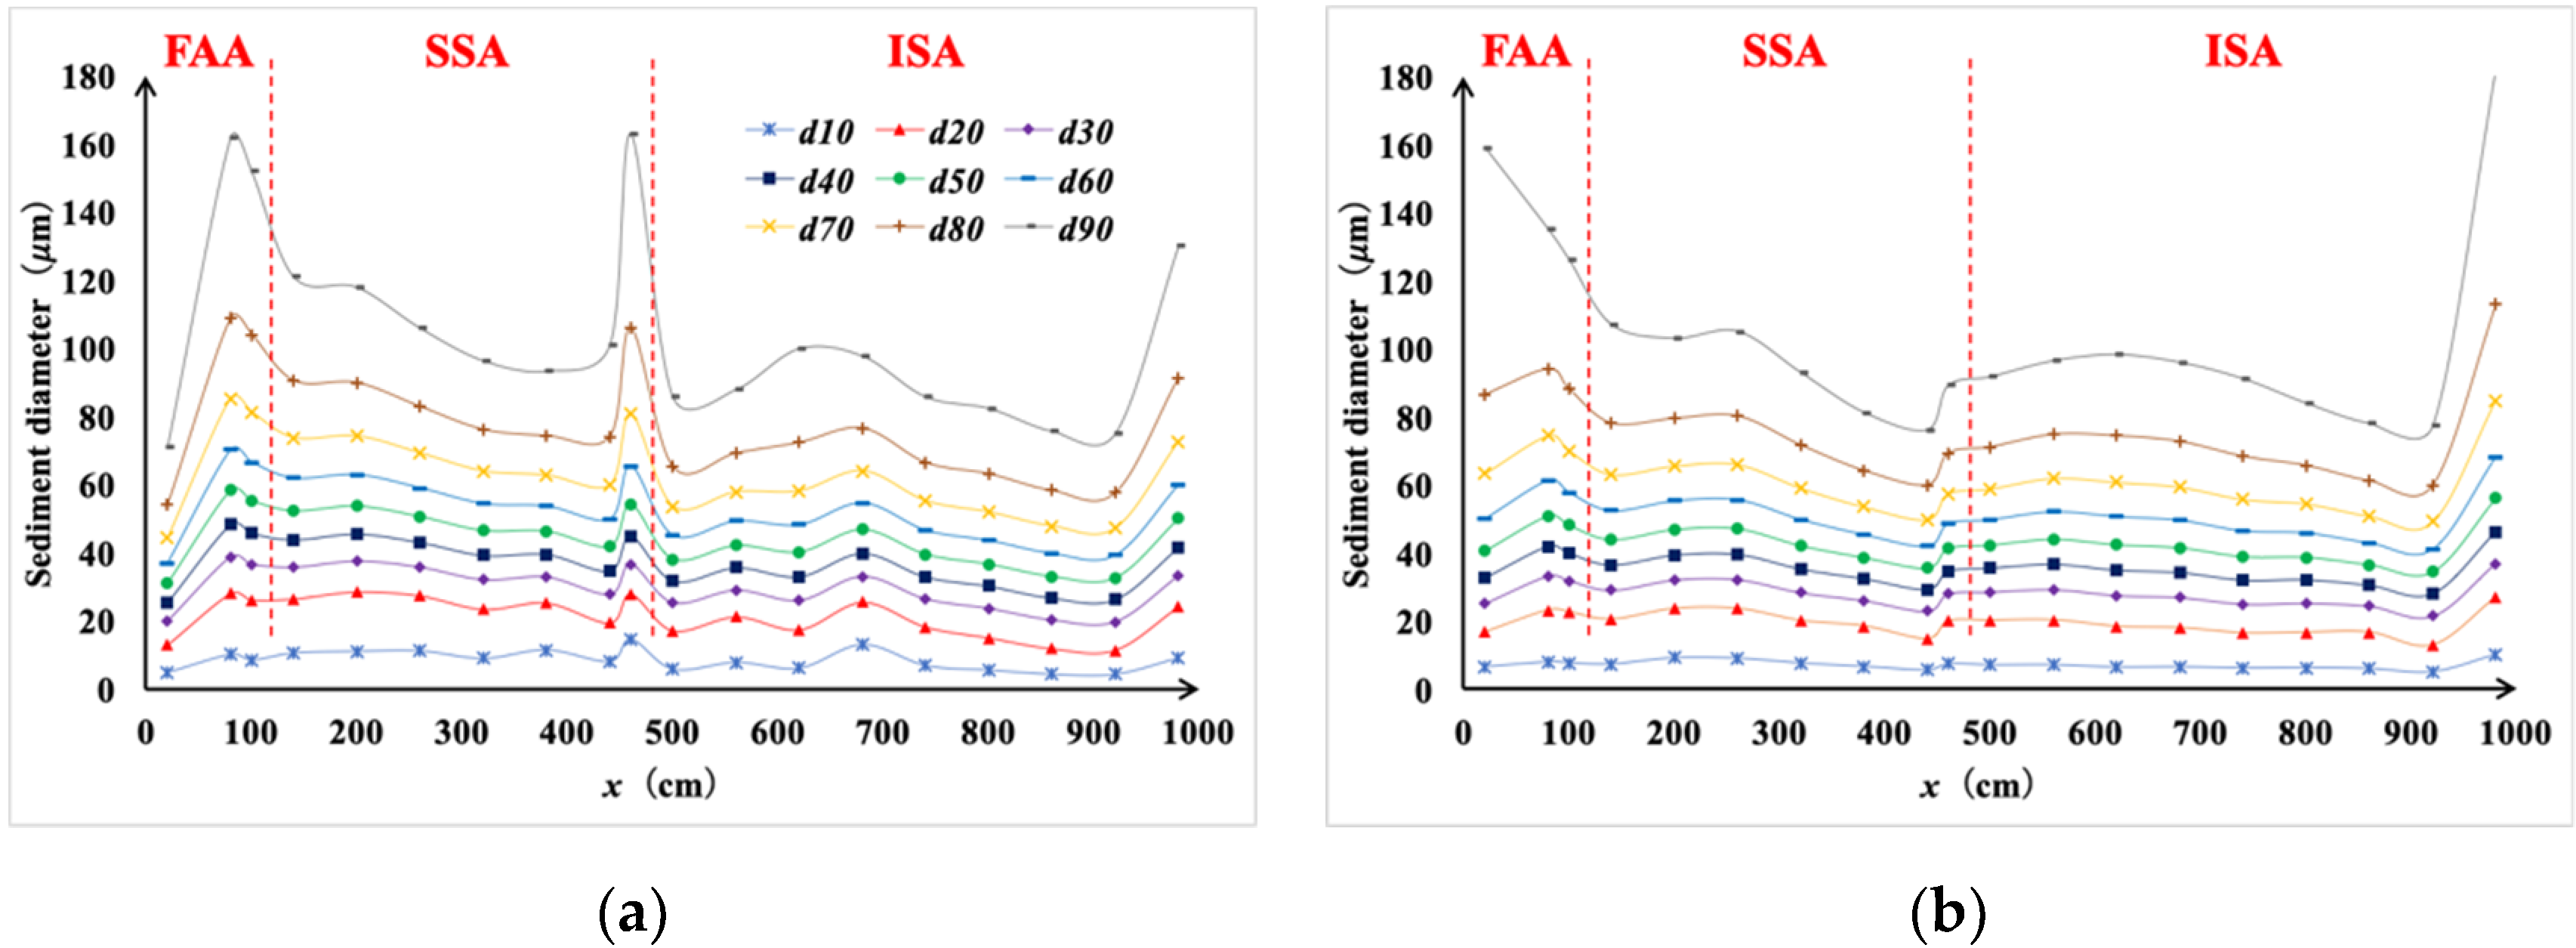
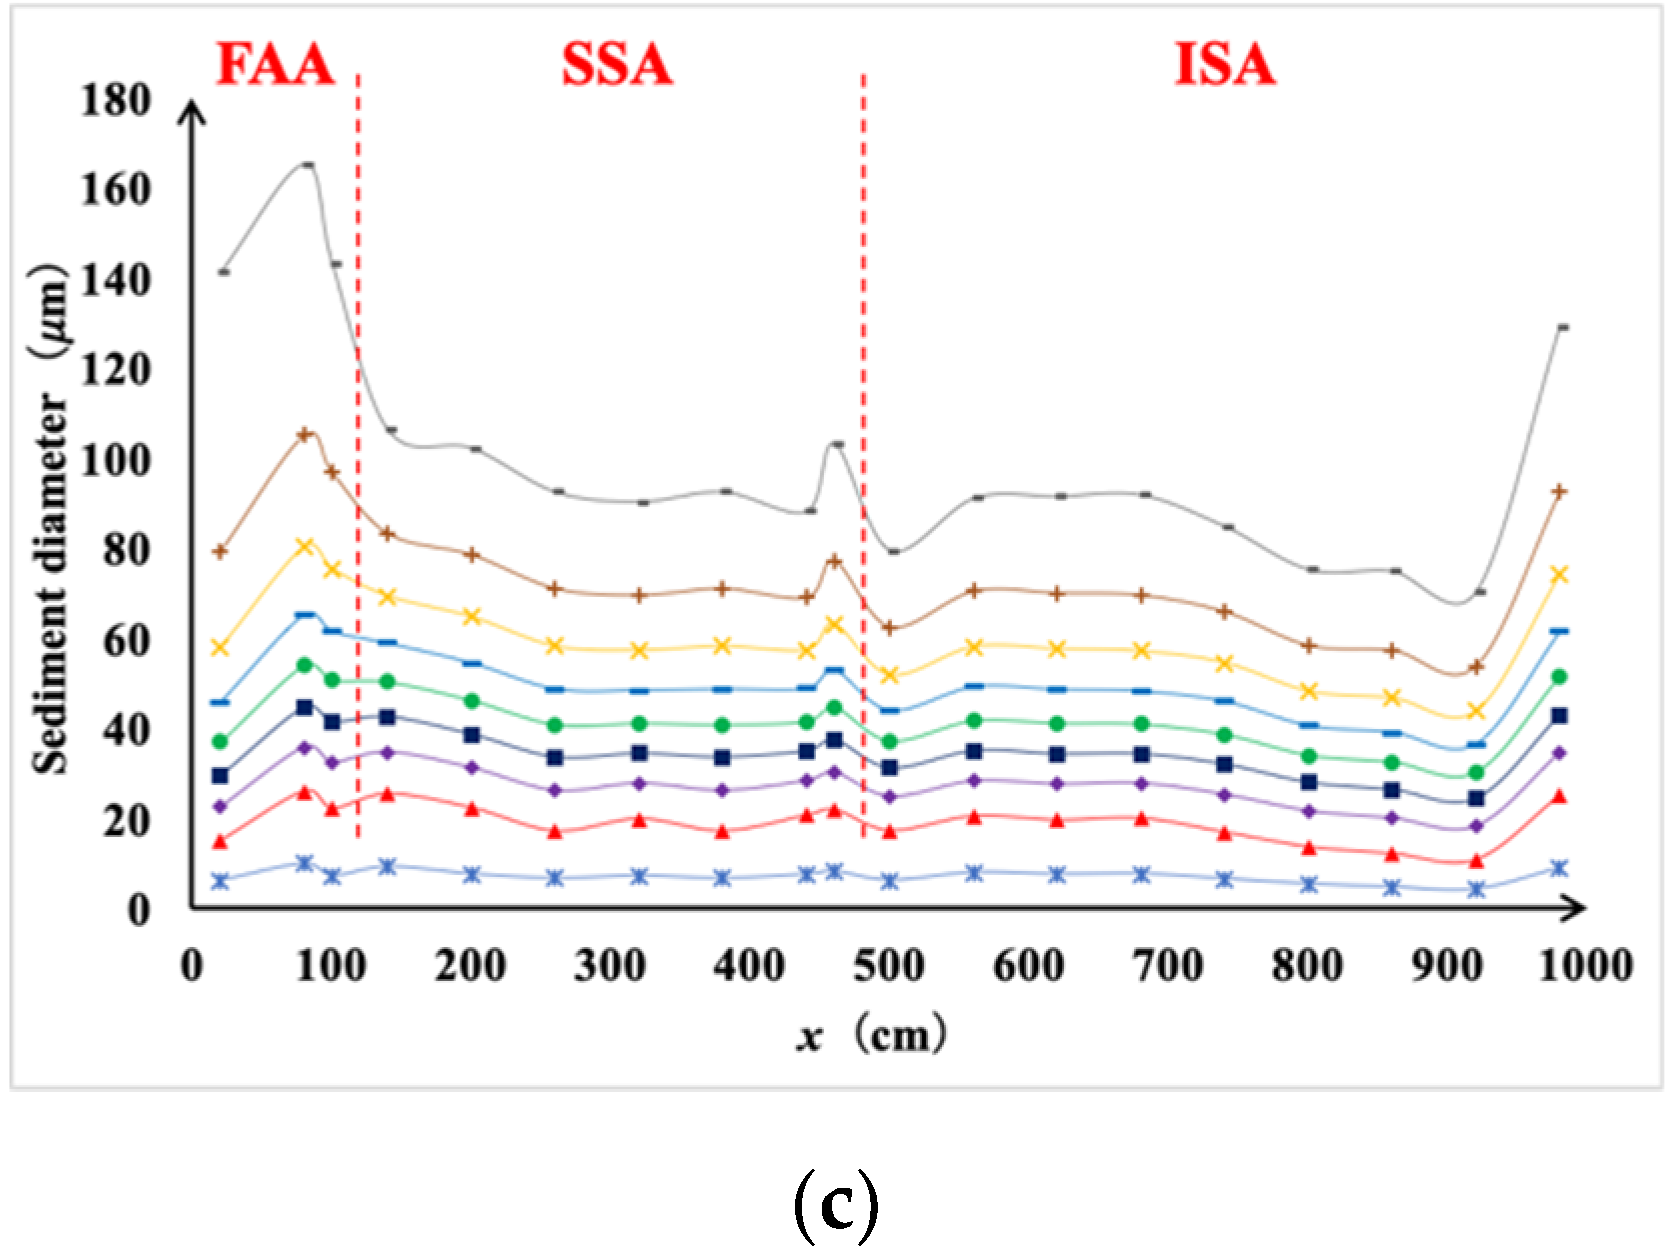
3.3.1. Sediment Size Grading at Different Locations on the Tank Bottom
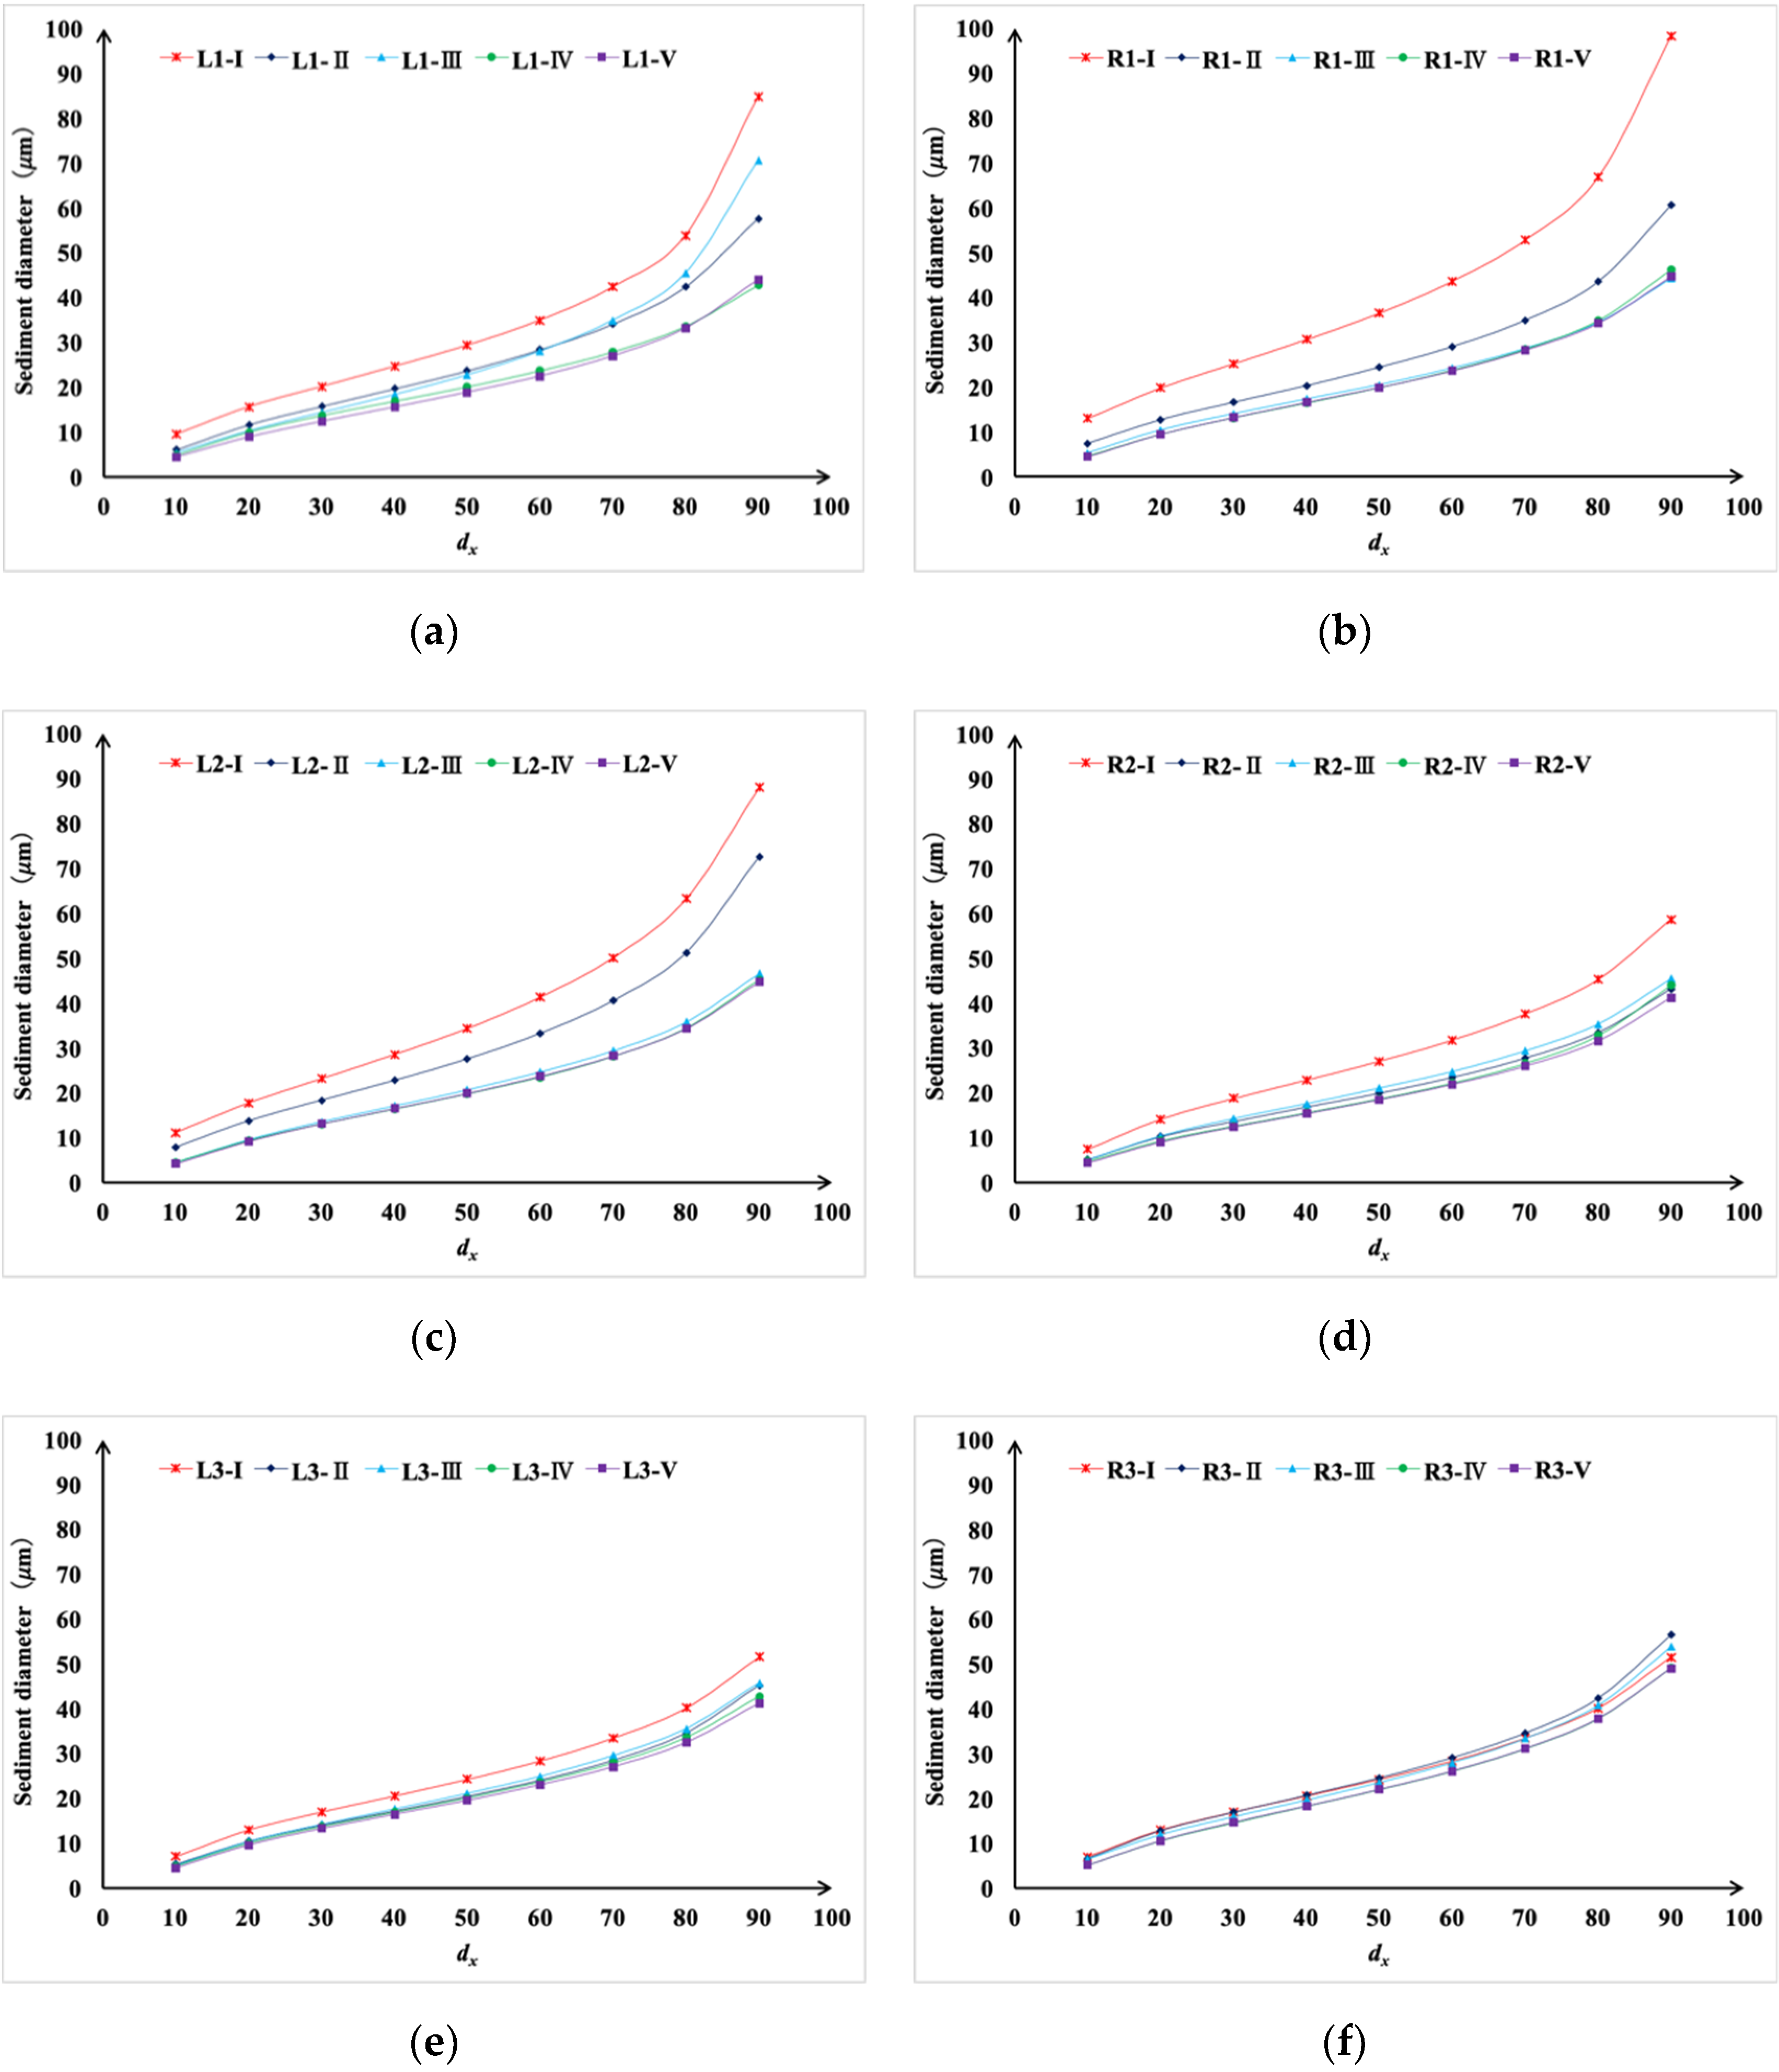
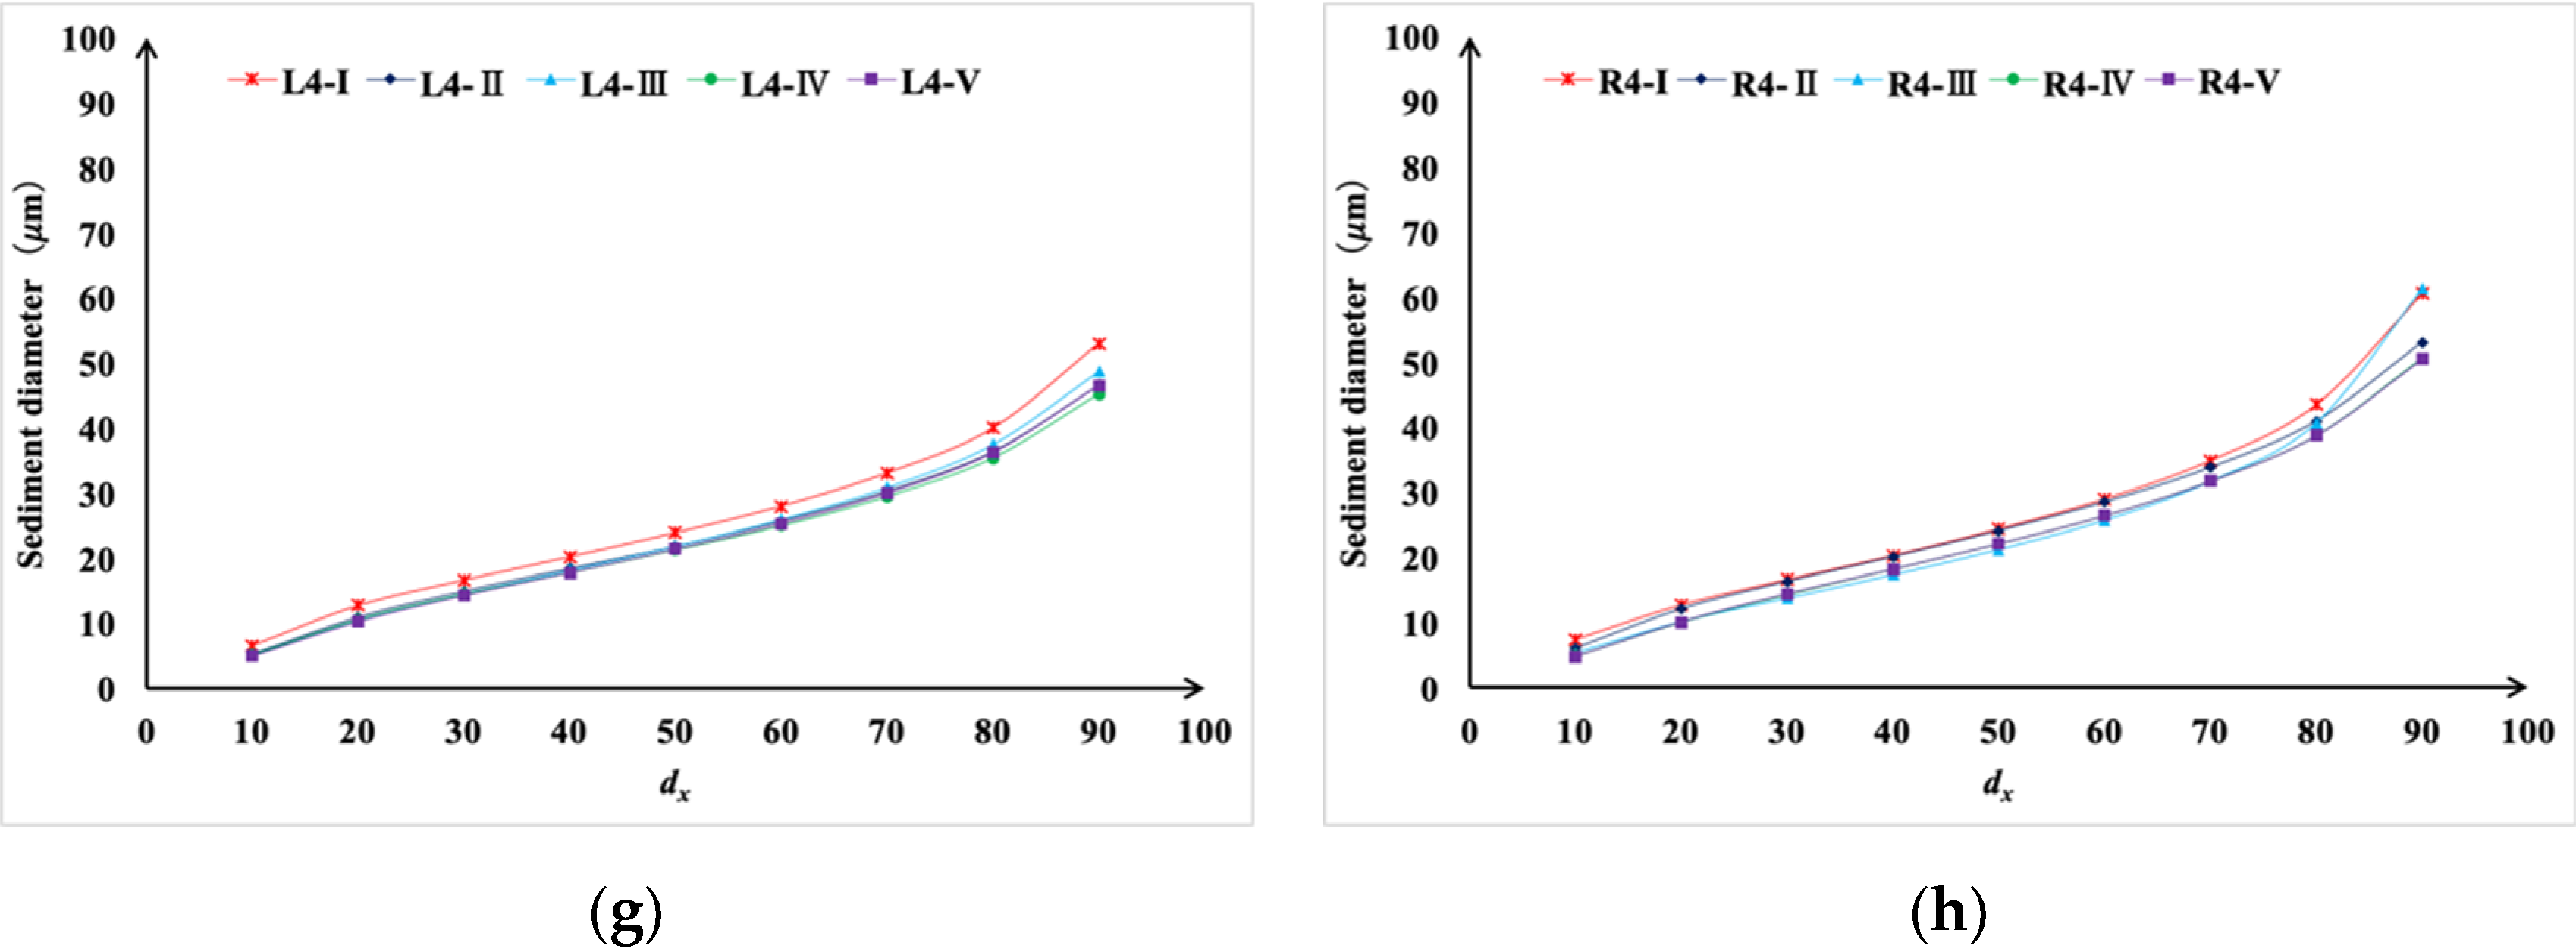
3.3.2. Sediment Size Grading at Different Locations in the Inclined Tubes
4. Discussion
5. Conclusions
- (1)
- The sediment concentration decreased rapidly in the front part of the SSA and the ISA. Large sediment mainly deposited in the FAA and the front part of the SSA, and the ISA had a great effect on fine sediment removal. The sediment removal rate of the inclined-tube gravity sedimentation tank could reach 64.7–69.7%, significantly higher than that of the sedimentation tank with a conventional structure (with a sediment removal rate of 20.7–32%).
- (2)
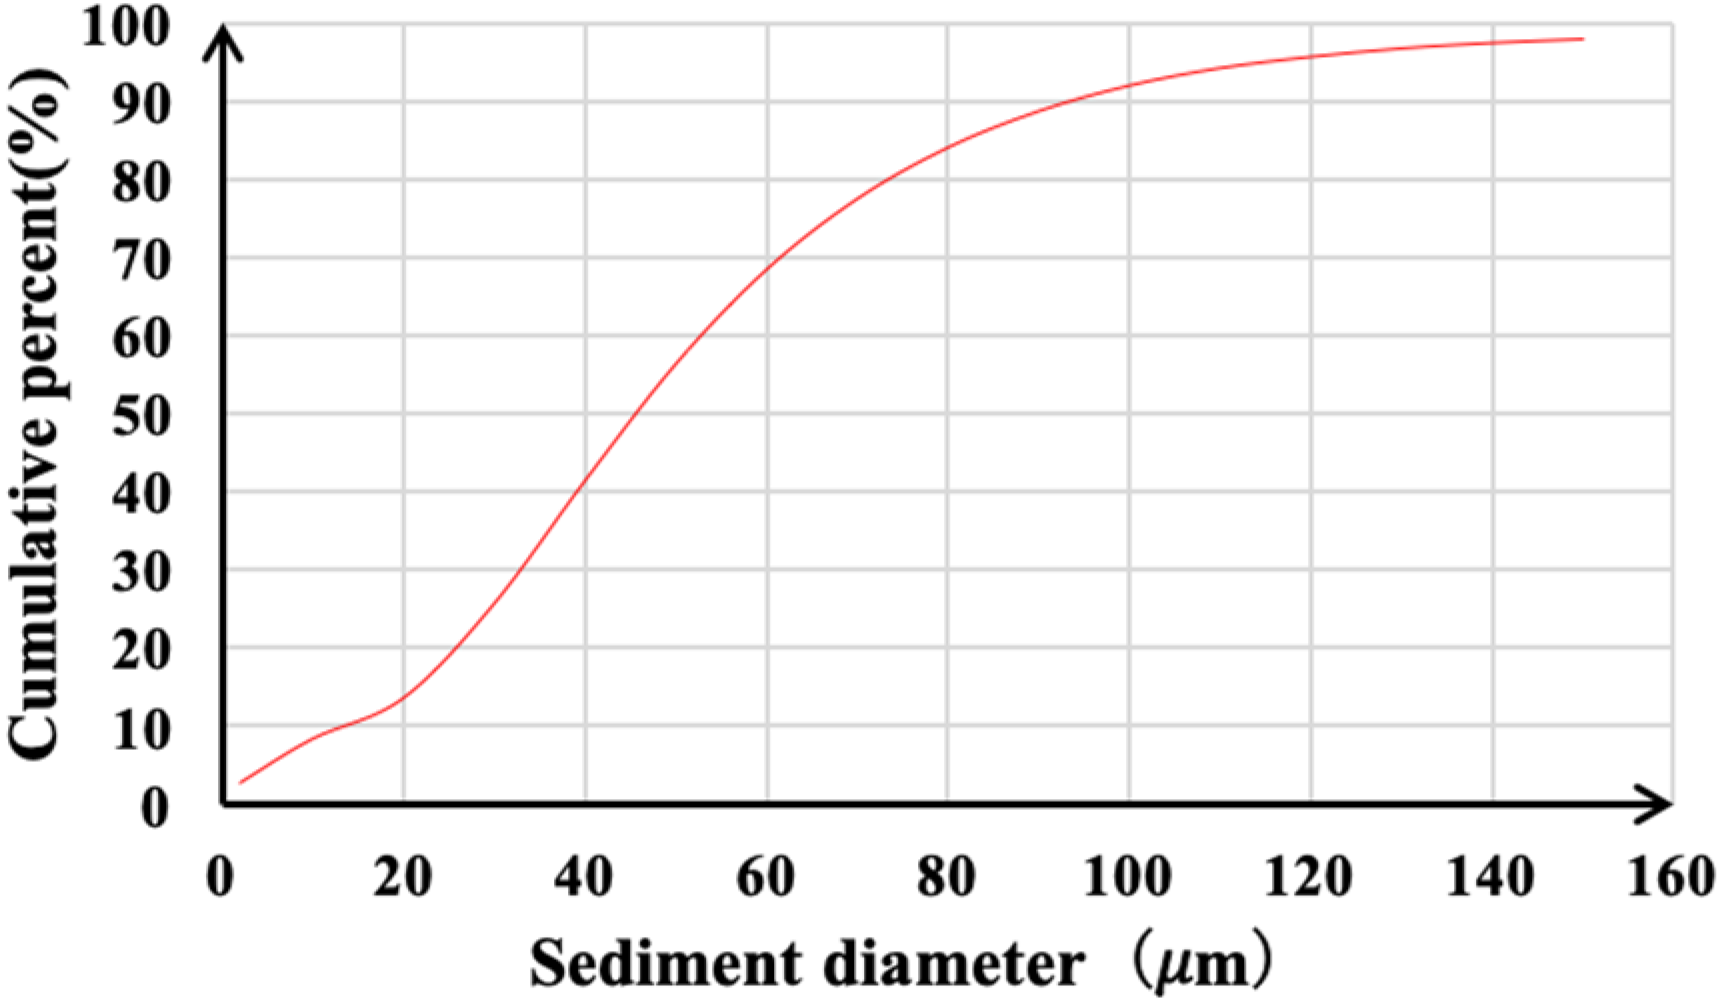
- Except for some locations, the characteristic particle sizes at different locations on the tank bottom gradually decreased along the x direction. As for the particle size in the inclined tubes, it was larger in the lower part than in the upper part, and it was larger in the left tubes near the overflow weir than in the right tubes. The results showed that the effective vertical working height of the inclined tubes should be 70–90 cm, and the particle size of d90 at the outlet of the inclined tubes was significantly smaller than that in the test water source.
- (3)
- The water inlet, baffle, and overflow weir would reduce the fine sediment removal and require further optimization.
Author Contributions
Funding
Acknowledgments
Conflicts of Interest
References
- Han, S.; Li, Y.; Xu, F.; Sun, D.; Feng, J.; Liu, Z.; Wu, R.; Wang, Z. Effect of lateral flushing on emitter clogging under drip irrigation with Yellow River water and a suitable method. Irrig. Drain. 2018, 67, 199–209. [Google Scholar] [CrossRef]
- Li, Q.; Song, P.; Zhou, B.; Xiao, Y.; Muhammad, T.; Liu, Z.; Zhou, H.; Li, Y. Mechanism of intermittent fluctuated water pressure on emitter clogging substances formation in drip irrigation system utilizing high sediment wate. Agric. Water Manag. 2019, 215, 16–24. [Google Scholar] [CrossRef]
- Zhou, H.; Li, Y.; Wang, Y.; Zhou, B.; Bhattarai, R. Composite fouling of drip emitters applying surface water with high sand concentration: Dynamic variation and formation mechanism. Agric. Water Manag. 2019, 215, 25–43. [Google Scholar] [CrossRef]
- Bajcar, T.; Steinman, F.; Sirok, B.; Preseren, T. Sedimentation efficiency of two continuously operating circular settling tanks with different inlet- and outlet arrangements. Chem. Eng. J. 2011, 178, 217–224. [Google Scholar] [CrossRef]
- Bajcar, T.; Gosar, L.; Sirok, B.; Steinman, F.; Rak, G. Influence of flow field on sedimentation efficiency in a circular settling tank with peripheral inflow and central effluent. Chem. Eng. Process. Process Intensif. 2010, 49, 514–522. [Google Scholar] [CrossRef]
- Krebs, P. Success and shortcomings of clarifier modelling. Water Sci. Technol. 1995, 31, 181–191. [Google Scholar] [CrossRef]
- Goula, A.M.; Kostoglou, M.; Karapantsios, T.D.; Zouboulis, A.I. A CFD methodology for the design of sedimentation tanks in potable water treatment: Case study: The influence of a feed flow control baffle. Chem. Eng. J. 2008, 140, 110–121. [Google Scholar] [CrossRef]
- Tamayol, A.; Firoozabadi, B.; Ahmadi, G. Effects of inlet position and baffle configuration on hydraulic performance of primary settling tanks. J. Hydraul. Eng. 2008, 134, 1004–1009. [Google Scholar] [CrossRef]
- Shahrokhi, M.; Rostami, F.; Said, M.A.M. Numerical modeling of baffle location effects on the flow pattern of primary sedimentation tanks. Appl. Math. Model. 2013, 37, 4486–4496. [Google Scholar] [CrossRef]
- Shahrokhi, M.; Rostami, F.; Said, M.A.M.; Yazdi, S.R.S.; Syafalni, S. Computational investigations of baffle configuration effects on the performance of primary sedimentation tanks. Water Environ. J. 2013, 27, 484–494. [Google Scholar] [CrossRef]
- Shahrokhi, M.; Rostami, F.; Said, M.A.M.; Yazdi, S.R.S.; Syafalni, S.; Abdullah, R. The effect of baffle angle on primary sedimentation tank efficiency. Can. J. Civil. Eng. 2012, 39, 293–303. [Google Scholar] [CrossRef]
- Shahrokhi, M.; Rostami, F.; Said, M.A.M.; Yazdi, S.R.S.; Syafalni, S. The effect of number of baffles on the improvement efficiency of primary sedimentation tanks. Appl. Math. Model. 2012, 36, 3725–3735. [Google Scholar] [CrossRef]
- Csépai, L.; Kabelka, H. Practical testing of automatically controlled overflow weirs. Water Res. 1996, 30, 749–752. [Google Scholar] [CrossRef]
- Zong, Q.; Liu, H.; Tang, H.; Wu, J. Study of effect of spillway trough on spillway crest length of settling basin. J. Sediment Res. 2011, 3, 67–72. [Google Scholar]
- Hua, G.; Liu, H.; Tang, H.; Zong, Q.; Gao, X. Experimental study of effect on sediment deposition in the new-type rectangular settling tanks. China Water Resour. 2010, 5, 8–10. [Google Scholar]
- Zhang, Y.; Zhang, Y.; Chang, Z. An experimental study of hydraulic characteristics on automatic flushing desilting basin. J. Irrig. Drain. 2009, 28, 78–82. [Google Scholar]
- Wu, J.; Zong, Q.; Liu, H.; Liu, C. Experiment study of flow’s adjusting with flow board in sediment basin. J. Water Resour. Water Eng. 2007, 18, 6–9. [Google Scholar]
- Aldulaimi, S.M.S.; Racoviteanu, G. Performance of the tube settler clarification at different inclination angles and variable flow rate. Math. Model. Civ. Eng. 2018, 14, 13–25. [Google Scholar] [CrossRef]
- Culp, G.; Hansen, S.P.; Richardson, G. High-rate sedimentation in water treatment works. J. Am. Water Works Assoc. 1968, 60, 681–698. [Google Scholar] [CrossRef]
- Fouad, H.A.; Elhefny, R.M.; Marei, A. Evaluating the use of tube settlers and lamella plates in Increasing the efficiency of sedimentation tanks. J. Appl. Life Sci. Int. 2016, 7, 1–8. [Google Scholar] [CrossRef] [PubMed]
- Fujisaki, K. Improvement of settling tank performance using inclined tube settlers. Water Resour. Manag. III 2005, 80, 475–484. [Google Scholar]
- Gurjar, A.; Bhorkar, M. Performance study of tube settlers module. Int. J. Eng. Res. Appl. 2017, 07, 52–55. [Google Scholar] [CrossRef]
- Hassan, M.S.; Hassan, A.H. The efficiency of using tube settlers technique in comparison with the conventional treatment in Mosul city water treatment. Al Rafadain Eng. J. 2009, 19, 26–34. [Google Scholar] [CrossRef]
- Yao, K.M. Design of high-rate settlers. J. Environ. Eng. Division 1973, 99, 621–637. [Google Scholar]
- Sarkar, S.; Kamilya, D.; Mal, B. Effect of geometric and process variables on the performance of inclined plate settlers in treating aquacultural waste. Water Res. 2007, 41, 993–1000. [Google Scholar] [CrossRef]
- Salem, A.; Okoth, G.; Thöming, J. An approach to improve the separation of solid–liquid suspensions in inclined plate settlers: CFD simulation and experimental validation. Water Res. 2011, 45, 3541–3549. [Google Scholar] [CrossRef]
- Balwan, K.S.; Mujawar, A.; Karake, M. To Study the Effect of Tube Settler on Clarification; LAP LAMBERT Academic Publishing: Beau Bassin, Mauritius, 2018. [Google Scholar]
- Subramani, T.; Thomas, S. Experiments on tube settler for the treatment of Fbw and optimization of plant operation for residual reduction. Int. J. Eng. Res. Appl. 2012, 2, 190–203. [Google Scholar]
- Demir, A. Determination of settling efficiency and optimum plate angle for plated settling tanks. Water Res. 1995, 29, 611–616. [Google Scholar] [CrossRef]
- Abdolzadeh, M.; Mehrabian, M.; Goharrizi, A.S. Numerical study to predict the particle deposition under the influence of operating forces on a tilted surface in the turbulent flow. Adv. Powder Technol. 2011, 22, 405–415. [Google Scholar] [CrossRef]
- Bandrowski, J.; Hehlmann, J.; Merta, H.; Zioło, J. Studies of sedimentation in settlers with packing. Chem. Eng. Process. Process. Intensif. 1997, 36, 219–229. [Google Scholar] [CrossRef]
- Xie, M.; Shi, Z.; Liu, X. The motion and removal efficiency of particles in circular tube settlers. In Proceedings of the 2009 International Conference on Energy and Environment Technology, Guilin, China, 16–18 October 2009; Volume 1, pp. 437–440. [Google Scholar]
- Ignjatović, L. Efficient (tube) settling tanks. Water Sci. Technol. 1991, 24, 223–228. [Google Scholar] [CrossRef]
- Casonato, M.; Gallerano, F. A finite difference self-adaptive mesh solution of flow in a sedimentation tank. Int. J. Numer. Methods Fluids 1990, 10, 697–711. [Google Scholar] [CrossRef]
- Liu, X.; García, M.H. Computational fluid dynamics modeling for the design of large primary settling tanks. J. Hydraul. Eng. 2010, 137, 343–355. [Google Scholar] [CrossRef]
- Maruejouls, T.; Vanrolleghem, P.A.; Pelletier, G.; Lessard, P. A phenomenological retention tank model using settling velocity distributions. Water Res. 2012, 46, 6857–6867. [Google Scholar] [CrossRef] [PubMed]
- Niu, W.; Liu, L.; Chen, X. Influence of fine particle size and concentration on the clogging of labyrinth emitters. Irrig. Sci. 2013, 31, 545–555. [Google Scholar] [CrossRef]
- Zhang, J.; Shi, K.; Gao, Y.; Wang, J. Turbid water desilting characteristics of circular-ring desilting and sediment ejection basin. Trans. Chin. Soc. Agric Eng. 2014, 30, 86–93. [Google Scholar]
- Doroodchi, E.; Fletcher, D.F.; Galvin, K.P. Influence of inclined plates on the expansion behaviour of particulate suspensions in a liquid fluidised bed. Chem. Eng. Sci. 2004, 59, 3559–3567. [Google Scholar] [CrossRef]
- Laux, H.; Ytrehus, T. Computer simulation and experiments on two-phase flow in an inclined sedimentation vessel. Powder Technol. 1997, 94, 35–49. [Google Scholar] [CrossRef]
- Schlieper, L.; Chatterjee, M.; Henschke, M.; Pfennig, A. Liquid–liquid phase separation in gravity settler with inclined plates. AIChE J. 2004, 50, 802–811. [Google Scholar] [CrossRef]
- Clay Mcmichael, F. Sedimentation in inclined tubes And its application for the design of high rate sedimentation devices. J. Hydraul. Res. 1972, 10, 59–75. [Google Scholar] [CrossRef]
- Yao, K. Theoretical study of high-rate sedimentation. J. (Water Pollut. Control Fed.) 1970, 42, 218–228. [Google Scholar]
- Zhou, S.; McCorquodale, J.A. Modeling of rectangular settling tanks. J. Hydraul. Eng. 1992, 118, 1391–1405. [Google Scholar] [CrossRef]
- Lv, X.; Zou, Q.; Reeve, D. Numerical simulation of overflow at vertical weirs using a hybrid level set/VOF method. Adv. Water Resour. 2011, 34, 1320–1334. [Google Scholar] [CrossRef]
- Chen, Y.; Fu, Z.; Chen, Q.; Cui, Z. Discharge coefficient of rectangular short-crested weir with varying slope coefficients. Water 2018, 10, 204. [Google Scholar] [CrossRef]
- Khode, B.; Tembhurkar, A.; Porey, P.; Ingle, R. Experimental studies on flow over labyrinth weir. J. Irrig. Drain. Eng. 2011, 138, 548–552. [Google Scholar] [CrossRef]


| Case | |||
|---|---|---|---|
| Case 1 | 3–3.5 kg/m3 | 1.06 kg/m3 | 64.7–69.7% |
| Case 2 | 3–3.5 kg/m3 | 2.38 kg/m3 | 20.7–32% |
© 2020 by the authors. Licensee MDPI, Basel, Switzerland. This article is an open access article distributed under the terms and conditions of the Creative Commons Attribution (CC BY) license (http://creativecommons.org/licenses/by/4.0/).
Share and Cite
Wang, K.; Li, Y.; Ren, S.; Yang, P. A Case Study on Settling Process in Inclined-Tube Gravity Sedimentation Tank for Drip Irrigation with the Yellow River Water. Water 2020, 12, 1685. https://doi.org/10.3390/w12061685
Wang K, Li Y, Ren S, Yang P. A Case Study on Settling Process in Inclined-Tube Gravity Sedimentation Tank for Drip Irrigation with the Yellow River Water. Water. 2020; 12(6):1685. https://doi.org/10.3390/w12061685
Chicago/Turabian StyleWang, Keyuan, Yunkai Li, Shumei Ren, and Peiling Yang. 2020. "A Case Study on Settling Process in Inclined-Tube Gravity Sedimentation Tank for Drip Irrigation with the Yellow River Water" Water 12, no. 6: 1685. https://doi.org/10.3390/w12061685
APA StyleWang, K., Li, Y., Ren, S., & Yang, P. (2020). A Case Study on Settling Process in Inclined-Tube Gravity Sedimentation Tank for Drip Irrigation with the Yellow River Water. Water, 12(6), 1685. https://doi.org/10.3390/w12061685