Article

Removal of Herbicides from Landfill Leachate in Biofilters Stimulated by Ammonium Acetate

by
Nadia Brogård Nord
1,
Nils M. Sevelsted Berthelsen
2,
Hasse Milter
2 and
Kai Bester
1,*
1
Department of Environmental Science, Aarhus University, Frederiksborgvej 399, 4000 Roskilde, Denmark
2
Region Zealand, Alléen 15, 4180 Soroe, Denmark
*
Author to whom correspondence should be addressed.
Water 2020, 12(6), 1649; https://doi.org/10.3390/w12061649
Submission received: 5 May 2020 / Revised: 4 June 2020 / Accepted: 4 June 2020 / Published: 9 June 2020
(This article belongs to the Section Wastewater Treatment and Reuse)

Abstract

:
At a former Danish polluted landfill, a field experiment using biofilters as an ex-situ remediation strategy for leachate water was carried out. The leachate water was polluted with phenoxy acids, mecoprop, dichlorprop, and their impurities originated from previous years of disposal of production wastes. Three individual biofilters were set up and each was filled with different a support material, e.g., sand, stonewool, and peat amended sand. The sand biofilter was spiked with ammonium acetate in pulses lasting a week to stimulate biomass growth and thereby enhance the removal of the phenoxy acids. The effects on removal and enantioselectivity were studied during a 69-day sampling campaign. Results showed that stimulation of the microbial community with ammonium acetate provided a boost, hence removal in the sand biofilter increased after the dosing whereas the stonewool and peat biofilters showed generally low removal. The highest removal was observed after stimulation in the sand biofilter for both herbicides. After a starting period, the removal was compound-specific but ranged from 60–100%. The final concentrations exceeded the drinking water limits slightly (0.25 µg L−1) (mecoprop and 2-(2/4-chlorophenoxy)propanoic acid), while it was considerably below the limit for all other compounds (2-(2-methylphenoxy)propanoic acid and dichlorprop). Enantioselective fractions were already 0.41, and 0.75 for mecoprop and dichlorprop, respectively, in the inlet, probably due to in-situ degradation in the landfill—Mecoprop showed some enrichment of the (R)-enantiomer in the sand biofilter whereas no real trends were seen in the stonewool and peat biofilter. Only minor alterations in enantiomeric fractions were observed for dichlorprop in all three biofilters. This experiment shows that it is feasible to remove micropollutants from landfill leachates and it is possible to stimulate biomass and thereby initiate and obtain increased removal faster.

Graphical Abstract

1. Introduction

Groundwater is currently the major source for drinking water production all over the world and especially in Denmark where treatment of raw groundwater is legally limited to removal of manganese, iron, and some gases, e.g., hydrogen sulfide [1]. In practice, this implies a high protection level of groundwater against contamination. Therefore, remediation strategies avoiding xenobiotics entering the aquifers from contaminated point sources are a focus area of high priority [2]. The unawareness of potential risks of xenobiotics in earlier times has caused pesticide concentrations above the EU limit of 0.1 µg L−1 in drinking water-wells, as observed by the Danish surveillance program, and thus a multitude of wells had to be closed down [3].
Phenoxy acid herbicides, including the compounds 2-(2,4-dichlorophenoxy)propanoic acid (dichlorprop (DCPP)) and 2-(4-chloro-2-methylphenoxy)propanoic acid (mecoprop (MCPP)), are among the pesticides frequently found in contaminated wells for drinking water production [3]. MCPP and DCPP are particular a problem in old landfills where improper waste disposal and spillage has occurred [4]. Their hydrophilic nature makes them a risk of leaching into aquifers, as they are not retained much by the soil [5]. Normally some degradation of such pesticides, e.g., mecoprop can take place in the topsoil under aerobic conditions [6]. However, once in the subsurface or aquifers they often become recalcitrant due to the low/no oxygen availability (see review by Buss et al. [7]). Reductive dechlorination has been observed at contaminated sites due to anaerobic processes under iron-reducing conditions [8]. Figure S1 in the Supplementary Material shows the aerobic and anaerobic degradation pathway of MCPP and DCPP.
MCPP and DCPP are chiral pesticides, and it is the (R)-enantiomer, which possesses herbicidal activity although in earlier times both compounds were produced as racemates (R:S = 1:1). Since the 1980s advances in asymmetric synthesis made it possible to produce enantiopure compounds for the pesticide market [9]. The enantiomers usually have different toxicity and biodegradation pathways [10] which may result in different reaction rates in aquifers and soils [11] caused by not only enantioselective metabolism but also enantioselective uptake [12]. In a review, Müller and Kohler [13] proposed an enantioselective degradation pathway by two microorganisms—Alcaligenes denitrificans and Sphingomonas herbicidovorans MH—possessing enantio-specific genes. It seems the reactions of MCPP and DCPP to 2,4-dichlorphenol and 4-chloro-2-methylphenol, respectively (Figure S1), are enantioselective. Previous studies have found generally degradation of the (S)-enantiomer to be favoured in both soil and water under aerobic conditions [14,15]. However, the enantio-preference seems to be dependent on the respective system, as Williams et al. [16] observed no degradation of (S)-enantiomer, and rapid degradation of (R)-enantiomer in a microcosm under nitrate-reducing conditions, and Frková et al. [15] determined different enantiomeric preference in the degradation depending on depth and redox of the respective soils. Monitoring the enantiomer composition can be used to obtain knowledge about biochemical fate and detect biologically reactions [17].
Treatment of point sources of pesticides can in some situations be handled in situ by monitored natural degradation, and experiments enhancing removal or/and kinetics with only minor interference, by addition of oxygen or bioaugumentation in the soil has been tested [18,19]. However, at the present studied experimental site, it was evaluated that natural attenuation was not an option even though some in situ degradation was observed. The resulting concentrations in the aquifer were still too high [4], and leachate had to be treated using pump and treat approaches. A remediation strategy in which polluted water is pumped up and treated at the site usually by filtering with granulated activated carbon (GAC) [20]. However, GAC can be costly, needs regeneration, and is often not effective for all pesticides. Rapid biofiltration is another approach that was successfully used before for polluted groundwater although removal only reached ~30%—likely due to the short residence time [21]. Hence, depending on hydraulic residence time, up to 90% removal of the pesticides can be reached by passing the contaminated water through a biofilter inhabited by pollutant-degrading bacteria [22,23,24,25].
Stimulation of natural degradation can in some cases be a tool for increased degradation rate and/or kinetics, accordingly, the addition of a simple carbon source, e.g., glucose could; (1) increase number or fraction of microorganisms able to degrade phenoxy acids, e.g., boost biomass [26], (2) promote co-metabolism [27,28], and/or (3) create competition between the substrate and pesticide resulting in a longer lag-phase prior to mineralization [29]. However, glucose addition has also shown to have a negative impact on mineralization [30].
This present work aimed to test whether amendment of ammonium acetate (NH4Ac) at a level at which oxygen was reduced without the system getting anaerobic could enhance removal and boost biomass in a classical sand biofilter. Our hypothesis suggests that stimulation can increase the indigenous microbial community increasing removal of DCPP and MCPP. To compare the strategy two additional biofilters—stonewool; and sand amended with peat—were set up. NH4Ac is not traditionally used since in addition to carbon as it also contains nitrogen, which could lead to nitrate-reducing conditions if the systems against expectations should lack oxygen. Furthermore, we used the enantiomeric fractioning of MCPP and DCPP during the experimental period to determine whether the stimulation would induce the biological degradation of one or the other enantiomers.

2. Materials and Methods

2.1. Pilot Site and Water Supply

The experimental site was Stengården in Hvalsø (Denmark) previously a landfill (55.5877° N, 11.8791° E), where disposal of empty pesticide containers were common from 1972–1985 but was since overgrown and unused. In 1995, a project was established to prevent leaching of pesticides into the groundwater by remediation pumping [4]. Currently, a treatment plant is pumping up leachate for subsequent treatment using advanced oxidation processes and GAC.
The raw leachate from the Stengården site contained high concentrations of iron and other salts thus prior to all treatments, the water was only subjected to a simple filtration (50 Micron filter cartridge from ATLAS Filtri, Italy) to mimic realistic conditions.

2.2. Construction of Biofilters

At Stengården test-site the three biofilter pilots were constructed using stainless steel tanks (height 1.35 m, radius 0.55 m, total volume 1.3 m3). The three biofilters were all provided with a 0.1 m bottom layer of gravel (11–16 mm) to allow unhindered outflow at the bottom and allow laminar flow from top to bottom. Each biofilter was filled with a different material; sand (0–2 mm from RAW A/S), “Rockflow” from ROCKWOOL® (Hedehusene, Denmark), and sand amended with 1% peat (Fagerhult unfertilized fine). A glass fiber mat (CSM 300 gr. Emulision m-2, Lintex, Chongfu, China) separated the layers in the sand, and peat amended biofilters. The biofilters will in the following be nominated as “sand”, “stonewool”, and “peat” referring to the support material in the tank. The two sand-based biofilters were filled from the top using a spiral conveyor simultaneously mixing in the peat (Figure S2). Construction of the stonewool biofilter consisted of six 0.2 m high layers with four pie-shaped pieces placed as seen in Figure S3. To avoid preferred water pathways between layers, it was shifted from layer to layer. One liter of activated sludge from Bjergmarken wastewater treatment plant (Roskilde, Denmark) was added on top of the filter packing before the degradation study to allow for a 6 months adaptation period with continuous operation. Based on pre-experiments determining the hydraulic properties the water flow was adjusted to 40 L h−1 for sand and peat, and 70 L h−1 for stonewool providing hydraulic retention times of ~16, and ~13 h, respectively. The hydraulic retention time (i.e., flow rate) varied over the experimental period with ±10 h; however, as sampling was conducted weekly, steady-state conditions were assumed.

2.3. Experimental Design

On the sand biofilter only we tested whether dosing of an additional extra carbon source, NH4Ac, could result in enhanced removal of phenoxyacids. Based on calculations outlined in [31] on biomass yield the aimed for concentration was estimated to 4 mg NH4Ac L−1. Theoretically, an inlet concentration of 4 mgO2 L−1 would mineralize 2.3 mg NH4Ac L−1, thus it was assumed that the remaining NH4Ac was converted to biomass. The average flow rate on the biofilter was set to 40 L h−1, which was then mixed with a separate stock solution of 10 g NH4Ac L−1 and pumped into the main flow at the head of the biofilter with 16 mL h−1 resulting in an NH4Ac dosage of 4 mg L−1 in the main flow of the sand biofilter.
The experiment progressed over 69 days, the sand biofilter was alternatively fed over 7-day periods either by NH4Ac amended landfill leachate or unamended landfill leachate. Samples were taken every 7th day at the end of each interval. During the entire period, the stonewool and peat biofilters were solely fed by landfill leachate.

2.4. Oxygen and Total Organic Carbon and Nitrogen (TOC/TN)

Oxygen was measured using an oxygen probe sensor with fiber-optic (Witrox oxygen meter, Loligo Systems, Viborg, Denmark) and logging data with the WitroxViev software.
Samples for total organic carbon (TOC) and total nitrogen (TN) were collected in 40 mL centrifuge tubes and stored at −18 °C until analysis after which they were thawed to room temperature. Measurements were done using a TOC-L CPN coupled to a TNM-L ROHS analyzer connected to an auto-sample (SHIMADZU, Tokyo, Japan). Samples were stirred magnetically in the auto-sampler, thus results could include undissolved carbon particles from the raw leachate. Limit of detection was 0.05 mg L−1 and 0.02 mg L−1 for TOC and TN, respectively.

2.5. Chemicals

Chemicals used were of analytical grade. Phenoxy acids MCPP and DCPP, and 7 metabolites: 2,4-Dichlorophenol (2,4-DCP), 2-(2-Methyl Phenoxy)propanonic Acid (MPP), 3-Methylcatechol (3-MeCat), 4-Chlorocatechol (4-ClCat), 2-(2/4-chlorophenoxy)propanoic Acid (CPP), Mecoprop sulfate (MCPP-sulfate), and 4-chloro-2-methylphenol (4-CloCr). Further information, e.g., CAS-number, structure, and supplier can be found in supplementary information (Table S1).

2.6. Quantification of Phenoxyacids

Samples were collected in 4 mL glass vials successively, 900 µL of sample was transferred into a HPLC-vial, and 100 µL of methanolic internal standard (containing D3 Mecoprop and D6 Dichlorprop (Table S2)) was added before it was vortexed (MS2 Minishaker, IKA®, Staufen, Germany) for ~10 s. Samples were stored at −20 °C until analysis but by then centrifuged for 10 min at 6000 rpm (Z206A, Hermle, Wehingen, Germany) to reduce particles in suspension.
MCPP, DCPP, and their metabolites were analyzed on an Ultimate 3000 (Dionex, Thermo Fisher Scientific Inc., CA, USA) coupled to a triple quadrupole mass spectrometer (API 4000™, AB Sciex, Framingham, MA, USA). Parents, CPP, MPP, and MCPP-sulfate were separated on an Acquity UPLC® CSH™ column (2.1 × 30 mm, Fluoro-Phenyl 1.7 μm) from Waters (Milford, MA, USA) using a multi-step gradient elution with 0.2% formic acid in HPLC-water, and 0.2% formic acid in methanol as mobile phases. Metabolites; 2,4-DCP, 3-MeCat, 4CloCr, and 4-ClCat separation were performed at 20 °C using a Synergi Polar RP column (150 × 2 mm, 4 µm) (Phenomenex, Torrance, CA, USA) with a multi-step gradient elution. Further information can be found in supplementary information (Tables S3 and S4). Enantio-separation of MCPP and DCPP were performed on a Nucleodex α-PM column (20 × 4 mm, 5 μm) from Macherey-Nagel (Düren, Germany) following the HPLC-method described in Frková et al., [15]. Confirmation on DCPP and MCPP enantiomers were performed by a single injection of an enantiopure solution of the (R)-enantiomers. The enantiomer elution order was (R) before (S) for both compounds.
All quantifications were performed using a 7-point calibration ranging from 0.05 µg L−1 to 30 µg L−1 linked to an internal standard using Analyst 1.6 software (SCIEX, Framingham, MA, USA). Details on the limit of quantification (LOQ) and detection (LOD) from calibration lines are provided in supplementary material (Table S5). The relative standard deviation (%) from the different calibration points was between 10–15%, hence ±15% was selected for the error bars in the Figures.
Removal rate was calculated using Equation (1)
Removal (%) = (CinCout)/Cin × 100
where Cout and Cin were concentrations from the outlet and inlet, respectively. In cases were concentrations were unquantifiable, the respective LOD was used as Cout.
The concentrations of individual MCPP and DCPP enantiomers were calculated into enantiomeric fractions (EF) used as a standardized measure according to Equation (2) [32].
EF = C(R)/(C(R)+C(S))
where C(R), and C(S) were concentration of (R)- and (S)-enantiomers.

3. Results and Discussion

3.1. Oxygen, TOC, and TN

Oxygen inlet concentrations were ~4 mgO2 L−1, whereas the outlet concentrations of all three biofilters were between 1–2 mgO2 L−1 (Figure S4). This points towards the systems not being limited by oxygen, and within oxic to suboxic conditions (>0.5 mgO2 L−1). However, the outlet pipe construction might have led to oxygen diffusion into the leachate during measurements resulting in small offset to high concentrations as experienced before [31]. Thus, it was strongly suspected that the systems had anoxic pockets present but overall was oxic.
Despite the iron precipitation and filtration as a pre-treatment, in all biofilters, a high amount of iron oxide precipitations affected the hydraulics. The clay-like material settled on the surfaces complicating the infiltration of the water into the biofilter—at full-scale, a plant layer can possibly prevent this effect to some extent. Species like Juncus effusus and Eriophorum augustifolium have been found most Fe-tolerant among a group of wetland species [33].
Results from all biofilters generally showed considerably increased removal of TOC over time, i.e., 10–50%. TN in the inflow was close to zero from day 0 to 41, and only minor increases towards the end of the experiment were determined (Figure 1) (absolute numbers can be seen in Table S6).
The addition of NH4Ac to the sand biofilter did not result in enhanced concentrations of TOC in the outlet compared to the inlet when accounting for the quantitative addition by NH4Ac. Indeed, TOC was removed which indicates a system limited on carbon sources. Removal of TN in the sand biofilter was close to 0% or negative on almost all sampling days (day; 20, 27, 34, 55, 62, and 69) successive the first addition of NH4Ac (Figure 1). This may be due to the already elevated concentrations of TN (17.8 ± 1.5 mg L−1) in the raw leachate. The additional nitrogen from the NH4Ac seemed to have little effect on the sand biofilter system; thereby it is likely that no denitrification took place. The total nitrogen removal in the peat and stonewool biofilters were indistinguishable from zero as well except for a few days where it was between 20–60%. Whether this is due to denitrification (improbable due to low carbon in the inflow) or growing biomass is not determined.
Overall, there was no extra emission from the biofilters, due to the feeding, and all standard parameters were similar or less when comparing the outflow with the inflow into the biofilters, which is preferable considering applications in full-scale.

3.2. Phenoxyacids and Metabolites

The average inlet concentrations were in agreement with previous results [4]. Probably due to the biodegradation processes and production impurities in the dumpsite, the inlet concentrations of DCPP (0.2 µg L−1) were lower than those of its metabolite, CPP (3.1 µg L−1), whereas the opposite was observed for MCPP (1.4 µg L−1), and MPP (0.3 µg/L−1) (see Table S7). Already at the inlet water CPP and MPP were present indicating towards anaerobic degradation (reductive dechlorination) most likely occurred within the landfill. Metabolites in the inlet samples do not necessarily prove degradation in themselves, as impurities in the herbicide products can make up to 30%. However, in this case, CPP concentrations were so high that natural attenuation was strongly suspected [34]. The parents and two metabolites followed a similar degradation-pattern, thus most of the times either removal or formation were observed. To determine further degradation of CPP, and MPP, one could have analyzed, e.g., phenols, 2-(2-(hydroxymethyl)phenoxy)propanoic acid, and 2-phenoxypropanoic acids. These are degradation products from CPP and MPP suggested by EAWAGs pathway prediction tool based on theoretical considerations [35]. Those included in the analysis (mainly aerobic products, see Figure S1) do not consider further degradation of anaerobic products.

3.2.1. Sand Biofilter

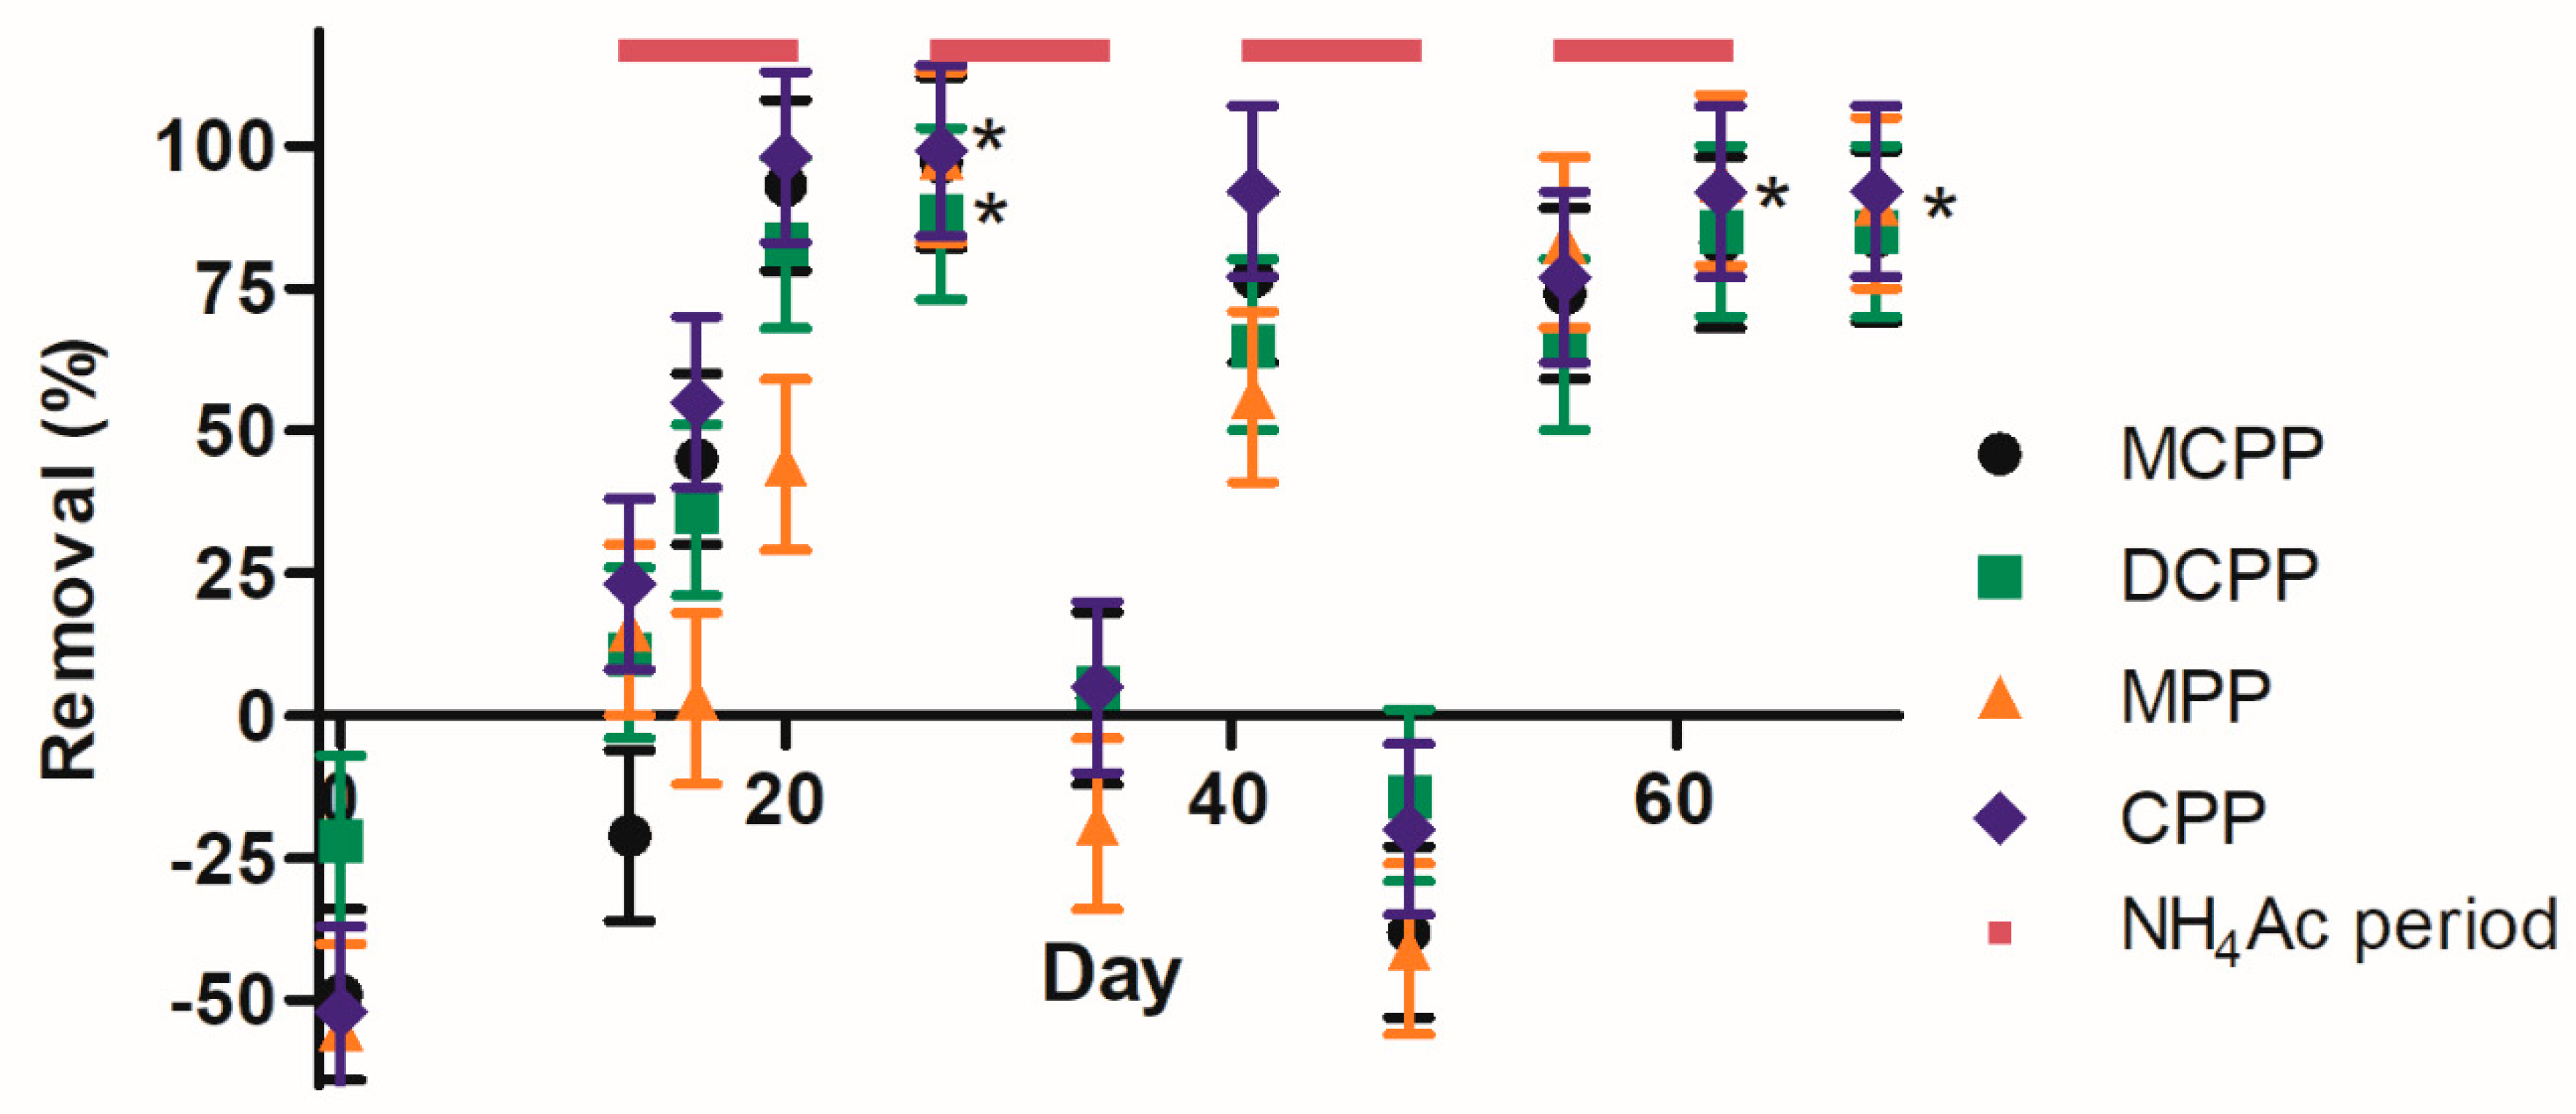
Removal of phenoxy herbicides and their metabolites in the sand biofilter during the experiment is presented in Figure 2. From day 0 to 27, a gradual increase from 0% to 100% removal can be observed for all compounds. The removal was continued throughout the experiment with no further changes of removal except for two sampling periods with considerably decreased removal at day 34 and 48. The initial increase in removal seems to be due to the start of the addition of NH4Ac from day 13 where NH4Ac seems to have boosted the biomass as hypothesized, thus a high removal was established (Figure 2). After this establishment, further NH4Ac dosing had little to no effect, or was maybe even detrimental, as low removal at the end of additional feeding events on day 34 and 48 could be seen as competitive inhibition. Additionally, decreased water flow (due to unnoticed pump problems) under continuous NH4Ac dosage or increased TOC from the leachate could have caused oxygen minima as we were feeding NH4Ac at levels nearly all oxygen could be consumed under regular operation and partial anoxic conditions during the feeding cannot be excluded. Decreased removal due to anoxic conditions could lead to low or no degradation of phenoxy acids in aquifer sediment with no oxygen present [36]. However, the high removal was again established in the next non-NH4Ac amended period. Decreasing removal was not always observed at the end of NH4Ac feeding periods (day 20 and 62). It might be advisable to only provide extra carbon-sources at the beginning of such biofilters and discontinue or decrease after 30 days or have longer intermittent periods. Interestingly, no formation of those metabolites that were analyzed was observed in the biofilters. Those metabolites that were detected in the inflow were often removed during the biofiltration. Feld et al. [21] similarly found no formation of metabolites targeted for during rapid sand filtration of groundwater screening for the same phenoxy acids.

3.2.2. Peat and Stonewool Biofilters

During the 69 days, the peat biofilter showed overall removal for the different compounds (MCPP 9.5 ± 55.1%, DCPP 21.4 ± 41.8%, CPP 21 ± 59.3%, and MPP 41.9 ± 74.8% (n = 11)) (Figure S5). This was, generally speaking, less than in the sand filter and negative removal indicates towards formation, which does not make sense for the parent compounds. DCPP and CPP were more often removed to a higher amount, and unlike the sand biofilter, there seemed to be a compound-depended removal. MPP was often not removed at all, and was only detected during three days of removal, though it never exceeded 55%. This could be due to MCPP transformation into MPP; however, those two compounds were detected with constant ratios though, MCPP removal was higher (>50%). MPP is formed under anaerobic conditions thus the negative removal could be formation indicating more reduced conditions in the peat biofilter [37]. DCPP was present at 15-times lower concentrations than CPP in the inflow thus CPP formation if it occurred would have passed unnoted.
Removal in the stonewool biofilter was minimal from the beginning and did not increase noticeably throughout the experiment except for day 27 where removal of all four compounds was above 70%. At day, 48 and 55 DCPP removal increased (primarily for CPP ~50%) but returned to initial values in the last samples (Figure S6).
The stonewool and peat biofilters were not amended with NH4Ac thus the positive effect observed in the sand biofilter could indicate amendment as a tool to assist in biomass development (Figures S7 and S8). However, results of co-degradation of MCPP are ambiguous as, e.g., Casas et al. [14] found extended removal of mecoprop with the addition of methanol in a batch moving bed biofilm reactor (MBBR) experiment whereas Frková et al., [15] reported relatively slower degradation of MCPP in soil incubations concluding co-metabolism with a simple c-source (i.e., glucose) a less important mechanism in MCPP degradation. It should be taken into account that MCPP can be degraded by quite different microbial communities which might prefer different conditions [15]. In the same study Frková et al. [15] also observed nitrate as a potential inorganic electron acceptor increasing removal under anaerobic conditions. However, in the overall picture, it does not affect our total removal. de Lipthay et al. [29] attempted amendment with phosphate, casamino acids, and glucose but did not detect changes in total mineralization at environmental concentrations (1 µg kg−1) in samples of aquifer sediments. Interestingly, increased concentrations of mecoprop (10 and 100 µg kg−1) to the samples enhanced mineralization, albeit only after a lag-phase (~50 days).
Despite relatively high removal in the sand biofilter, the absolute concentrations were sometimes a factor two above the EU drinking water limit of 0.1 µg L−1 (Table S8). The most critical parameters being MCPP and CPP. Probably expanding retention time from 10–16 h to ~50 h would achieve concentrations <0.1 µg L−1 based on first-order kinetics extracted from the results. Hedegaard et al., [38] investigated the removal of MCPP at considerably lower concentrations (0.037 µg L−1) using full-scale rapid (HRT of 63 min) sand filters, detected removal of ~73% and reached final concentrations below 0.010 µg L−1. It should, however, be mentioned that inlet concentrations in Hedegaard et al., [38] were factor 10 lower than in our study, and as shown by Svendsen et al., [39] kinetics are often concentration, and/or compound dependent.

3.3. Enantioselectivity

3.3.1. Mecoprop

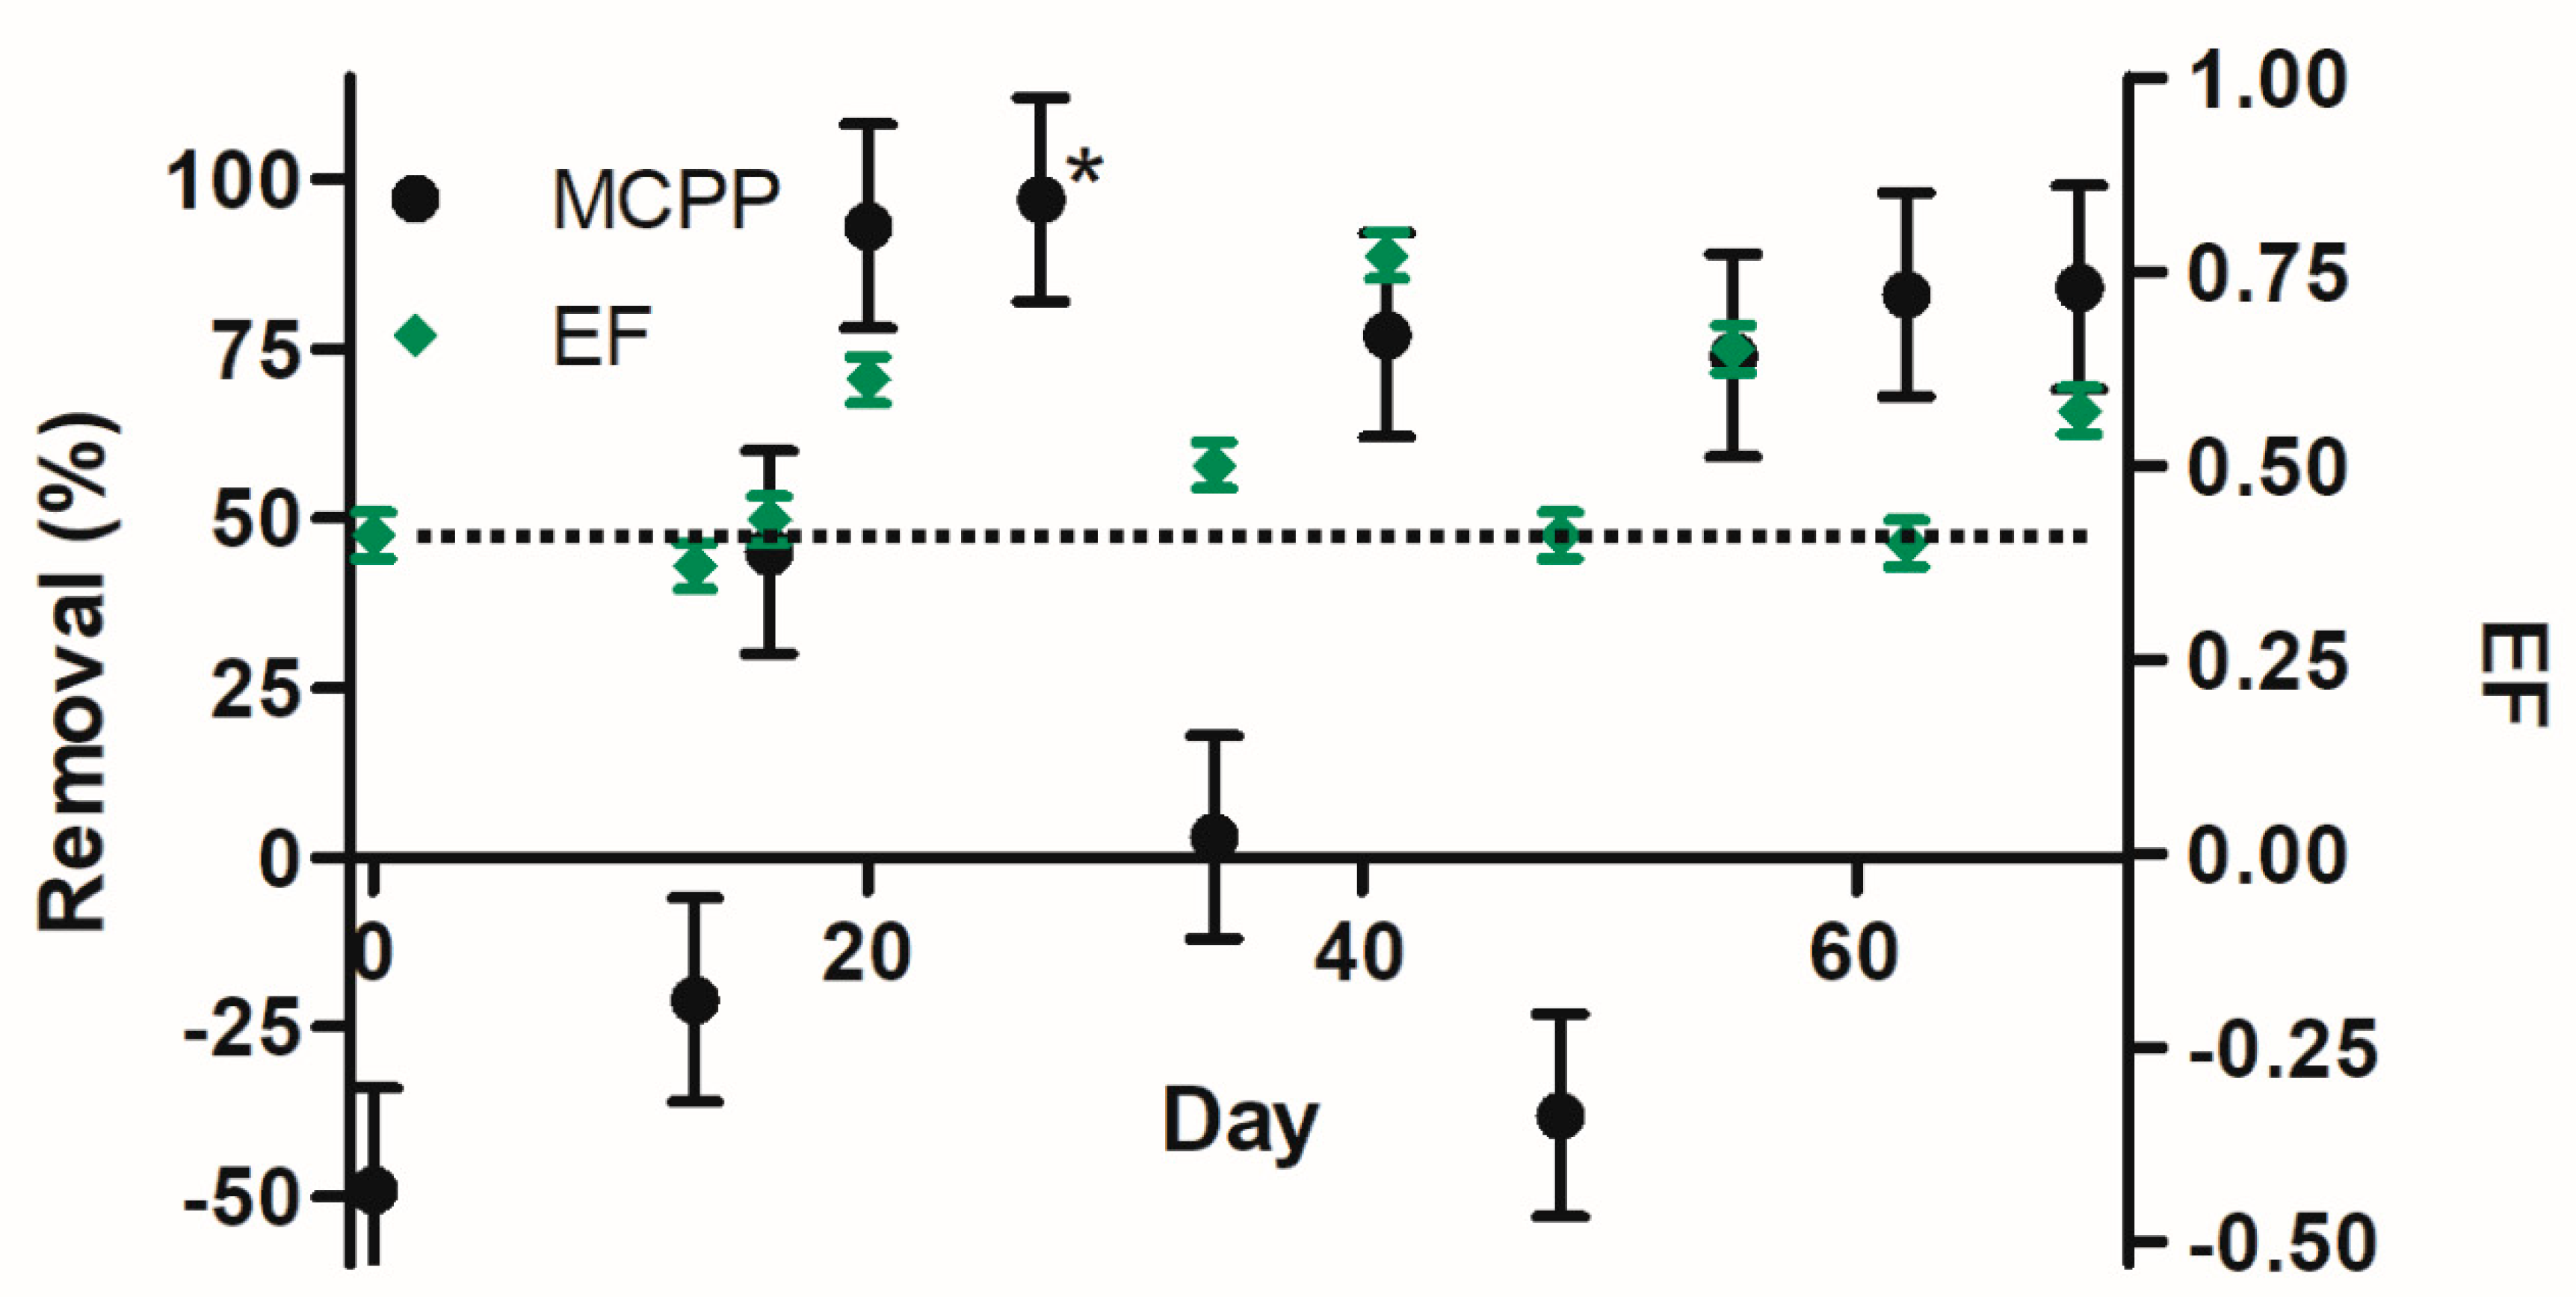
The EF of MCPP in the raw leachate (inflow of biofilter) was 0.41 ± 0.05 (Figure 3). Removal of MCPP in the sand biofilter exceeded 50% on days 20, 27, 41, 55, 62, and 69. This was accompanied by an increase in EF from the average inlet value of 0.42 to >0.5 at days 20, 41, 55, and 69. Thus, the (S)-enantiomers were degraded preferentially. This is in agreement with most aerobic degradation. For the stonewool biofilter, this trend towards elevated EF is only observed at day 55, while all other days the EF was unchanged. This finding agrees well with the low removal of MCPP in the stonewool biofilter. In the peat biofilter, no change in the EF was observed despite a removal rate higher 50% at days 13, 27, 62, and 69. This could indicate different microbial communities in the peat biofilter than in the sand biofilter. As mentioned, monitoring the enantiomeric composition was suggested as an indicator of biological degradation [17]; however, most results were derived from aerobic experiments with racemic mixtures [15]. Our experiment dealt with environmental concentrations and biofilters that possibly had anaerobic pockets during high loading with NH4Ac. Furthermore, as shown earlier (Supplementary Material Figure S1) not all degradation pathways are enantioselective.
An increase of the EF-value would indicate enrichment of the (R)-enantiomer in the effluent, thus likely faster degradation of the (S)-enantiomer as occurred to Williams et al., [16] during a field experiment under aerobic conditions. In addition, the same authors observed faster degradation of the (R)-enantiomer under nitrate-reducing conditions and speculated whether redox conditions affected enantioselective degradation. However, Rügge et al., [40] observed no preferential degradation during a field study in an aerobic aquifer. In accordance with Rügge et al., [40] our findings indicated predominantly non-enantioselective pathways probably focusing on oxidizing the aromatic systems of the molecule in biofilters. Although to the author’s knowledge this has not been investigated before.

3.3.2. Dichlorprop

(R)-enantiomer enrichment in the inlet water was detected as expected for DCPP [4] with average inlet enantioselective fraction (EF) of 0.75 ± 0.03.
The EF of DCPP in the effluent of the sand biofilter at days 41 and 62 had decreased to 0.51 and 0.56, respectively, indicating an enhanced degradation of the predominant (R)-enantiomer correspondingly the total removal of DCPP were of ~50% (Figure 4). At days 20 and 27 the removal exceeded 50% (outlet replaced with LOD) as well but both enantiomers were below LOD. Müller and Buser [41] observed a significantly slower degradation of the herbicidally active (R)-enantiomer than the (S)-enantiomer during a soil incubation experiment (35 days) of enantiopure DCPP. This was similar to Zipper et al., [12] who performed catabolic experiments with Sphingomonas herbicidovorans MH grown solely with dichlorprop as energy and carbon source. In our systems we did not determine kinetics thereby a direct linkage was difficult albeit EF was decreasing which points toward a system more prone towards the degradation of the (R)-enantiomer. These results are in disagreement with the above described trends. However, it should be noted that only a third of the total DCPP present was the (S)-enantiomer, which could slow down kinetics. For MCPP is known to be degraded by different organisms and under different ecological conditions with different enantio-preference [15]. Possibly this is also true for DCPP.
At day, 13 the DCPP in the effluent of the peat biofilter a decrease EF of 0.57, and a removal rate exceeding 50% was observed. This could be considered an outlier. Matamoros and Franco [42] found little changes of EF in a peat-soil column whereas EF declined in the sand column though both columns exhibited removal >65%. The columns were fed with agricultural run-off with a low organic matter content (COD: 31 mg L−1) spiked with DCPP and MCPP (10 µg L−1). Thus, different mechanisms or microorganisms might control degradation in the respective biofilters.
The stonewool biofilter had low removal, and thus as expected EF was more or less unchanged during the experiment except for day 27 where EF was 0.53 and the removal >50% for DCPP with both parameters indicating an enhanced biological process. However, similar to the peat biofilter, this was likely an outlier. Other experiments with the stonewool material confirmed that this material is less suited than sand as a support for a biofilter [31].
Overall changes in the EF combined with compound removal rate where in the overall picture only minor and not stabile during the sampling campaign, thus it is difficult to conclude something altogether.
Further perspectives for biofilters could be a combination of technologies. As discussed, high concentrations of the pollutants could be an advantage. To obtain high pollutant concentrations for sand filtration (catabolic conditions), Hylling et al. [43] proposed a hybrid treatment step in which pollutants were up concentrated via reverse-osmosis and then treated in a sand filter. Others have successfully tried to transfer pesticide-removal capabilities to microbial sand filter communities using natural plasmids [44].

4. Conclusions

Quantitative removal was achieved by the sand biofilter after the initial kick-starting with small doses of NH4Ac. Biofilms capable of degrading phenoxy acids were present in all three biofilters; however, natural biomass abundance was probably low, and therefore removal remained low especially in the biofilters without additional carbon sources, i.e., peat and stonewool. However, the addition of NH4Ac kick-started biomass growth resulting in quantitative removal (75–100%) in the sand biofilter. However, there were indications for that too high or too long dosing of NH4Ac is not beneficial. This paper is not recommending a continuous amendment but only amendment during the starting up of the biofilters. Final concentrations of the pesticide residues, though considerably decreased, still occasionally exceeded the EU drinking water limit of 0.1 µg L−1. However, this could most probably be overcome by increasing the hydraulic retention time somewhat.

Supplementary Materials

The following are available online at https://www.mdpi.com/2073-4441/12/6/1649/s1, Figure S1: Proposed degradation pathway of mecoprop and dichlorprop. Figure S2: Filling of the sand biofilter (left) and the stonewool biofilter from the top (right). Figure S3: Sketch of the construction of the biofilters and the design of the stonewool layers. Figure S4: Oxygen concentrations from the three biofilter systems outlet and at the inlet (SW = stonewool). Figure S5: Removal in the peat amended sand biofilter. Figure S6: Removal in the stonewool biofilter. Figure S7: Removal [%] of MCPP. Figure S8: Removal [%] of DCPP. Table S1: Information on compounds, CAS-numbers, structures, and suppliers used for analytical purpose. Table S2: Corresponding compounds of internal standard used the analytical methods. Table S3: HPLC-method for analysis of parents, and metabolites (CPP, MPP, and MCPP sulfate). Table S4: HPLC-method for analysis of metabolites (3-MeCat, 4-CloCr, 4-Clcat and 2,4-DCP). Table S5: LOQ and LOD of the analyzed compounds. Table S6: Total organic carbon (TOC) and nitrogen (TN) for inlet water, and outlet water from the biofilter systems. Table S7: Average inlet concentrations from the raw landfill leachate during the experimental period. Table S8: Outlet concentrations of the biofilter.

Author Contributions

Conceptualization, K.B., H.M., N.M.S.B. and N.B.N.; methodology, N.B.N. and K.B.; software, N.B.N.; validation, N.B.N., and K.B.; formal analysis, N.B.N.; investigation, N.B.N.; resources, K.B.; data curation, N.B.N.; writing—original draft preparation, N.B.N.; writing—review and editing, N.B.N., K.B., N.M.S.B., and H.M.; visualization, N.B.N.; supervision, K.B.; project administration, K.B.; funding acquisition, K.B. All authors have read and agreed to the published version of the manuscript.

Funding

This research was funded by Region Zealand. It also received funding via the BONUS CLEANWATER project which has received funding from BONUS (Art 185), funded jointly by the EU and Innovation Fund Denmark, Sweden’s innovation agency VINNOVA and the German Ministry for Education and Science (BMBF). TOC-L equipment was supported by the COWI foundation, Denmark.

Acknowledgments

The authors acknowledge Sidra Ilyas contributions before the actual start of the project with model and control experiments in the master’s thesis.

Conflicts of Interest

The authors declare no conflict of interest.

References

  1. Miljøstyrelsen Sådan Fremstilles Drikkevand. Available online: https://mst.dk/natur-vand/vand-i-hverdagen/drikkevand/saadan-fremstilles-drikkevand/ (accessed on 31 January 2020).
  2. Danish Environmental Protection Agency. Guidelines on Remediation of Contaminated Sites; Danish Environmental Protection Agency: Copenhagen, Denmark, 2002; Volume 7, p. 290. [Google Scholar]
  3. Thorling, L.; Ditlefsen, C.; Ernstsen, V.; Hansen, B.; Johnsen, A.R.; Troldborg, L. Grundvandsovervågning. Status og Udvikling 1989–2018; GEUS: Copenhagen, Denmark, 2019. [Google Scholar]
  4. Overheu, N.D.; Møller, M.G.; Jepsen, T.S.; Larsen, L.C.; Thomsen, J.; Tuxen, N. Tilvejebringelse af Beslutningsgrundlag for den Fremtidige Afværge på Stengårdens Losseplads; Orbicon: Roskilde, Denmark, 2015. [Google Scholar]
  5. Paszko, T.; Muszyński, P.; Materska, M.; Bojanowska, M.; Kostecka, M.; Jackowska, I. Adsorption and degradation of phenoxyalkanoic acid herbicides in soils: A review. Environ. Toxicol. Chem. 2016, 35, 271–286. [Google Scholar] [CrossRef] [PubMed] [Green Version]
  6. Rodriguez-Cruz, S.; Jones, J.E.; Bending, G.D. Field-scale study of the variability in pesticide biodegradation with soil depth and its relationship with soil characteristics. Soil Biol. Biochem. 2006, 38, 2910–2918. [Google Scholar] [CrossRef]
  7. Buss, S.; Thrasher, J.; Morgan, J.; Smith, J.W. A review of mecoprop attenuation in the subsurface. Q. J. Eng. Geol. Hydrogeol. 2006, 39, 283–292. [Google Scholar] [CrossRef]
  8. Milosevic, N.; Qiu, S.; Elsner, M.; Einsiedl, F.; Maier, M.P.; Bensch, H.K.V.; Albrechtsen, H.J.; Bjerg, P.L. Combined isotope and enantiomer analysis to assess the fate of phenoxy acids in a heterogeneous geologic setting at an old landfill. Water Res. 2013, 47, 637–649. [Google Scholar] [CrossRef] [PubMed]
  9. Williams, A. Opportunities for chiral agrochemicals. Pest Manag. Sci. 1996, 46, 3–9. [Google Scholar] [CrossRef]
  10. Tomlin, C.D.S. The Pesticide Manual: A World Compendium; Tomlin, C.D.S., Ed.; British Crop Production Council: Hampshire, UK, 1997; ISBN 9781901396188. [Google Scholar]
  11. Zipper, C.; Nickel, K.; Angst, W.; Kohler, H.P.E. Complete microbial degradation of both enantiomers of the chiral herbicide mecoprop [(RS)-2-(4-chloro-2-methylphenoxy)propionic acid] in an enantioselective manner by Sphingomonas herbicidovorans sp. nov. Appl. Environ. Microbiol. 1996, 62, 4318–4322. [Google Scholar] [CrossRef] [Green Version]
  12. Zipper, C.; Bunk, M.; Zehnder, A.J.B.; Kohler, H.P.E. Enantioselective uptake and degradation of the chiral herbicide dichlorprop [(RS)-2-(2,4-dichlorophenox)propanoic acid] by Sphingomonas herbicidovorans MH. J. Bacteriol. 1998, 180, 3368–3374. [Google Scholar] [CrossRef] [Green Version]
  13. Müller, T.A.; Kohler, H.P.E. Chirality of pollutants - Effects on metabolism and fate. Appl. Microbiol. Biotechnol. 2004, 64, 300–316. [Google Scholar] [CrossRef]
  14. Escolà Casas, M.; Nielsen, T.K.; Kot, W.; Hansen, L.H.; Johansen, A.; Bester, K. Degradation of mecoprop in polluted landfill leachate and waste water in a moving bed biofilm reactor. Water Res. 2017, 121, 213–220. [Google Scholar] [CrossRef]
  15. Frková, Z.; Johansen, A.; de Jonge, L.W.; Olsen, P.; Gosewinkel, U.; Bester, K. Degradation and enantiomeric fractionation of mecoprop in soil previously exposed to phenoxy acid herbicides—New insights for bioremediation. Sci. Total Environ. 2016, 569–570, 1457–1465. [Google Scholar] [CrossRef]
  16. Williams, G.M.; Harrison, I.; Carlick, C.A.; Crowley, O. Changes in enantiomeric fraction as evidence of natural attenuation of mecoprop in a limestone aquifer. J. Contam. Hydrol. 2003. [Google Scholar] [CrossRef]
  17. Wong, C.S. Environmental fate processes and biochemical transformations of chiral emerging organic pollutants. Anal. Bioanal. Chem. 2006, 386, 544–558. [Google Scholar] [CrossRef] [PubMed]
  18. Tsitnonaki, K.; Roost, S.; Larsen, L.C.; Andersen, K.; Johansen, A.; Gosewinkel, U.; Nielsen, T.K. Pilotprojekt—In Situ Test af Stimuleret Aerob Nedbrydning til Oprensning af Pesticidpunktkilder; Danish Environmental Protection Agency: Copenhagen, Denmark, 2017. [Google Scholar]
  19. Tuxen, N.; Reitzel, L.A.; Albrechtsen, H.J.; Bjerg, P.L. Oxygen-enhanced biodegradation of phenoxy acids in ground water at contaminated sites. Ground Water 2006, 44, 256–265. [Google Scholar] [CrossRef] [PubMed]
  20. Heijman, S.G.J.; Siegers, W.; Sterk, R.; Hopman, R. Prediction of breakthrough of pesticides in GAC-filters and breakthrough of colour in ion-exchange-filters. Water Sci. Technol. Water Supply 2002, 2, 103–108. [Google Scholar] [CrossRef]
  21. Feld, L.; Nielsen, T.K.; Hansen, L.H.; Aamand, J.; Albers, C.N. Establishment of bacterial herbicide degraders in a rapid sand filter for bioremediation of phenoxypropionate-polluted groundwater. Appl. Environ. Microbiol. 2015, 82, 878–887. [Google Scholar] [CrossRef] [Green Version]
  22. Bester, K.; Banzhaf, S.; Burkhardt, M.; Janzen, N.; Niederstrasser, B.; Scheytt, T. Activated soil filters for removal of biocides from contaminated run-off and waste-waters. Chemosphere 2011, 85, 1233–1240. [Google Scholar] [CrossRef]
  23. Carpenter, C.M.G.; Helbling, D.E. Removal of micropollutants in biofilters: Hydrodynamic effects on biofilm assembly and functioning. Water Res. 2017, 120, 211–221. [Google Scholar] [CrossRef]
  24. Casas, M.E.; Bester, K. Can those organic micro-pollutants that are recalcitrant in activated sludge treatment be removed from wastewater by biofilm reactors (slow sand filters)? Sci. Total Environ. 2015, 506–507, 315–322. [Google Scholar] [CrossRef] [Green Version]
  25. Hermes, N.; Jewell, K.S.; Schulz, M.; Müller, J.; Hübner, U.; Wick, A.; Drewes, J.E.; Ternes, T.A. Elucidation of removal processes in sequential biofiltration (SBF) and soil aquifer treatment (SAT) by analysis of a broad range of trace organic chemicals (TOrCs) and their transformation products (TPs). Water Res. 2019, 114857. [Google Scholar] [CrossRef]
  26. Kunc, F.; Rybářová, J. Effect of glucose on the amount of bacteria mineralizing 2,4-dichlorophenoxyacetic acid in soil. Folia Microbiol. (Praha) 1983, 28, 54–56. [Google Scholar] [CrossRef]
  27. Fischer, K.; Majewsky, M. Cometabolic degradation of organic wastewater micropollutants by activated sludge and sludge-inherent microorganisms. Appl. Microbiol. Biotechnol. 2014, 98, 6583–6597. [Google Scholar] [CrossRef]
  28. Zhang, L.; Carvalho, P.N.; Bollmann, U.E.; EI-taliawy, H.; Brix, H.; Bester, K. Enhanced removal of pharmaceuticals in a biofilter: Effects of manipulating co-degradation by carbon feeding. Chemosphere 2019, 236, 124303. [Google Scholar] [CrossRef]
  29. de Lipthay, J.R.; Sørensen, S.R.; Aamand, J. Effect of herbicide concentration and organic and inorganic nutrient amendment on the mineralization of mecoprop, 2,4-D and 2,4,5-T in soil and aquifer samples. Environ. Pollut. 2007, 148, 83–93. [Google Scholar] [CrossRef]
  30. Frková, Z.; Johansen, A.; Karlson, U.G. Mecoprop mineralization potential at oxygen-reduced conditions in subsoil with phenoxy acid contamination history. Soil Biol. Biochem. 2015, 84, 189–198. [Google Scholar] [CrossRef]
  31. Nord, N.B.; Bester, K. Can the removal of pharmaceuticals in biofilters be influenced by short pulses of carbon? Sci. Total Environ. 2020, 707, 135901. [Google Scholar] [CrossRef]
  32. Harner, T.; Wiberg, K.; Norstrom, R. Enantiomer fractions are preferred to enantiomer ratios for describing chiral signatures in environmental analysis. Environ. Sci. Technol. 2000, 34, 218–220. [Google Scholar] [CrossRef]
  33. Snowden, R.E.D.; Wheeler, B.D. Chemical changes in selected wetland plant species with increasing Fe supply, with specific reference to root precipitates and Fe tolerance. New Phytol. 1995, 131, 503–520. [Google Scholar] [CrossRef]
  34. Reitzel, L.A.; Tuxen, N.; Ledin, A.; Bjerg, P.L. Can Degradation Products Be Used as Documentation for Natural Attenuation of Phenoxy Acids in Groundwater? Environ. Sci. Technol. 2004, 38, 457–467. [Google Scholar] [CrossRef]
  35. Gao, J.; Ellis, L.B.M.; Wackett, L.P. The University of Minnesota Biocatalysis/Biodegradation Database: Improving public access. Nucleic Acids Res. 2009, 38, 488–491. [Google Scholar] [CrossRef]
  36. Levi, S.; Hybel, A.M.; Bjerg, P.L.; Albrechtsen, H.J. Stimulation of aerobic degradation of bentazone, mecoprop and dichlorprop by oxygen addition to aquifer sediment. Sci. Total Environ. 2014, 473–474, 667–675. [Google Scholar] [CrossRef] [Green Version]
  37. Mohn, W.W.; Tiedje, J.M. Microbial reductive dehalogenation. Microbiol. Rev. 1992, 56, 482–507. [Google Scholar] [CrossRef] [PubMed] [Green Version]
  38. Hedegaard, M.J.; Arvin, E.; Corfitzen, C.B.; Albrechtsen, H.J. Mecoprop (MCPP) removal in full-scale rapid sand filters at a groundwater-based waterworks. Sci. Total Environ. 2014, 499, 257–264. [Google Scholar] [CrossRef] [PubMed] [Green Version]
  39. Svendsen, S.; El-taliawy, H.; Bester, K. Concentration dependent degradation of pharmaceuticals in MBBR from wastewater treatment plant effluent. Water Res. submitted in June 2020.
  40. Rügge, K.; Juhler, R.K.; Broholm, M.M.; Bjerg, P.L. Degradation of the (R)- and (S)-enantiomers of the herbicides MCPP and dichlorprop in a continuous field-injection experiment. Water Res. 2002, 36, 4160–4164. [Google Scholar] [CrossRef]
  41. Buser, H.-R.; Müller, M.D. Conversion Reactions of Various Phenoxyalkanoic Acid Herbicides in Soil. 2. Elucidation of the Enantiomerization Process of Chiral Phenoxy Acids from Incubation in a D2O/Soil System. Environ. Sci. Technol. 1997, 31, 1960–1967. [Google Scholar] [CrossRef]
  42. Matamoros, V.; Franco, J. Assessing the use of sand, peat soil, and pine bark for the attenuation of polar pesticides from agricultural run-off: A bench-scale column experiment. Environ. Sci. Pollut. Res. 2018, 25, 20640–20647. [Google Scholar] [CrossRef]
  43. Hylling, O.; Nikbakht Fini, M.; Ellegaard-Jensen, L.; Muff, J.; Madsen, H.T.; Aamand, J.; Hansen, L.H. A novel hybrid concept for implementation in drinking water treatment targets micropollutant removal by combining membrane filtration with biodegradation. Sci. Total Environ. 2019, 694, 133710. [Google Scholar] [CrossRef]
  44. Pinilla-Redondo, R.; Olesen, A.K.; Russel, J.; de Vries, L.E.; Christensen, L.D.; Musovic, S.; Nesme, J.; Sørensen, S.J. Conjugative dissemination of plasmids in rapid sand filters: A trojan horse strategy to enhance pesticide degradation in groundwater treatment. bioRxiv 2020. [Google Scholar] [CrossRef]
Figure 1. Removal of total organic carbon and nitrogen (%) in the three biofilters. Inflow concentrations during NH4Ac-pulses were adjusted to theoretical input. Data points below −20% were for simplicity removed from the plot (sand; day 55 and 69) and error bars were set to ±5%.
Water 12 01649 g001
Figure 2. Sand biofilter: Removal rate (%) of CPP (♦), DCPP (■), MCPP (●), and MPP (▲) during the experimental period. Orange bars indicate the periods in which NH4Ac was applied. Error bars were set to ±15% by calculation from calibration functions, and asterisks (*) indicate where outlet values were below LOD.
Water 12 01649 g002
Figure 3. Removal (●) and enantiomeric fractions (EF) (■) for mecoprop in the sand biofilter. The dotted line represents the average EF (0.41) of the inlet water. The error bars were ±15%, and ±0.03 for removal, and EF, respectively. Asterisks mark the points where Cout was replaced with LOD.
Water 12 01649 g003
Figure 4. Removal (●) and EF (■) for dichlorprop in the sand biofilter. The dotted line represents the average EF (0.75) of the inlet water. The error bars were ±15%, and ±0.03 for removal, and EF, respectively. Asterisks mark the points where Cout was replaced with LOD.
Water 12 01649 g004