Article

Bibliometric Analysis of Research on Soil Water from 1934 to 2019

Hubei Province Key Laboratory for Geographical Process Analysis and Simulation, Central China Normal University, Wuhan 430079, China
*
Authors to whom correspondence should be addressed.
Water 2020, 12(6), 1631; https://doi.org/10.3390/w12061631
Submission received: 12 April 2020 / Revised: 2 June 2020 / Accepted: 3 June 2020 / Published: 6 June 2020
(This article belongs to the Section Hydrology)

Abstract

:
As an essential factor of the earth’s critical zone, soil water has a remarkable influence on nutrient cycle and energy flow in terrestrial ecosystems and has attracted the attention of considerable scholars. Based on the online database of Web of Science, the bibliometric analysis was performed to evaluate the evolution feature of soil water research from 1934 to 2019. The results showed a rapid growth of scientific outputs with a gradually increasing proportion of internationally collaborative articles. Environmental Sciences, Water Resources, and Soil Science were the most frequently used subject categories, and the Journal of Hydrology had the highest number of publications in this field. The institutions from the USA and China were the most active, and the USA occupied a leading position in soil water research, producing the most articles and having the most considerable number of citations. Clusters of authors were mostly located in North America, Western Europe, West Asia, and East Asia. Keywords analysis demonstrated that climate change, drought, evapotranspiration, remote sensing, and irrigation were the current research hotspots. Scientific issues focusing on the interaction between soil water and environmental factors, drought forecast, relationships between soil structure and water/solute transport, improving the accuracy and depth of soil moisture monitoring with satellite, and spatio-temporal scaling transform require further research.

1. Introduction

Studies on soil water (SW) are gaining more attention as soil water is a critical factor in the natural ecosystem, being closely related to soil [1], water [2], plants [3], and other components. The content, dynamics, and existing forms of soil water significantly impact on the formation and development of soil, terrestrial hydrological cycle, and plant production [4]. Soil water also plays a vital role in agriculture [5], especially in irrigation management practices in semiarid and arid areas [6,7], and it is of considerable significance to regulate soil water to improve crop productivity [8,9].
Bibliometrics is a quantitative analysis method based on mathematical statistics [10]. It has been widely used in scientific fields to quantitatively reflect the research hotspots and reveal the future trends of new theories [11]. So far, it is found that there are many pieces of research on soil moisture at different scales [12,13], but few bibliometric reviews of the global research on SW have been conducted. In order to understand the current situation and trends of SW research comprehensively and objectively, bibliometric methods were applied to analyze the related scientific publications on SW between 1934 and 2019 from multiple perspectives and to reveal the diversity and innovative methods in the global research trends of SW.
In this research, a general bibliometric study was performed by investigating the annual publication output, subject category, source journal, source country, and source institution to offer an alternate perspective on the development of SW studies [14,15]. Moreover, innovative methods such as international collaboration network analysis, geographic distribution map, and core author keywords were applied to provide insights into the global research trends from various perspectives. Based on revealing the development course and current trend in SW research, this paper proposed the aspects that need further study in the future, which may provide a reference for researchers.

2. Materials and Methods

2.1. Data Collection

The data in this paper were searched and collected from The Science Citation Index Expanded (SCIE) and Social Sciences Citation Index (SSCI) online databases of Web of Science, which is an extensive comprehensive and multidisciplinary core journal citations index database [16]. Topic = (“soil water” OR “soil moisture” OR “soil humidity” OR “soil-water” OR “soil-moisture” OR “soil-humidity”), document type = “article”, timespan = “1900–2019”, and deadline = “May 4, 2020” were used as the data retrieval strategies. In the SCIE and SSCI database, the first article matching the search criteria was published in 1934, and 66,648 articles in SW research from 1934 to 2019 were acquired and used for further analysis.

2.2. Data Analysis Methods

Bibliometric analysis was conducted to reveal patterns in SW studies from the following aspects: the scientific outputs characteristics, subject categories, major journals, international collaborations, the geographic distribution of authors, and keywords. The individual document information, including author name, author address, journal title, subject category, publication year, citation frequency, the title of the article, and other information were downloaded into Microsoft Excel 2010 for the subsequent data processing. Research cooperation was determined by a complete counting strategy, and each signatory on the document was equally treated. Collaborative articles refer to articles signed by two or more authors from different institutions and countries, respectively. The keywords with different forms of spelling but identical meanings were classified under a single keyword.
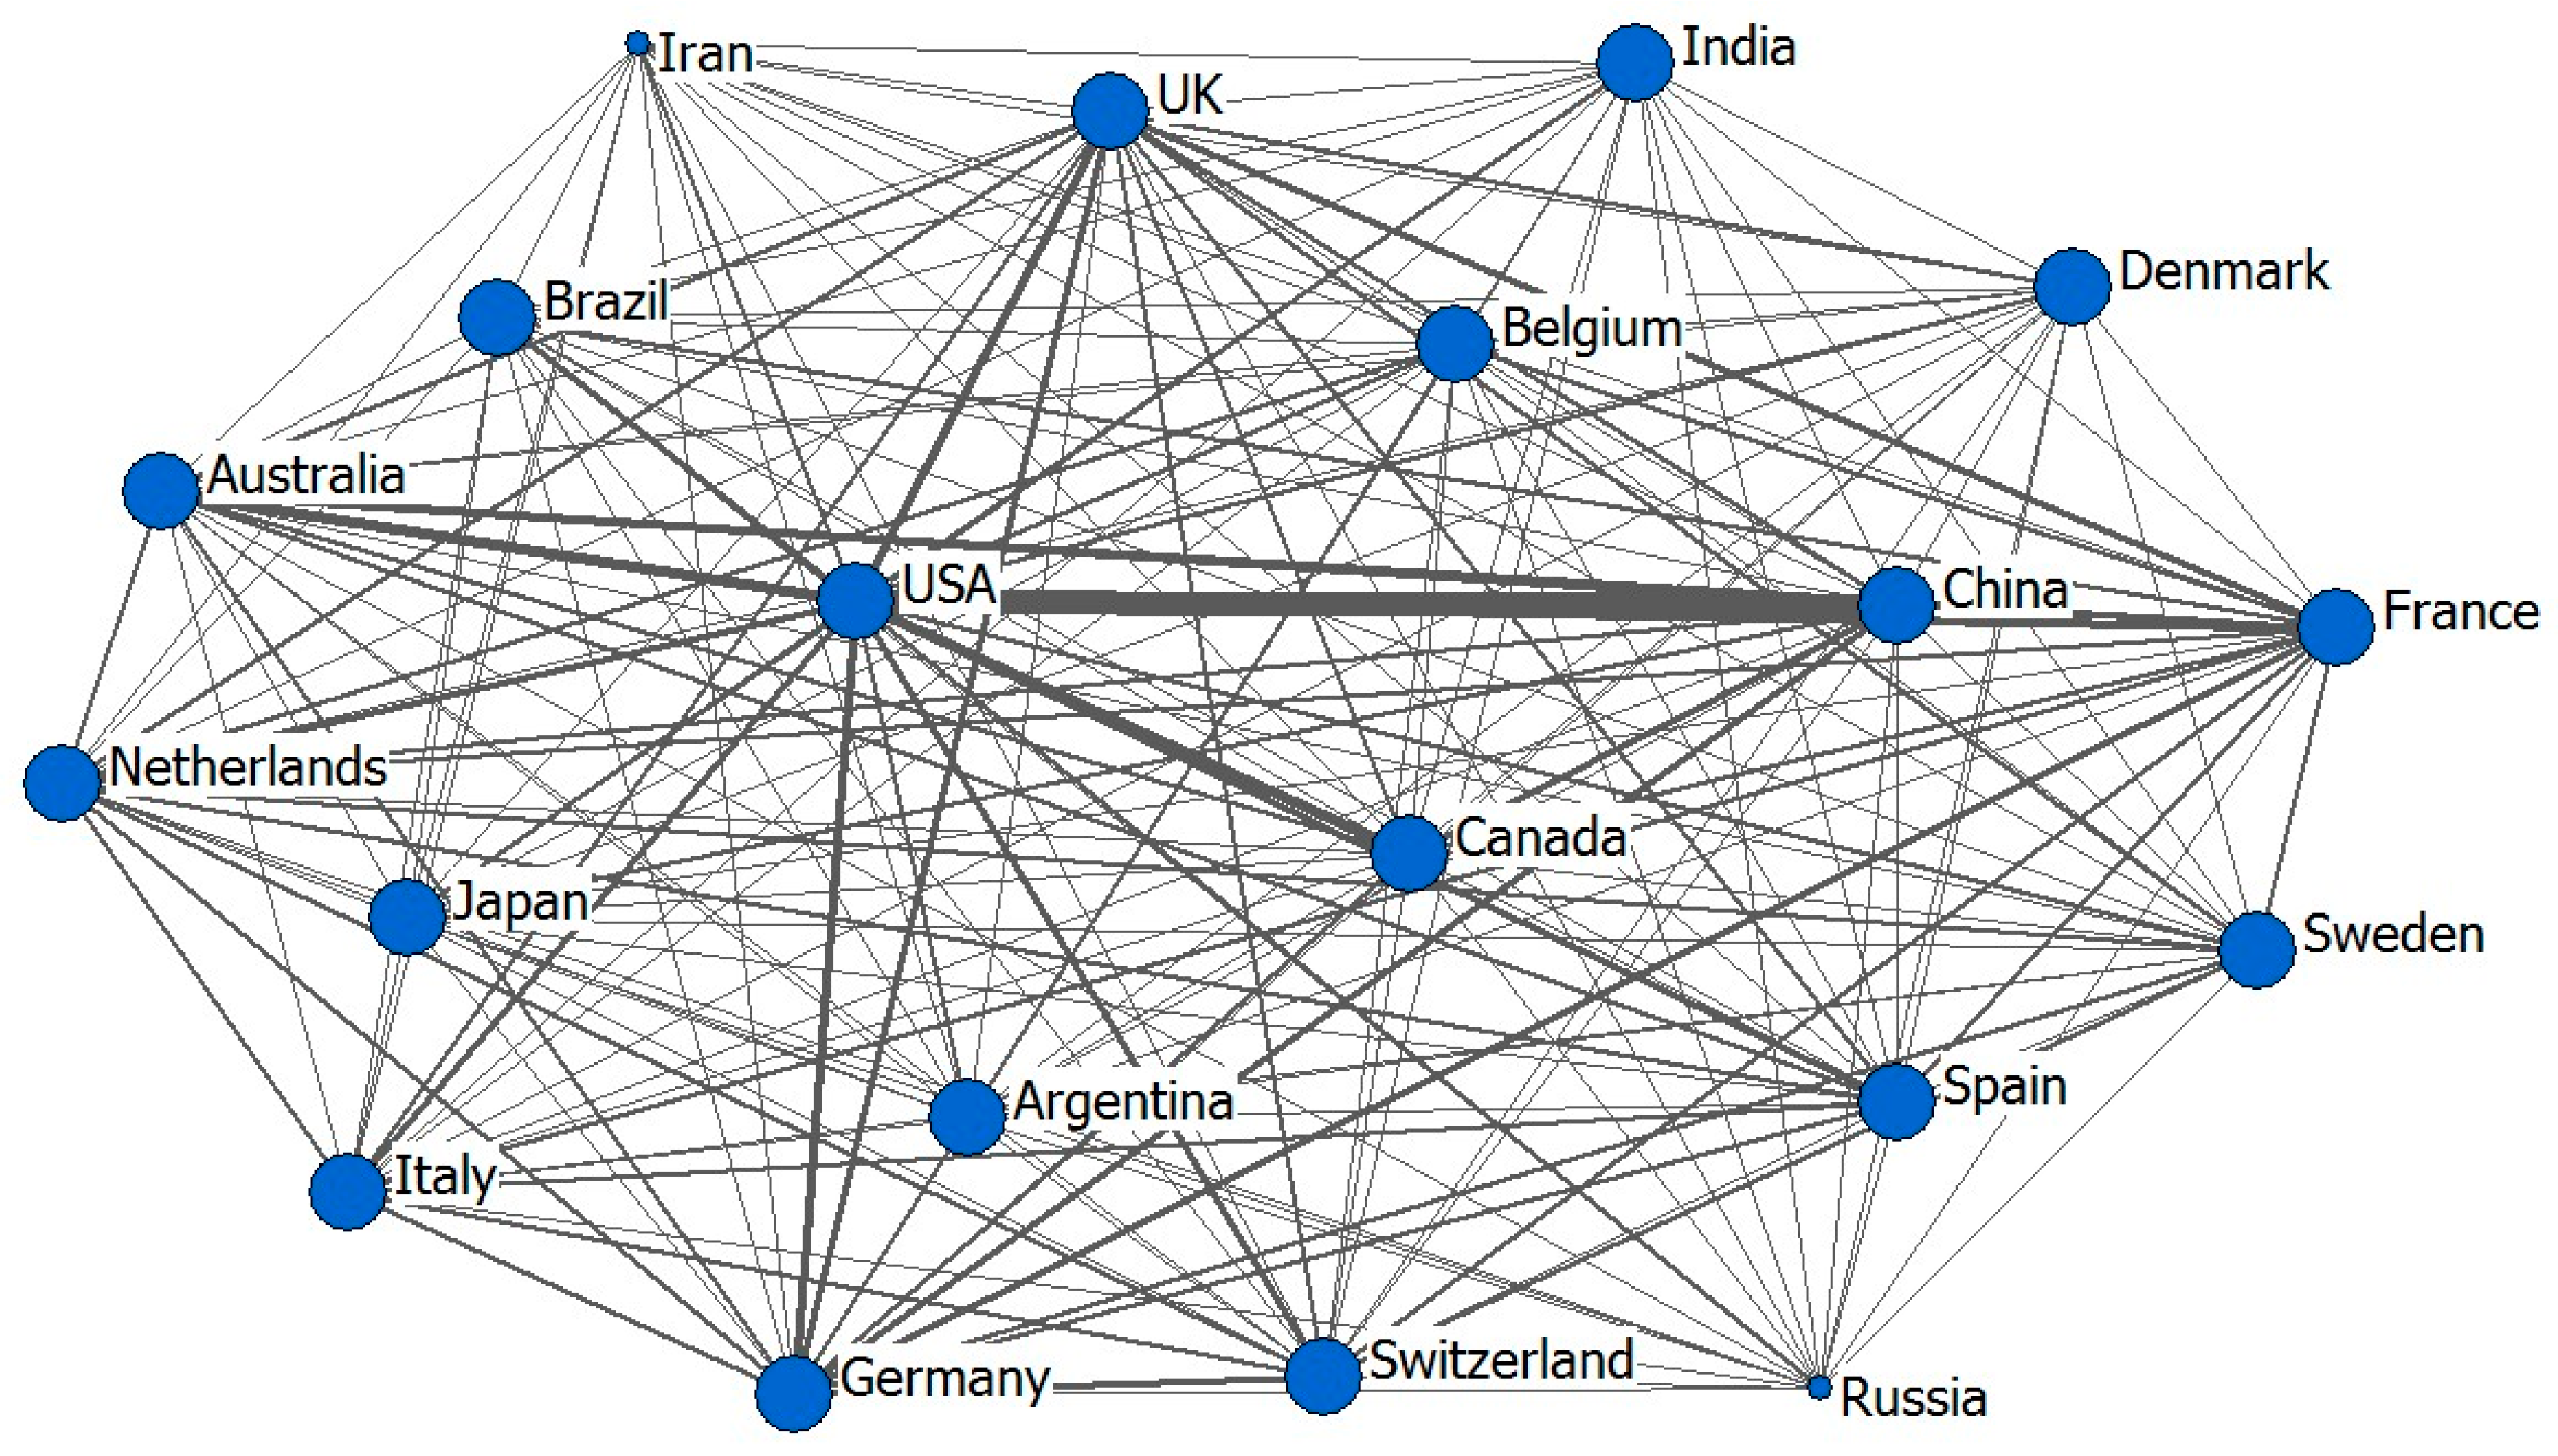
Data visualization was completed using software of UCINET [17], CiteSpace [18], Arc GIS 10.2, and VOSviewer [19]. More information about visualization analysis was described in detail as following. In order to evaluate the connection between countries in SW research, the cooperation frequency matrix was generated by calculating the frequency of co-occurrence between every two countries; after that, it was imported into UCINET to generate an international cooperation network map. The larger node represents the more significant degree centrality and importance of countries in the cooperation network, and the thicker line represents the higher intensity of collaboration. The geographic coordinates of the author’s location were obtained by CiteSpace based on author addresses, and then Arc GIS 10.2 was applied to generate the global geographic distribution map of the SW research authors. High-frequency keywords were imported into VOSviewer to create a keyword co-occurrence network map to present research topics vividly. The frequency of keywords determined the size of nodes, and the larger the node is, the more critical it is in the network. The thickness of connecting lines between nodes represents the degree of connection between keywords, and the thicker the line, the stronger the connection.

3. Results and Discussion

3.1. The Evolution of Research Activity by Quantitative Analysis of Article Outputs

The annual number of articles and the citations per article are shown in Figure 1. The first article in SW research was published in 1934 [20], and the annual number of articles did not exceed two until 1975. The number of articles increased gradually from the 1970s to the 1990s, and it increased sharply since the 1990s. The number of citations per article fluctuated within 20 from 1934 to 1970, then it showed a rising and fluctuating characteristic from 1975 to 2004 and reached a peak value (50.45) in 2004. After that, the citations per article kept dropping and went down to 1.58 in 2019. These features proved that SW research was still in the initial stage from 1970 to 1990, but the research content gradually matured, mainly focusing on basic concepts, fundamental theories, and research methods. Therefore, a small number of research results during this period had a high frequency of citation. The rapid development of the Internet after 1990 led to much easier online access to publications, which resulted in the increment of citations per paper published between 1990 and 2004. The average number of citations per paper decreased since 2004, which was attributed to short publication time and a huge number of articles.
The characteristics of current SW research outputs for the period 1934–2019 were summarized in Table 1. All output indicators for discussion included the total number of articles, the number of authors, cited references, pages, and citations per article. All indicators showed the trend of rising at an increasing growth rate for except the number of citations per article, indicating an expanding accumulation of knowledge in SW research fields. Under the background of the fast development of natural sciences, the number of SW researchers was increasing since the 1970s. Meanwhile, a considerable amount of sci-tech journals related to SW research were successively established. Among them, The Soil Science Society of America Journal, Hydrological Processes, Vadose Zone Journal started publication in 1976, 1986, and 2002, respectively. Therefore, with the increasing number of article outputs, the knowledge in the SW field quickly accumulated in the past three decades.

3.2. Analysis of Main Subject Categories and Journals

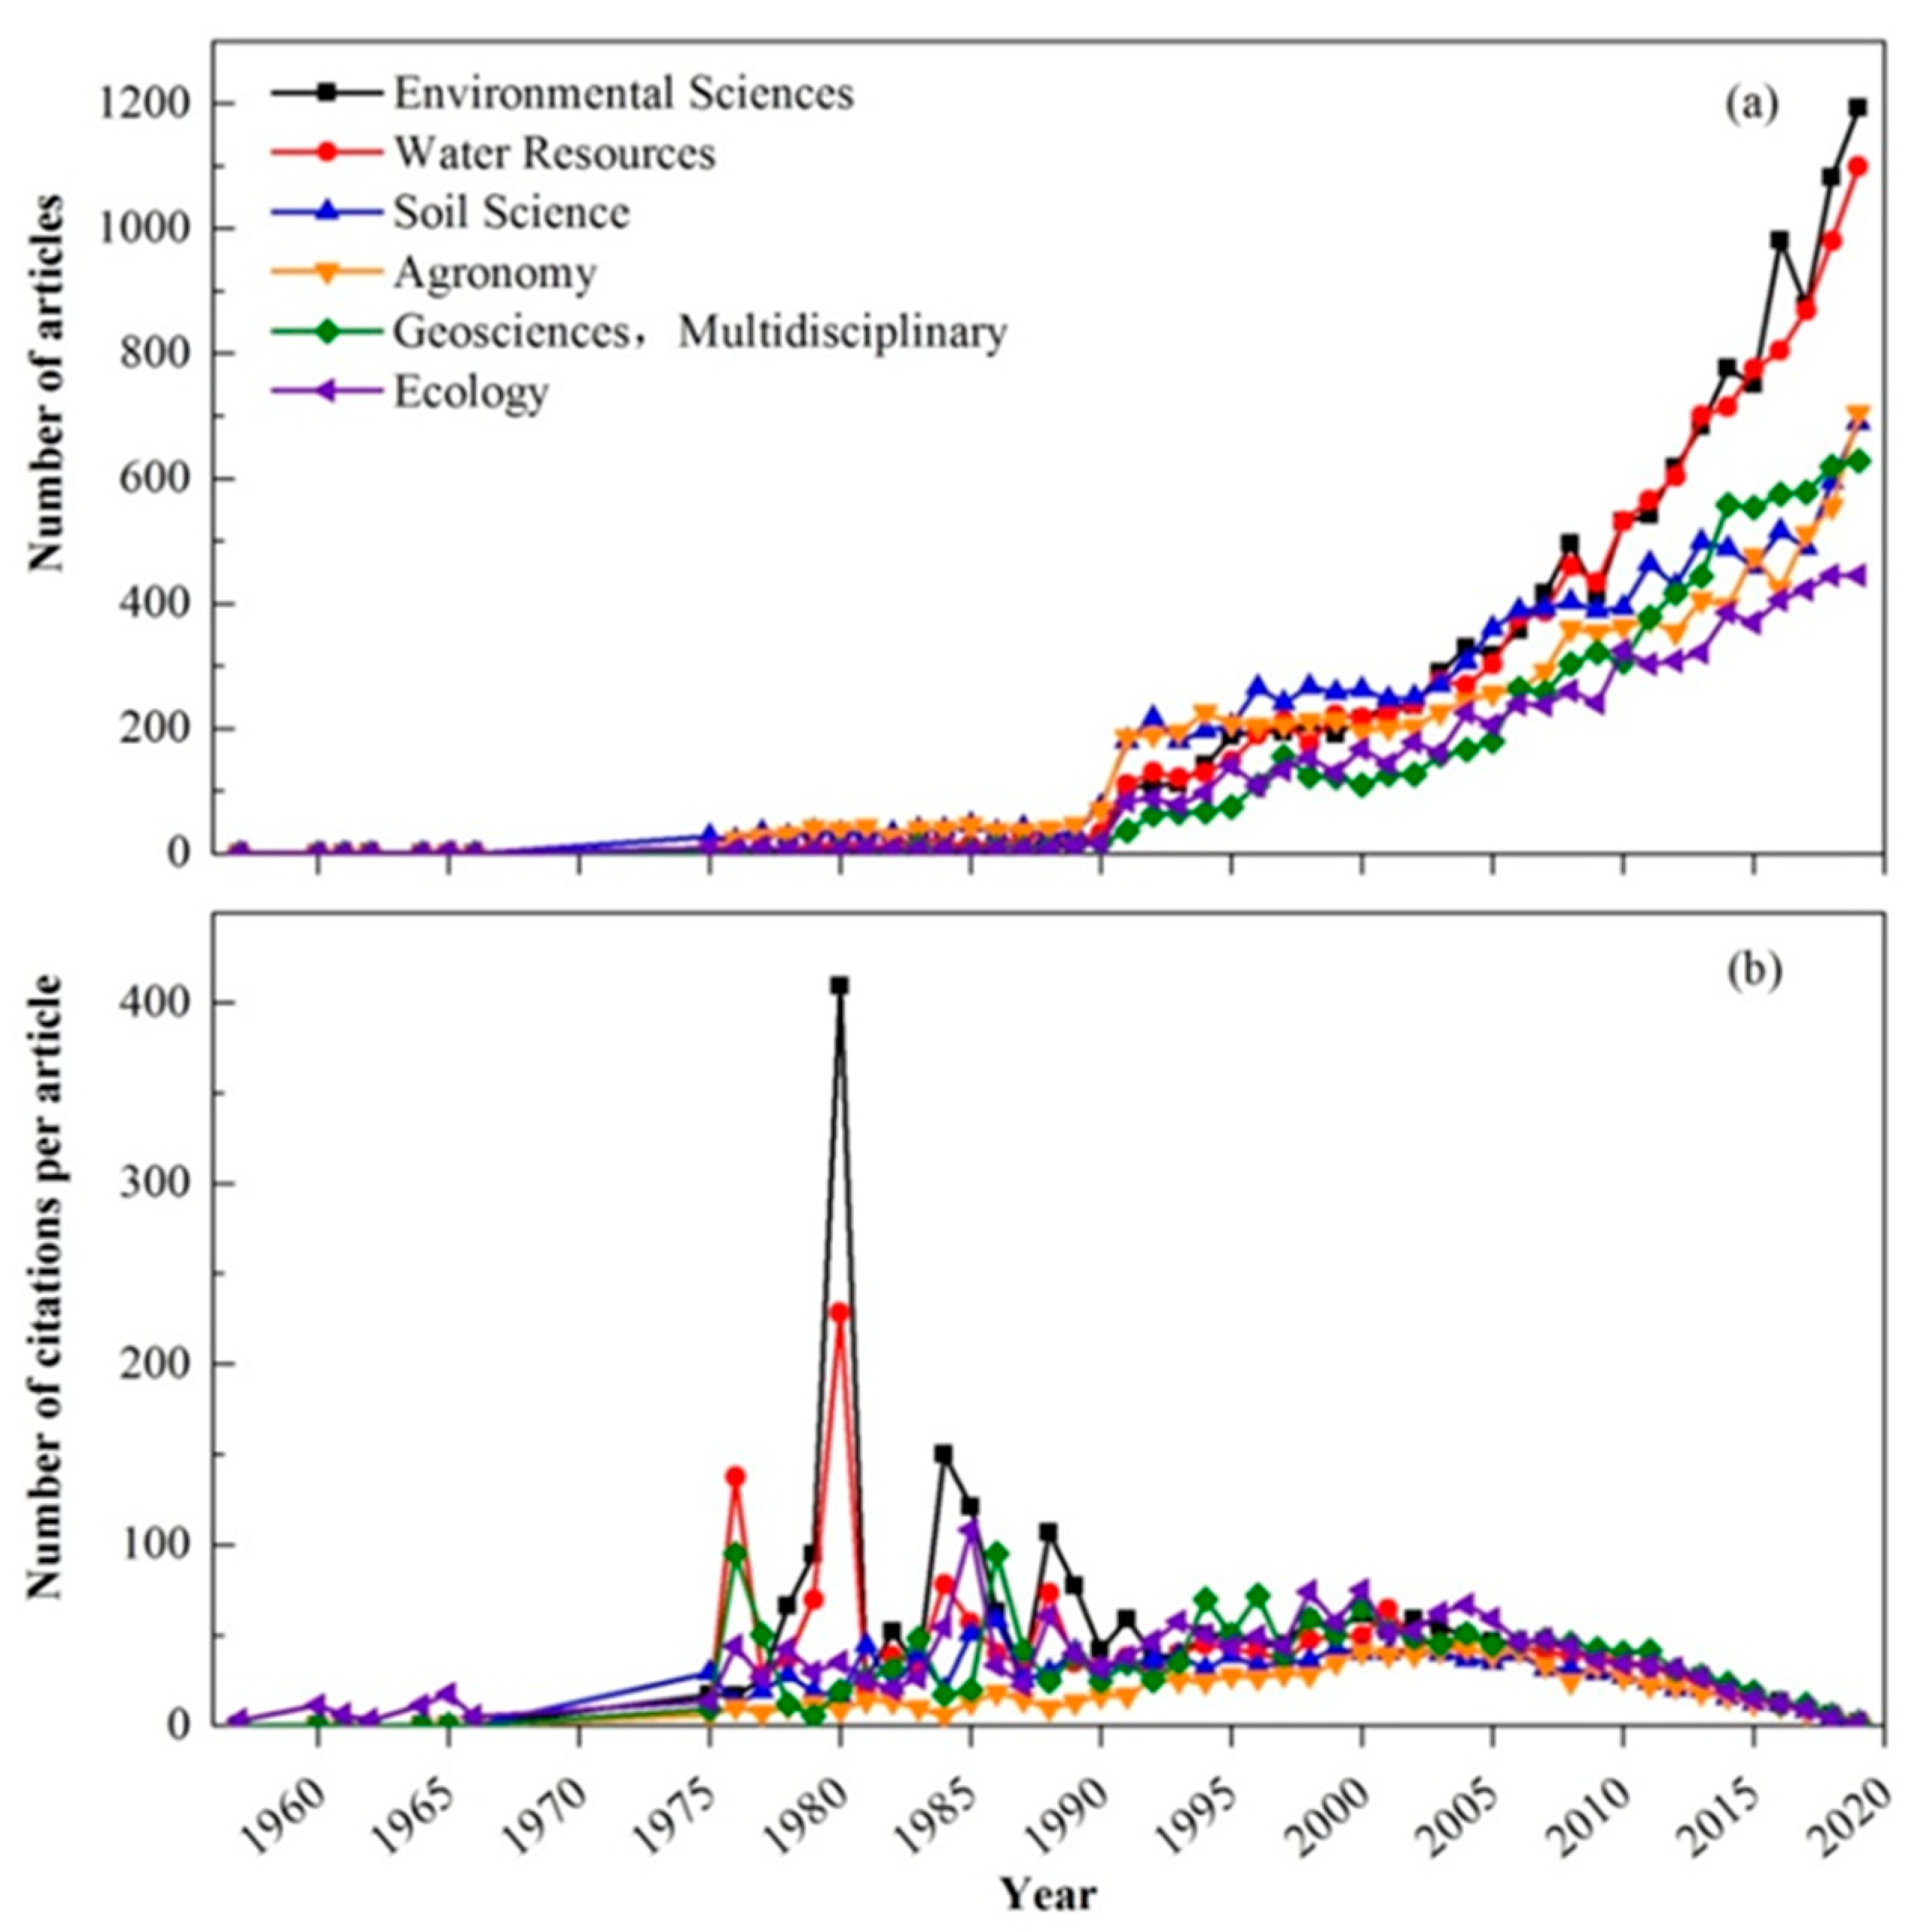
Figure 2 shows the annual numbers of the articles published with the top 6 productive subject categories. In the past two decades, the number of research articles in each category has been increasing. The 6 most common categories were Environmental Sciences (12,926 articles), Water Resources (12,509 articles), Soil Science (10,861 articles), Agronomy (9577 articles), Geosciences, Multidisciplinary (7995 articles), and Ecology (6931 articles). Other main subject categories in the SW study included Plant Sciences, Meteorology and Atmospheric Sciences, Forestry, and Remote Sensing. Among the top 6 productive subject categories, the average number of citations per article of Environmental Sciences (47.06) ranked first, followed by Water Resources (37.49) and Ecology (35.73). The maximum value of annual citation frequencies per article (409.33) belonged to Environmental Sciences in 1980, indicating that SW research in this field possessed the highest recognition. Since 2000, the number of citations for each subject category has shown a downward trend.
According to statistical analysis of the distribution of journals publishing SW research articles, the core journals with high recognition in this field can be determined [21]. The top 20 productive journals are displayed in Table 2, along with the total number of articles and the number of citations per article. The Journal of Hydrology published the most articles (1821) from 1934 to 2019, accounting for 2.73% of the total. Water Resources Research ranked first in total citations, accounting for 4.40% compared to 3.75% for Journal of Hydrology. Agricultural Water Management also ranked high, which occupied 1497 articles (2.19%) and 35,634 total citations (3.33%). It is noteworthy that Remote Sensing of Environment has published papers with the most average number of cited times (57.15); however, the number of articles published in this journal only accounted for 0.97% of the total. Besides, the number of SW research articles in some journals established in recent years had multiplied. For example, Remote Sensing and Water had published 590 and 425 SW research articles since their first publication in 2009, and ranked 6th and 12th among all journals during 2009–2019, respectively.

3.3. Study on International Collaboration and Geographic Distribution of Authors

The top 20 productive institutions in SW research from 1934 to 2019 are listed in Table 3. The leading productive institutions are distributed across the USA and China, accounting for 55% and 25% among the top 20 institutions, respectively. According to the number of published articles, The Chinese Academy of Sciences (CAS) in China, and The United States Department of Agriculture Agricultural Research Service (USDA ARS) in the USA were significantly higher than other research institutions, accounted for 7.14% (4761) and 4.29% (2858) of the total number of articles, respectively. Meanwhile, USDA ARS (101,305) ranked first in the total number of citations, followed by CAS (91,891). However, in terms of the citation per article, these two institutions were ranked 12th and 16th, respectively. The top three citations per article were National Aeronautics and Space Administration (NASA, 64.08) and University of Arizona (53.20) in the USA, and Commonwealth Scientific and Industrial Research Organization (CSIRO, 52.37) in Australia.
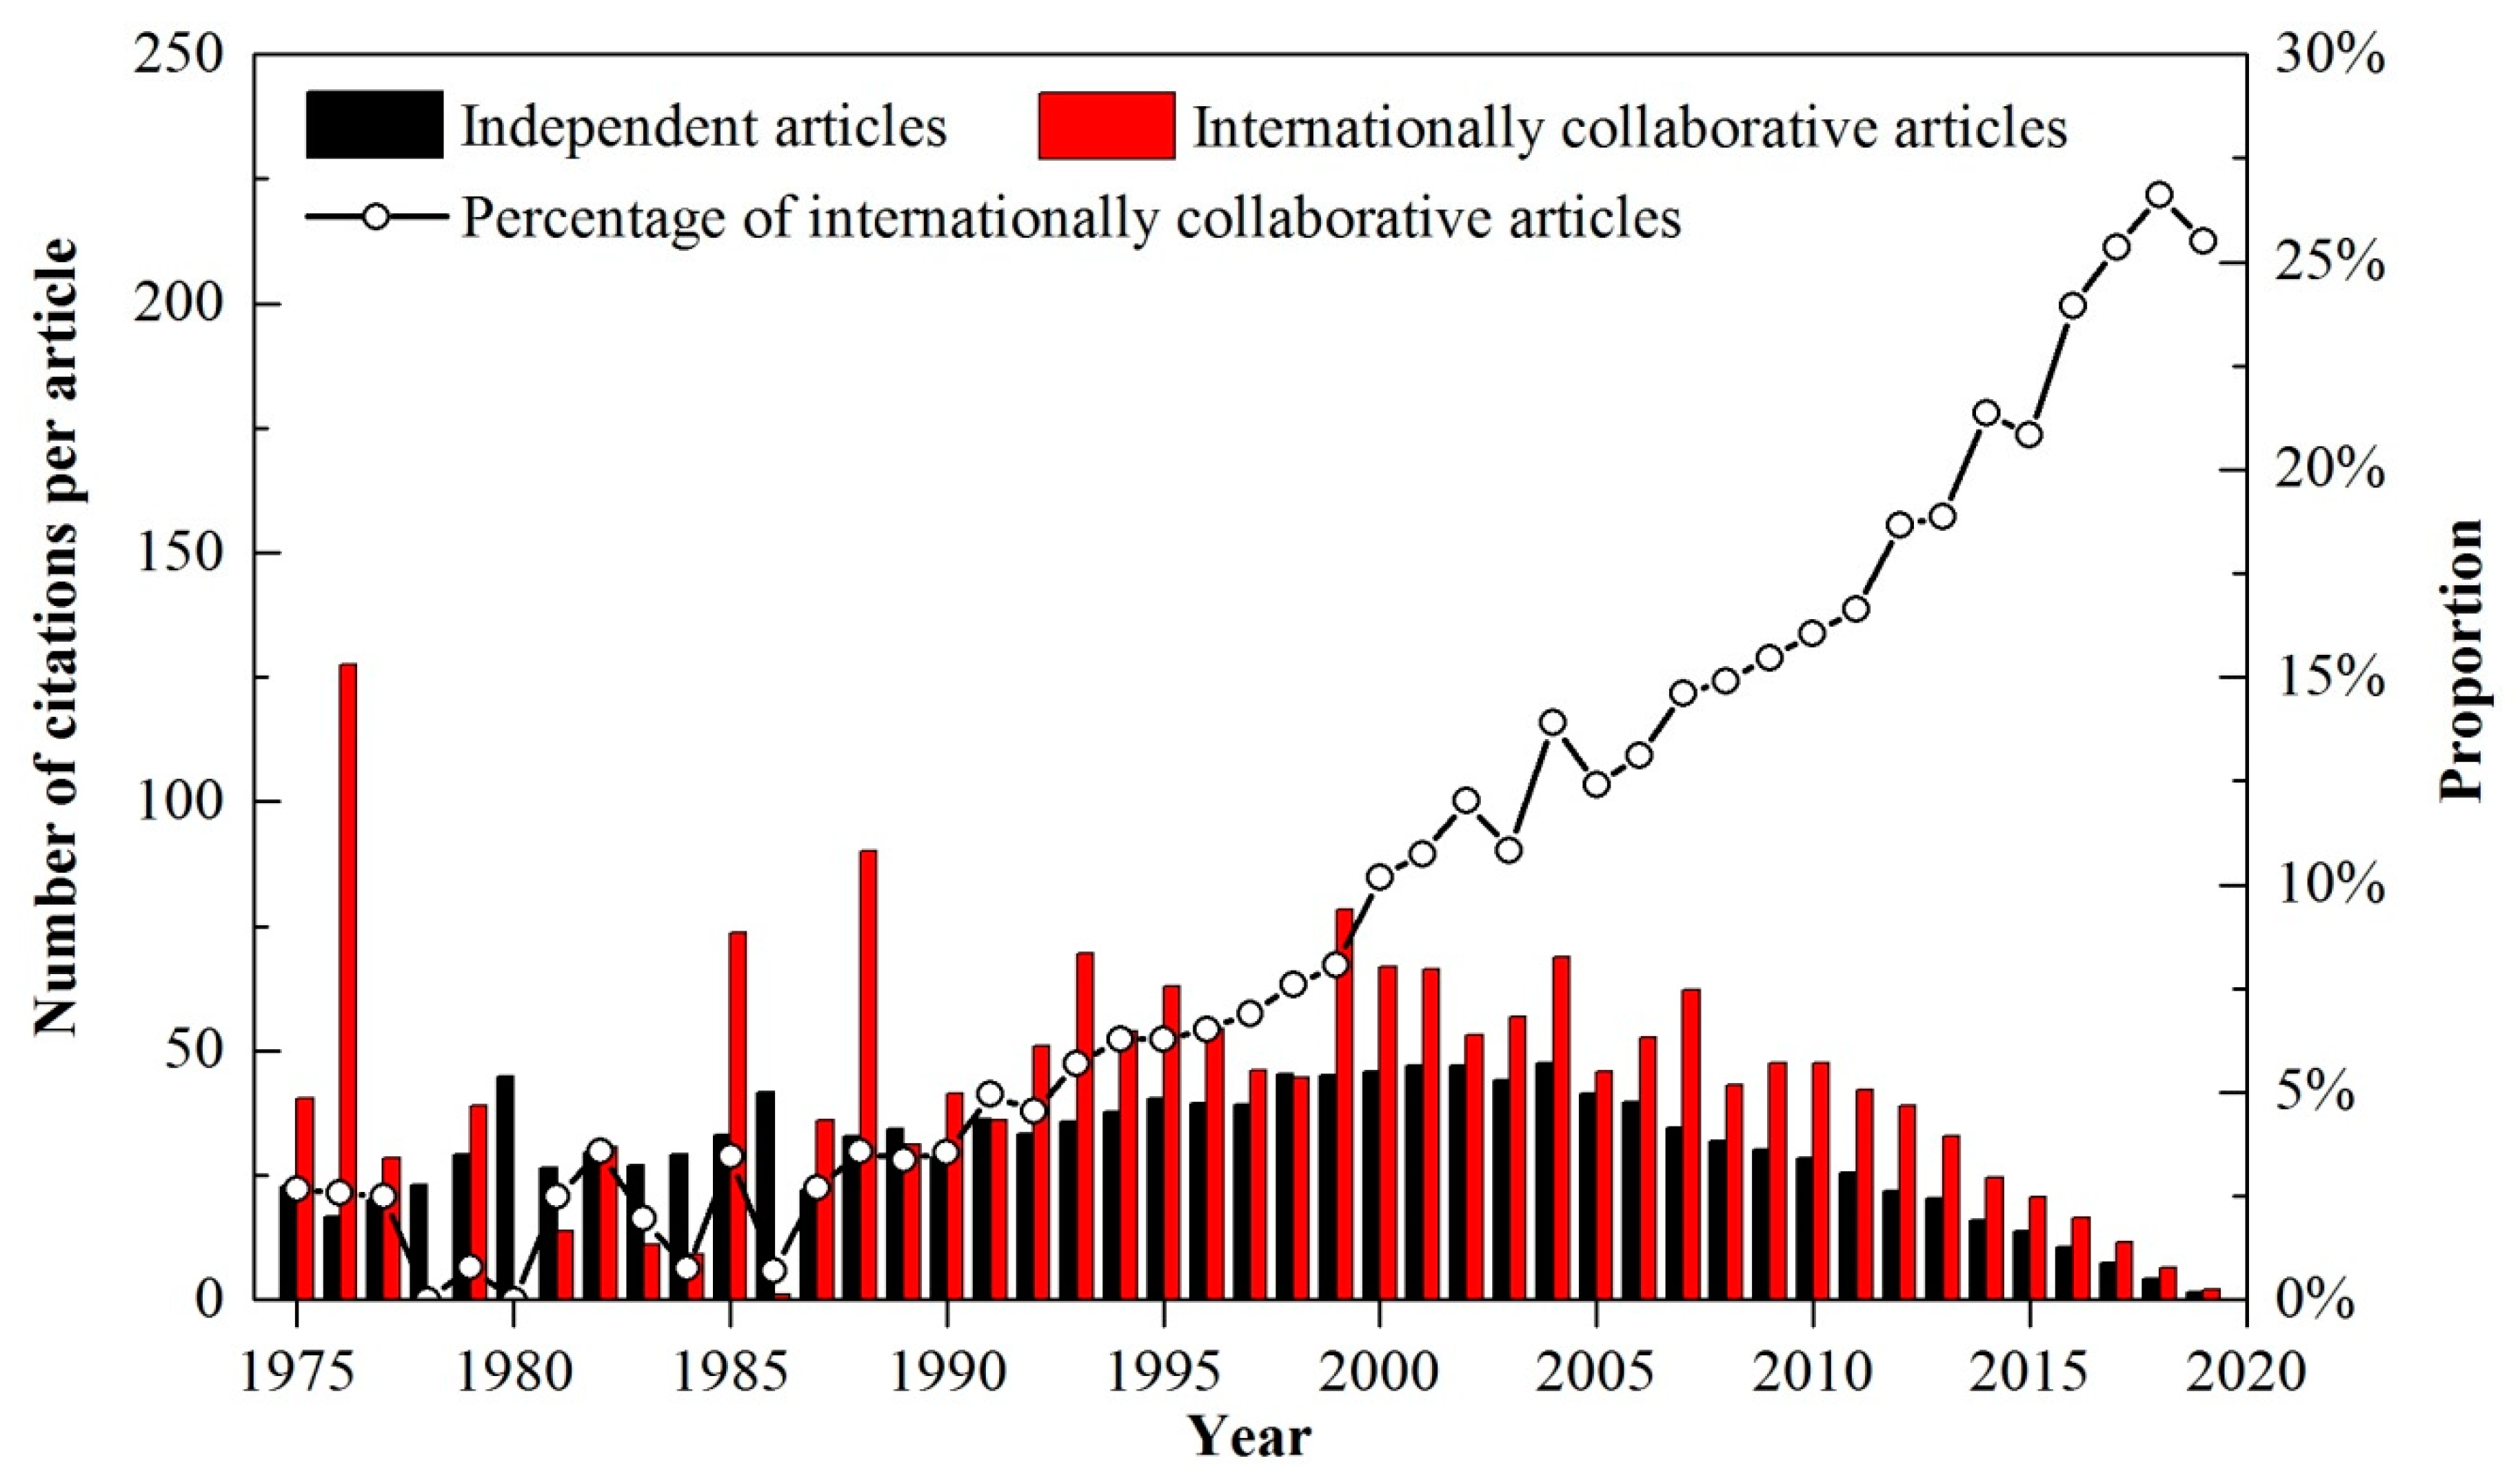
According to Figure 3, the percentage of internationally collaborative articles increased with fluctuations and reached the highest level in 2018 (26.62%), suggesting that international cooperation had become a trend in the field of SW research. Generally, internationally collaborative articles were cited more frequently than independent articles in the same period. International cooperative SW research promoted collaborators to take full advantages of the leading technology and method, respectively, to create highly recognized articles worldwide. The maximum value of an annual number of citations per internationally collaborative article (127.50) appeared in 1976, because there were only two internationally collaborative articles in 1976, and the article “Simulation of Field Water Uptake by Plants Using a Soil Water Dependent Root Extraction Function” had been cited 252 times [22]. As well, “Topographic Effects on the Distribution of Surface Soil Water and the Location of Ephemeral Gullies” and “Phosphorus in Soil, Water and Sediment: an Overview” had been cited 238 and 111 times [23,24], respectively, which resulted in the average citation frequency of three internationally collaborative articles in 1988 (90.00) ranked second during 1975–2019.
The top 20 most productive countries/territories are summarized in Table 4, with a total number of articles and total citations for independent and internationally collaborative articles. The USA and China had contributed significantly to the development of SW research and had published a considerable number of articles (23,238 and 10,832, respectively). However, the articles produced by China were only cited 15.49 times on average, which may be attributed to the fact that 85.00% of SW research articles in China have been published in the past decade, and the short publication time resulted in low cited frequency. In the UK, France, Netherlands, Switzerland, Belgium, and Denmark, the average citation of per article was above 35, indicating that these countries had played essential roles in SW research fields. In addition, the proportion of international cooperation articles in the Netherlands, Switzerland, and Belgium all exceeded 55%. The average citation of internationally collaborative articles was higher than that of independent articles, indicating that international cooperation was effective in strengthening the influence of scientific outputs in SW research. It was noteworthy that the countries with the average number of citations per article less than 20 times were all developing countries (i.e., China, India, Brazil, Iran, and Russia), and the proportion of internationally collaborative articles in these countries was less than the average of top 20 productive countries (37.29%). It implied that those developing countries should strengthen cooperation with developed countries to improve the influence power of SW scientific publications.
The cooperation among the top 20 countries is shown in Figure 4. The country with the larger node had cooperative relations with more countries, and its degree centrality and importance in the cooperation network were also more remarkable. Except for Iran and Russia not having published any collaborative articles, the other 18 countries had cooperated in conducting SW research. The USA was the center of the global SW research cooperation network, and its main partners were China, the UK, Australia, Canada, and other countries. The thick line connecting the USA and other countries indicated that the USA had produced a large number of internationally collaborative articles in SW research. In addition to the USA, other major countries in the world also extended their cooperation network outwards. The analysis confirmed that the cooperation between countries with advanced science and technology guides the way of SW studies, and it also implied that international collaboration promoted the development of SW research.
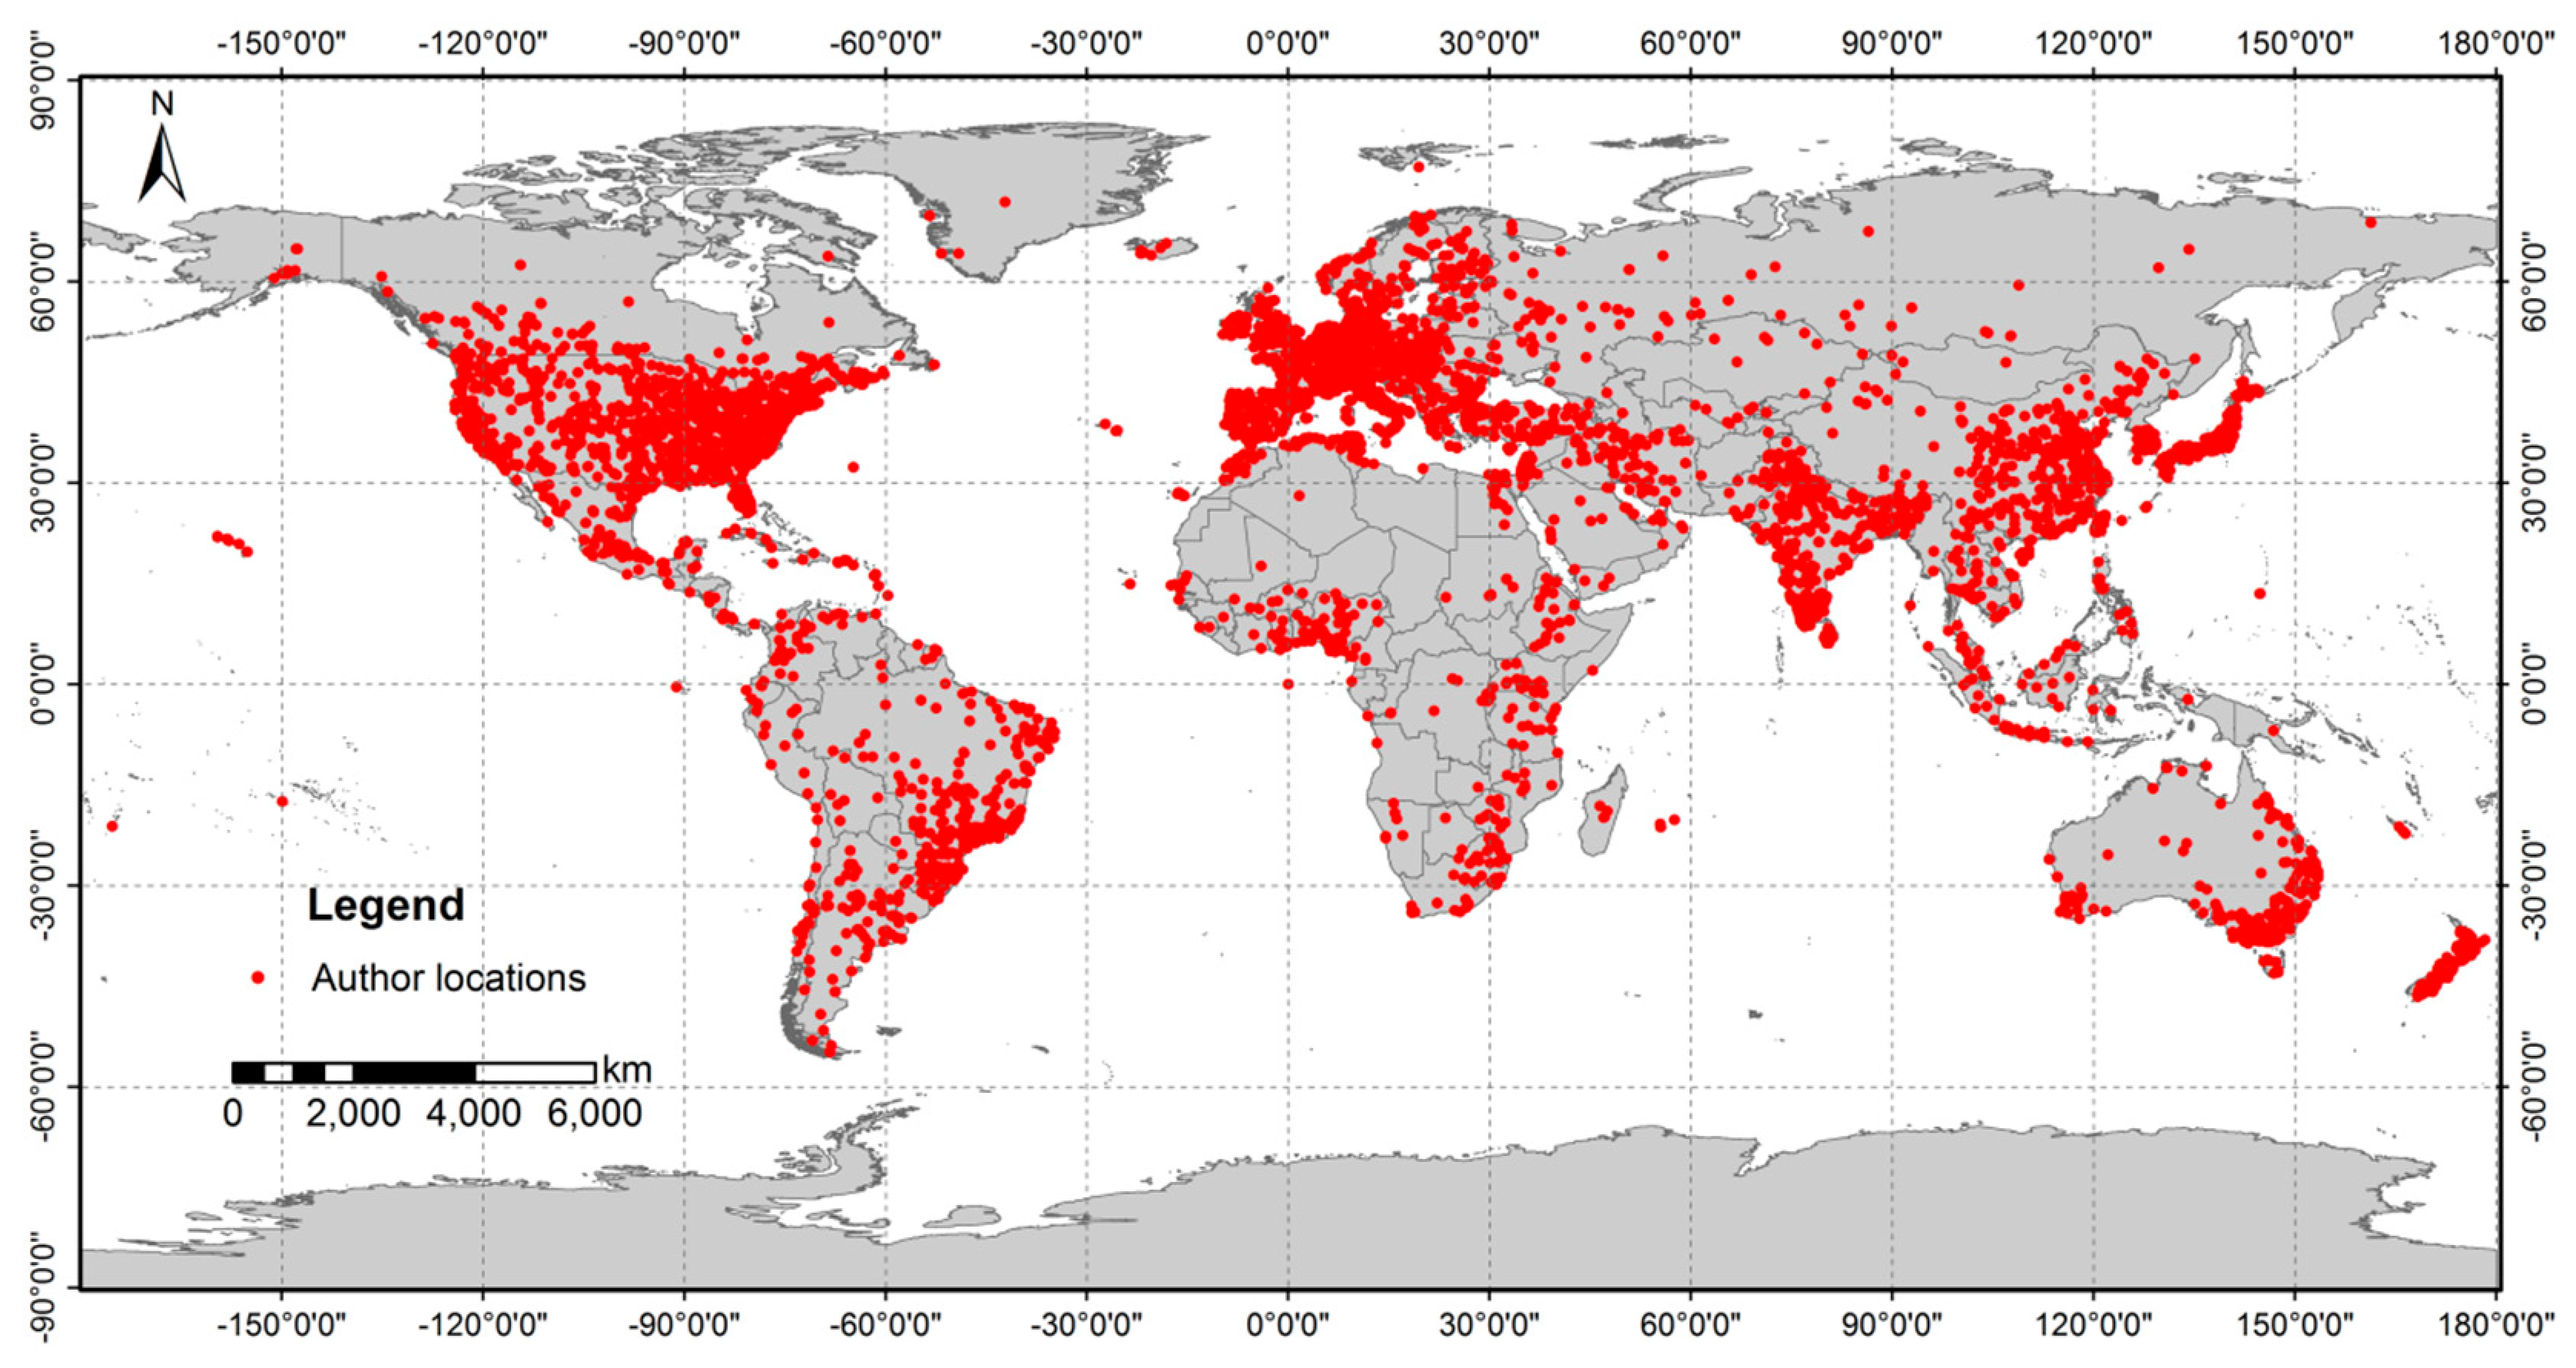
According to Figure 5, the dominating clusters of authors existed in North America, Western Europe, West Asia, East Asia, and several minor clusters located in other parts of the world. The spatial distribution characteristics of SW researchers were related to population density. The regions with a large number of authors were generally located in densely populated areas, such as the eastern USA, southern Europe, South Asia, eastern China, South Korea, and Japan.

3.4. The Hot Topics in SW Research

Keywords are natural language words that can reflect the core contents of papers. Therefore, a collection of keywords in an academic field can reveal the future trends of academic research in the specified field [16]. Before the 1990s, the article number was small, and its keywords information was incomplete. As a result, the articles from 1990 to 2019 were used for the top 20 frequently used keywords analysis with 10-year intervals (Table 5). The temporal change of keywords occurrences indicated the evolution characteristics of SW research hotspots. From 1990 to 1999, the research on soil moisture mainly focused on topics closely related to agricultural production, such as “water stress”, “drought”, and “irrigation”. Some keywords related to plant growth mechanisms were also used frequently in the early stages, among them, “nitrogen”, “transpiration”, “photosynthesis”, and “stomatal conductance” ranked 5th, 8th, 10th, and 11th, respectively. However, the frequency of keywords related to basic concepts and fundamental principles had been gradually decreasing as time went by. For the last three decades, the frequency rankings of “soil temperature” were almost stable and fluctuated between 12th and 15th, showing that combining soil moisture with other physical properties of soil was a classic analysis mode for related research. The frequency of “climate change”, “remote sensing”, and “water-use efficiency” had shown a significant increase since 2000, and the recent rankings had reached 2nd 6th, and 7th, respectively. The SW research hotspots were developing into new academic fields and gradually turning to topics closely related to human production and life.
Besides the search terms, “climate change”, a great concern worldwide that attracts tremendous attention, was the highest-ranked keyword for the reason that soil moisture is a key variable of the climate system and plays a major role in predicting climate change. There has been evidence that soil moisture is one of the potential limiting factors for land carbon uptake, which could reduce gross primary production through ecosystem water stress and further exacerbate climate extremes due to land–atmosphere feedbacks [25]. Studies on climate change mainly focused on the impact of climate change on soil moisture and soil water erosion [26,27] and using soil moisture as one of the variables to build climate change prediction models [25]. As an important way to connect soil moisture with other climatic elements, “evapotranspiration” ranked 4th.
“Drought” ranked 3rd among all keywords. Drought is a predominant cause of poor yields worldwide, and the study of drought mainly concentrated on the effects of soil moisture on agricultural irrigation, crop growth, and yield, especially under the condition of drought and water shortage [28,29]. As an important agricultural production method to mitigate the effects of drought, “irrigation” ranked 8th, and related research mainly explored irrigation optimization strategies under different soil moisture conditions [30,31].
Soil water content, the 5th high-frequency keyword, mainly focused on the comparison of accuracy and applicable scope of various measurement methods [32,33,34]. The interaction between soil physical properties and soil water content had also attracted a great deal of attention, especially associated with land-use and land-cover changes in the water limited regions, such as the Loess Plateau in China [35], southern Africa [36], and northwestern America [37]. The spatial and temporal variability of soil water content is also a research hotspot in the related fields. Remote sensing acted as a useful method overcoming the difficulties of obtaining continuous time-series data at a large spatial scale [26], which was widely used to obtain surface hydrology and vegetation information [38]. Spatiotemporal continuous soil moisture content and other data were retrieved from remote sensing images, which were frequently performed to study soil water spatiotemporal variability. Among remote sensing image products, medium-resolution imaging spectrometers, microwave radiometer satellites, and soil moisture and seawater salinity satellites were widely used in SW research [39,40,41]. With the rapid development of computer technology in recent years, remote sensing technology has become increasingly mature. Meanwhile, emerging technologies such as high spatiotemporal resolution satellite remote sensing images and drones have promoted the application of remote sensing in SW research.

3.5. The Research Frontiers in the Field of SW

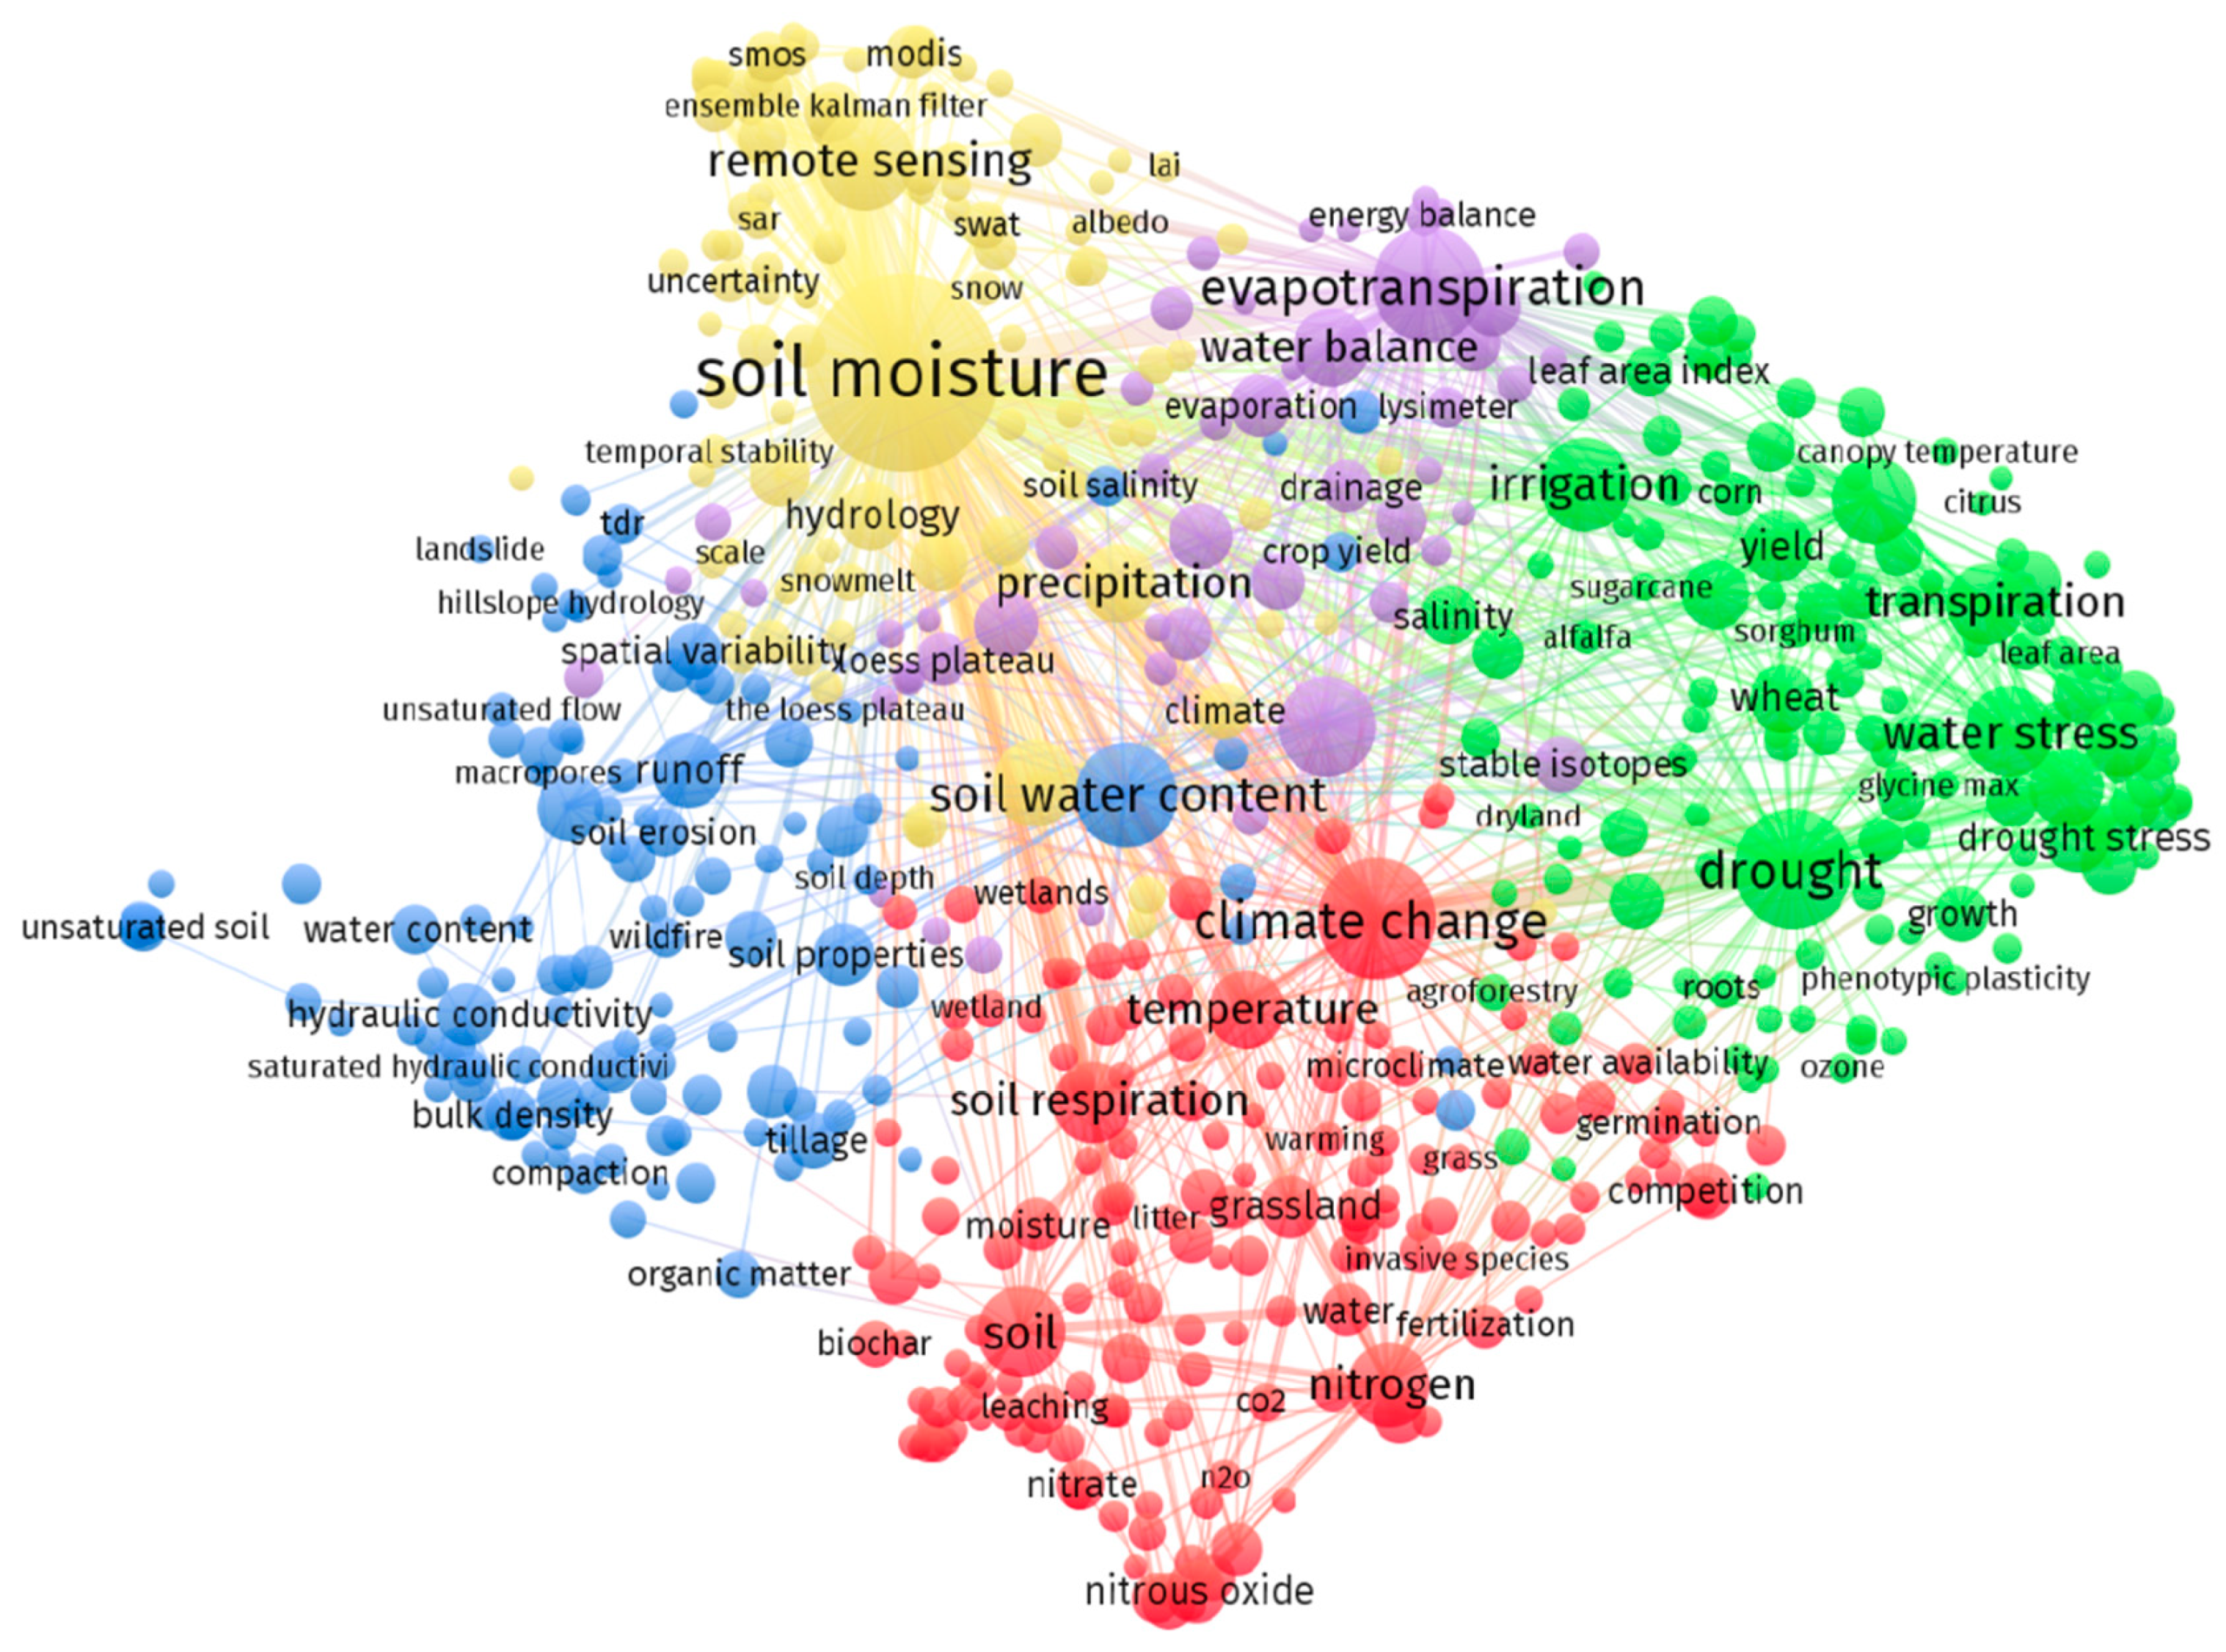
Keywords with a frequency of 50 or more were selected to generate the keyword co-occurrence network map (Figure 6). It showed that the high-frequency keywords were mainly divided into five clusters and were represented by different colors. Based on the results of keywords clustering analysis and previous research reviews, the SW research frontiers were discussed as the following.
(1)
“Temperature”, “soil respiration”, “nitrogen”, “warming”, and other keywords related to “climate change” were included in the red cluster. As the problem of global warming becomes increasingly prominent, SW researchers have also paid more attention to spatiotemporal trends of soil moisture and the interaction between soil moisture and soil nutrient conversion under the background of global climate change [42]. Affected by meteorological factors and vegetation conditions, there are differences in the response of soil moisture to climate change in various regions. However, current soil moisture projections are almost essentially “black-box” type assessments that remain considerable uncertainties [43], which leads to discrepancies in the prediction results based on different models. Further research is needed, in terms of improving model prediction accuracy by understanding the interaction mechanism among the elements of the soil–vegetation–atmosphere system.
(2)
For the green cluster, researches on “drought”, “soil water stress”, “soil water-use efficiency”, “irrigation”, and “yield” mainly explored the relationship between soil water and agricultural production activities. Soil moisture drought impacts can be witnessed in irrigated agriculture, and long-term drought creates a severe threat to food security. Hence, it is critical to focus on soil moisture drought forecasting, early warning, mitigations, resilience, and recovery in future SW research [44].
(3)
The blue keywords cluster mainly consisting of “soil water content”, “runoff”, “bulk density”, and “organic matter”, which mostly occurred in studies of soil properties and soil water movement mechanism. The water retention capacity and hydraulic conductivity of soil are controlled by the soil structure, especially the pore size distribution [45]. Studies on quantifying the relationships between soil hydraulic properties and soil structure parameters, and revealing the effects of soil structure on soil water storage, water flow, and the solute transport are still essential in the future [46].
(4)
“Remote sensing”, “Moderate Resolution Imaging Spectroradiometer (MODIS)”, and “Synthetic Aperture Radar (SAR)” constituted the yellow cluster centered on “soil moisture”, mainly representing the research method of soil moisture retrieval based on remote sensing technology. Establishing multi-index or multivariate soil moisture inversion models based on multiple satellite data sets is an effective method to improve the accuracy of soil moisture monitoring, and it merits further exploration. As remote sensing inversion can only provide soil moisture data in the thin upper layers, developing a method to obtain soil moisture data in deep soil layers (e.g., plant root zone) with satellite data may be an effective approach to agriculture drought monitoring at a large spatial scale [44].
(5)
The research themes represented by the purple cluster centered on “evapotranspiration” were mainly related to water balance and energy balance research studies, which were generally combined with water circulation processes such as evaporation and drainage [47]. The main controlling factors of soil hydrological processes such as evapotranspiration, runoff, and infiltration are various on different spatial scales, so scaling transform is worthy of further study [48].
Clarifying the interaction between soil water and soil structure, vegetation, and meteorological factors is conducive to promote the development of the study in the earth’s critical zone. Based on advanced field measuring instruments, remote sensing technology, and hydrological models, accurate and timely soil moisture monitoring needs further research to provide data support for drought warning and sustainable agricultural production. In addition, with the improvement of field measuring instruments and the application of remote sensing technology, the spatial and temporal scale of SW research has been constantly complicated. The spatial objects of SW research ranged from the soil pores to global coverage. Moreover, SW research focused not only on the temporal stability of soil water content in a special event but also on the trends of changing over a longer period, such as inter-annual changes in the background of climate change. Investigating comprehensive scientific issues at multiple spatiotemporal scales is still a challenge for SW research.

4. Conclusions

This study provided a new perspective to reveal the global research trend of SW research. The results of the bibliometric analysis demonstrated that the annual number of article outputs had been in a steady state of continuous increase since 1990, indicating that SW research had wide study prospects. International cooperation, especially among developed countries, was one of the essential driving forces for the further development of SW research, due to the increasing proportion of internationally collaborative articles and the higher citation frequency than independent articles. However, the developing countries need to produce content-rich and high-quality scientific outputs in SW research by strengthening cooperation with developed countries in the future. SW research involved many fields closely related to humankind’s production and life, such as the environment, ecology, and agriculture. For journals at similar levels in the Web of Science database, those attributed to water science and technology, agronomy and crop science, and soil science had more scientific outputs in SW research, and the quality of research articles depends mainly on the grade of journals. Institutions with large scientific outputs in SW research were mainly located in the USA and China. Furthermore, the USA maintained close cooperative relations with considerable countries, which led to its pivotal role worldwide. Recently, SW research mainly focused on agricultural production and other aspects with substantial practical application value and quickly combined with hot topics such as climate change and remote sensing. The research area in revealing an interaction mechanism between SW and environmental factors, developing the approaches for drought forecasting and mitigating, quantifying the effects of soil structure parameters on soil water and solute transport, improving the accuracy and depth range of soil moisture monitoring with satellite, and multiplying spatiotemporal scaling transform were parts of important SW research frontiers.

Author Contributions

Conceptualization, H.Z.; methodology, H.Z., X.L. and J.Y.; resources, X.Y.; data curation, H.D.; formal analysis, X.L. and X.Y.; validation, M.L., T.W. and P.T.; visualization, X.L. and X.Y.; writing—original draft preparation, H.Z., X.L., X.Y. and Y.H.; writing—review and editing, J.Y. and M.L.; supervision, H.Z.; project administration, H.Z. All authors have read and agreed to the published version of the manuscript.

Funding

This research was funded by the Natural Science Foundation of China (No. 41601215, 41771261, and 41701323), Hubei Province Natural Science Foundation of China (No. 2016CFA027, 2019CFB766), and Fundamental Research Funds for the Central Universities (No. CCNU19TS005, CCNU20QN030, and CCNU20TD008).

Acknowledgments

The authors would like to thank Central China Normal University, Wuhan, China, for providing necessary facilities and support.

Conflicts of Interest

The authors declare no conflict of interest.

References

  1. Sawatsky, N.; Li, X. Importance of soil-water relations in assessing the endpoint of bioremediated soils. Plant Soil 1997, 192, 227–236. [Google Scholar] [CrossRef]
  2. Rawls, W.J.; Pachepsky, Y.A.; Ritchie, J.C.; Sobecki, T.M.; Bloodworth, H. Effect of soil organic carbon on soil water retention. Geoderma 2003, 116, 61–76. [Google Scholar] [CrossRef]
  3. Li, S.; Zhou, D.; Luan, Z.; Pan, Y.; Jiao, C. Quantitative simulation on soil moisture contents of two typical vegetation communities in Sanjiang Plain, China. Chin. Geogr. Sci. 2011, 21, 723–733. [Google Scholar] [CrossRef]
  4. Jensen, C.R. Effect of soil water osmotic potential on growth and water relationships in barley during soil water depletion. Irrig. Sci. 1982, 3, 111–121. [Google Scholar] [CrossRef]
  5. Chen, H.; Qin, A.; Chai, Q.; Gan, Y.; Liu, Z. Quantification of Soil Water Competition and Compensation Using Soil Water Differences between Strips of Intercropping. Agric. Res. 2014, 3, 321–330. [Google Scholar] [CrossRef]
  6. Subbaiah, R. A review of models for predicting soil water dynamics during trickle irrigation. Irrig. Sci. 2013, 31, 225–258. [Google Scholar] [CrossRef]
  7. Bell, J.M.; Schwartz, R.C.; McInnes, K.J.; Howell, T.A.; Morgan, C.L.S. Effects of irrigation level and timing on profile soil water use by grain sorghum. Agric. Water. Manag. 2020, 232, 106030. [Google Scholar] [CrossRef]
  8. Bodner, G.; Nakhforoosh, A.; Kaul, H. Management of crop water under drought: A review. Agron. Sustain. Dev. 2015, 35, 401–442. [Google Scholar] [CrossRef]
  9. Medrano, H.; Tomás, M.; Martorell, S.; Escalona, J.; Pou, A.; Fuentes, S.; Flexas, J.; Bota, J. Improving water use efficiency of vineyards in semi-arid regions. A review. Agron. Sustain. Dev. 2015, 35, 499–517. [Google Scholar] [CrossRef] [Green Version]
  10. Nederhof, A.J. Bibliometric monitoring of research performance in the Social Sciences and the Humanities: A Review. Scientometrics 2006, 66, 81–100. [Google Scholar] [CrossRef]
  11. Mao, G.; Zou, H.; Chen, G.; Du, H.; Zuo, J. Past, current and future of biomass energy research: A bibliometric analysis. Renew. Sustain. Energy Rev. 2015, 52, 1823–1833. [Google Scholar] [CrossRef]
  12. Cui, Y.; Zeng, C.; Zhou, J.; Xie, H.; Wan, W.; Hu, L.; Xiong, W.; Chen, X.; Fan, W.; Hong, Y. A spatio-temporal continuous soil moisture dataset over the Tibet Plateau from 2002 to 2015. Sci. Data 2019, 6, 247. [Google Scholar] [CrossRef] [PubMed] [Green Version]
  13. McColl, K.A.; Alemohammad, S.H.; Akbar, R.; Konings, A.G.; Yueh, S.; Entekhabi, D. The global distribution and dynamics of surface soil moisture. Nat. Geosci. 2017, 10, 100–104. [Google Scholar] [CrossRef]
  14. Arbeláez-Cortés, E. Knowledge of Colombian biodiversity: Published and indexed. Biodivers. Conserv. 2013, 22, 2875–2906. [Google Scholar] [CrossRef]
  15. Wang, X.; Ma, M.; Li, X.; Zhang, Z. Applications and researches of geographic information system technologies in bibliometrics. Earth Sci. Inform. 2014, 7, 147–152. [Google Scholar] [CrossRef]
  16. Wang, H.; He, Q.; Liu, X.; Zhuang, Y.; Hong, S. Global urbanization research from 1991 to 2009: A systematic research review. Landsc. Urban Plan 2012, 104, 299–309. [Google Scholar] [CrossRef]
  17. Borgatti, S.P.; Everett, M.G.; Freeman, L.C. Ucinet for Windows: Software for Social Network Analysis; Analytic Technologies: Harvard, MA, USA, 2002. [Google Scholar]
  18. Chen, C. Searching for intellectual turning points: Progressive knowledge domain visualization. Proc. Natl. Acad. Sci. USA 2004, 101 (Suppl. 1), 5303–5310. [Google Scholar] [CrossRef] [Green Version]
  19. Van Eck, N.J.; Waltman, L. Software survey: VOSviewer, a computer program for bibliometric mapping. Scientometrics 2010, 84, 523–538. [Google Scholar] [CrossRef] [Green Version]
  20. Shreve, F. Rainfall, Runoff and Soil Moisture under Desert Conditions. Ann. Assoc. Am. Geogr. 1934, 24, 131–156. [Google Scholar] [CrossRef]
  21. Hengl, T.; Minasny, B.; Gould, M. A geostatistical analysis of geostatistics. Scientometrics 2009, 80, 491–514. [Google Scholar] [CrossRef] [Green Version]
  22. Feddes, R.A.; Kowalik, P.; Kolinska-Malinka, K.; Zaradny, H. Simulation of field water uptake by plants using a soil water dependent root extraction function. J. Hydrol. 1976, 31, 13–26. [Google Scholar] [CrossRef]
  23. Moore, I.D.; Burch, J.G.; Mackenzie, D.H. Topographic Effects on the Distribution of Surface Soil Water and the Location of Ephemeral Gullies. Trans. ASAE 1988, 31, 1098–1107. [Google Scholar] [CrossRef]
  24. Holtan, H.; Kamp-Nielsen, L.; Stuanes, A.O. Phosphorus in soil, water and sediment: An overview. Hydrobiologia 1988, 170, 19–34. [Google Scholar] [CrossRef]
  25. Green, J.K.; Seneviratne, S.I.; Berg, A.M.; Findell, K.L.; Hagemann, S.; Lawrence, D.M.; Gentine, P. Large influence of soil moisture on long-term terrestrial carbon uptake. Nature 2019, 565, 476–479. [Google Scholar] [CrossRef] [PubMed]
  26. Cheema, M.J.M.; Bastiaanssen, W.G.M.; Rutten, M.M. Validation of surface soil moisture from AMSR-E using auxiliary spatial data in the transboundary Indus Basin. J. Hydrol. 2011, 405, 137–149. [Google Scholar] [CrossRef]
  27. Guo, Y.; Peng, C.; Zhu, Q.; Wang, M.; Wang, H.; Peng, S.; He, H. Modelling the impacts of climate and land use changes on soil water erosion: Model applications, limitations and future challenges. J. Environ. Manag. 2019, 250, 109403. [Google Scholar] [CrossRef]
  28. Belder, P.; Bouman, B.A.M.; Cabangon, R.; Guoan, L.; Quilang, E.J.P.; Yuanhua, L.; Spiertz, J.H.J.; Tuong, T.P. Effect of water-saving irrigation on rice yield and water use in typical lowland conditions in Asia. Agric. Water Manag. 2004, 65, 193–210. [Google Scholar] [CrossRef]
  29. Ulrich, D.E.M.; Sevanto, S.; Ryan, M.; Albright, M.B.N.; Johansen, R.B.; Dunbar, J.M. Plant-microbe interactions before drought influence plant physiological responses to subsequent severe drought. Sci. Rep. 2019, 9, 249. [Google Scholar] [CrossRef] [Green Version]
  30. Guo, S.; Wang, J.; Zhang, F.; Wang, Y.; Guo, P. An Integrated Water-Saving and Quality-Guarantee Uncertain Programming Approach for the Optimal Irrigation Scheduling of Seed Maize in Arid Regions. Water 2018, 10, 908. [Google Scholar] [CrossRef] [Green Version]
  31. Orduña Alegría, M.E.; Schütze, N.; Niyogi, D. Evaluation of Hydroclimatic Variability and Prospective Irrigation Strategies in the U.S. Corn Belt. Water 2019, 11, 2447. [Google Scholar] [CrossRef] [Green Version]
  32. Noborio, K. Measurement of soil water content and electrical conductivity by time domain reflectometry: A review. Comput. Electron. Agric. 2001, 31, 213–237. [Google Scholar] [CrossRef]
  33. Boix-Fayos, C.; Calvo-Cases, A.; Imeson, A.C.; Soriano-Soto, M.D. Influence of soil properties on the aggregation of some Mediterranean soils and the use of aggregate size and stability as land degradation indicators. Catena 2001, 44, 47–67. [Google Scholar] [CrossRef]
  34. Wang, M.; Liu, D.; Jia, J.; Zhang, X. Global trends in soil monitoring research from 1999–2013: A bibliometric analysis. Acta Agric. Scand. Sect. B Soil Plant Sci. 2015, 65, 483–495. [Google Scholar]
  35. Huang, L.; Shao, M.A. Advances and perspectives on soil water research in China’s Loess Plateau. Earth Sci. Rev. 2019, 199, 102962. [Google Scholar] [CrossRef]
  36. Willcocks, T.J.; Twomlow, S.J. A review of tillage methods and soil and water conservation in southern Africa. Soil Tillage Res. 1993, 27, 73–94. [Google Scholar] [CrossRef]
  37. Pacific, V.J.; McGlynn, B.L.; Riveros-Iregui, D.A.; Epstein, H.E.; Welsch, D.L. Differential soil respiration responses to changing hydrologic regimes. Water Resour. Res. 2009, 45, W07201. [Google Scholar] [CrossRef] [Green Version]
  38. Chen, J.M.; Chen, X.; Ju, W.; Geng, X. Distributed hydrological model for mapping evapotranspiration using remote sensing inputs. J. Hydrol. 2005, 305, 15–39. [Google Scholar] [CrossRef]
  39. Petropoulos, G.P.; Ireland, G.; Barrett, B. Surface soil moisture retrievals from remote sensing: Current status, products & future trends. Phys. Chem. Earth Parts 2015, 83–84, 36–56. [Google Scholar]
  40. Karthikeyan, L.; Pan, M.; Wanders, N.; Kumar, D.N.; Wood, E.F. Four decades of microwave satellite soil moisture observations: Part 1. A review of retrieval algorithms. Adv. Water Resour. 2017, 109, 106–120. [Google Scholar] [CrossRef]
  41. Reichle, R.H. Data assimilation methods in the Earth sciences. Adv. Water Resour. 2008, 31, 1411–1418. [Google Scholar] [CrossRef]
  42. Lei, T.; Pang, Z.; Wang, X.; Li, L.; Fu, J.; Kan, G.; Zhang, X.; Ding, L.; Li, J.; Huang, S.; et al. Drought and Carbon Cycling of Grassland Ecosystems under Global Change: A Review. Water 2016, 8, 460. [Google Scholar] [CrossRef] [Green Version]
  43. Berg, A.; Sheffield, J. Climate Change and Drought: The Soil Moisture Perspective. Curr. Clim. Chang. Rep. 2018, 4, 180–191. [Google Scholar] [CrossRef]
  44. Haile, G.G.; Tang, Q.; Li, W.; Liu, X.; Zhang, X. Drought: Progress in broadening its understanding. Wires. Water 2019, 7, e1407. [Google Scholar] [CrossRef]
  45. Otalvaro, I.F.; Neto, M.P.C.; Delage, P.; Caicedo, B. Relationship between soil structure and water retention properties in a residual compacted soil. Eng. Geol. 2016, 205, 73–80. [Google Scholar] [CrossRef]
  46. Rezanezhad, F.; Price, J.S.; Quinton, W.L.; Lennartz, B.; Milojevic, T.; Van Cappellen, P. Structure of peat soils and implications for water storage, flow and solute transport: A review update for geochemists. Chem. Geol. 2016, 429, 75–84. [Google Scholar] [CrossRef]
  47. Zhao, Y.; Si, B.; He, H.; Xu, J.; Peth, S.; Horn, R. Modeling of Coupled Water and Heat Transfer in Freezing and Thawing Soils, Inner Mongolia. Water 2016, 8, 424. [Google Scholar] [CrossRef]
  48. Kathuria, D.; Mohanty, B.P.; Katzfuss, M. Multiscale Data Fusion for Surface Soil Moisture Estimation: A Spatial Hierarchical Approach. Water Resour. Res. 2019, 55, 10443–10465. [Google Scholar] [CrossRef]
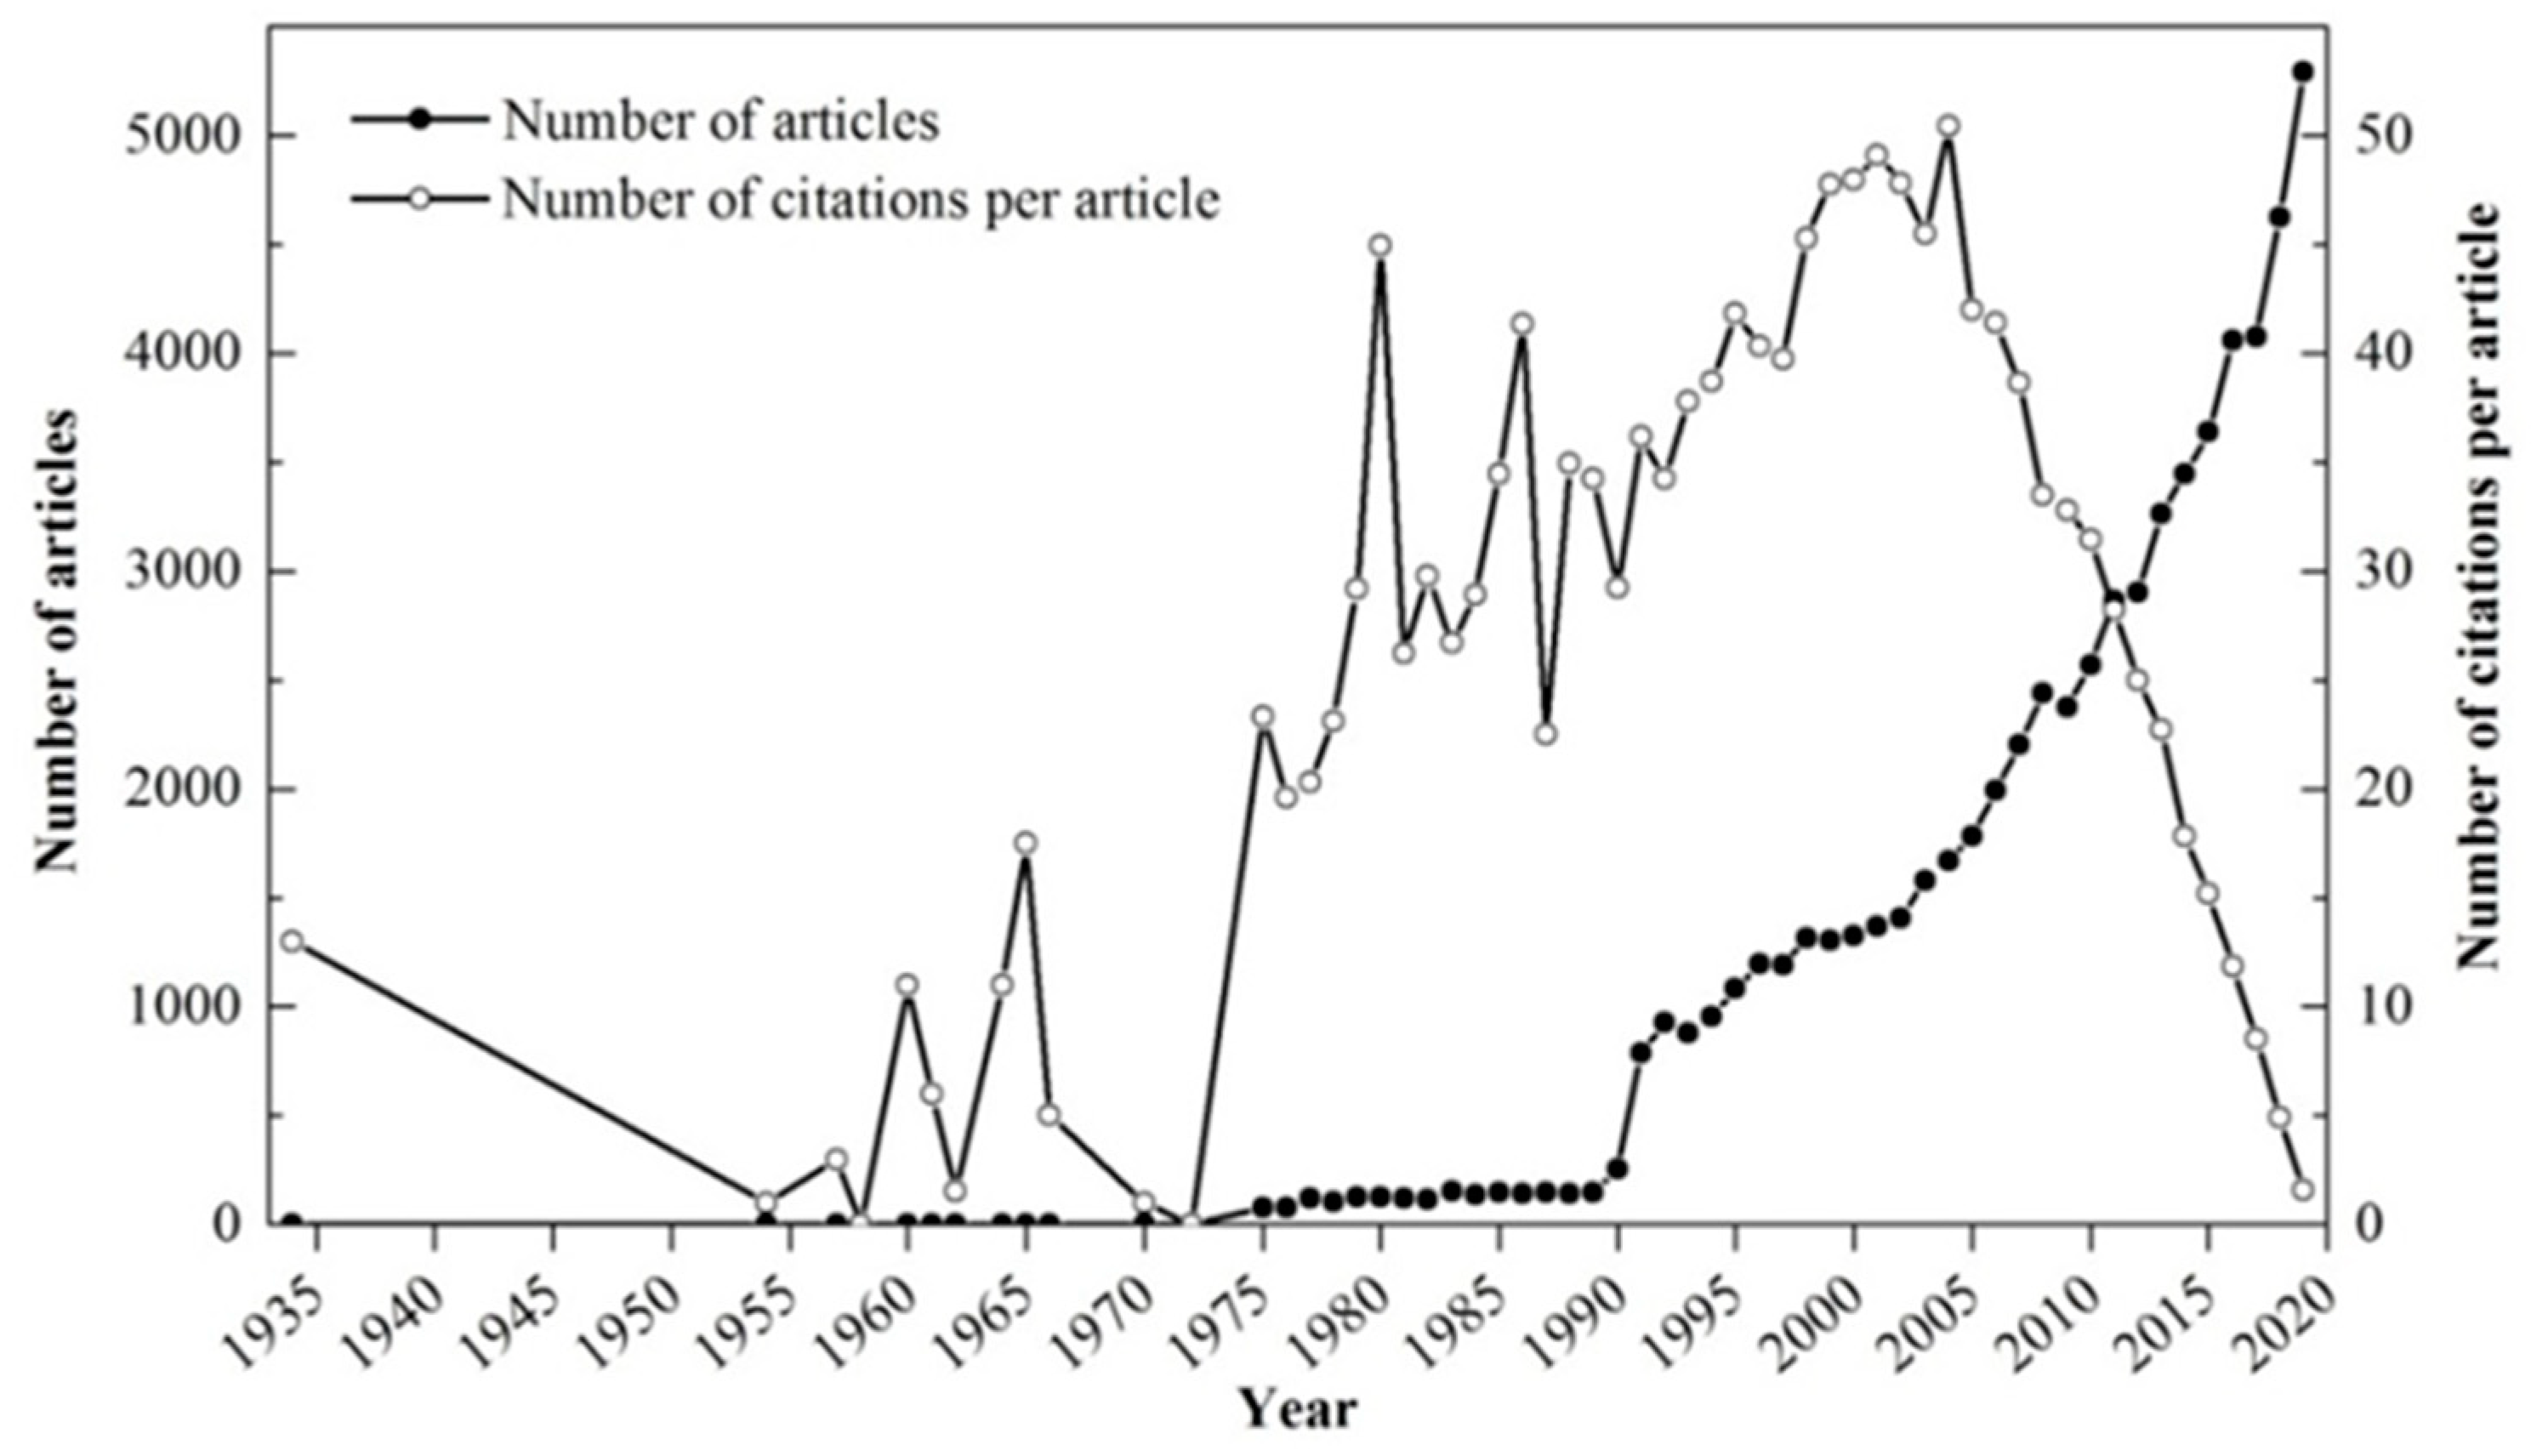
Figure 1. The annual number of articles and citations per article from 1934 to 2019.
Water 12 01631 g001
Figure 2. The annual number of soil water (SW) research articles (a) and citations per article (b) in the top 6 subject categories.
Water 12 01631 g002
Figure 3. Evolution of internationally collaborative and independent articles in SW research.
Water 12 01631 g003
Figure 4. Core international collaboration network map of the top 20 countries from 1934 to 2019.
Water 12 01631 g004
Figure 5. Global geographic distribution of authors in the field of SW research.
Water 12 01631 g005
Figure 6. The co-occurrence network map of keywords published more than 50 times from 1990 to 2019.
Water 12 01631 g006
Table 1. Characteristics of article output from 1934 to 2019.
YearTATA (%)TUTU/TATRTR/TATPTP/TATCTC/TA
1934–194910.00211.0055.002626.001313.00
1950–195930.00541.333812.67248.0041.33
1960–196980.012141.7517121.38516.38718.88
1970–19795080.76210682.10649912.7939377.7511,87023.37
1980–198913662.04932002.3423,10716.9212,5029.1544,12132.30
1990–1999988814.83628,9922.93275,35927.85109,72711.10400,38640.49
2000–200918,13927.21668,0413.75679,88537.48208,28811.48756,06541.68
2010–201936,73555.118179,3094.881,873,81051.01454,35812.37539,02114.67
Total66,648 280,629 2,858,874 788,913 175,1551
Average 4.21 42.90 11.84 26.28
Abbreviations: TA, total number of articles; TU, total number of authors; TR, total number of cited references; TP, total number of pages; TC, total number of citations; TU/TA, TR/TA, TP/TA, and TC/TA, refer to the number of authors, references, pages, and citations per article, respectively.
Table 2. Top 20 productive journals in SW research during 1934–2019.
Journal TitleTATA (%)TCTC (%)TC/TA
Journal of Hydrology18212.7365,6833.7536.07
Agricultural Water Management14972.2535,6342.0323.80
Water Resources Research14792.2277,0024.4052.06
Soil Science Society of America Journal13081.9651,6952.9539.52
Hydrological Processes10661.6030,3181.7328.44
Plant and Soil9761.4630,9551.7731.72
Agricultural and Forest Meteorology8961.3435,7892.0439.94
Geoderma8721.3124,6101.4128.22
Hydrology and Earth System Sciences8631.2925,9401.4830.06
Soil & Tillage Research8101.2224,4861.4030.23
Journal of Geophysical Research-Atmospheres8061.2138,8962.2248.26
Forest Ecology and Management7541.1323,6461.3531.36
Agronomy Journal7261.0920,8941.1928.78
IEEE Transactions on Geoscience and Remote Sensing6941.0431,1371.7844.87
Vadose Zone Journal6630.9913,0930.7519.75
Soil Biology & Biochemistry6580.9934,8141.9952.91
Science of the Total Environment6570.9911,1300.6416.94
Remote Sensing of Environment6450.9736,8602.1057.15
Journal of Hydrometeorology6280.9426,6731.5242.47
Remote Sensing5900.8954720.319.27
Abbreviations: TA, total number of articles; TC, total number of citations; TC/TA, number of citations per article.
Table 3. Top 20 productive institutions in SW research during 1934–2019.
InstitutionCountryTATCTC/TA
Chinese Academy of SciencesChina476191,89119.30
USDA ARSUSA2858101,30535.45
University of Chinese Academy of SciencesChina113310,6109.36
INRAFrance95239,49141.48
NASAUSA83953,76364.08
University of California, DavisUSA74528,07737.69
University of FloridaUSA73017,22123.59
University of ArizonaUSA72738,67853.20
Northwest A&F UniversityChina683695510.18
China Agricultural UniversityChina67411,84117.57
Beijing Normal UniversityChina64111,55318.02
Colorado State UniversityUSA63828,32344.39
CSICSpain62821,21433.78
Texas A&M UniversityUSA58316,83128.87
Agriculture and Agri-Food CanadaCanada58213,68623.52
US Geological SurveyUSA56827,19347.88
Oregon State UniversityUSA54822,37840.84
CSIROAustralia53427,96752.37
University of NebraskaUSA52915,77729.82
US Forest ServiceUSA52418,79335.86
Abbreviations: TA, total number of articles; TC, total number of citations; TC/TA, number of citations per article; USDA ARS, United States Department of Agriculture, Agricultural Research Service; INRA, Institute National de la Recherche Agronomique; NASA, National Aeronautics and Space Administration; CSIC, Spanish National Research Council; CSIRO, Commonwealth Scientific and Industrial Research Organization.
Table 4. Top 20 productive countries/territories in SW research.
CountryTATC/TAIAIA (%)IC/IACACA (%)CC/CA
USA23,23834.7017,91777.1035.27532122.9032.79
China10,83215.49799973.8513.73283326.1520.46
Australia405731.13266065.5728.61139734.4335.94
Germany386828.68219556.7524.68167343.2533.92
Canada386428.87274671.0727.26111828.9332.80
UK328239.19182255.5137.81146044.4940.91
France305936.76162953.2535.51143046.7538.18
Spain238930.13150863.1228.6688136.8832.63
India238512.26205586.1611.5733013.8416.52
Brazil227015.75171175.3710.1855924.6332.79
Italy214432.10134362.6425.1280137.3643.80
Japan206220.34139867.8017.1766432.2027.03
Netherlands174942.6675343.0539.3299656.9545.18
Switzerland117538.0251744.0037.4765856.0038.45
Sweden98434.3350351.1231.6948148.8837.08
Iran90210.9866874.069.6523425.9414.77
Belgium88436.0238643.6732.6949856.3338.61
Denmark80236.7942352.7435.4637947.2638.27
Argentina70423.6349269.8918.0921230.1136.48
Russia63214.6742767.564.9920532.4434.85
Abbreviations: TA, total number of articles; TC/TA, number of citations per article; IA, number of independent articles; IC/IA, number of citations per independent article; CA, number of internationally collaborative articles; CC/CA, number of citations per internationally collaborative article.
Table 5. The top 20 high-frequency keywords in SW research from 1990 to 2019.
Keywords1990–19992000–20092010–20191990–2019
FRFRFRFR
Soil moisture3991134413260150031
Climate change622329461308216642
Drought140638941128316573
Evapotranspiration11484532920414874
Soil water content96123435759511985
Soil water18523983509910926
Remote sensing46382639733610427
Irrigation1327283751889338
Soil15142788437118669
Water stress1743236124321284210
Water use efficiency612519319522777611
Soil temperature8015215144661076112
Nitrogen1455250103082070313
Transpiration1148241113321568714
Soil respiration3555210153931463815
Photosynthesis11110207163121963016
Temperature8314205173221861017
Water balance8015201183231760418
Precipitation2682131254241358119
Stomatal conductance10511217132502657220
Abbreviations: F, frequency of keywords; R, the rank of the keywords.