Article

Drought Stress and Livelihood Response Based on Evidence from the Koshi River Basin in Nepal: Modeling and Applications

1
Institute of Mountain Hazards and Environment, Chinese Academy of Sciences, Chengdu 610041, China
2
University of Chinese Academy of Sciences, Beijing 100049, China
3
College of Resources and Environment, University of Chinese Academy of Sciences, Beijing 100190, China
4
Center of Research for Environment, Energy and Water (CREEW), Kathmandu 44600, Province No. 3, Nepal
*
Author to whom correspondence should be addressed.
Water 2020, 12(6), 1610; https://doi.org/10.3390/w12061610
Submission received: 11 May 2020 / Revised: 2 June 2020 / Accepted: 2 June 2020 / Published: 5 June 2020
(This article belongs to the Section Water Use and Scarcity)

Abstract

:
Drought vulnerability analysis at the household level can help people identify livelihood constrains and potential mitigation and adaptation strategies. This study used meteorological and household level data which were collected from three different districts (Kavrepalanchowk, Sindhuli, and Saptari) in the Koshi River Basin of Nepal to conduct a drought vulnerability analysis. We developed a model for assessing drought vulnerability of rural households based on three critical components, i.e., exposure, sensitivity, and adaptive capacity. The results revealed that Saptari (drought vulnerability index, 0.053) showed greater vulnerability to drought disasters than Kavrepalanchowk (0.014) and Sindhuli (0.007). The most vulnerable district (Saptari) showed the highest exposure, the highest sensitivity, and the highest adaptive capacity. Kavrepalanchowk had the middle drought vulnerability index with middle exposure, low sensitivity, and middle adaptive capacity. Sindhuli had the lowest vulnerability with the lowest exposure, the lowest sensitivity, and the lowest adaptive capacity. On the basis of the results of the vulnerability assessment, this paper constructed livelihood adaptation strategies from the perspectives of households, communities, and the government. Many households in Kavrepalanchowk and Sindhuli significantly depend on agriculture as their main source of income. They need to implement some strategies to diversify their sources of income. In addition, the most important livelihood adaptation strategy for Saptari is improving water conservancy facilities to facilitate the allocation of water.

1. Introduction

Understanding, evaluating, and mitigating the impact of climate changes such as frequent drought and flood disasters poses one of the most important and challenging issues of the 21st century. Climate change causes negative impacts on the economic, ecological and social services, and the impacts vary greatly by region [1]. Additionally, the effects of climate change are more serious in poor regions because these regions rely heavily on natural resources but have a low coping capacity for natural disasters [2]. Many studies have concluded that recent extreme weather events are very likely to lead to reduced agricultural yields, wetland losses, and social unrest [3,4,5]. Therefore, comprehensive research on the impacts of climate change would provide information for proposing effective strategies for disaster prevention and mitigation.
Natural disasters happen and affect people’s livelihoods in most parts of the world. Some people are more vulnerable as differences exist among countries and communities within a nation, and the effect of disasters driven by climate change on different households can vary within communities [6]. The United Nations have evaluated that about 1.5 billion people in the world are vulnerable to drought, and the national drought vulnerability is the highest in Asia [7]. For vulnerable households, the threat of drought is very likely to prevent them from making full use of their resources and cause them to be poorer than they used to be [8].
A regional vulnerability assessment provides prerequisites and strategies for climate change adaptations [9]. The Intergovernmental Panel on Climate Change (IPCC) has defined climate change vulnerability as a function of the character, magnitude, and rate of climate change and variation to which a system is exposed, its sensitivity, and its adaptive capacity [10,11]. Typical vulnerability analysis includes three aspects, namely, exposure, sensitivity, and adaptation. Exposure refers to the magnitude and duration of changes in climate such as temperature rise and precipitation reduction, sensitivity refers to the degree that a system is affected by climate risk, and adaptive capacity is the ability of the system to recover from an exposure [12,13,14,15,16]. Therefore, assessing vulnerability to climate change, by estimating its three components, is key for evaluating and improving households’ livelihoods.
Previous research has shown the vulnerability of various objects to climate change including physiographic zones [10], crops [17], soil [18], elevation levels, aquaculture [19], tourism [20], and extreme events. However, the vulnerability assessment of agricultural countries at the household level is limited, but it is important for policy recommendations. Moreover, studies on vulnerability to disasters caused by climate change, namely, floods, landslides, windstorm etc., have shown that climate change damage was very likely to affect residents’ livelihood in Nepal. In order to address vulnerability, Nagoda and Nightingale [6,21,22] improved climate change adaptation (CCA) approaches and qualitatively described the vulnerability of food security faced with climatic stressors in Nepal at the village, district, and national levels. Additionally, Baffoe and Matsuda [23] employed the livelihood vulnerability index (LVI) investigated the spatial variation of each household’ livelihood vulnerability and their results showed that disparity existed but it was not significant. In addition, the climate vulnerability index has been proposed to quantitatively evaluate population vulnerability to climate change at the regional level [24,25]. The household vulnerability index (HVI) has been developed to measure household vulnerability by the Food Agriculture and Natural Resources Policy Analysis Network [26], and Pham et al. [27] employed it to estimate the vulnerability of smallholder farmers under the influence of flash floods and landslides. An analytical framework was used for drought vulnerability assessment, consisting of a social-ecological model, an operationalized measure for livelihood security assessment, and a strategy for vulnerability assessments of households [28]. Silva and Kawasaki [2] estimated household vulnerability to droughts and floods based on access models and the pressure and release (PAR) and their results showed that low income households who depend heavily on agriculture suffered most from disasters. Work on the impacts of floods, landslides, and earthquakes in Nepal is well researched but the vulnerability research on drought disasters at a household level is limited [29,30].
The present method differs from previous approaches in that it employs primary data from household surveys to calculate the drought vulnerability index, which avoids the pitfalls associated with using secondary data. Additionally, empirical researches on vulnerability to climate change have been conducted at the national and subnational level [31,32,33]. A vulnerability assessment is usually required for the current scales and it needs to be more localized, such as at the community or household levels [34]. If we study drought vulnerability at the national level, the strategies are not suitable for households in most parts of Nepal in the context of different geographical features. Thus, this study developed a model for assessing drought vulnerability of rural households and constructed a strategy system for adaptation to climate change to address its negative impacts in different geographical areas.
There are many challenges, including frequency droughts, heavy relance on rainfed agriculture, and a low socioeconomic status in the Koshi River Basin, which result in high sensitivity to climate change. This study attempts to assess household vulnerability to drought disasters in three districts and aims to identify the most vulnerable group using data from household questionnaire surveys. It further compares the specific indicators which depict the three contributing factors to drought vulnerability (exposure, sensitivity, and adaptive capacity) at the household level. The ultimate goal is to present recommendations on how to mitigate vulnerability to droughts and improve the adaptive capacity. It is efficient to implement the drought adaptations through a multi-stakeholder process.

2. Methodology

2.1. Study Area

2.1.1. Topography

The Koshi River which runs from north to south for a total length of 255 km originates in the middle part of the Himalayan orogen. The basin spans some parts of Tibet in the southwest of China, eastern Nepal, and northern India and it covers an area of 59,000 km2. This paper focuses on the part of the basin in Nepal, with an area of about 39,500 km2 and a population density of 329 per square kilometer [35]. The study area can be divided into five regions including High Himalayas, High Mountains, Middle Mountain, Siwalik, and Tarai [36]. The elevation ranges from 57 masl in the Tarai to 8431 masl in the High Himalayas. More than 70% of the study area is mountainous, which increases the household vulnerability to natural disasters, especially droughts and floods (Figure 1).

2.1.2. Climate

In the study area, the annual average temperature is 10.5 ℃ and the average rainfall is 1683 mm [35]. There are the following four distinct climatic seasons in the Koshi River Basin: pre-monsoon (March–May), monsoon (June–September), post-monsoon (October–November), and winter (December–February) [37]; about 80% of the precipitation occurred in the monsoon season (Figure 2). Figure 3 shows the trend line of precipitation during the monsoon season for 1901–2015, indicating a clear picture of decreasing precipitation. Seasonal drought is the main threat to rural livelihood. Almost every year, people experienced localized droughts which caused crop losses and jeopardized sustainable development of the study area [38]. The spring drought from 1985 to 2014 was reported to be frequent in Nepal. It occurred at least 4 or 5 times in most regions of the Koshi River Basin [39]. Frequent droughts have threatened food production, water security, and livestock losses. As a result, the household income decreased and some people suffered from hunger, thirst, and poverty.

2.1.3. Social Economy

There are 77 districts in Nepal. It occupies a land area of 147,181 km2 and has a population of 26.49 million. This study was conducted in the Koshi River Basin of Nepal, which contains 27 districts. It covers an area of 39,500 km2 and the population is around 13 million [40]. Agriculture which is subject to climate change is the main source of income, and therefore residents are sensitive to natural hazards. Kathmandu, the capital of Nepal is the center for tourism with a lower dependence on agriculture than other districts. According to the Nepal Human Development Report 2014 published by the government of Nepal National Planning Commission, the per capita income is 1197 USD, which shows the study area has a low level of economic development.

2.1.4. Culture Norms

Nepal is a multireligious, multicultural, multilingual, and multiracial country. Hindus represent 81.3% of the total population, 9.0% identifying as Buddhists, 4.4% as Muslims, 3.0% as Kirant/Yumaist, 1.4% as Christian, and 0.9% of people follow other religions or none religious [41]. The most distinctive features of the culture of Nepal are the caste system and the land system. The caste system is a status symbol. It includes four classes which are Sudra priest (laborers), Vaisya (merchants and traders), Kshatriya (warriors), and Brahman (priests and scholars). Intercaste marriage tends to carry a social disgrace. In addition, the private ownership of land results in an uneven distribution of land, which greatly widens the gap between the rich and poor and limits economic growth. According to the National Sample Census of Agriculture Nepal 2012 carried out by the Central Bureau of Statistics (CBS), only about 47% of households own 15% of the total land, however, 5% of households own 37% of the total land in the study area. In this study, religious factor is not considered in the vulnerability model because it is complicated and difficult to quantify. We strengthen the analysis of all potential factors as far as possible in the next study.

2.2. Data Collection

For this study, we used meteorological data and farm survey data collected from three different districts (Kaverepalanchowk, Sindhuli, and Saptari) in the Koshi River Basin of Nepal. The meteorological data was taken from the MODIS evapotranspiration product (MOD16A3) in the high-resolution monthly grid dataset, the database from the International Centre for Integrated Mountain Development (ICIMOD), and the Climatic Research Unit Timeseries (CRU TS) dataset. Specifically, the crop water stress index (CWSI) in the Koshi River Basin during the period from 2000 to 2014 was computed according to MOD16A3. The data about the number of occurrences of drought disasters during spring season from 1985 to 2014 and the months of drought duration was taken from the database of ICIMOD, KBIS. The data about precipitation during the monsoon season for 1901–2015 was taken from the CRU TS dataset. The information used for the variables based on sensitivity and adaptive capacity was taken from household surveys.
We used both primary and secondary data in this study. When we asked the respondents information about drought disasters, they gave us an obscure answer. They could not clearly remember and describe the frequency, intensity, and duration of droughts. Therefore, the combination of meteorological data and farm survey data was used for the analysis in this study. It made the indicators more comprehensive, which helped us learn more information about the research subjects. However, there were some limitations caused by taking both sources. For example, the data used for drought intensity, frequency, and duration was a time series and could not reflect the latest information such as the questionnaire data. Nevertheless, it could show the spatial differences in climatic conditions.

2.3. The Empirical Estimation Technique

Empirical research is defined as research in. which results and conclusions of the study are strictly derived from concretely empirical evidence rather than from theory or belief [42]. The word empirical means that the data collection is based on observation, experience, or calibrated scientific instruments. Generally speaking, empirical research can be conducted by using quantitative or qualitative methods [43]. This study employed the quantitative research method. It was used to gather information through digital data which could quantify behaviors, opinions, or other defined indicators. Survey research commonly involves many people to gather a large amount of information, and uses a predetermined series of closed questions which are quite easy to answer. High responses are achieved due to the simplicity of this method, and now it is one of the most widely used methods for various research.
By using primary household data, the empirical evaluation was conducive to avoid the pitfalls linked with using secondary data [44]. For example, based on the information collected from the respondents, the minimum, mean, and maximum values for each of the variables used was determined, which showed gaps in exposure, sensitivity, and adaptability among households. Another advantage was that conclusions drawn from representative samples were generalizable to this region. In other words, the empirical evaluation helped draw conclusions applicable to the whole region through the sample study [2,29].
Household questionnaires helped us to understand the survey participants’ opinions on livelihood issues and actions about adaptation to climate change. Selecting survey sites at a district scale, we considered three crucial principles, namely, the topographies of the basin, mountains, hills, and plains; covering the middle and lower reaches of the basin; and the climate ranges from the cold mountains to the tropical Tarai. At the household scale, we considered four aspects, that is, livelihood issues, types of livelihoods, family income levels, and the distance to rivers. Interviews were conducted by four students from Kathmandu University and one staff from the ICIMOD. Before the team arrived in the village, the staff contacted the community leaders and obtained permission to conduct the questionnaire survey. The community leaders introduced basic information about the households to us when our field team came to a village. On the basis of the information, four factors including livelihood issues, types of livelihoods, family income levels, and the distance to rivers were considered when we selected samples. This study employed the household sampling method which was adapted from the World Health Organization (WHO) [45]. Specifically, the team drove to the center of the village and selected a direction for the first interviewer through randomly spinning a pen [44] and the selection of directions for other interviewers was conducted in the same way. The interviewers chose the houses based on the principles mentioned above, walking in their respective direction. They knocked on the door and interviewed the head of household. If a household was empty, they skipped it and moved to the next house. When the head of the household was not at home, the wife was interviewed. Identifying information which included the questionnaire number and the name of the district was recorded. Using the method of random sampling, we ended up with 130 questionnaires consisting of a set of questions which referred to basic family information, livelihood issues, livelihood capitals, and strategies for climate change adaptation, in April 2018. Table 1 showed some topographic characteristics of the sample districts.

2.4. Approaches to Measuring Vulnerability

The vulnerability concept proposed by the IPCC has been applied to a large variety of assessments in drought-prone areas [10]. For the purpose of deriving indicators, it is necessary to understand and distinguish the three components of vulnerability. Exposure refers to climate changes and it describes rural households’ pressure on drought disaster [46,47,48], which can be characterized by drought intensity, duration, and frequency. Sensitivity refers to the degree to which households are affected by drought disasters [10]. It is measured by the agricultural investment such as the proportion of the area of rainfed agriculture land, livestock ownership, and employment in agriculture. Adaptive capacity describes the ability of rural households to adjust to drought stresses [2] and it can be characterized by the economic strength, types of livelihood, access to water, and external support. Families with high exposure, high sensitivity, and low adaptive capacity are the most vulnerable. The variables used for the drought vulnerability assessment were selected based on available literature, as mentioned in Table 2.
The main difficulty of calculating indicators into a drought vulnerability index is that many indicators are expressed in different units. It is necessary to standardize the indicators. The data standardization approach (Equations (1) and (2)) is widely used to calculate a climate vulnerability index [44,55].
For the indicators with a positive correlation with the major components:
r i = λ i λ i min λ i max λ i min
For the indicators with a negative correlation with the major components:
r i = λ i max λ i λ i max λ i min
where λi is the original subcomponent; λimax and λimin are the maximum and minimum values, respectively; and ri refers to the standardized value of λi. This standardization makes for data with values ranging from zero to one, for the purpose of making variables comparable to each other. For example, the units of household income and average time to water source are different, the standardization can make them comparable to each other. In Equation (1), a higher λi means a higher ri, and in Equation (2), a higher λi means a lower ri. The dataset where a higher value means a lower corresponding major component was inverted by subtracting the standardized value by one. The inverted dataset only includes the average time to get water.
The rank correlation analysis is an improved method of analytic hierarchy process and it was adopted to distribute the weight of indicators in different dimensions. The rank correlation analysis is efficient to determine the mutual effects between indicators [56]. We used it to distribute the weight of each subcomponent in different dimensions and calculate the composite index. The calculation models of exposure index (EI), sensitivity index (SI), adaptive capacity index (ACI), and drought vulnerability index (DVI) can be written as Equations (3)–(6) [57].
EI = E i ω i ω i
SI = S j ω j ω j
ACI = A n ω n ω n
DVI = ( E i ω i ω i A n ω n ω n ) S j ω j ω j
where i (i = 1, 2, 3), j (j = 1, 2, 3), and n (n = 1, 2, …, 5) indicate the number of exposure subcomponents, sensitivity subcomponents, and adaptive capacity subcomponents, respectively. Ei, Sj, and An are the standardized values of exposure subcomponents, sensitivity subcomponents, and adaptive capacity subcomponents respectively. ωi, ωj and ωn are the weights of exposure subcomponents, sensitivity subcomponents, and adaptive capacity subcomponents, respectively. EI, SI, ACI, and DVI represent the exposure index, sensitivity index, adaptive capacity index, and drought vulnerability index respectively.

3. Results

3.1. Exposure and Sensitivity

The subcomponents, major components, and the composite DVI for each district are presented in Table 3. Among three districts, the highest value of exposure was recorded in the Saptari district (0.700) and lowest value in the Sindhuli district (0.341). In a drought-prone region, the drought intensity, duration, and frequency can potentially create high exposure to climate change among farmers [58,59,60,61]. Saptari showed a higher drought intensity, longer drought duration, and lower drought frequency than Kavrepalanchowk and Sindhuli (the drought intensity was 0.80 in Saptari, indicating that the region was threatened by water scarcity which was a serious constraint for crop production [62]. Furthermore, the long drought duration could increase the risk of crop failure in Saptari).
Saptari (0.192) also showed greater sensitivity to drought disasters than Kavrepalanchowk (0.154) and Sindhuli (0.153) (Figure 4). The households in the three districts are involved in some other income earning activities such as fishing, collecting forest products, working in a different district, doing small business, and so on, whereas households in all three districts depend highly on agriculture as their main source of income. Furthermore, in the index showing the area of rainfed agriculture land, Saptari has the highest value, and Sindhuli has the lowest value. Rainfall plays an important role in rainfed agriculture, and therefore the regions relying heavily on rainfed agriculture are more sensitive to drought [10]. In the index showing the number of livestock, Saptari has the highest value (0.071), followed by Sindhuli (0.026) and Kavrepalanchowk (0.022). The households usually raise animals including cow, buff, goat, sheep and pig that demand a lot of food and water. Households who heavily rely on livestock farming means that the households are especially vulnerable to changes in precipitation (the number of livestock per household, Kavrepalanchowk 8, Sindhuli 9, and Saptari 26) [63].

3.2. Adaptive Capacity

The adaptive capacity index ranges from 0.295 in Sindhuli to 0.422 in Saptari. Livelihood diversification strategies which are described by the average livelihood diversification index play an important role in development process (livelihood diversification strategies, Kavrepalanchowk 2.58, Sindhuli 2.84, and Saptari 3.12). In addition to agricultural activities, many households are involved in non-agricultural income earning activities such as working in a different district due to a lack of jobs in Kavrepalanchowk and Sindhuli (most of respondents are female in Kavrepalanchowk and Sindhulia nd when questioned further, they said that their husband worked in a different district such as Kathmandu and Lalitpur for more than eight months per year). Households in Saptari often employ livelihood strategies including growing crops, raising animals, and doing small business. They do not have to work away from their house when suffering from drought because there are more employment opportunities than the other two districts, which greatly reduces household vulnerability to climate change. Some respondents in Saptari mentioned that their husbands had left Nepal to work abroad and sent money home every few months, which is conducive to the improvement in living conditions.
Households without water supply facilities need to travel long distances from their house to collect water. Kavrepalanchowk households reported walking 22 min on average for a water source as compared with the other two districts (Sindhuli 8 min and Saptari 7 min). The main sources of drinking water for each district are presented in Table 4. Spring (32.56%) is the main source of drinking water in Kavrepalanchowk and many residents in Kavrepalanchowk mentioned that they did not have a consistent water supply, which greatly increases household vulnerability to drought disasters. Private tap (40.91%) is the main source of drinking water in Sindhuli. It greatly reduces the time needed for water collection. Private tube well is the main source in Saptari. People use hand water pumps to deliver water from wells. Additionally, the common types of irrigation facilities in the three districts include canals, tanks, water pumps, pipes, and tub wells. The percentage of households who have irrigation facilities was the lowest in Kavrepalanchowk (9.85%) as compared with Sindhuli (28.40%) and Saptari (57.50%). An irrigation problem that is difficult to avoid is how to move water from a source to farmland due to the rapid elevation drop from north to south in Kavrepalanchowk and Sindhuli. In addition, many respondents from Saptari mentioned that the water table was falling, and they had to replace hand water pumps with electric pumps.
The three districts had a low income per capita and there was a large income gap between the richest (3077.65 USD) and poorest people (17.05 USD). Many respondents said that private ownership of land is a source of inequality, and it creates an income gap between the haves and the have nots. The government and non-governmental organizations (NGOs) provide assistance to needy residents primarily through financial subsidies, agriculture loans, and technical training. The percentage of households with external support in Kavrepalanchowk (41.86%) was higher than Sindhuli (25.00%) and Saptari (18.60%). The government has promised to help fund the rebuilding of private homes, but many people affected by the earthquake have not received it. The respondents mentioned that most of them would not ask their relatives for help when suffering from natural disasters, and they always made a living by themselves. When questioned further, they explained that some farmers applied for a loan for a living, some young men chose to work away from their house, and some people did small business.

3.3. The Estimation of Overall Drought Vulnerability

Despite the analysis of individual components being helpful, it is important to evaluate the overall drought vulnerability in the three districts by linking the different components (exposure, sensitivity, and adaptive capacity) into a particular measure. Table 3 presents the composite DVI for each district. The results revealed that the drought vulnerability indexes of the three districts ranged from 0.01 to 0.06. Households in Saptari were found to be more vulnerable to drought disasters than Kavrepalanchowk and Sindhuli as measured by the DVI. A comparison of the exposure scores, sensitivity scores, and adaptive capacity scores of each district showed that Kavrepalanchowk belongs to the middle-exposure low-sensitivity middle-adaptive capacity group (MLM group), Sindhuli belongs to the low-exposure low-sensitivity low-adaptive capacity group (LLL group), and Saptari belongs to the high-exposure high-sensitivity high-adaptive capacity group (HHH group). The LLL group can have a low DVI such as Sindhuli, but it is not favorable for the development of agriculture due to the limited adaptive capacity. Strategies including livelihood diversification, accelerated coverage in water supply, and irrigation improvements are the most effective ways to enhance the adaptive capacity and reduce the drought vulnerability. With the exception of Saptari which has the highest adaptive capacity, the most vulnerable districts are those with the high exposure, high sensitivity, and low adaptive capacity (Figure 4). The most vulnerability households are those relying heavily on rainfed agriculture, repeatedly being hit by drought, and having almost no chance to engage in non-agricultural activities; many people do not have enough food to lead a healthy life. Furthermore, these districts are marked by low human capital, the lack of land, and so on. Davies et al. [64] stated that families who are highly dependent on subsistence agriculture suffered from a greater impact of drought disasters and rural needy residents who directly relied on grain output for their livelihoods feel these impacts more keenly.

3.4. The Impact of Drought Vulnerability on Livelihood Strategies

Many farmers in the Koshi River Basin choose the livelihood diversification strategy in the context of climate change. It takes a great deal of time to get a water source for many households in Kavrepalanchowk and most families do not have irrigation facilities, which greatly increases the water pressure on local people. Therefore, most households choose to seek off-farm employment to decrease their drought vulnerability and diversify their sources of income. Sindhuli is not a drought-prone area and families have low drought vulnerability. However, it is not enough to maintain their livelihoods if agriculture is the only source of income due to the scarcity of land in Sindhuli. Many men have to be seasonal out-working labors or do a small business to diversify their sources of income. Most households have high drought vulnerability in Saptari, therefore, they take advantage of the high population density and the convenient transport to engage in off-farm activities. Some households with access to irrigation are less vulnerable to drought disasters than others, and they depend on agriculture for their livelihoods (Figure 5).

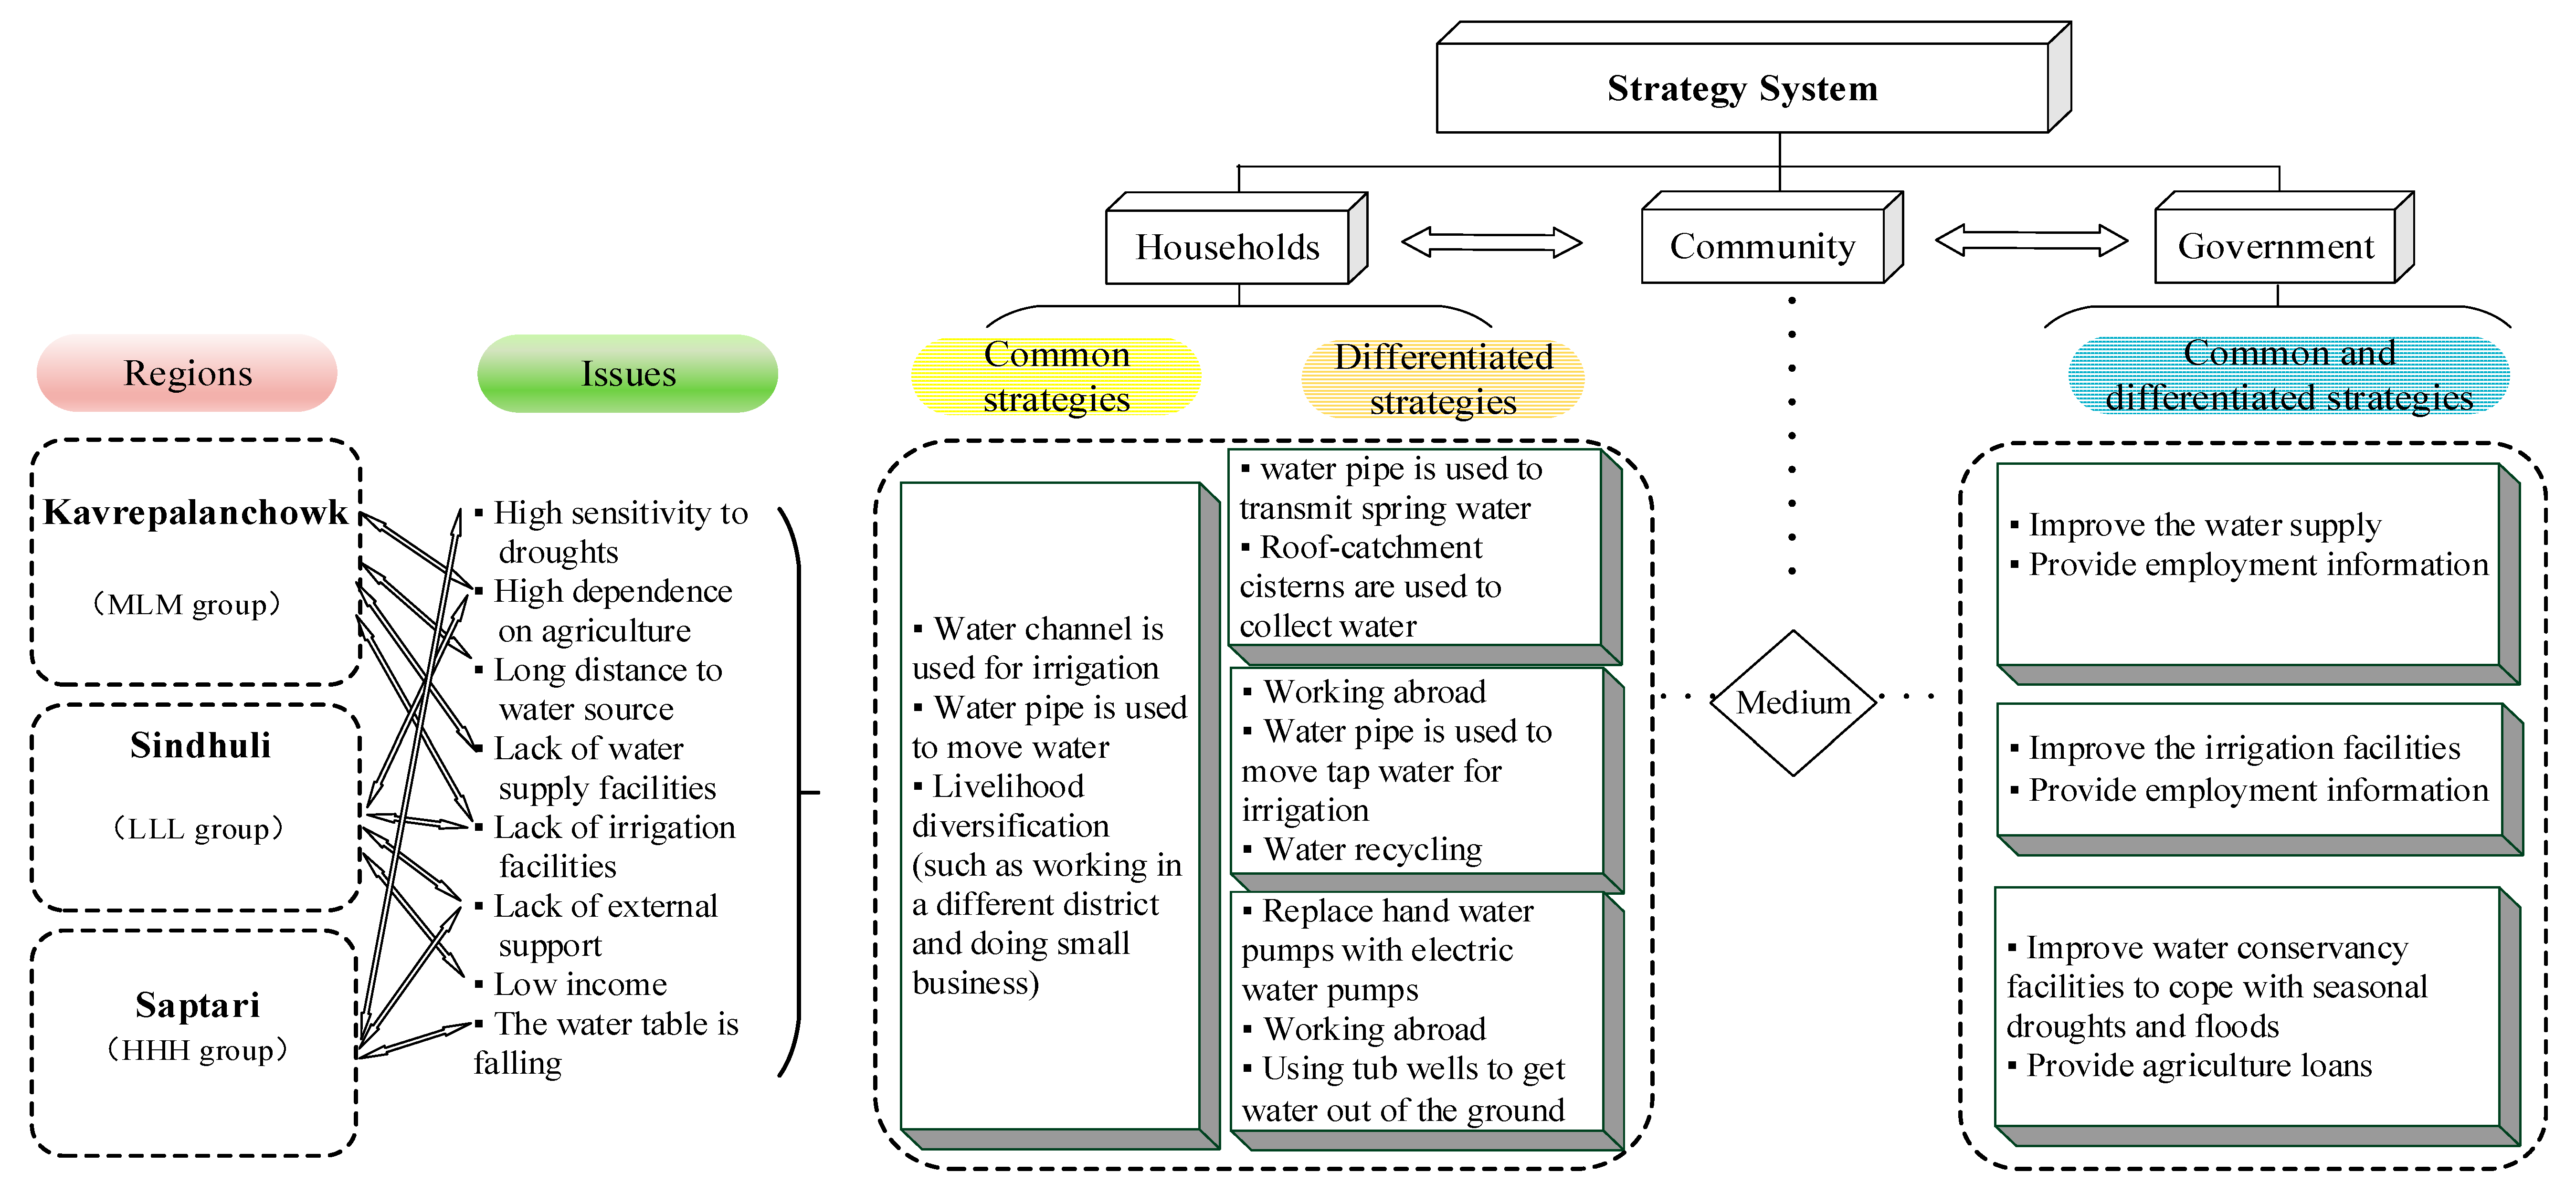
3.5. Adaptation Strategies for Drought Disasters

The high exposure and sensitivity can easily result in livelihood losses such as a decline in grain production and the death of livestock. Households take different strategies to handle drought disasters because the problems families face are different. This paper constructed livelihood adaptation strategies from the perspectives of households, communities, and the government in Kavrepalanchowk, Sindhuli, and Saptari.
As shown in Figure 6, the three districts belong to the MLM group (Kavrepalanchowk), LLL group (Sindhuli), and HHH group (Saptari). There are three main problems in Kavrepalanchowk as follows: (A) Many households depend significantly on agriculture as their main source of income, which increases their vulnerability to climate change; (B) households without water supply facilities need to travel long distances from their house to collect water; and (C) households lack of irrigation facilities. People in Kavrepalanchowk often take livelihood strategies including working in a different district and doing small business to diversify their sources of income. In addition, they employ different types of strategies that help in reducing water pressure. Specifically, water pipes are used to transmit spring water to houses and water channels are used to guide water from rivers to the farmland. In addition, roof-catchment cisterns are important systems which are used to collect rainwater for households. Moreover, the Community Employment Alliance has been built to provide employment information for residents who need non-agricultural jobs and the government needs to improve the water supply. There are four main problems in Sindhuli as follows: (A) Many households depend highly on agriculture as their main source of income; (B) the income is at a low level; (C) households lack of irrigation facilities; and (D) the percentage of households with external support is low. People in Sindhuli often take livelihood strategies including working in a different district, working abroad, and doing small business to increase their income. The water pipe is used to move tap water to the farmland for irrigation, which greatly reduces household vulnerability to drought disasters. Water recycling is also an important drought adaptation strategy, which means reusing wastewater for beneficial purposes such as agricultural irrigation and toilet flushing is an efficient way to save water. In addition, employment information provided by the Community Employment Alliance plays a key role in diversifying residents’ sources of income. People in Saptari have high adaptive capacity, but there are still some challenges such as the high sensitivity to drought disasters and the low percentage of households with external support. The majority of water used for self-supplied domestic and livestock purposes comes from groundwater sources in Saptari and many people use electric water pumps and tub wells to get water out of the ground. The water channel is used to guide water from rivers to the farmland. In addition, agriculture loans provided by the government are vital for residents suffered from drought disasters. To facilitate the allocation of water, the government should improve water conservancy facilities.

4. Discussion

Assessments of socio-ecological vulnerability in Nepal generally lack in meteorological data [65]. But this study overcame the problem by combining meteorological data and farm survey data to assess drought vulnerability. For the empirical evaluation, it is crucial that samples take into account differences in climatic conditions, topography, types of livelihood activities, etc. By using random sampling, the high-quality data collection in this study succeeded in highlighting differences in drought vulnerability of rural households at different elevations. The results showed that Saptari is the most vulnerable district, followed by Kavrepalanchowk and Sindhuli. Low exposure, low sensitivity, and high adaptive capacity can lead to low vulnerability to impacts of drought disasters. Exposure is largely determined by climatic conditions, and it is hard to reduce it artificially. In order to lower sensitivity, reducing agricultural investment (e.g., less people engaged in agriculture, decrease in crop area and the number of livestock) is a direct approach, but it could impede the sustainable development of local agriculture. Therefore, among the three components, improving adaptive capacity is the most effective and common method to reduce vulnerability.
In terms of adaptive capacity, Kavrepalanchowk and Sindhuli are worse than Saptari. This result agrees with the climate change vulnerability assessment of Nepal by different organizations and scholars, such as Mainali and Pricope [25] who reported that adaptive capacity to climate change in the mountain and hill districts was lower than the rest of the Nepal, especially due to the long distance to the nearest city and the shortage of wealth and health infrastructure. Poverty is higher in the mountain and hill areas than the plain areas because of the large proportion of food insecure households that heavily rely on subsistence agriculture, which increases impacts of unpredictable climate change [66]. This could explain why the support from local governments, communities, and NGOs in Kavrepalanchowk and Sindhuli is more than Tarai.
Livelihood diversification is a commonly used strategy for coping with environmental and economic shocks in poverty reduction [67]. The well-endowed households are more likely to get jobs in high return sectors and acquire wealth [68]. It is a positive feedback effect where the asset rich households accumulate wealth which forms the basis for further diversification. However, the poor households often get jobs in low return sectors, which widens inequality between poor and rich households [69,70,71]. It is noteworthy that ethnicity and caste greatly reflect the distribution of both tangible (e.g., land, livestock, and houses) and intangible assets (e.g., background, access to information, and knowledge) and contribute to the pattern of livelihood diversification in Nepal. Thus, historical and socioeconomic dimensions of caste and ethnicity should be taken into account in an in-depth analysis of livelihood dynamics.
Households in Kaverepalanchowk have to take more time to get water as compared with Sindhuli and Saptari, which agrees with the assessment of household access to drinking water by Behera, Rahut, and Sethi [72] who reported that households in the ecologically sensitive mountainous areas have poorer access to secure drinking water than other regions in Nepal. Water scarcity has been a great challenge in the middle mountains of Nepal [73]. Houses with a piped water connection in the hill and Tarai areas are more than houses located in the mountain areas, which greatly saves time to get drinking water for them [72]. However, the households are more likely to get water by using public taps in the mountains. More seriously, some families have to spend more than an hour a day walking to the rivers and carrying water back home due to the scarcity of water supply facilities. Consequently, there is a more urgent need in the mountains to invest in capacity to improve access to drinking water as compared with the hill and Tarai areas. It is worth noting that male labor outmigration makes women the key decision makers of the households, which results in women playing an important role in water collection [74]. The consideration of gender factor in an in-depth study of water use is conducive to achieving the sustainable development goals (SDG) of the United Nations by 2030 [75].
Nepal faces a shortage of irrigation water despite the abundant water resources in the country because of insufficient irrigation infrastructure development [76]. Access to irrigation water is a key factor in meeting the food needs of a rapidly growing population in Nepal [77]. The percentage of households who have irrigation facilities was higher in Saptari as compared with households located in Kavrepalanchowk and Sindhuli. A possible explanation for this result could be that the positive impact of remittances on agricultural productivity is higher in Terai than the hill and mountain areas because households in Terai have better opportunities for investment in the agriculture due to a more favorable topography [78]. Residents use these remittances to increase their access to irrigation water, thereby reducing their sensitivity to climate change. Additionally, previous research has shown that lands with access to one type of irrigation facility have lower value than those with access to more than one type. A variety of irrigation sources and facilities can help increase agricultural productivity [79].

5. Conclusions

Due to the frequency of drought occurrence, diverse topography, agricultural-dominant pattern of production, and low coverage of water supply facilities in the Koshi River Basin, climate change has significant impacts on the livelihoods of rural residents. This study evaluated the drought vulnerability at the household level and identified the most vulnerable group. The results showed that the most vulnerable region was Saptari, followed by Kavrepalanchowk, and Sindhuli was the least vulnerable region. The high vulnerability of Saptari to droughts is not only due to high drought exposure but also to high sensitivity. The high drought intensity and long drought duration of Saptari is linked to high exposure due to the shortage of rainfall. It was concluded that the large percentage of population engaged in agriculture and the area of rainfed agriculture land are the primary determinants of drought vulnerability in Saptari, rather than the adaptive capacity. Given the significant spatial differences in drought vulnerability across the three districts, the government, communities, and households should, therefore, tailor adaptation strategies to local conditions. Specifically, many households in Kavrepalanchowk and Sindhuli depend highly on agriculture as their main source of income. They need to diversify their sources of income. In addition, the shortage of irrigation facilities determines that increasing investment in providing access to water is an important adaptation strategy for coping with future drought. With the exception of Saptari, the most important livelihood adaptation strategy is improving water conservancy facilities to facilitate the allocation of water.

Author Contributions

R.Z. and C.Z conceived and designed the field survey and experiments; R.Z. performed the analysis from the survey data; Y.F., R.Z., N.N., and S.K. contributed in writing the paper and revising following revision; Y.F. supervised R.Z. and C.Z. in the further analysis and assisted in the writing-up of the paper. All authors have read and agreed to the published version of the manuscript.

Funding

This research was funded by the NSFC-ICIMOD Joint Research Project (Grant No. 41661144038). We would also acknowledge the help and support from the International Center for Integrated Mountain Development (ICIMOD).

Conflicts of Interest

The authors declare no conflict of interest.

References

  1. Li, L.; Cao, R.; Wei, K.; Wang, W.; Chen, L. Adapting climate change challenge: A new vulnerability assessment framework from the global perspective. J. Clean. Prod. 2019, 217, 216–224. [Google Scholar] [CrossRef]
  2. de Silva, M.; Kawasaki, A. Socioeconomic Vulnerability to Disaster Risk: A Case Study of Flood and Drought Impact in a Rural Sri Lankan Community. Ecol. Econ. 2018, 152, 131–140. [Google Scholar] [CrossRef]
  3. Dinar, A.; Mendelsohn, R.; Evenson, R.; Parikh, J.; Sanghi, A.; Kumar, K.; McKinsey, J.; Lonergan, S. Measuring the Impact of Climate Change on Indian Agriculture. Bangladesh 1998, 40, 383. [Google Scholar] [CrossRef]
  4. Nicholls, R.J.; Hoozemans, F.; Marchand, M. Increasing flood risk and wetland losses due to global sea-level rise: Regional and global analyses. Glob. Environ. Chang. 1999, 9, 69–87. [Google Scholar] [CrossRef]
  5. Castree, N. The Politics of Climate Change—By Anthony Giddens. Soc. Rev. 2010, 58, 156–162. [Google Scholar] [CrossRef]
  6. Samir, K.C. Community Vulnerability to Floods and Landslides in Nepal. Ecol. Soc. 2013, 18, 8. [Google Scholar] [CrossRef] [Green Version]
  7. Eriyagama, N.; Smakhtin, V.; Gamage, N. Mapping Drought Patterns and Impacts: A Global Perspective; IWMI Research Report; International Water Management Institute: Colombo, Sri Lanka, 2009. [Google Scholar]
  8. Lybbert, T.J.; Carter, M.R. Chapter 22—Bundling Drought Tolerance and Index Insurance to Reduce Rural Household Vulnerability to Drought; Sustainable Economic Development; Elsevier Inc.: Amsterdam, The Netherlands, 2015; pp. 401–414. [Google Scholar]
  9. Boano, D.C.; Zetter, R.; Morris, D.T. Environmentally displaced people: Understanding the linkages between environmental change, livelihoods and forced migration. Refug. Stud. Cent. 2008, 19, 60–64. [Google Scholar]
  10. Mohmmed, A.; Li, J.; Elaru, J.; Elbashier, M.M.; Keesstra, S.; Artemi, C.; Martin, K.; Reuben, M.; Teffera, Z.L. Assessing drought vulnerability and adaptation among farmers in Gadaref region, Eastern Sudan. Land Use Policy 2018, 70, 402–413. [Google Scholar] [CrossRef] [Green Version]
  11. Gain, A.K.; Giupponi, C.; Renaud, F.G. Climate Change Adaptation and Vulnerability Assessment of Water Resources Systems in Developing Countries: A Generalized Framework and a Feasibility Study in Bangladesh. Water 2012, 4, 345–366. [Google Scholar] [CrossRef] [Green Version]
  12. Smit, B.; Wandel, J. Adaptation, adaptive capacity, and vulnerability. Glob. Environ. Chang. 2006, 16, 282–292. [Google Scholar] [CrossRef]
  13. Jackson, S.T.; Betancourt, J.L.; Booth, R.K.; Gray, S.T. Ecology, and the ratchet of events: Climate variability, niche dimensions, and species distributions. Proc. Natl. Acad. Sci. USA 2009, 106, 19685–19692. [Google Scholar] [CrossRef] [PubMed] [Green Version]
  14. Pandey, R.; Jha, S.K.; Alatalo, J.M.; Archie, K.M.; Gupta, A.K. Sustainable livelihood framework-based indicators for assessing climate change vulnerability and adaptation for Himalayan communities. Ecol. Indic. 2017, 79, 338–346. [Google Scholar] [CrossRef]
  15. Reed, M.S.; Podestá, G.; Fazey, I.; Geeson, N.; Hessel, R.; Hubacek, K.; Letson, D.; Nainggolan, D.; Prell, C.; Rickenbach, M.; et al. Combining analytical frameworks to assess livelihood vulnerability to climate change and analyse adaptation options. Ecol. Econ. 2013, 94, 66–77. [Google Scholar] [CrossRef] [Green Version]
  16. Paavola, J. Livelihoods, vulnerability, and adaptation to climate change in Morogoro, Tanzania. Environ. Sci. Policy 2008, 11, 642–654. [Google Scholar] [CrossRef]
  17. Wang, B.; Feng, P.; Liu, D.L.; Waters, C. Modelling biophysical vulnerability of wheat to future climate change: A case study in the eastern Australian wheat belt. Ecol. Indic. 2020, 114. [Google Scholar] [CrossRef]
  18. Hursh, A.; Ballantyne, A.; Cooper, L.; Maneta, M.; Kimball, J.; Watts, J. The sensitivity of soil respiration to soil temperature, moisture, and carbon supply at the global scale. Glob. Chang. Boil. 2016, 23, 2090–2103. [Google Scholar] [CrossRef]
  19. Kim, B.-T.; Brown, C.L.; Kim, D.-H. Assessment on the vulnerability of Korean aquaculture to climate change. Mar. Policy 2019, 99, 111–122. [Google Scholar] [CrossRef]
  20. Scott, D.; Hall, C.M.; Gössling, S. Global tourism vulnerability to climate change. Ann. Tour. Res. 2019, 77, 49–61. [Google Scholar] [CrossRef]
  21. Dewan, T.H. Societal impacts, and vulnerability to floods in Bangladesh and Nepal. Weather Clim. Extrem. 2015, 7, 36–42. [Google Scholar] [CrossRef] [Green Version]
  22. Nagoda, S.; Nightingale, A.J. Participation and Power in Climate Change Adaptation Policies: Vulnerability in Food Security Programs in Nepal. World Dev. 2017, 100, 85–93. [Google Scholar] [CrossRef]
  23. Baffoe, G.; Matsuda, H. An Empirical Assessment of Households Livelihood Vulnerability: The Case of Rural Ghana. Soc. Indic. Res. 2017, 140, 1225–1257. [Google Scholar] [CrossRef]
  24. Sullivan, C.; Meigh, J. Targeting attention on local vulnerabilities using an integrated index approach: The example of the climate vulnerability index. Water Sci. Technol. 2005, 51, 69–78. [Google Scholar] [CrossRef]
  25. Mainali, J.; Pricope, N.G. High-resolution spatial assessment of population vulnerability to climate change in Nepal. Appl. Geogr. 2017, 82, 66–82. [Google Scholar] [CrossRef]
  26. Project HVI. Available online: http://dialogue2011.fanrpan.org/sites/default/files/publications/Project-HVI_September2011.pdf (accessed on 9 May 2020).
  27. Pham, N.T.T.; Nong, D.; Sathyan, A.R.; Garschagen, M. Vulnerability assessment of households to flash floods and landslides in the poor upland regions of Vietnam. Clim. Risk Manag. 2020, 28, 100215. [Google Scholar] [CrossRef]
  28. Martin, R.; Linstädter, A.; Frank, K.; Müller, B. Livelihood security in face of droughtpAssessing the vulnerability of pastoral households. Environ. Model. Softw. 2016, 75, 414–423. [Google Scholar] [CrossRef]
  29. Aryal, K. Disaster vulnerability in Nepal. Int. J. Disaster Risk Reduct. 2014, 9, 137–146. [Google Scholar] [CrossRef]
  30. Sellmyer, A.; Vasily, L.; Thomas, S. Annual Report 2018; International Centre for Integrated Mountain Development (ICIMOD): Kathmandu, Nepal, 2018. [Google Scholar]
  31. United Nations Development Programme (UNDP). Reducing Disaster Risk—A Challenge for Development; United Nations Development Programme: New York, NY, USA, 2004. [Google Scholar]
  32. Yohe, G.; Tol, R.S. Indicators for social and economic coping capacity—Moving toward a working definition of adaptive capacity. Glob. Environ. Chang. 2002, 12, 25–40. [Google Scholar] [CrossRef]
  33. Shewmake, S. Vulnerability and the Impact of Climate Change in South Africa’s Limpopo River Basin; International Food Policy Research Institute Discussion: Washington, DC, USA, 2008. [Google Scholar]
  34. Khadka, C.; Aryal, K.P.; Edwards-Jonášová, M.; Upadhyaya, A.; Dhungana, N.; Cudlin, P.; Vacik, H. Evaluating participatory techniques for adaptation to climate change: Nepal case study. For. Policy Econ. 2018, 97, 73–82. [Google Scholar] [CrossRef]
  35. Nie, Y. Land cover changes in Mt. Qomolangma region. Ph.D. Thesis, University of Chinese Academy of Sciences, Beijing, China, 2010. [Google Scholar]
  36. Gupta, A.K.; Negi, M.; Nandy, S.; Alatalo, J.M.; Singh, V.; Pandey, R. Assessing the vulnerability of socio-environmental systems to climate change along an altitude gradient in the Indian Himalayas. Ecol. Indic. 2019, 106, 105512. [Google Scholar] [CrossRef]
  37. Yatagai, A.; Kamiguchi, K.; Arakawa, O.; Hamada, A.; Yasutomi, N.; Kitoh, A. Aphrodite: Constructing a Long-Term Daily Gridded Precipitation Dataset for Asia Based on a Dense Network of Rain Gauges. Bull. Am. Meteorol. Soc. 2012, 93, 1401–1415. [Google Scholar] [CrossRef]
  38. Winter Drought Worsens Food Insecurity in Nepal. Available online: https://www.wfp.org/news/news-release/winter-drought-worsens-food-insecurity-nepal (accessed on 14 January 2020).
  39. International Centre for Integrated Mountain Development (ICIMOD). Available online: https://www.icimod.org/ (accessed on 21 February 2020).
  40. Statistical Yearbook Nepal; Nepal Central Bureau of Statistics: Kathmandu, Nepal, 2016; ISBN 9789937-0-1707-7.
  41. Religions in Nepal. Available online: https://www.imnepal.com/major-religions-in-nepal-hindu-buddhism-muslim/ (accessed on 21 February 2020).
  42. EMP. Available online: https://guides.libraries.psu.edu/emp (accessed on 21 April 2020).
  43. QuestionPro. Available online: https://www.questionpro.com/blog/empirical-research/ (accessed on 21 April 2020).
  44. Hahn, M.B.; Riederer, A.M.; Foster, S.O. The Livelihood Vulnerability Index: A pragmatic approach to assessing risks from climate variability and change—A case study in Mozambique. Glob. Environ. Chang. 2009, 19, 74–88. [Google Scholar] [CrossRef]
  45. World Health Organization (WHO). Immunization Coverage Cluster Survey—Reference Manual; WHO Document Production Services: Geneva, Switzerland, 2005. [Google Scholar]
  46. Gbetibouo, G.A.; Ringler, C. Mapping South African Farming Sector Vulnerability to Climate Change and Variability: A Subnational Assessment; The International Food Policy Research Institute: Amsterdam, Netherlands, 2009; pp. 175–187. [Google Scholar]
  47. Wang, L.; Xiong, W.; Wen, X.; Feng, L. Effect of climatic factors such as temperature, precipitation on maize production in china. Trans. Chin. Soc. Agric. Eng. 2014, 30, 138–146. [Google Scholar]
  48. Esperon-Rodriguez, M.; Bonifacio-Bautista, M.; Barradas, V.L. Socio-economic vulnerability to climate change in the central mountainous region of eastern Mexico. Ambio 2015, 45, 146–160. [Google Scholar] [CrossRef] [Green Version]
  49. Perch-Nielsen, S.L. The vulnerability of beach tourism to climate change—An index approach. Clim. Chang. 2009, 100, 579–606. [Google Scholar] [CrossRef]
  50. Keshavarz, M.; Maleksaeidi, H.; Karami, E. Livelihood vulnerability to drought: A case of rural Iran. Int. J. Disaster Risk Reduct. 2017, 21, 223–230. [Google Scholar] [CrossRef]
  51. Alam, G.M.; Alam, K.; Mushtaq, S.; Clarke, M.L. Vulnerability to climatic change in riparian char and river-bank households in Bangladesh: Implication for policy, livelihoods, and social development. Ecol. Indic. 2017, 72, 23–32. [Google Scholar] [CrossRef]
  52. Ncube, A.; Mangwaya, P.T.; Ogundeji, A.A. Assessing vulnerability and coping capacities of rural women to drought: A case study of Zvishavane district, Zimbabwe. Int. J. Disaster Risk Reduct. 2018, 28, 69–79. [Google Scholar] [CrossRef]
  53. Dendir, Z.; Simane, B. Livelihood vulnerability to climate variability and change in different agroecological zones of Gurage Administrative Zone, Ethiopia. Prog. Disaster Sci. 2019, 3, 100035. [Google Scholar] [CrossRef]
  54. Huang, X.; Huang, X.; He, Y.; Yang, X. Assessment of livelihood vulnerability of land-lost farmers in urban fringes: A case study of Xi’an, China. Habitat Int. 2017, 59, 1–9. [Google Scholar] [CrossRef]
  55. Sullivan, C.; Meigh, J.; Fediw, T. Derivation and Testing of the Water Poverty Index Phase 1; Final report May 2002; Centre for Ecology & Hydrology: London, UK, 2002. [Google Scholar]
  56. He, R.; Yang, Z.; Li, X.; Li, Z.; Liu, Z.; Chen, F. A comprehensive approach for fracability evaluation in naturally fractured sandstone reservoirs based on analytical hierarchy process method. Energy Sci. Eng. 2019, 7, 529–545. [Google Scholar] [CrossRef]
  57. International Rice Research Institute (IRRI). Vulnerability to Climate Variability and Drought among Small and Marginal Farmers: A Case Study in Odisha, India; Climate and Development; International Rice Research Institute (IRRI): Los Banos, Philippines, 2016. [Google Scholar]
  58. Jamir, C.; Sharma, N.; Sengupta, A.; Ravindranath, N.H. Farmers’ vulnerability to climate variability in Dimapur district of Nagaland, India. Reg. Environ. Chang. 2012, 13, 153–164. [Google Scholar] [CrossRef]
  59. Hoque, M.A.-A.; Pradhan, B.; Ahmed, N. Assessing drought vulnerability using geospatial techniques in northwestern part of Bangladesh. Sci. Total. Environ. 2020, 705, 135957. [Google Scholar] [CrossRef]
  60. Ahmadalipour, A.; Moradkhani, H. Multi-dimensional assessment of drought vulnerability in Africa: 1960–2100. Sci. Total. Environ. 2018, 644, 520–535. [Google Scholar] [CrossRef] [PubMed]
  61. Christina, G. Broadening understandings of drought—The climate vulnerability of farmworkers and rural communities in California (USA). Environ. Sci. Policy 2018, 89, 283–291. [Google Scholar]
  62. Li, J.R. Method, and advances of drought monitoring by remote sensing. J. China Hydrol. 2001, 21, 15–17. [Google Scholar]
  63. Fields, S. Continental Divide: Why Africa’s Climate Change Burden Is Greater. Environ. Heal. Perspect. 2005, 113, 534–537. [Google Scholar] [CrossRef]
  64. Davies, M.; Guenther, B.; Leavy, J.; Mitchell, T.; Tanner, T. Climate Change Adaptation, Disaster Risk Reduction and Social Protection: Complementary Roles in Agriculture and Rural Growth? IDS Work. Pap. 2009, 1–37. [Google Scholar] [CrossRef]
  65. Pandey, R.; Bardsley, D.K. Social-ecological vulnerability to climate change in the Nepali Himalaya. Appl. Geogr. 2015, 64, 74–86. [Google Scholar] [CrossRef] [Green Version]
  66. Hunzai, K.; Gerlitz, J.Y.; Hoermann, B. Understanding mountain poverty in the Hindu Kush-Himalayas: Regional report for Afghanistan, Bangladesh, Bhutan, China, India, Myanmar, Nepal, and Pakistan. Can. J. Dev. Stud. 2011, 33, 250–265. [Google Scholar]
  67. Gautam, Y.; Andersen, P. Rural livelihood diversification and household well-being: Insights from Humla, Nepal. J. Rural. Stud. 2016, 44, 239–249. [Google Scholar] [CrossRef] [Green Version]
  68. Woldenhanna, T.; Oskam, A. Income diversification and entry barriers: Evidence from the Tigray region of northern Ethiopia. Food Policy 2001, 26, 351–365. [Google Scholar] [CrossRef]
  69. Reardon, T.; Taylor, J.E.; Stamoulis, K.; Lanjouw, P.; Balisacan, A. Effects of Nonarm Employment on Rural Income Inequality in Developing Countries: An Investment Perspective. J. Agr. Econ. 2000, 51. [Google Scholar]
  70. Barrett, C.B.; Reardon, T.; Webb, P. Nonfarm income diversification and household livelihood strategies in rural Africa: Concepts, dynamics, and policy implications. Food Policy 2001, 26, 315–331. [Google Scholar] [CrossRef]
  71. Canagarajah, S.; Newman, C.; Bhattamishra, R. Non-farm income, gender, and inequality: Evidence from rural Ghana and Uganda. Food Policy 2001, 26, 405–420. [Google Scholar] [CrossRef]
  72. Behera, B.; Rahut, D.B.; Sethi, N. Analysis of household access to drinking water, sanitation, and waste disposal services in urban areas of Nepal. Util. Policy 2020, 62, 100996. [Google Scholar] [CrossRef]
  73. Merz, J.; Nakarmi, G.; Shrestha, S.K.; Dahal, B.M.; Dangol, P.M.; Dhakal, M.P.; Dongol, B.S.; Sharma, S.; Shah, P.B.; Weingärtner, R. Water: A Scarce Resource in Rural Watersheds of Nepal’s Middle Mountains. Mt. Res. Dev. 2003, 23, 41–49. [Google Scholar] [CrossRef]
  74. Paudel, G.P.; Gartaula, H.; Rahut, D.B.; Craufurd, P. Gender differentiated small-scale farm mechanization in Nepal hills: An application of exogenous switching treatment regression. Technol. Soc. 2020, 61, 101250. [Google Scholar] [CrossRef]
  75. Sustainable Development Goal 5: Gender Equality. Available online: https://sustainabledevelopment.un.org/sdg5 (accessed on 9 May 2020).
  76. Cook, J.; Freeman, S.; Hill, M. Shifting Course: Climate Adaptation for Water Management Institutions; WWF-US: Gland, Switzerland, 2010. [Google Scholar]
  77. von Westarp, S.; Chieng, S.; Schreier, H. A comparison between low-cost drip irrigation, conventional drip irrigation, and hand watering in Nepal. Agric. Water Manag. 2004, 64, 143–160. [Google Scholar] [CrossRef]
  78. Kapri, K.; Shankar, G. Migration, remittance, and agricultural productivity: Evidence from the Nepal Living Standard Survey. World Dev. Perspect. 2020, 100198. [Google Scholar] [CrossRef]
  79. Mukherjee, M.; Schwabe, K. Irrigated Agricultural Adaptation to Water and Climate Variability: The Economic Value of a Water Portfolio. Am. J. Agric. Econ. 2014, 97, 809–832. [Google Scholar] [CrossRef] [Green Version]
Figure 1. Geographical location of the study area.
Water 12 01610 g001
Figure 2. Monthly distribution of precipitation in the Koshi River Basin.
Water 12 01610 g002
Figure 3. The distribution of precipitation during the pre-monsoon, monsoon, post-monsoon, and winter season for 1901–2015 in the Koshi River Basin.
Water 12 01610 g003
Figure 4. The radar map of exposure, sensitivity, and adaptive capacity index.
Water 12 01610 g004
Figure 5. The distribution of the samples of rural households with different types of livelihood strategies in Kavrepalanchowk, Sindhuli, and Saptari districts.
Water 12 01610 g005
Figure 6. The strategy system for adaptation to drought from the perspectives of households, communites, and government.
Water 12 01610 g006
Table 1. Topographic characteristics of sample districts.
Agroecological ZonesSample DistrictsAltitude/mNumber of Questionnaires
Middle MountainKavrepalanchowk86743
SiwalikSindhuli41444
TaraiSaptari7643
Table 2. Primary variables used in vulnerability assessments.
Major ComponentSub-ComponentThe Type of DataSurvey QuestionExplanation and MeasuresThe Correlation of the Indicator to the Corresponding Major ComponentSource
Exposure(E1) Drought intensitySecondary dataThe crop water stress index was used to describe the drought intensity+[49]
(E2) Drought duration/monthsSecondary dataDrought disasters lasted for different periods of time in different regions+[50]
(E3) Drought frequency/numberSecondary dataNumber of occurrences of drought disasters during spring season from 1985 to 2014+[50]
Sensitivity(S1) Percentage of population who engaged in agriculture/%Primary dataHow many people are there in your family?
What’s everyone’s occupation in your family?
+[51]
(S2) The area of rainfed agriculture land per household/haPrimary dataWhat is the area of rainfed agriculture land in your family?The more rainfed agriculture land, the more sensitivity to drought disaster+[10]
(S3) Number of Livestock per householdPrimary dataHow many livestock are there in your family?
(Including cow, buff, goat, sheep and pig)
+[52]
Adaptive capacity(A1) Annual household income per capita/USDPrimary dataWhat is the annual income of each person in your family?+[10]
(A2) Average livelihood diversification indexPrimary dataWhat’s everyone’s occupation in your family?The livelihood diversity index means how many types of occupations in a family. The larger livelihood index, the stronger capacity adjusts to drought disaster.+[2]
(A3) Average time to get water/minutesPrimary dataHow long will it take your family to walk to get water?-[53]
(A4) Percentage of households with irrigation facility/%Primary dataWhere does irrigation water come from?A. rain B. river C. tap D. borehole E. dam F. well G. others
According to the respondents’ answers, we divided the households into the following two groups: households with irrigation facility and households without irrigation facility. Then, we assigned a value of 1 to the former and assigned a value of 0 to the latter.
+[10]
(A5) Level of external supportPrimary dataDid the government give you any help during a drought?
Did Non-Governmental Organizations give you any help during a drought?
Did any of your relatives help you during a drought
We want to quantify the help of the government, non-governmental organizations, or relative during a drought. If the household received one (two, three) type(s) of external help, we assigned a value of 1(2,3).+[51,53,54]
“+” means the indicators with a positive correlation with the major components, and “−” means the indicators with a negative correlation with the major components.
Table 3. Indexed subcomponents, major components, and overall drought vulnerability index (DVI) for Kavrepalanchowk, Sindhuli, and Saptari districts.
SubcomponentKavrepalanchowkSindhuliSaptariMajor ComponentKavrepalanchowkSindhuliSaptari
E10.0000.7501.000E0.4130.3410.700
E20.3800.0001.000
E31.0000.1400.000
S10.3330.3560.354S0.1540.1530.192
S20.0400.0130.090
S30.0220.0260.071
A10.1590.1320.172A0.3190.2950.422
A20.1280.1880.343
A30.7590.9130.923
A40.2790.3410.581
A50.4190.2500.186
Overall DVI
DVI Kavrepalanchowk0.014
DVI Sindhuli0.007
DVI Saptari0.053
Table 4. The main sources of drinking water in Kavrepalanchowk, Sindhuli, and Saptari districts.
The Main Sources of Drinking WaterKavrepalanchowkSindhuliSaptari
Public Taps (%)30.2311.3639.53
Private Taps (%)18.6040.914.65
Public Tube Wells (%)9.309.0911.63
Private Tube Wells (%)9.3011.3641.86
Spring (%)32.5627.272.33

