Article

Quantification and Characterization of Antimicrobial Resistance in Greywater Discharged to the Environment

1
Department of Environmental Hydrology and Microbiology, Zuckerberg Institute for Water Research, Ben-Gurion University of the Negev, Midreshet Ben Gurion 84990, Israel
2
MAGICAL Group, Department of Health Systems Management, School of Public Health, Faculty of Health Sciences, Ben-Gurion University of the Negev, Beer-Sheva 84105, Israel
3
Clinical Microbiology Laboratory, Soroka University Medical Center, Beer-Sheva 84105, Israel
4
South District Health Office, Ministry of Health, Beer-Sheva 84105, Israel
5
Department of Health Systems Management, School of Public Health, Faculty of Health Sciences, Ben-Gurion University of the Negev, Beer-Sheva 84105, Israel
*
Author to whom correspondence should be addressed.
Water 2020, 12(5), 1460; https://doi.org/10.3390/w12051460
Submission received: 22 April 2020 / Revised: 12 May 2020 / Accepted: 18 May 2020 / Published: 20 May 2020
(This article belongs to the Special Issue The Use of Greywater and Wastewater for Irrigation)

Abstract

:
In disenfranchised communities, untreated greywater (wastewater without sewage) is often environmentally discharged, resulting in potential human exposure to antimicrobial-resistant bacteria (ARB), including extended-spectrum beta-lactamase (ESBL) producers. We sought to examine the abundance of ARB, specifically ESBLs, and antimicrobial resistance genes (ARGs) in greywater from off-grid, pastoral Bedouin villages in Southern Israel. Greywater samples (n = 21) collected from five villages were analyzed to enumerate fecal coliforms and Escherichia coli. ESBL producers were recovered on CHROMagar ESBL and confirmed by VITEK®2 (bioMerieux, Marcy l’Etoile, France) for identification and antimicrobial susceptibility testing. Total genomic DNA was extracted from greywater samples and quantitative PCR (qPCR) was used to determine relative abundance (gene copies/16S rRNA gene) of class 1 integron-integrase intI1, blaTEM, blaCTX-M-32, sul1, and qnrS. The mean count of presumptive ESBL-producing isolates was 4.5 × 10⁶ CFU/100 mL. Of 81 presumptive isolates, 15 ESBL producers were recovered. Phenotypically, 86.7% of ESBL producers were multi-drug resistant. Results from qPCR revealed a high abundance of intI1 (1.4 × 10⁻¹ gene copies/16S rRNA), sul1 (5.2 × 10⁻² gene copies/16S rRNA), and qnrS (1.7 × 10⁻² gene copies/16S rRNA) followed by blaTEM (3.5 × 10⁻³ gene copies/16S rRNA) and blaCTX-M-32 (2.2 × 10⁻⁵ gene copies/16S rRNA). Results from our study indicate that greywater can be a source of ARB, including ESBL producers, in settings characterized by low sanitary conditions and inadequate wastewater management.

1. Introduction

Increase in levels of antimicrobial-resistant bacteria (ARB) [1] and antimicrobial resistance genes (ARGs) in the environment due to the discharge of wastewater is a recent human health concern. Untreated greywater (GW, wastewater from all household sources other than sewage) is known to harbor pathogens including but not limited to Klebsiella pneumoniae, Pseudomonas aeruginosa, and Legionella sp. [2,3,4]. Occurrence of both pathogenic bacteria and antimicrobials in household GW has been identified as a potential factor responsible for proliferation of resistant bacteria [5,6,7]. Furthermore, factors such as crowding, poor sanitation, and antimicrobial misuse are known drivers of antimicrobial resistance (AMR) among low socioeconomic status populations [8]. Despite these known concerns, the risks of potential human exposure to AMR in the case of disenfranchised communities where domestic GW is often environmentally discharged without treatment is understudied.
In Israel, the Bedouin are an indigenous ethnic group of low socioeconomic status (Israel Central Bureau of Statistics, 2010). Unrecognized Bedouin villages (as per their legal status defined by the State of Israel) are frequently not connected to centralized sewage and waste removal systems [9], and black water (wastewater containing sewage) is discharged to cesspits while domestic GW is discharged to the environment with little to no treatment. Additionally, GW is frequently reused for irrigation without treatment [10]. These practices could be drivers behind the observed spread of AMR within this population and pose a significant threat to the human communities, animals, and the environment. Antimicrobial resistance in respiratory, gastrointestinal, and pneumococcal infections have been reported among the Bedouin pediatric population [11,12]. Higher prevalence of methicillin-resistant Staphylococcus aureus (MRSA) nasal carriage in healthy Bedouin infants has also been reported [13]. Currently there is an overall increase in resistance patterns of hospitalized community-acquired urinary tract infections in the residents of the southern region of Israel according to a study by Elnasasra et al. [14]. Moreover, this study, which identified antimicrobial resistance patterns of urinary tract infections, has reported an increased prevalence of community acquired extended-spectrum beta-lactamase (ESBL)-producing pathogens in recent years (4.5% in 2000 to 25.5% in 2017) in the Bedouin population from the Negev regions. This study also reported that the majority of Enterobacteriaceae pathogens strains identified were E. coli (70%) and Klebsiella (13%). In this context, the prevalence and spread of AMR through discharge of untreated GW in Bedouin communities, in particular, ESBL-producing Enterobacterales, is an important yet neglected aspect of health and environment risk assessment.
Data regarding AMR in GW is limited and somewhat contradictory. One Israeli study found that irrigation of soil with treated GW did not affect the antimicrobial resistance levels in the soil microbiome [15], however a recent study carried out in Israel by Troiano et al. (2018) observed ARB, specifically tetracycline-resistant and multidrug-resistant (MDR) bacteria, in treated GW [16]. There is a dearth of studies assessing ARB and ARGs in untreated GW, as well as a lack of understanding of resistance patterns of pathogens associated with untreated GW. To our knowledge, this is one the first studies that has specifically targeted assessment of domestic untreated GW for detection of ARB and quantification of clinically relevant ARGs and potential mobile genetic elements (MGEs). The objective of this study is to investigate the prevalence of ARB and ARGs in domestic untreated GW and examine its role in the spread of AMR. We present here results of identification and characterization of ARB from GW samples collected from different Bedouin community villages in the Negev region of Israel. In addition, we present results of qPCR-based quantification of clinically relevant ARGs in order to assess the load of contaminating ARGs in domestic GW samples.

2. Material and Methods

2.1. Study Setting and Sample Collection

GW samples were collected from 21 households in five different Bedouin villages in the southern region of Israel. Villages were defined as either recognized or unrecognized based on their legal status according to the State of Israel. Two recognized villages of Qasir al-Sir and Um Batin (populations 1574 and 3274, respectively), and three unrecognized villages Wadi al-Na’am, Al-Fura, and Tel Arad (populations 13,000, 5000, and 1700, respectively) [10] were selected for collecting the samples. These villages differ in the level of development, population sizes, and their proximity to a health clinic. The rationale for selection was based on the absence of basic infrastructure for wastewater and sewage management, village accessibility, and cooperation of villagers. [10]. The rational for studying AMR in these villages was based on factors such as poor sanitation; close-knit and densely-populated community dwellings; lack of proper wastewater management; direct disposal of GW into the surrounding environment; and the presence of livestock in proximity to the human dwellings. Such factors are the major drivers for the spread and dissemination of AMR in a given area. Samples were collected between March and November 2018 and included effluents from kitchen sinks, laundry machines, showers, and wash basins (Table S1). Samples from a minimum of four households in each village were collected and transported to the laboratory on ice within 4 h and physiochemical tests and plating for bacterial counts were carried out on the same day.

2.2. Physiochemical Parameters

Physiochemical and microbiological analysis for all GW samples (n = 21) was conducted on the same day of collection. In situ measurement of electrical conductivity [17] and pH was carried out using a CyberScan510 pH meter (Eutech Instruments, Thermo, Waltham, MA, USA). Total organic carbon (TOC) and total nitrogen (TN) were measured using a Multi N/C® 2100S analyzer (Analytik Jena AG, Jena, Germany). Total suspended solids (TSS) and five-day biological oxygen demand (BOD5) were determined according to standard analytical methods for the examination of water and wastewater [18,19].

2.3. Cultivation and Identification of Antimicrobial-Resistant Bacteria

Enumeration of total fecal coliforms (n = 21), total E. coli (n = 18), and ESBL producers (n = 18) from untreated GW samples were carried out within 4 h of sample collection. GW samples were 10-fold serially diluted in 9 ml of sterilized 0.01 M phosphate buffered saline (PBS) (pH 7.4) and 0.1 mL was plated on HiCrome™ E. coli Agar (Himedia Lab, Mumbai, India) and CHROMagar™ ESBL plates (Hylabs®, Rehovot, Israel) to enumerate the total E. coli along with other fecal coliform counts and ESBL producing bacteria, respectively [20]. The HiCrome™ E. coli agar plates (Himedia Lab, Mumbai, India) were incubated at 44 °C for 24 h, blue colonies were counted as presumptive as E. coli while cream-colored colonies were counted as presumptive fecal (or thermotolerant) coliforms. CHROMagar™ ESBL plates were incubated at 37 °C for 20 h. The targeted bacterial pre-selection was carried out following manufacturer’s instructions for ESBL media color coding: dark pink colonies indicated presumptive E. coli; metallic blue with or without reddish halo indicated presumptive Klebsiella sp., Enterobacter sp., or Citrobacter sp.; a brown halo indicated presumptive Proteus sp.; cream colonies indicated presumptive Acinetobacter sp.; and translucent cream or green indicated presumptive Pseudomonas sp.

2.4. Characterization and Antimicrobial Susceptibility Testing of ARB

The bacterial isolates were identified using matrix-assisted laser desorption/ionization time of flight mass spectrometry (MALDI-TOF-MS) using Vitek MS (bioMerieux, Marcy l’Etoile, France) [21] and antimicrobial susceptibility testing (AST) was carried out on all the isolates using the VITEK 2 system (bioMerieux, Marcy l’Etoile, France) using AST-N270 and AST-N308 cards for measuring minimum inhibitory concentrations (MICs) of Gram-negative fermenting and non-fermenting isolates. The antimicrobials used for Gram-negative fermenters were: amikacin, amoxicillin/clavulanic acid, ampicillin, cefuroxime, ceftazidime ceftriaxone, cefoxitin cephalexin, ciprofloxacin, ertapenem, fosfomycin, gentamicin, meropenem, nitrofurantoin, trimethoprim/sulfamethoxazole, and those for Gram-negative non-fermenters were: amikacin, ceftazidime, ciprofloxacin, gentamicin, imipenem, levofloxacin, meropenem, piperacillin/tazobactam, piperacillin, and tobramycin. MICs were interpreted according to Clinical and Laboratory Standards Institute standards 2019 [22] and species-specific corrections with particular antimicrobials were made using VITEK 2 Advanced Expert Systems (AES). E. coli ATCC 25,922 and 35,218 was used for quality control [23,24]. Isolates were further classified based on definitions mentioned in [1] as non-multidrug-resistant (non-MDR), multidrug-resistant (MDR), extensively drug-resistant (XDR), or pan drug-resistant (PDR).

2.5. DNA Extraction from Untreated GW

Raw GW samples (500 mL) were centrifuged at 8000 rpm for 10 min, and the resulting sludge pellet was used for total DNA extraction using a DNeasy® PowerMax Soil Kit (QIAGEN®, Carlsbad, CA, USA) following manufacturer’s instructions with minor modification; to facilitate complete lysis of bacterial cell wall samples were incubated in a water bath at 70 °C for 30 min with intermittent vortexing. Final DNA was eluted in 25 μL of elution buffer (provided in kit). DNA concentrations and purity were determined using a Nanodrop 1000 spectrophotometer (Thermo™, Waltham, MA, USA). DNA was stored at −20 °C.

2.6. Quantification of ARGs by Quantitative PCR (qPCR)

Details of specific primers and PCR conditions used for the quantification of class 1 integron integrase (intI1), the 16S rRNA gene, and the following ARGs targeting different classes of antimicrobials, including β-lactams (blaCTX-M-32 and blaTEM), sulphonamides (sul1), and quinolones (qnrS), are shown in Supplementary Table S2 [25]. Total genomic DNA directly extracted from GW was used for qPCR assays. The samples were run in three technical replicates within the same run with a calibration curve and a no template control (NTC). Quantitative PCR was carried out in a Rotor Gene TM 6000 Thermocycler (Corbett life science, NSW, Australia). The reaction mixture consisted of 10 µL of SYBR green (KAPA SYBR® FAST Universal kit, KAPA Biosystems, Woburn, MA, USA) master mix, 0.5 µL each of forward and reverse gene specific primers (stock concentration 10 µM), 7 µL of nuclease-free water and 2 µL of diluted template DNA (5 ng/µL.) Thermocycling was performed under the following conditions: 95 °C for 5 min for initial activation of the DNA polymerase followed by 40 cycles of 95 °C for 20 s; 60 °C for 30 s for primer annealing and elongation. A melting curve analysis was applied to all reactions to demonstrate primer specificity and amplification of a single product. Calibration curves were built using a ten-fold dilution series of synthetic plasmid “pNORM” containing inserts of six genes, intI1, sul1, qnrS, blaCTX-M-32, blaTEM, and 16s rRNA, embedded in a single plasmid [25]. The values of R2 were greater than 0.99 for all calibration curves while amplification efficiencies ranged from 98% to 102%. Calculation of the absolute gene copies of target genes were carried out based on known copies of a standard reference plasmid pNORM. Relative gene abundance was calculated by normalizing the absolute number of ARG copies to that of 16S rRNA gene copies as described previously in [26].

2.7. Statistics

Data for relative abundance of ARG copy numbers in different samples was compared using ANOVA followed by Tukey HSD post-hoc test using SigmaPlot version 12.5 (Systat Software, Inc. San Jose, CA, USA). Pearson’s rank correlation test was performed to identify correlations between levels of physiochemical parameters, bacterial counts, and gene abundances. Principal component analysis (PCA) was performed on levels of ARGs, physiochemical parameters, and bacterial counts using FactoMineR package, and plots were generated using ggplot2 package in R Studio version 1.1.463. (RStudio Inc. 2018, Boston, MA, USA)

3. Results

3.1. Physiochemical Parameters and Microbial Counts

Physiochemical parameters of the GW samples, fecal coliform counts, E. coli counts, and ESBL counts are shown in Table 1. Values for all analyzed physiochemical parameters did not vary significantly among different villages (Figure S1). Mean values of pH for GW samples ranged from 4.8 to 7.8 while values of EC obtained for the samples ranged from 0.6 to 3.9 mS/cm. Measured values of TSS varied greatly among GW samples ranging from 207 to 3487 mg/L. The average BOD5 values in GW samples ranged from 280 to 570 mg/L, while observed TOC values ranged from 245 to 2645 mg/L. Mean values of TN ranged from 21.7 to 114.9 mg/L. Mean count of E. coli ranged from 1.2 × 10⁶ to 1.7 × 10⁸ CFU/100 mL, while average fecal coliforms ranged from 1.8 × 10⁷ to 1.1 × 10⁹ CFU/100 mL. ESBL-producing bacteria were recovered from all Bedouin villages. Average counts of ESBL-producing bacteria recovered from selective plating on CHROMagar™ ESBL ranged from 1.6 × 10⁶ to 7.3 × 10⁶ CFU/100 mL. A direct positive correlation was observed between total coliform counts and values of BOD5 (p = 0.03). Moreover, a positive correlation was also observed between average ESBL counts and fecal coliform counts (p = 0.008). The values of TOC positively correlated with BOD5 values (p = 0.0001) (Table 2).

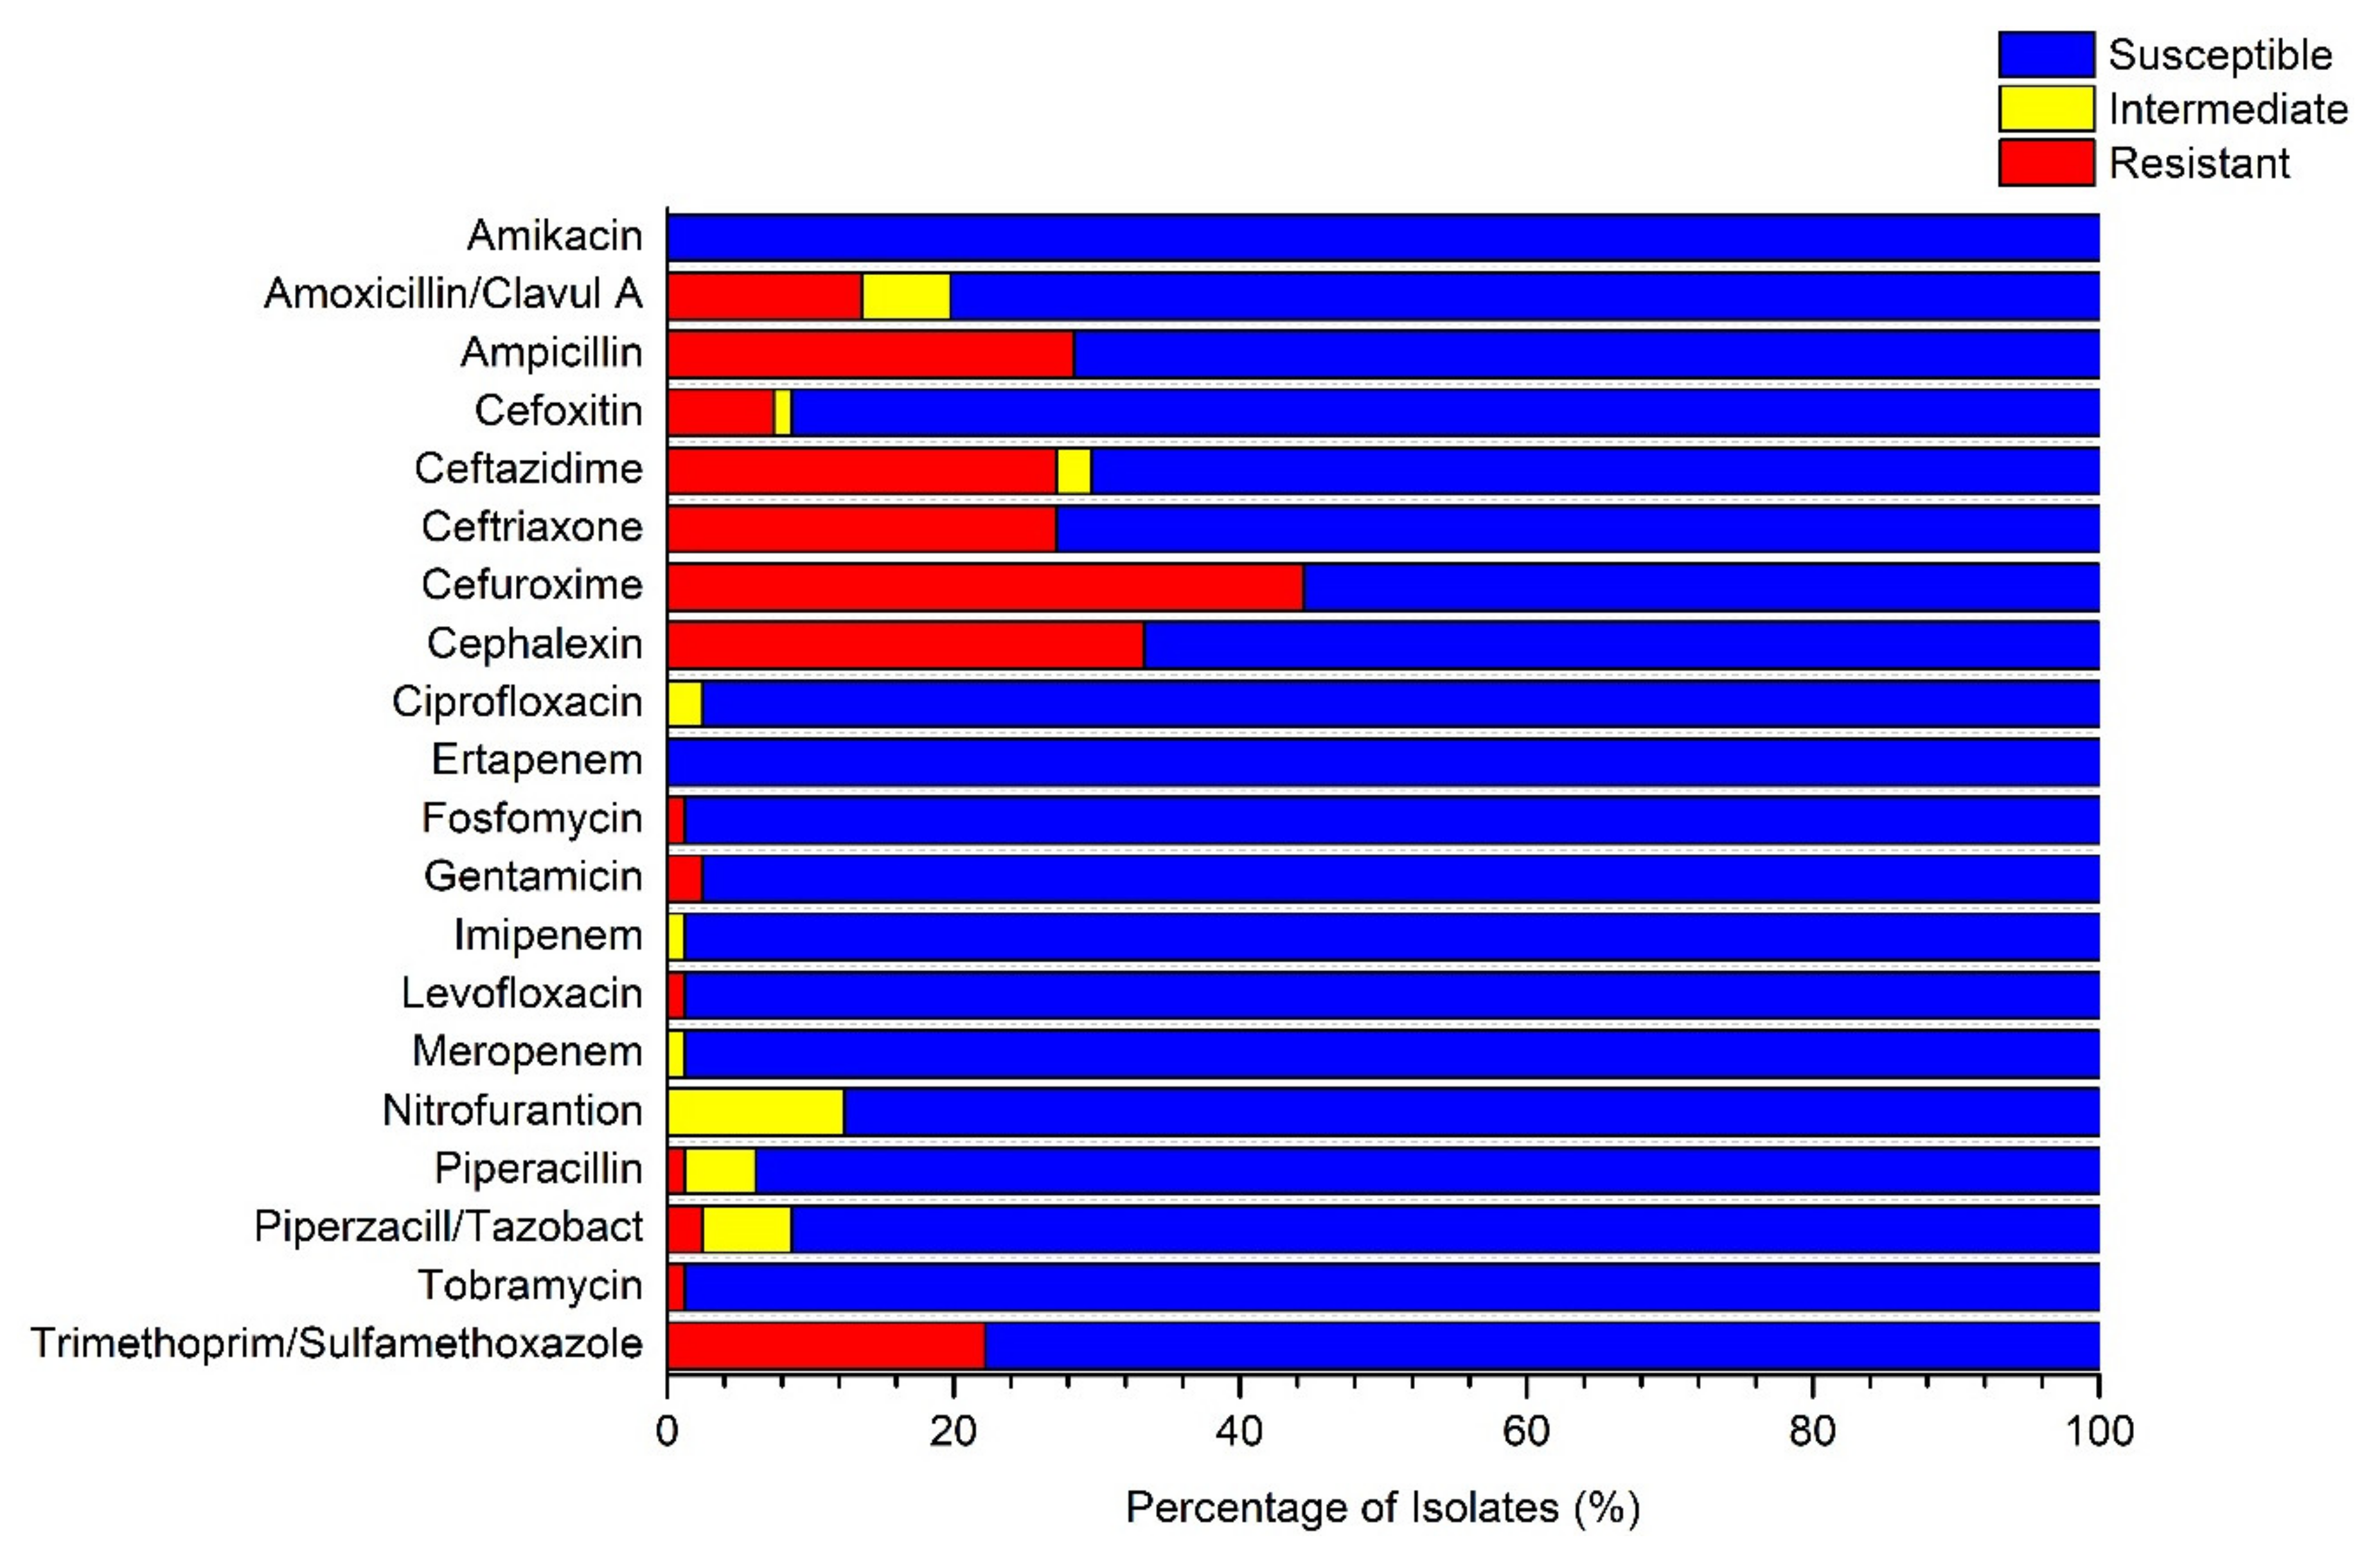
3.2. Presence of Multidrug-Resistant Isolates in Untreated GW Samples

ARB were pre-selected from all sampling locations. Of 81 isolates characterized, 82% showed resistance to more than one of the tested antimicrobials (Figure 1), 18% isolates were confirmed to be ESBL producers (Table 3), and 86.7% of these ESBL producers were MDR (Figure 1). ESBL-producing isolates expressed resistance to other antimicrobials: 80% of isolates were resistant to trimethoprim/sulfamethoxazole, 20% were resistant to amoxicillin/clavulanic acid (Figure S2), and 20% were resistant to gentamicin (Table 4).

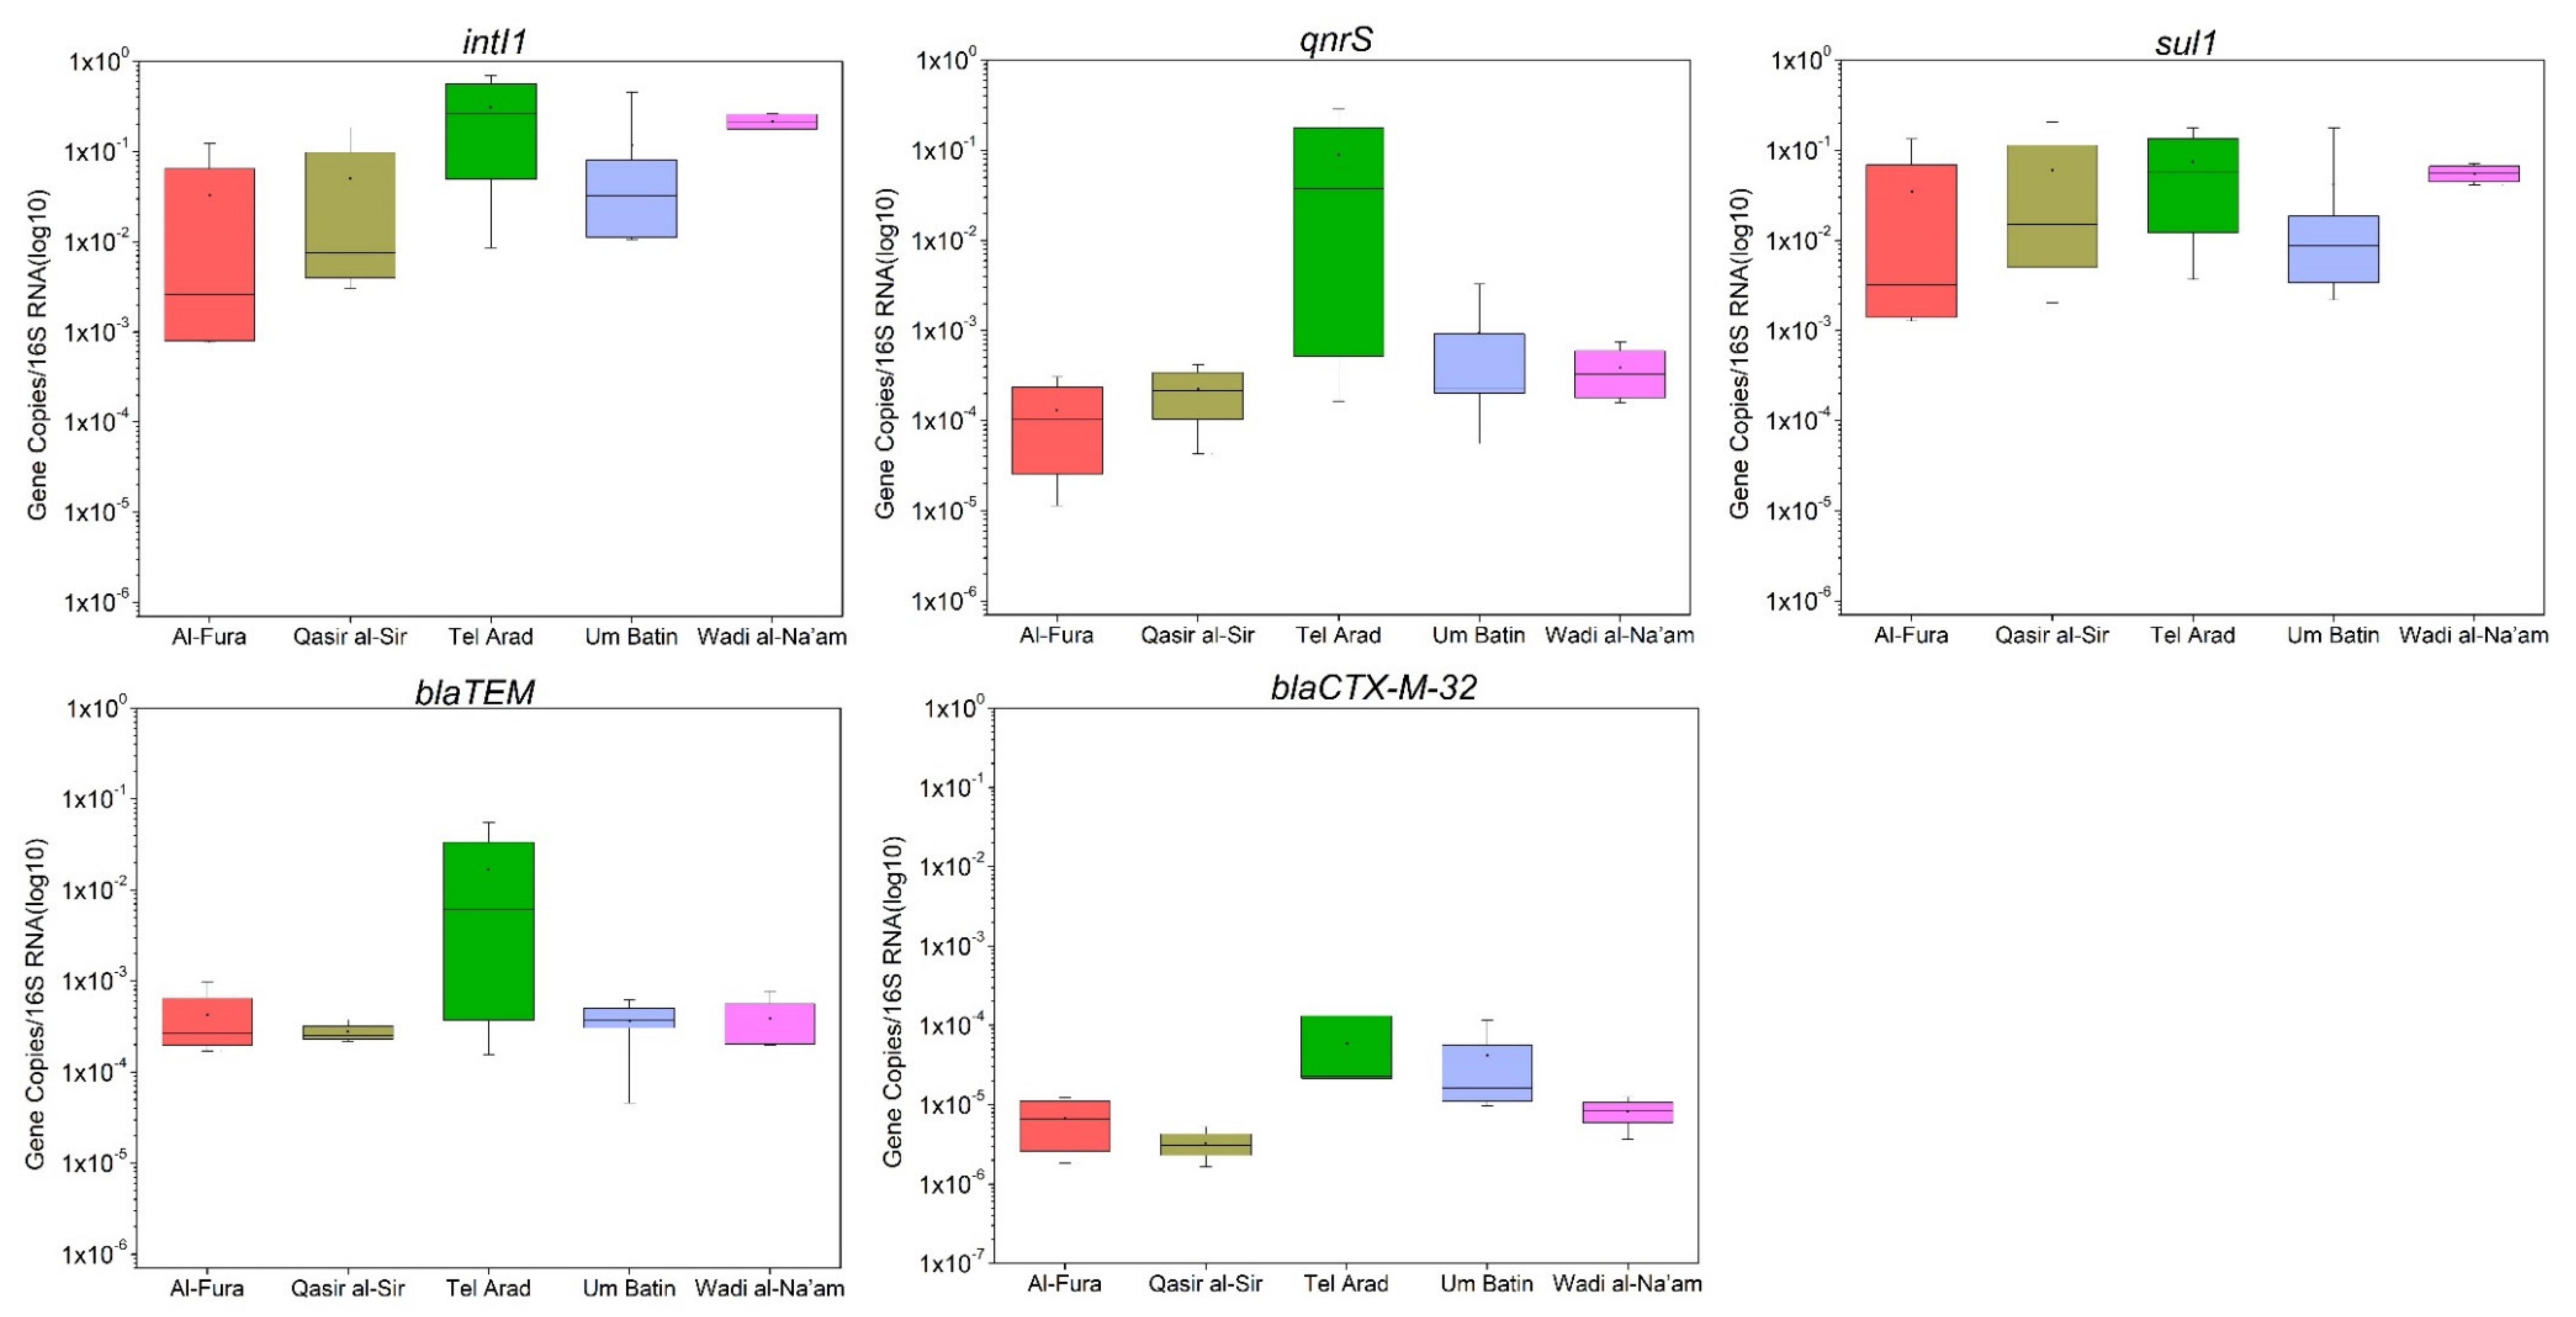
3.3. Quantification of Antimicrobial Resistance Genes in GW

The results of relative abundance of ARGs analyzed via quantitative PCR are shown in Figure 2. GW samples from all villages had detectable levels of the relevant ARGs. Among the five genes monitored in this study, the abundance of intI1 remained highest in all the GW samples analyzed. The highest average copy numbers were observed for intI1 (1.4 × 10⁻¹ gene copies/16S rRNA), sul1 (5.2 × 10⁻² gene copies/16S rRNA), and qnrS (1.7 × 10⁻² gene copies/16S rRNA), followed by blaTEM (3.5 × 10⁻³ gene copies/16S rRNA) and blaCTX-M-32 (2.2 × 10⁻⁵ gene copies/16S rRNA, (Figure 2). This relative order of the abundance of these genes in GW was observed in most of the GW samples across all villages.
Analysis of statistical correlations between abundance of different ARGs originating from GW revealed a positive correlation between copies of the qnrS gene to copies of intI1 and sul1 (p = 0.007 and p = 0.03, respectively) (Table 2). Similarly, relative abundance of the blaTEM gene had a positive correlation to abundance of blaCTX-M-32 and qnrS genes (p = 0.01 and p = 0.0001, respectively). Moreover, a strong positive correlation was also observed between intI1 and sul1 (p = 0.0001). Although none of the physiochemical parameters had a significant correlation with abundance of ARGs, a positive correlation was observed between average fecal coliform counts and abundance of 16S rRNA gene copies (Table 2).

4. Discussion

4.1. Summary of Findings

This study focused on the relatively unexplored issue of AMR in recognized and unrecognized Bedouin villages. Our results demonstrate that untreated GW can harbor ARB and ARGs of human origin, and this is one of the first studies reporting the presence of MDR ESBL-producing bacteria in untreated GW discharged from household activities. Furthermore, the uncontrolled discharge of untreated GW into the surrounding environment could lead to dissemination of ARB, ARGs, and MGEs in the environment and increase the risks of human exposure to AMR.
In this study, physiochemical properties were analyzed for GW samples collected from different household sources (shower, laundry, and kitchen). The measured characteristics varied among samples collected from different sources. This is expected as the composition of GW varies widely from household to household and its characteristics are also shaped by concentration of pollutant load based on the water origin [27,28]. Division and segregation practices of GW in Bedouin villages are irregular and diverse and vary greatly among households, contributing to the observed variability in physiochemical parameters. Typically, GW streams originating from kitchen and laundry have a higher load of organics and physical pollutants contributing to higher values of TSS and EC as compared to shower and mixed GW [27,29]. In this study, the measured mean BOD5 value for samples was 414 mg/L which was similar to values reported earlier in untreated GW [29,30,31], indicating elevated organic load and significant pollution potential in these GW samples. Such high levels of BOD5 could be because of higher loads of organic matter originating mainly from food residuals and dirt from washing of vegetables [32]. A positive correlation between values of BOD5 and fecal counts and copies of 16S genes further indicate the high organic load in GW. Mean counts of fecal coliforms in analyzed GW samples were very high (1.8 × 10⁷−1.1 × 10⁹ CFU/100 mL), however this is in line with earlier studies which reported mean total coliforms ranging from 1.4 × 10³ to 1.5 × 10⁸ CFU/100 mL in bathroom, laundry, and mixed GW [27,33].
Generally, GW does not include feces, thus counts of fecal bacteria are usually expected to be lower than that of blackwater; however, studies have shown association of high loads of fecal pathogens in GW [34,35]. Significant levels of fecal coliform counts (3 × 10⁵ CFU/100 mL) have been reported earlier in GW samples obtained from small-scale GW treatment systems in the central Negev region in Israel [36]. A study by Craddock et al. in the West Bank, Palestinian Territories, reported variable, frequently high values of E. coli in the range of 0–7.1 × 10⁵ CFUs/100 mL from raw GW samples including kitchen, laundry, and sink water [37]. In our study, mean counts of bacteria were relatively higher than these regionally-specific levels for GW, however, 70% of the GW samples taken in this study contained only kitchen sink water (Supplementary Table S1). Thus, it is plausible that this could be one of the reasons for the comparatively high bacterial load in our samples, as high nutrient concentrations (degraded organic material) associated with GW discharged from kitchen sources increase levels of BOD and favor growth of enteric bacteria [38,39]. In addition, preparing raw meat and chicken can also contribute to bacteria levels [39,40]. Moreover, a study by Maimon et al. in Israel has also demonstrated that effluents containing kitchen GW, in particular, have the lowest quality among GW sources with high levels of E. coli (1.6 × 10⁵ CFU/100 mL) [41]. Similarly high bacterial levels in GW have also been reported in other studies [42]. For GW sources other than kitchen water, the major contributors to high bacterial concentrations include activities such as washing laundry contaminated with fecal matter (i.e., diapers), childcare, and showering [39,41]. The Bedouin households included in this study have typically large family sizes, often with small children, which potentially contributes to elevated bacterial concentrations in GW discharged from these houses.

4.2. ARG Occurrence in Untreated GW

ARGs were detected from all GW samples in this study, and may have originated from humans, livestock (i.e., washing hands after animal care), or food items (which can harbor ARGs from soil or irrigation water) [43]. On average, the highest relative abundance was detected for intI1, while blaCTX-M-32 was the least abundant ARG. This is in agreement with an earlier study which had also reported a similar trend for these two genes among all the studied ARGs from waste water effluents and stabilization reservoirs in Israel [43]. A high relative abundance of the intI1 gene in all GW samples indicated anthropogenic pollution. An earlier study had also detected the intI1 gene from surfaces of domestic environments such as U-bends of kitchen and bathroom sinks, and significantly higher occurrences in shower bends [27]. The occurrence of the intI1 gene and its selection has also been associated with environments polluted with disinfectants/biocides, detergents, and quaternary ammonium compound (QAC) [5,28]. This explains the occurrence of intI1 in GW samples, as these ARGs could have originated from animals or humans and their selection and accumulation may have been aided by routinely used fabric care and body care products (such as shower gel and toothpastes), which are known to have biocides and detergent-like compounds. Earlier studies have shown that integrons are frequently associated with members of the Enterobacteriaceae family, and their abundance is higher in anthropogenically impacted ecosystems [44,45]. Moreover the abundance of intI1 is known to alter rapidly in natural reservoirs owing to the short generation time of host cells and gene transfer mechanisms, and thus is a suitable marker of the pollution level in the environment [46]. Our observations are particularly alarming, since the intI1 gene is associated with multiple ARGs resistant to a broad range of antimicrobial classes and plays an important role as a vector in the dissemination of antimicrobial resistance to indigenous microbes [27,47].
Additionally, correlation analysis revealed a strong positive correlation of gene copies of inI1 with abundance of both sul1 and qnrS. This is likely since sul1 is typically located in the 3’ conserved segments of class 1 integron [44]. Moreover, this correlation also indicates the potentially crucial role of horizontal gene transfer mechanisms in the spread of ARGs such as sul1 and qnrS. In this study, two key ESBL genes, blaCTX-M-32 and blaTEM, were also detected in GW from Bedouin villages. Moreover, a positive correlation was also obtained for the abundance of these ARGs in the GW samples. Earlier studies have reported the presence of blaCTX-M -32 in a wide range of clinical bacteria and geographic areas compared to the other two ESBL gene families—blaSHV (not studied herein) and blaTEM [48]. The blaCTX-M-32 and blaTEM genes are common ESBL genes found predominantly in clinical Enterobacterales isolates other than Pseudomonas sp. (i.e., K. pneumoniae and E. coli). This explains their occurrence in GW as most of the MDR ESBL isolates we identified from our samples belonged to these two species. Overall, the occurrence of these two ESBL genotypes in GW is a potential health concern as humans can be exposed when untreated GW is discharged to the environment or used for irrigation.

4.3. Presence of MDR ESBL Isolates in GW

Remarkably, ESBL producers were detected from every village. Phenotypically, 86.7% of these ESBL-producers were MDR. A high prevalence of MDR isolates of Klebsiella sp. and E. coli, followed by Enterobacter cloacae, was observed among ESBL isolates identified from the GW samples. Previously, a high prevalence of ESBL-producing E. coli and Klebsiella sp. was reported in urban wastewater, hospital waste, and sewage [22,30,31], however, in this study we report their occurrence in untreated GW from Bedouin villages. The occurrence of these resistant isolates in GW, and its associated environmental discharge, could potentially contribute to the spread of ESBL-producing E. coli and Klebsiella sp. [29]. E. coli and Klebsiella are the most common ESBL producers among Enterobacterales [48,49] and are often recognized as opportunistic pathogens associated with urinary tract, bloodstream, and respiratory infections [6,7]. In this context, infections with ESBL-producing bacteria are also an emerging health problem among the Bedouin of Israel [14]. As mentioned earlier, these communities are frequently left unconnected to wastewater grids, leading to higher levels of exposure to sewage. Furthermore, other reasons for the occurrence of MDR ESBL E. coli and Klebsiella sp. in GW from these villages could include inappropriate antimicrobial usage and the close proximity of livestock and other domestic animals, which can serve as a reservoir or source of ARB, including ESBLs [50,51,52]. Although we cannot fully ascertain the origin of these ESBL-producing bacteria, it is very well known that ESBL genes can be transferred across environmental sources and, specifically, from food-producing animals to humans via MGEs in interconnected habitats [14,47]. The presence of MDR and ESBL-producing E. coli and Klebsiella in untreated GW discharged from these Bedouin villages could accelerate transfer of ESBL genes to animals and humans and thus poses a possible public health threat.

4.4. Limitations

Collection of samples from Bedouin villages present a great challenge since the Bedouins live in settings which are characterized as pastoral, off-grid, disenfranchised, and under constant conflict. Hence, the limitations of this study include a small sample size from GW collected within a limited sampling timeframe. However, our goal was to measure antimicrobial resistance from a wide variety of GW sources within the Bedouin community, which was accomplished in this study. As the samples were collected non-longitudinally from a small number of villages, it is possible that variation among villages or seasonal variation was not observed. Future research should aim to collect more samples, from a larger number of villages and cities, over a longitudinal sampling timeframe. Another limitation is the use of qPCR, which can target identification of only previously known resistance genes. Future research should utilize whole genome sequencing to establish the bacterial community structure of GW, as well as a more detailed description of ARGs. Despite these limitations, the current findings from our study indicate that untreated GW can serve as a potential source of ARGs and MDR bacteria such as Gram-negative ESBL producers.

4.5. Conclusions

Our results indicate that untreated GW in the sampled settlements presents a risk of dissemination of ARB, including ESBL-producing bacteria, into the surrounding environment. Overall, high levels of bacteria, phenotypically resistant Gram-negative isolates, and multiple ARGs were observed in these samples. In every village sampled, this study observed ESBL genes and isolates which were confirmed to be ESBL producers, suggesting that this may be a widespread problem in GW in Bedouin villages. Additionally, our study also highlights the importance of sanitation, and the urgent need to develop and implement effective wastewater management strategies in order to prevent dissemination of MDR bacteria.

Supplementary Materials

The following are available online at https://www.mdpi.com/2073-4441/12/5/1460/s1, Figure S1: Percentage of resistance patterns of isolates obtained from GW of Bedouin villages against β-lactam antimicrobials. Data shows percentage susceptible, intermediate and resistance to β-lactam antimicrobials among 81 potential ESBL isolates. Figure S2: Principal component analysis of various physiochemical parameters and relative abundance of antimicrobial resistance genes analyzed in untreated GW samples. (A) Individuals PCA – each individual biological replicate represented as a colored label corresponding to the type of water sample. Values indicated on the axis of map correspond to the percentage of total variance explained by each axis (PC1 and PC2 respectively). (B) Variables PCA—showing contribution of individual variables to the total variance. Table S1: Details of greywater (GW) sources sampled from different Bedouin Villages. Table S2: Details of primers and annealing temperature used in real time PCR assay.

Author Contributions

Conceptualization, N.D., Z.R. and J.M.-G.; Formal analysis, S.P., Y.M. and O.S.; Funding acquisition, N.D., Z.R. and J.M.-G.; Investigation, S.P., O.S. and Z.E.; Project administration, Z.R. and J.M.-G.; Visualization, S.P. and H.A.C.; Writing—original draft, S.P. and H.A.C.; Writing—review & editing, S.P., H.A.C., M.G., Z.E., N.D., Z.R. and J.M.-G. All authors have read and agreed to the published version of the manuscript.

Funding

This research was funded by the Marcus Foundation for water research under Ben Gurion University of the Negev. Craddock is supported by the Israel-US Fulbright Postdoctoral Fellowship Program and the Zuckerman Postdoctoral Scholars Program.

Acknowledgments

We would like to thank Shany Treub at Soroka University Medical Center, Boris Khalfin, Damiana Diaz-Reck and Lusin Ghazaryan, Ben Gurion University of the Negev. We would like to thank Eddie Cytryn for providing us the pNORM plasmid.

Conflicts of Interest

The authors declare no conflict of interest.

References

  1. Magiorakos, A.P.; Srinivasan, A.; Carey, R.B.; Carmeli, Y.; Falagas, M.E.; Giske, C.G.; Harbarth, S.; Hindler, J.F.; Kahlmeter, G.; Olsson-Liljequist, B.; et al. Multidrug-resistant, extensively drug-resistant and pandrug-resistant bacteria: An international expert proposal for interim standard definitions for acquired resistance. Clin. Microbiol. Infect. 2012, 18, 268–281. [Google Scholar] [CrossRef] [PubMed] [Green Version]
  2. Benami, M.; Gillor, O.; Gross, A. Potential health and environmental risks associated with onsite greywater reuse: A review. Built Environ. 2016, 42, 212–229. [Google Scholar] [CrossRef]
  3. Casanova, L.M.; Little, V.; Frye, R.J.; Gerba, C.P. A survey of the microbial quality of recycled household graywater. J. Am. Water Resour. Assoc. 2001, 37, 1313–1319. [Google Scholar] [CrossRef]
  4. Birks, R.; Colbourne, J.; Hobson, R. Microbiological water quality in a large in-building, water recycling facility. Water Sci. Technol. 2004, 50, 165–172. [Google Scholar] [CrossRef] [PubMed]
  5. Gaze, W.H.; Abdouslam, N.; Hawkey, P.M.; Wellington, E.M.H. Incidence of Class 1 Integrons in a Quaternary Ammonium Compound-Polluted Environment. Antimicrob. Agents Chemother. 2005, 49, 1802. [Google Scholar] [CrossRef] [Green Version]
  6. Kothari, C.; Gaind, R.; Singh, L.C.; Sinha, A.; Kumari, V.; Arya, S.; Chellani, H.; Saxena, S.; Deb, M. Community acquisition of β-lactamase producing Enterobacteriaceae in neonatal gut. BMC Microbiol. 2013, 13, 136. [Google Scholar] [CrossRef] [Green Version]
  7. Quan, J.; Zhao, D.; Liu, L.; Chen, Y.; Zhou, J.; Jiang, Y.; Du, X.; Zhou, Z.; Akova, M.; Yu, Y. High prevalence of ESBL-producing Escherichia coli and Klebsiella pneumoniae in community-onset bloodstream infections in China. J. Antimicrob. Chemother. 2016, 72, 273–280. [Google Scholar] [CrossRef] [Green Version]
  8. Bailie, R.S.; Stevens, M.; McDonald, E.L. The impact of housing improvement and socio-environmental factors on common childhood illnesses: A cohort study in Indigenous Australian communities. J. Epidemiol. Community Health 2012, 66, 821–831. [Google Scholar] [CrossRef] [Green Version]
  9. Treister-Goltzman, Y.; Peleg, R. What is Known About Health and Morbidity in the Pediatric Population of Muslim Bedouins in Southern Israel: A Descriptive Review of the Literature from the Past Two Decades. J. Immigr. Minority Health 2015, 17, 940–946. [Google Scholar] [CrossRef]
  10. Ezery, Z. Inadequate Wastewater Infrastructure’s Effect on the Environmental Health of the Bedouin Population in the Negev. Master’s Thesis, Ben-Gurion University of the Negev, Be’er Sheva, Israel, 2016. [Google Scholar]
  11. Natalya, B.; Fraser, D.; Givon-Lavi, N.; Dagan, R. A Decade (1989–1998) of Pediatric Invasive Pneumococcal Disease in 2 Populations Residing in 1 Geographic Location: Implications for Vaccine Choice. Clin. Infect. Dis. 2001, 33, 421–427. [Google Scholar] [CrossRef]
  12. Dagan, R.; Landau, D.; Haikin, H.; Tal, A. Hospitalization of Jewish and Bedouin infants in southern Israel for bronchiolitis caused by respiratory syncytial virus. Pediatr. Infect. Dis. J. 1993, 12, 381–386. [Google Scholar] [CrossRef] [PubMed]
  13. Adler, A.; Givon-Lavi, N.; Moses, A.E.; Block, C.; Dagan, R. Carriage of Community-Associated Methicillin-Resistant Staphylococcus aureus in a Cohort of Infants in Southern Israel: Risk Factors and Molecular Features. J. Clin. Microbiol. 2010, 48, 531. [Google Scholar] [CrossRef] [PubMed] [Green Version]
  14. Elnasasra, A.; Alnsasra, H.; Smolyakov, R.; Riesenberg, K.; Nesher, L. Ethnic Diversity and Increasing Resistance Patterns of Hospitalized Community-Acquired Urinary Tract Infections in Southern Israel: A Prospective Study. Isr. Med. Assoc. J. 2017, 19, 538–542. [Google Scholar] [PubMed]
  15. Gatica, J.; Cytryn, E. Impact of treated wastewater irrigation on antibiotic resistance in the soil microbiome. Environ. Sci. Pollut. Res. 2013, 20, 3529–3538. [Google Scholar] [CrossRef] [PubMed] [Green Version]
  16. Troiano, E.; Beneduce, L.; Gross, A.; Ronen, Z. Antibiotic-Resistant Bacteria in Greywater and Greywater-Irrigated Soils. Front. Microbiol. 2018, 9, 2666. [Google Scholar] [CrossRef]
  17. Rizzo, L.; Manaia, C.M.; Merlin, C.; Schwartz, T.; Dagot, C.; Ploy, M.-C.; Michael, I.; Fatta-Kassinos, D. Urban Wastewater Treatment Plants as Hotspots for Antibiotic Resistant Bacteria and Genes Spread into the Environment: A Review. Sci. Environ. 2013, 447C, 345–360. [Google Scholar] [CrossRef]
  18. APHA. WPCF (2005) Standard Methods for the Examination of Water and Wastewater; APHA: Washington, DC, USA, 2005. [Google Scholar]
  19. Gross, A.; Sklarz, M.Y.; Yakirevich, A.; Soares, M.I.M. Small scale recirculating vertical flow constructed wetland (RVFCW) for the treatment and reuse of wastewater. Water Sci. Technol. 2008, 58, 487–494. [Google Scholar] [CrossRef]
  20. Müller, H.; Sib, E.; Gajdiss, M.; Klanke, U.; Lenz-Plet, F.; Barabasch, V.; Albert, C.; Schallenberg, A.; Timm, C.; Zacharias, N.; et al. Dissemination of multi-resistant Gram-negative bacteria into German wastewater and surface waters. FEMS Microbiol. Ecol. 2018, 94. [Google Scholar] [CrossRef]
  21. Faron, M.L.; Buchan, B.W.; Hyke, J.; Madisen, N.; Lillie, J.L.; Granato, P.A.; Wilson, D.A.; Procop, G.W.; Novak-Weekley, S.; Marlowe, E.; et al. Multicenter Evaluation of the Bruker MALDI Biotyper CA System for the Identification of Clinical Aerobic Gram-Negative Bacterial Isolates. PLoS ONE 2015, 10, e0141350. [Google Scholar] [CrossRef]
  22. CLSI. Performance Standards for Antimicorbial Susceptibility Testing, 29th ed.; CLSI supplement M100; Clinical and Laboratory Standards Institute: Wayne, PA, USA, 2019. [Google Scholar]
  23. Galler, H.; Feierl, G.; Petternel, C.; Reinthaler, F.F.; Haas, D.; Habib, J.; Kittinger, C.; Luxner, J.; Zarfel, G. Multiresistant Bacteria Isolated from Activated Sludge in Austria. Int. J. Environ. Res. Public Health 2018, 15, 479. [Google Scholar] [CrossRef] [Green Version]
  24. Jiang, X.; Cui, X.; Xu, H.; Liu, W.; Tao, F.; Shao, T.; Pan, X.; Zheng, B. Whole Genome Sequencing of Extended-Spectrum Beta-Lactamase (ESBL)-Producing Escherichia coli Isolated From a Wastewater Treatment Plant in China. Front. Microbiol. 2019, 10, 1797. [Google Scholar] [CrossRef] [PubMed] [Green Version]
  25. Rocha, J.; Cacace, D.; Kampouris, I.; Guilloteau, H.; Jäger, T.; Marano, R.B.M.; Karaolia, P.; Manaia, C.M.; Merlin, C.; Fatta-Kassinos, D.; et al. Inter-laboratory calibration of quantitative analyses of antibiotic resistance genes. J. Environ. Chem. Eng. 2020, 8, 102214. [Google Scholar] [CrossRef]
  26. Auerbach, E.; Seyfried, E.; McMahon, K. Tetracycline Resistance Genes in Activated Sludge Wastewater Treatment Plants. Water Res. 2007, 41, 1143–1151. [Google Scholar] [CrossRef] [PubMed]
  27. Lucassen, R.; Rehberg, L.; Heyden, M.; Bockmühl, D. Strong correlation of total phenotypic resistance of samples from household environments and the prevalence of class 1 integrons suggests for the use of the relative prevalence of intI1 as a screening tool for multi-resistance. PLoS ONE 2019, 14, e0218277. [Google Scholar] [CrossRef] [PubMed]
  28. Marshall, B.M.; Robleto, E.; Dumont, T.; Levy, S.B. The Frequency of Antibiotic-Resistant Bacteria in Homes Differing in Their Use of Surface Antibacterial Agents. Curr. Microbiol. 2012, 65, 407–415. [Google Scholar] [CrossRef] [PubMed]
  29. Oteng-Peprah, M.; Acheampong, M.A.; deVries, N.K. Greywater Characteristics, Treatment Systems, Reuse Strategies and User Perception—A Review. Water Air Soil Pollut. 2018, 229, 255. [Google Scholar] [CrossRef] [PubMed] [Green Version]
  30. Ghaitidak, D.M.; Yadav, K.D. Characteristics and treatment of greywater—A review. Environ. Sci. Pollut. Res. 2013, 20, 2795–2809. [Google Scholar] [CrossRef]
  31. Bakare, B.F.; Mtsweni, S.; Rathilal, S. Characteristics of greywater from different sources within households in a community in Durban, South Africa. J. Water Reuse Desalin. 2016, 7, 520–528. [Google Scholar] [CrossRef]
  32. Noutsopoulos, C.; Andreadakis, A.; Kouris, N.; Charchousi, D.; Mendrinou, P.; Galani, A.; Mantziaras, I.; Koumaki, E. Greywater characterization and loadings – Physicochemical treatment to promote onsite reuse. J. Environ. Manag. 2018, 216, 337–346. [Google Scholar] [CrossRef]
  33. De Gisi, S.; Casella, P.; Notarnicola, M.; Farina, R. Grey water in buildings: A mini-review of guidelines, technologies and case studies. Civ. Eng. Environ. Syst. 2016, 33, 35–54. [Google Scholar] [CrossRef]
  34. Ottoson, J.; Stenström, T.A. Faecal contamination of greywater and associated microbial risks. Water Res. 2003, 37, 645–655. [Google Scholar] [CrossRef]
  35. Winward, G.P.; Avery, L.M.; Frazer-Williams, R.; Pidou, M.; Jeffrey, P.; Stephenson, T.; Jefferson, B. A study of the microbial quality of grey water and an evaluation of treatment technologies for reuse. Ecol. Eng. 2008, 32, 187–197. [Google Scholar] [CrossRef]
  36. Ronen, Z.; Guerrero, A.; Gross, A. Greywater disinfection with the environmentally friendly Hydrogen Peroxide Plus (HPP). Chemosphere 2010, 78, 61–65. [Google Scholar] [CrossRef] [PubMed]
  37. Craddock, H.A.; Rjoub, Y.; Rosen, D.; Greif, J.; Lipchin, C.; Mongodin, E.F.; Sapkota, A.R. Antibiotic-resistant Escherichia coli and Klebsiella sp. in greywater reuse systems and pond water used for agricultural irrigation in the West Bank, Palestinian Territories. Environ. Res. 2020, in press. [Google Scholar]
  38. Boyjoo, Y.; Pareek, V.K.; Ang, M. A review of greywater characteristics and treatment processes. Water Sci. Technol. 2013, 67, 1403–1424. [Google Scholar] [CrossRef] [PubMed]
  39. Cogan, T.A.; Bloomfield, S.F.; Humphrey, T.J. The effectiveness of hygiene procedures for prevention of cross-contamination from chicken carcases in the domestic kitchen. Lett. Appl. Microbiol. 1999, 29, 354–358. [Google Scholar] [CrossRef]
  40. Maimon, A.; Tal, A.; Friedler, E.; Gross, A. Safe on-site reuse of greywater for irrigation—A critical review of current guidelines. Environ. Sci. Technol. 2010, 44, 3213–3220. [Google Scholar] [CrossRef]
  41. Maimon, A.; Friedler, E.; Gross, A. Parameters affecting greywater quality and its safety for reuse. Sci. Total Environ. 2014, 487, 20–25. [Google Scholar] [CrossRef]
  42. Leonard, M.; Gilpin, B.; Robson, B.; Wall, K. Field study of the composition of greywater and comparison of microbiological indicators of water quality in on-site systems. Environ. Monit. Assess. 2016, 188, 475. [Google Scholar] [CrossRef]
  43. Marano, R.B.M.; Zolti, A.; Jurkevitch, E.; Cytryn, E. Antibiotic resistance and class 1 integron gene dynamics along effluent, reclaimed wastewater irrigated soil, crop continua: Elucidating potential risks and ecological constraints. Water Res. 2019, 164, 114906. [Google Scholar] [CrossRef]
  44. Fluit, A.C.; Schmitz, F.J. Class 1 Integrons, Gene Cassettes, Mobility, and Epidemiology. Eur. J. Clin. Microbiol. Infect. Dis. 1999, 18, 761–770. [Google Scholar] [CrossRef]
  45. Gillings, M. DNA as a Pollutant: The Clinical Class 1 Integron. Curr. Pollut. Rep. 2018, 4, 1–7. [Google Scholar] [CrossRef]
  46. Gillings, M.R.; Gaze, W.H.; Pruden, A.; Smalla, K.; Tiedje, J.M.; Zhu, Y.-G. Using the class 1 integron-integrase gene as a proxy for anthropogenic pollution. ISME J. 2015, 9, 1269–1279. [Google Scholar] [CrossRef] [PubMed]
  47. Stalder, T.; Barraud, O.; Casellas, M.; Dagot, C.; Ploy, M.-C. Integron involvement in environmental spread of antibiotic resistance. Front. Microbiol. 2012, 3, 119. [Google Scholar] [CrossRef] [PubMed] [Green Version]
  48. Paterson, D.L.; Bonomo, R.A. Extended-spectrum beta-lactamases: A clinical update. Clin. Microbiol. Rev. 2005, 18, 657–686. [Google Scholar] [CrossRef] [Green Version]
  49. Pitout, J.D.D.; Laupland, K.B. Extended-spectrum β-lactamase-producing Enterobacteriaceae: An emerging public-health concern. Lancet Infect. Dis. 2008, 8, 159–166. [Google Scholar] [CrossRef]
  50. Carattoli, A. Animal reservoirs for extended spectrum β-lactamase producers. Clin. Microbiol. Infect. 2008, 14, 117–123. [Google Scholar] [CrossRef] [Green Version]
  51. Friedman, C.R.; Whitney, C.G. It’s Time for a Change in Practice: Reducing Antibiotic Use Can Alter Antibiotic Resistance. J. Infect. Dis. 2008, 197, 1082–1083. [Google Scholar] [CrossRef]
  52. Rousham, E.K.; Unicomb, L.; Islam, M.A. Human, animal and environmental contributors to antibiotic resistance in low-resource settings: Integrating behavioural, epidemiological and One Health approaches. Proc. R. Soc. B Biol. Sci. 2018, 285, 20180332. [Google Scholar] [CrossRef]
Figure 1. Resistance patterns observed in presumptive ESBL isolates (n = 81) obtained from GW of Bedouin villages against clinically relevant antimicrobials. Data shows percentage susceptible, intermediate, and resistant to clinically relevant antimicrobials among 81 isolates recovered on CHROMagar ESBL media.
Water 12 01460 g001
Figure 2. Relative abundance of antimicrobial resistance genes in GW samples collected from five different villages. Data shown as relative gene copies normalized to the copies of 16S rRNA genes from each sample. Relative abundance of ARGs are shown as box plots (boxes- show interquartile range, mean and median are shown as small square symbol and horizontal line respectively).
Water 12 01460 g002
Table 1. Physiochemical parameters of untreated household greywater (GW) samples collected from Bedouin villages.
ParameterAl-FuraQasr al-SirTel AradUm BatinWadi al-Na’amAll Villages
RangeMean ± SDRangeMean ± SDRangeMean ± SDRangeMean ± SDRangeMean ± SDRangeMean ± SD
pH3.80–6.584.81 ± 1.224.7–7.35.6 ± 1.15.8–9.57.8 ± 1.54.9–7.46.1 ± 1.255.5–6.76 ± 0.53.80–9.596.09 ± 1.46
EC (mS/cm)1.02–10.173.98 ± 4.20.4–0.90.6 ± 0.10.7–4.42.3 ± 1.61.5–3.72.3 ± 1.050.7–0.90.8 ± 0.10.13–10.172.04 ± 2.19
TSS (mg/L)231.6–28531156.5 ± 116422–575260 ± 250.176–136203487.5 ± 675576–338207 ± 185.221–493212.4 ± 208.621–136201160 ± 3177
BOD5 (mg/L)448.25–572.5492.6 ± 54.857.5–503280.9 ± 185.06.7–532.2312.5 ± 247.6101.3–881.8570.2 ± 313.1287.2–491.7378.2 ± 85.06.75–881.83414.7 ± 220.62
TOC (mg/L)543.14–60472645 ± 246072.8–407.4245 ± 137.93.3–833412.1 ± 411.848.5–34501300 ± 1304108.5–827323 ± 338.03.34–60471000 ± 1460
TN (mg/L)21.36–142.8154.52 ± 58.9415.6–29.121.7 ± 5.51.3–94.532.8 ± 42.98.9–424.8114.9 ± 175.81.0–7.74.6 ± 3.31.05–424.8449.06 ± 93.16
FC (CFU/100 mL)1 × 10⁶–1.26 × 1093.8 × 108 ± 5.94 × 1084.7 × 106 –1.1 × 1083.6 × 107 ± 4.5 × 1070–2.2 × 1085.5 × 107 ± 1.1 × 1081.1 × 106–6.0 × 1071.8 × 107 ± 2.5 × 1072.3 × 108–1.5 × 1091.1 × 109 ± 5.8 × 1080–1.5 × 1092.61 × 108 ± 4.94 × 10⁸
ESBL (CFU/100 mL)6.90 × 10⁵–9× 1064.87 × 106 ± 4 × 1065.7 × 105–1.0 × 1073.7 × 106 ± 3.34 × 1061.0 × 105–1.0 × 1074.1 × 106 ± 5.7 × 1064.3 × 105–2.8 × 1061.6 × 106 ± 1.7 × 1061.2 × 106–2.5 × 1077.3 × 106 ± 1.7 × 1061.05 × 105–2.56 × 1074.5 × 106 ± 5.89 × 10⁶
E. coli (CFU/100 mL)0–4 × 1061.23 × 106 ± 1.88 × 1060–5.5 × 1061.3 × 106 ± 2.1 × 1060–1.9 × 1084.7 × 107 ± 9.4 × 1076 × 106–9.5× 1067.7 × 106 ± 2.4 × 1066.5 × 107–4 × 1081.7 × 10 8± 1.5 × 1080–4 × 1084.15 × 107 ± 9.47 × 10⁷
EC—electrical conductivity, BOD5—biological oxygen demand, TSS—total suspended solids, TOC–total organic carbon, TN—total nitrogen, FC—fecal coliforms, ESBL—extended-spectrum β-lactamase-producing bacteria, CFU—colony forming unit.
Table 2. Correlation matrix relating antimicrobial resistance gene abundance, total fecal coliforms (CFU/mL), ESBL (CFU/mL), and physiochemical parameters. Values in bold indicate statistically significant correlations (Pearson) with a p-value < 0.05.
VariablesTSS (mg/L)BOD5 (mg/L)TOC (mg/L)TN (mg/L)FC (CFU/100 mL)ESBL (CFU/100 mL)16SintI1sul1qnrSblaTEMblaCTX-M-32
TSS (mg/L)1
BOD5 (mg/L)0.3851
TOC (mg/L)0.4420.8701
TN (mg/L)0.3560.4120.5151
FC (CFU/100 mL)0.1080.4910.261−0.0321
ESBL (CFU/100 mL)−0.1030.058−0.035−0.0990.5891
16S0.1830.2970.3500.0170.6720.3591
intI1−0.1820.056−0.309−0.3080.307−0.011−0.2061
sul1−0.218−0.010−0.327−0.2810.4360.1790.0350.9111
qnrS0.2210.1830.0080.0350.1920.198−0.1020.5740.4651
blaTEM0.3700.2100.0890.0860.3750.3550.1780.3890.4050.8381
blaCTX-M-320.4270.2220.1490.0490.3460.0140.3840.1660.0750.4370.5411
EC—electrical conductivity, BOD5—biological oxygen demand, TSS—total suspended solids, TOC—total organic carbon, TN—total nitrogen, FC—fecal coliforms, ESBL-extended-spectrum β-lactamase-producing bacteria, CFU—colony forming unit.
Table 3. Extended-spectrum β-lactamase (ESBL) producers identified from greywater samples. Data presented in table shows total numbers of ESBL-producers identified from initial 81 bacterial isolates obtained by pre-selection on ESBL CHROMagar® plates.
Identity of Bacterial IsolateSourceVillageNo. of Isolates
Enterobacter cloacaeKitchenAl-Fura2
Klebsiella oxytocaKitchenQasr al-Sir3
Klebsiella pneumoniaeKitchenTel Arad2
Klebsiella pneumoniaeMixed GW Tel Arad 2
Escherichia coliKitchenUm Batin3
Klebsiella pneumoniaeKitchenWadi al-Na’am2
Escherichia coliKitchenWadi al-Na’am1
Table 4. Minimum inhibitory concentration (MIC) of various clinically relevant antimicrobials tested on ESBL-positive isolates.
LocationOrganismAmoxicillin/Clavulanic AAmpicillinCeftazidimeCeftriaxoneCefuroximeCephalexin
(S/I/)MIC (µg/m)(S/I/)MIC (µg/m)(S/I/)MIC (µg/m)(S/I/)MIC (µg/m)(S/I/R)MIC (µg/m)(S/I/R)MIC (µg/m)
Al-FuraE. cloacaeR≥32R≥32R≥64R16R≥64R≥64
E. cloacaeR≥32R≥32R≥64R16R≥64R≥64
Qasr al -SirK. oxytocaS≤2R≥32R*<=1R16R≥64R≥64
K. oxytocaS≤2R≥32R*≤1R16R≥64R≥64
Tel AradK. pneumoniaeI16R≥32R8R≥64R≥64R≥64
K. pneumoniaeS4R≥32R4S≤1.0R≥64R≥64
K. pneumoniaeS8R≥32R*≤1R4R16R16
K. pneumoniaeI16R≥32R8R≥64R≥64R≥64
Um BatinE. coliS4R≥32R4R≥64R≥64R≥64
E. coliS4R≥32R16R≥64R≥64R≥64
Wadi aln’amE. coliS4R≥32R16R≥64R16R≥64
K. pneumoniaeS4R≥32R4R16R≥64R≥64
K. pneumoniaeI16R≥32R8R≥64R≥64R≥64
S—susceptible; I—intermediate; R—resistant; R*—species-specific corrections with particular antimicrobials made using VITEK 2 Advanced Expert System (AES).

