Article

Effects of Consecutive Extreme Weather Events on a Temperate Dystrophic Lake: A Detailed Insight into Physical, Chemical and Biological Responses

1
Dundalk Institute of Technology, Centre for Freshwater and Environmental Studies, Dundalk, Marshes Upper, Co. Louth A91 K584, Ireland
2
Marine Institute, Furnace, Newport, Co. Mayo F28 PF65, Ireland
*
Authors to whom correspondence should be addressed.
Water 2020, 12(5), 1411; https://doi.org/10.3390/w12051411
Submission received: 21 April 2020 / Revised: 8 May 2020 / Accepted: 13 May 2020 / Published: 15 May 2020
(This article belongs to the Special Issue Effect of Extreme Climate Events on Lake Ecosystems)

Abstract

:
Between May and July 2018, Ireland experienced an exceptional heat wave, which broke long-term temperature and drought records. These calm, stable conditions were abruptly interrupted by a second extreme weather event, Atlantic Storm Hector, in late June. Using high-frequency monitoring data, coupled with fortnightly biological sampling, we show that the storm directly affected the stratification pattern of Lough Feeagh, resulting in an intense mixing event. The lake restabilised quickly after the storm as the heatwave continued. During the storm there was a three-fold reduction in Schmidt stability, with a mixed layer deepening of 9.5 m coinciding with a two-fold reduction in chlorophyll a but a three-fold increase in total zooplankton biomass. Epilimnetic respiration increased and net ecosystem productivity decreased. The ratio of total nitrogen:total phosphorus from in-lake versus inflow rivers was decoupled, leading to a cascade effect on higher trophic levels. A step change in nitrogen:phosphorus imbalances suggested that the zooplankton community shifted from phosphorus to nitrogen nutrient constraints. Such characterisations of both lake thermal and ecological responses to extreme weather events are relatively rare but are crucial to our understanding of how lakes are changing as the impacts of global climate change accelerate.

Graphical Abstract

1. Introduction

Extreme-weather-related episodic events are becoming more frequent as a consequence of global climate change [1]. Meteorological extremes can be defined as those occasions when temperature (e.g., heat waves or cold spells), precipitation (e.g., floods or droughts) and/or wind speeds (e.g., hurricanes) break long-term records for a specific site with values well above (or below) a threshold of the studied variable [2,3]. Climate change, in turn, has been shown to influence lake thermal dynamics by altering lake mixing regimes [4]. In addition, weather-related episodic events facilitate the export of dissolved and particulate compounds from the surrounding terrestrial ecosystems [5]. As a consequence, lake ecosystems are excellent sentinels of change as they respond directly to meteorological episodic events, incorporating the catchment effects and integrating responses over time at different trophic levels [6]. However, responses to climate change in lake ecosystems operate on various temporal scales, and disentangling driver–response relationships impacting freshwater aquatic ecosystems is complex [7]. For this reason, understanding the responses of single climatic forcing events in the context of longer-term dynamics (e.g., seasonal patterns) is important and requires ecological variables at shorter critical time windows to be explored. In particular, this allows organism response to these disruptive events to be captured [8]. The timing of short or long-term responses differs depending on the variable of interest, from minutes when observing physico-chemical parameters to months or years when studying planktonic communities or higher trophic levels such as fish. High-frequency monitoring allows a more accurate exploration of both the meteorological drivers and their limnological consequences [9], in particular physico-chemical variables such as water temperature and dissolved oxygen (DO) [5]. In contrast, investigations of nutrient and biological responses require analytical and collection time with few studies of episodic events integrating the impact on physical, chemical and biological dynamics [10].
Dystrophic lakes are categorised by low nutrient concentrations (total nitrogen, TN < 350 μg N·L−1 and total phosphorus, TP < 10 μg P·L−1) [11] and high concentrations of humic matter, which gives a typical brown colour to the water (colour > 50 mg Pt·L−1) [12]. Humic matter generally originates from terrestrial ecosystems and is directly related to dissolved organic carbon (DOC) concentrations (DOC > 6 mg C·L−1) [13]. The characteristic brown colour of dystrophic lakes increases attenuation of solar radiation, which has been associated with a reduction of primary productivity [14]. Therefore, dystrophic lakes are characterised as low-productive systems with chlorophyll a (Chl a) concentrations of less than 3.5 μg Chl a·L−1 [11]. Terrestrial carbon input tends to promote higher bacterial production and, as such, dystrophic lakes are net heterotrophic systems [15]. In turn, this has an effect on primary consumers by altering food web efficiencies [16]. These types of lakes are commonly found in peatland catchments in northern regions worldwide [17] and particularly in Finland, Sweden, Estonia, the United Kingdom and Ireland [18].
Increasing inputs of terrestrial DOC have been recorded in temperate systems linked to rising temperatures and changes in precipitation patterns due to climate change [6]. However, the complexity of trophic interactions increases the level of uncertainty regarding how these systems are affected by such climatic events, due to observed local differences and synergistic or opposite effects between stressors [6]. In turn, in-lake nutrients and loadings, especially the ratio of nitrogen (N) to phosphorus (P), are important in structuring freshwater planktonic communities. However, little is known about shifts in N:P ratios in aquatic ecosystems due to extreme climatic events [19,20]. Differences in nutrient mobilization in peatland catchments [21] can disentangle relationships between loadings and in-lake N:P dynamics during extreme weather events. On the other hand, internal lake processes such as changes in microbial and primary producer nutrient uptake may drive a shift in lake N:P seasonal pattern [22], in turn impacting higher trophic levels [23].
Phytoplankton community composition can be strongly affected by episodic weather events through changes in lake water column stability which, in turn, effects light and nutrient availability [24,25,26,27,28]. Previous studies have found evidence of effects on phytoplankton communities following nutrient pulses as a consequence of episodic events [29,30,31]. In addition, in temperate stratified lakes, the seasonal pattern of primary production is linked to the development of thermal stratification [32]. According to the ‘critical depth hypothesis’, the initiation of the spring phytoplankton bloom occurs when the depth of surface mixing is shallower than the base of the euphotic depth [33,34]. For this reason, buoyant cyanobacteria generally dominate in lakes during calm and warm conditions [35] where, in contrast, deeper mixed layers favour taxa which are less sensitive to large fluctuations in light levels, such as certain Chlorophyta and diatom species [35,36]. Fast-sinking algae, like heavy and non-motile diatoms, take advantage of higher turbulence to remain in the mixed layer longer [37,38]. Cryptophytes, Chrysophytes and Dinophytes, which are often very motile and can have mixotrophic feeding strategies [39,40,41], can also have competitive advantages when mixed layer depths are deeper and relatively high-turbulence conditions dominate, because of their low light:nutrient requirements [42].
Quantifying changes in gross primary production (GPP), respiration (R) and net ecosystem productivity (NEP) (where NEP = GPP−R), can be used to assess the impact of episodic events on lake ecosystems, by changing the metabolic balance between R and GPP, and hence NEP [10,43,44]. Ecosystem metabolism and biomass dynamics are tightly coupled [45], and an increase in the biomass of the heterotrophic planktonic community is linked with an increase in ecosystem R [46,47]. In addition, R is strongly coupled to GPP, as R is constrained by the availability of labile carbon exudates through photosynthesis from primary producers (NEP) [48]. Consequently, shifts at the base of aquatic food webs (e.g., from heterotrophic to autotrophic production) have an effect on metabolism estimates, thus providing a general picture of whole-lake ecosystem impacts driven by meteorological extreme events [30,49]. However, the net effect of extreme climatic events on ecosystem metabolism is not straightforward, as metabolic rates differ at species level [50]. Therefore, new evidence may help to explain discrepancies between observations [43,51,52].
A number of studies have assessed the response of zooplankton community composition and biomass altered by extreme weather-related events increasing lake turbulence and deepening the thermocline [27,53,54,55,56,57,58,59]. Almost all authors who have studied zooplankton dynamics following storms have reported a relative increase in the biomass of omnivorous and predatory copepods during storm-induced mixing, which could be accompanied by changes in the biomass of the strictly herbivorous groups such as cladocerans [58]. Diet selection by calanoid copepods is strongly influenced by both particle quality and abundance of food available [60]. Therefore, changes in zooplankton community composition after meteorological-induced episodic events may be, in part, explained by the indirect effects to changes in their food source. New tools are increasingly available which allow food quality changes for primary consumers to be assessed. Ecological stoichiometry aims to provide a mechanism for explaining food quality constraints from the perspective of fundamental chemistry by comparing food-source elemental ratios with consumer elemental nutrient body content [61].
During summer 2018, Ireland experienced a heat wave and resultant drought from the 22nd May to the 12th June. This ended temporarily with the arrival of Storm Hector, which brought heavy rain and strong winds between the 13th and 19th June. Following this storm, high pressure and very stable warm and dry conditions returned, with the highest temperature ever recorded at a synoptic station in Ireland (32 °C; Shannon Airport, Co. Clare) on the 28th June. In addition, drought conditions were recorded at 21 stations in the country at various times between the 22nd May and the 14th July 2018, the driest summer on record for Ireland (record length of 56 years) [62].
A recent study at Lough Feeagh, a long-term monitoring site located in western Ireland, suggested that relatively rare summer storms may result in more pronounced impacts on lake physics compared to the more generally common winter storms [63]. In turn, it is necessary to better understand the implications of these extreme events for lake biology, particularly given their likely increased frequency as a consequence of climate change [64] and especially where they occur consecutively. Therefore, this work aims to assess the physical, chemical and biological effects of a well isolated summer mixing event in a dystrophic lake in western Ireland as a consequence of Storm Hector, in the context of extreme pre- and post-storm heat wave conditions. Specifically, the objectives of this study are to (1) characterise the extreme weather conditions in 2018 and their effect on the study site, based on the previous 15 years of available meteorological and lake physical data; (2) quantify a well-isolated summer mixing event in Lough Feeagh; (3) examine changes in lake epilimnetic metabolic estimates induced by Storm Hector; (4) compare total N:P loadings with in-lake values and examine if nutrient balances were affected by extreme weather-related events; (5) assess, in turn, N:P imbalances to emphasise any potential impact on nutrient constraints for primary consumers; and (6) evaluate fortnightly changes in planktonic community structure in Lough Feeagh so as to capture planktonic implications related to an atypical meteorological summer season.

2. Materials and Methods

2.1. Study Site and High-Frequency Monitoring

Lough Feeagh, in the Burrishoole catchment (Figure 1), is a monomictic lake, which has a maximum depth of 45 m and a mean depth of 14.5 m. It lies at an altitude of 14.5 m above sea level, has a surface area of 3.95 km2 and its water retention time is ~164 days (5−6 months) [65]. Feeagh is classified as a dystrophic lake [66] due to its low nutrient concentrations and primary productivity, but high colour and dissolved organic carbon concentrations, with TN values of 0.32–0.51 mg N·L−1, TP values between 3.70 and 28.76 μg P·L−1, Chl a values of 0.1–2.61 μg Chl a·L−1 and colour and DOC ranging from 45.33 to 105 mg Pt·L−1 and 6.83 to 12.18 mg C·L−1, respectively, in 2018 (n = 26).
The Burrishoole catchment is situated on the northwest Atlantic coast of Ireland, in County Mayo (Figure 1). The area of the catchment is approximately 90 km2 and the geology is primarily composed of granite, gneiss and schist [67]. The system comprises 45 km of low-productive and poorly buffered shallow streams draining into the sea in the northeast corner of Clew Bay, on the Atlantic coast [68]. The streams form two main sub-catchments comprising the two main inflow rivers to Lough Feeagh, the Glenamong and Black rivers (Figure 1). The presence of small amounts of dolomite and wacke in the eastern part of the catchment has a marked effect on the buffering capacity of the Black river compared with the Glenamong [69]. A terminal moraine, marking the boundary between metamorphic and sedimentary rock-types, separates the largest freshwater lake, Lough Feeagh, from the lagoonal estuary, Lough Furnace [70] (Figure 1). The land cover in the catchment comprises 64% blanket bog with a peat depth ranging from 0.5 to 2 m [71]. In addition, 23% of the land is used for commercial afforestation. The remaining area comprises reduced extensions of native oak woodland, natural grasslands and agricultural land [70].
The Marine Institute (MI) maintains an Automatic Water Quality Monitoring Station (AWQMS) on Lough Feeagh (Coordinates; 53.95, −9.58) [72] and Automatic River Monitoring Stations (ARMS) on the Glenamong (Coordinates: 53.96, −9.60) and Black (Coordinates: 53.97, −9.58) rivers (Figure 1). The MI also measures water level on the Glenamong river downstream of the ARMS every 15 minutes using a data logger (Orpheus mini, OTT Hydromet, Germany). An established rating curve has been used to convert water level into stream flow. To measure Black river discharges, the ‘drainage area ratio method’ was used [73]. Feeagh AWQMS collects high-frequency sensor information every 2 minutes. Vertical temperature profiles were measured using 12 platinum resistance thermometers (PRTs: Lab facility PT100 1/10DIN 4 wire sensor, Labfacility Ltd., UK) at 2.5, 5, 8, 11, 14, 16, 18, 20, 22, 27, 32, and 42 m. The AWQMS has a multiparameter probe (Hydrolab Data Sonde 5x, OTT Hydromet, UK) at 0.9 m from the surface to measure temperature and DO. Sensors on the AWQMS are cleaned fortnightly and DO on the sonde is calibrated once per month. Wind speed was measured in the AWQMS (2.3 m above lake surface level) with an anemometer (Vector Instruments A100L2-WR, Windspeed Ltd., UK). Data from the AWQMS is available from 2004 onwards. More information about the deployed sensors in the buoy can be found in the GitHub Data Repository [74]. In addition, Met Éireann maintains an automatic weather station (Newport Furnace) installed at 22 m above mean sea level, on the shore of Lough Feeagh (Coordinates: 53.92, −9.58), from which minimum and maximum air temperature as well as daily rainfall data have been obtained [75] (Figure 1).

2.2. Seasonal Chemical and Biological Sampling

Lough Feeagh and its main inflows, the Glenamong and Black rivers, were sampled fortnightly from April to October 2018 during daytime hours (10:00−16:00). The lake was sampled at its deepest point next to the buoy, and the rivers were sampled next to the monitoring stations (Figure 1). Samples for water chemistry in the two rivers were collected in 2 L pre-acid-washed high-density polyethylene bottles (HDPB), pre-rinsed with river water prior to sample collection. In Lough Feeagh, a 6 m integrated water sample was collected using a Plexiglas tube (length: 6 m, diameter: 70 mm). A quantity of 30 L of lake water was collected and placed in three acid-washed 10 L HDPB bottles which were pre-rinsed with lake water. All water samples (filtered and unfiltered) were kept in dark at 4 °C until further analyses, which were carried out within 24–48 h following collection. Unfiltered lake water from the 6-m integrated samples was placed into 120-mL amber glass bottles and preserved with Lugol’s iodine solution for further phytoplankton and ciliate counts. Zooplankton samples were collected using a 53-µm mesh net (diameter 0.3 m) with a flow meter (438115, HYDRO-BIOS, Germany) attached. The net was lowered to a 20-m depth and drawn vertically through the water column at an approximate speed of 1 m·s−1. After collection, zooplankton were transferred to 500-mL storage containers and anaesthetised with half an Alka-Seltzer® tablet to prevent ejection of eggs. The samples were then preserved in 70% v/v final concentration industrial methylated spirits (IMS). A fourth zooplankton sample was taken without the preservation step and kept alive for later gut evacuation and preparation for nutrient content analyses.
In addition, during the period of peak stratification (from May to August 2018), monthly water samples (n = 3, specifically on the 28th May, the 26th June and the 24th July) for phytoplankton and ciliate composition were collected at two discrete depths at the same time as the integrated samples to examine vertical patterns in plankton community composition. These samples were taken at 12 m (to represent the more stable, stratified zone below the surface mixed layer) and at 25 m (to represent hypolimnetic water below the thermocline) and were collected with a standard peristaltic pump and a pre-rinsed weighted silicone tube.

2.3. Chlorophyll a and Nutrient Analyses

Chlorophyll a analysis was carried out on 2 L triplicate samples from the integrated water sample filtered through GF/F filters and extracted with ethanol, with absorbance read in a spectrophotometer (UV-1800, Shimadzu, Germany) at 665 and 750 nm, with a 1 cm cuvette [76]. Total nitrogen samples were analysed in a certified external laboratory (Aquatic Services Unit, University College Cork, Ireland) with a flow injection analysis system (Quickchem® 8500, Lachat Instruments, Germany) on unfiltered water after a persulfate oxidation digestion step (method detection limit of 0.1 mg N·L−1) [77]. Total phosphorus was analysed on unfiltered water samples using the molybdenum blue method, with absorbance read in a spectrophotometer (UV−1800, Shimadzu, Germany) at 882 nm, with a 5 cm cuvette, following a digestion step with potassium persulfate (K2S2O8) under pressure and temperature (autoclave for 30 min at 15 psi and 121 °C) (method detection limit of 1 μg P·L−1) [76,78]. Total phosphorus analysis was carried out in triplicate using standard curves with certified reagents and quality controls using separate reagents to assess the performance of the analytical method.
Seston carbon (C), nitrogen (N) and phosphorus (P) content was analysed from lake water passed through a 53-μm mesh to remove zooplankton and filtered onto pre-combusted and weighted GF/F filters. For zooplankton community nutrient content analyses, the fourth un-preserved zooplankton sample was transferred to 2 L of filtered (0.45 μm) lake water for approximately four hours to evacuate their gut. After gut evacuation, zooplankton fraction was rinsed with Milli-Q water and divided into six equal, well-mixed sub-samples and filtered onto pre-combusted and weighted GF/F filters. All GF/F filters (seston and zooplankton fractions) were immediately dried at 60 °C for 24 h. Triplicate filters for C and N analyses were measured using an elemental analyser (vario EL cube, Elementar®, Germany). The standard reagent used for this analysis was Acetanilide (C8H9NO) with a composition of 10.36% of N and 71.09% of C. Triplicate filters for P content were determined as specified for TP water analysis with an additional pre-step of combusting the filters at 550 °C for 2 h to ensure the seston and zooplankton organic matter would break down during the persulfate digestion step [78,79]. A blank filter per replicate was considered for all C, N and P analyses.

2.4. Phytoplankton Community Identification and Enumeration

Identification and counting of preserved phytoplankton samples was carried out following the technique developed by Utermöhl [80]. Preserved phytoplankton samples were well mixed before transferring them to a 25-mL sedimentation chamber. Chambers were settled for at least 18 h. Identification and enumeration were performed under an inverted microscope (Leica® Microsystems, Ireland). A camera linked with the microscope enabled accurate phytoplankton measurements from images by using a calibrated stage micrometre available in the Leica Application Suite imaging software (LAS V4.12). Two counts were carried out on each sample, a count of large species at x40 magnification, and a high magnification count at x400 for small species. At x40 magnification, the whole chamber was counted to include large species or colonies which may not be numerous enough to be captured by the subsequent count at high magnification. Counts at x400 magnification were carried out over two transects of the chamber base. Samples were identified to genus and species level when possible [81,82]. Biovolumes were then calculated in order to compare the relative contributions of different algae samples [83]. This was done by multiplying the number of cells for each species present in a sample by its average cell volume. Average cell biovolume was calculated by measuring 10–20 individuals of each species from each sample. Fewer individuals were measured for rare species.

2.5. Zooplankton Community Identification and Enumeration

Preserved zooplankton samples were sieved into a 53-μm mesh and washed with deionized water to remove IMS. The zooplankton fraction was then transferred into a graduated volumetric cylinder and diluted to 40–100 ml, depending on the density of the sample. A minimum of 10% of the final volume was then identified and counted by transferring a 5-mL sub-sample, using a wide-bore 5-mL pipette, to a Ward rotary chamber [84]. Sub-samples were counted under a stereoscope microscope (SZX16, Olympus®, Germany). Zooplankton individuals were identified to groups (cladocerans, copepods and rotifers) and to genus level or species level where possible [85,86]. For biomass calculations, the lengths of, at least, the first 50 individuals encountered in a sub-sample were measured using a calibrated ocular micrometre. Copepod total body length was measured from the top of the head to the base of the caudal rami. Cladoceran total body length was measured from the top of the head to the tip of the abdomen, not including spines or projections. Taxa abundance was converted to biomass using regression formulae relating length to weight, calculated for individuals from the most abundant taxa in Lough Feeagh [87], using formulae from previous studies in Irish lakes [88], or from the literature [84,89].

2.6. Data Analyses

For the high-frequency data collected on Feeagh buoy (AWQMS), a QA/QC was applied to account for data gaps, calibration periods or any sensor problems [74]. Data was then transformed from sub-daily (recorded every few minutes) to daily data (daily averages) using the subdaily2daily function from the hydroTSM package in R [90]. Schmidt stability was calculated using lake water temperature profile data, Feeagh bathymetry and wind speed as input files to the rLakeAnalyzer package in R [91]. Schmidt stability was used as a physical index indicative of the resistance of Lough Feeagh to mixing (e.g., a value of 0 implies that a water column is fully mixed with units of amount of energy required to fully mix a water column per lake area) [92]. Mixed layer depth (MLD) was defined as the depth where the water density was 0.1 km·m−3 greater than the shallowest sensor depth, which, based on the findings from Wilson et al. (2020), is a robust method for temporal analysis in Lough Feeagh [93]. Quantifying the changes of the estimated MLD of Lough Feeagh over the study period was used to better characterise the physical impacts of the extreme-weather-related events in the lake which, in turn, had implications for chemical and planktonic community dynamics [94]. Based on the summer 2018 lake stability pattern, the period under study was divided into three phases (pre-, intermediate and post-Storm Hector). Pre-storm conditions were delineated by the initial heat wave (28th May–13th June); this was followed by an intermediate period dominated by the arrival and aftereffects of Storm Hector (14th June–3rd July) and, finally, the post-storm period was represented by a return to stable conditions, with high Schmidt stability values (4th–15th of July).
Metabolic estimates were calculated using the maximum likelihood estimation method (mle) from the LakeMetabolizer package in R [95]. Two-minute time step changes of Lough Feeagh epilimnetic DO (0.9 m), water temperature, photosynthetic active radiation (PAR) and wind speed for the study period (April–October 2018) were used for producing daily GPP (positive values), R (negative values) and NEP (GPP + R) metabolism estimates. Daily values of air-water oxygen exchange velocity (k600) were calculated following Cole and Caraco (1998) [96]. Regarding daily metabolic estimates calculated from DO values at 0.9 m of Lough Feeagh, only the sub-period from the 28th May to the 15th July was used, comprising similar days for the pre-, intermediate and post-storm event phases. Days with negative values of GPP or positive values of R were removed from the dataset. The non-parametric Kruskal–Wallis test and a following pairwise multiple comparison Dunn’s test for determining which groups differ from others [97,98] were performed to test for statistical differences between periods (pre-, intermediate and post-storm event) on metabolic estimates using the FSA package in R [99].
Point loadings (L) from the main inflow rivers were calculated by multiplying the concentration from the biweekly grab sampling nutrient concentrations by the daily average flow on the day the sample was collected [100] (Equation (1)). In turn, biweekly nutrient ratios of total inflow loadings were calculated as the sum of the Glenamong and Black rivers’ nutrient loadings, converted to molar concentrations to make it possible to calculate nutrient ratios.
L = K · V d · C d
where L is the nutrient loading in tonnes (t) or kilograms (kg) per day; K is the factor to convert milligram or microgram concentrations to t or kg; Vd is the daily cumulative streamflow in litres (flow in L·s−1 multiplied by 86,400 s·day−1); and Cd is the grab sampling nutrient concentration measured on the streams each specific day. Spearman’s rank correlation coefficient and significance of the correlation between inflow and in-lake TN:TP ratios were carried out with the Chart.correlation function of the PerformanceAnalytics package in R [101].
Nutrient N:P imbalances were calculated as the N:P of the seston fraction minus the N:P of the zooplankton community fraction. Elemental nutrient imbalances can provide an indication of the magnitude of potential food quality constraints for the zooplankton community. Therefore, elemental imbalances close to 0 would indicate no food quality constraints, whereas values at variance from 0 (positive or negative values) indicate possible food quality constrains for the zooplankton community [61]. Shannon diversity index for phytoplankton and ciliate community was calculated with the diversity function of the vegan package in R [102] using abundance data based on the lowest taxonomic group possible [103]. All R analyses were performed in version 3.6.1 [104].

3. Results

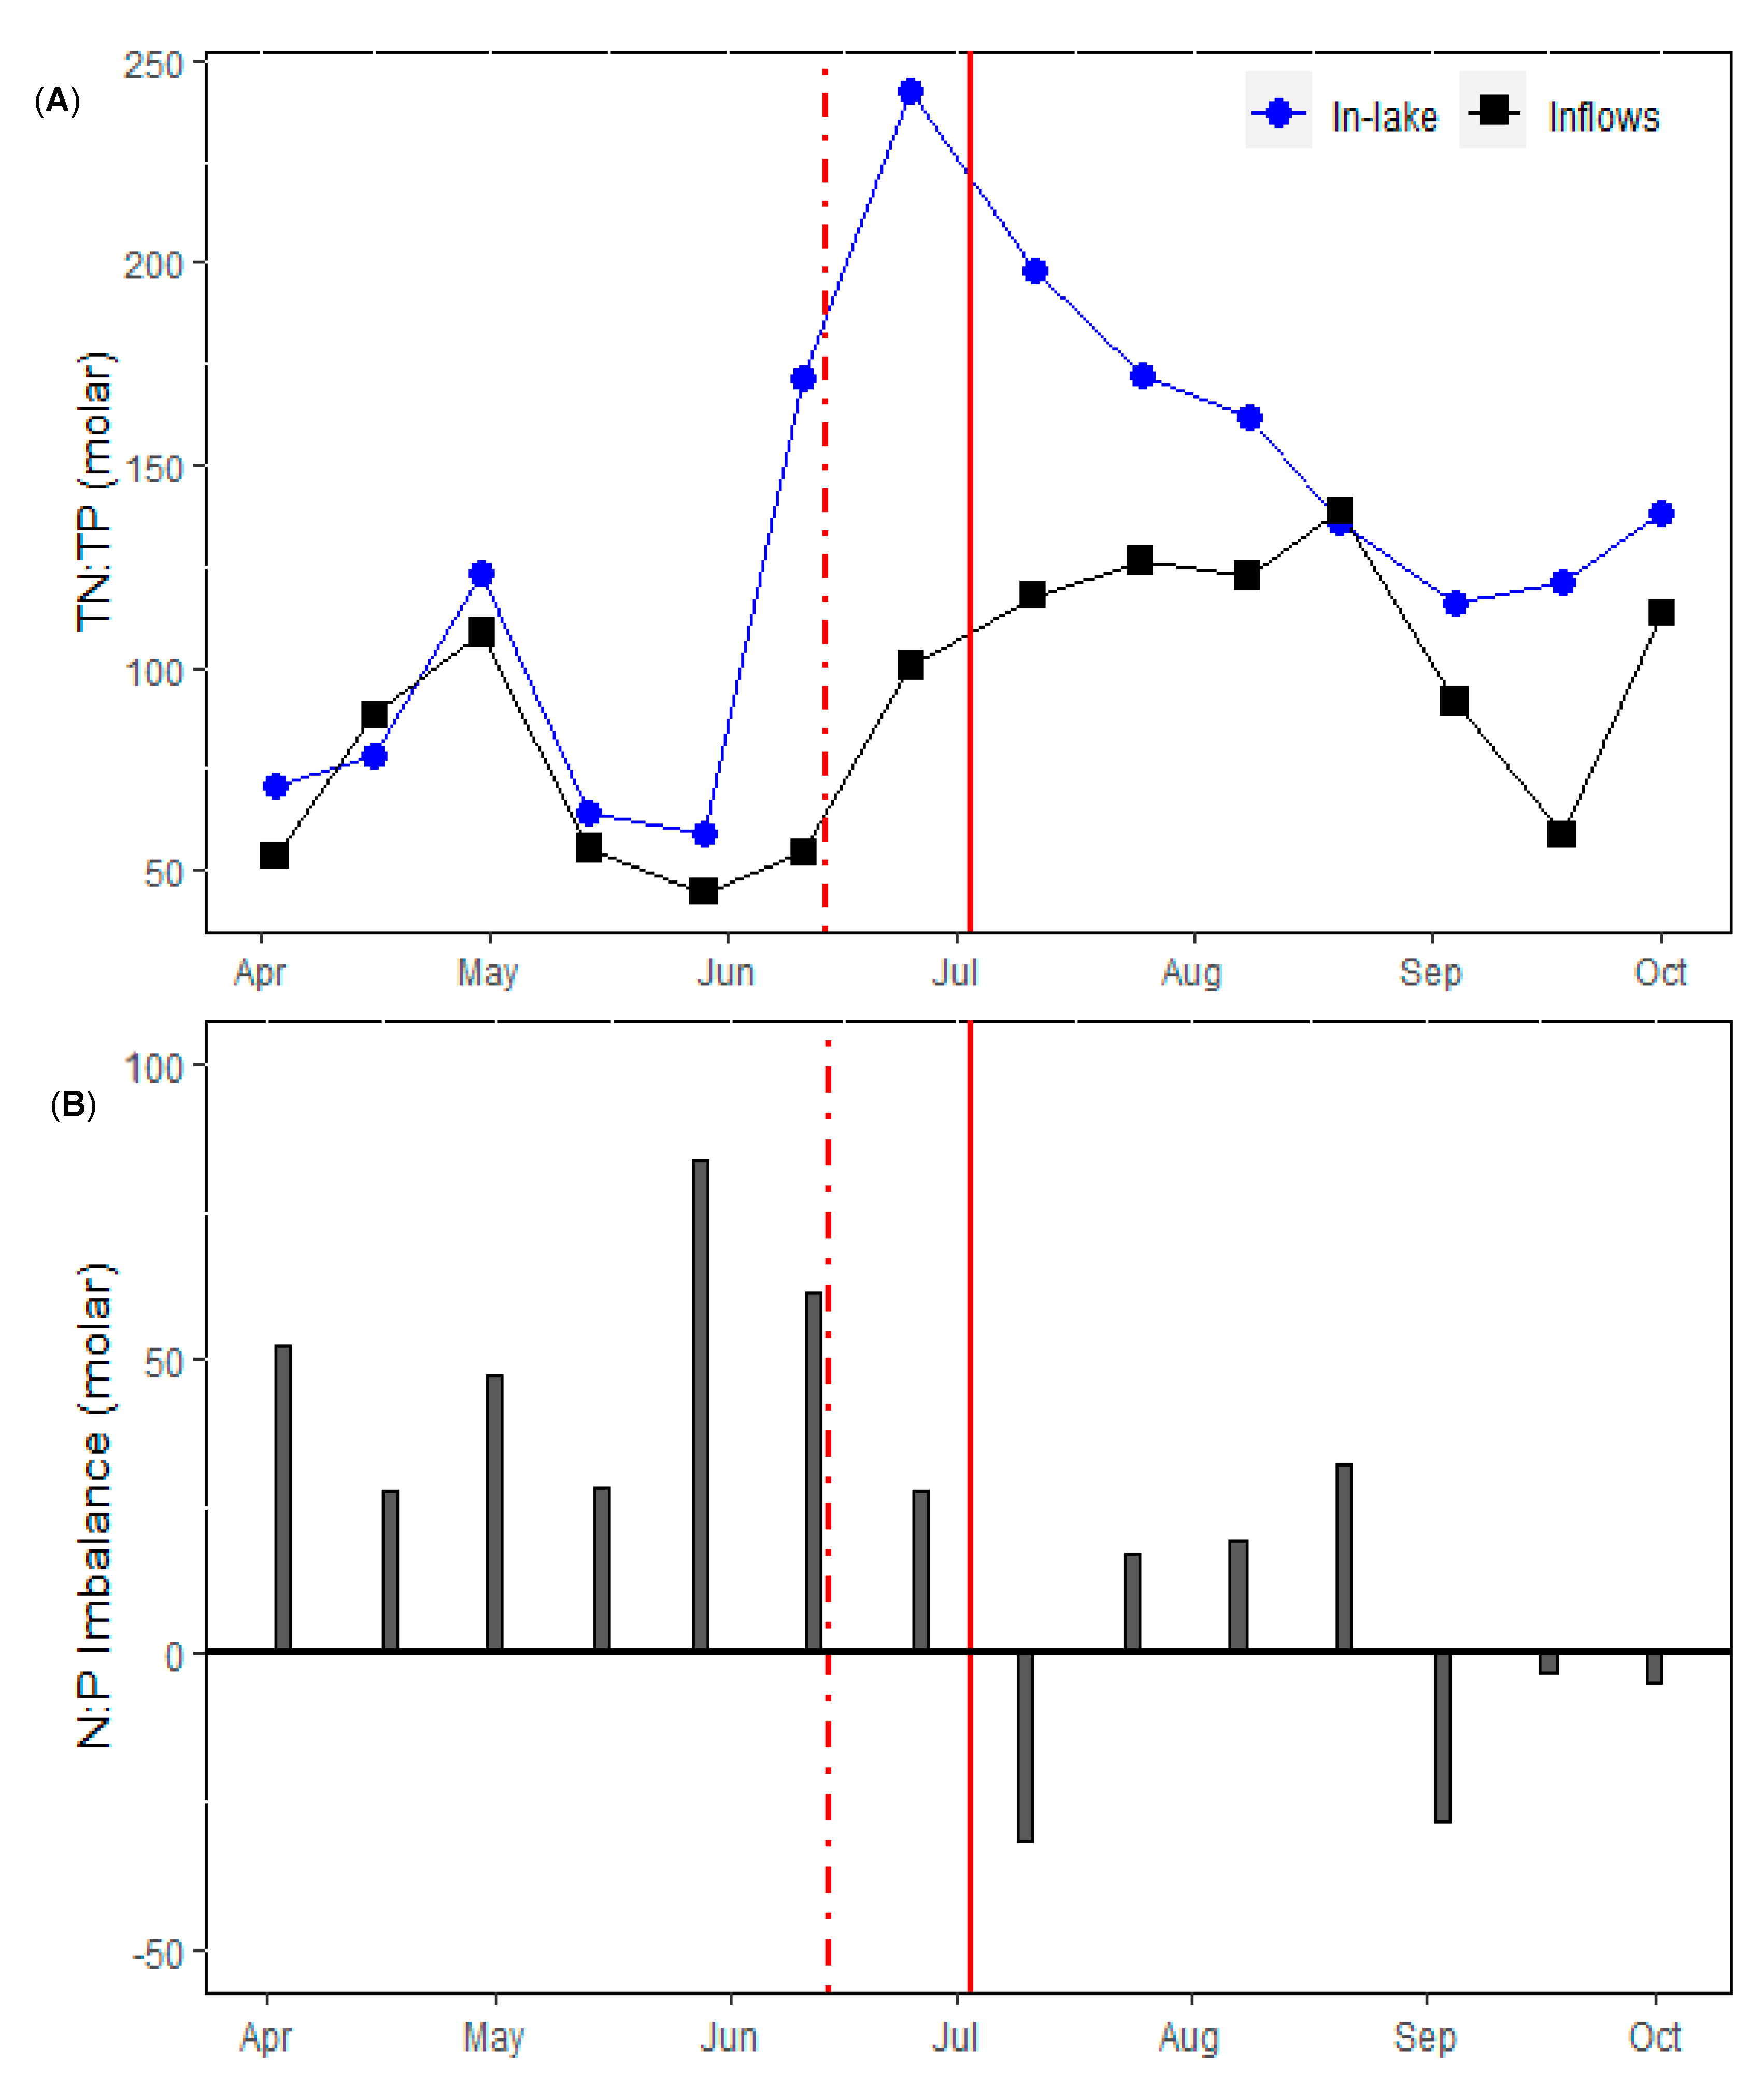
3.1. Physical and Nutrient Dynamics

During summer 2018, high pressure (>1013 mbar) dominated over Ireland and, as a consequence, the country experienced unusually dry and warm conditions from the middle of May to the 12th June compared to the previous 15-year average during this time period (Figure 2A,B). Between the 13th and the 19th June, Storm Hector brought heavy rain and strong winds across Ireland as well as a significant drop in mean daily air temperatures (Figure 2). There was an accumulation of 64 mm of precipitation during these 7 days, which occurred after 11 days and was followed by 20 days with no rain (0 mm·day−1) (Figure 2B). On the 14th June 2018, coinciding with the arrival of Storm Hector, wind speed reached a daily mean value of 9.6 m·s−1 (Figure 2C), with maximum gusts of 26.91 m·s−1 [75]. After Storm Hector, from the 21st June to the 12th July, high pressure stretching from the Azores to Scandinavia brought very warm and dry conditions, during which a maximum air temperature of 29.8 °C on the 27th June was recorded at the study site (Newport Furnace, Met Éireann weather station) (Figure 2A).
Thermal stratification was recorded in Feeagh from mid-May as a result of the increasing air temperatures and calmer weather conditions (low precipitation and wind speeds) recorded at that time. This resulted in a sudden increase in Schmidt stability (St), reaching values above 400 J·m−2 from the 1st June and a maximum of 548.25 J·m−2 recorded on the 7th June (Figure 3A). With the arrival of Storm Hector on the 14th June, strong winds and a decrease in surface heat input from the atmosphere led to a decline in St values to 192.52 J·m−2 (three-fold reduction). After two weeks, stable stratification was again observed in the Feeagh water column, with the maximum St value of 669.41 J·m−2 reached on the 30th June. Schmidt stability remained well above the 15-year average throughout July 2018 (>510 J·m−2) (Figure 3A). The mixed layer deepened from 6.5 m before the storm to 16 m on the 21st of June, highlighting a deepening of the mixed surface layer to a maximum of 9.5 m during the intermediate period (Figure 3B). From July onwards, the mixed layer gradually deepened from 2 m on the 3rd July to 42 m by the end of September, when the lake became fully mixed again and there was a complete breakdown of the water column stratification (Figure 3B).
Daily estimates of epilimnetic (0.9 m) lake metabolism (GPP, R and NEP) were calculated for each of the respective periods. Reliable estimates were produced for 27 days out of a possible 49 days (55.10%) within the sub-period under study (28th May–15th July) and between 7 and 10 observation days (n) for each specific period. Pre- and post-storm values of R and NEP were significantly different from the intermediate period (Kruskal–Wallis test and Dunn’s post hoc test, p < 0.05) (Figure 4). Respiration increased while NEP decreased, corresponding to a decrease in GPP during the mixing event linked with extreme-weather-related conditions. The resulting NEP estimates were nearly always negative, but clearly higher during the periods with calm and hot sunny days (early June and early July) (Figure 4).
The nutrient ratios (TN:TP) of Lough Feeagh and the inflowing streams ranged from 44 to 243 from April to October 2018 (Figure 5A), and were strongly correlated (ρ = 0.64, p < 0.05, n = 14). However, a decoupling of nutrient ratios between the inflowing streams and Lough Feeagh was observed to begin to occur during Storm Hector in June, with TN:TP concentrations in Lough Feeagh much higher relative to TN:TP loading from the inflows (Figure 5A). At the same time, nutrient imbalances between seston and zooplankton were positively different from 0, indicating potential P limitation for the zooplankton community during the pre-storm period (Figure 5B). Later on, following the Storm Hector mixing event, there was a step change from P to N nutrient constraints for primary consumers, when nutrient imbalances were negative on the 10th July and remained closer to 0 from the end of July until October (Figure 5B).

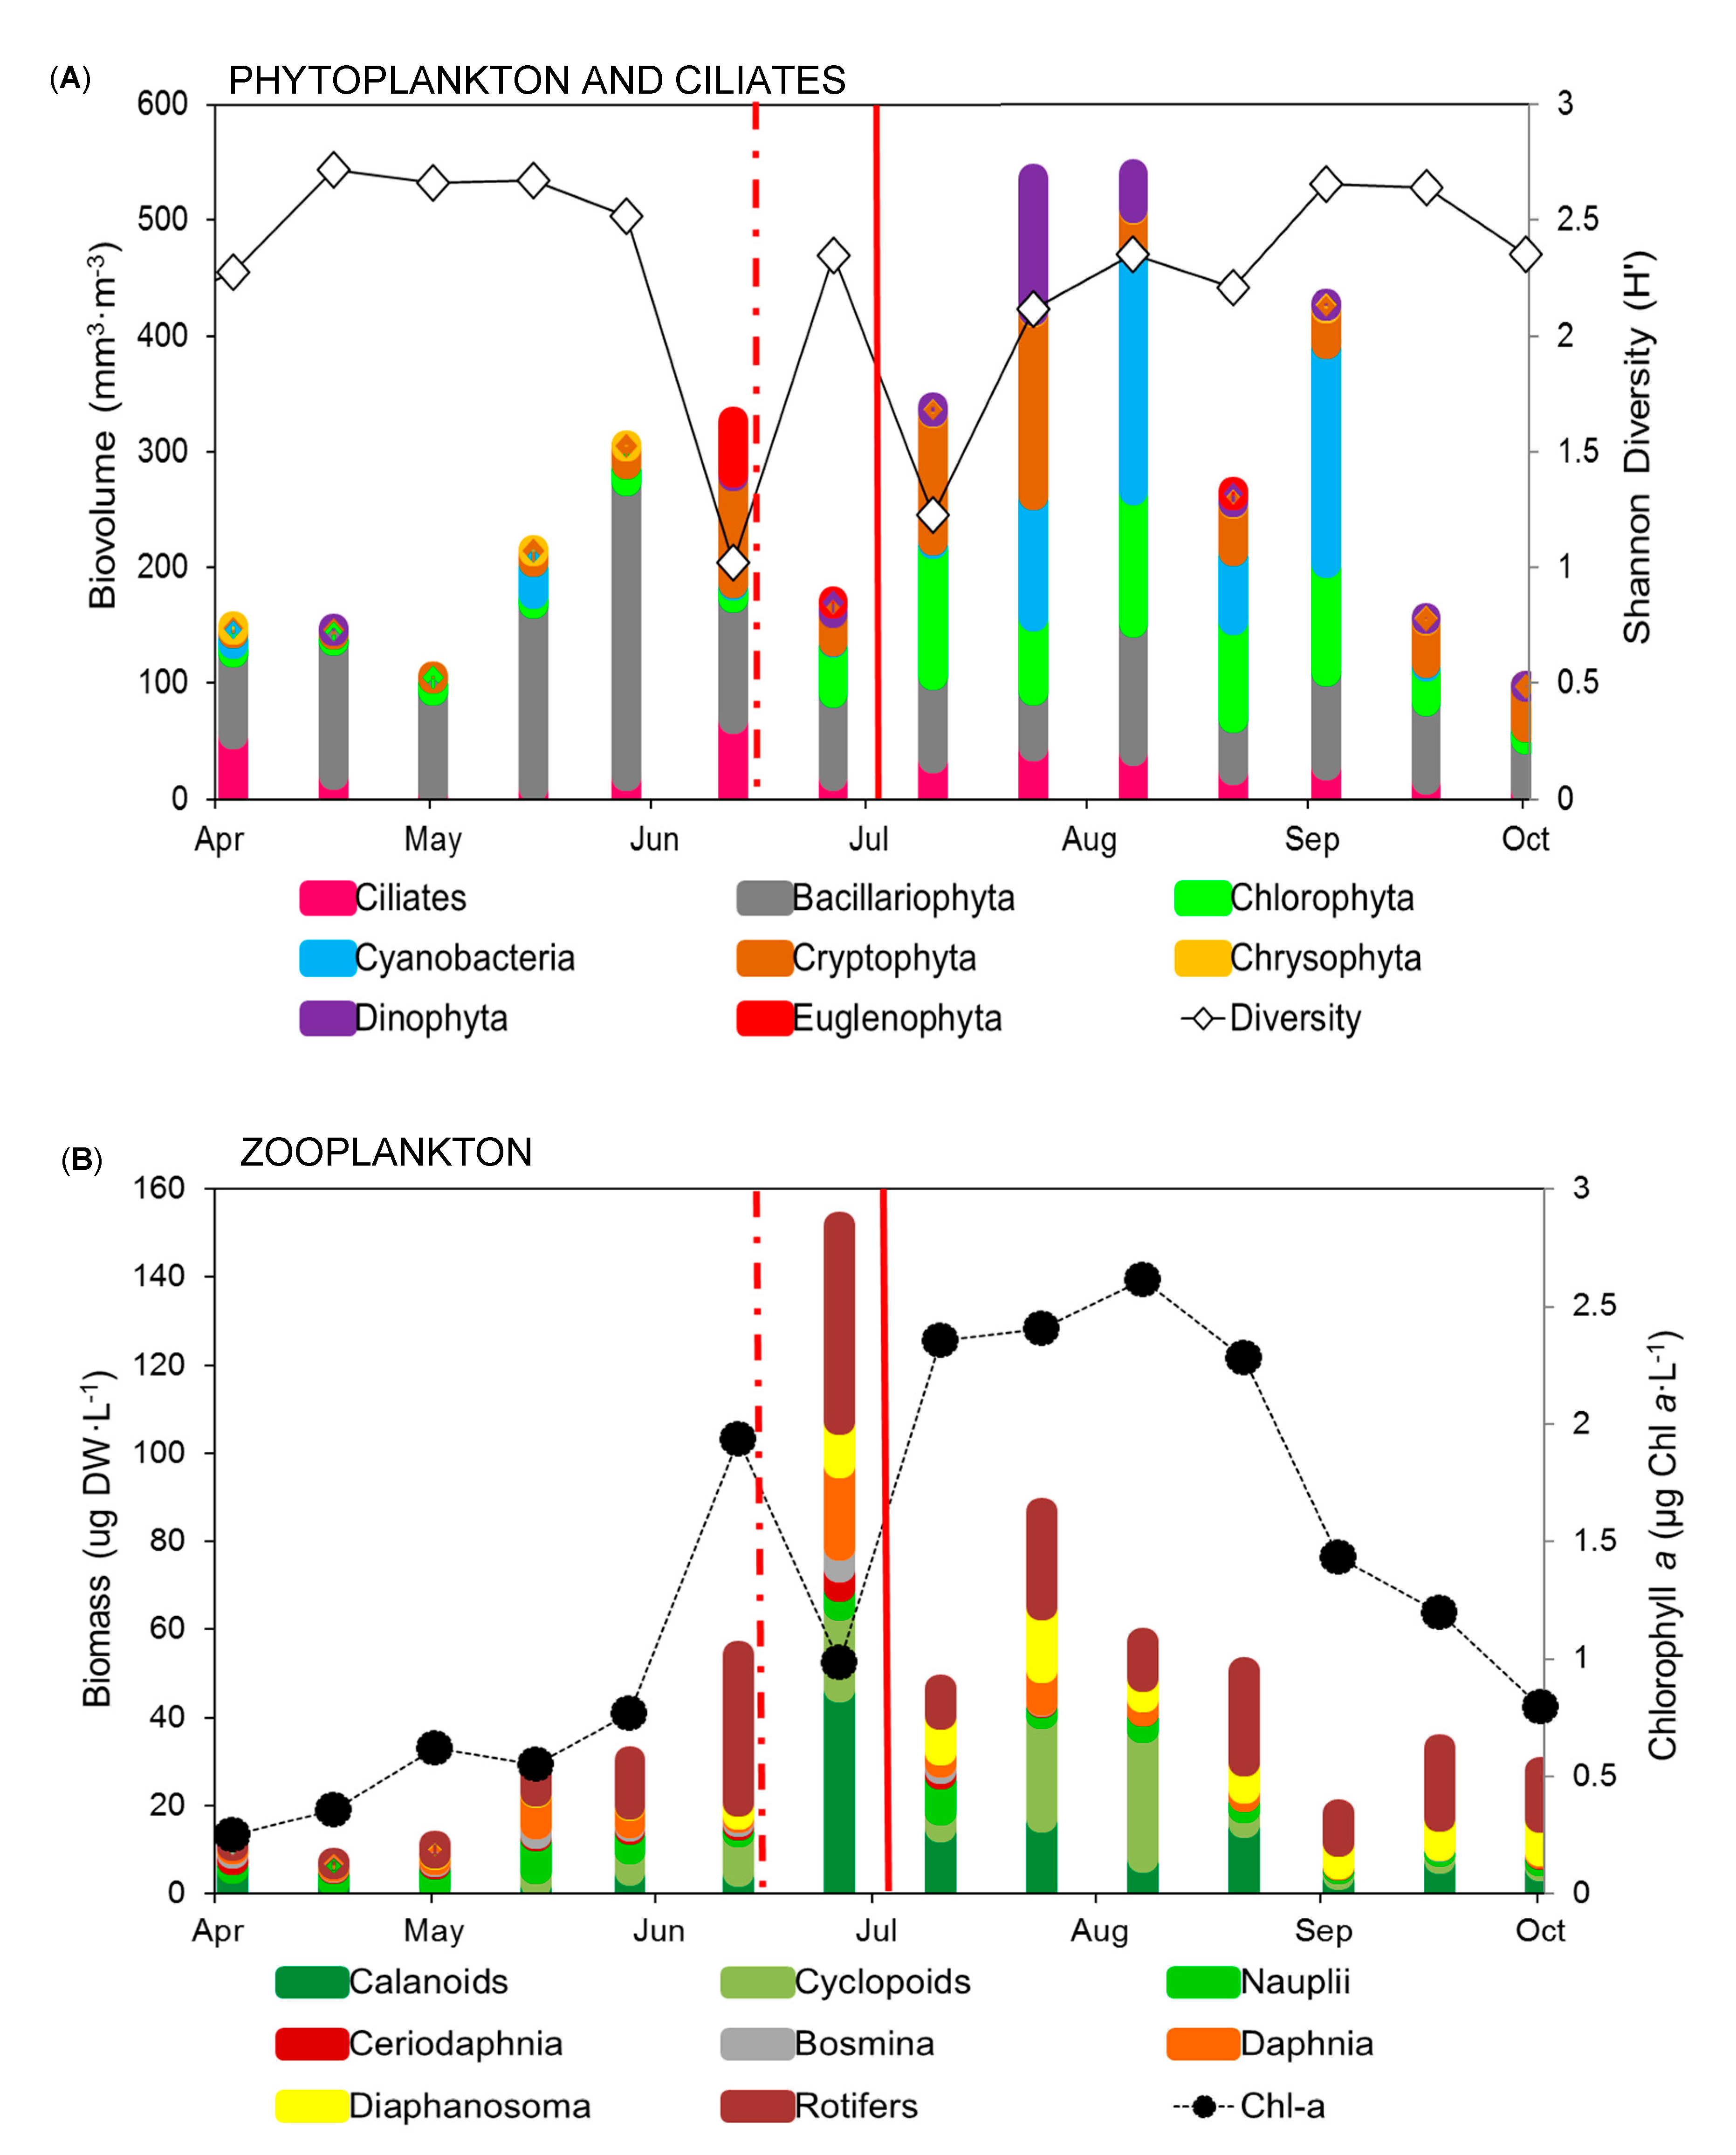
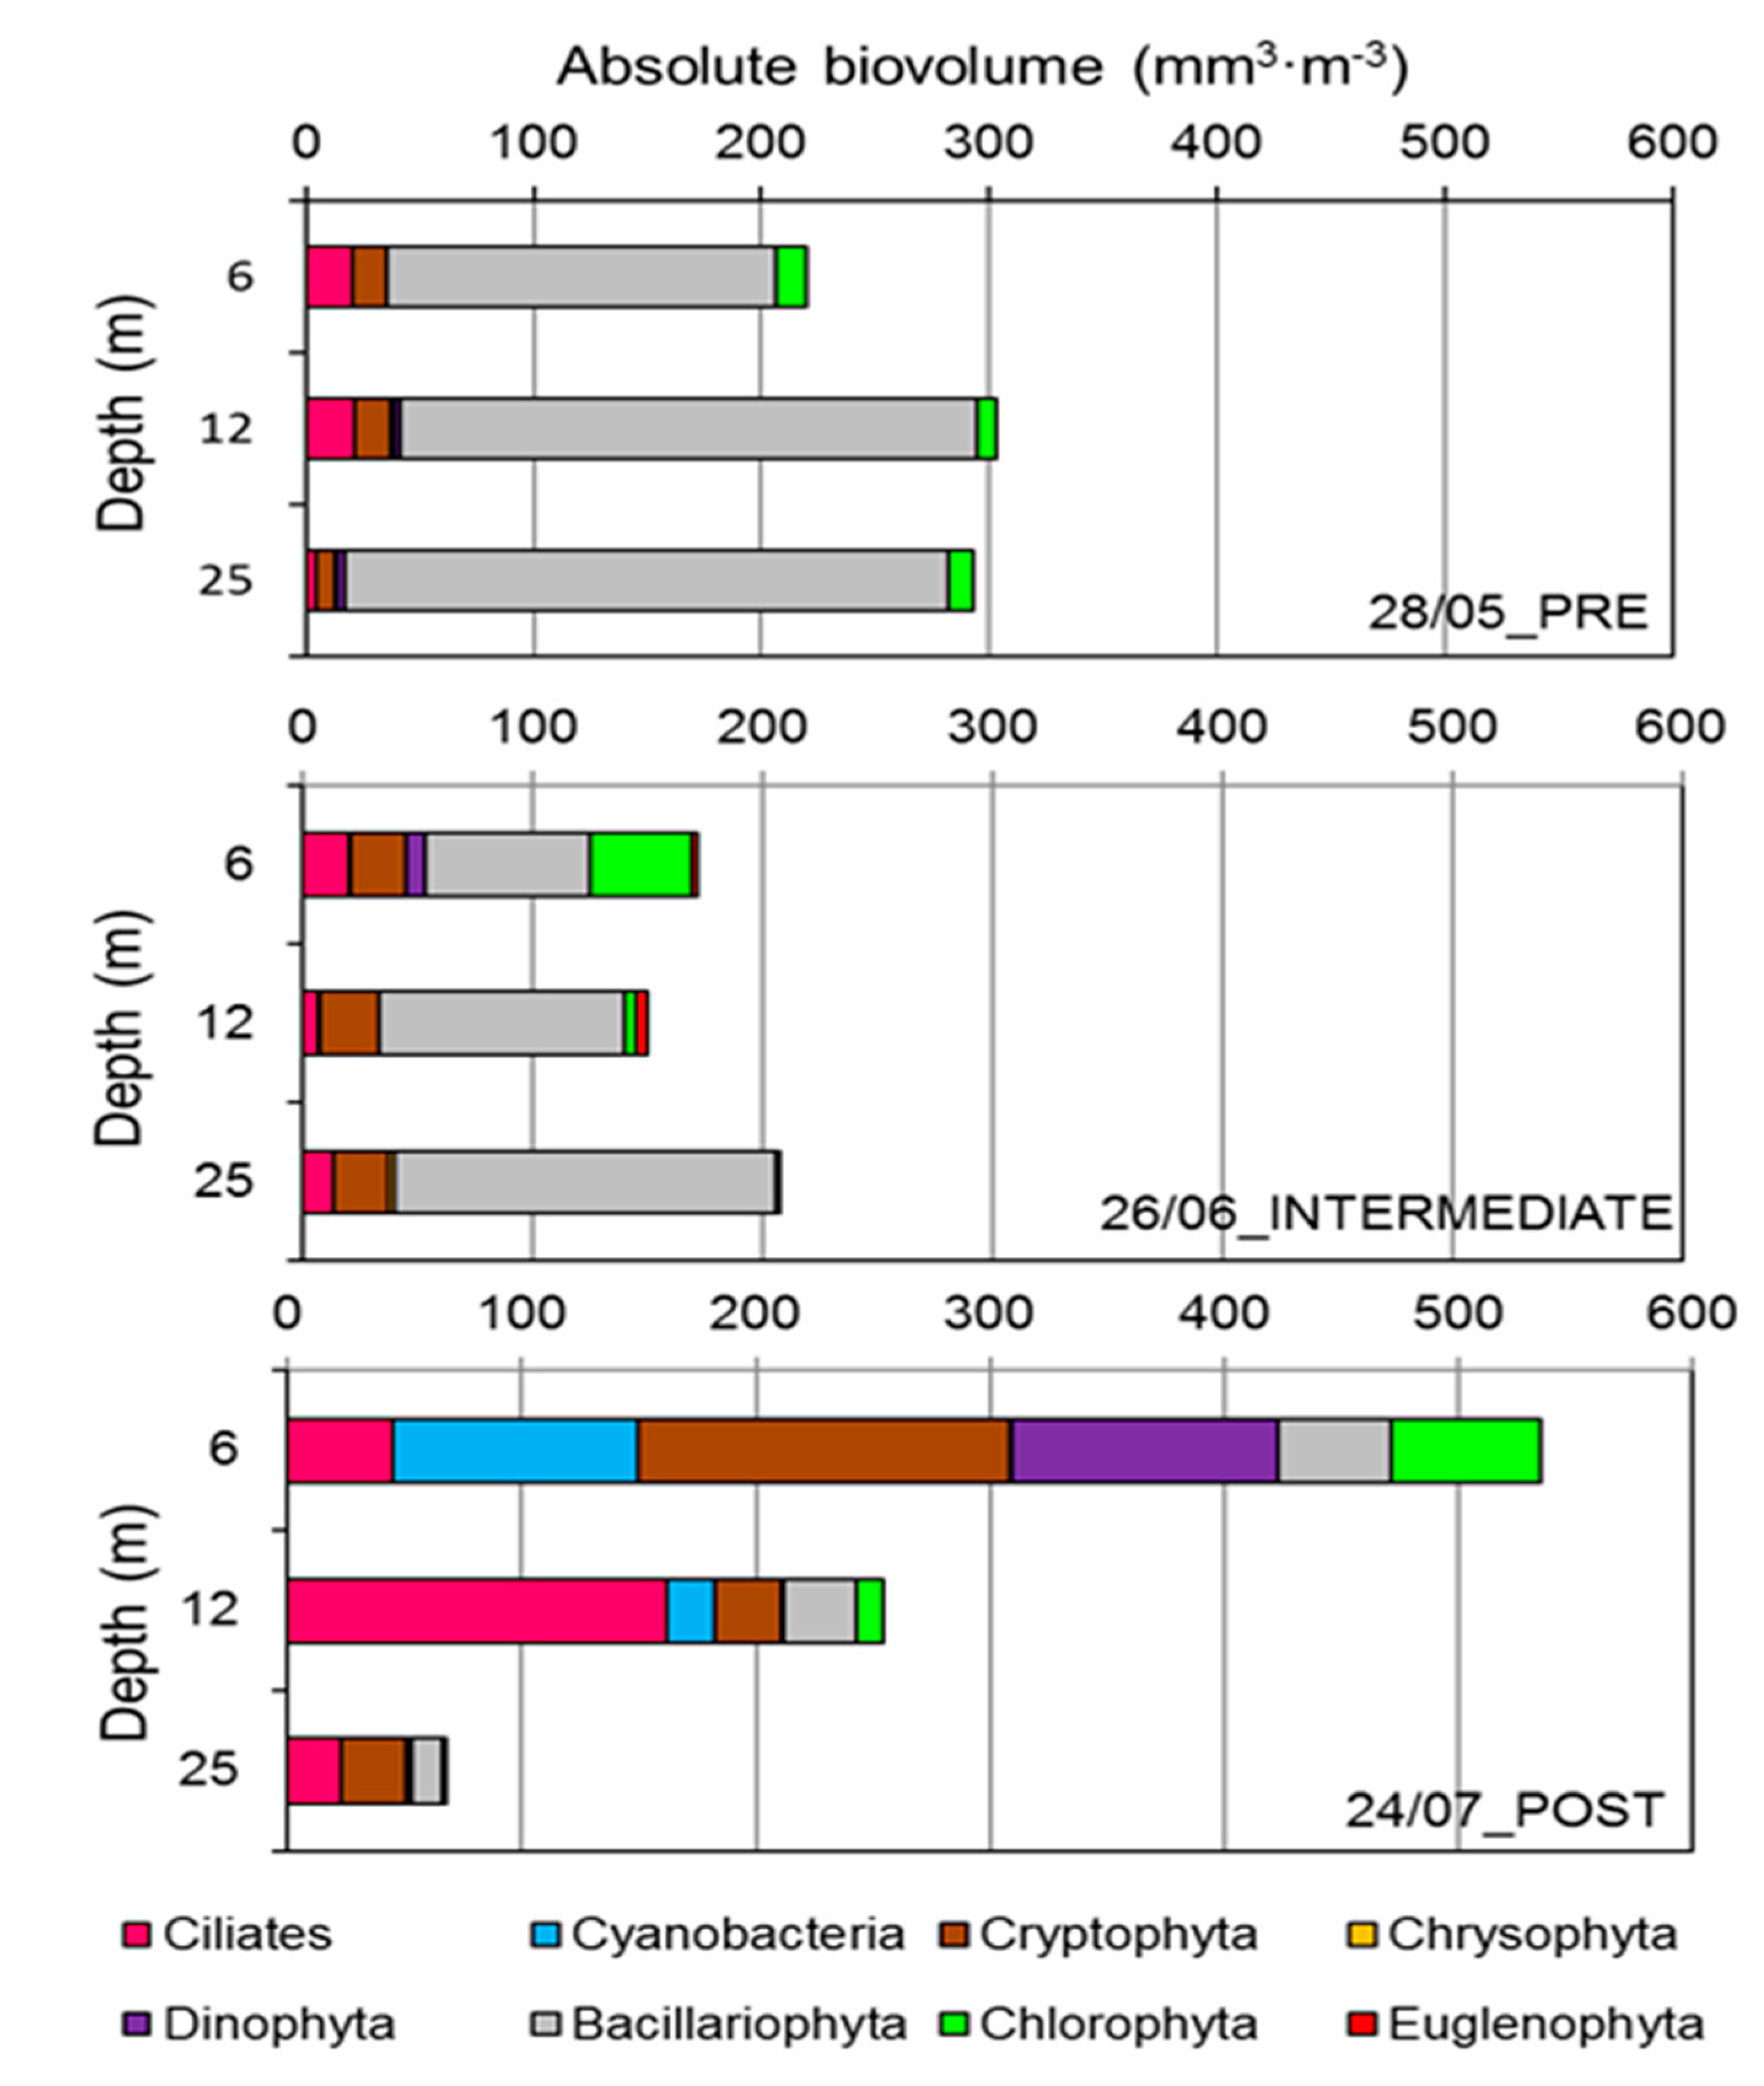
3.2. Phytoplankton and Ciliate Dynamics

Chlorophyll a concentrations in Lough Feeagh ranged from 0.76 to 2.61 μg Chl a·L−1, Shannon diversity ranged from 1.02 to 2.66, and phytoplankton community biovolume ranged from 97.81 to 539.74 mm3·m−3 during the study period (April to October 2018). Increases in phytoplankton biovolume occurred as soon as St increased above 400 J·m−2, which was a consequence of the warm and calm meteorological conditions. In addition, from the end of May to mid-June (pre-storm period), Chl a, phytoplankton and ciliates biovolume quickly increased to maximum values of 1.93 μg Chl a·L−1 and 325.97 mm3·m−3, respectively. However, phytoplankton diversity decreased 2.5-fold during the first heatwave at the beginning of June (Figure 6). From April to the end of May (mean ± SD, n = 5), the system was clearly dominated by Bacillariophyta (diatom bloom), with a biovolume of 134.48 ± 73.48 mm3·m−3 (71.96 ± 13.86% of relative biovolume) in the top 6 m water column (Figure 6A), but also at deeper layers (12 m and 25 m), with an average biovolume of 259.11 mm3·m−3 (86.95%) for that specific day (Figure 7, 28th May pre-storm). On the 12th June, just before Storm Hector, and at the end of the first heat wave, Cryptophyta, Euglenophyta and ciliates increased their biovolume to 92.28 mm3·m−3 (28.31%), 43.95 mm3·m−3 (13.48%) and 69.08 mm3·m−3 (21.19%), respectively. In turn, Bacillariophyta biovolume decreased to 105.09 mm3·m−3 (32.24%). Specifically, there was a relatively large and rapid increase in Plagioselmis nannoplanctica (Crysophyta), Trachelomonas volvocina (Euglenophyta) and Strobilidium sp. (large ciliates), decreasing Shannon diversity index from 2.51 to 1.02 (Figure 6A).
After the Storm Hector event (12 days post-storm), although there was a recovery in phytoplankton Shannon diversity to maximum values of 2.35, Chl a, phytoplankton and ciliate biovolume decreased, dropping to the minimum values for the study period (0.98 μg Chl a·L−1 and 171.1 mm3·m−3, respectively; Figure 6). By comparing phytoplankton community changes between the 12th (pre-storm period) and the 26th (intermediate period) June, it was observed that Cryptophyta and ciliates decreased to biovolumes of 24.72 mm3·m−3 (14.45%) and 19.50 mm3·m−3 (11.40%), respectively, while Chlorophyta biovolume started to increase to 44.00 mm3·m−3 (25.71%) in the top 6 m layers (Figure 6A).
From July onwards, the system restabilised and remained stratified until the autumn turnover period at the end of September (Figure 3). These repeated warm and calm conditions at a later stage of the phytoplankton seasonal dynamics resulted in another increase in Chl a concentrations, reaching a maximum of 2.61 μg Chl a·L−1 in August, but coinciding with another Shannon diversity minimum (1.22) on the 10th July (Figure 6), when the system was dominated by Plagioselmis nannoplantica in the Cryptophyta group and Botrycoccus brunni in the Chlorophyta group. Immediately following the restabilisation period (10th July), there was an increase in Chlorophyta biovolume to 113.03 mm3·m−3 (33.39%) and, again, Cryptophyta biovolume increased to 110.30 mm3·m−3 (32.58%). On the 10th July, total biovolumes reached similar values to pre-storm conditions (338.51 mm3·m−3). In turn, on the 24th July, total biovolume reached maximum values of 535.49 mm3·m−3 coinciding with Dinophyta (Gymnodinium sp. and Ceratium sp.) and cyanobacteria (Woronichinia naegeliana and Anabaena flos-aquae) biovolume increases to 113.38 mm3·m−3 (21.17%) and 104.29 mm3·m−3 (19.47%), respectively (Figure 6A).
In contrast to what was observed on the 26th June, with similar total biovolumes at different depths (Figure 7, 26th June intermediate), on the 24th July (post-storm period), phytoplankton cells were more concentrated within the first top 6 m from the surface, representing a decrease from 535.49 to 254.63 mm3·m−3 of total biovolume at 12 m and to 67.97 mm3·m−3 at 25 m, respective to the 6 m integrated water sample taken on the same sampling day. Despite the lower biovolumes recorded at the bottom layers relative to the top 6 m layer, the bottom layers were highly dominated by ciliates and Cryptophyta taxa (Figure 7, 24th July post-storm). On the 7th August, cyanobacteria reached their maximum biovolume, corresponding to 210.46 mm3·m−3, an unprecedentedly high value for this lake [10], and this was mainly a consequence of large aggregates of Woronichinia naegeliana. In turn, from late July onwards, the Shannon diversity index increased again to a maximum value of 2.65 for the study period on the 3rd September (Figure 6A).

3.3. Zooplankton Dynamics

From April to October 2018, total zooplankton biomass in Lough Feeagh ranged from 7.33 to 151.92 μg DW·L−1 (Figure 6B). From mid-May to just before Storm Hector, total zooplankton biomass started to increase, coinciding with the initial peak in Chl a at this time. Nevertheless, total crustacean biomass remained below 20 μg DW·L−1, with rotifers dominating zooplankton biomass (Figure 6B).
In contrast, after Storm Hector at the end of June (intermediate period, 26th June), all zooplankton groups increased their biomass, achieving maximum values of 151.92 μg DW·L−1. In particular, calanoids (mainly Eudiaptumus gracilis) and Daphnia increased their biomass to 46.52 μg DW·L−1 (30.62%) and 18.89 μg DW·L−1 (12.44%), respectively (Figure 6B). Rotifers’ total biomass also increased, with a direct effect on Keratella and Tricocherca groups (specific rotifers genus not shown). This peak in total zooplankton biomass coincided with a decrease in both phytoplankton and ciliates biovolumes, and Chl a concentration. (Figure 6).
Once the lake restabilised and Chl a recovered to pre-storm conditions in the surface layer (6 m integrated sample), total zooplankton biomass decreased to 60.35 ± 18.11 μg DW·L−1 (July and August, n = 4) (Figure 6B). During that period, zooplankton community biomass was dominated by copepods (33.10 ± 10.59 μg DW·L; calanoids, cyclopoids and nauplii). In turn, Diaphanosoma and rotifer biomass remained around averages of 8.34 ± 4.2 μg DW·L−1 and 14.27 ± 8.10 μg DW·L−1, respectively. On the other hand, Daphnia biomass returned to minimum values of 3.75 ± 2.43 μg DW·L−1 (Figure 6B).
During September, lake stratification ended and Chl a decreased again to values below 1 μg Chl a·L−1. In that period (September, n = 3), total zooplankton biomass decreased to 26.52 ± 7.5 μg DW·L−1, mainly due to a sudden decline in calanoids and cyclopoids. On the other hand, rotifer and Diaphanosoma biomass remained stable with values of 11.26 ± 4.57 μg DW·L−1 and 6.56 ± 1.34 μg DW·L−1, respectively (Figure 6B).

4. Discussion

The work described here gives an insight into how a deep monomictic dystrophic lake situated on the Atlantic coast of Europe responded to sequential extreme weather events. To our knowledge, it is the first study reporting on planktonic community responses relating to the 2018 European heatwave, when Western Europe, in particular, experienced notably increased summer surface lake water temperature [52,64]. In turn, for the study site, Storm Hector was of particular interest, as it abruptly interrupted the heat wave conditions, with high temperatures and drought well outside the ranges normally recorded in Ireland. The physical structure of the Feeagh water column responded to the arrival of the first heat wave in the early summer season (late May–early June), with a rapid stratification of the water column (high Schmidt stability). Consequently, once Storm Hector arrived, Feeagh experienced a characteristic mixing event with a surface mixed layer deepening of 9.5 m at the end of June, never previously reported at this site [63]. Following Storm Hector, the anomalous pre-storm heat wave conditions returned, allowing an unprecedented isolated summer mixing episodic event in the middle of extremely high lake stability, for the site, to be examined.
The unusual lake stratification pattern presented in this study differed from another episodic flood event which occurred on the 2nd of July 2009 at the same site. Compared to the 2018 event, in 2009 there was a loss of Schmidt stability for the rest of the year and, despite the extreme nature of the event, the overall lake impact was considered relatively small [10]. In contrast, results from this study show that the mixing event induced by extreme continuous weather events drove a shift towards an increase in R and a decrease in NEP, despite the already natural heterotrophic conditions of the system [66]. In turn, a two-fold reduction in Chl a coincided with a three-fold reduction in lake Schmidt stability. In contrast, pre- and post-storm heat waves clearly encouraged fast growth of phytoplankton cells in the top water layers. As a consequence, an unexpected and atypical increase in cyanobacteria was observed at the end of July and beginning of August. In addition, observations of N:P imbalances for primary consumers in Lough Feeagh indicated a step change from P to N nutrient constrains following the mixing event in June. Furthermore, an increase in total zooplankton biomass during the intermediate period indicated a quick response to potential availability of more favourable food for primary consumers.
Metabolism estimates can provide a concise summation of the many effects of extreme meteorological events. In this study, we observed a significant increase in ecosystem R and a decrease in NEP during the intermediate mixing period, compared to pre- and post-storm warm and stable periods, which resulted in a slight decrease in GPP following Storm Hector. Similar to our study, some authors have also reported a decrease in GPP and an increase in R after flooding events, coinciding with an increase in bacterial biomass and a decrease in phytoplankton biomass and Chl a [10,44,46]. In contrast, results from thermocline-deepening experimental mesocosms, simulating the effects of storm events, showed that surface water GPP responded more strongly than R as a consequence of increased autotrophy driven by the proliferation of filamentous cyanobacteria released from light and nutrient limitation, resulting in an increase in NEP [43].
Phytoplankton primary production and bacterioplankton secondary production are influenced by bioavailable nutrients and, in turn, both processes support fluxes of energy and matter to higher trophic compartments [105]. In freshwater ecosystems, a range of organic and inorganic species of N and P co-occur. Both the amounts and stoichiometry of the total bioavailable resources determine nutrient limitation patterns in planktonic communities [23]. Taking into account that bulk TN:TP resources often vastly overestimates the corresponding bioavailable resources [105], in this study, we found similar in-lake and inflow river nutrient ratios, suggesting that lake water chemistry was highly influenced by nutrient loadings from the surrounding catchment, as observed in other studies [100]. In contrast, following Storm Hector, there was a decoupling period of TN:TP patterns of in-lake and inflowing streams lasting for 2 months (from mid-June to mid-August), with higher TN:TP values recorded in the lake compared with the inflowing rivers. Previous studies have concluded that, in general, TN:TP ratios are relatively higher in lakes than in their inflow streams, in part likely owing to enhanced water column primary production and microbial activity [106]. In addition, Sadro and Malack (2012) reported a disproportionally larger increase in nitrate loading during an extreme rain event, causing a substantial increase of in-lake dissolved inorganic nitrogen:total phosphorus ratio (DIN:TP) [46]. Another study suggested that storm events disproportionately mobilize P compared to N, contributing to reduction in N:P loading to the receiving water bodies [19]. Nevertheless, as Storm Hector in Feeagh mainly influenced the stratification pattern, instead of being characterised by an event that increased catchment nutrient runoff, the enhanced difference between inflow and in-lake total nutrient ratios seemed to be driven by internal biological dynamics accentuated, in turn, by the loss of lake stability, as suggested by Maranger et al. (2018) [106].
Phytoplankton community composition appeared to follow the natural seasonal succession expected for a dystrophic low-productivity lake such as Feeagh [65]. However, while cyanobacteria blooms have previously been linked to increases in water temperature and high stability [107,108,109,110], directly associated with extreme weather events [31,111], and associated with the depletion of available nitrogen [111,112,113,114], the higher cyanobacteria biomass that we found has rarely been seen before in Feeagh [10]. Woronichinia naegeliana appeared to take advantage of post-storm warm and calm conditions in Lough Feeagh. This cyanobacteria species is one of the most commonly associated with toxic cyanobacteria blooms [115]. It is not capable of fixing atmospheric nitrogen, but it is very efficient at taking up other dissolved fractions, with cells usually taking advantage when N concentrations are limiting to other algae [116]. A decrease in turbulent diffusion was shown to be the dominant environmental parameter determining the timing of phytoplankton development, together with an increase in water temperatures when light is limited (e.g., brown lakes such as Feeagh) [25]. Therefore, despite storm events disrupting the stability of the systems, if the persistent calm conditions of this study occur more frequently [4], a quick return to thermal stratification will potentially increase cyanobacteria biomass, even in lakes with low inorganic nutrient concentrations and high water colour [117].
In addition to cyanobacterial increases, a wide range of effects on phytoplankton community composition after physico-chemical lake changes driven by episodic meteorological events have been reported [118]. In accordance with our study, Havens et al. (2011) observed that, unlike previous documented effects of hurricanes, where increased N inputs stimulated primary productivity, a substantial reduction in phytoplankton biomass occurred, coinciding with a large decline in mean irradiance in the mixed layer and increases in phytoplankton grazers [55]. In this study, an increase in the biomass of grazers also simultaneously occurred with a decrease in phytoplankton biomass at different depths, particularly the Cryptophyta group, which is considered a high-quality food for primary consumers [119,120], and is highly selected by copepods [121]. In addition, ciliates, which can be a significant part of the copepod diet [122], also declined, which may have potentially led to a release of predation on bacteria resulting in an increase in ecosystem respiration [123]. Therefore, the increase in total zooplankton biomass during the intermediate period would support the idea that phytoplankton and ciliates experienced higher grazing pressure during the mixing event, in addition to a dilution effect at the top layers (above 6 m) and less favourable conditions for phytoplankton cells (decrease of euphotic depth and water temperature above 6 m).
Observations that calanoid copepods, in particular Eudiaptomus gracilis, experienced the highest increase in biomass compared with pre-storm conditions would agree with other published results [53,56,124]. This increase may be a result of higher-quality food availability due to higher turbulence enhancing predator–prey encounters [54,125] and the fact that mixed layer deepening brought food to lower depths allowing zooplankton to feed while still avoiding visual fish predators [126,127]. Moreover, despite a decrease in rotifers’ relative biomass compared to the pre-storm period, rotifers total biomass also increased, as also reported in other studies [27,57]. In addition, an increase in temperature at deeper layers (below 6 m from the surface compared to pre-storm conditions) due to the mixing event after Storm Hector could have also played an important role in the increase of zooplankton biomass, owing to an increase in metabolic rates driven, at the same time, by an increase in water temperature [50].
After Storm Hector, two peaks in copepod abundance potentially accounted for the shift from P to N zooplankton nutrient constraints during July and September. N:P imbalances were negative during both occasions, suggesting that zooplankton N:P body content was higher than seston N:P, which can be accounted for by the dominance of copepods in the system, leading to higher seston N uptake [61,128]. This is in accordance with ecological stoichiometric theory, which states that taxa such as copepods require more N in their diet than high P demanding taxa such as Daphnia [23]. The N:P imbalance remained close to 0 (no nutrient imbalances) for the remainder of the study period (August–October), suggesting a potential nutrient constraint release for primary consumers, driven by the weather induced mixing event, and maintained for the rest of the summer period.
In contrast, zooplankton biomass declined once the lake restabilised, despite this coinciding with a peak in Chl a concentration. These observations can be explained by the fact that phytoplankton community composition at that time was dominated by less nutritious groups (e.g., large Chlorophyta and cyanobacteria), known to be low in essential fatty acids [129,130], which were also less available (e.g., concentrated at top 6 m water layers) [131]. Therefore, a decrease in zooplankton biomass when Chl a values were maximum would suggest that extremely stable conditions are not linked to higher food availability for primary consumers, as well as a potential higher risk of fish predation at the top layers where food was in higher quantities. Minimum zooplankton biomass values observed during April could be linked with potentially higher fish predation as a consequence of the movement of salmon (Salmo salar) smolts downstream to the sea at that time of the year [132].

5. Conclusions

More frequent summer heat waves, leading to highly stable lake conditions, could enhance atypical cyanobacteria increases, even in nutrient- and light-limited aquatic ecosystems (e.g., dystrophic lakes). In addition, this study suggests that lake mixing disturbances driven by storms, especially in lakes experiencing more intense summer stratification due to warming, can enhance ecosystem respiration and primary consumer biomass and, in turn, reduce zooplankton nutrient constraints and phytoplankton biomass. Future scenarios predict more summers such as the one presented in this paper. Characterisations of both lake thermal, nutrient and ecological responses to consecutive extreme weather events are relatively rare, but are crucial to understand how lakes are changing, inform forecasting tools and therefore protect such ecosystems, as the impacts of global climate change accelerate.

Author Contributions

This study was jointly conceived by M.C.-P., V.M., E.d.E. and E.J. Data collection was carried out by M.C.-P., E.d.E., M.D. and M.R.A. Laboratory analyses and planktonic community identification and enumeration were carried out by M.C.-P. Metabolism estimates and physical metrics were computed by S.K., H.L.W., E.d.E. and M.C.-P. The manuscript was written by M.C.-P., revised by V.M., E.d.E. and E.J. and approved by all authors. All authors have read and agreed to the published version of the manuscript.

Funding

This project (Grant-Aid Agreement No. PBA/FS/16/02) is carried out with the support of the Marine Institute and is funded under the Marine Research Program by the Irish Government under the name BEYOND2020.

Acknowledgments

The maintenance of the long-term monitoring program in Burrishoole was facilitated by the staff of the Marine Institute, Joseph Cooney, Michael Murphy, Pat Hughes, Pat Nixon, David Sweeney, Russell Poole and Emma Drohan, and the authors sincerely acknowledge their contribution to this work. The authors also wish to thank Tadhg Moore for constructive feedback during the analysis and writing phase of this study.

Conflicts of Interest

The authors declare no conflict of interest.

References

  1. IPCC. Climate Change 2014: Synthesis Report. Contribution of Working Groups I, II and III to the Fifth Assessment Report of the Intergovernmental Panel on Climate Change, 1st ed.; IPCC: Geneva, Switzerland, 2014. [Google Scholar]
  2. IPCC. The Scientific Basis. Contribution of Working Group I to the Third Assessment Report of the Intergovernmental Panel on Climate Change; Cambridge University Press: Cambridge, UK, 2001. [Google Scholar]
  3. Stephenson, D.B.; Diaz, H.F.; Murnane, R.J. Definition, diagnosis, and origin of extreme weather and climate events. Clim. Extrem. Soc. 2008, 340, 11–23. [Google Scholar]
  4. Woolway, R.I.; Merchant, C.J.; Hoek, J.V.D.; Azorin-Molina, C.; Nõges, P.; Laas, A.; Mackay, E.B.; Jones, I.D. Northern Hemisphere Atmospheric Stilling Accelerates Lake Thermal Responses to a Warming World. Geophys. Res. Lett. 2019, 46, 11983–11992. [Google Scholar] [CrossRef] [Green Version]
  5. Jennings, E.; Jones, S.; Arvola, L.; Staehr, P.A.; Gaiser, E.; Jones, I.D.; Weathers, K.C.; Weyhenmeyer, G.A.; Chiu, C.-Y.; Eyto, E.D. Effects of weather-related episodic events in lakes: An analysis based on high-frequency data. Freshw. Biol. 2012, 57, 589–601. [Google Scholar] [CrossRef] [Green Version]
  6. Quante, M.; Colijn, F. North Sea Region Climate Change Assessment; Springer Open: Cham, Swhitzerland, 2016. [Google Scholar]
  7. Ryo, M.; Aguilar-Trigueros, C.A.; Pinek, L.; Muller, L.A.H.; Rillig, M.C. Basic Principles of Temporal Dynamics. Trends Ecol. Evol. 2019, 34, 723–733. [Google Scholar] [CrossRef] [Green Version]
  8. Adrian, R.; Gerten, D.; Huber, V.; Wagner, C.; Schmidt, S.R. Windows of change: Temporal scale of analysis is decisive to detect ecosystem responses to climate change. Mar. Biol. 2012, 159, 2533–2542. [Google Scholar] [CrossRef]
  9. Weathers, K.C.; Hanson, P.C.; Arzberger, P.; Brentrup, J.; Brookes, J.; Carey, C.C.; Gaiser, E.; Gaiser, E.; Hamilton, D.P.; Hong, G.S.; et al. The Global Lake Ecological Observatory Network (gleon): The Evolution of Grassroots Network Science. Limnol. Oceanogr. Bull. 2013, 22, 71–73. [Google Scholar] [CrossRef]
  10. De Eyto, E.; Jennings, E.; Ryder, E.; Sparber, K.; Dillane, M.; Dalton, C.; Poole, R. Response of a humic lake ecosystem to an extreme precipitation event: Physical, chemical, and biological implications. Inland Waters 2016, 6, 483–498. [Google Scholar] [CrossRef] [Green Version]
  11. Nürnberg, G.K.; Shaw, M. Productivity of clear and humic lakes: Nutrients, phytoplankton, bacteria. Hydrobiologia 1998, 382, 97–112. [Google Scholar] [CrossRef]
  12. Chapman, P.J.; McDonald, A.T.; Tyson, R.; Palmer, S.M.; Mitchell, G.; Irvine, B. Changes in water colour between 1986 and 2006 in the headwaters of the River Nidd, Yorkshire, UK. Biogeochemistry 2010, 101, 281–294. [Google Scholar] [CrossRef]
  13. Williamson, C.E.; Morris, D.P. Dissolved organic carbon and nutrients as regulators of lake ecosystems: Resurrection of a more integrated paradigm. Limnol. Oceanogr. 1999, 44, 795–803. [Google Scholar] [CrossRef] [Green Version]
  14. Carpenter, S.R.; Cole, J.J.; Kitchell, J.F.; Pace, M.L. Impact of dissolved organic carbon, phosphorus, and grazing on phytoplankton biomass and production in experimental lakes. Limnol. Oceanogr. 1998, 43, 73–80. [Google Scholar] [CrossRef]
  15. Jansson, M.; Bergström, A.-K.; Blomqvist, P.; Drakare, S. Allochthonous Organic Carbon and Phytoplankton/Bacterioplankton Production Relationships in Lakes. Ecology 2000, 81, 3250–3255. [Google Scholar] [CrossRef]
  16. Faithfull, C.L.; Mathisen, P.; Wenzel, A.; Bergström, A.-K.; Vrede, T. Food web efficiency differs between humic and clear water lake communities in response to nutrients and light. Oecologia 2015, 177, 823–835. [Google Scholar] [CrossRef] [PubMed]
  17. Xu, J.; Morris, P.J.; Liu, J.; Holden, J. PEATMAP: Refining estimates of global peatland distribution based on a meta-analysis. Catena 2018, 160, 134–140. [Google Scholar] [CrossRef] [Green Version]
  18. Montanarella, L.; Jones, R.J.A.; Hiederer, R. The distribution of peatland in Europe. Mires Peat 2006, 1, 1. [Google Scholar]
  19. Kelly, P.T.; Renwick, W.H.; Knoll, L.; Vanni, M.J. Stream Nitrogen and Phosphorus Loads Are Differentially Affected by Storm Events and the Difference May Be Exacerbated by Conservation Tillage. Environ. Sci. Technol. 2019, 53, 5613–5621. [Google Scholar] [CrossRef]
  20. Williamson, T.J.; Vanni, M.J.; Renwick, W.H. Spatial and Temporal Variability of Nutrient Dynamics and Ecosystem Metabolism in a Hyper-eutrophic Reservoir Differ between a Wet and Dry Year. Ecosystems 2020. [Google Scholar] [CrossRef]
  21. Asam, Z.-U.-Z. Cycling and Transport of Phosphorus and Nitrogen from Harvested Peatland Forests and Possible Mitigation and Methods; Civil Engineering Department, National University of Ireland: Galway, Ireland, 2012. [Google Scholar]
  22. Schade, J.D.; MacNeill, K.; Thomas, S.A.; McNelly, F.C.; Welter, J.R.; Hood, J.; Goodrich, M.; Power, M.E.; Finlay, J.C. The stoichiometry of nitrogen and phosphorus spiralling in heterotrophic and autotrophic streams. Freshw. Biol. 2011, 56, 424–436. [Google Scholar] [CrossRef]
  23. Sterner, R.W.; Elser, J.J. Ecological Stoichiometry: The Biology of Elements from Molecules to the Biosphere; Princeton University Press: Princeton, NJ, USA, 2002; ISBN 978-0-691-07491-7. [Google Scholar]
  24. Berger, S.A.; Diehl, S.; Kunz, T.J.; Albrecht, D.; Oucible, A.M.; Ritzer, S. Light supply, plankton biomass, and seston stoichiometry in a gradient of lake mixing depths. Limnol. Oceanogr. 2006, 51, 1898–1905. [Google Scholar] [CrossRef]
  25. Peeters, F.; Straile, D.; Lorke, A.; Ollinger, D. Turbulent mixing and phytoplankton spring bloom development in a deep lake. Limnol. Oceanogr. 2007, 52, 286–298. [Google Scholar] [CrossRef]
  26. Yvon-Durocher, G.; Jones, J.I.; Trimmer, M.; Woodward, G.; Montoya, J.M. Warming alters the metabolic balance of ecosystems. Philos. Trans. R. Soc. B Biol. Sci. 2010, 365, 2117–2126. [Google Scholar] [CrossRef] [PubMed] [Green Version]
  27. Cantin, A.; Beisner, B.E.; Gunn, J.M.; Prairie, Y.T.; Winter, J.G. Effects of thermocline deepening on lake plankton communities. Can. J. Fish. Aquat. Sci. 2011, 68, 260–276. [Google Scholar] [CrossRef]
  28. Kraemer, B.M.; Mehner, T.; Adrian, R. Reconciling the opposing effects of warming on phytoplankton biomass in 188 large lakes. Sci. Rep. 2017, 7, 1–7. [Google Scholar] [CrossRef]
  29. Foreman, C.M.; Wolf, C.F.; Priscu, J.C. Impact of episodic warming events on the physical, chemical and biological relationships of lakes in the McMurdo Dry Valleys. Antarct. Aquat. Geochem. 2004, 10, 239–268. [Google Scholar] [CrossRef]
  30. Klug, J.L.; Richardson, D.C.; Ewing, H.A.; Hargreaves, B.R.; Samal, N.R.; Vachon, D.; Pierson, D.C.; Lindsey, A.M.; O’Donnell, D.M.; Effler, S.W. Ecosystem effects of a tropical cyclone on a network of lakes in northeastern North America. Environ. Sci. Technol. 2012, 46, 11693–11701. [Google Scholar] [CrossRef] [PubMed]
  31. Kasprzak, P.; Shatwell, T.; Gessner, M.O.; Gonsiorczyk, T.; Kirillin, G.; Selmeczy, G.; Padisák, J.; Engelhardt, C. Extreme weather event triggers cascade towards extreme turbidity in a clear-water lake. Ecosystems 2017, 20, 1407–1420. [Google Scholar] [CrossRef]
  32. Sommer, U.; Gliwicz, Z.M.; Lampert, W.; Duncan, A. The PEG-model of seasonal succession of planktonic events in fresh waters. Arch. Hydrobiol. 1986, 106, 433–471. [Google Scholar]
  33. Sverdrup, H.U. On conditions for the vernal blooming of phytoplankton. J. Cons. Int. Explor. Mer. 1953, 18, 287–295. [Google Scholar] [CrossRef]
  34. Huisman, J.E.F.; van Oostveen, P.; Weissing, F.J. Critical depth and critical turbulence: Two different mechanisms for the development of phytoplankton blooms. Limnol. Oceanogr. 1999, 44, 1781–1787. [Google Scholar] [CrossRef] [Green Version]
  35. Huisman, J.; Sharples, J.; Stroom, J.M.; Visser, P.M.; Kardinaal, W.E.A.; Verspagen, J.M.; Sommeijer, B. Changes in turbulent mixing shift competition for light between phytoplankton species. Ecology 2004, 85, 2960–2970. [Google Scholar] [CrossRef] [Green Version]
  36. Litchman, E. Growth rates of phytoplankton under fluctuating light. Freshw. Biol. 2000, 44, 223–235. [Google Scholar] [CrossRef]
  37. Diehl, S.; Berger, S.; Ptacnik, R.; Wild, A. Phytoplankton, light, and nutrients in a gradient of mixing depths: Field experiments. Ecology 2002, 83, 399–411. [Google Scholar] [CrossRef]
  38. Winder, M.; Reuter, J.E.; Schladow, S.G. Lake warming favours small-sized planktonic diatom species. Proc. R. Soc. B Biol. Sci. 2009, 276, 427–435. [Google Scholar] [CrossRef]
  39. Sanders, R.W.; Porter, K.G. Phagotrophic phytoflagellates. In Advances in Microbial Ecology; Springer: Berlin, Germany, 1988; pp. 167–192. [Google Scholar]
  40. Olrik, K. Ecology of mixotrophic flagellates with special reference to Chrysophyceae in Danish lakes. In Phytoplankton Trophic Gradients; Springer: Dordrecht, The Netherlands, 1998; pp. 329–338. [Google Scholar]
  41. Mitra, A.; Flynn, K.J.; Tillmann, U.; Raven, J.A.; Caron, D.; Stoecker, D.K.; Not, F.; Hansen, P.J.; Hallegraeff, G.; Sanders, R. Defining planktonic protist functional groups on mechanisms for energy and nutrient acquisition: Incorporation of diverse mixotrophic strategies. Protist 2016, 167, 106–120. [Google Scholar] [CrossRef]
  42. Ptacnik, R.; Diehl, S.; Berger, S. Performance of sinking and nonsinking phytoplankton taxa in a gradient of mixing depths. Limnol. Oceanogr. 2003, 48, 1903–1912. [Google Scholar] [CrossRef] [Green Version]
  43. Giling, D.P.; Nejstgaard, J.C.; Berger, S.A.; Grossart, H.-P.; Kirillin, G.; Penske, A.; Lentz, M.; Casper, P.; Sareyka, J.; Gessner, M.O. Thermocline deepening boosts ecosystem metabolism: Evidence from a large-scale lake enclosure experiment simulating a summer storm. Glob. Chang. Biol. 2017, 23, 1448–1462. [Google Scholar] [CrossRef]
  44. Perga, M.-E.; Bruel, R.; Rodriguez, L.; Guénand, Y.; Bouffard, D. Storm impacts on alpine lakes: Antecedent weather conditions matter more than the event intensity. Glob. Chang. Biol. 2018, 24, 5004–5016. [Google Scholar] [CrossRef]
  45. Segatto, P.L.; Battin, T.J.; Bertuzzo, E. Modeling the coupled dynamics of stream metabolism and microbial biomass. Limnol. Oceanogr. 2020. [Google Scholar] [CrossRef]
  46. Sadro, S.; Melack, J.M. The effect of an extreme rain event on the biogeochemistry and ecosystem metabolism of an oligotrophic high-elevation lake. Arct. Antarct. Alp. Res. 2012, 44, 222–231. [Google Scholar] [CrossRef]
  47. Solomon, C.T.; Bruesewitz, D.A.; Richardson, D.C.; Rose, K.C.; Van de Bogert, M.C.; Hanson, P.C.; Kratz, T.K.; Larget, B.; Adrian, R.; Babin, B.L. Ecosystem respiration: Drivers of daily variability and background respiration in lakes around the globe. Limnol. Oceanogr. 2013, 58, 849–866. [Google Scholar] [CrossRef] [Green Version]
  48. Guillemette, F.; McCallister, S.L.; del Giorgio, P.A. Selective consumption and metabolic allocation of terrestrial and algal carbon determine allochthony in lake bacteria. ISME J. 2016, 10, 1373–1382. [Google Scholar] [CrossRef] [Green Version]
  49. Vachon, D.; Del Giorgio, P.A. Whole-lake CO2 dynamics in response to storm events in two morphologically different lakes. Ecosystems 2014, 17, 1338–1353. [Google Scholar] [CrossRef]
  50. Brown, J.H.; Gillooly, J.F.; Allen, A.P.; Savage, V.M.; West, G.B. Toward a metabolic theory of ecology. Ecology 2004, 85, 1771–1789. [Google Scholar] [CrossRef]
  51. Allen, A.P.; Gillooly, J.F.; Brown, J.H. Linking the global carbon cycle to individual metabolism. Funct. Ecol. 2005, 19, 202–213. [Google Scholar] [CrossRef]
  52. Gómez-Gener, L.; Lupon, A.; Laudon, H.; Sponseller, R.A. Drought alters the biogeochemistry of boreal stream networks. Nat. Commun. 2020, 11, 1–11. [Google Scholar] [CrossRef] [PubMed]
  53. Havens, K.E.; Beaver, J.R.; Casamatta, D.A.; East, T.L.; James, R.T.; Mccormick, P.; Phlips, E.J.; Rodusky, A.J. Hurricane effects on the planktonic food web of a large subtropical lake. J. Plankton Res. 2011, 33, 1081–1094. [Google Scholar] [CrossRef] [Green Version]
  54. Tóth, G.L.; Parpala, L.; Balogh, C.; Tàtrai, I.; Baranyai, E. Zooplankton community response to enhanced turbulence generated by water-level decrease in Lake Balaton, the largest shallow lake in Central Europe. Limnol. Oceanogr. 2011, 56, 2211–2222. [Google Scholar] [CrossRef]
  55. Beaver, J.R.; Casamatta, D.A.; East, T.L.; Havens, K.E.; Rodusky, A.J.; James, R.T.; Tausz, C.E.; Buccier, K.M. Extreme weather events influence the phytoplankton community structure in a large lowland subtropical lake (Lake Okeechobee, Florida, USA). Hydrobiologia 2013, 709, 213–226. [Google Scholar] [CrossRef]
  56. Ji, G.; Havens, K.E.; Beaver, J.R.; East, T.L. Recovery of plankton from hurricane impacts in a large shallow lake. Freshw. Biol. 2018, 63, 366–379. [Google Scholar] [CrossRef]
  57. Gauthier, J.; Prairie, Y.T.; Beisner, B.E. Thermocline deepening and mixing alter zooplankton phenology, biomass and body size in a whole-lake experiment. Freshw. Biol. 2014, 59, 998–1011. [Google Scholar] [CrossRef]
  58. Sastri, A.R.; Gauthier, J.; Juneau, P.; Beisner, B.E. Biomass and productivity responses of zooplankton communities to experimental thermocline deepening. Limnol. Oceanogr. 2014, 59, 1–16. [Google Scholar] [CrossRef]
  59. Zhou, J.; Han, X.; Qin, B.; Casenave, C.; Yang, G. Response of zooplankton community to turbulence in large, shallow Lake Taihu: A mesocosm experiment. Fundam. Appl. Limnol. Hydrobiol. 2016, 187, 315–324. [Google Scholar] [CrossRef]
  60. DeMott, W.R. Optimal foraging theory as a predictor of chemically mediated food selection by suspension-feeding copepods. Limnol. Oceanogr. 1989, 34, 140–154. [Google Scholar] [CrossRef]
  61. Dobberfuhl, D.R.; Elser, J.J. Elemental stoichiometry of lower food web components in arctic and temperate lakes. J. Plankton Res. 2000, 22, 1341–1354. [Google Scholar] [CrossRef] [Green Version]
  62. Met Éireann. 2018, A Summer of Heat Waves and Droughts; Irish Meteorological Sevice: Dublin, Ireland, 2018. [Google Scholar]
  63. Andersen, M.R.; de Eyto, E.; Dillane, M.; Poole, R.; Jennings, E. 13 Years of Storms: An Analysis of the Effects of Storms on Lake Physics on the Atlantic Fringe of Europe. Water 2020, 12, 318. [Google Scholar] [CrossRef] [Green Version]
  64. Woolway, R.I.; Jennings, E.; Carrea, L. Impact of the 2018 European heatwave on lake surface water temperature. Inland Waters 2020, 1–11. [Google Scholar] [CrossRef]
  65. Sparber, K.; Dalton, C.; de Eyto, E.; Jennings, E.; Lenihan, D.; Cassina, F. Contrasting pelagic plankton in temperate Irish lakes: The relative contribution of heterotrophic, mixotrophic, and autotrophic components, and the effects of extreme rainfall events. Inland Waters 2015, 5, 295–310. [Google Scholar] [CrossRef]
  66. Ryder, E. Estimating Carbon Pools and Processing in a Humic Irish Lake; School of Health and Science, Dundalk Institute of Technology: Dundalk, Ireland, 2015. [Google Scholar]
  67. Irvine, K.; Allott, N.; de Eyto, E.; Free, G.; White, J.; Caroni, R.; Kennelly, C.; Keaney, J.; Lennon, C.; Kemp, A.; et al. The Ecological Assessment of Irish Lakes: The development of a new methodology suited to the needs of the EU directive for Surface Waters; Environmental Protection Agency: Wexport, Ireland, 2001. [Google Scholar]
  68. Byrne, K.; Farrell, E.P.; Papen, H.; Burrerbach-Bahl, K. The influence of temperature on carbon dioxide production in laboratory columns of virgin and forested blanket bog. Int. Peat J. 2001, 11, 35–42. [Google Scholar]
  69. Allott, N.; McGinnity, P.; O’Hea, B. Factors influencing the downstream transport of sediment in the Lough Feeagh catchment, Burrishoole, Co. Mayo, Ireland. Freshw. Forum 2005, 23, 126–138. [Google Scholar]
  70. Fealy, R.M.; Buckley, C.; Mechan, S.; Melland, A.; Mellander, P.E.; Shortle, G.; Wall, D.; Jordan, P. The Irish Agricultural Catchments Programme: Catchment selection using spatial multi-criteria decision analysis. Soil Use Manag. 2010, 26, 225–236. [Google Scholar] [CrossRef]
  71. Sottocornola, M.; Laine, A.; Kiely, G.; Byrne, K.A.; Tuittila, E.-S. Vegetation and environmental variation in an Atlantic blanket bog in South-western Ireland. Plant Ecol. 2008, 203, 69. [Google Scholar] [CrossRef]
  72. De Eyto, E.; Dillane, M.; Cooney, J.; Hughes, P.; Murphy, M.; Nixon, P.; Sweeney, D.; Poole, R.; Rouen, M. Water quality and meteorological data from the Lough Feeagh Automatic Water Quality Monitoring Station (AWQMS), 2004–2017 Marine Institute, Ireland. Available online: http://data.marine.ie/geonetwork/srv/eng/catalog.search#/metadata/ie.marine.data:dataset.3757 (accessed on 6 April 2020).
  73. Doyle, B.C.; de Eyto, E.; Dillane, M.; Poole, R.; McCarthy, V.; Ryder, E.; Jennings, E. Synchrony in catchment stream colour levels is driven by both local and regional climate. Biogeosciences 2019, 16, 1053–1071. [Google Scholar] [CrossRef] [Green Version]
  74. Irish Marine Institute. BurrishooleLTER-Public. Available online: https://github.com/IrishMarineInstitute/BurishooleLTER-Public (accessed on 14 May 2020).
  75. Met Éireann. Display and Download Historical Data from Current Stations. Available online: https://www.met.ie/climate/available-data/historical-data (accessed on 6 April 2020).
  76. FWE; APHA. Standard Methods for the Examination of Water and Wastewater; American Public Health Association: Washington, DC, USA, 2005. [Google Scholar]
  77. Grasshoff, K.; Kremling, K.; Ehrhardt, M. Methods of Seawater Analysis; John Wiley & Sons: Hoboken, NJ, USA, 2009; ISBN 978-3-527-61399-1. [Google Scholar]
  78. Eisenreich, S.J.; Bannerman, R.T.; Armstrong, D.E. A Simplified Phosphorus Analysis Technique. Environ. Lett. 1975, 9, 43–53. [Google Scholar] [CrossRef] [PubMed]
  79. McCarthy, V.; Donohue, I.A.N.; Irvine, K. Field evidence for stoichiometric relationships between zooplankton and N and P availability in a shallow calcareous lake. Freshw. Biol. 2006, 51, 1589–1604. [Google Scholar] [CrossRef]
  80. Utermohl, H. Zur Vervollkommung der quantitativen phytoplankton-methodik. Mitt Int. Ver Limnol. 1958, 9, 38. [Google Scholar]
  81. John, D.M.; Whitton, B.A.; Brook, A.J. The Freshwater Algal Flora of the British Isles: An Identification Guide to Freshwater and Terrestrial Algae; Cambridge University Press: Cambridge, UK, 2002; Volume 25, pp. 2002–2702. [Google Scholar]
  82. Cox, E.J. Identification of Freshwater Diatoms from Live Material; Chapman & Hall: London, UK, 1996; Volume 158. [Google Scholar]
  83. Hillebrand, H.; Dürselen, C.-D.; Kirschtel, D.; Pollingher, U.; Zohary, T. Biovolume Calculation for Pelagic and Benthic Microalgae. J. Phycol. 1999, 35, 403–424. [Google Scholar] [CrossRef]
  84. Bpttrell, H.H. A review of some problems in zooplankton production studies. Nor. J. Zool. 1976, 24, 419–456. [Google Scholar]
  85. Scourfield, D.J.; Harding, J.P. A Key to the British Species of Freshwater Cladocera, with Notes on their Ecology; Freshwater Biological Association: Ambleside, UK, 1958. [Google Scholar]
  86. Harding, J.P.; Smith, W.A. A key to the British Freshwater Cyclopoid and Calanoid Copepods; Freshwater Biological Association: Ambleside, UK, 1974; pp. 1–55. [Google Scholar]
  87. McCarthy, V. The Relationship between Resource Elemental Deficiencies and Zooplankton Community Structure and Dynamics; School of Natural Science, The University of Dublin: Dublin, Ireland, 2007. [Google Scholar]
  88. De Eyto, E.; Irvine, K. Variation in the Biomass of Functional Groups Comprising the Open-Water Plankton of Shallow Lakes in Ireland. Biol. Environ. Proc. R. Ir. Acad. 2005, 105B, 53–58. [Google Scholar] [CrossRef]
  89. Dumont, H.J.; Van de Velde, I.; Dumont, S. The dry weight estimate of biomass in a selection of Cladocera, Copepoda and Rotifera from the plankton, periphyton and benthos of continental waters. Oecologia 1975, 19, 75–97. [Google Scholar] [CrossRef]
  90. Zambrano–Bigiarini, M. Time Series Management, Analysis and Interpolation for Hydrological Modeling; R Package Version 04-2-1; R Foundation for Statistical Computing: Vienna, Austria, 2014. [Google Scholar]
  91. Winslow, L.; Read, J.; Woolway, R.; Brentrup, J.; Leach, T.; Zwart, Z.; Albers, S.; Collinge, D. rLakeAnalyzer: Lake Physics Tools; R Package Version 1110; R Foundation for Statistical Computing: Vienna, Austria, 2017. [Google Scholar]
  92. Read, J.S.; Hamilton, D.P.; Jones, I.D.; Muraoka, K.; Winslow, L.A.; Kroiss, R.; Wu, C.H.; Gaiser, E. Derivation of lake mixing and stratification indices from high-resolution lake buoy data. Environ. Model. Softw. 2011, 26, 1325–1336. [Google Scholar] [CrossRef]
  93. Wilson, H.L.; Ayala, A.I.; Jones, I.D.; Rolston, A.; Pierson, D.; de Eyto, E.; Grossart, H.P.; Perga, M.E.; Woolway, R.I.; Jennings, J. Variability in epilimnion depth estimations in lakes. Hydrol. Earth Syst. Sci. 2020. in prep. [Google Scholar]
  94. Gray, E.; Mackay, E.B.; Elliott, J.A.; Folkard, A.M.; Jones, I.D. Wide-spread inconsistency in estimation of lake mixed depth impacts interpretation of limnological processes. Water Res. 2020, 168, 115136. [Google Scholar] [CrossRef]
  95. Winslow, L.; Zwart, J.; Batt, R.; Corman, J.; Dugan, H.; Hanson, P.; Holtgrieve, G.; Jaimes, A.; Read, J.; Woolway, R. LakeMetabolizer: Tools for the Analysis of Ecosystem Metabolism. R Package Version 15. 2016. [Google Scholar]
  96. Cole, J.J.; Caraco, N.F. Atmospheric exchange of carbon dioxide in a low-wind oligotrophic lake measured by the addition of SF6. Limnol. Oceanogr. 1998, 43, 647–656. [Google Scholar] [CrossRef] [Green Version]
  97. Helsel, D.R.; Hirsch, R.M. Statistical methods in water resources, chapter A3. In Hydrologic Analysis and Interpretation; U.S. Geological Survey: Reston, VA, USA, 2002; Volume 4. [Google Scholar]
  98. Dinno, A. Nonparametric Pairwise Multiple Comparisons in Independent Groups using Dunn’s Test. Stata J. 2015, 15, 292–300. [Google Scholar] [CrossRef] [Green Version]
  99. Ogle, D.H.; Wheeler, P.; Dinno, A. FSA: Fisheries Stock Analysis; R Package Version 08309000; R Foundation for Statistical Computing: Vienna, Austria, 2020. [Google Scholar]
  100. Byrne, M.J.; Wood, M.S. Concentrations and Loads of Nutrients in the Tributaries of the Lake Okeechobee Watershed, South–Central Florida, Water Years 2004–2008; U.S. Geological Survey: Recon, VA, USA, 2012.
  101. Peterson, B.G.; Carl, P.; Boudt, K.; Bennett, R.; Ulrich, J.; Zivot, E.; Cornilly, D.; Hung, E.; Lestel, M.; Balkissoon, K.; et al. Econometric Tools for Performance and Risk Analyses; R Package ‘PerformanceAnalytics’ Version 153; R Foundation for Statistical Computing: Vienna, Austria, 2018. [Google Scholar]
  102. Oksanen, J. Vegan: Ecological Diversity; R Package Version 25-5; R Foundation for Statistical Computing: Vienna, Austria, 2019. [Google Scholar]
  103. Magurran, A.E.; McGill, B.J. Biological Diversity: Frontiers in Measurement and Assessment; Oxford University Press: Oxford, UK, 2011. [Google Scholar]
  104. R Core Team. R: A Language and Environment for Statistical Computing; R Foundation for Statistical Computing: Vienna, Austria, 2019. [Google Scholar]
  105. Berggren, M.; Sponseller, R.A.; Alves Soares, A.R.; Bergström, A.-K. Toward an ecologically meaningful view of resource stoichiometry in DOM-dominated aquatic systems. J. Plankton Res. 2015, 37, 489–499. [Google Scholar] [CrossRef]
  106. Maranger, R.; Jones, S.E.; Cotner, J.B. Stoichiometry of carbon, nitrogen, and phosphorus through the freshwater pipe. Limnol. Oceanogr. Lett. 2018, 3, 89–101. [Google Scholar] [CrossRef]
  107. Wagner, C.; Adrian, R. Consequences of changes in thermal regime for plankton diversity and trait composition in a polymictic lake: A matter of temporal scale. Freshw. Biol. 2011, 56, 1949–1961. [Google Scholar] [CrossRef]
  108. Huber, V.; Wagner, C.; Gerten, D.; Adrian, R. To bloom or not to bloom: Contrasting responses of cyanobacteria to recent heat waves explained by critical thresholds of abiotic drivers. Oecologia 2012, 169, 245–256. [Google Scholar] [CrossRef]
  109. Mantzouki, E.; Lürling, M.; Fastner, J.; De Senerpont Domis, L.; Wilk-Woźniak, E.; Koreivienė, J.; Seelen, L.; Teurlincx, S.; Verstijnen, Y.; Krztoń, W.; et al. Temperature Effects Explain Continental Scale Distribution of Cyanobacterial Toxins. Toxins 2018, 10, 156. [Google Scholar] [CrossRef] [Green Version]
  110. Burford, M.A.; Carey, C.C.; Hamilton, D.P.; Huisman, J.; Paerl, H.W.; Wood, S.A.; Wulff, A. Perspective: Advancing the research agenda for improving understanding of cyanobacteria in a future of global change. Harmful Algae 2020, 91, 101601. [Google Scholar] [CrossRef]
  111. Yang, Z.; Zhang, M.; Shi, X.; Kong, F.; Ma, R.; Yu, Y. Nutrient reduction magnifies the impact of extreme weather on cyanobacterial bloom formation in large shallow Lake Taihu (China). Water Res. 2016, 103, 302–310. [Google Scholar] [CrossRef] [PubMed]
  112. Elliott, J.A. The seasonal sensitivity of Cyanobacteria and other phytoplankton to changes in flushing rate and water temperature. Glob. Chang. Biol. 2010, 16, 864–876. [Google Scholar] [CrossRef]
  113. Isles, P.D.F.; Giles, C.D.; Gearhart, T.A.; Xu, Y.; Druschel, G.K.; Schroth, A.W. Dynamic internal drivers of a historically severe cyanobacteria bloom in Lake Champlain revealed through comprehensive monitoring. J. Gt. Lakes Res. 2015, 41, 818–829. [Google Scholar] [CrossRef]
  114. Bucak, T.; Trolle, D.; Tavşanoğlu, Ü.N.; Çakıroğlu, A.İ.; Özen, A.; Jeppesen, E.; Beklioğlu, M. Modeling the effects of climatic and land use changes on phytoplankton and water quality of the largest Turkish freshwater lake: Lake Beyşehir. Sci. Total Environ. 2018, 621, 802–816. [Google Scholar] [CrossRef] [PubMed]
  115. Bober, B.; Bialczyk, J. Determination of the toxicity of the freshwater cyanobacterium Woronichinia naegeliana (Unger) Elenkin. J. Appl. Phycol. 2017, 29, 1355–1362. [Google Scholar] [CrossRef] [PubMed] [Green Version]
  116. Bennett, L. Algae, Cyanobacteria Blooms, and Climate Change; The Climate Institute: Washington, DC, USA, 2017. [Google Scholar]
  117. Hallstan, S.; Trigal, C.; Johansson, K.S.L.; Johnson, R.K. The impact of climate on the geographical distribution of phytoplankton species in boreal lakes. Oecologia 2013, 173, 1625–1638. [Google Scholar] [CrossRef] [PubMed]
  118. Stockwell, J.D.; Doubek, J.P.; Adrian, R.; Anneville, O.; Carey, C.C.; Carvalho, L.; de Senerpont Domis, L.N.; Dur, G.; Frassl, M.A.; Grossart, H.P.; et al. Storm impacts on phytoplankton community dynamics in lakes. Glob. Chang. Biol. 2020. [Google Scholar] [CrossRef] [Green Version]
  119. Meersche, K.V.; den Rijswijk, P.V.; Soetaert, K.; Middelburg, J.J. Autochthonous and allochthonous contributions to mesozooplankton diet in a tidal river and estuary: Integrating carbon isotope and fatty acid constraints. Limnol. Oceanogr. 2009, 54, 62–74. [Google Scholar] [CrossRef]
  120. De Kluijver, A.; Schoon, P.L.; Downing, J.A.; Schouten, S.; Middelburg, J.J. Stable carbon isotope biogeochemistry of lakes along a trophic gradient. Biogeosciences 2014, 11, 6265. [Google Scholar] [CrossRef] [Green Version]
  121. Leitão, E.; Ger, K.A.; Panosso, R. Selective Grazing by a Tropical Copepod (Notodiaptomus iheringi) Facilitates Microcystis Dominance. Front. Microbiol. 2018, 9. [Google Scholar] [CrossRef]
  122. Hartmann, H.J.; Taleb, H.; Aleya, L.; Lair, N. Predation on Ciliates by the Suspension-Feeding Calanoid Copepod Acanthodiaptomus denticornis. Can. J. Fish. Aquat. Sci. 1993, 50, 1382–1393. [Google Scholar] [CrossRef]
  123. Fenchel, T. The microbial loop—25 years later. J. Exp. Mar. Biol. Ecol. 2008, 366, 99–103. [Google Scholar] [CrossRef]
  124. Lydersen, E.; Aanes, K.J.; Andersen, S.; Andersen, T.; Brettum, P.; Baekken, T.; Lien, L.; Lindstrøm, E.A.; Løvik, J.E.; Mjelde, M.; et al. Ecosystem effects of thermal manipulation of a whole lake, Lake Breisjøen, southern Norway (THERMOS project). Hydrol. Earth Syst. Sci. Discuss. 2008, 12, 509–522. [Google Scholar] [CrossRef] [Green Version]
  125. Visser, A.W.; Mariani, P.; Pigolotti, S. Swimming in turbulence: Zooplankton fitness in terms of foraging efficiency and predation risk. J. Plankton Res. 2009, 31, 121–133. [Google Scholar] [CrossRef]
  126. Mehner, T.; Thiel, R. A Review of Predation Impact by 0+ Fish on Zooplankton in Fresh and Brackish Waters of the Temperate Northern Hemisphere. Environ. Biol. Fishes 1999, 56, 169–181. [Google Scholar] [CrossRef]
  127. Härkönen, L.; Pekcan-Hekim, Z.; Hellén, N.; Ojala, A.; Horppila, J. Combined Effects of Turbulence and Different Predation Regimes on Zooplankton in Highly Colored Water—Implications for Environmental Change in Lakes. PLoS ONE 2014, 9. [Google Scholar] [CrossRef]
  128. Main, T.M.; Dobberfuhl, D.R.; Elser, J.J. N: P stoichiometry and ontogeny of crustacean zooplankton: A test of the growth rate hypothesis. Limnol. Oceanogr. 1997, 42, 1474–1478. [Google Scholar] [CrossRef] [Green Version]
  129. Burns, C.W.; Brett, M.T.; Schallenberg, M. A comparison of the trophic transfer of fatty acids in freshwater plankton by cladocerans and calanoid copepods. Freshw. Biol. 2011, 56, 889–903. [Google Scholar] [CrossRef]
  130. Galloway, A.W.E.; Taipale, S.J.; Hiltunen, M.; Peltomaa, E.; Strandberg, U.; Brett, M.T.; Kankaala, P. Diet-specific biomarkers show that high-quality phytoplankton fuels herbivorous zooplankton in large boreal lakes. Freshw. Biol. 2014, 59, 1902–1915. [Google Scholar] [CrossRef]
  131. Porter, K.G. The Plant-Animal Interface in Freshwater Ecosystems: Microscopic grazers feed differentially on planktonic algae and can influence their community structure and succession in ways that are analogous to the effects of herbivores on terrestrial plant communities. Am. Sci. 1977, 65, 159–170. [Google Scholar]
  132. De Eyto, E.; Doyle, B.; King, N.; Kilbane, T.; Finlay, R.; Sibigtroth, L.; Poole, R.; Dillane, M.; Jennings, E. Characterisation of salmonid food webs in the rivers and lakes of an Irish peatland ecosystem. Biol. Environ. Proc. R. Ir. Acad. 2020. [Google Scholar] [CrossRef]
Figure 1. Location of the Burrishoole catchment on the west coast of Ireland. Lough Feeagh is the main freshwater lake and the two main inflow rivers characterise the Glenamong and Black river sub-catchments. The squares represent the Automatic River Monitoring Stations (ARMS) and the star the Automatic Water Quality Monitoring Station (AWQMS). The location of Met Éireann weather station (Newport Furnace) is marked with an arrow.
Water 12 01411 g001
Figure 2. (A) Daily mean air temperature (°C) and (B) daily accumulated precipitation (mm) in Newport Furnace weather station. Black lines indicate 2018, the average for all years from 2004 to 2018 is shown with a grey line, and the grey shaded area indicates the 95% confidence interval around that average. (C) Daily 2018 mean wind speed (m·s−1) recorded at Feeagh AWQMS, 2.3 m above lake surface level. The red dotted vertical lines mark the 14th June 2018 (Storm Hector).
Water 12 01411 g002
Figure 3. (A) Schmidt stability (J·m−2) of Lough Feeagh. Black line indicates 2018 values. The mean ± SD for the 2004–2018 period is shown by the grey line and area. The dotted red line indicates the Storm Hector event and the solid red line indicates when the Feeagh water column returned to more stable stratification conditions, highlighting pre-, intermediate and post-storm periods. (B) Temperature contour plot of Lough Feeagh water column. Black line indicates 2018 estimated mixed layer depth (m) daily values. Dotted black lines highlight the 9.5 m mixed surface layer deepening during the intermediate period.
Water 12 01411 g003
Figure 4. Daily averages of epilimnetic (0.9 m) metabolism estimates (mg O2·L−1·day−1) of (A) gross primary productivity (GPP), (B) respiration (R), and (C) net ecosystem productivity (NEP) in Lough Feeagh during the periods pre- (black points n = 7), intermediate (blue points n = 10) and post- (red points n = 10) Storm Hector. In each boxplot, the black line is the median and the box represents the 25th and 75th percentiles. The upper and lower whiskers represent values outside the middle 50%. Values that lie outside the observed distribution are represented as points above or below the respective whiskers. Statistical significances following pairwise multiple-comparison Dunn’s test for determining differences between periods on metabolic estimates are indicated with curly brackets where p-values < 0.05 are represented with ‘*’, and p-values < 0.01 with ‘**’.
Water 12 01411 g004
Figure 5. (A) TN:TP nutrient ratios of Lough Feeagh (blue circles) and loadings to Lough Feeagh (black squares) and (B) Lough Feeagh N:P nutrient imbalances (seston N:P minus zooplankton community N:P) from April to October 2018. Ratios are performed in molar units. Dotted red lines indicate the Storm Hector event and solid red lines indicate when the Feeagh water column returned to more stable stratification conditions.
Water 12 01411 g005
Figure 6. (A) Biovolumes (mm3·m−3) of different phytoplankton phyla and ciliates from 6 m integrated water samples and Shannon diversity index (H’) and (B) biomass (μg DW·L−1) of different zooplankton taxa and chlorophyll a recorded in Lough Feeagh between April and October 2018. Dotted red lines indicate the Storm Hector event and solid red lines indicate when the Feeagh water column returned to more stable stratification conditions.
Water 12 01411 g006
Figure 7. Biovolumes (mm3·m−3) of different phytoplankton phyla and ciliates recorded at different depths in Lough Feeagh on each specific date (pre-, intermediate and post-storm event). Samples at 6 m (integrated water sample from the surface) correspond to epilimnion, samples at 12 m correspond to metalimnion and samples at 25 m correspond to hypolimnion of Lough Feeagh.
Water 12 01411 g007

