Comprehensive Analysis of Coordination Relationship between Water Resources Environment and High-Quality Economic Development in Urban Agglomeration in the Middle Reaches of Yangtze River
Abstract
:1. Introduction
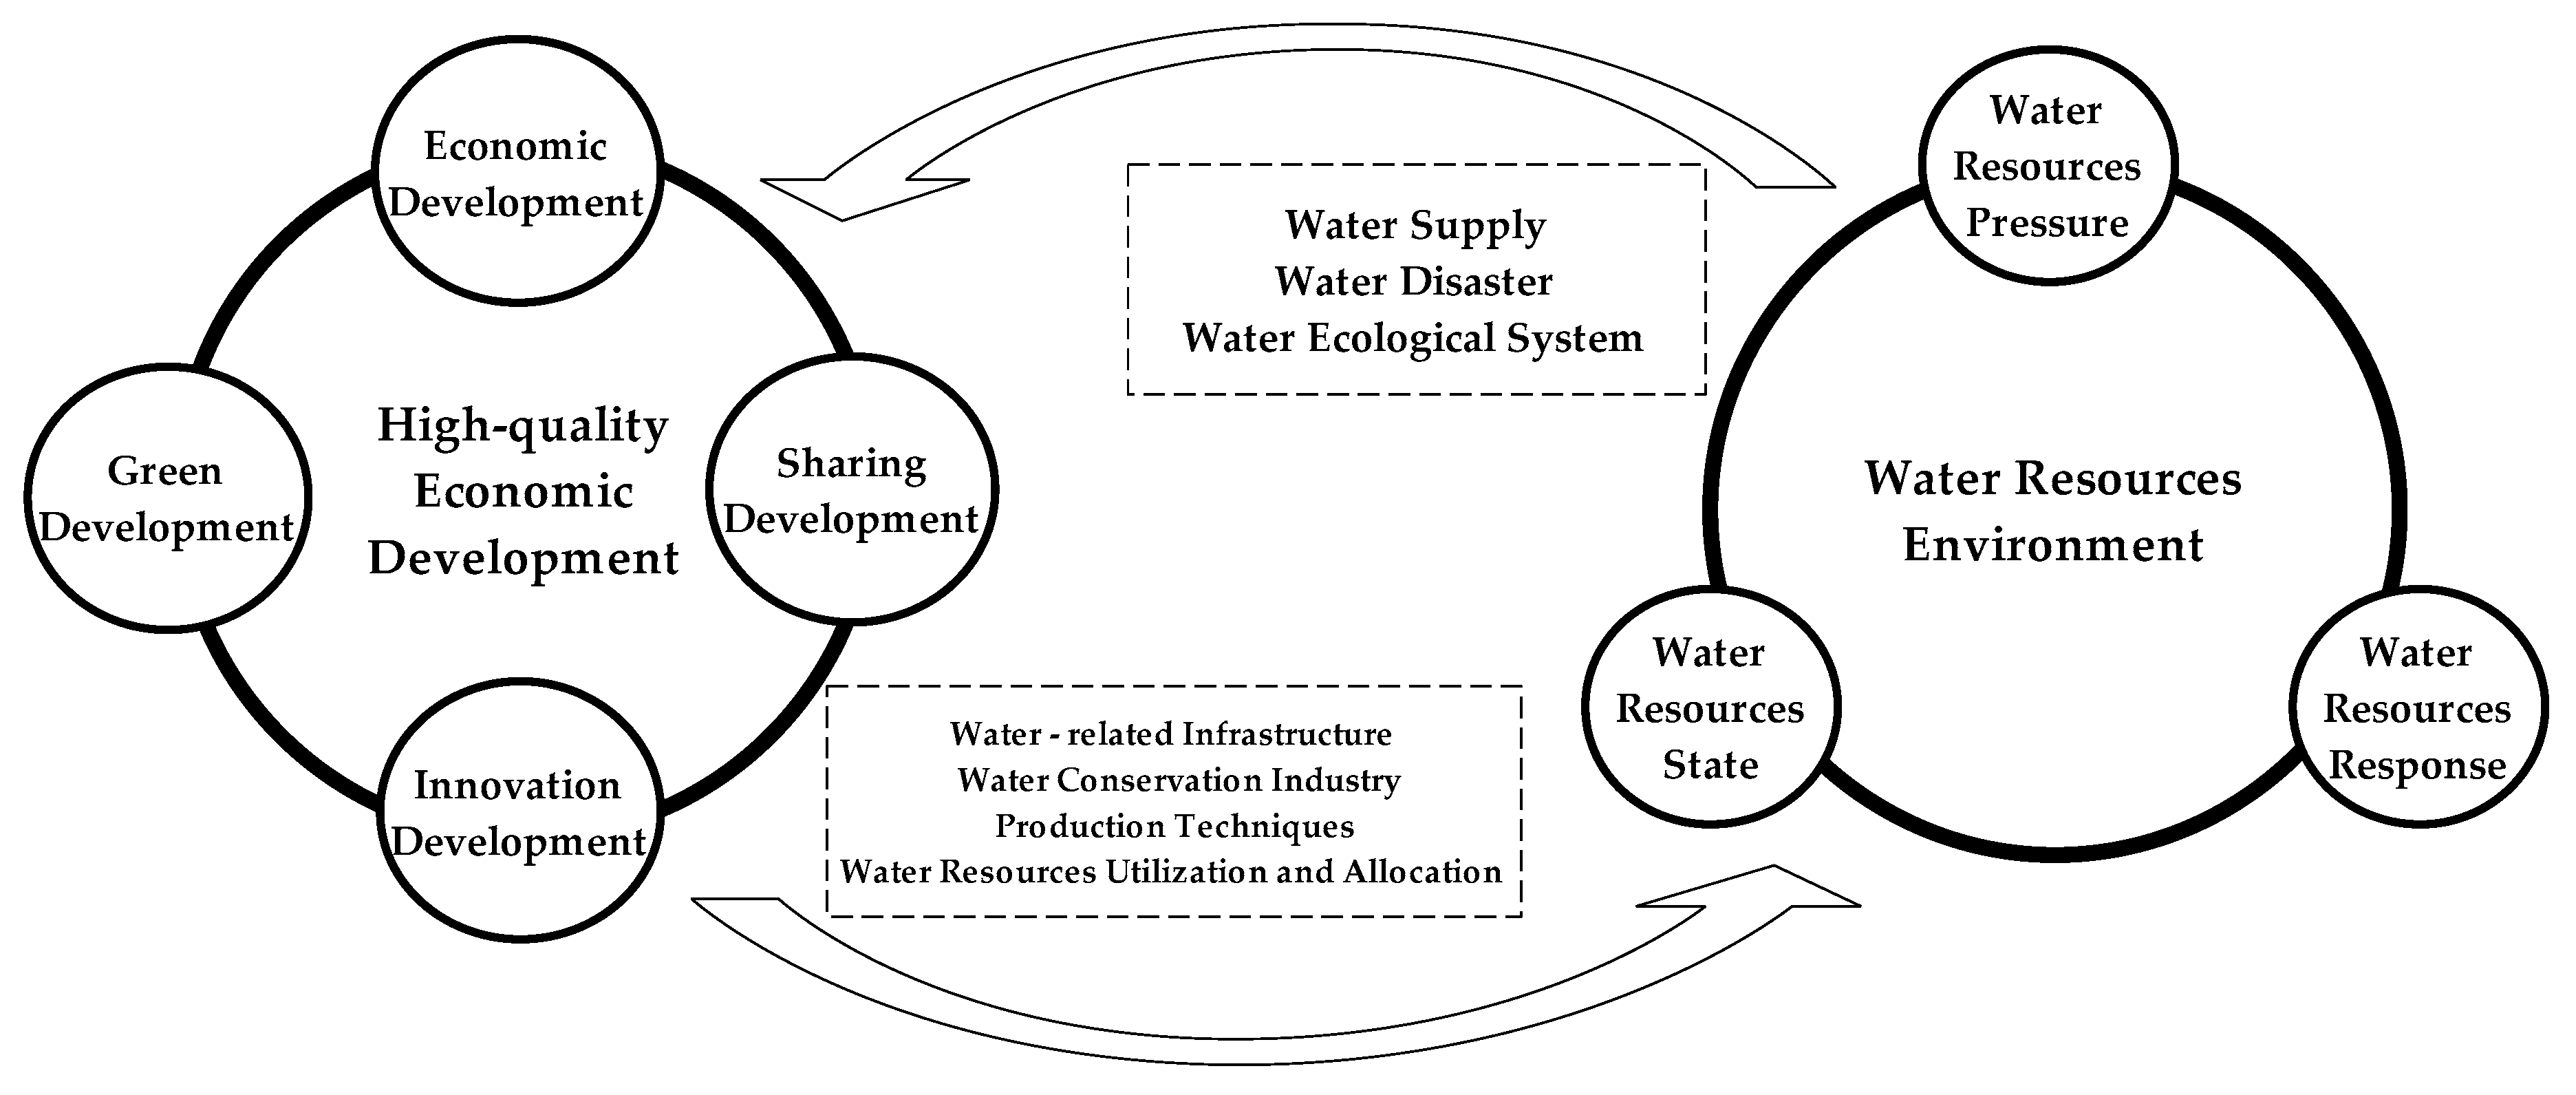
2. Synergy Mechanism and Evaluation Index System
2.1. Synergy Mechanism between Water Resources Environment and High-Quality Economic Development
2.2. Construction of the Evaluation Index System
- WRP. Domestic water per capita for urban residents (X1) and rural residents(X2) that reflects water demands from urban and rural areas, separately; industrial wastewater discharge per GDP(X3) was selected as the proxy for regional water pollution.
- WRS. Here, four indicators were established, namely the total amount of water resources per capita (X4), the precipitation per unit area(X5), the underground water per unit area (X6) and the surface water per unit area (X7), which were selected to represent the water resources state.
- WRR. The water consumption per GDP(X8), the water consumption of industrial value added (X9) and the water consumption of per mu farmland (X10) were selected to measure the economic response of the water resources environment. Water supply per capita (X11) is an indicator of the water supply response. Additionally, public green areas per capita (X12) was selected as ecological environment response 17.
- ED. GDP per capita (X13), the gross industrial output per capita(X14), the proportion of tertiary industry GDP to gross GDP (X15) and the total actual utilization of foreign capital per capita (X16) reflect economic strength.
- SD. The ultimate goal of high-quality economic development is to share development wellbeing with citizens, and thus sharing development is a key component of high-quality economic development. The average wages of employees (X17) and the proportion of disposable income per capita to GDP per capita (X18) were selected to present the income level; the proportion of disposable income between the urban and rural residents (X19) reflects the urban–rural income distribution; registered urban unemployment rate (X20) is a representative index of employment.
- ID. The proportion of science and technology expenditure in government expenditure (X21) and the growth rate of the value added of high-tech industries (X22) were adopted as proxies of innovation level.
- GD. The unit GDP energy-consuming parameter (X23), the general comprehensive utilization of solid waste (X24) and the urban garbage treatment rate (X25) were used to measure ecological environment improvement.
3. Methodology
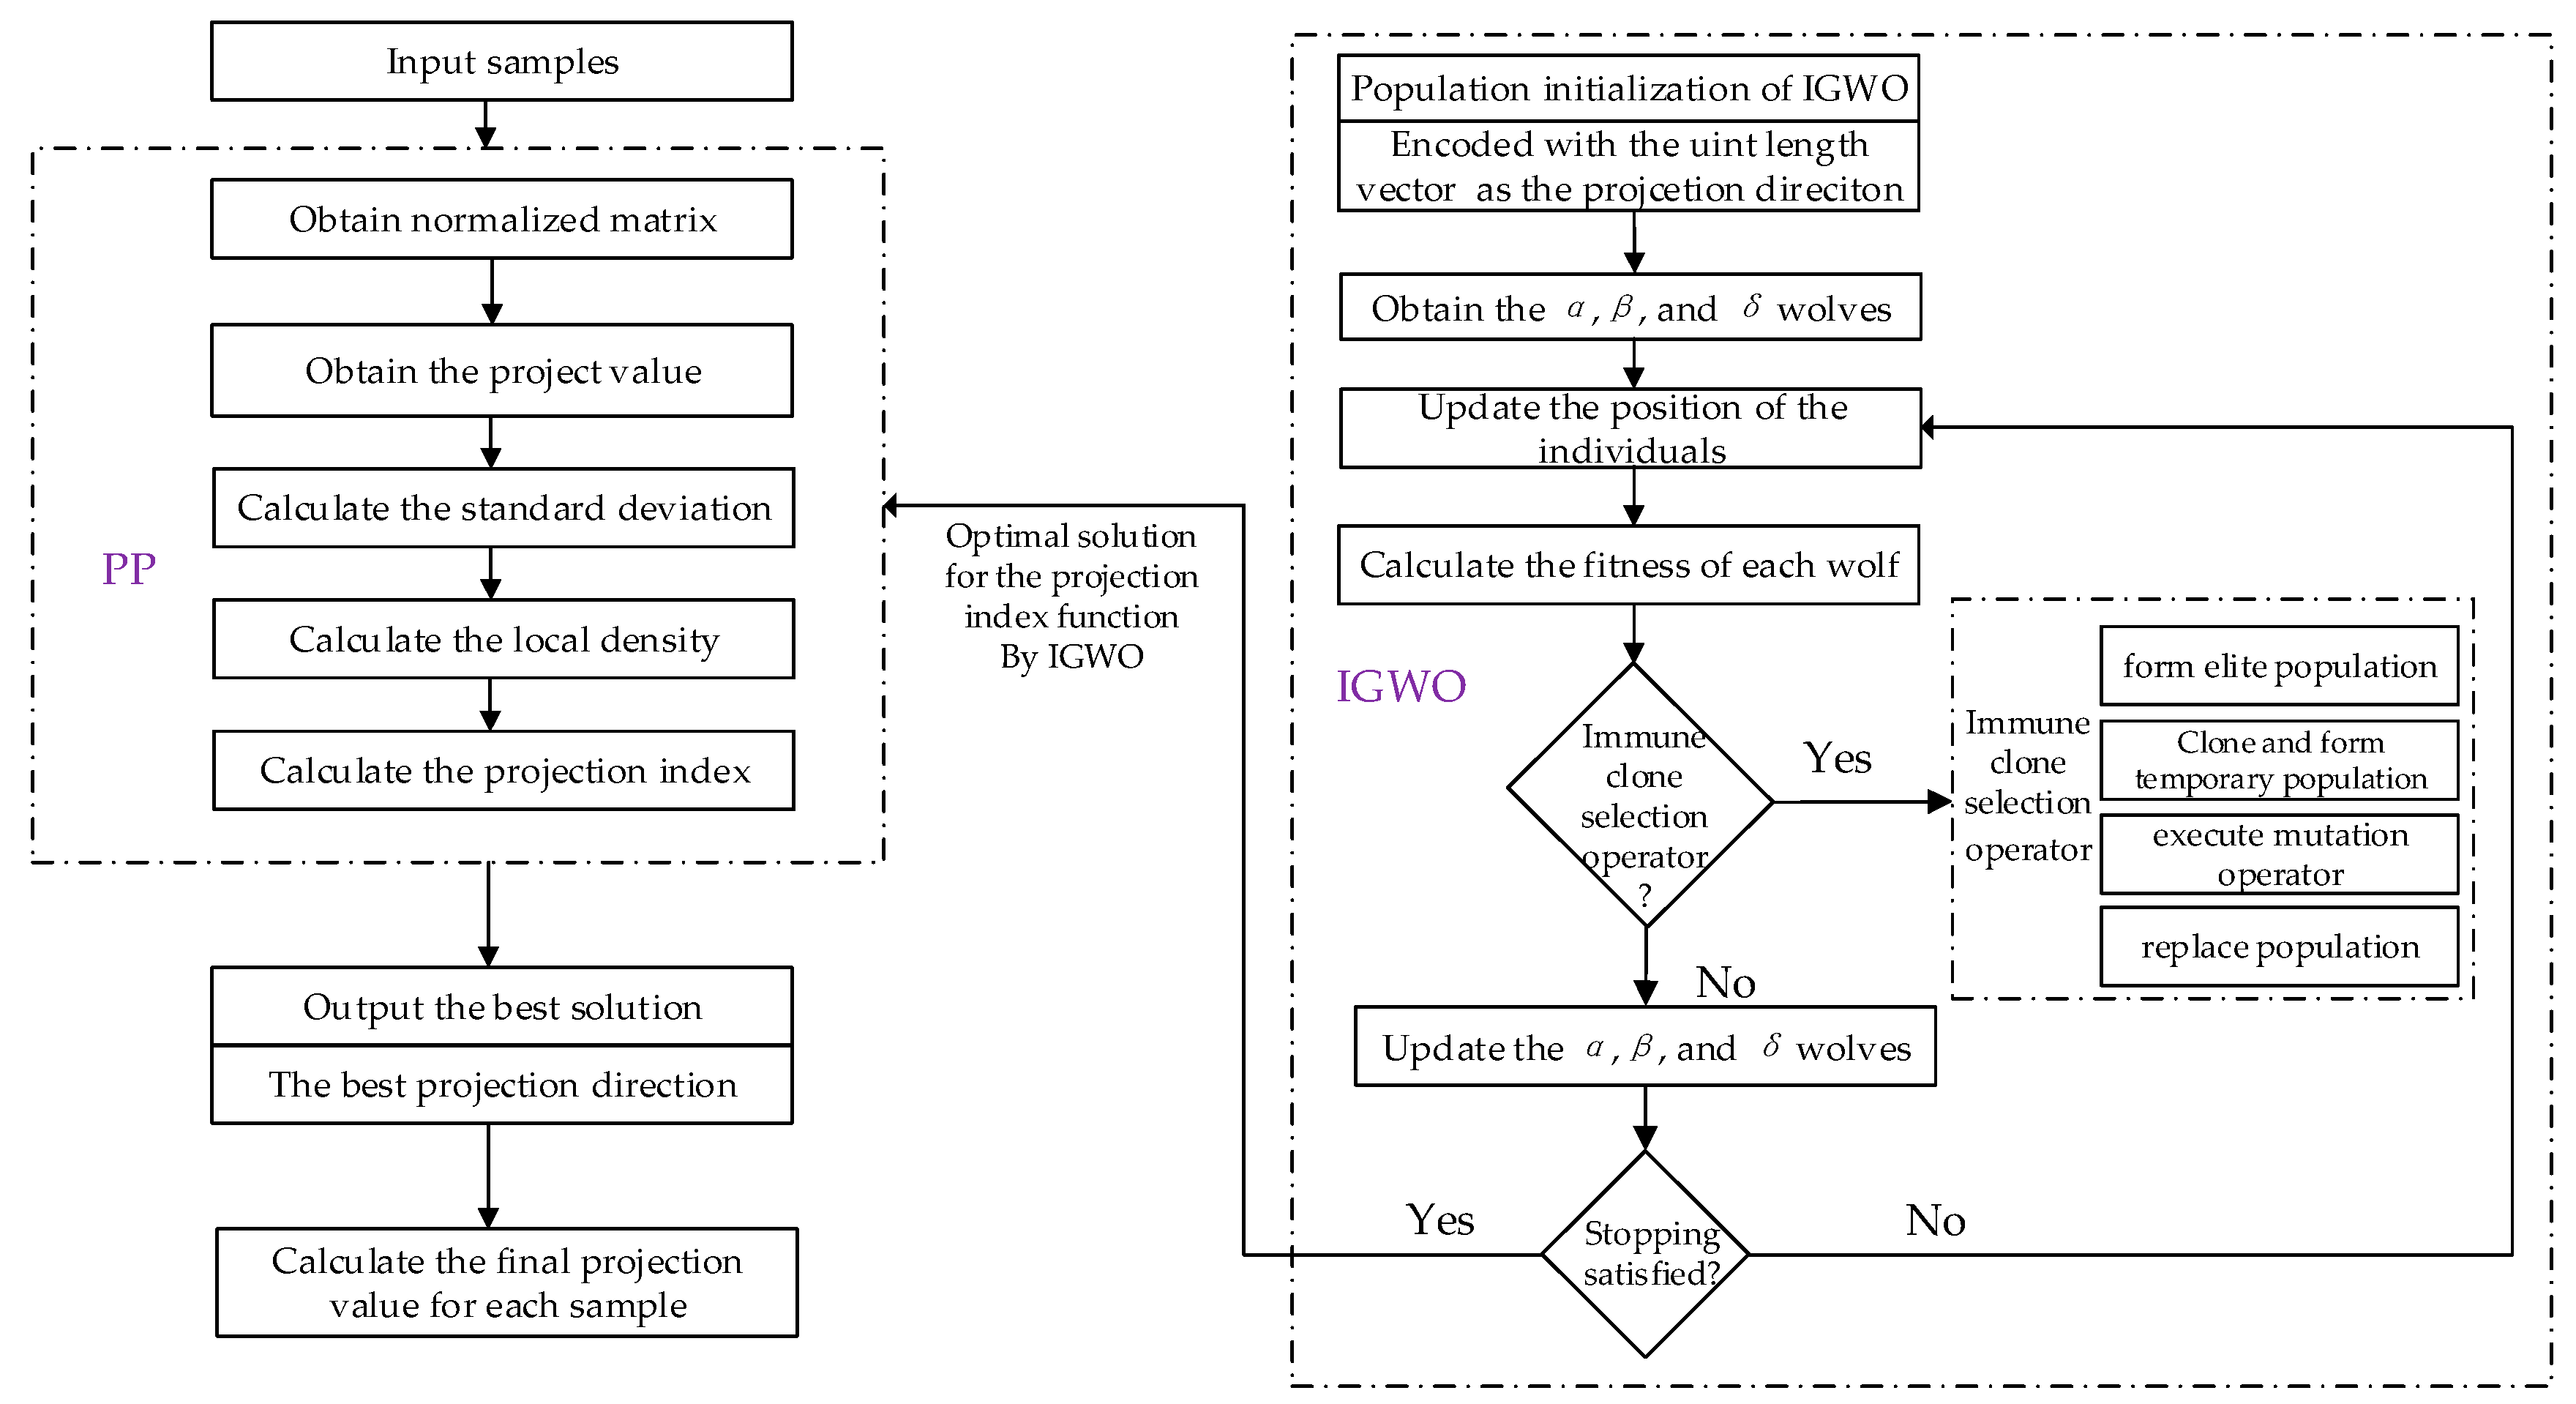
3.1. Projection Pursuit-Entropy Weight Method
3.1.1. Projection Pursuit
3.1.2. Entropy Weight Method
3.2. Membership Function Coordination Model
3.2.1. Static Membership Function Coordination Model
3.2.2. Dynamic Membership Function Coordination Model
4. Study Area and Data Source
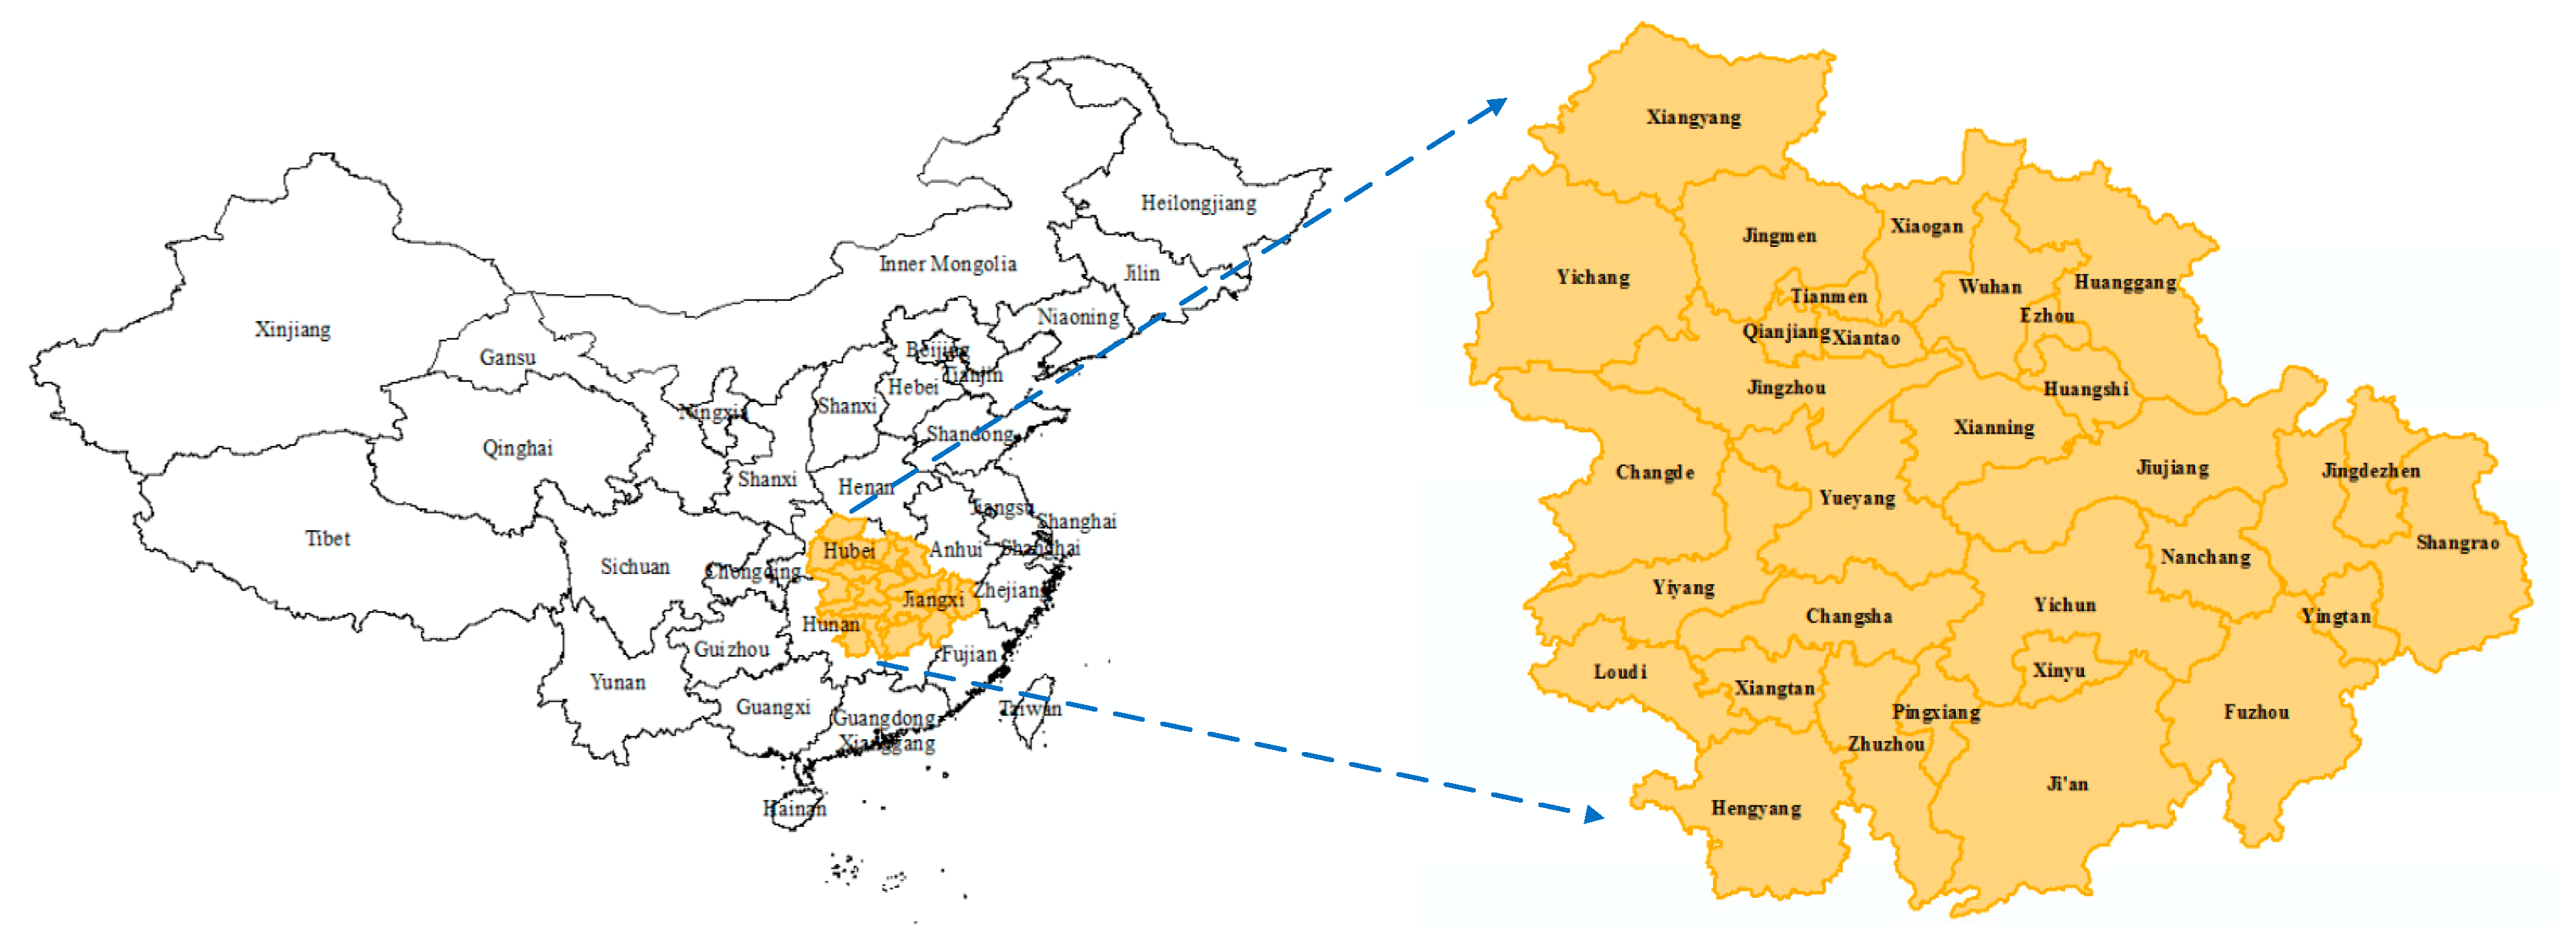
4.1. Introduction of Urban Agglomeration in the Middle Reaches of the Yangtze River
4.2. Data Source
5. Results and Discussion
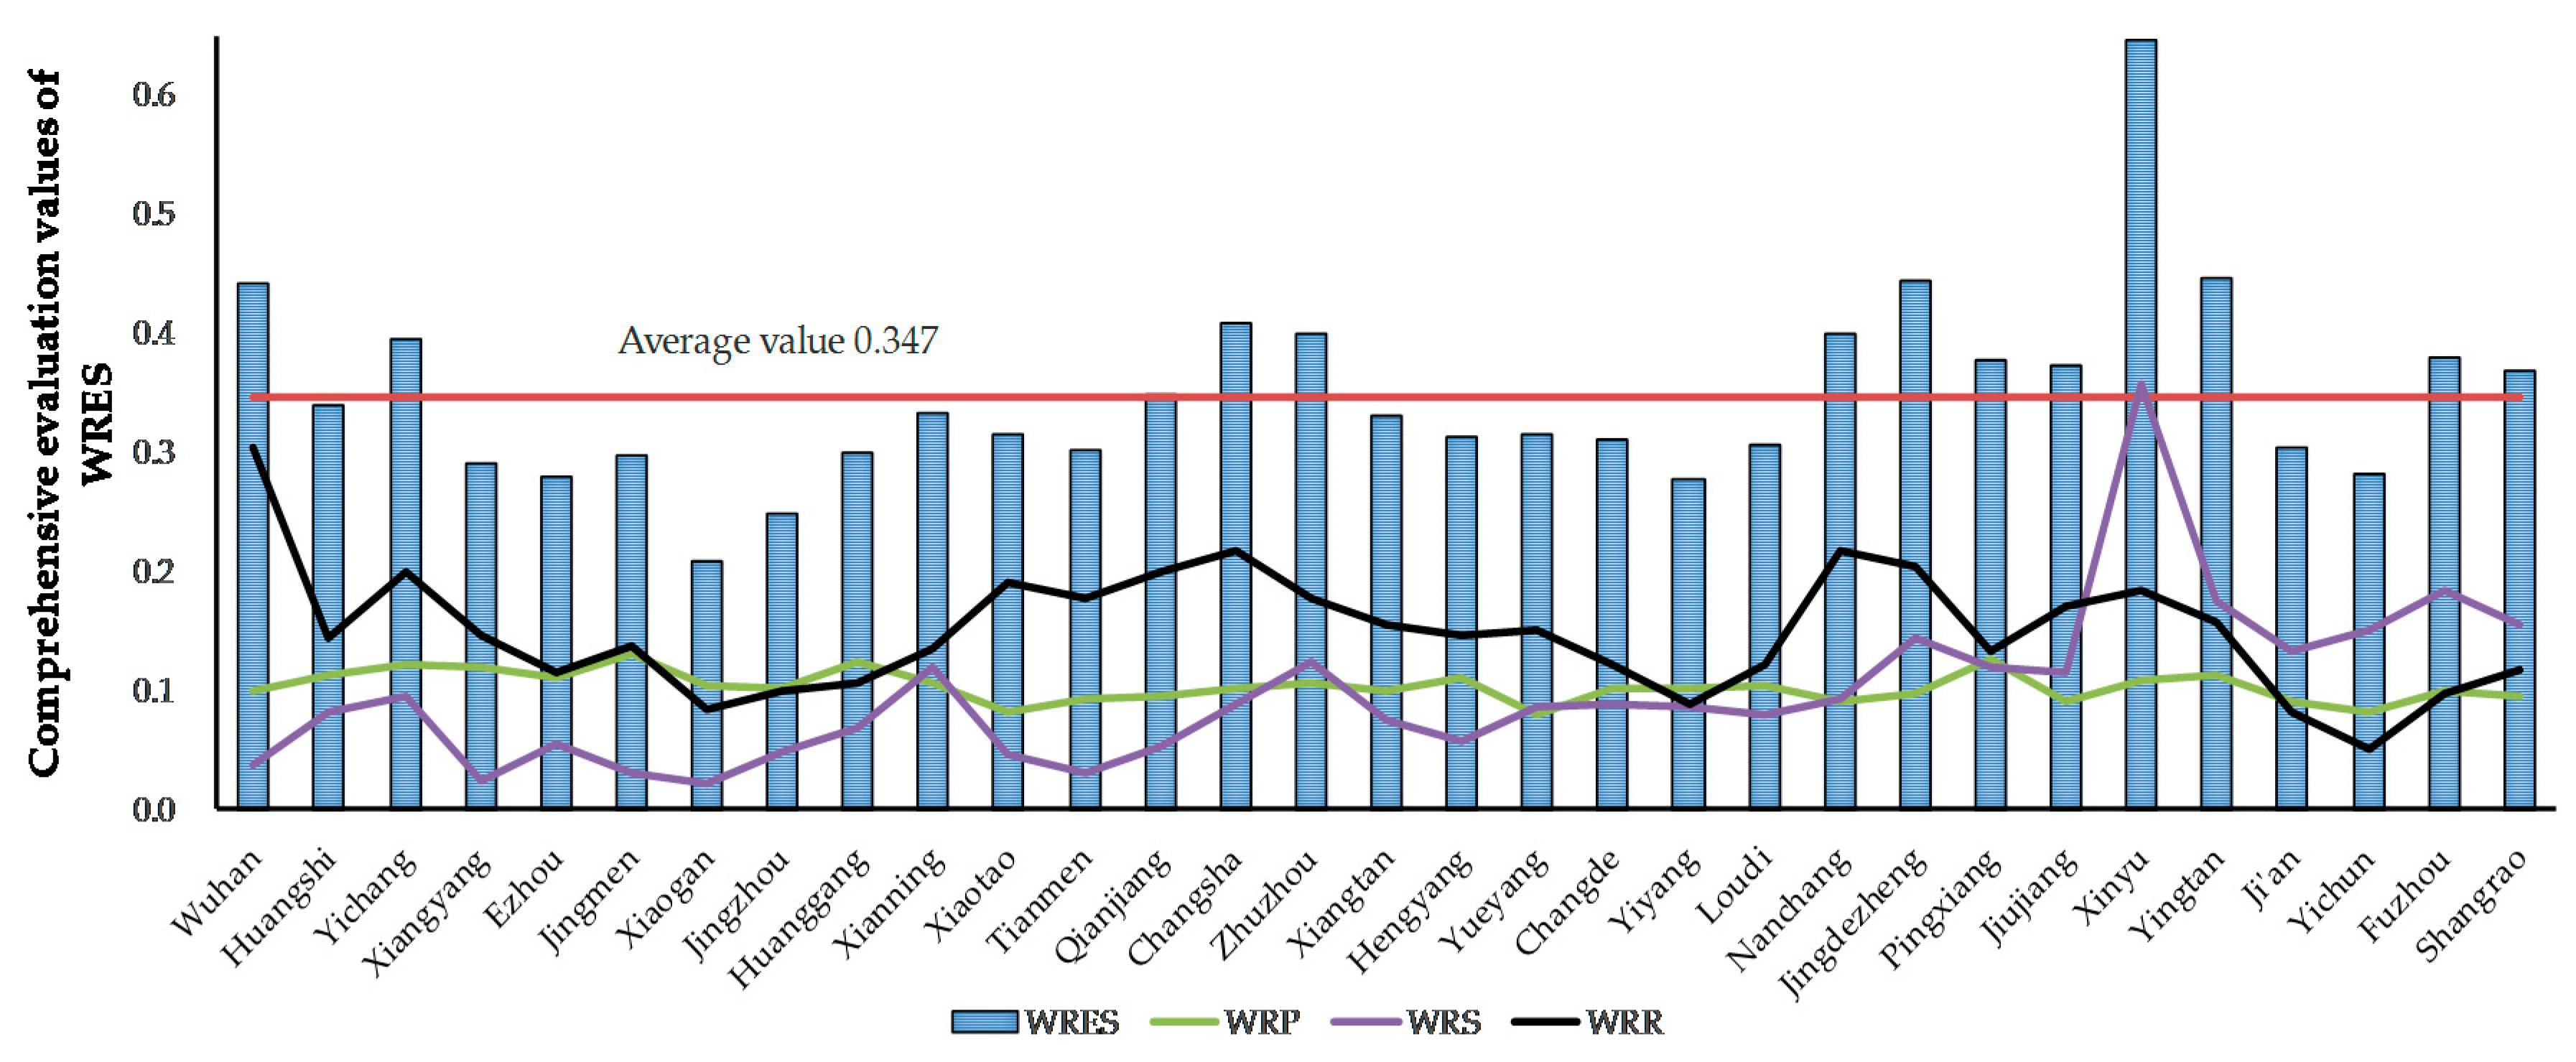
5.1. Comprehensive Evaluation of WRES and HQEDS
5.2. Analysis of Static Coordination Degree
5.3. Analysis of Dynamic Coordination Degree
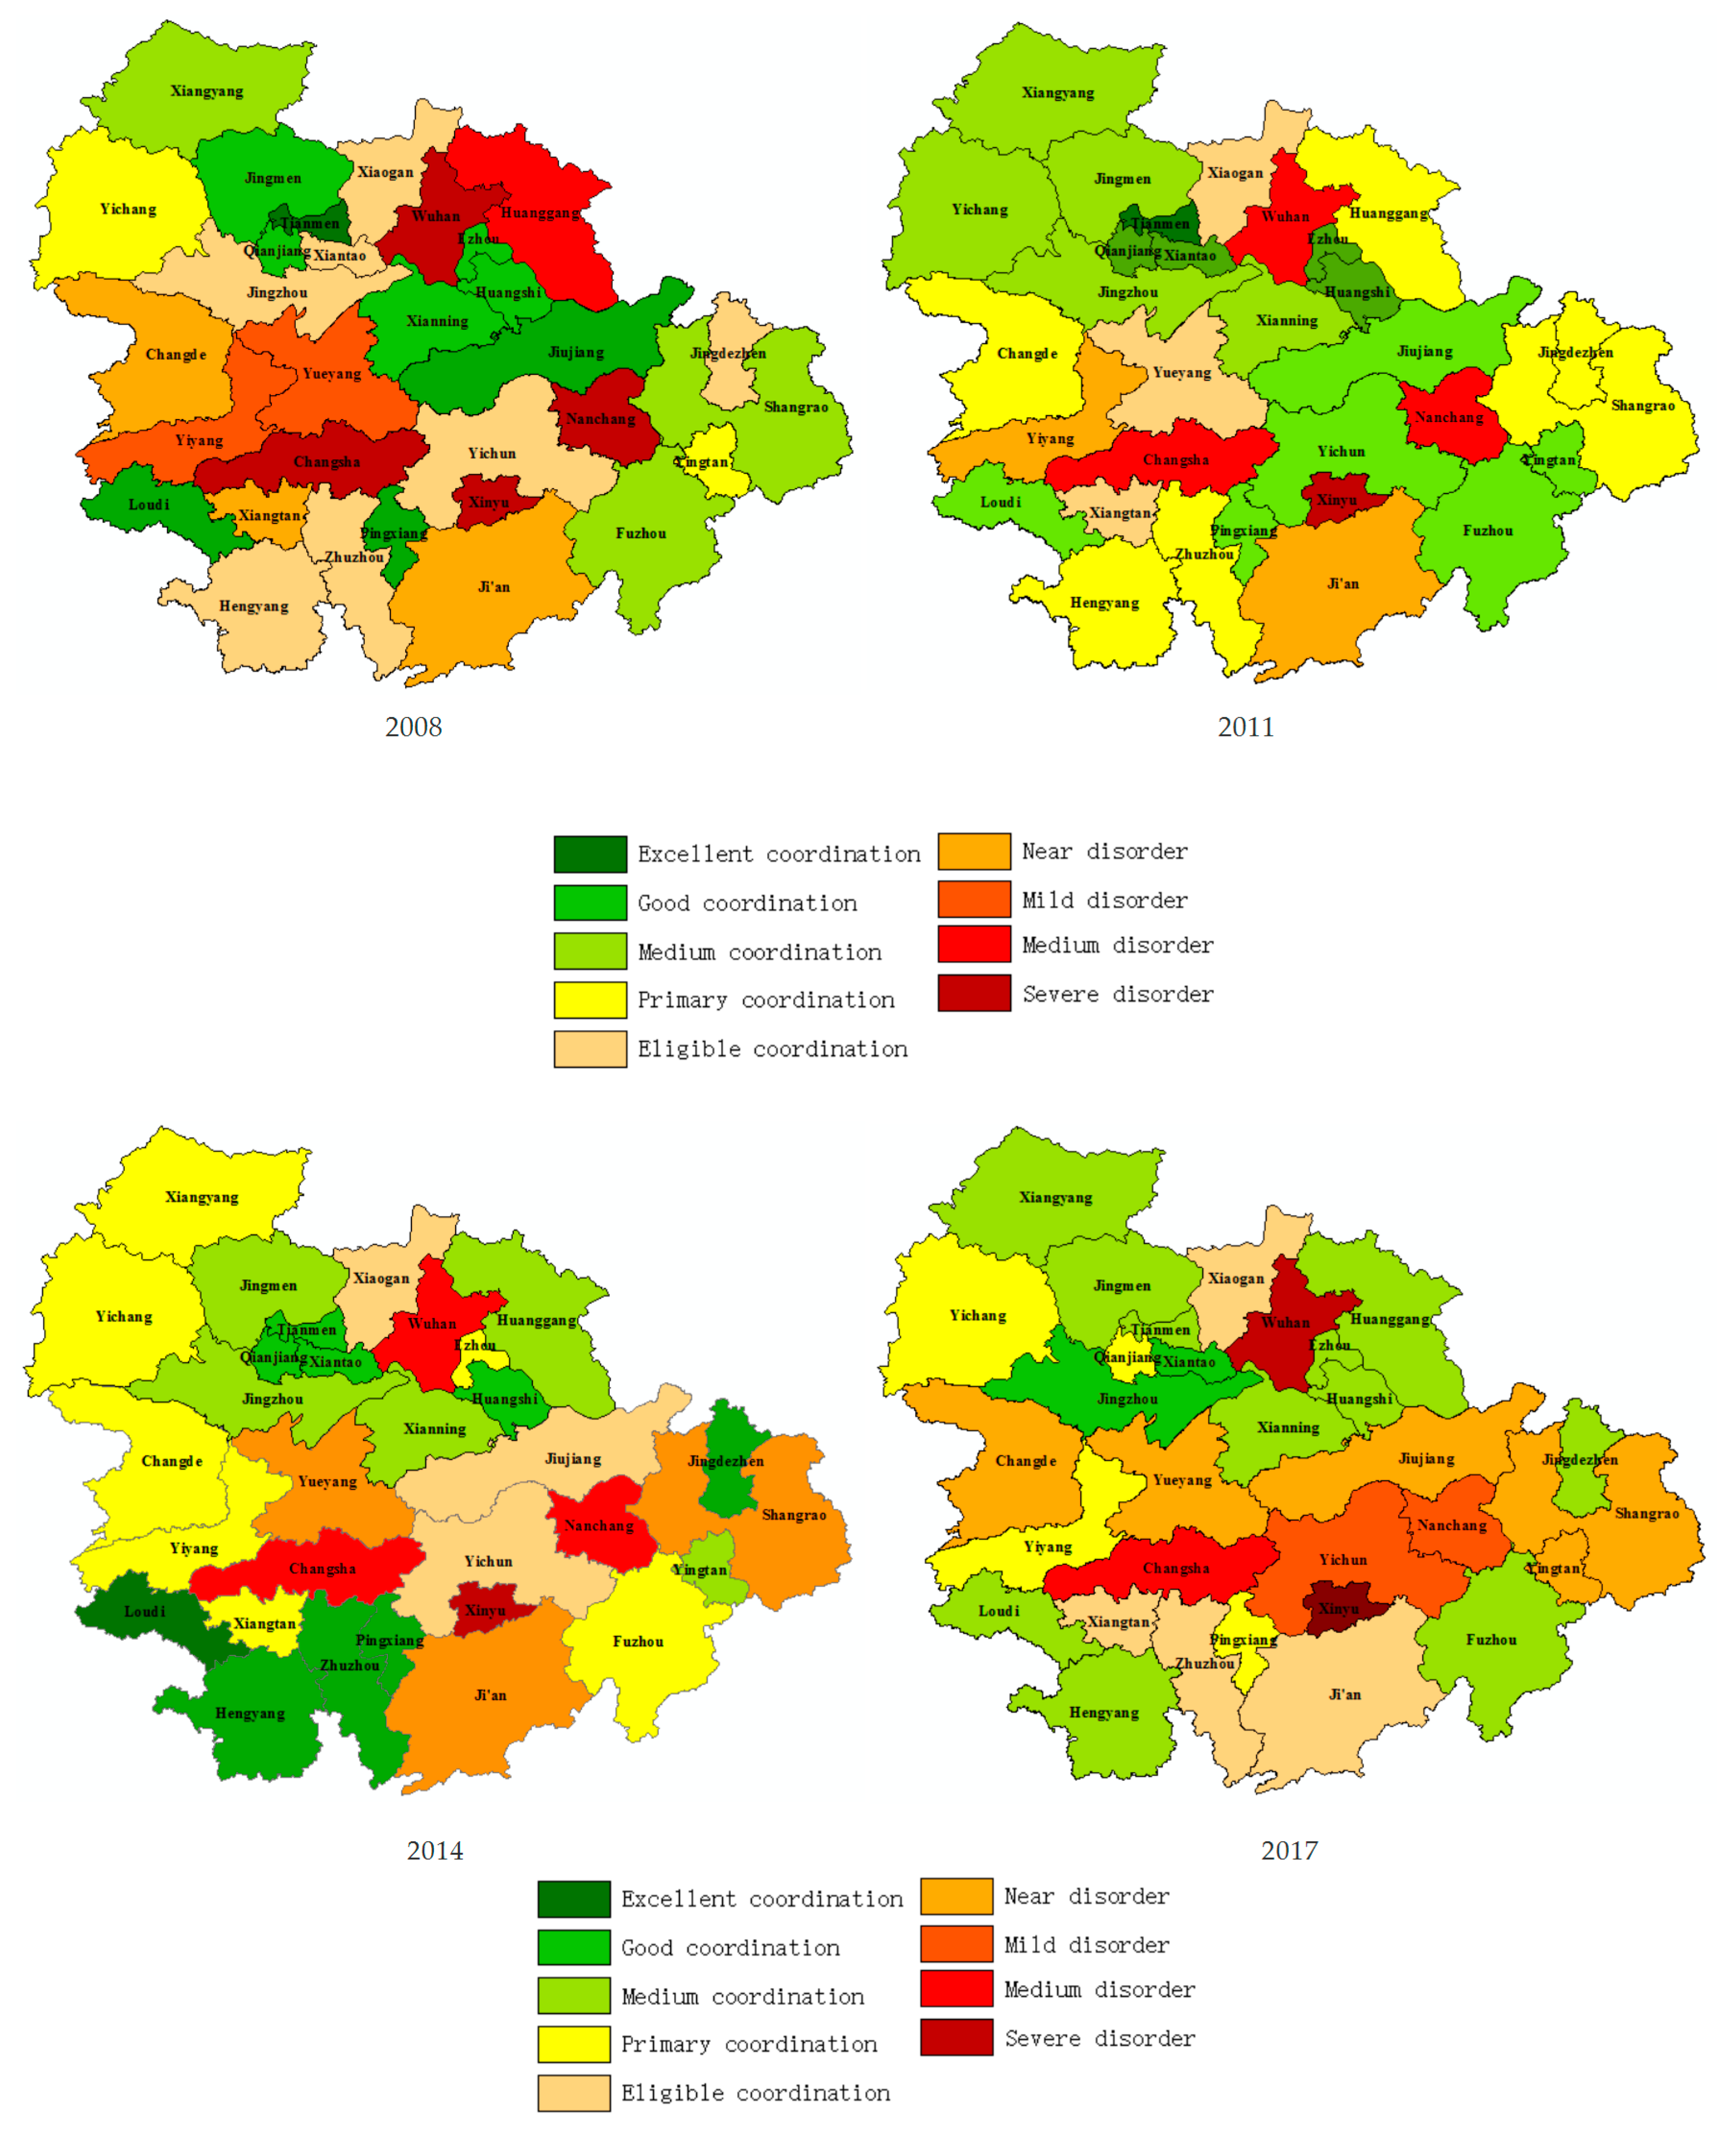
- From temporal characteristics, the number of cities in which the coordination type was retained in good coordination and above (Cd > 0.8) varied with time. Specifically, in 2008, the number of cities that had a coordination degree that was in good coordination and above was nine, and the cities’ average coordination degree was 0.860. In 2011, the number decreased to five, and the average coordination degree slightly dropped to 0.852. In 2014, the number increased to nine again and the average coordination degree remained at 0.852. However, in 2017, the number sharply fell to three and the average declined to 0.830. This signified that the superior coordination relationship between the WRES and the HQEDS in the urban agglomeration tended to be unstable during the study period. Combined with the evaluation values of the two subsystems, it was the unsynchronized improvement of the WRES and the HQEDS that resulted in the sharp decline of the quantity of well coordinated cities. From 2014, high-quality economic development had accelerated, but the water resources environment sluggishly improved and even invariably stagnated. Therefore, for the urban agglomeration in the middle reaches of Yangtze river, the key direction to promote the coordinated relationship between the WRES and the HQEDS lies in the improvement of the water resources environment by taking advantage of high-quality economic achievement.
- From spatial characteristics, the coordination degrees of Xinyu and the three provincial cities (i.e., Wuhan, Changsha and Nanchang) were continuously in a poor level. For the four cities, the reasons that caused the severe imbalance between the WRES and the HQEDS were different. Specifically, Xinyu had the top average scores for the WRES out of all cities because of its advantageous water resources condition, but it failed to translate the favorable natural condition into the driving force for high-quality economic development, which is, for Xinyu, reasonable water utilization to enhance economic benefit. As the three center cities in the urban agglomeration, Wuhan, Changsha and Nanchang, taking priority in the high-quality economic development, it was urgent to convert the advantages from high-quality economic development into impetus to improve the water resources environment, such as the upgrading of water-related infrastructure, the promotion of pollution-reducing technologies and the supporting of water conservation industries.
- The nature of the coordination may have significantly varied among regions with the same coordination type. Although the dynamic coordination degrees of Xiangyang and Fuzhou remained in the range of (0.60–0.80), the evaluation scores for the WRES and the HQEDS in Fuzhou were both higher than the overall average scores (its average scores for the WRES and the HQEDS were 0.379 and 0.420, respectively), thus its coordination should be defined as high-high coordination. However, the evaluation scores for the WRES and the HQEDS of Xiangyang were both below the overall average values (its average scores for the WRES and the HQEDS were 0.290 and 0.364, respectively), and its coordination should be defined as low-low coordination. Therefore, in order to identify the differences among the cities with the same coordination type in detail, the comprehensive values of the WRES and the HQEDS must be considered.
6. Conclusions
- (1)
- Based on the synergetic mechanism between the water resources environment and high-quality economic development, the WRES were divided into water resources pressure, water resources state and water resources response; whereas the HQEDS was composed of economic development, sharing development, innovation development and green development.
- (2)
- Comparing the evaluation values of the WRES and the HQEDS of the three urban agglomerations from 2008 to 2017, the Wuhan urban agglomeration had higher scores for water resources response and economic development; the Chang-Zhu-Tan urban agglomeration had a prominent performance in water resources response and innovation development; and the urban agglomeration around Poyang Lake had advantages in water resources state and green development.
- (3)
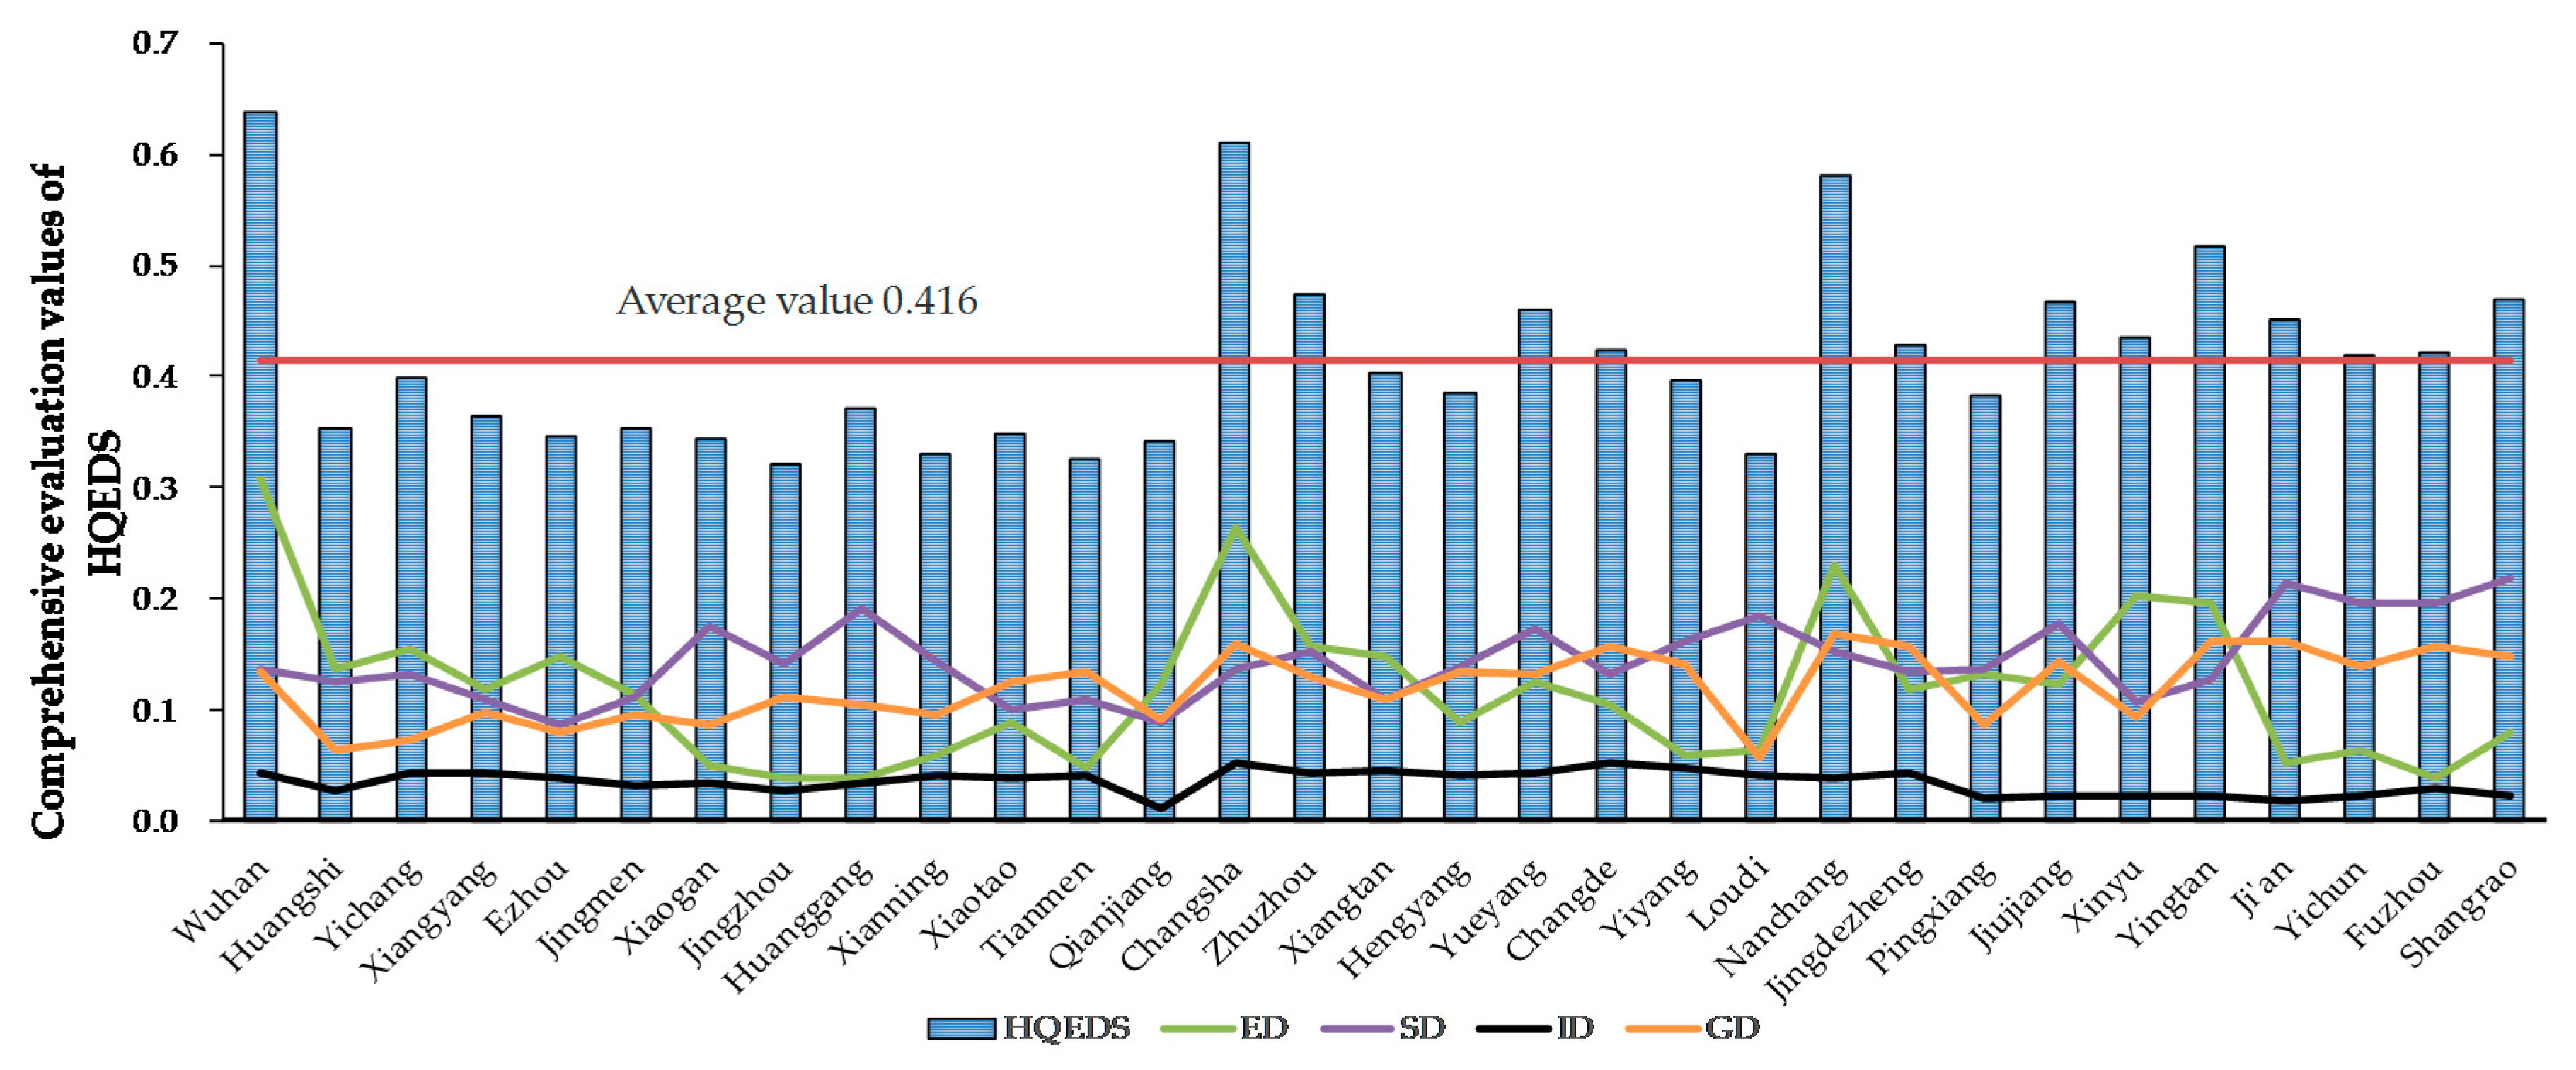
- According to the comprehensive evaluation values of the WRES and the HQEDS, less than half of the cities of the urban agglomeration in the middle reaches of the Yangtze River had evaluation values that exceeded the overall average values, and thus the cities in the urban agglomeration still had lots of room for improvement in terms of the water resources environment and high-quality economic development.
- (4)
- The analysis of the static coordination degrees measured by the MFCM suggested that there were significant regional differences in the coordination degrees between the WRES and the HQEDS. According to the static coordination degrees, 31 cities in the urban agglomeration were divided into five types, namely the constantly rising type, the constantly declining type, the rising-declining type, the declining-rising type and the fluctuation type.
- (5)
- The analysis of the dynamic coordination degrees calculated by the MFCM demonstrated that, in the study period, the cities that kept in good coordination and above decreased sharply in recent years, and Xinyu and the three provincial cities (i.e., Wuhan, Changsha and Nanchang) constantly had poor performances. Therefore, effective and scientific approaches that can promote the mutual conversion of advantages and achievements between the water resources environment and high-quality economic development should be raised and applied, in combination with practical solutions.
Author Contributions
Funding
Acknowledgments
Conflicts of Interest
References
- Karaouzas, I.; Smeti, E.; Vourka, A.; Vardakas, L.; Mentzafou, A.; Tornés, E.; Sabater, S.; Muñoz, I.; Skoulikidis, N.T.; Kalogianni, E. Assessing the ecological effects of water stress and pollution in a temporary River-Implications for water management. Sci. Total Environ. 2018, 618, 1591–1604. [Google Scholar] [CrossRef] [PubMed]
- Fang, D.C.; Ma, W.B. Study on the measurement of China’s inter-provincial high-quality development and its spatial-temporal characteristics. Reg. Econ. Rev. 2019, 2, 61–70. (In Chinese) [Google Scholar]
- Wang, G.Y.; Liu, J. Coordinating Evaluation of Water Resources Environment and Economic Development Based on Improved Water Ecological Footprint: A Case Study of Central Plains Urban Agglomeration. Resour. Environ. Yangtze Basin 2019, 28, 80–90. (In Chinese) [Google Scholar]
- Suinyuy, D.N.; Xiong, Z.X.; Presley, K. Signatures of water resources consumption on sustainable economic growth in Sub-Saharan African countries. Int. J. Sustain. Built Environ. 2016, 5, 114–122. [Google Scholar] [CrossRef] [Green Version]
- Ke, W.L.; Sha, J.H.; Yan, J.J.; Zhang, G.F.; Wu, R.R. A multi-objective input–output linear model for water supply, economic growth and environmental planning in resource-based cities. Sustainability 2016, 8, 160. [Google Scholar] [CrossRef] [Green Version]
- Li, N.; Zhang, J.Q.; Wang, L. Decoupling and water footprint analysis of the coordinated development between water utilization and the economy in urban agglomeration in the middle reaches of the Yangtze River. China Popul. Resour. Environ. 2017, 27, 202–208. (In Chinese) [Google Scholar]
- Zhang, X.J.; Dong, Z.C.; Luo, B.M. Industrial Structure Optimization based on Water Quantity and Quality Restrictions. J. Hydrol. Eng. 2013, 18, 1107–1113. [Google Scholar] [CrossRef]
- Shi, Q.L.; Chen, S.Y.; Shi, C.C. The Impact of industrial transformation on water use efficiency in northwest region of China. Sustainability 2014, 7, 56–74. [Google Scholar] [CrossRef] [Green Version]
- Hristov, J.; Martinovska-Stojcheska, A.; Surry, Y. The economic role of water in FYR Macedonia: An input-output analysis and implications for the Western Balkan countries. Water Econ. Policy 2016, 2, 1650025. [Google Scholar] [CrossRef]
- Wang, J.J.; Guo, M.C.; Jiang, Z.D. The construction and application of an agricultural ecological-economic system coupling process model. Acta Ecol. Sin. 2010, 30, 2371–2378. (In Chinese) [Google Scholar]
- Davijani, M.; Habibi nihabib, M.E.; Anvar, A. Nadjafzadeh. Multi-objective optimization model for the allocation of water resources in arid regions: Based on the maximization of socioeconomic efficiency. J. Hydrol. 2016, 30, 927–946. [Google Scholar] [CrossRef]
- Dou, M.; Zuo, Q.T.; Ma, J.X. Simulation and control of the linked systems of water quantity-water quality-socio-economics in the Huaihe River basin. Hydrol. Sci. J. 2016, 61, 763–774. [Google Scholar] [CrossRef]
- Qi, J. Fiscal expenditure incentives, spatial correlation and quality of economic growth: Evidence from a Chinese province. Int. J. Bus. Manag. 2016, 11, 191–201. (In Chinese) [Google Scholar] [CrossRef]
- Wei, M.; Li, S.H. Study on the measurement of economic high-quality development level in Chinese in the New Era. J. Quant. Tech. Econ. 2018, 35, 3–20. (In Chinese) [Google Scholar]
- Zhang, W.G.; Du, X.Z.; Huang, A.Q.; Yin, H.J. Analysis and comprehensive evaluation of water use efficiency in China. Water 2019, 11, 2620. [Google Scholar] [CrossRef] [Green Version]
- Gao, Y.Y.; Xu, X.Y.; Wang, H.R.; Gao, X.; Yin, X.L. New model for water use efficiency evaluation of China and its application. Syst. Eng. Theory Pract. 2013, 33, 776–784. (In Chinese) [Google Scholar]
- Yan, X.X.; Fan, L.; Fan, Y.Y. Spatial and temporal distribution and evolution of ecological-disaster-social system in China. Macroecon. Res. 2019, 8, 115–127. (In Chinese) [Google Scholar] [CrossRef]
- Tan, F.; Shi, Y.Y. Coupling coordination degree evaluation between water resources environment and economic development: A case study in Jiangsu province. J. Econ. Water Resour. 2019, 37, 8–12. (In Chinese) [Google Scholar]
- Xu, W.J.; Zhang, X.P.; Xu, Q.; Gong, H.L.; Li, Q.; Liu, B.; Zhang, J.W. Study on the coupling coordination relationship between water-use efficiency and economic development. Sustainability 2020, 12, 1246. [Google Scholar] [CrossRef] [Green Version]
- Li, M.X.; Ren, B.P. Comprehensive Evaluation and Path Choice of China’s High-Quality Development in the New Era. Financ. Sci. 2018, 5, 26–40. (In Chinese) [Google Scholar]
- Li, Z.D.; Yang, W.P.; Wang, C.J.; Zhang, Y.S.; Yuan, X.L. Guided high-quality development, resources, and environmental forcing in China’s green development. Sustainability 2019, 11, 1936. [Google Scholar] [CrossRef] [Green Version]
- Wang, Y.B.; Lu, Y.; Wang, W.H. New research progress on the coordinated coupling of high-quality economic development and ecological environmental protection. J. Beijing Univ. Technol. (Soc. Sci. Ed.) 2019, 19, 84–94. (In Chinese) [Google Scholar]
- Zong, G.; Guo, C. Coordination evaluation of urban traffic accessibility and urban spatial structure system in Beijing. Urban Probl. 2014, 5, 49–54. (In Chinese) [Google Scholar] [CrossRef]
- Yao, C.S.; Li, X.T.; Du, H. Coordination between land intensive use and economic development in Yangtze River Delta. Econ. Geogr. 2016, 36, 161–168. (In Chinese) [Google Scholar]
- Jiang, L.Y. Study on the appropriate ratio of the Anhui fiscal revenue to GDP-Based on empirical analysis by Fuzzy Membership Function Model. J. Chongqing Univ. Arts and Sci. (Soc. Sci. Ed.) 2018, 37, 124–131. (In Chinese) [Google Scholar]
- Albertini, E. Does Environmental Management Improve Financial Performance? A Meta-Analytical Review. Organ. Environ. 2013, 26, 431–457. [Google Scholar] [CrossRef]
- Golley, J.; Meng, X. Income Inequality and Carbon Dioxide Emissions: The Case of Chinese Urban Households. Energy Econ. 2012, 34, 1864–1872. [Google Scholar] [CrossRef]
- Zou, Q.; Liao, L.; Ding, Y. Flood Classification Based on a Fuzzy Clustering Iteration Model with Combined Weight and an Immune Grey Wolf Optimizer Algorithm. Water 2019, 11, 80. [Google Scholar] [CrossRef] [Green Version]
- Html. NDRC. The Notice about the Development Plan of the Urban Agglomeration in the Middle Reaches of Yangtze River[R/OL]. Available online: http://www.sdpc.gov.cn/zcfb/zcfbtz/201504/t20150416_688229 (accessed on 13 April 2015).
- Ma, J.; Li, X.F.; Zhang, H. The coordination of urban development quality system in urban agglomeration in the middle reaches of the Yangtze River. Econ. Geogr. 2016, 36, 53–61. (In Chinese) [Google Scholar]
- Xie, S.; Deng, H.B. Quality evaluation of urban agglomeration development in the middle reaches of the Yangtze River. Stat. Decis. 2018, 34, 55–58. (In Chinese) [Google Scholar]
| Target Layer | First-Order Index | Second-Order Index | Third-Order Index | Direction | Weight |
|---|---|---|---|---|---|
| The integrated system of the water resources environment and high-quality economic development | Water resources environment subsystems (WRES) | Water resources pressure | Domestic water per capita for urban residents (X1) | Negative | 0.053 |
| Domestic water per capita for rural residents (X2) | Negative | 0.057 | |||
| Industrial waste water discharge per GDP (X3) | Negative | 0.068 | |||
| Water resources state | Total water resources per capita (X4) | Positive | 0.081 | ||
| Precipitation per unit area (X5) | Positive | 0.037 | |||
| Underground water per unit area (X6) | Positive | 0.276 | |||
| Surface water per unit area (X7) | Positive | 0.051 | |||
| Water resources response | Water consumption per 10,000 yuan of GDP (X8) | Negative | 0.049 | ||
| Water consumption of industrial value added (X9) | Negative | 0.067 | |||
| Water consumption of per mu farmland (X10) | Negative | 0.049 | |||
| Water supply per capita (X11) | Positive | 0.138 | |||
| Public green areas per capita (X12) | Positive | 0.075 | |||
| High-quality economic development subsystems (HQEDS) | Economic development | GDP per capita (X13) | Positive | 0.162 | |
| Gross industrial output per capita (X14) | Positive | 0.107 | |||
| The proportion of tertiary industry GDP to gross GDP (X15) | Positive | 0.117 | |||
| Total actual utilization of foreign capital per capita (X16) | Positive | 0.032 | |||
| Sharing development | Average wages of employees (X17) | Positive | 0.045 | ||
| The proportion of disposable income per capita to GDP per capita (X18) | Positive | 0.095 | |||
| The proportion of disposable income between urban and rural residents (X19) | Negative | 0.090 | |||
| Registered urban unemployment rate (X20) | Negative | 0.060 | |||
| Innovation development | The proportion of science and technology expenditure in government expenditure (X21) | Positive | 0.029 | ||
| The growth rate of value added of high-tech industries (X22) | Positive | 0.049 | |||
| Green development | Unit GDP energy-consuming parameter (X23) | Negative | 0.126 | ||
| General comprehensive utilization of solid waste (X24) | Positive | 0.022 | |||
| Sound urban garbage treatment rate (X25) | Positive | 0.031 |
| Coordination Degree | Type | Coordination Degree | Type |
|---|---|---|---|
| 0.90–1.00 | Excellent coordination | 0.40–0.49 | Near disorder |
| 0.80–0.89 | Good coordination | 0.30–0.39 | Mild disorder |
| 0.70–0.79 | Medium coordination | 0.20–0.29 | Medium disorder |
| 0.60–0.69 | Primary coordination | 0.10–0.19 | Severe disorder |
| 0.50–0.59 | Eligible coordination | 0.01–0.09 | Extreme disorder |
| Lag Order | AIC Value | R-Squared | |
|---|---|---|---|
| Water Resources Environment | High-Quality Economic Development | ||
| 1 | −7.2078 | 0.6116 | 0.7377 |
| 2 | −5.8612 | 0.8024 | 0.7647 |
| 3 | −1.2724 | 0.8224 | 0.7626 |
| 4 | −5.4856 | 0.8251 | 0.7638 |
| 5 | −2.1888 | 0.8209 | 0.7648 |
| Region | City | 2008 | 2009 | 2010 | 2011 | 2012 | 2013 | 2014 | 2015 | 2016 | 2017 |
|---|---|---|---|---|---|---|---|---|---|---|---|
| Wuhan urban agglomeration | Wuhan | 0.170 | 0.247 | 0.364 | 0.328 | 0.169 | 0.278 | 0.151 | 0.128 | 0.209 | 0.177 |
| Huangshi | 0.842 | 0.868 | 0.869 | 0.625 | 0.750 | 0.982 | 0.947 | 0.810 | 0.889 | 0.492 | |
| Yichang | 0.645 | 0.765 | 0.870 | 0.583 | 0.517 | 0.709 | 0.604 | 0.745 | 0.753 | 0.583 | |
| Xiangyang | 0.710 | 0.704 | 0.677 | 0.800 | 0.529 | 0.754 | 0.653 | 0.836 | 0.723 | 0.805 | |
| Ezhou | 0.844 | 0.744 | 0.961 | 0.852 | 0.602 | 0.490 | 0.731 | 0.743 | 0.769 | 0.820 | |
| Jingmen | 0.872 | 0.679 | 0.695 | 0.926 | 0.496 | 0.980 | 0.687 | 0.802 | 0.907 | 0.724 | |
| Xiaogan | 0.579 | 0.542 | 0.666 | 0.604 | 0.339 | 0.634 | 0.514 | 0.645 | 0.724 | 0.448 | |
| Jingzhou | 0.560 | 0.668 | 0.889 | 0.796 | 0.553 | 0.939 | 0.591 | 0.916 | 0.730 | 0.984 | |
| Huanggang | 0.280 | 0.543 | 0.725 | 0.971 | 0.483 | 0.879 | 0.649 | 0.926 | 0.909 | 0.559 | |
| Xianning | 0.833 | 0.904 | 0.757 | 0.703 | 0.749 | 0.934 | 0.673 | 0.688 | 0.647 | 0.917 | |
| Xiaotao | 0.555 | 0.957 | 0.947 | 0.910 | 0.585 | 0.952 | 0.974 | 0.682 | 0.852 | 0.974 | |
| Tianmen | 0.954 | 0.877 | 0.913 | 0.999 | 0.729 | 0.838 | 0.875 | 0.754 | 0.961 | 0.556 | |
| Qianjiang | 0.845 | 0.839 | 0.715 | 0.912 | 0.812 | 0.962 | 0.780 | 0.697 | 0.716 | 0.516 | |
| Chang-Zhu-Tan urban agglomeration | Changsha | 0.112 | 0.213 | 0.285 | 0.210 | 0.349 | 0.309 | 0.228 | 0.052 | 0.114 | 0.420 |
| Zhuzhou | 0.514 | 0.362 | 0.820 | 0.928 | 0.584 | 0.994 | 0.827 | 0.355 | 0.609 | 0.374 | |
| Xiangtan | 0.418 | 0.569 | 0.784 | 0.615 | 0.536 | 0.725 | 0.538 | 0.505 | 0.772 | 0.239 | |
| Hengyang | 0.598 | 0.337 | 0.862 | 0.750 | 0.671 | 0.986 | 0.914 | 0.767 | 0.655 | 0.861 | |
| Yueyang | 0.376 | 0.492 | 0.787 | 0.353 | 0.297 | 0.591 | 0.478 | 0.323 | 0.244 | 0.659 | |
| Changde | 0.415 | 0.557 | 0.741 | 0.806 | 0.499 | 0.961 | 0.514 | 0.241 | 0.429 | 0.739 | |
| Yiyang | 0.379 | 0.396 | 0.603 | 0.575 | 0.453 | 0.952 | 0.501 | 0.499 | 0.684 | 0.845 | |
| Loudi | 0.872 | 0.555 | 0.778 | 0.928 | 0.816 | 0.981 | 0.894 | 0.918 | 0.798 | 0.488 | |
| Urban agglomeration around Poyang Lake | Nanchang | 0.177 | 0.249 | 0.376 | 0.337 | 0.208 | 0.146 | 0.309 | 0.235 | 0.205 | 0.596 |
| Jingdezheng | 0.558 | 0.557 | 0.500 | 0.824 | 0.657 | 0.819 | 0.923 | 0.809 | 0.933 | 0.747 | |
| Pingxiang | 0.838 | 0.547 | 0.812 | 0.678 | 0.962 | 0.939 | 0.948 | 0.522 | 0.677 | 0.487 | |
| Jiujiang | 0.841 | 0.836 | 0.536 | 0.824 | 0.407 | 0.489 | 0.427 | 0.178 | 0.559 | 0.511 | |
| Xinyu | 0.104 | 0.060 | 0.068 | 0.233 | 0.101 | 0.108 | 0.096 | 0.140 | 0.128 | 0.109 | |
| Yingtan | 0.610 | 0.689 | 0.779 | 0.768 | 0.711 | 0.664 | 0.964 | 0.215 | 0.316 | 0.157 | |
| Ji’an | 0.477 | 0.335 | 0.408 | 0.469 | 0.412 | 0.488 | 0.293 | 0.557 | 0.283 | 0.885 | |
| Yichun | 0.541 | 0.748 | 0.837 | 0.964 | 0.657 | 0.439 | 0.156 | 0.181 | 0.424 | 0.568 | |
| Fuzhou | 0.777 | 0.961 | 0.625 | 0.684 | 0.794 | 0.726 | 0.590 | 0.709 | 0.930 | 0.590 | |
| Shangrao | 0.788 | 0.223 | 0.878 | 0.534 | 0.582 | 0.409 | 0.456 | 0.713 | 0.248 | 0.333 |
© 2020 by the authors. Licensee MDPI, Basel, Switzerland. This article is an open access article distributed under the terms and conditions of the Creative Commons Attribution (CC BY) license (http://creativecommons.org/licenses/by/4.0/).
Share and Cite
Zhu, H.; Zhu, J.; Zou, Q. Comprehensive Analysis of Coordination Relationship between Water Resources Environment and High-Quality Economic Development in Urban Agglomeration in the Middle Reaches of Yangtze River. Water 2020, 12, 1301. https://doi.org/10.3390/w12051301
Zhu H, Zhu J, Zou Q. Comprehensive Analysis of Coordination Relationship between Water Resources Environment and High-Quality Economic Development in Urban Agglomeration in the Middle Reaches of Yangtze River. Water. 2020; 12(5):1301. https://doi.org/10.3390/w12051301
Chicago/Turabian StyleZhu, Hua, Jinsheng Zhu, and Qiang Zou. 2020. "Comprehensive Analysis of Coordination Relationship between Water Resources Environment and High-Quality Economic Development in Urban Agglomeration in the Middle Reaches of Yangtze River" Water 12, no. 5: 1301. https://doi.org/10.3390/w12051301


