Article

Magnetic Sorbent for the Removal of Selenium(IV) from Simulated Industrial Wastewaters: Determination of Column Kinetic Parameters

1
Chemical Sciences Division, Oak Ridge National Laboratory, Oak Ridge, TN 37831, USA
2
The Bredesen Center for Interdisciplinary Research and Graduate Education, The University of Tennessee, Knoxville, TN 37996, USA
3
Energy and Transportation Science Division, Oak Ridge National Laboratory, Oak Ridge, TN 37831, USA
*
Author to whom correspondence should be addressed.
Contributed equally.
Water 2020, 12(5), 1234; https://doi.org/10.3390/w12051234
Submission received: 1 April 2020 / Revised: 21 April 2020 / Accepted: 22 April 2020 / Published: 26 April 2020
(This article belongs to the Special Issue Water Treatment with New Nanomaterials)

Abstract

:
A novel meso- and microporous tire-derived-carbon support with magnetic iron oxide nanoparticle adsorbents that selectively adsorbs Se(IV) ions from simulated contaminated water has been developed. In this work, the physicochemical characteristics of the composite adsorbent are characterized with respect to porosity and surface area, chemical composition, and microstructure morphology. The kinetics of this composite adsorbent in a fixed-bed setting has been determined. Several column runs were conducted and analyzed by inductively coupled plasma-optical emission spectroscopy (ICP-OES) to determine the concentration gradient vs time. These results were then fit to a pseudo-second order rate law to obtain equilibrium values. Combining calculated equilibrium values with effluent concentration data, enabled the application of the Adams–Bohart model to determine reaction constants and column coefficients. Column parameters obtained from different flow rates and fittings of the Adams–Bohart model were remarkably consistent. These findings enable the application of this sorbent to fixed-bed column systems and opens up further research into mixed pollutants tests with real wastewater and scaling of selenium pollutant removal.

Graphical Abstract

1. Introduction

Mining, fossil, and petrochemical operations often produce significant quantities of wastewater with high concentrations of toxic metals such as selenium, arsenic, and lead [1,2,3,4]. The millions of gallons of wastewater produced from industrial activities present an economic, legal, and technological challenge as the water must be treated before being stored or reintroduced back into the environment [5,6,7,8]. Previous research has explored the use of composite materials derived from sources of industrial waste, such as tires and iron chloride [9], as adsorbents that can affordably and sustainably reduce selenium concentrations to EPA standards of ≤50 ppb. These materials can be easily integrated into an industrial purification process by flowing wastewater through a fixed bed of composite adsorbents in a continuous-flow system.
Ion uptake rates of adsorbents vary when scaling from batch adsorption to continuous column tests due to transport effects. Fixed beds can experience uneven flow distribution, z-axis concentration gradients, mass transport limitations due to the presence of inert media, and other mass transport limitations. However, fixed-bed columns are of simple design and perform effectively in the removal of low concentration pollutants [10]. Kinetics models, such as the Adams–Bohart model, have been developed to model the sorbent behavior in continuous settings [11]. Employing such models to understand the behavior at a small scale can ease transition to full-scale industrial processes. By quantifying the maximum adsorption capacity, rate of adsorption, and breakthrough curve (a plot of concentration of the adsorbate in the effluent vs. time) [12], the operation of adsorption columns can be optimized. Rate law and kinetic constants can also be used to normalize columns to account for varying volumes, masses, and flow rates.
A variety of materials are known to adsorb selenium species effectively including mesoporous materials [13], graphene based composites [14], and a variety of metal oxides [15], layered-double hydroxides [16], metal-organic frameworks (MOFs) [17], MgO nanosheets [18], carbon nanotubes [19], and bioremediation-based methods [20,21,22]. Other methods, such as mineralization [23], capacitive deionization, and catalyzed reduction [24] are also known but not the focus of the current work. As separation materials are developed, they need to be aligned with a more sustainable future in mind. There are twelve principles of circular chemistry of particular importance [25]. In this work, the adsorbent material addressed two concerns in this area, namely the collection and use of waste and the optimization of resource efficiency. The sorbent was synthesized from waste tire material and iron chloride, FeCl3, both of which are waste products from different sectors. Additionally, the sorbent was able to be regenerated and reused, decreasing the need for large amounts of adsorbent material.
A tire-derived carbon has recently been demonstrated in our laboratory as an effective support for iron oxide magnetic adsorbents for selectively removing Se(IV) ions from contaminated water [9]. While it is most effective in a fluidized bed, due to the ease of removal of the magnetized particles, determining its viability in fixed-bed systems is still of importance. This is due to the lower cost, simplicity, and predictable behavior in the removal of low concentration pollutants. Herein, the physicochemical characteristics of this composite adsorbent were characterized, and its kinetic behavior with respect to Se(IV) uptake in a fixed-bed setting was determined and analyzed to inform its effective use.

2. Experimental Methods

2.1. Carbon Supported Magnetic Nanoparticle Adsorbents (C-MNA) Synthesis

Tire derived carbon was synthesized as described in previous work [9]. To enhance its activity, it was ground with potassium hydroxide pellets (Sigma Aldrich, >85%) in a 1:4 weight ratio. The mixture was then placed in a furnace and heated at a 10 °C/min ramp rate to 800 °C, where it was kept under nitrogen atmosphere for 1.5 h. The mixture was then removed, cooled to ambient temperature, and neutralized with 3M hydrochloric acid (EMD Millipore).
C-MNA was synthesized by suspending 0.5 g of activated carbon in 120 mL of deionized water containing 13 mmol of iron sulfate, FeSO4·7H2O (Sigma Aldrich, ≥99.0%) and 15.6 mmol FeCl3·6H2O (Sigma Aldrich, ≥97.0%). The mixture was then sonicated for 5 min and stirred at 70 °C for 1 h. 3M sodium hydroxide solution was added in excess to maximize iron oxide nanoparticle (FeNP) precipitation. C-MNA was then vacuum filtered and separated from the excess iron chloride mother liquor via magnetic filtration and washing with DI water.

2.2. Column Set Up

A solution containing 5 ppm Se(IV) at pH 5 was prepared by dissolving sodium selenite (Sigma Aldrich, 99%) into deionized water. The pH was adjusted with dilute hydrochloric acid. As demonstrated in Figure 1, the column was prepared by using a standard jacketed borosilicate glass column with a radius of 0.5 cm and a bed height of 13 cm, lining the bottom with approximately 2.5-cm height of cotton, adding sand containing 5 weight % of C-MNA, and finally adding 2.5-cm height of pure sand on the top. A peristaltic pump was used to deliver the Se(IV) solution at varying flow rates. The effluent was collected manually in increments of 9.5 mL and sampled for analysis via inductively coupled plasma optical emission spectroscopy (ICP-OES) [26]. The column was prepared for trials by flowing 20 mL of dilute hydrochloric acid of pH 5 through the column before adding the Se(IV) solution. After the adsorbent was fully saturated with Se(IV), the column was flushed with 1 M sodium hydroxide solution of pH 11 to desorb Se(IV). This demonstrates that the adsorbents can be recycled as shown in Figure 1.

2.3. Characterization

X-ray powder diffraction (XRD) patterns were collected using a PANalytical Empyrean instrument (Malvern, UK) with a Cu Kα radiation. All data were processed with HighScore Plus (Malvern, United Kingdom). Brunauer-Emmett-Teller (BET) surface areas and pore-size distributions were determined from nitrogen adsorption isotherms at 77 K using Autosorb-1 from Quantachrome (Anton Paar GmbH, Austria). The pore-size distributions and pore volumes were calculated from the DFT/Monte Carlo method using the QSDFT adsorption branch model. ICP-OES compositional analysis was performed to determine selenite removal from the solution using a Thermo Fisher iCAP Model 7400 ICP-OES Duo. The ICP-OES has a minimum selenium detection limit of 0.77 µg/L at wavelength 196 nm. During measurements, the linear standard curve had an R2 value of 1 and a limit of detection of 0.049 ppm. A Zeiss Merlin VP scanning electron microscopy (SEM) (White Plains, NY, USA) operated at 3 kV and a Hitachi HD-2300A scanning transmission electron microscope (STEM) with a field emission source operated at 200 kV in bright-field imaging mode at a 2.1 Å resolution, were used to characterize the surface morphologies of the samples.

2.4. Kinetic Model

The kinetic equations were derived from the kinetic rate law equation for pseudo-second order reactions, as a variety of carbon based materials display this general adsorption behavior [27,28]. Equation (1) assumes that the adsorption capacity is correlated to the number of active sites on the surface.
d q t d t = k ( q e q t ) 2
In this equation, qe and qt refer to the equilibrium concentration and the concentration at time t, respectively. The k parameter is the kinetic constant. With the boundary conditions of t0 = 0, t = t, q0 = q(t = 0) = 0, and q(t) = qt, a solution was derived and rearranged to a linear form as seen in Equations (2)–(5). Equation (5) is then used to fit experimental data.
1 q e q t 1 q e = k t
q t q e 2 q e q t = k t
q t = k t q e 2 1 + k t q e
1 q t = ( 1 k q e 2 ) 1 t + 1 q e
The derivation of the Adams–Bohart model starts with a modified chemical rate law expression as shown in Equation (6) [29].
q t = k A B C ( q 0 q )
The analytical solution provided by Adams and Bohart is shown in Equations (7) and (8) [30].
C C 0 = e x p ( α ) e x p ( α ) + exp ( β ) 1
α = k A B C 0 ( t Z v ) ;   β = k A B ρ p q 0 Z v 1 ε ε
Here, the following simplifications are made [28]:
  • e x p ( α ) , e x p ( β ) 1
    The quantity 1 at the denominator of Equation (7) is thus regarded as insignificant.
  • t Z v
    Since the time of the experiment far outweighs the residence time, the residence-time term can be ignored.
The following definitions are also used:
  • ρ P q 0 ( 1 ε ) = N 0
  • ε v = u
Equation (7) is then simplified into the recognizable form in Equation (9) [12]. Although this equation is used to calculate the breakthrough time, or the time before the effluent concentration exceeds acceptable levels [12], the Adams–Bohart equation can be used to predict changes in the effluent concentration over time.
l n ( C o C B 1 ) = k A B N o Z u k A B C o t B
Equation (9) can be rewritten with the following adjustments as seen in Equation (10).
N 0 Z u = q o M Q
We can rewrite u as Q A and then rewrite N 0 Z A as q o M since both reduce to the amount of solute adsorbed in the system.
l n ( C o C B 1 ) = k A B q o M Q k A B C o t B

3. Results and Discussion

The C-MNA adsorbent utilized in this study was fully characterized, including SEM, EDS, and magnetic property measurements in previous work [9]. XRD patterns of the column mixture of adsorbent and inert packing material shown in Figure 2 indicates the presence of both C-MNA and sand in the mixed material. SEM images of sand, C-MNA and the composite mixture are shown in Figure 3. SEM images of C-MNA and the porous carbon surfaces are clearly seen. Additionally, the large sand particles are mixed with smaller C-MNA particles homogenously in the mixture. Finally, a BET analysis was performed to determine the surface area of the different materials as another assurance of C-MNA mixing with the inert packing material. In Figure 4, surface areas of 6.8 m2/g for sand, 638 m2/g for C-MNA, and 45.5 m2/g for the mixture were determined, confirming that the high surface area C-MNA was mixed with inert sand packing material.
In continuous flow systems, kinetics data are normalized for comparison to the residence time. The residence time, or the total time that the solution is in contact with the sorbent, is calculated by dividing the total bed volume by the volumetric flow rate.
R e s i d e n c e   T i m e = B e d   V o l u m e V o l u m e t r i c   F l o w   R a t e
By expressing kinetics relative to residence time, we can make sure that the effects of bed volume size or flow rate are not omitted. In our column runs, we assumed that there was good radial mixing and no axial dispersion. As seen in Figure 5, the composite adsorbent steadily adsorbed Se(IV) until reaching a plateau between 0.4 and 0.5 mg Se per g adsorbent, suggesting monolayer formation on the carbon surface of the adsorbent [29]. Subsequent adsorption is thought to be a result of mass transfer of Se(IV) into the mesopores of the carbon support structures and formation of a multilayer on the surface of the iron nanoparticles, since the adsorption profile fits the two stage adsorption characteristic of a Type IV adsorption isotherm [19]. At a higher flow rate of Se(IV) solution, the initial rate of Se(IV) adsorption is higher than Se(IV) adsorption at a lower flow rate because there is a greater concentration gradient between the bulk concentration and the concentration adsorbed [27], which means a greater driving force for mass transfer.
Sand was mixed with adsorbent because the small grain size of the adsorbent caused packing issues. Previous studies used sand as an inert medium to house sorbents [26]. However, sand is known to physisorb selenium as well as other contaminants [31,32]. To quantify the adsorption capacity of the sand, a column was filled with pure sand (still including the cotton layer at the bottom), and water containing 5 ppm Se(IV) at a pH of 5 was flowed through the column. The concentration of the effluent was compared to the initial concentration to calculate how much Se(IV) was adsorbed per gram of sand. At a flow rate of 2.92 mL/min and a pH value of 5, the adsorption capacity was low (6.8 µg/g), as shown in Figure 6, compared to the total of ~500 µg/g in the presence of the composite adsorbent. Based on these tests, the adsorption of sand was determined to be negligible. Instead, the adsorption is attributed to the embedded FeNPs and surface adsorption on the carbon support. Although correction for Se(IV) adsorption by sand did not change fundamental conclusions about the reaction rate or adsorption behavior, the equilibrium concentrations and kinetics constants were affected. As a result, all data subsequently shown and discussed contain corrections made for sand adsorption.

3.1. Rate Law

To further elucidate the mechanism and kinetics of the composite adsorption of previously studied carbon and iron-based adsorbents, the adsorption rate was modeled using a second-order kinetic rate equation, as shown in Equation (7). From Figure 7, the adsorption kinetics is strongly consistent with pseudo-second order reactions and corroborates trends observed in kinetic data taken from other studies [33,34]. The equilibrium concentration and kinetic constant were also obtained from this model and subsequently used in Adams–Bohart kinetic model calculations (see Table 1).
Previous batch studies report the maximum adsorption concentration achieved was 1.14 mg/g [9]. When the sorbent is mixed with inert sand in a fixed-bed column, several factors could lead to a decrease in the observed uptake of Se. Channeling could restrict water flow to certain sections of the column, preventing the sorbent in that region from interacting with selenite. The inert medium could cover the mesopores in the composite sorbent, again restricting adsorbate flow to the iron nanoparticles housed within the mesopores. In addition, batch tests are performed with the adsorbent free flowing in solution, thus increasing the wettability of the sorbent in comparison to the fixed column. Finally, due to lower concentrations of the adsorbate near the bottom of the column, preventing the full utilization of the adsorbent for selenite removal, the adsorbent in that area could require extended time to reach equilibrium.

3.2. Adams–Bohart Model

The Adams–Bohart model utilizes the following assumptions: (1) flow rate is constant, (2) absence of axial dispersion, (3) behavior matches the rectangle (irreversible) isotherm (i.e., highly favorable adsorption), and (4) adsorption rate follows second-order reaction kinetics [30]. The data were fit with a linear regression line as shown in Figure 8, and the rate constant (kBA) was calculated from the m and b terms of the linear regression equation (y = mx + b).
The literature shows two forms (Equations (9) and (10)) of the Adams–Bohart model [11,30]. Although both models yield kinetic constants while maintaining dimensional homogeneity, they differ slightly in the method by which the kinetic constant is derived. One equation can be used to calculate the constants by equilibrium adsorption per unit volume, while the other can be used to determine the constants on a per unit mass basis. The two forms of the same model would be considered identical if the contents of the column were homogenized and uniform [30]. However, the presence of both an inert medium and the composite sorbent in our column means that local densities and adsorption capacities could vary. In our case, we chose to include the mass and volume of sand in our calculations in order to obtain more precise values. As discussed above, further tests indicated that the sand did play a minor role in the adsorption of Se(IV).
Linear regression fits were performed on the data in Figure 8, providing two equations to determine kinetic parameters from. For a resonance time of 3.5 min and 6 min, the regressions were y = −0.0502x + 2.1309 and y = −0.0617x + 2.4508, respectively. Since the rate constant appears in both the m and b terms of the linear regression equation, each fitting could yield two rate constants. Between these two terms the slope (m) produced more consistent parameter values, making them more useful for the predictions of the fixed-bed behavior [30]. A better agreement with the observed column adsorption behavior was seen by only including the initial adsorption of the column. This is reflective of the constraints of the model, as the Adams–Bohart model is typically used to depict breakthrough curves rather than overall adsorption curves [12]. As seen in Table 2 and Table 3, many of the kinetic constants derived from the m and b components across all forms of the Adams–Bohart model and all residence times were similar. Only the values calculated on a per unit mass basis (Equation (10)) deviated significantly, potentially due to variance in equilibrium concentration calculations or sand adsorption behavior. The differing rate constants from the m and b terms potentially originate from multiple kinds of adsorption taking place or multiple reactions occurring. Another possibility is the existence of a pseudo-solution which can be eliminated by comparing the kinetic rate constants from both equations and over both runs. When compared to values obtained from experimental data, the theoretical values calculated from concentration measurements resulted in rate constants that displayed a small initial deviation from the experimentally obtained values that subsequently decreased as the column reached full saturation.

4. Conclusions

Column kinetics were determined by first analyzing the rate law to obtain equilibrium concentrations. Subsequently, this data was fitted to the Adams–Bohart model, enabling the calculation of critical data on column kinetics of C-MNA adsorbents in a fixed-bed system. Since the data displayed strong correlation to a pseudo-second order linear regression fit, the equilibrium concentrations could be applied to an Adams–Bohart providing a better understanding of column behavior. Within a continuous-flow setting, the Adams–Bohart model predicts column behavior with reasonable accuracy, given certain limitations. Given the mixture of semi-inert sand and composite adsorbent, calculations were found to be more accurate when the mass and volume of the sand were included in the model. Given the lack of literature on the Se(IV) adsorption behavior in a fixed-bed column, this analysis provides valuable insight as corporations and governments continue to require new technologies for waste and contaminated water processing. This work provides insights to enable further work on mixed pollutant removal in addition to industrial scaling of this column.
Finally, although magnetism has not been taken advantage of in the current work, it can be used to create macroporosity in a sorbent bed and thereby increase mass transfer, while reducing pressure drop. It is well known that magnetically stabilized beds can have the benefits of fixed beds, in terms of simplicity and high separation efficiency, and fluidized beds with respect to high mass-transfer rates and low pressure drop. Future work will be focused on removing Se(IV) from real wastewater using magnetically stabilized sorbent beds with magnetic sorbent based on tire-derived carbon.

Author Contributions

Conceptualization, A.Y., S.F.E., C.T. and M.P.P.; methodology, A.Y., S.F.E. and C.T.; formal analysis, A.Y., S.F.E. and C.T.; resources, M.P.P.; data curation, A.Y. and S.F.E.; writing—original draft preparation, A.Y., S.F.E.; writing—review and editing, C.T., M.P.P.; supervision, M.P.P.; funding acquisition, M.P.P. All authors have read and agreed to the published version of the manuscript.

Funding

The synthesis of carbon composite materials was sponsored by the U.S. Department of Energy, Office of Science, Office of Basic Energy Sciences, Materials Sciences and Engineering Division. This work was supported in part by the U.S. Department of Energy, Office of Science, Office of Workforce Development for Teachers and Scientists (WDTS) under the Science Undergraduate Laboratory Internship (SULI) program. S.F.E. is grateful for a fellowship from the Bredesen Center. We would like to thank Dr. Rich Lee, RJ Lee Group for providing tire derived carbon.

Acknowledgments

This manuscript has been authored by UT-Battelle LLC under Contract No. DE-AC05-00OR22725 with the U.S. Department of Energy. The United States Government retains and the publisher, by accepting the article for publication, acknowledges that the United States Government retains a non-exclusive, paid-up, irrevocable, world-wide license to publish or reproduce the published form of this manuscript, or allow others to do so, for United States Government purposes. The Department of Energy will provide public access to these results of federally sponsored research in accordance with the DOE Public Access Plan (http://energy.gov/downloads/doe-public-access-plan).

Conflicts of Interest

The authors declare no conflict of interest. The funders had no role in the design of the study; in the collection, analyses, or interpretation of data; in the writing of the manuscript, or in the decision to publish the results.

Abbreviations

Relevant Variables
kkinetic constant (g mg−1 min−1)
qeequilibrium concentration (mg g−1)
qtconcentration at time t (mg g−1)
ttime (min)
CBbreakthrough concentration (mg cm−3)
Csorbate concentration in bulk (mg cm−3)
C0initial sorbate concentration in feed (mg cm−3)
kABAdams–Bohart rate constant (cm3 mg−1 s−1)
Mmass of adsorbent (g)
N0sorption capacity per unit volume of fixed bed (mg cm−3)
qsorbate concentration in adsorbent (mg g−1)
q0sorption capacity per unit mass of adsorbent (mg g−1)
Qflow rate (cm3 s−1)
tBbreakthrough time (s)
usuperficial velocity (cm s−1)
νinterstitial velocity (cm s−1)
Vvolume of solution (mL)
Ztotal bed depth (cm)
εcolumn void fraction
ρPapparent adsorbent density (g cm−3)

References

  1. Liu, Y.-T.; Chen, T.-Y.; Mackebee, W.G.; Ruhl, L.; Vengosh, A.; Hsu-Kim, H. Selenium Speciation in Coal Ash Spilled at the Tennessee Valley Authority Kingston Site. Environ. Sci. Technol. 2013, 47, 14001–14009. [Google Scholar] [CrossRef]
  2. Walls, S.J.; Jones, D.S.; Stojak, A.R.; Carriker, N.E. Ecological risk assessment for residual coal fly ash at Watts Bar Reservoir, Tennessee: Site setting and problem formulation. Integr. Environ. Assess. Manag. 2015, 11, 32–42. [Google Scholar] [CrossRef]
  3. Khamkhash, A.; Srivastava, V.; Ghosh, T.; Akdogan, G.; Ganguli, R.; Aggarwal, S. Mining-related selenium contamination in Alaska, and the state of current knowledge. Minerals 2017, 7, 46. [Google Scholar] [CrossRef]
  4. Lemly, A.D. Aquatic selenium pollution is a global environmental safety issue. Ecotoxicol. Environ. Saf. 2004, 59, 44–56. [Google Scholar] [CrossRef] [Green Version]
  5. Grimalt, J.O.; Ferrer, M.; Macpherson, E. The mine tailing accident in Aznalcollar. Sci. Total Environ. 1999, 242, 3–11. [Google Scholar] [CrossRef]
  6. Johnson, D.B. Chemical and microbiological characteristics of mineral spoils and drainage waters at abandoned coal and metal mines. Water Air Soil Pollut. Focus 2003, 3, 47–66. [Google Scholar] [CrossRef]
  7. Deonarine, A.; Kolker, A.; Doughten, M.W. Trace Elements in Coal Ash; US Geological Survey: New York, NY, USA, 2015; pp. 2327–6932. [Google Scholar]
  8. Hartuti, S.; Kambara, S.; Takeyama, A.; Kumabe, K.; Moritomi, H. Direct quantitative analysis of arsenic in coal fly ash. J. Anal. Methods Chem. 2012, 2012. [Google Scholar] [CrossRef] [Green Version]
  9. Evans, S.F.; Ivancevic, M.R.; Yan, J.; Naskar, A.K.; Levine, A.M.; Lee, R.J.; Tsouris, C.; Paranthaman, M.P. Magnetic adsorbents for selective removal of selenite from contaminated water. Sep. Sci. Technol. 2019, 54, 2138–2146. [Google Scholar] [CrossRef]
  10. Sze, M.F.F.; Lee, V.K.C.; McKay, G. Simplified fixed bed column model for adsorption of organic pollutants using tapered activated carbon columns. Desalination 2008, 218, 323–333. [Google Scholar] [CrossRef]
  11. Aksu, Z.; Gönen, F. Biosorption of phenol by immobilized activated sludge in a continuous packed bed: Prediction of breakthrough curves. Process Biochem. 2004, 39, 599–613. [Google Scholar] [CrossRef]
  12. Taniguchi, M.; Wang, K.; Gamo, T. Land and Marine Hydrogeology; Elsevier: Amsterdam, The Netherlands, 2003. [Google Scholar]
  13. Awual, M.R.; Hasan, M.M.; Ihara, T.; Yaita, T. Mesoporous silica based novel conjugate adsorbent for efficient selenium (IV) detection and removal from water. Microporous Mesoporous Mater. 2014, 197, 331–338. [Google Scholar] [CrossRef]
  14. Fu, Y.; Wang, J.; Liu, Q.; Zeng, H. Water-dispersible magnetic nanoparticle–graphene oxide composites for selenium removal. Carbon 2014, 77, 710–721. [Google Scholar] [CrossRef]
  15. Sheha, R.; El-Shazly, E. Kinetics and equilibrium modeling of Se (IV) removal from aqueous solutions using metal oxides. Chem. Eng. J. 2010, 160, 63–71. [Google Scholar] [CrossRef]
  16. Asiabi, H.; Yamini, Y.; Shamsayei, M. Highly selective and efficient removal of arsenic(V), chromium(VI) and selenium(VI) oxyanions by layered double hydroxide intercalated with zwitterionic glycine. J. Hazard. Mater. 2017, 339, 239–247. [Google Scholar] [CrossRef]
  17. Howarth, A.J.; Katz, M.J.; Wang, T.C.; Platero-Prats, A.E.; Chapman, K.W.; Hupp, J.T.; Farha, O.K. High Efficiency Adsorption and Removal of Selenate and Selenite from Water Using Metal–Organic Frameworks. J. Am. Chem. Soc. 2015, 137, 7488–7494. [Google Scholar] [CrossRef]
  18. Cui, W.; Li, P.; Wang, Z.; Zheng, S.; Zhang, Y. Adsorption study of selenium ions from aqueous solutions using MgO nanosheets synthesized by ultrasonic method. J. Hazard. Mater. 2018, 341, 268–276. [Google Scholar] [CrossRef]
  19. Vilardi, G.; Mpouras, T.; Dermatas, D.; Verdone, N.; Polydera, A.; Di Palma, L. Nanomaterials application for heavy metals recovery from polluted water: The combination of nano zero-valent iron and carbon nanotubes. Competitive adsorption non-linear modeling. Chemosphere 2018, 201, 716–729. [Google Scholar] [CrossRef]
  20. Khakpour, H.; Younesi, H.; Mohammadhosseini, M. Two-stage biosorption of selenium from aqueous solution using dried biomass of the baker’s yeast Saccharomyces cerevisiae. J. Environ. Chem. Eng. 2014, 2, 532–542. [Google Scholar] [CrossRef]
  21. Tuzen, M.; Sarı, A. Biosorption of selenium from aqueous solution by green algae (Cladophora hutchinsiae) biomass: Equilibrium, thermodynamic and kinetic studies. Chem. Eng. J. 2010, 158, 200–206. [Google Scholar] [CrossRef]
  22. Nettem, K.; Almusallam, A.S. Equilibrium, Kinetic, and Thermodynamic Studies on the Biosorption of Selenium (IV) Ions onto Ganoderma Lucidum Biomass. Sep. Sci. Technol. 2013, 48, 2293–2301. [Google Scholar] [CrossRef]
  23. Serrà, A.; Artal, R.; García-Amorós, J.; Sepúlveda, B.; Gómez, E.; Nogués, J.; Philippe, L. Hybrid Ni@ZnO@ZnS-Microalgae for Circular Economy: A Smart Route to the Efficient Integration of Solar Photocatalytic Water Decontamination and Bioethanol Production. Adv. Sci. 2020, 7, 1902447. [Google Scholar] [CrossRef]
  24. Hill, C.M. Review of Available Technologies for the Removal of Selenium from Water; Final Report for North American Metals Council: Washington, DC, USA, June 2010. [Google Scholar]
  25. Keijer, T.; Bakker, V.; Slootweg, J.C. Circular chemistry to enable a circular economy. Nat. Chem. 2019, 11, 190–195. [Google Scholar] [CrossRef]
  26. Islam, M.T.; Saenz-Arana, R.; Hernandez, C.; Guinto, T.; Ahsan, M.A.; Bragg, D.T.; Wang, H.; Alvarado-Tenorio, B.; Noveron, J.C. Conversion of waste tire rubber into a high-capacity adsorbent for the removal of methylene blue, methyl orange, and tetracycline from water. J. Environ. Chem. Eng. 2018, 6, 3070–3082. [Google Scholar] [CrossRef]
  27. Robati, D. Pseudo-second-order kinetic equations for modeling adsorption systems for removal of lead ions using multi-walled carbon nanotube. J. Nanostruct. Chem. 2013, 3, 55. [Google Scholar] [CrossRef] [Green Version]
  28. Cooney David, O. Adsorption Design for Wastewater Treatment; CRC Press LLC: Boca Raton, FL, USA, 1999; pp. 9–20. [Google Scholar]
  29. Ho, Y.-S.; McKay, G. Pseudo-second order model for sorption processes. Process Biochem. 1999, 34, 451–465. [Google Scholar] [CrossRef]
  30. Chu, K.H. Fixed bed sorption: Setting the record straight on the Bohart–Adams and Thomas models. J. Hazard. Mater. 2010, 177, 1006–1012. [Google Scholar] [CrossRef] [PubMed]
  31. Kent, D.; Davis, J.; Anderson, L.; Rea, B. Transport of chromium and selenium in a pristine sand and gravel aquifer: Role of adsorption processes. Water Resour. Res. 1995, 31, 1041–1050. [Google Scholar] [CrossRef]
  32. Awan, M.A.; Qazi, I.A.; Khalid, I. Removal of heavy metals through adsorption using sand. J. Environ. Sci. 2003, 15, 413–416. [Google Scholar]
  33. Maiti, A.; DasGupta, S.; Basu, J.K.; De, S. Batch and column study: Adsorption of arsenate using untreated laterite as adsorbent. Ind. Eng. Chem. Res. 2008, 47, 1620–1629. [Google Scholar] [CrossRef]
  34. Tanhaei, B.; Ayati, A.; Lahtinen, M.; Sillanpää, M. Preparation and characterization of a novel chitosan/Al2O3/magnetite nanoparticles composite adsorbent for kinetic, thermodynamic and isotherm studies of Methyl Orange adsorption. Chem. Eng. J. 2015, 259, 1–10. [Google Scholar] [CrossRef]
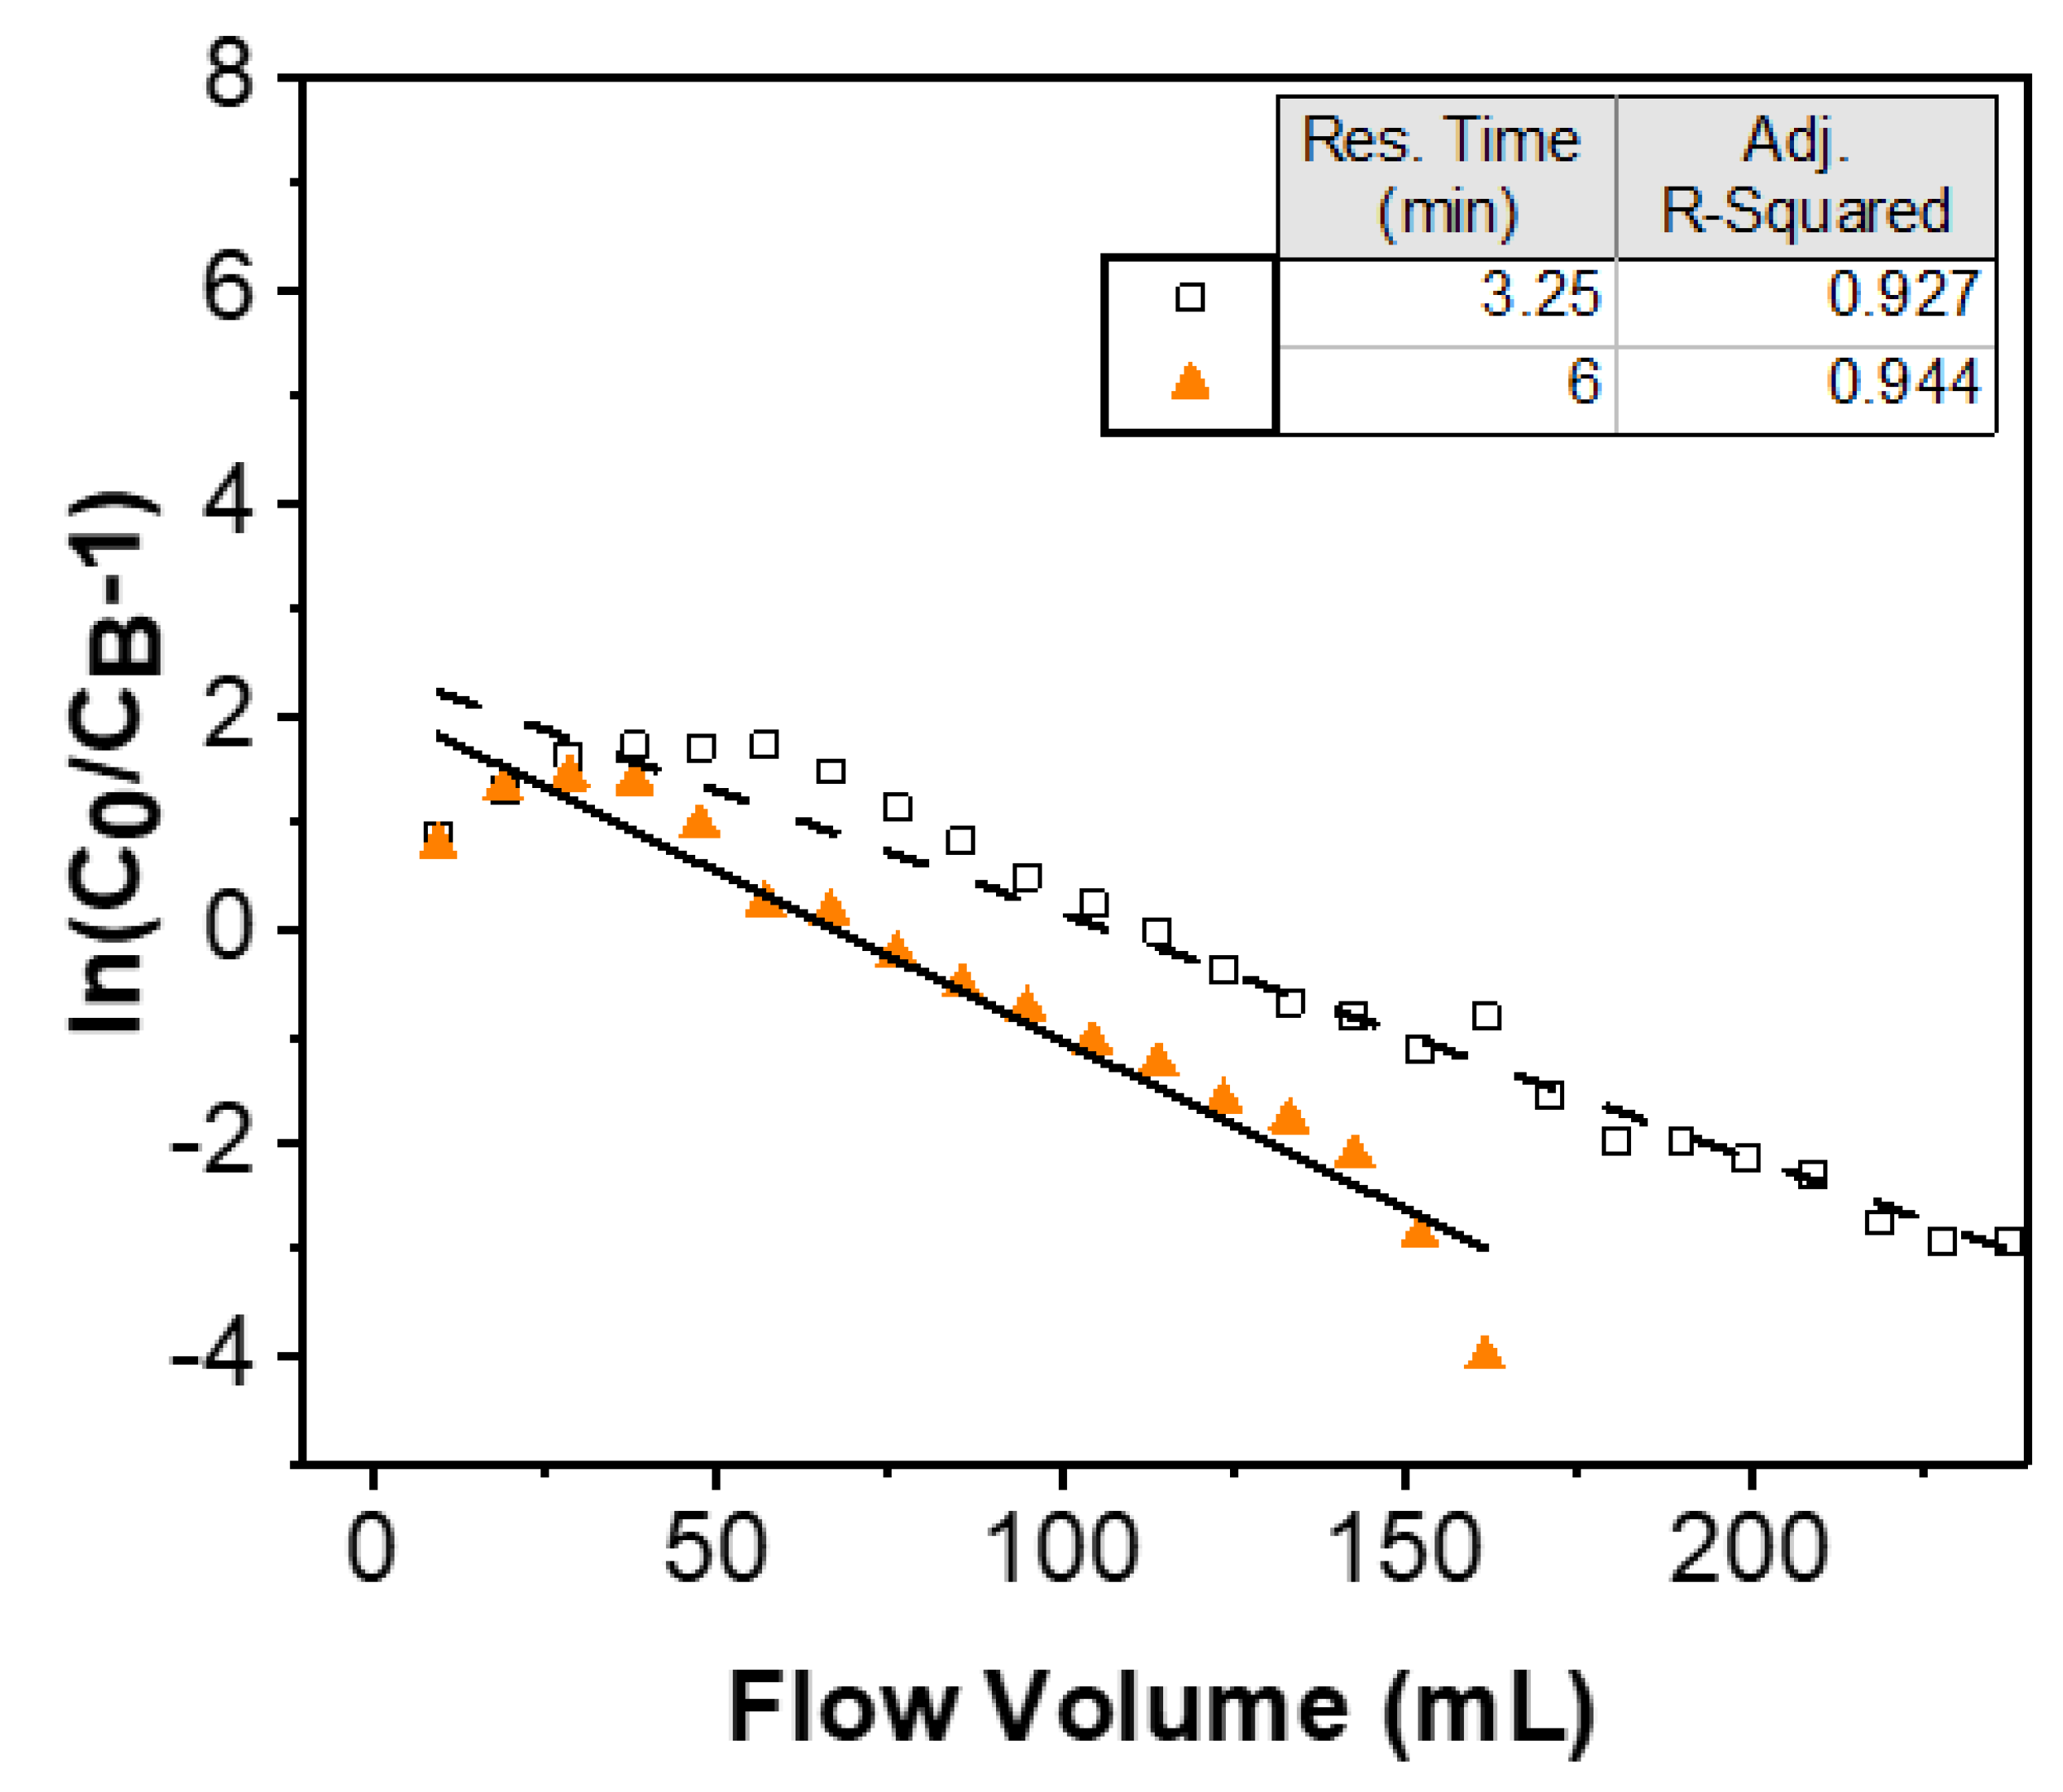
Figure 1. Schematic of the bench scale column set up. After Se (IV) removal from the contaminated stream, 1M NaOH solution can be flushed into the column to desorb Se (IV) in the form of sodium selenite by exiting through the top of the column.
Water 12 01234 g001
Figure 2. X-ray powder diffraction (XRD) patterns of column materials sand, C-MNA, and a mixture of the two.
Water 12 01234 g002
Figure 3. SEM images of (a) sand; (b) C-MNA adsorbent material; and (c) mixture of sand and C-MNA composite material.
Water 12 01234 g003
Figure 4. BET analysis of (a) sand; (b) C-MNA adsorbent material; and (c) mixture of sand and C-MNA used in the column.
Water 12 01234 g004
Figure 5. Se adsorption of column at differing flow rates to determine breakthrough times.
Water 12 01234 g005
Figure 6. Adsorption of Se in sand as a control for inert column materials present.
Water 12 01234 g006
Figure 7. Linear regression fit of data to second order kinetics equation in agreement with expected pseudo-second order behavior.
Water 12 01234 g007
Figure 8. Linear regression fit of data to Adams–Bohart model. Values from these regressions were used in the calculation of kinetic constants in Table 2 and Table 3.
Water 12 01234 g008
Table 1. Equilibrium concentration and kinetic constants from 2nd order kinetic model fitting.
Residence Time (min)Theoretical Se Uptake (mg g−1)Observed Se Uptake (mg g−1)Kinetic Constant (g mg−1 min−1)
3.253.3050.5130.001
60.7240.4070.013
Table 2. Kinetic constants calculated from the slope.
Residence Time (min)Equation UsedkAB (mL/mg/min)
3.2590.011
100.013
690.009
100.009
Table 3. Kinetic constants calculated from the y-intercept.
Residence Time (min)Equation UsedkAB (mL/mg/min)
3.2590.002
102.167
690.005
104.661

