Article

Periodic Oscillation of Sediment Transport Influenced by Winter Synoptic Events, Bohai Strait, China

1
College of Marine Geosciences, Key Laboratory of Submarine Geosciences and Prospecting Technology, Ocean University of China, 238 Songling Road, Qingdao 266100, China
2
Department of Ocean Science and Engineering, Southern University of Science and Technology, Shenzhen 518055, China
3
Laboratory for Marine Geology, Qingdao National Laboratory for Marine Science and Technology (QNLM), Qingdao 266061, China
*
Author to whom correspondence should be addressed.
Water 2020, 12(4), 986; https://doi.org/10.3390/w12040986
Submission received: 19 January 2020 / Revised: 7 March 2020 / Accepted: 30 March 2020 / Published: 31 March 2020

Abstract

:
Instruments on two bottom-mount platforms deployed in the Bohai Strait during a cruise from January 6–13, 2018 recorded an intense northerly wind event. The responses of hydrodynamic and hydrographical characteristics in Bohai Sea and Yellow Sea to the wind event were analyzed aided by the wind, wave, sea surface suspended sediment concentration and sea surface height datasets from open sources. It is shown that the strong wind event had a significant impact on the redistribution of sea surface height, regional wave conditions, regional circulations and the accompanying sediment transport pattern. Specifically, the sediment transport through the Bohai Strait may be divided into two chronological phases related to the wind event: (1) the enhanced sediment transport phase during the buildup and peak of the wind event when both the Northern Shandong Coastal Current and regional suspended sediment concentration were sharply increased; and (2) the relaxation phase when the northerly wind subsided or even reversed, accompanied by the enhanced Yellow Sea Warm Current with lowered suspended sediment concentration. Such results at synoptic scale would improve our capability of quantifying sediment exchange between the Bohai and Yellow sea, through the Bohai Strait and provide valuable reference for the study of other similar environments worldwide.

Highlights:

  • One typical, intense winter wind event was captured by in situ measurements in the Bohai Strait.
  • The patterns of circulations and sediment transports around the Bohai Strait were not always constant in winter, but shown oscillating processes corresponding to the synoptic events.
  • A new conceptual model of sediment transport through Bohai Strait in winter was established to reveal the underlying mechanism more clearly.

1. Introduction

A strait is a natural channel that connects two large bodies of waters between which water and particle material are exchanged. Such exchanges of material (water, nutrients, sediment, etc.) and energy (heat) play a critical role in redistribution of heat, salt, pollutants and sediments—as well as regionally biogeochemical cycles [1,2,3].
The Bohai Strait (BHS) between Shandong and Liaodong peninsula is the only pathway connecting two epeiric seas in the northern China, the Bohai Sea (BH) and the North Yellow Sea (NYS) (Figure 1). The ~104 km wide BHS is the shallowest in the southern end, growing deeper northward with a channel as deep as 70 m offshore Liaodong Peninsula [4] (Figure 1). BH is a semi-enclosed shallow (<18 m) marginal sea that is located to the west of BHS [5]. The surface sediment distribution of the BH is characterized by fine-grained sediment covering the southwestern area and coarser sediment covering the east [6]. In BHS, the coarse silt covers the south and it gradually becomes coarser in the north with coarse sand and gravel. The sedimentation rate of the BH is lower than 0.3 cm/yr, except for the central mud area which is ~2 cm/yr [7]. The tidal regime in the BH is dominated by mixed semidiurnal tide with two main tidal constituents of K1 and M2. The maximum tidal current occurs in the north of the BHS with the velocity of 1 m/s [8]. The tidal range in the BHS is lower than 2 m [9]. The residual currents in the BHS are mainly impacted by seasonal monsoon activates and thermal/saline stratifications [10]. The winter circulation in the BH and Yellow Sea (YS) are mainly driven by the intense winter monsoon, while the circulations in summer are maintained by the tilting thermohaline as the wind is much weaker and heat flux is much stronger. Due to the prevailed strong northerly winds, the regional dynamics in winter are significantly stronger than those in other seasons [11]. As a densely populated and important economic zone, the state of the marine environment of BH has been of great concern. Several rivers discharge large amounts of nutrients, pollutants and other terrestrial materials into the BH. In particular, the Yellow River, the second largest river in terms of riverine sediment, transported about 1.2 Gt of terrestrial sediments into the BH annually [12,13,14,15]. Such terrestrial sediments not only accumulated quickly near the estuary, but also transported to the open ocean, through the BHS, contributing to the marine environmental and the geological evolution of the East China Sea [11,16,17,18]. Therefore, accurately characterizing the flux of water and sediment through BHS is of great importance.
In the past decades, numerous studies attempted to quantify the sediment transport using various methods such as sedimentary records [21], in situ observation [22], numerical models [23,24] and satellite remote sensing [25] and produced different and sometimes opposite results. The sediment transport is closely related to the regional circulation structure and the water exchange processes in BHS [11,26,27]. The traditional view of the BHS circulation structure is "inflow in the north and outflow in the south" [20]. The north of the strait is dominated by the Yellow Sea Warm Current (YSWC) [28], while the south by the Northern Shandong Coastal Current (NSCC) [24,29] (Figure 1). This circulation structure changes with seasonal monsoons, more evident in winter than in summer [11,25]. Previous studies mostly focused on the monthly or seasonal variation of the circulation using observations or numerical models [28,29]. However, recent studies showed that certain synoptic events, such as winter storms or summer typhoons, can significantly modulate the circulation system and sediment transport patterns (e.g., [30,31,32,33]). Due to lack of enough temporal (long, continuous time-series) and spatial (synchronized measurements at multiple locations) coverage of field data, how synoptic events such as the strengthening and weakening of winter storm winds alter the sediment transport patterns in the BHS is still unclear.
Here, we present the results and analyses based on field data from an 11-day in situ observation at two locations in BHS in January 2018, during which a typical intense northerly wind event occurred. Based on analyzing the variations of current fields and suspended sediments responding to the different wind conditions, aided by satellite remote sensing and numerical models, the mechanism of sediment transport through BHS affected by the synoptic events is explored and a new conceptual model of sediment transport in the winter is developed.

2. Data and Methods

The field data came from both moored time-series (Tripod, Bottom Mount and Moorings) and shipboard hydrographic surveys (25 h anchor stations) from January 2 to January 13, 2018. Bottom mounted platforms and subsurface moorings for time-series measurements were placed at two stations in the BHS, with T01 in the south at 30 m water depth and T02 in the north at 50 m water depth (Figure 2). The various type of instruments, their settings and placements are listed in Table 1.
In addition, a 25-hour (January 6, 10:00, UTC + 8 to January 7, 11:00, UTC + 8) synchronized casts were conducted from two vessels anchored at T01 and T02 (Table 1). Instruments mounted for the casts included a conductivity/temperature sensor (CT), a turbidity sensor (TU) and one Laser In situ Scattering Transmissometer profiler (LISST). Water samples were collected with Niskin bottles at 3 heights (0.2, 0.4 and 0.8 of total water depth) every hour. The water samples were pumped through pre-weighted micropore filter pairs with 450 μm pore size and 47 mm diameter to be filtered. The filters were first washed three times with distilled water to remove the sea salt, then dried in an oven at 60℃ for 24 hours and then weighed with a high-precision electronic balance. The suspended sediment concentration (SSC) was calculated using the sediment weight and the filtered water volumes [25].
Auxiliary data used in this study were downloaded from various open sources. Wind data are the hourly time-series products from National Centers for Environmental Prediction Climate Forecast System Version 2 (NCEP/CFSv2) with a horizontal resolution of 0.205° × 0.204° over BHS. In previous studies, the NCEP/CFSv2 wind products performed well in East China Sea [34]. Gridded hourly sea surface height (SSH) data with a map spacing of 0.083° × 0.083° were obtained from the Copernicus Marine and Environment Monitoring Service (CMEMS) global ocean physical analysis and forecasting products. For shallow and coastal waters, the correlation coefficients between the CMEMS products and tide gauge series ranges between 0.78 and 0.82 [31,35]. Sea surface SSC data were obtained from the Geostationary Ocean Color Imager (GOCI) L2 products with high spatial and temporal resolution. In coastal waters, GOCI-derived turbidity variation was reliable and can efficiently reflect the temporal dynamics of the turbidity [36]. Significant wave height data were derived from NOAA WAVEWATCH III global model which was widely used in study areas [11,37].
The in situ current profiles from the ADCPs during the observation are shown in Figure 3. In order to better describe the responses of hydrodynamic processes of BHS to the synoptic events, this study only focused on the subtidal current and residual water level. Specifically, the following processing methods were used to remove the tidal signals. First, we used the T_Tide [38] toolbox to predict the time series tidal current during the observation period. Then, the predicted tidal currents were subtracted from the raw current field to remove the tidal component. Lastly, the residual currents were smoothed by moving average with a 1-hour window to filter the high frequency variability. The residual currents were considered as the subtidal currents. Meanwhile we used the bottom pressure records to retrieve the water level which was then processed using the same method to obtain the residual water level.
In addition, we use the relationship between backscatter voltage ( V r m s ) and SSC proposed by Thorne and Hurther (2013) for inversion calculation to obtain SSC profiles with higher vertical and temporal resolution [39]:
S S C i = ( V r m s · φ ( r ) · r K t · K s ) 2 e 4 ( α w · r )
V r m s is calculated by the backscatter intensity (E) measured by ADCP according to V r m s = 10 K c · E / 20 . K c is the conversion number of raw backscatter from a dB scale to a voltage scale. φ ( r ) is the near-field correction related to r (distance from the measuring point to the transducer), the radius of the transducer and the signal wavelength; K t is a constant and is a measure of the instrument sensitivity; K s is the parameter of the scattering properties of sediment with mixed mineralogy, which depends on the particle size, particle distribution characteristics and backscattering of suspended particles; α w is the absorption of sound by seawater, which depends on temperature, salinity, depth and pH (during observation: temperature is 7℃, salinity is 32 PSU and pH is 8). In this study, the calculated α w was 0.019 nepers/m. In order to validate the accuracy of SSC obtained by inversion, we fitted the inversed SSC (SSCinv) with the measured SSC (SSCobs), their relationship shown in Figure 4c. SSCinv and SSCobs have a good relationship (determination coefficient (R2) is 0.75), which means that SSCinv can replace the real SSC during observation. The inversed SSC profiles are shown in Figure 4a,b.

3. Results

3.1. Wind and Wave Conditions

The period from January 6 to January 13, when measurements were available at both stations, was selected for investigating the hydrological and hydrodynamic responses to the different wind conditions. A gale level wind event was captured from January 8 to January 11 (Figure 5a). Before the intense wind, a gradually subsided northerly wind prevailed around the BHS on January 6 and finally shifted to southerly wind on January 7. The overall wind speed was below 5 m/s. After that, the intense northwesterly wind dominated this area, which reached a gale level for a short period of time with the maximum speed of over 16.7 m/s. After January 11, the wind weakened and shifted to westerly or southwesterly. During the observation, there was a period of wind relaxation or reversal either before or after the intense wind respectively. According to the wind condition (both wind speed and direction), the observation period was divided into three phases, which are two wind relaxation or reversal phases (Figure 5: phase 1 (P1), phase 3 (P3)) and the intense northerly wind phase (the northerly wind with the speed over 10.8 m/s) (Figure 5: phase 2 (P2)). In this study, the northerly wind is broadly defined (including northerly and northwesterly).
Wave had an obvious response to the wind with a lag of 3–6 hours (Figure 5b–d). The peak of wind occurred between 1 pm and 3 pm on January 8, 2018, while the peak of significant wave height ( H s ) occurred between 6 pm and 7 pm on January 8, 2018. During P1, the H s in the BHS was overall lower than 1 m and gradually decreasing, the peak period ( T p ) was about 4 seconds and the peak direction ( D p ) was relatively chaotic. As the intense wind was coming, the H s significantly increased with the maximum of greater than 3 m on January 8 and the H s in T01 was overall higher than that in T02 during the P2. The T p also increased to 7-8 seconds. The D p was stable and rotated clockwise along with the winds. As the northerly wind subsided, H s gradually decreased, as did the T p . Until the wind turned to westerly or southwesterly, the H s rose to 2 m again. At this moment, the H s of T02 was higher than that of T01. The D p remained stable and consistent with the wind direction.

3.2. Hydrological Characteristics during the Observation Period

During observation, as the water column of T01 and T02 was well mixed, the depth-averaged temperature, salinity and excess density were used to describe the temporal variation of hydrological characteristics and the differences between the northern and southern stations (Figure 6). Under the influence of YSWC in winter, the temperature of the northern side was about 0.5–1 ℃ higher than that of the southern side, ranging from 5.5–7 ℃ in T01 and 6.4–7.5 ℃ in T02 respectively (Figure 6a). Salinity of the northern side was slightly lower than that of the southern side, ranging from 32.3–32.35 PSU in T01 and 32.25–32.28 PSU in T02 (Figure 6b). The density of T01 was slightly higher than that of T02 with the combination of temperature and salinity (Figure 6c). However, the water in this area could be considered uniform since the difference was so tiny that the baroclinic effect was negligible. During the observation period, both northern and southern sides showed a continuously decrease in temperature and increase in salinity. In T01, the temperature and salinity varied sharply during the intense wind, while became more stable with the obvious tidal signals after the wind subsided or shifted. In T02, the seasonal cooling and the tide were the main forces behind the changes of temperature and salinity instead of the wind.

3.3. Water Level and Current Variation Responding to the Wind

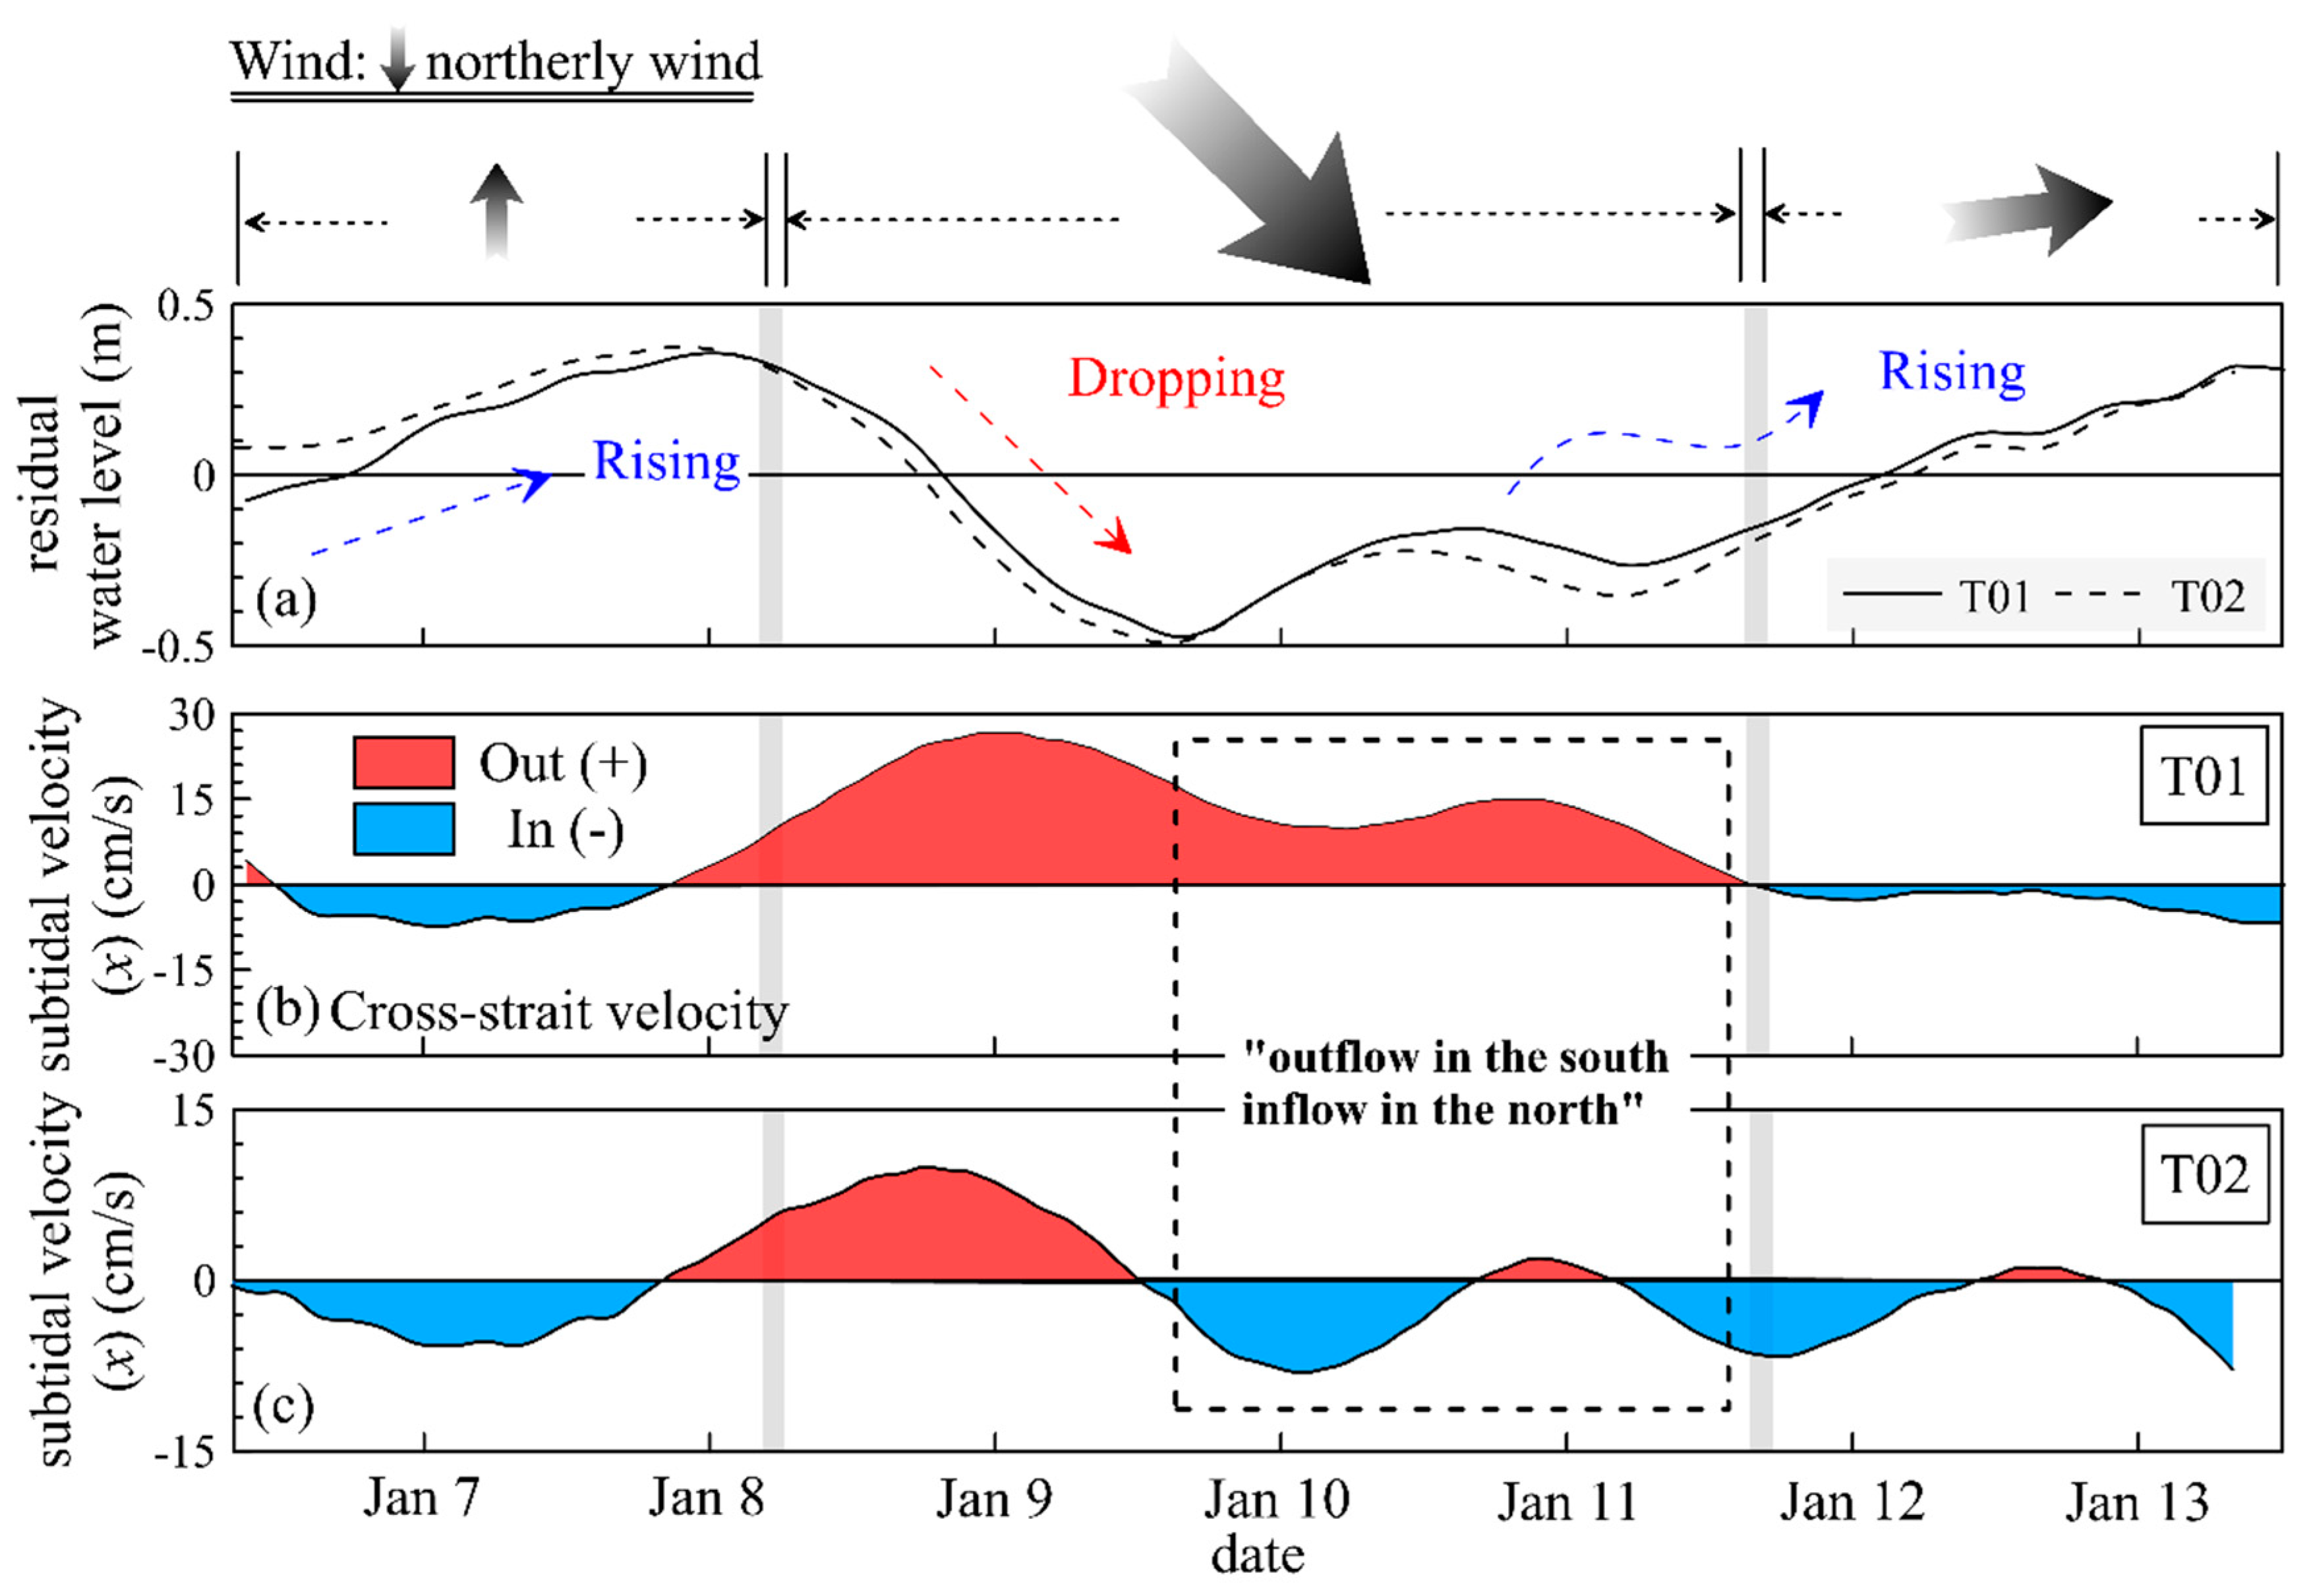
The variation of the water level was consistent with that of the wind (Figure 7a). During P1, the water level was continuously rising about 0.3 m within two days under the effect of the weak wind. In the beginning of P2, the overall water level of BHS plunged about 0.8 m in one day affected by the intense wind and then gradually recovered with a periodic fluctuation during the later phase of P2 and throughout P3. As the circulations around BHS were barotropic processes in winter [32], only depth-averaged currents were used. Figure 7b,c shows the variation of the cross-strait subtidal current at T01 and T02 respectively. The variation of subtidal currents also corresponded well with the wind. During P1, both southern strait and northern strait showed a weak inflow, with a relatively low velocity of ~0.1 m/s. In the initial phase of P2, as the wind increased significantly, both the north and south of the strait showed intense outflow, with a velocity of about ~0.27 m/s on the south and ~0.1 m/s on the north. As the wind continued, the southern side continued to be dominated by the strong outflow, while the northern side shifted to a fluctuating inflow with a period of 2–3 days. At this moment, the circulation in BHS showed a traditional pattern: "inflow in the north and outflow in the south". During P3, as the wind gradually subsided and shifted, both the north and south of the strait were dominated by inflow again, with the flow velocity of the north stronger than that of the south. The results showed the P1 and P3 had some similarities that the water level of the strait was continuously rising accompanied by a consistent inflow during the wind relaxation or reversal. The outflows mainly appeared during the intense wind and dominated the southern strait. Consequently, on the synoptic scale, the circulation structure of BHS was incredibly sensitive to the oscillation of the wind condition, rather than simply "inflow in the north and outflow in the south". The underlying mechanism of variation of circulation modulated by synoptic events would be discussed in the following sections.

3.4. The Variation of SSC and Transport through BHS

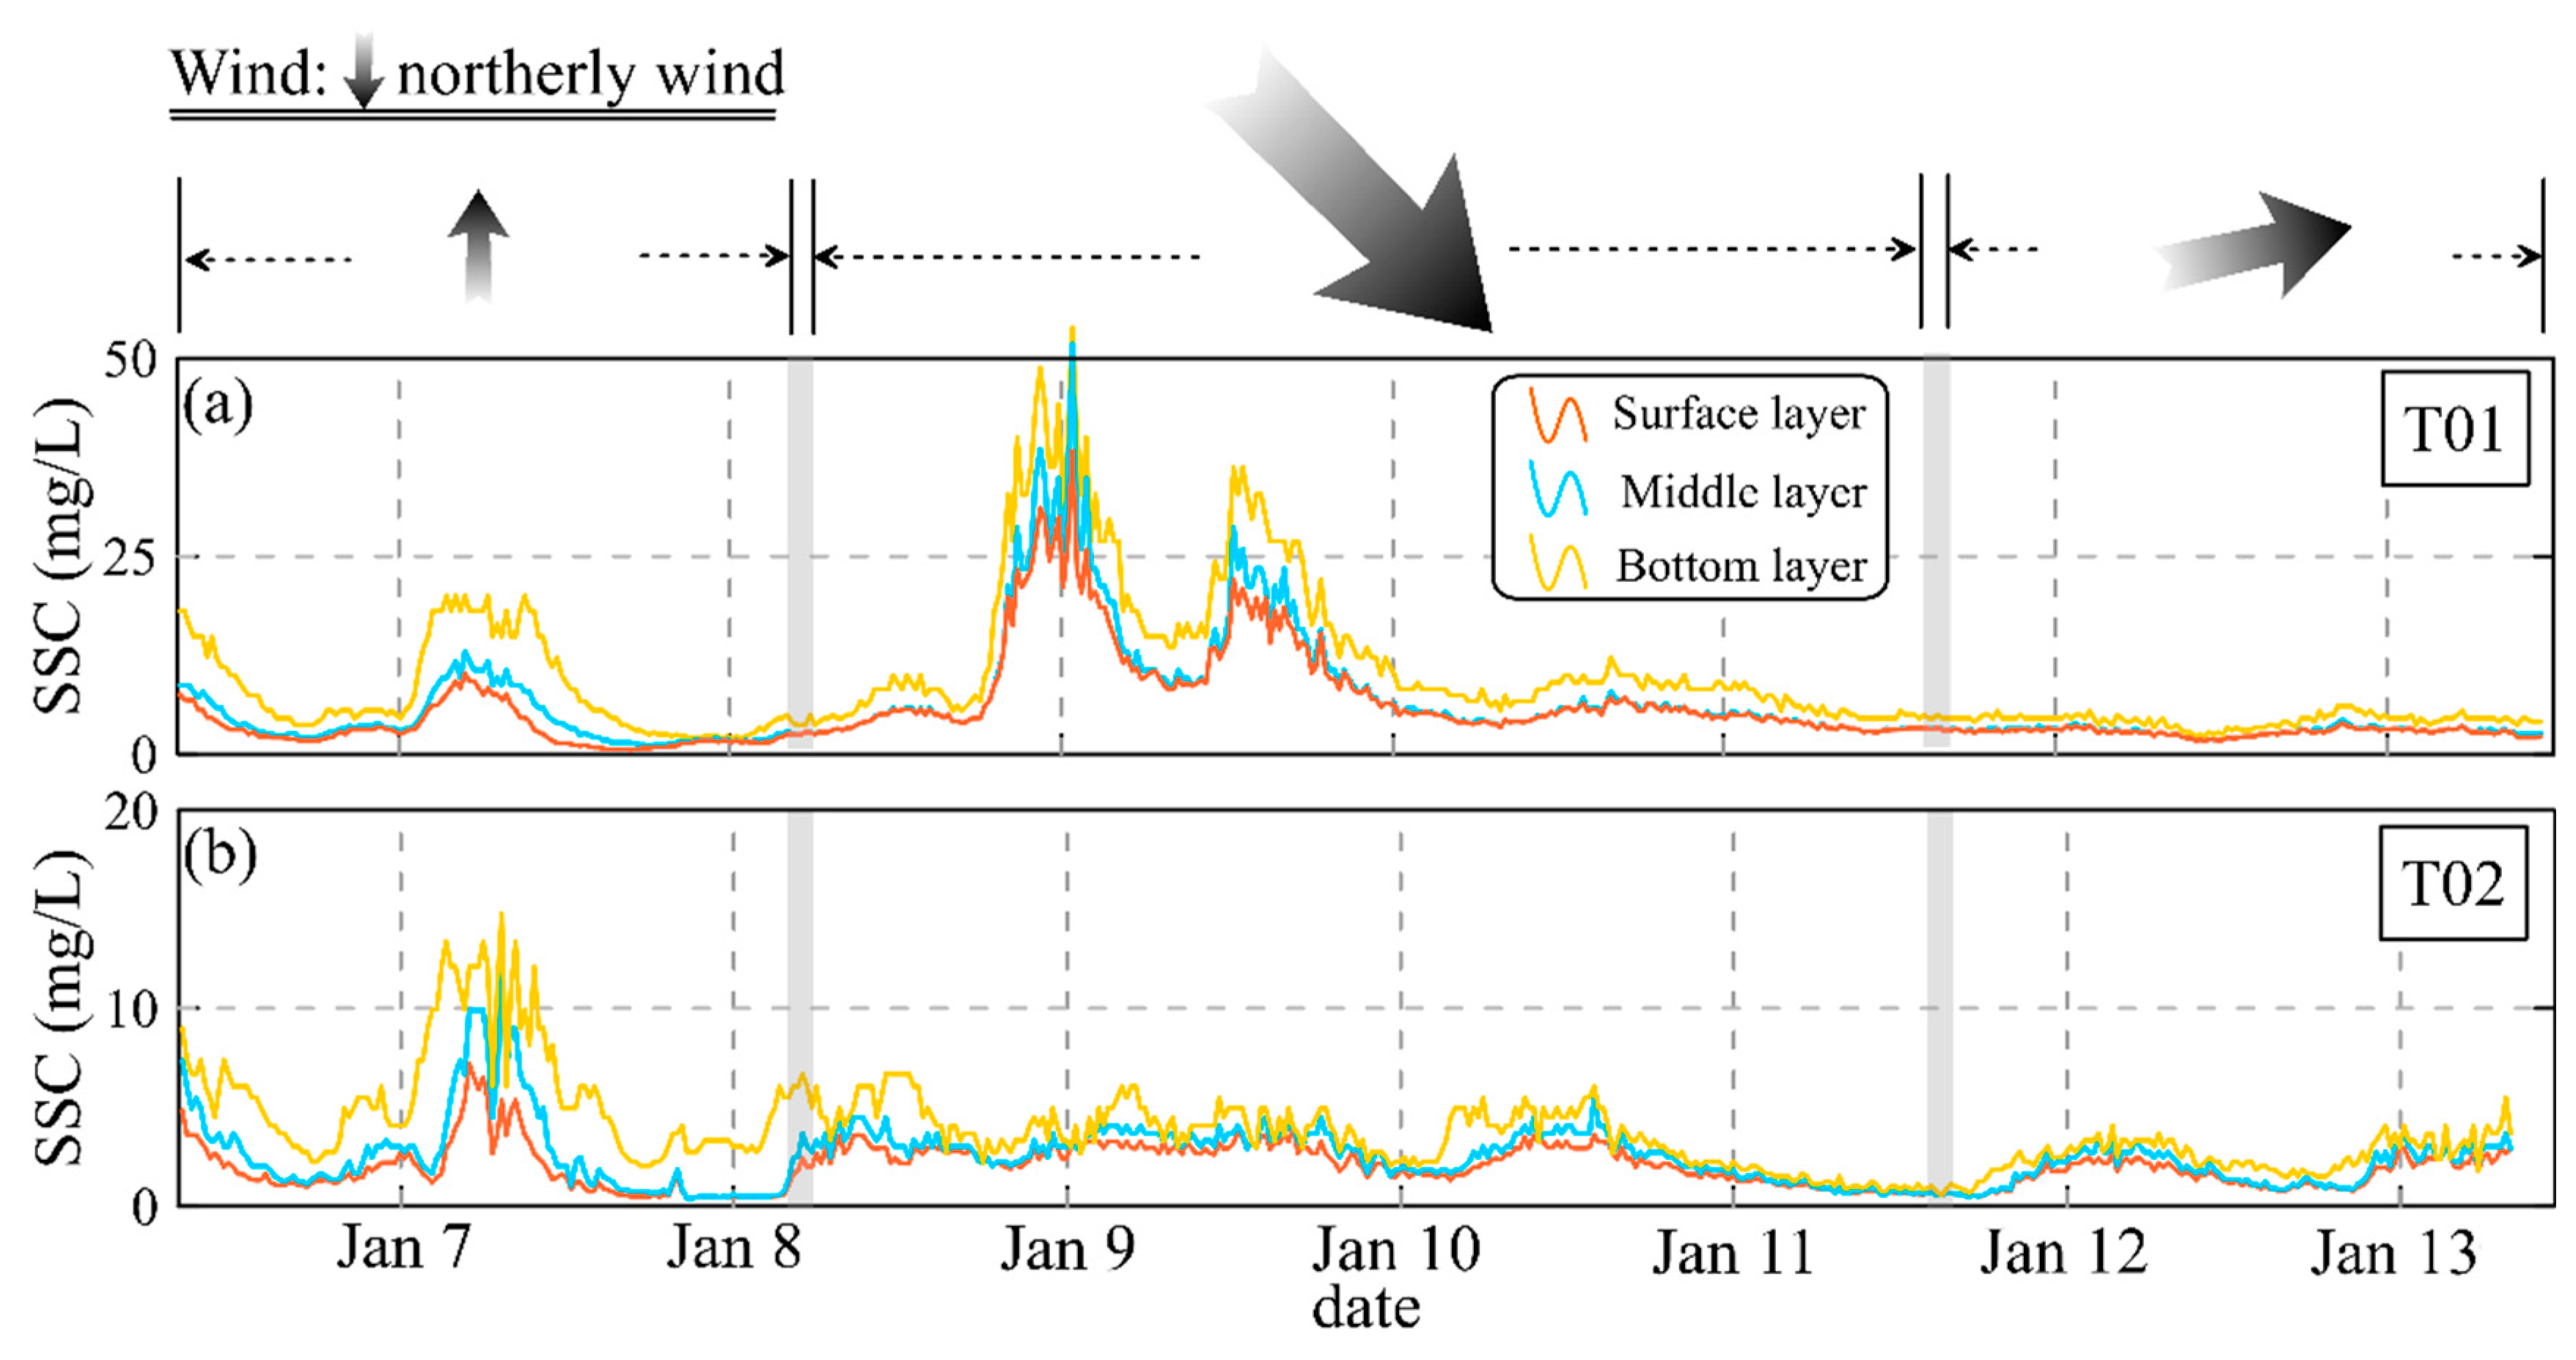
The distribution of SSC at surface, middle and bottom layers in BHS were shown in Figure 8a,b. SSC showed high values in the south and low values in the north overall. In the water column, SSC showed a decreasing tendency from the bottom to the surface and the bottom layer was significantly higher than the surface and the middle. The temporal variation of SSC had significant fluctuations corresponding to the tidal currents in T02, which gradually decreased from the beginning to the end (spring tide to neap tide) (Figure 4). During P1, the SSC in T01 and T02 had similar variation trend. A peak, which slightly lagging behind the maximum ebb, appeared in both sides of BHS on January 7 with the value of 15–20 mg/L in T01 and ~10 mg/L in T02. During the intense northerly wind (P2), SSC in the south and north had different responses. SSC in southern BHS increased significantly, 2–5 times of the other periods with the maximum value exceeding 50 mg/L (Figure 8a). The northern side was opposite, where SSC had no obvious signal corresponding to the wind, even lower than the average value of mere 3–6 mg/L (Figure 8b). After the wind relaxation or reversal, the SSC was back to a relatively low value in both T01 and T02.
With the current velocities and sediment concentration, both from the ADCP measurements, the unit-width cross-strait water flux ( W F ) and SSC flux ( S S F ) can be easily calculated respectively:
W F x ¯ = t = 1 T   i = 1 n H i t · C x i t T  
S S F x ¯ = t = 1 T   i = 1 n H i t · C x i t · S S C i t T
where C x is the x component (cross-strait) current velocity; T is the number of ADCP ensembles for each phase;   H   = 0.75 m is the bin size, n is the total number of layers, units are /m.
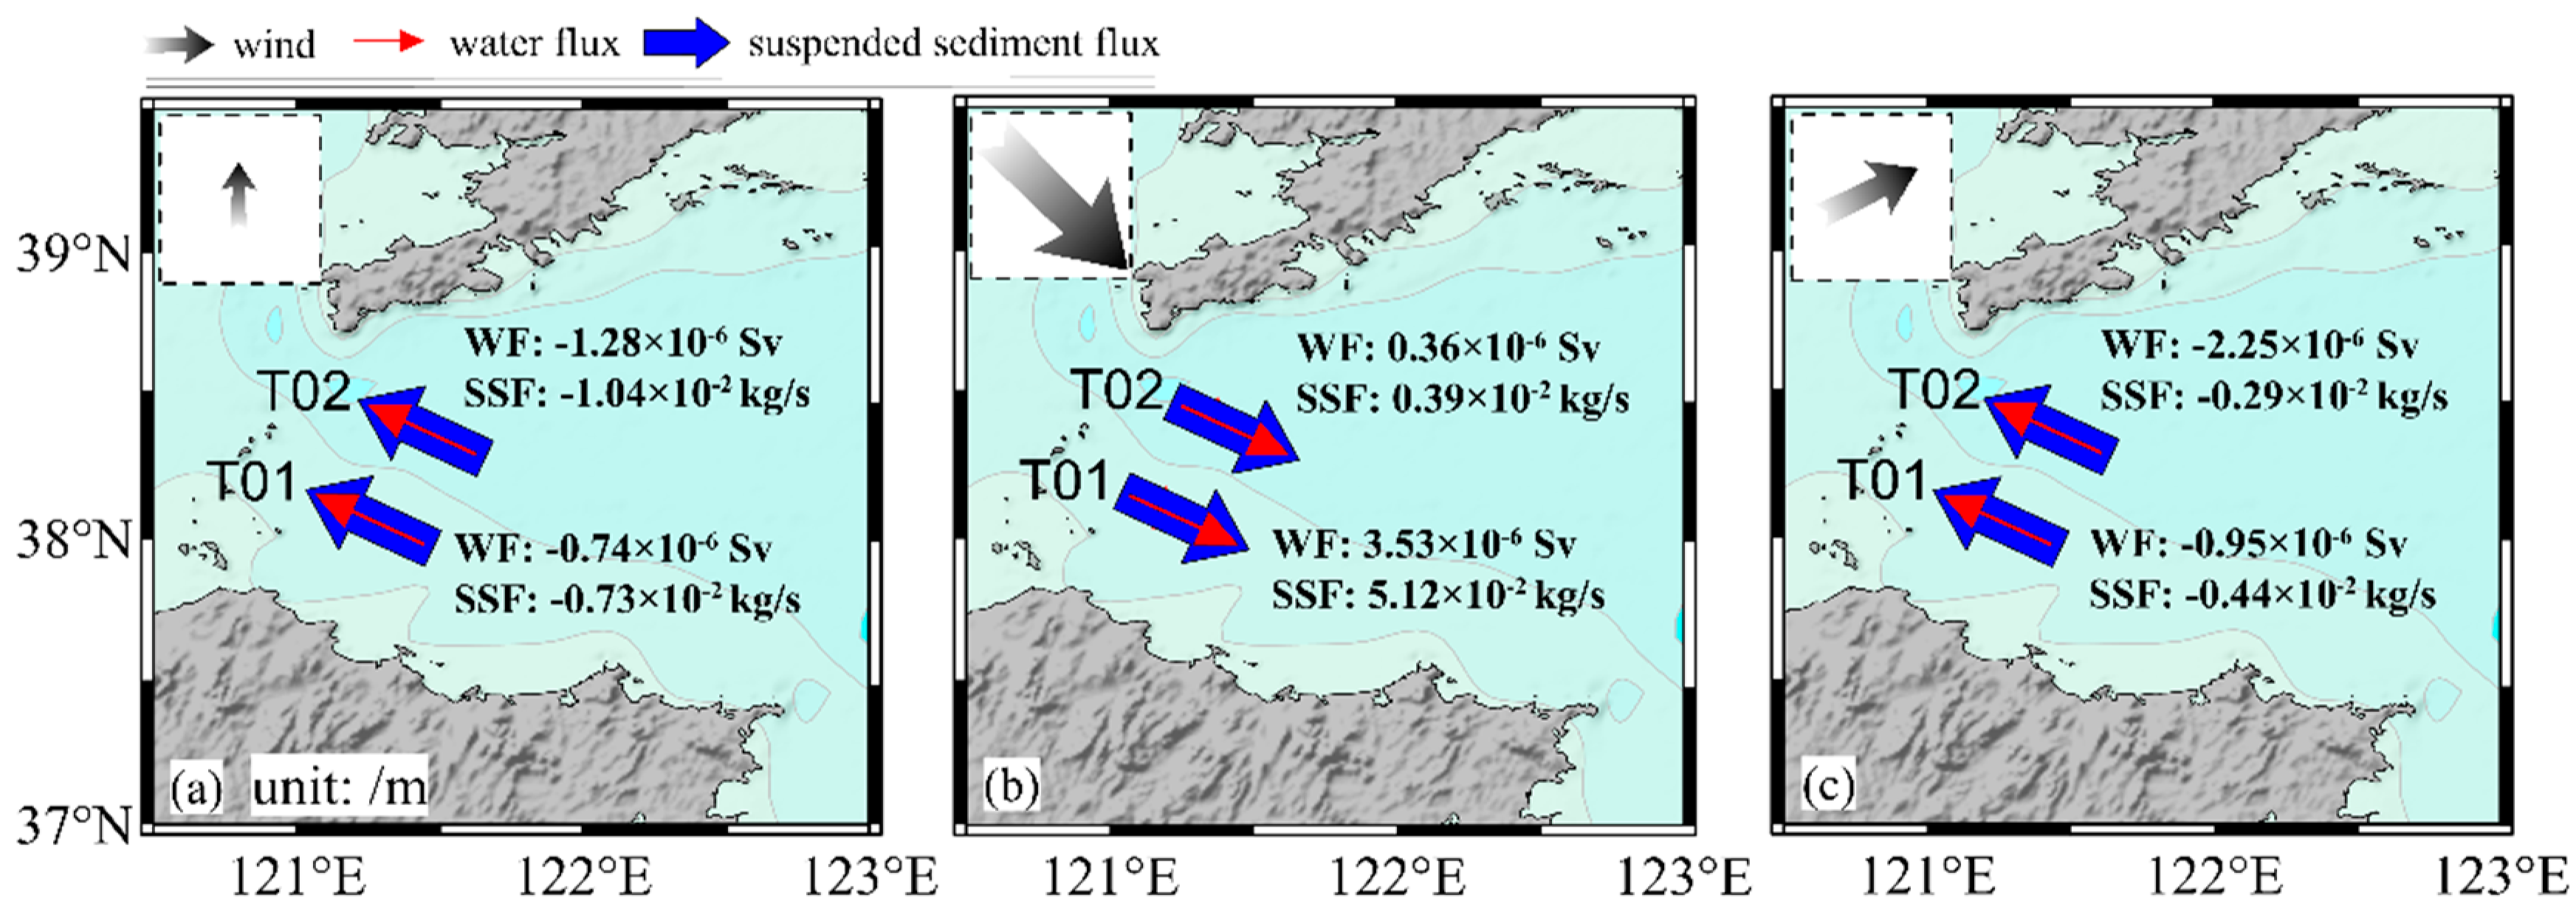
The net water and sediment fluxes through BHS in different phases are shown in Figure 9. During P1, under the weak northerly or southerly wind, the net water and sediment both transport to BH at a relatively low level. The fluxes of the northern side was higher than that of the southern side (Figure 9a). In P2, however, the water and sediment transport reversed to out of BH due to the enhanced northwesterly wind. It was notable that the net water and sediment fluxes on the southern side significantly increased, which was an order higher than before. In comparison, the fluxes of the northern side were much lower than the southern side (Figure 9b). P3 is similar to P1 in that the transport direction shifted into BH again after the wind subsided and reversed in both sides of BHS (Figure 9c).
Based on the previous results, we concluded the typical characteristics of water and sediment transport affected by the synoptic events as follows: 1. The total transport (both water and sediment) of the whole observation through the BHS was consistent with the traditional views: "inflow in the north and outflow in the south" (Table 2). However, the transport situations in different phases of wind conditions varied greatly; 2. The phases of the intense northerly wind were the main period of water and sediment transporting out of the BH through the southern BHS (Table 2); 3. After the wind died down or reversed, the outward transportation of water and sediment gradually disappeared and even some sediments were back to BH with the backflow. In summary, in terms of synoptic scales, the water and sediment transport processes in the BHS are not constant, but the periodic processes which are more sensitive to the variation of wind conditions. Thus, the underlying mechanisms of the transport processes would be discussed in the next sections.

4. Discussion

4.1. Changes in BHS Circulations due to the Synoptic Events

Previous sections had shown that the hydrological and sedimentary pattern through BHS were sensitive to winter synoptic events. To better illustrate underlying mechanisms of the wind effect on the circulations around BHS, SSH data from CMEMS and the daily wind data from NCEP were employed in this study.
From January 6 to January 7, a weak southerly wind lingered around the BH and YS, the SSH in the area was gradually recovering from south to north (Figure 10a,b). During this period, a consistent inflow dominated the entire BHS (Figure 7b,c). Notably, a relatively high SSH propagated northward along the west coast of the Korean Peninsula. On January 7, the SSH in BH reached the peak value of the observation period, even higher than it in the YS (Figure 10b). During January 8 and January 9, the intense northerly wind swept over BH and YS and the SSH dropped by about 0.6 m rapidly from north to south (Figure 10c,d). The water rapidly escaped BH towards YS in a short time with an intense outflow through BHS. During January 10 to January 11, as the intense wind continued, the SSH of BH remained at a low level (Figure 10e,f). The relatively high SSH was distributed along the coast of Shandong Peninsula. In BHS, an "inflow in the north and outflow in the south" structure of the circulation appeared (Figure 7b,c). On January 12, the northerly wind weakened and shifted to the westerly wind and southwesterly wind. The SSH in BH and YS gradually recovered with a relatively high SSH propagated northward along the west coast of the Korean Peninsula (Figure 10g). On January 13, a southerly wind dominated the BH and YS, the distribution of SSH showed by the high level in the north and the low level in the south (Figure 10h). At this moment, a continued inflow predominated the entire BHS (Figure 7b,c).
We compared the three synoptic events that the variation of currents showed some obviously traceable characteristics and had a tight link with the regional distribution of SSH. Influenced by the East Asian Monsoon, the northerly wind prevails in winter [11,25]. The oscillation of the wind had a significantly impact on the redistribution of regional SSH, thereby causing the periodic variation of circulation in the BHS. Combined with our results and previous studies, these processes could be summarized as follows. At the initial stage of the intense northerly wind, the water rapidly exited of BH and the SSH decreased rapidly. The changed spatial distribution of the SSH formed a northward pressure gradient field. Meanwhile, the relatively high SSH was distributed along the northern Shandong Peninsula, along with strong NSCC enhanced by geostrophic balance [32,33]. Correspondingly, the BHS was characterized by the strong outflow (i.e., from BH to NYS). After the wind relaxed or reversed, the northward pressure gradient established by precedent winter gales was released and created a northward compensation flow [40]. The YSWC was generated. Besides, the intense northerly wind triggered a coastal-trapped shelf wave (CTW) propagating northward with a relatively high SSH along the west coast of the Korean Peninsula [32]. The YSWC was also facilitated by the CTW [41,42]. During this period, BHS was dominated by the inflow. In other words, the winter circulations around BHS was not constant on the synoptic scale, but sensitive to varied wind conditions. Furthermore, according to wind conditions, circulation processes could be classified into two situations, one is under intense northerly wind and the other is after the wind relaxed or reversed.

4.2. Changes of SSC in BH and BHS due to Synoptic Events

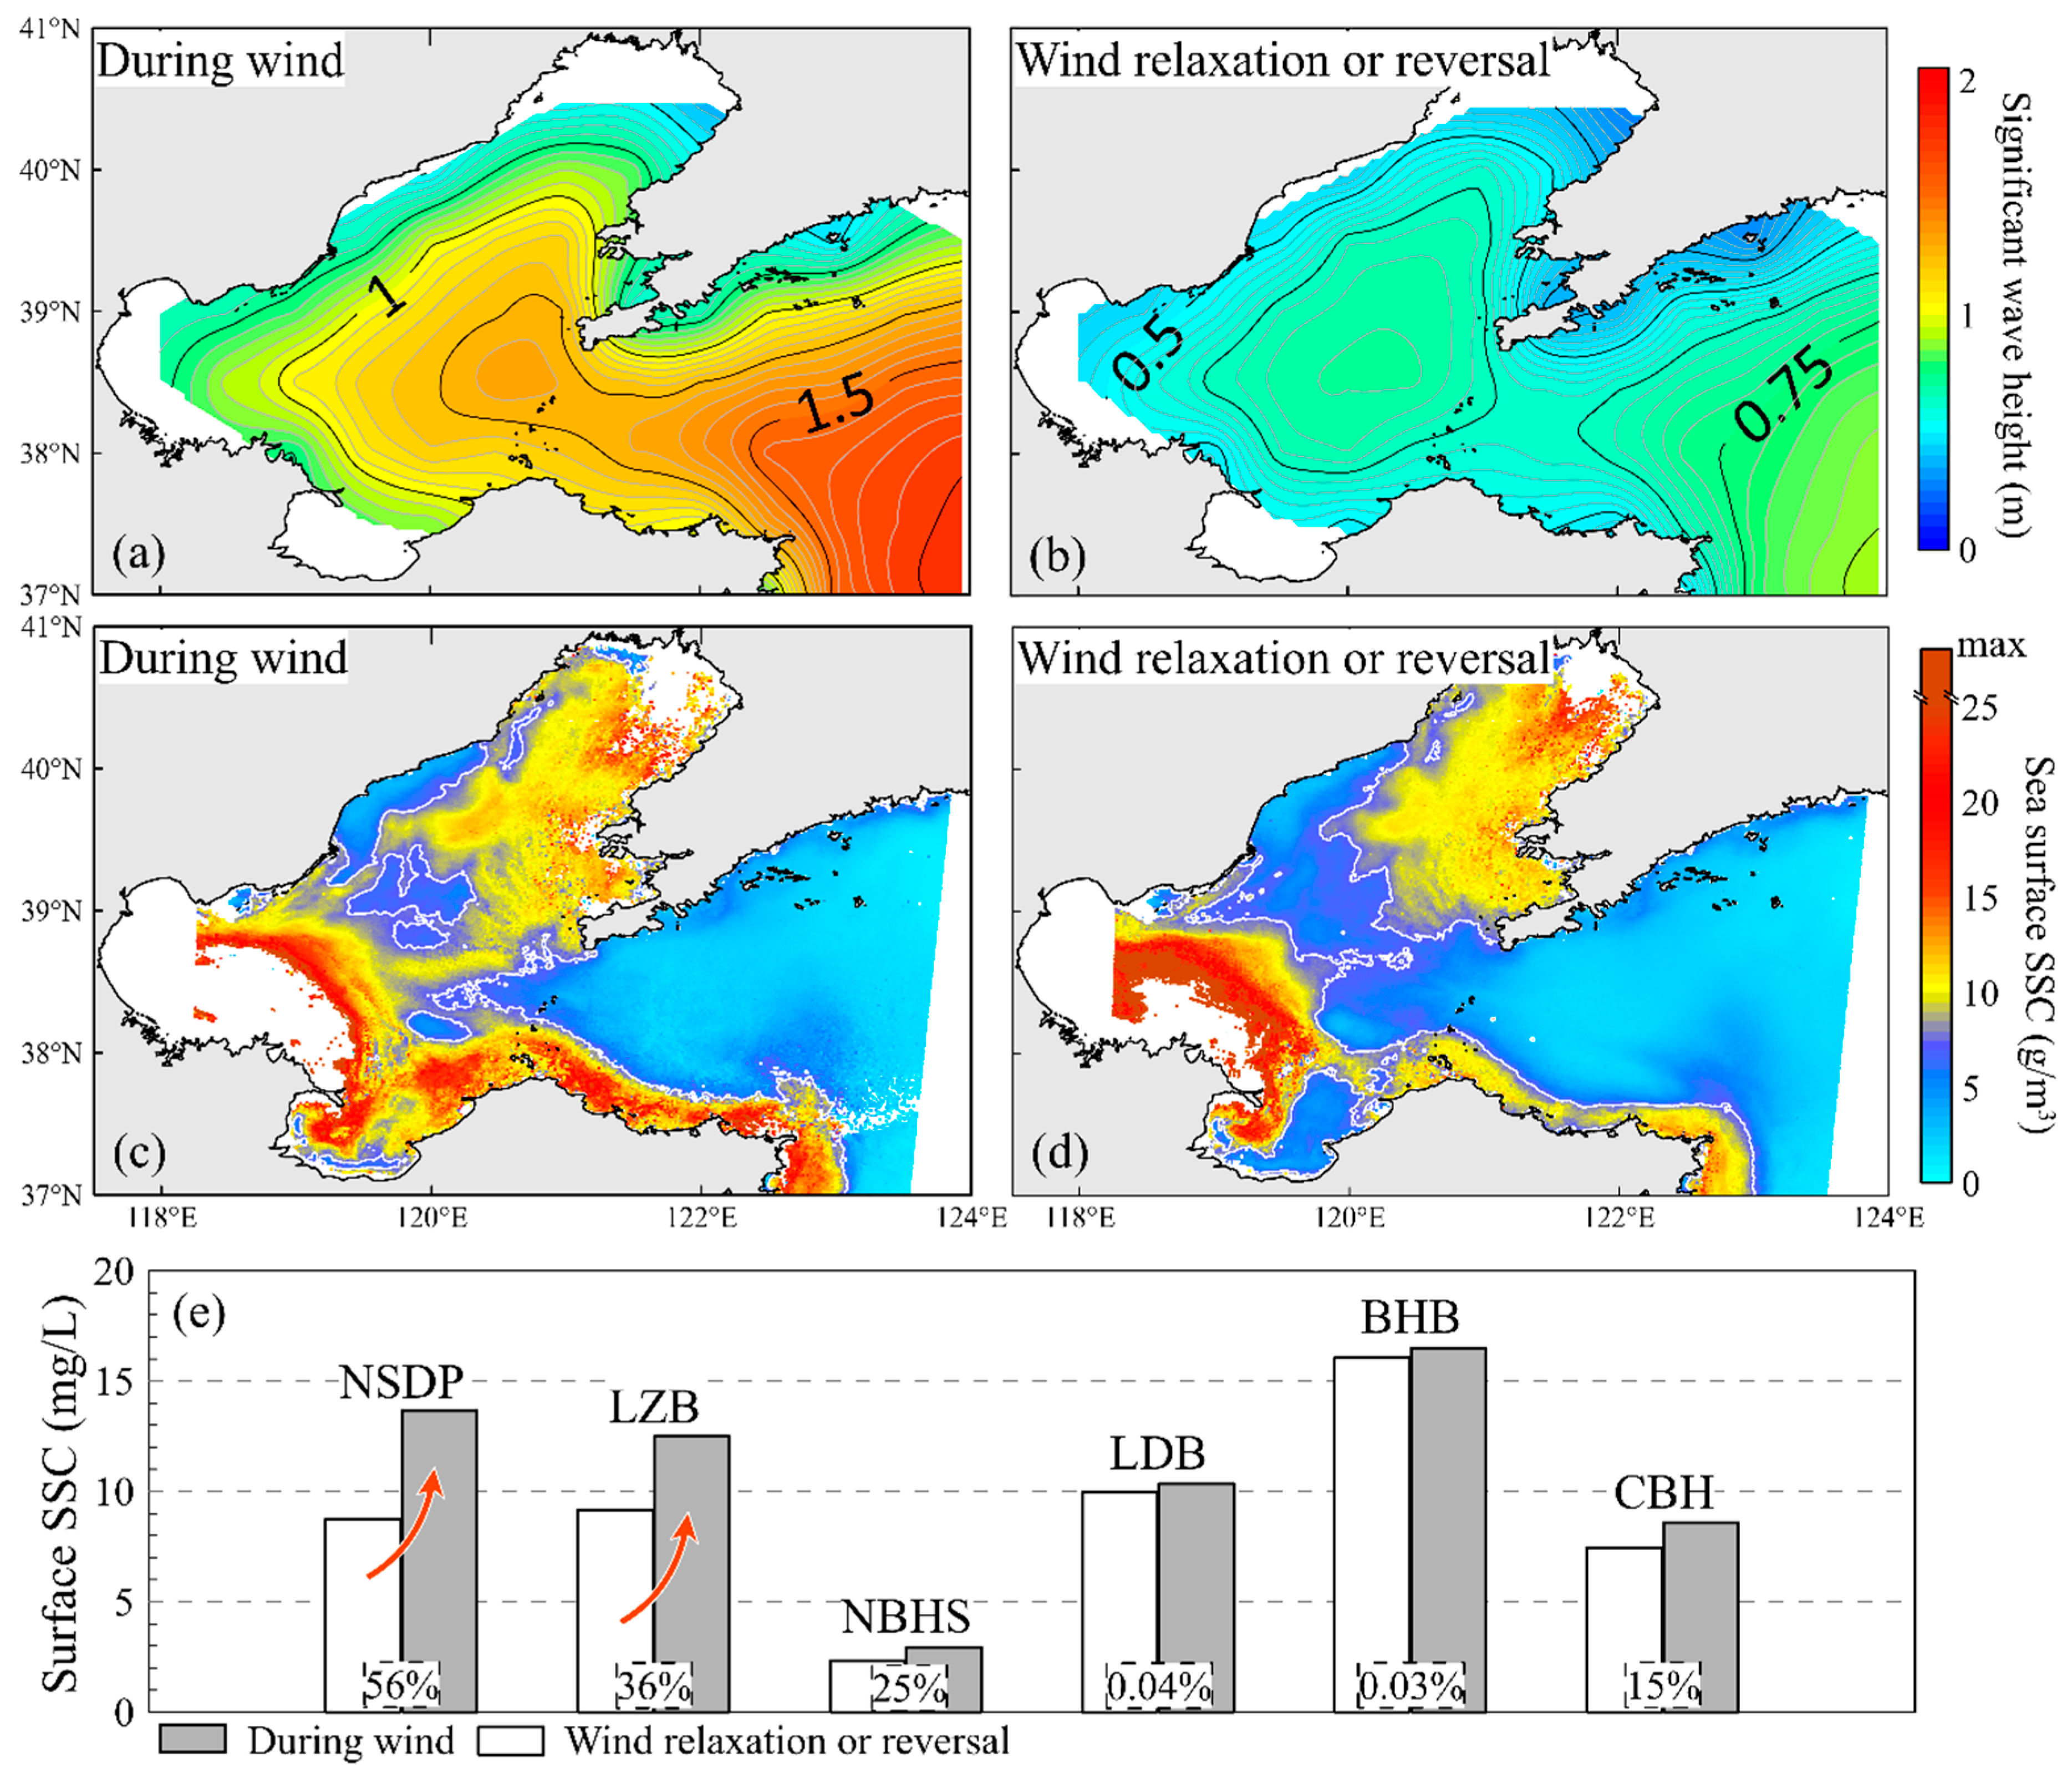
Our previous results showed that the SSC had different responses to the different wind conditions. In general, the resuspension of sediment is controlled by both internal and external factors including sediment grain size, topography and hydrodynamic characteristics (current and wave), etc. [43]. Among these factors, the sediment grain size and the topography were relatively stable for years or longer. Meanwhile—as typical of marginal seas—BH was significant affected by the tidal current. Therefore, the different responses of suspended sediment to different wind conditions can be attributed to the variation of the wave and tidal current. We employed the spatial distribution of wave field from the WAVEWATCHⅢ global model and sea surface SSC from GOCI products to illustrate the spatial variation of sediment in BH during winter, 2018 (November 2017 to March 2018). Based on the wind conditions, the variation of wave and sediment were separated into two regimes: one was affected by the intense northerly wind (regional averaged wind speed ≥ 8 m/s) and the other was when the wind relaxed or reversed. The variation of wave and sea surface suspended sediment in different situations are shown in Figure 11a–d. During the action of intense northerly wind, the wave was enhanced more than that in periods of wind relaxation or reversal. The averaged H s was ~1.2 m under intense wind conditions, while it was only half that value when the wind subsided or shifted (Figure 11a,b). Correspondingly, the sea surface SSC had different characteristics in the two synoptic situations (Figure 11c,d). In winter seasons, the high SSC in BH was mainly concentrated in the vicinity of the Yellow River estuary, the Bohai Bay and the Liaodong Bay. The center of BH and northern BHS had relatively low SSC. During the intense northerly wind, the SSC in the Laizhou Bay and the northern coast of Shandong Peninsula increased significantly, forming a belt of high turbidity along the Shandong Peninsula from the Laizhou Bay and extending eastward around the Chengshantou (Figure 11c). After the wind subsided, except the Yellow River estuary, the SSC of the Laizhou Bay was back to a relatively low level. The turbid belt became indistinct and the high SSC was only distributed around the southern BHS and Chengshantou (Figure 11d). The variation of sea surface SSC affected by the intense wave mainly reflected in the shallow waters such as Laizhou bay and northern coast of Shandong Peninsula, with amplification of about 36% and 56% respectively (Figure 11e). The northern side of BHS and the center of BH were less affected by the intense wind, with slight increases of about 25% and 15% respectively (Figure 11e). While the variation in Liaodong Bay and Bohai Bay were negligible with only 0.04% and 0.03% (Figure 11e). Besides the sea surface layer, the SSC in the middle and bottom layers could also increase several times or dozens of times during the extreme weather in winter in the shallow waters [26,44]. In general, besides the wind intensity, the growth of wave also depends on the wind duration and fetch [45]. During the northerly wind in winter, the southern BH had the longer fetch which was better for wave growth. In addition, due to the lower temperature and salinity, the sea ice could last ~105–130 days with a coverage extending offshore over ~70 km in Liaodong Bay which formed a natural barrier to the air-sea interaction [46,47]. Therefore, these factors combined with the depth of water made the shallow water in southern BH a sensitive area of the variation of SSC under intense northerly winds, rather than the northern BH.
To further illustrate the control factors of different responses of SSC on the southern and northern sides of BHS during different wind conditions, we employed the empirical formulas for bottom shear stress calculation proposed by Soulsby (1995) [48] and Van Rijn (1993) [49] to calculate wave-induced shear stress ( τ w ) , current-induced shear stress ( τ c ) and combined wave and current shear stress ( τ c w ) :
τ c = ρ · C D · U ¯ 2
C D = [ 0.4 1 + ln ( z 0 H ) ] 2  
τ w = 0.5 · ρ · f w · U w 2
τ c w = τ c [ 1 + 1.2 ( τ w τ c + τ w ) 3.2 ]  
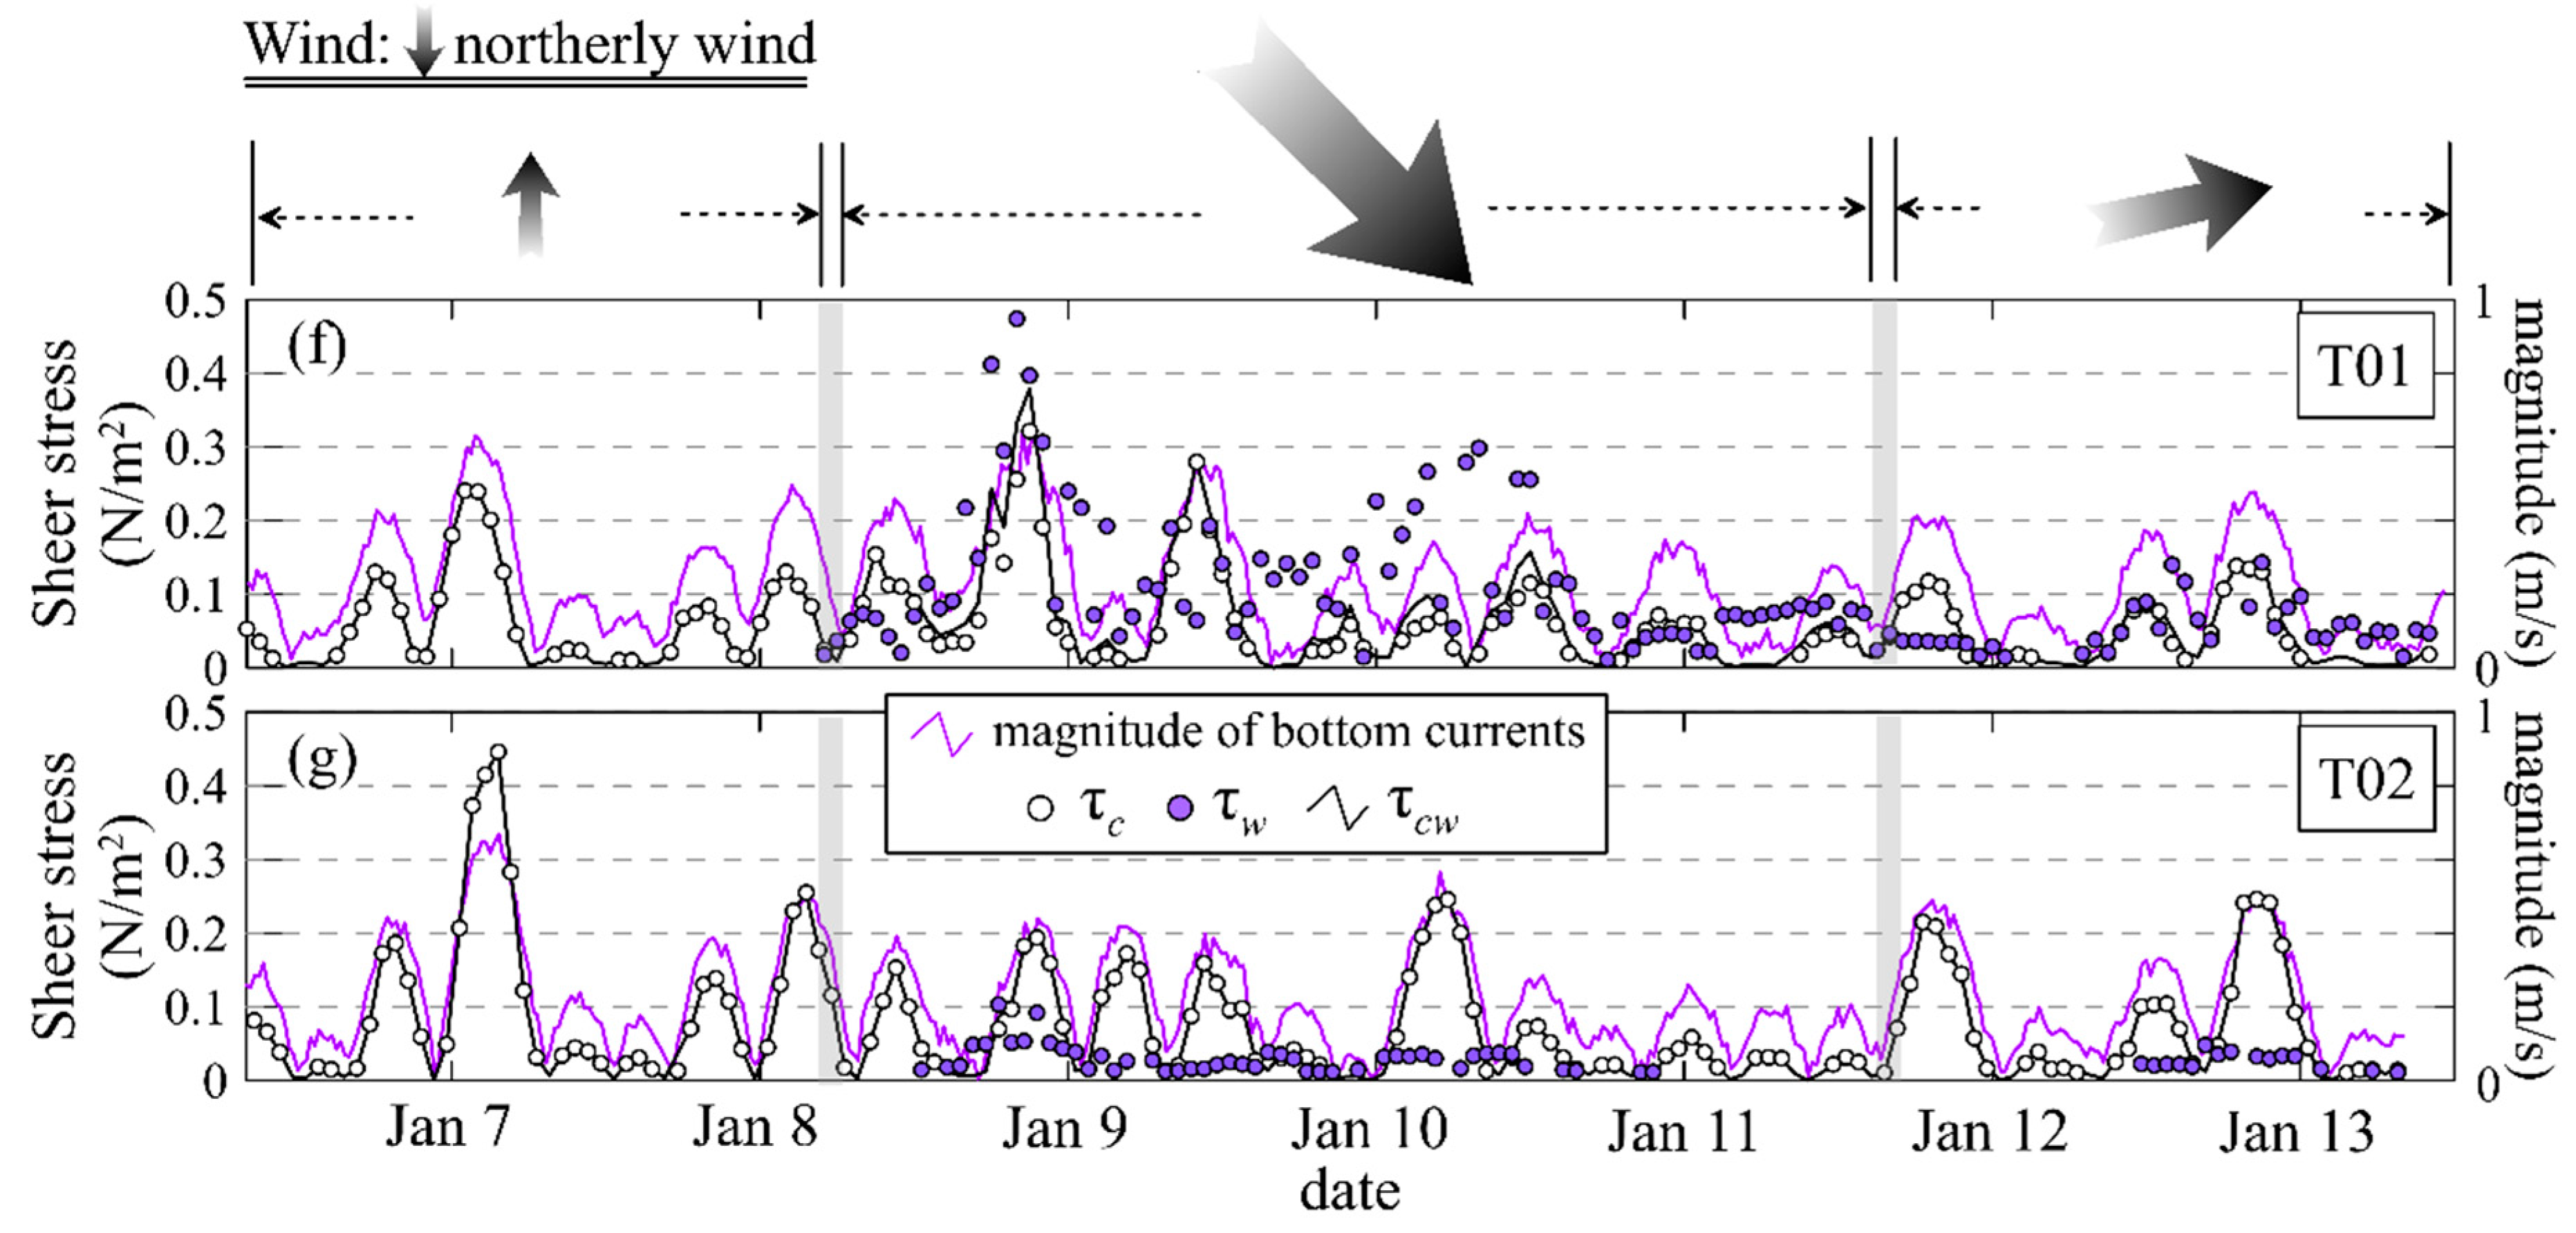
ρ is water density; C D   is the drag coefficient (applicable to depth-averaged current); z 0 is the bed roughness length; U ¯ is the depth-averaged current speed; H is the water depth; f w is the wave friction factor; U w is the wave orbital velocity amplitude at sea bed. The results showed that the SSC in the both sides of BHS were obvious consistent with the τ c w . Before the intense wind, the peak of SSC in both T01 and T02 was dominated by the   τ c (Figure 12a,b). During the intense wind, the enhanced wave caused a significant increase of τ w in the southern side of the BHS. The current in the south was also enhanced by the intense wind, which also caused the increase of τ c . The superimposed effect of wave and current caused the significant increase of τ c w , facilitating the obvious increase of SSC (Figure 12a). Conversely, during this period, although the wave on the northern side of BHS significantly increased, the τ w was still small due to the deeper water depth. Meanwhile, the period of the intense wind was during neap-tide, so the τ c also decreased. This was why the SSC on the northern side even decreased during the intense wind (Figure 12b). In summary, the resuspension of sediment was dominated by the combination of current and wave in the southern strait, while only by the tide in the northern strait.

4.3. Suspended Sediment Transport through BHS by the Winter Wind Event

Most of the terrigenous materials carried by the large rivers of BH were deposited around the estuaries in summer [30] and substantial quantities of sediments were transported over long distance by NSCC to form distal mud patches in winter [25]. Previous studies summarized this typical feature as "storage in summer and transport in winter" [13,41]. In the past decades, most of previous simulated studies of sediment transport in BH and YS were focused on the seasonal variation by using monthly or seasonal averaged wind data (e.g., [43,50,51,52]). Such an approach is undoubtedly feasible for the study of mean climatology conditions. Nevertheless, sometimes intense northerly wind or weak southerly wind episodically occur during winter and such synoptic events related processes would be obscured. In fact, the winter monsoon was an oscillating activity in which the intense northerly wind events and the wind relaxation or reversal events occurred alternately. Our observation showed that both the sediment carriers (NSCC and YSWC) and sediment themselves were sensitive to the intense northerly wind and the sediment transport processes through BHS were also shown the oscillating processes corresponding to the wind conditions. Therefore, we divided the sediment transport processes though BHS in winter into two patterns according to wind conditions:
  • The intense northerly wind caused the water piling up to south while the SSH in BH fell significantly, effectively forming a northward pressure gradient. A large quantity of the water escape from BH to YS through BHS. Meanwhile, the relatively high SSH is distributed along the northern coast of the Shandong Peninsula and NSCC is markedly enhanced because of geostrophic balance. Furthermore, intensified waves facilitates the rapid increase of SSC in the shallow water of southern BH, which is then carried out of BH by NSCC. This period is the main transport stage of the sediments from BH (Figure 13a).
  • After the wind weakened or shifted, the preceding accumulation of SSH was unleashed, forming a northward compensatory flow. The wind-triggered CTW carried a high-water level propagated northward along the western coast of the Korean peninsula and facilitated the YSWC [41]. During this time, the relatively high SSH in the northern BHS is geostrophically balanced by an inflow from YS to BH. Meanwhile, SSC decreased due to the weak wave and a small part of sediment is brought back to BH (Figure 13b).
Our study also showed that there would be co-existence of the two patterns when the intense wind lasted a longer time (Figure 7a,b). Study on the two decisively separated patterns would help us understand the underlying mechanism more clearly and serve as a basis for more accurate quantitative estimation of sediment transport. Moreover, there have been a number of studies on numerous straits around the globe (e.g., Gibraltar, Otranto, Taiwan and Tsushima Straits) [53,54,55] that show the transports of water and sediment have significant seasonal variations affected by the monsoon activities [56,57,58,59]. Meanwhile, some episodic synoptic events do not follow the original transport pattern or are even contrary to previous results [31,32,60,61,62], e.g., typhoons could cause the strong southward transport in Taiwan Strait, which temporarily changed the general direction of Taiwan Strait northward transport [63]. Ko et al. had shown the transport reversal in Taiwan Strait affected by the northerly winter wind bursts [64]. These results of transport processes in worldwide straits, including the BHS, on synoptic scales had some similar phenomenon with our findings. Affected by the episodic synoptic events, the transports through straits were not always constant, but shown the oscillation processes corresponding to the wind. In summary, the establishment of the conceptual model of water and sediment transport is not only nonnegligible for the accurate quantitative study of transport processes in the BHS, but also valuable reference for the study in other similar environments worldwide.

5. Conclusions

During the winter cruise from January 6 to January 13, 2018, an intense northerly wind event was captured using the in situ observation systems at the key stations in the north and south of BHS. Combined with satellite remote sensing and model data, the responses of hydrodynamic and hydrological characteristics in BH and YS to the intense wind events and the accompanying wind subsided events were analyzed. Based on the results, we came to the following conclusions:
(1)
The distribution of SSH in BH and YS was sensitive to the synoptic events. The regional variation of SSH would significantly modulate the winter circulation structures around the BHS. According to the wind conditions, circulation processes around the BHS could be classified in two situations: one is dominated by outflow during intense northerly wind, the other is dominated by inflow after wind relaxation or reversal.
(2)
Similarly, the wave condition in BH and YS was also sensitive to the synoptic events. The different wave conditions had significant impact on the variation of SSC mainly in shallow waters around southern BH and northern coast of Shandong Peninsula. During the intense northerly wind, SSC sharply increased in these regions. In BHS, resuspension of sediment in the south was controlled by the combination of current and wave, while it was only controlled by the current in the north.
(3)
The volume and sediment transport processes through the BHS were not always constant in winter, but shown an oscillating pattern corresponding to the synoptic events. According to the different wind conditions, the sediment transport through BHS in winter were divided into two periods, each with its pattern. One was the main sediment transport period with enhanced NSCC and SSC by the intense northerly wind, the other was the recovery period with enhanced YSWC and lower SSC when the wind was relaxed or shifted. The established conceptual model of water and sediment transport help us understand the underlying mechanism more clearly. This is necessary for the accurate quantitative study of transport processes in the BHS and provide valuable reference for the study of other similar straits in the world.

Author Contributions

H.D. wrote the manuscript; J.X. conceptualized the study and supervised H.D. in writing the manuscript; X.W., C.W. and H.D. collected and analyzed the data; H.W. and Z.L. provided constructive suggestions to the manuscript. All authors have read and agreed to the content of the manuscript.

Funding

This work was supported by the National Natural Science Foundation of China (NSFC, Grants No. 41530966, U1606401, 41806101, 41525021 and 41476070).

Acknowledgments

We appreciate the crew member of R/V ‘Dongfanghong 2’ for their support to field observation.

Conflicts of Interest

The authors declare no conflict of interest.

References

  1. Hoshika, A.; Tanimoto, T.; Mishima, Y. Current and Material Transport at Tomogashima Strait, Japan. J. Oceanogr. 1999, 55, 427–437. [Google Scholar] [CrossRef]
  2. Malikides, M.; Harris, P.; Tate, P. Sediment transport and flow over sandwaves in a non-rectilinear tidal environment, Bass Strait, Australia. Cont. Shelf Res. 1989, 9, 203–221. [Google Scholar] [CrossRef]
  3. Tian, J.; Yang, Q.; Liang, X.; Xie, L.; Hu, D.; Wang, F.; Qu, T. Observation of Luzon Strait transport. Geophys. Res. Lett. 2006, 33, L19607. [Google Scholar] [CrossRef]
  4. Cheng, P.; Gao, S.; Bokuniewicz, H. Net sediment transport patterns over the Bohai Strait based on grain size trend analysis. Estuar. Coast. Shelf Sci. 2004, 60, 203–212. [Google Scholar] [CrossRef]
  5. Qin, Y.; Li, F. Study of influence of sediment loads discharged from the Huanghe River on sedimentation in the Bohai Sea and the Huanghai Sea. In Proceedings of the International Symposium on Sedimentation on the Continental Shelf with Special Reference to the East China Sea, Hangzhou, China, 12–16 April 1983; pp. 91–101. [Google Scholar]
  6. Liu, Z.; Xia, D.; Berne, S.; Wang, K.; Marsset, T.; Tang, Y.; Bourillet, J. Tidal deposition systems of China’s continental shelf, with special reference to the eastern Bohai Sea. Mar. Geol. 1988, 145, 225–253. [Google Scholar]
  7. Yuan, P. Temporal-Spatial Variation of Oceanic Fronts and Its Influence Mechanism on the Transport of Fine-Grained Sediment in the East China Seas. Ph.D. Thesis, Ocean University of China, Qingdao, China, 2019. [Google Scholar]
  8. Sun, X.; Xi, P. The results of the 3D nonlinear tidal boundary problem and its analysis. J. Shandong Coll. Oceanogr. 1988, 18, 51–52, (In Chinese with English abstract). [Google Scholar]
  9. Qin, Y. Geology of the Bohai Sea, 2nd ed.; Science Press: Beijing, China, 1985; pp. 13–19. [Google Scholar]
  10. Huang, D.; Su, J.; Backhaus, J. Modelling the seasonal thermal stratification and baroclinic circulation in the Bohai Sea. Cont. Shelf Res. 1999, 19, 1485–1505. [Google Scholar] [CrossRef]
  11. Wang, H.; Wang, A.; Bi, N.; Zeng, X.; Xiao, H. Seasonal distribution of suspended sediment in the Bohai Sea, China. Cont. Shelf Res. 2014, 90, 17–32. [Google Scholar] [CrossRef]
  12. Milliman, J.; Meade, R. World-wide delivery of river sediment to the oceans. J. Geol. 1983, 91, 1–21. [Google Scholar] [CrossRef]
  13. Ren, M.; Shi, Y. Sediment discharge of the Yellow River (China) and its effect on the sedimentation of the Bohai and the Yellow Sea. Cont. Shelf Res. 1986, 6, 785–810. [Google Scholar] [CrossRef]
  14. Zhang, J.; Huang, W.; Liu, M. Geochemistry of major Chinese river-estuary systems. In Oceanology of China Seas; Springer: Dordrecht, The Netherlands, 1994; Volume 1, pp. 179–188. [Google Scholar]
  15. Wang, H.; Bi, N.; Saito, Y.; Wang, Y.; Sun, X.; Zhang, J.; Yang, Z. Recent changes in sediment delivery by the Huanghe (Yellow River) to the sea, causes and environmental implications in its estuary. J. Hydrol. 2010, 391, 302–313. [Google Scholar] [CrossRef]
  16. Milliman, J.; Li, F.; Zhao, Y.; Zheng, T.; Limeburner, R. Suspended matter regime in the Yellow Sea. Progress Oceanogr. 1986, 17, 215–227. [Google Scholar] [CrossRef]
  17. Yang, Z.; Fan, D.; Guo, Z.; Mao, D. Distribution of the carbonate clast size and the provenance analyses of the surface sediments in the northern East China Sea. Acta Sedimentol. Sin. 2002, 20, 1–6, (In Chinese with English Abstract). [Google Scholar]
  18. Lee, E.; Bowers, D.; Kyte, E. Remote sensing of temporal and spatial patterns of suspended particle size in the Irish Sea in relation to the Kolmogorov microscale. Cont. Shelf Res. 2009, 29, 1213–1225. [Google Scholar]
  19. Yang, Z.; Liu, J. A unique Yellow River-derived distal subaqueous delta in the Yellow Sea. Mar. Geol. 2007, 240, 169–176. [Google Scholar] [CrossRef]
  20. Guan, B. Patterns and structures of the currents in Bohai, Huanghai and East China seas. In Oceanology of China Seas; Zhou, D., Liang, Y., Tseng, C.K., Eds.; Kluwer Academic Publishers: Dordrecht, The Netherlands, 1994; Volume 1, pp. 17–26. [Google Scholar]
  21. Alexander, C.; De Master, D.; Nittrouer, C. Sediment accumulation in a modern epicontinental-shelf setting, the Yellow Sea. Mar. Geol. 1991, 98, 51–72. [Google Scholar] [CrossRef]
  22. Martin, J.; Zhang, J.; Shi, M.; Zhou, Q. Actual flux of the Huanghe (Yellow River) sediment to the western Pacific Ocean. Neth. J. Sea Res. 1993, 31, 243–254. [Google Scholar] [CrossRef]
  23. Li, G.; Xue, H.; Liu, Y.; Wang, H.; Liao, H. Diagnostic experiments for transport mechanisms of suspended sediment discharged from the Yellow River in the Bohai Sea. J. Geograph. Sci. 2010, 20, 49–63. [Google Scholar] [CrossRef]
  24. Li, Y.; Eric, W.; Zhang, H. What processes control the net current through shallow straits? A review with application to the Bohai Strait, China. Estuar. Coast. Shelf Sci. 2015, 158, 1–11. [Google Scholar] [CrossRef]
  25. Bi, N.; Yang, Z.; Wang, H.; Fan, D.; Sun, X.; Lei, K. Seasonal variation of suspended-sediment transport through the southern Bohai Strait. Estuar. Coast. Shelf Sci. 2011, 93, 239–247. [Google Scholar] [CrossRef]
  26. Jiang, W.; Pohlmann, T.; Sündermann, J.; Feng, S. A modelling study of SPM transport in the Bohai Sea. J. Mar. Syst. 2000, 24, 175–200. [Google Scholar] [CrossRef]
  27. Chen, Y.; Hu, D.; Wang, F. Long-term variabilities of thermodynamic structure of the East China Sea Cold Eddy in summer. Chin. J. Oceanol. Limnol. 2004, 22, 224–230. [Google Scholar] [CrossRef]
  28. Lin, X.; Wu, D.; Bao, X.; Jiang, W. Study on seasonal temperature and water flux variation of the Bohai Strait. J. Ocean Univ. Qingdao 2002, 32, 355–360, (In Chinese with English abstract). [Google Scholar]
  29. Zhang, Z.; Qiao, F.; Guo, J.; Guo, B. Seasonal changes and driving forces of inflow and outflow through the Bohai Strait. Cont. Shelf Res. 2018, 154, 1–8. [Google Scholar] [CrossRef]
  30. Wu, X.; Bi, N.; Yuan, P.; Li, S.; Wang, H. Sediment dispersal and accumulation off the present Huanghe (Yellow River) delta as impacted by the Water-Sediment Regulation Scheme. Cont. Shelf Res. 2015, 111, 126–138. [Google Scholar] [CrossRef]
  31. Wu, X.; Wu, H.; Wang, H.; Bi, N.; Duan, H.; Wang, C.; Bian, C.; Xu, J. Novel, repeated surveys reveal new insights on sediment flux through a narrow strait, Bohai, China. J. Geophys. Res. Oceans 2019, 124, 6927–6941. [Google Scholar] [CrossRef]
  32. Wu, X.; Xu, J.; Wu, H.; Bi, N.; Bian, C.; Li, P.; Wang, A.; Duan, H.; Wang, H. Synoptic variations of residual currents in the Huanghe (Yellow River)-derived distal mud patch off the Shandong Peninsula: Implications for long-term sediment transport. Mar. Geol. 2019, 417, 106014. [Google Scholar] [CrossRef]
  33. Ding, Y.; Bao, X.; Yao, Z.; Bi, C.; Wan, K.; Bao, M.; Jiang, Z.; Song, J.; Gao, J. Observational and model studies of synoptic current fluctuations in the Bohai Strait on the Chinese continental shelf. Ocean Dyn. 2019, 69, 323–351. [Google Scholar] [CrossRef]
  34. Fan, S.; Sheng, C.; Qu, Q.; Rong, Y. Eavluation and analysis of CFSR data based on spring gale observation over coastal areas of Yellow Sea and Bohai Sea. Meteorol. Sci. Technol. 2017, 45, 917–924, (In Chinese with English abstract). [Google Scholar]
  35. Poitevin, C.; Wöppelmann, G.; Raucoules, D.; Le Cozannet, G.; Marcos, M.; Testut, L. Vertical land motion and relative sea level changes along the coastline of Brest (France) from combined space-borne geodetic methods. Remote Sens. Environ. 2019, 222, 275–285. [Google Scholar] [CrossRef]
  36. Choi, J.; Park, Y.; Ahn, J.; Lim, H.; Eom, J.; Ryu, J. GOCI, the world’s first geostationary ocean color observation satellite, for the monitoring of temporal variability in coastal water turbidity. J. Geophys. Res. 2012, 117, C09004. [Google Scholar] [CrossRef]
  37. Wang, A.; Wang, H.; Bi, N.; Wu, X. Sediment Transport and Dispersal Pattren from the Bohai Sea to the Yellow Sea. J. Coast. Res. 2016, 74, 104–116. [Google Scholar] [CrossRef] [Green Version]
  38. Pawlowicz, R.; Beardsley, B.; Lentz, S. Classical tidal harmonic analysis including error estimates in MATLAB using T_TIDE. Comput. Geosci. 2002, 28, 929–937. [Google Scholar] [CrossRef]
  39. Thorne, P.; Hurther, D. An overview on the use of backscattered sound for measuring suspended particle size and concentration profiles in non-cohesive inorganic sediment transport studies. Cont. Shelf Res. 2013, 73, 97–118. [Google Scholar] [CrossRef] [Green Version]
  40. Hu, Z.; Wang, D.; He, X.; Li, M.; Wei, J.; Pan, D.; Bai, Y. Episodic surface intrusions in the Yellow Sea during relaxation of northerly winds. J. Geophys. Res. Oceans 2017, 122, 6533–6546. [Google Scholar] [CrossRef]
  41. Qu, L.; Lin, X.; Hetland, R.D.; Guo, J. The Asymmetric Continental Shelf Wave in Response to the Synoptic Wind Burst in a Semienclosed Double-Shelf Basin. J. Geophys. Res. Oceans 2018, 123, 131–148. [Google Scholar] [CrossRef]
  42. Ding, Y.; Bao, X.; Yao, Z.; Song, D.; Song, J.; Gao, J.; Li, J. Effect of coastal-trapped waves on the synoptic variations of the Yellow Sea Warm Current during winter. Cont. Shelf Res. 2018, 167, 14–31. [Google Scholar] [CrossRef]
  43. Jiang, D.; Gao, S.; Cheng, P. Modelling sediment transport in the Bohai Strait. Oceanol. Limnol. Sin. 2002, 33, 553–561, (In Chinese with English abstract). [Google Scholar]
  44. Qin, Y.; Li, F. Study on the suspended matter of the sea water of the Bohai Gulf. Acta Oceanol. Sin. 1982, 4, 191–200, (In Chinese with English abstract). [Google Scholar]
  45. Fan, R.; Wei, H.; Zhao, L.; Zhao, W.; Jiang, C.; Nie, H. Identify the impacts of waves and tides to coastal suspended sediment concentration based on high-frequency acoustic observations. Mar. Geol. 2019, 400, 154–164. [Google Scholar] [CrossRef]
  46. Su, H.; Wang, Y. Using MODIS data to estimate sea ice thickness in the Bohai Sea (China) in the 2009–2010 winter. J. Geophys. Res. 2012, C10018. [Google Scholar] [CrossRef]
  47. Shi, W.; Wang, M. Sea ice properties in the Bohai Sea measured by MODIS-Aqua: 2. Study of sea ice seasonal and interannual variability. J. Mar. Syst. 2012, 95, 41–49. [Google Scholar] [CrossRef]
  48. Soulsby, R.; Davies, A. Bed Shear Stress Due to Combined Waves and Currents, Advances in Coastal Morphodynamics; Delft Hydraulics: Delft, The Netherlands, 1995. [Google Scholar]
  49. Van Rijn, L.C. Principles of Sediment Transport in Rivers, Estuaries and Coastal Seas; Aqua Publications: Amsterdam, The Netherlands, 1993. [Google Scholar]
  50. Yang, Z.; Ji, Y.; Bi, N.; Lei, K.; Wang, H. Sediment transport off the Huanghe (Yellow River) delta and in the adjacent Bohai Sea in winter and seasonal comparison. Estuar. Coast. Shelf Sci. 2011, 93, 173–181. [Google Scholar] [CrossRef]
  51. Lu, J.; Qiao, F.; Wang, X.; Wang, Y.G.; Teng, Y.; Xia, C. A numerical study of transport dynamics and seasonal variability of the Yellow River sediment in the Bohai and Yellow seas. Estuar. Coast. Shelf Sci. 2011, 95, 39–51. [Google Scholar] [CrossRef]
  52. Bian, C.; Jiang, W.; Greatbatch, R. An exploratory model study of sediment transport sources and deposits in the Bohai Sea, Yellow Sea, and East China Sea. J. Geophys. Res. Oceans 2013, 188, 1–16. [Google Scholar] [CrossRef] [Green Version]
  53. Jacobs, G.; Perkins, H.; Teague, W.; Hogan, P. Summer transport through the Tsushima-Korea Strait. J. Geophys. Res. 2001, 106, 6917–6929. [Google Scholar] [CrossRef]
  54. Jan, S.; Sheu, D.D.; Kuo, H. Water mass and throughflow transport variability in the Taiwan Strait. J. Geophys. Res. 2006, 111, C12012. [Google Scholar] [CrossRef]
  55. Ursella, L.; Gačić, M.; Kovačević, V.; Deponte, D. Low-frequency flow in the bottom layer of the Strait of Otranto. Cont. Shelf Res. 2012, 44, 5–19. [Google Scholar] [CrossRef]
  56. Carracedo Segade, L.I.; Gilcoto, M.; Mercier, H.; Pérez, F. Quasi-synoptic transport, budgets and water mass transformation in the Azores-Gibraltar Strait region during summer 2009. Progress Oceanogr. 2015, 130, 47–64. [Google Scholar] [CrossRef] [Green Version]
  57. Takikawa, T.; Yoon, J. Volume Transport through the Tsushima Straits Estimated from Sea Level Difference. J. Oceanogr. 2005, 61, 699–708. [Google Scholar] [CrossRef] [Green Version]
  58. Teagure, W.; Hwang, P.; Jacobs, G.; Book, J.; Perkins, H. Transport variability across the Korea/Tsushima Strait and the Tsushima Island wake. Deep Sea Res. II 2005, 52, 1784–1801. [Google Scholar] [CrossRef]
  59. Yari, S.; Kovačević, V.; Cardin, V.; Gačić, M.; Bryden, H. Direct estimate of water, heat, and salt transport through the Strait of Otranto. J. Geophys. Res. 2012, 117, C09009. [Google Scholar] [CrossRef] [Green Version]
  60. Jacobs, G.; Ko, D.; Ngodock, H.; Preller, R.; Riedlinger, S. Synoptic forcing of the Korea Strait transport. Deep Sea Res. II 2005, 52, 1490–1504. [Google Scholar] [CrossRef]
  61. Moon, J.; Hirose, N.; Yoon, J.; Pang, I. Effect of the Along-Strait Wind on the Volume Transport through the Tsushima/Korea Strait in September. J. Oceanogr. 2009, 65, 17–29. [Google Scholar] [CrossRef]
  62. Zhang, W.; Hong, H.; Yan, X. Typhoons enhancing northward transport through the Taiwan Strait. Cont. Shelf Res. 2013, 56, 13–25. [Google Scholar] [CrossRef]
  63. Zhang, W.; Hong, H.; Shang, S.; Yan, X.; Chai, F. Strong southward transport events due to typhoons in the Taiwan Strait. J. Geophys. Res. 2009, 114, C11013. [Google Scholar] [CrossRef] [Green Version]
  64. Ko, D.; Preller, R.; Jacobs, G.; Tang, T.; Lin, S. Transport reversals at Taiwan Strait during October and November 1999. J. Geophys. Res. 1999, 108, 3370. [Google Scholar] [CrossRef] [Green Version]
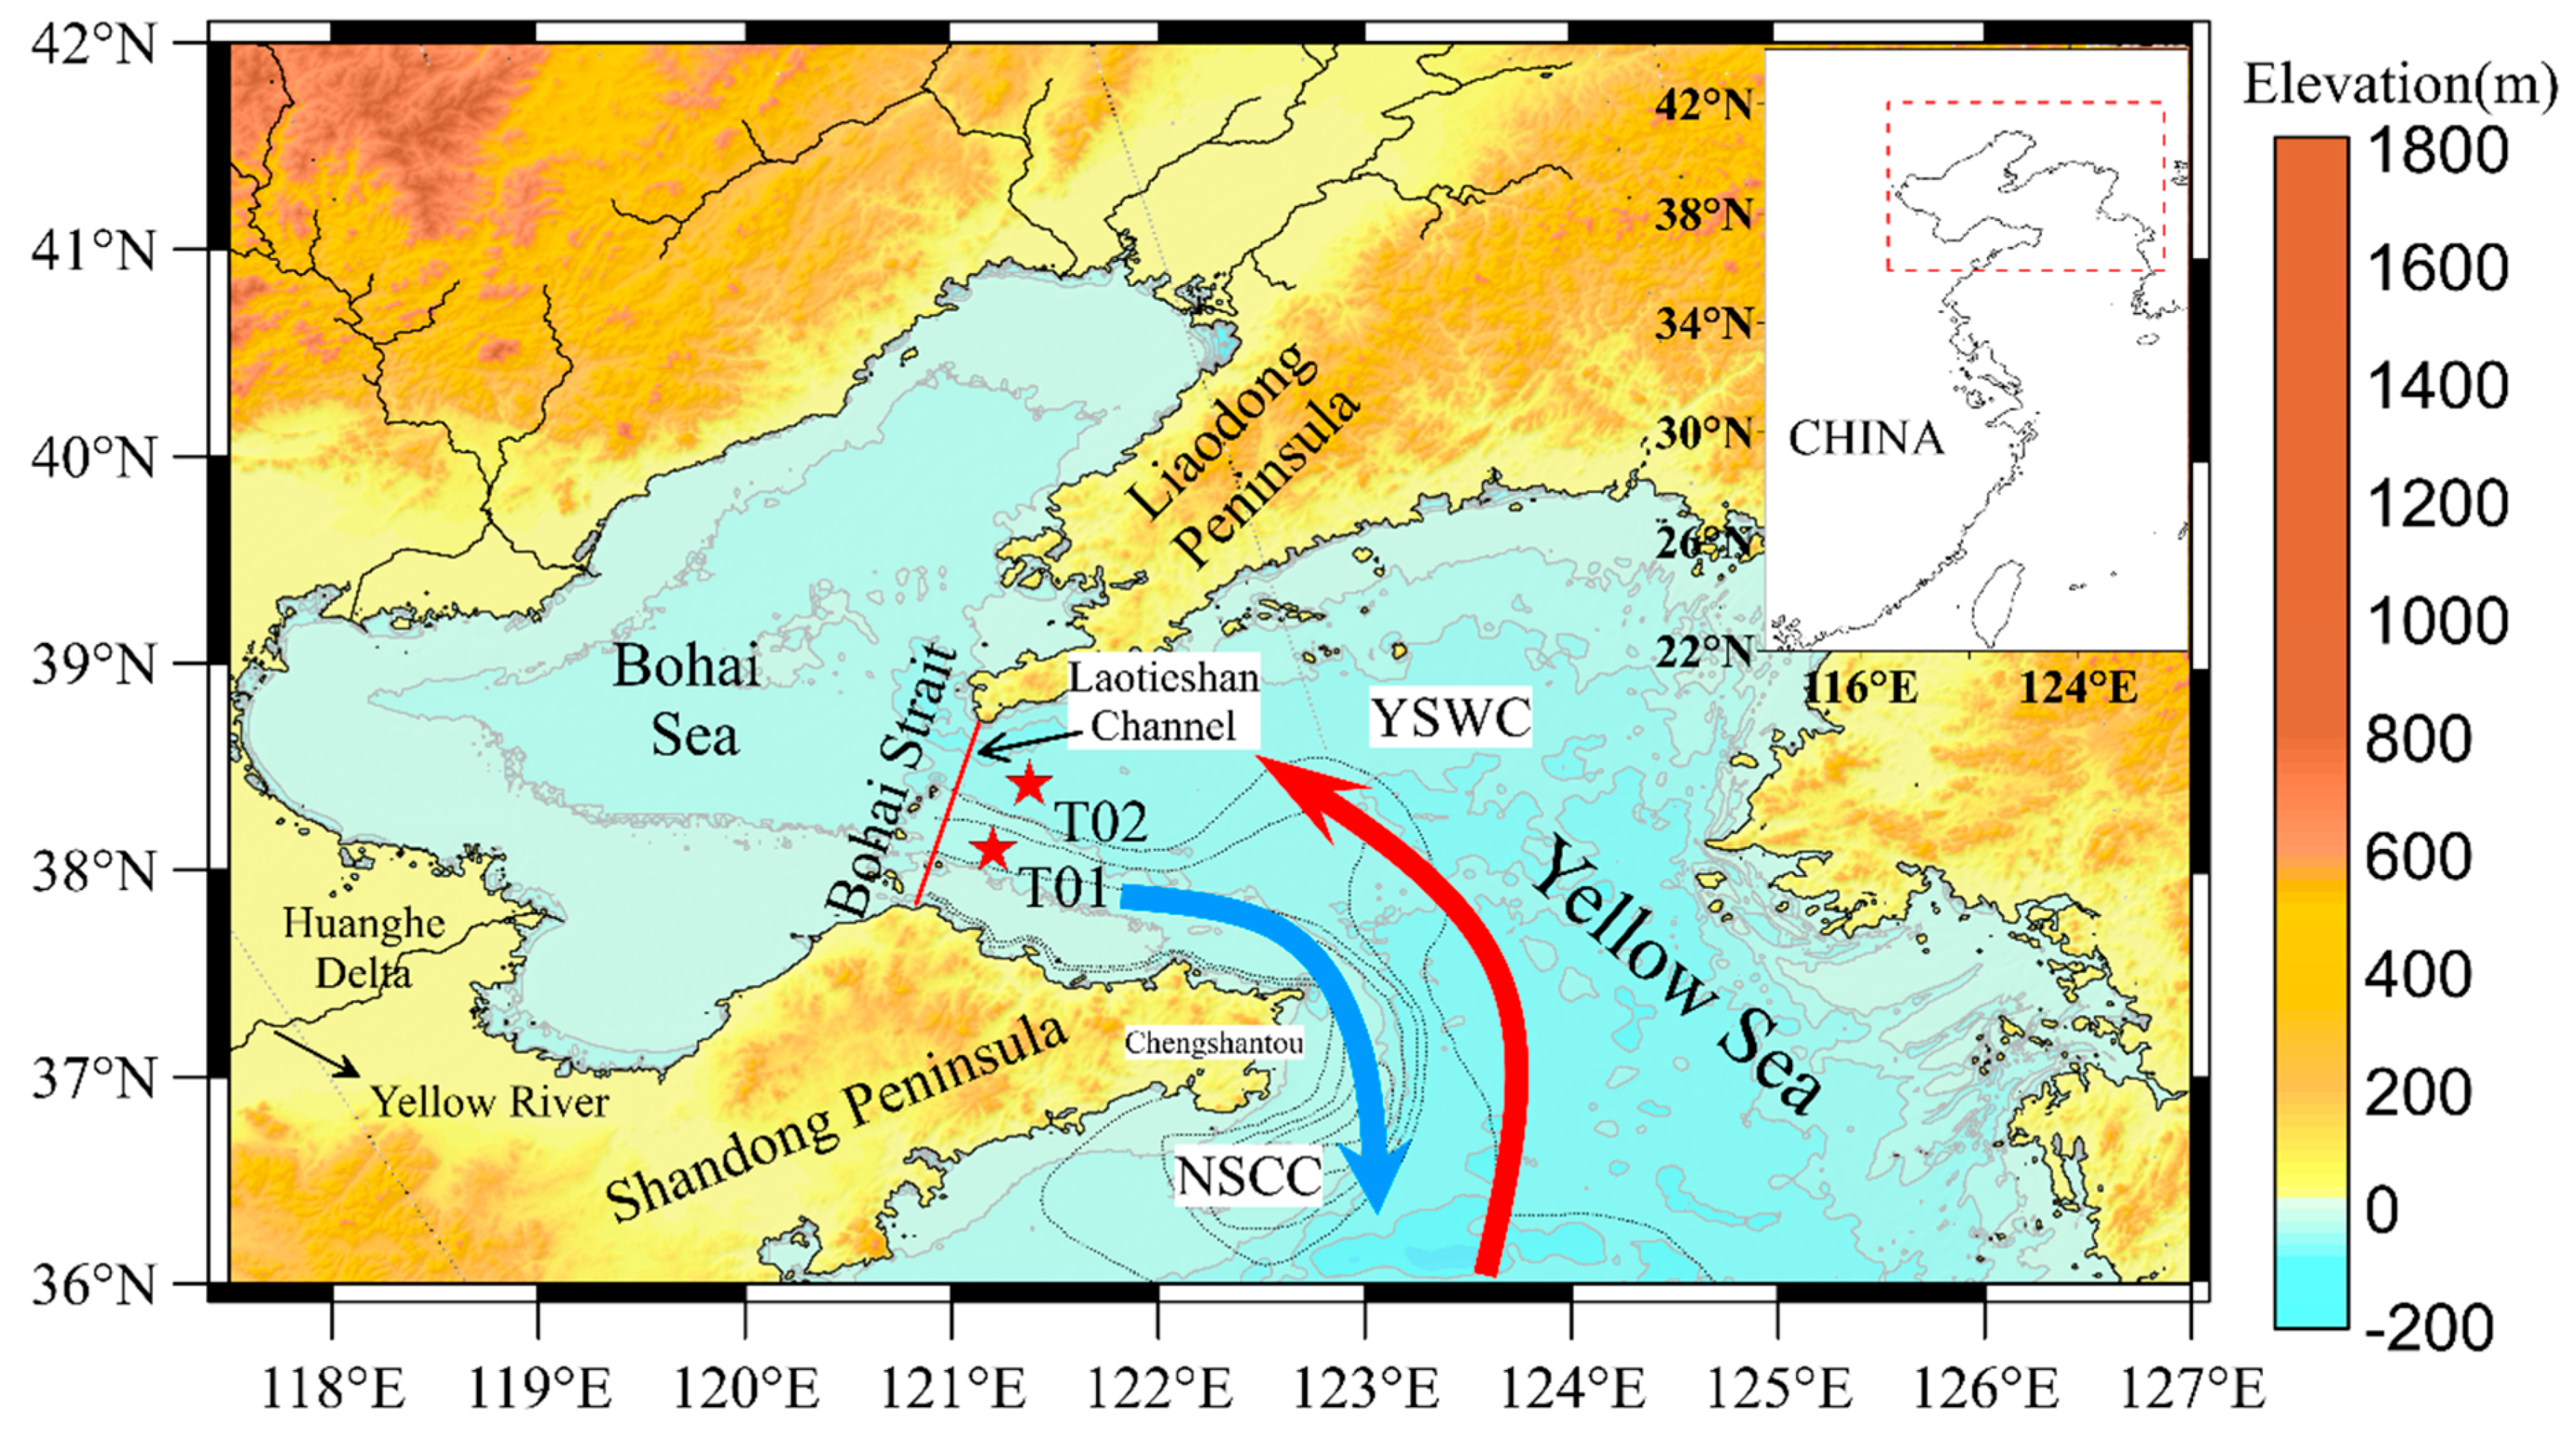
Figure 1. A local bathymetric map showing the location of the observation sites (red stars). The red solid line is the transect across The Bohai Strait. The dotted contour lines are the iso-thickness of the Holocene mud in North Yellow Sea (the contour interval is 10 m; the thickness is about 40 m at the top of the deposit) [19]. The red and blue arrows indicated the Yellow Sea Warm Current (YSWC) and the Northern Shandong Coastal Current (NSCC) respectively [20].
Water 12 00986 g001
Figure 2. A schematic drawing showing the instrument placements at the site T01 (a) and site T02 (b) respectively.
Water 12 00986 g002
Figure 3. Time-series of in situ current profiles (b) of site T01 (a) and site T02 (b) respectively during observation.
Water 12 00986 g003
Figure 4. Time-series of inversed SSC profiles of site T01 (a) and site T02 (b) respectively during observation; (c) Comparison of the observed SSC (obtained by the water samples) and the inversed SSC at site T01 and site T02 respectively.
Water 12 00986 g004
Figure 5. (a) Hourly wind vectors and magnitude (NCEP/CFSv2) of 10 m above the sea surface over the Bohai Strait January 6 to 13, 2018. Time-series of significant wave height (b), peak period (c) and peak direction (d) recorded by the ADCPs at site T01 and T02 respectively.
Water 12 00986 g005
Figure 6. Time-series of hydrological characteristics (temperature (a), salinity (b) and excess density (c)) in T01 and T02 during observation).
Water 12 00986 g006
Figure 7. The variation of residual water level (a) during different wind conditions (the dashed arrows indicate the varied trend). The variation of depth-averaged subtidal velocity of cross-strait component at site T01 (b) and site T02 (c) during different wind conditions.
Water 12 00986 g007
Figure 8. The variation of SSC at surface, middle and bottom layers at site T01 (a) and site T02 (b) during different wind conditions.
Water 12 00986 g008
Figure 9. The unit-width water flux (red arrows) and suspended sediment flux (blue arrows) at observed depths at site T01 and T02 under different wind conditions. (a) Weak northerly or southerly wind (P1); (b) intense northerly wind event (P2); (c) wind relaxation or reversal (P3).
Water 12 00986 g009
Figure 10. Spatial distribution of wind field and sea level height from January 6, 2018 to January 13, 2018. The data of sea surface height is available at CMEMS: http://marine.copernicus.eu/services-portfolio/access-to-products/; the data of wind field is available at https://rda.ucar.edu/datasets/ds094.1/.
Water 12 00986 g010
Figure 11. Spatial distribution of significant wave height during different wind conditions on winter 2018: (a) during intense wind; (b) wind relaxation or reversal. Spatial distribution of sea surface SSC during different wind conditions on winter 2018: (c) during intense wind; (d) wind relaxation or reversal. The significant wave height are available at WAVEWATCHⅢ Global model: http://ww3.cimh.edu.bb/. The data of sea surface SSC are available at GOCI: http://kosc.kiost.ac.kr/eng/p10/kosc_p11.html. (e) The variation of sea surface SSC in different regions during different wind conditions. Northern Shandong Peninsula (NSDP), Laizhou Bay (LZB), Northern Bohai Strait (NBHS), Liaodong Bay (LDB), Bohai Bay (BHB) and Center of Bohai Sea (CBS). The percentage in the dashed frames indicate the variation rate.
Water 12 00986 g011
Figure 12. The bottom currents and shear stress of current, wave and wave-current combination at site T01 (a) and site T02 (b) during the observation.
Water 12 00986 g012
Figure 13. Schematic diagrams to show the different transport patterns through the Bohai strait under the impacts of the intense northerly wind (a) and wind relaxations or reversals (b) respectively.
Water 12 00986 g013
Table 1. Instruments placements in this study and the details on their setup.
StationsObservation
Method
InstrumentsMeasurement
Period
Sampling Interval Depth (m)Sampling Levels / Vertical Bin Size (m)Blind Zone (m)
T01Anchor stationWater samples6 January 9:00 to
7 January 10:00
1 h0.2, 0.4,
0.8 depth
3/--
TripodCTD6 January 9:00 to
13 January 12:00
1 min301/--
ADCP6 January 9:00 to
13 January 12:00
20 min,
1 h
3034/0.75 (velocity),
1/- (wave)
1.55
ADV6 January 9:00 to
13 January 12:00
10 min301/-
Subsurface
mooring
TU1 January 9:00 to
13 January 12:00
1 min151/--
CTD1 January 9:00 to
13 January 12:00
1 min151/--
T02Anchor stationWater samples6 January 9:00 to
7 January 10:00
1 h0.2, 0.4,
0.8 depth
3/--
Bottom mountCTD1 January 9:00 to
13 January 11:00
1 min501/--
ADCP1 January 9:00 to
13 January 11:00
20 min,
1 h
5064/0.75 (velocity),
1/- (wave)
1.55
Subsurface
mooring
TUs1 January 9:00 to
13 January 11:00
1 min22, 442/--
CTDs1 January 9:00 to
13 January 11:00
1 min22, 442/--
Notes: ADCP: 600 kHz Acoustic Doppler Current Profiler with wave module; ADV: Acoustic Doppler Velocimeter; CTD: conductivity/temperature/pressure sensor; TU: turbidity sensor; Depths are relative to the sea level and 0.2, 0.4 and 0.8 mean 20%, 40% and 80% of the local water depth respectively.
Table 2. Total transport quantities during observation.
Stations (+/-: Out/in)Phase 1Phase 2Phase 3Total
T01Water (×105 m3/m)−1.2811.3−1.648.38
Suspended sediment (tons/m)−1.2713.75−0.7811.7
T02Water (×105 m3/m)−2.143.71−3.92−2.35
Suspended sediment (tons/m)−1.801.44−0.55−0.91