Effect of Wave, Current, and Lutocline on Sediment Resuspension in Yellow River Delta-Front


Abstract
1. Introduction
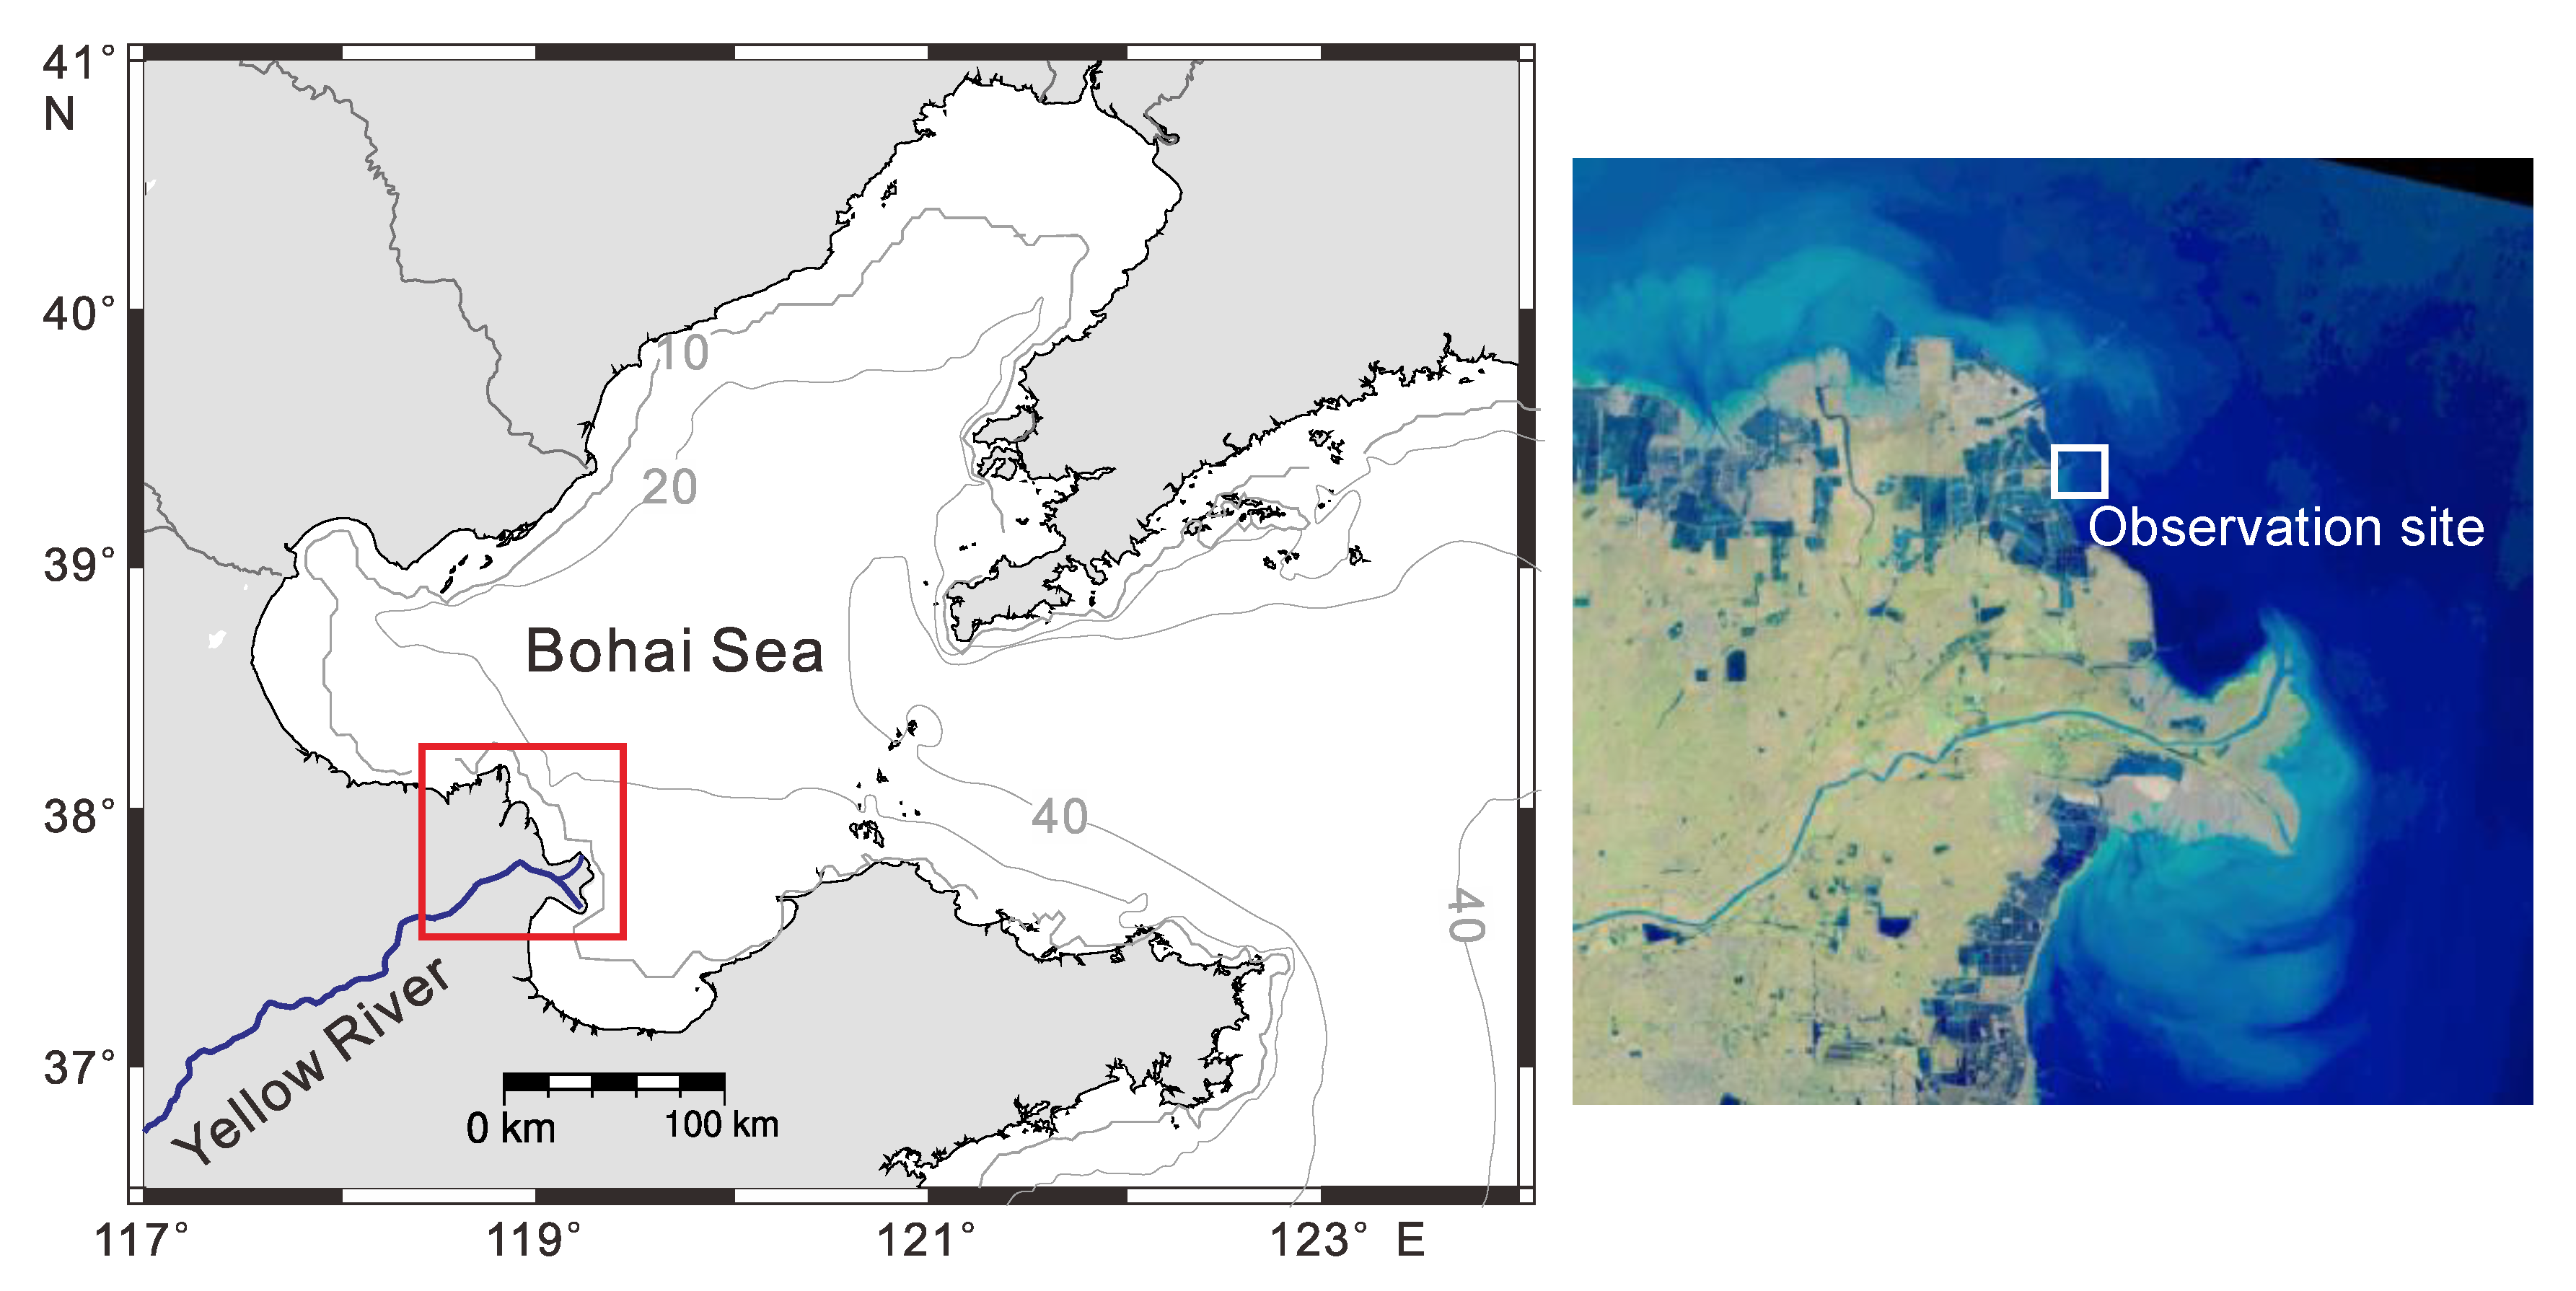
2. Study Site
3. Methods
3.1. Observation Instrumentation
3.2. Performance of Observation Instruments
3.3. Calculation
4. Results
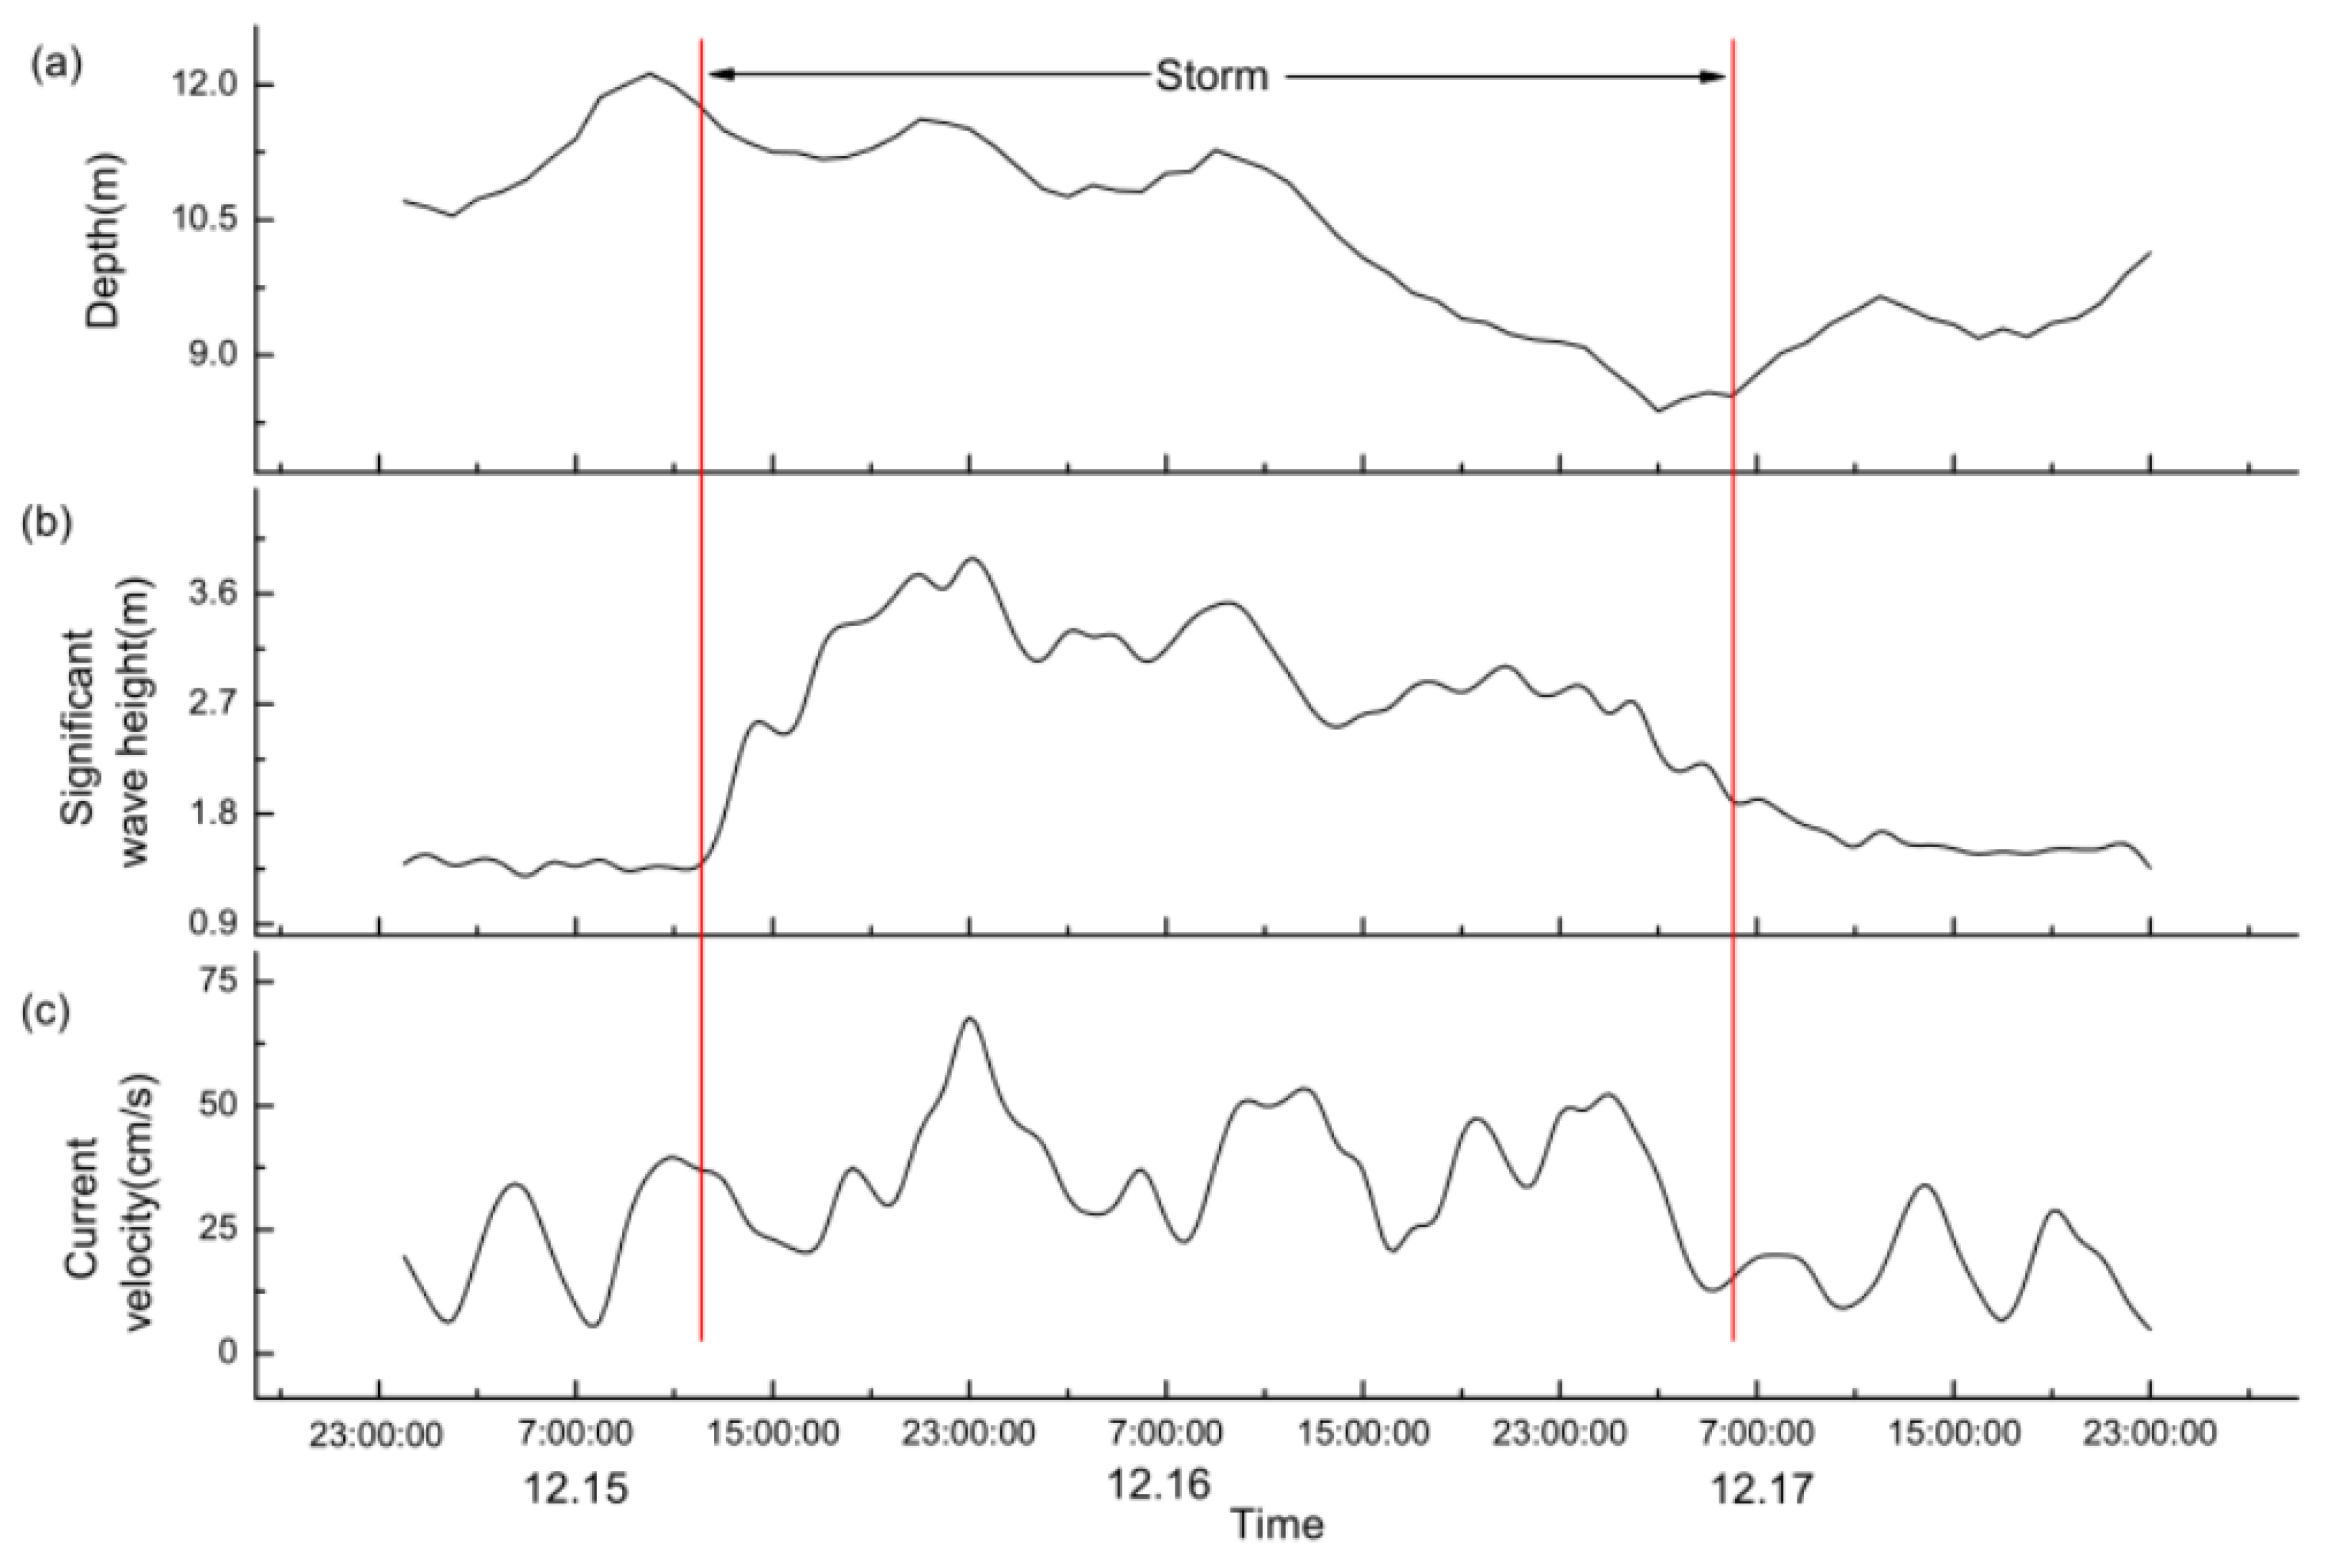
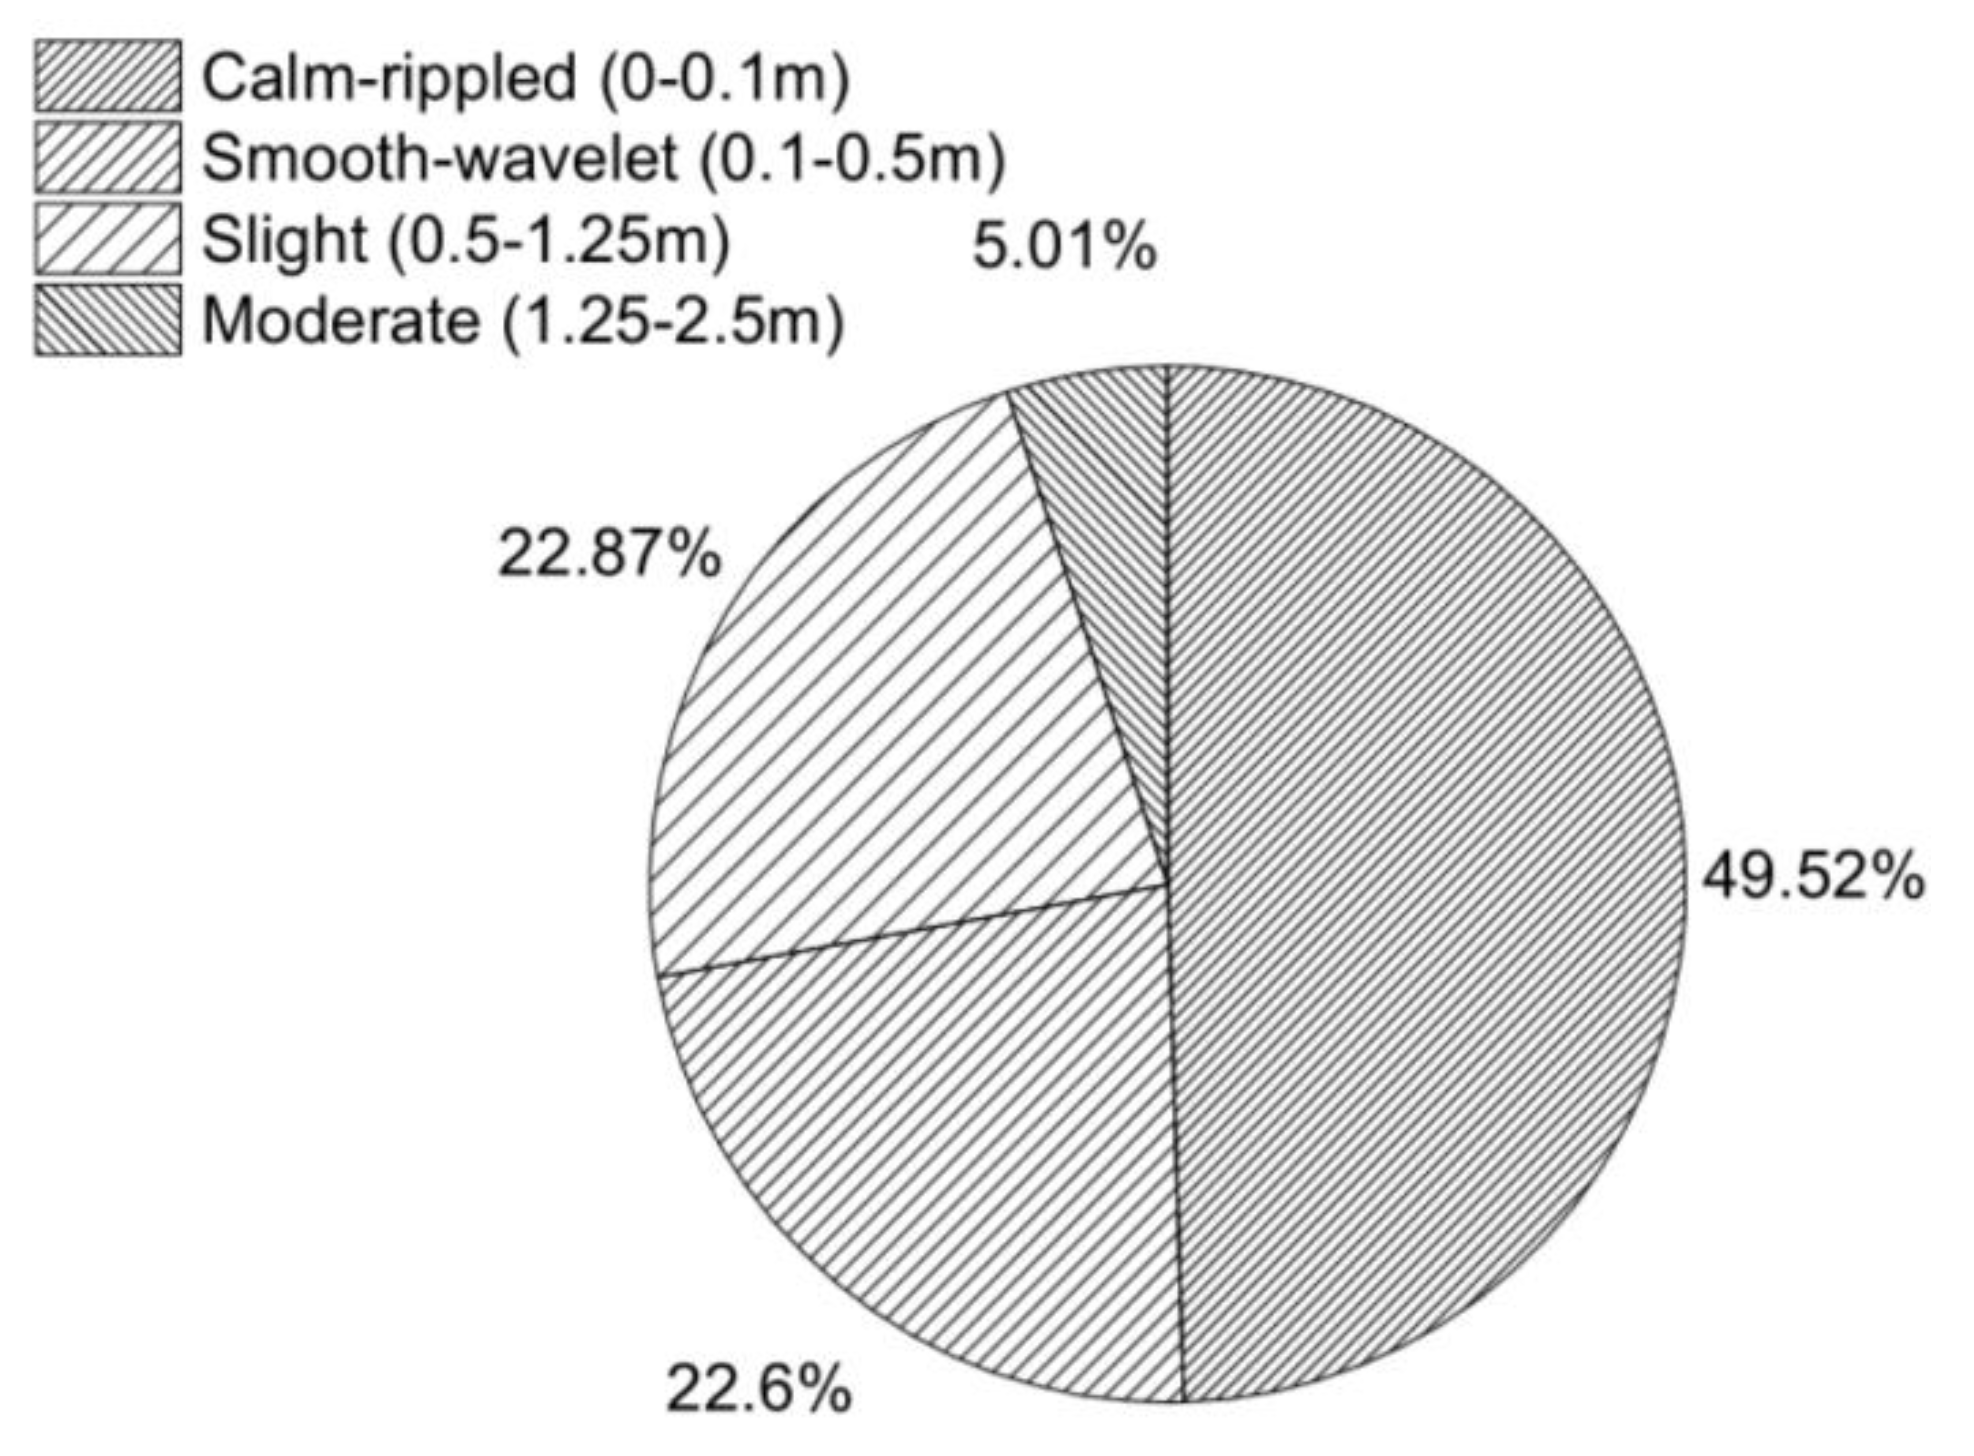
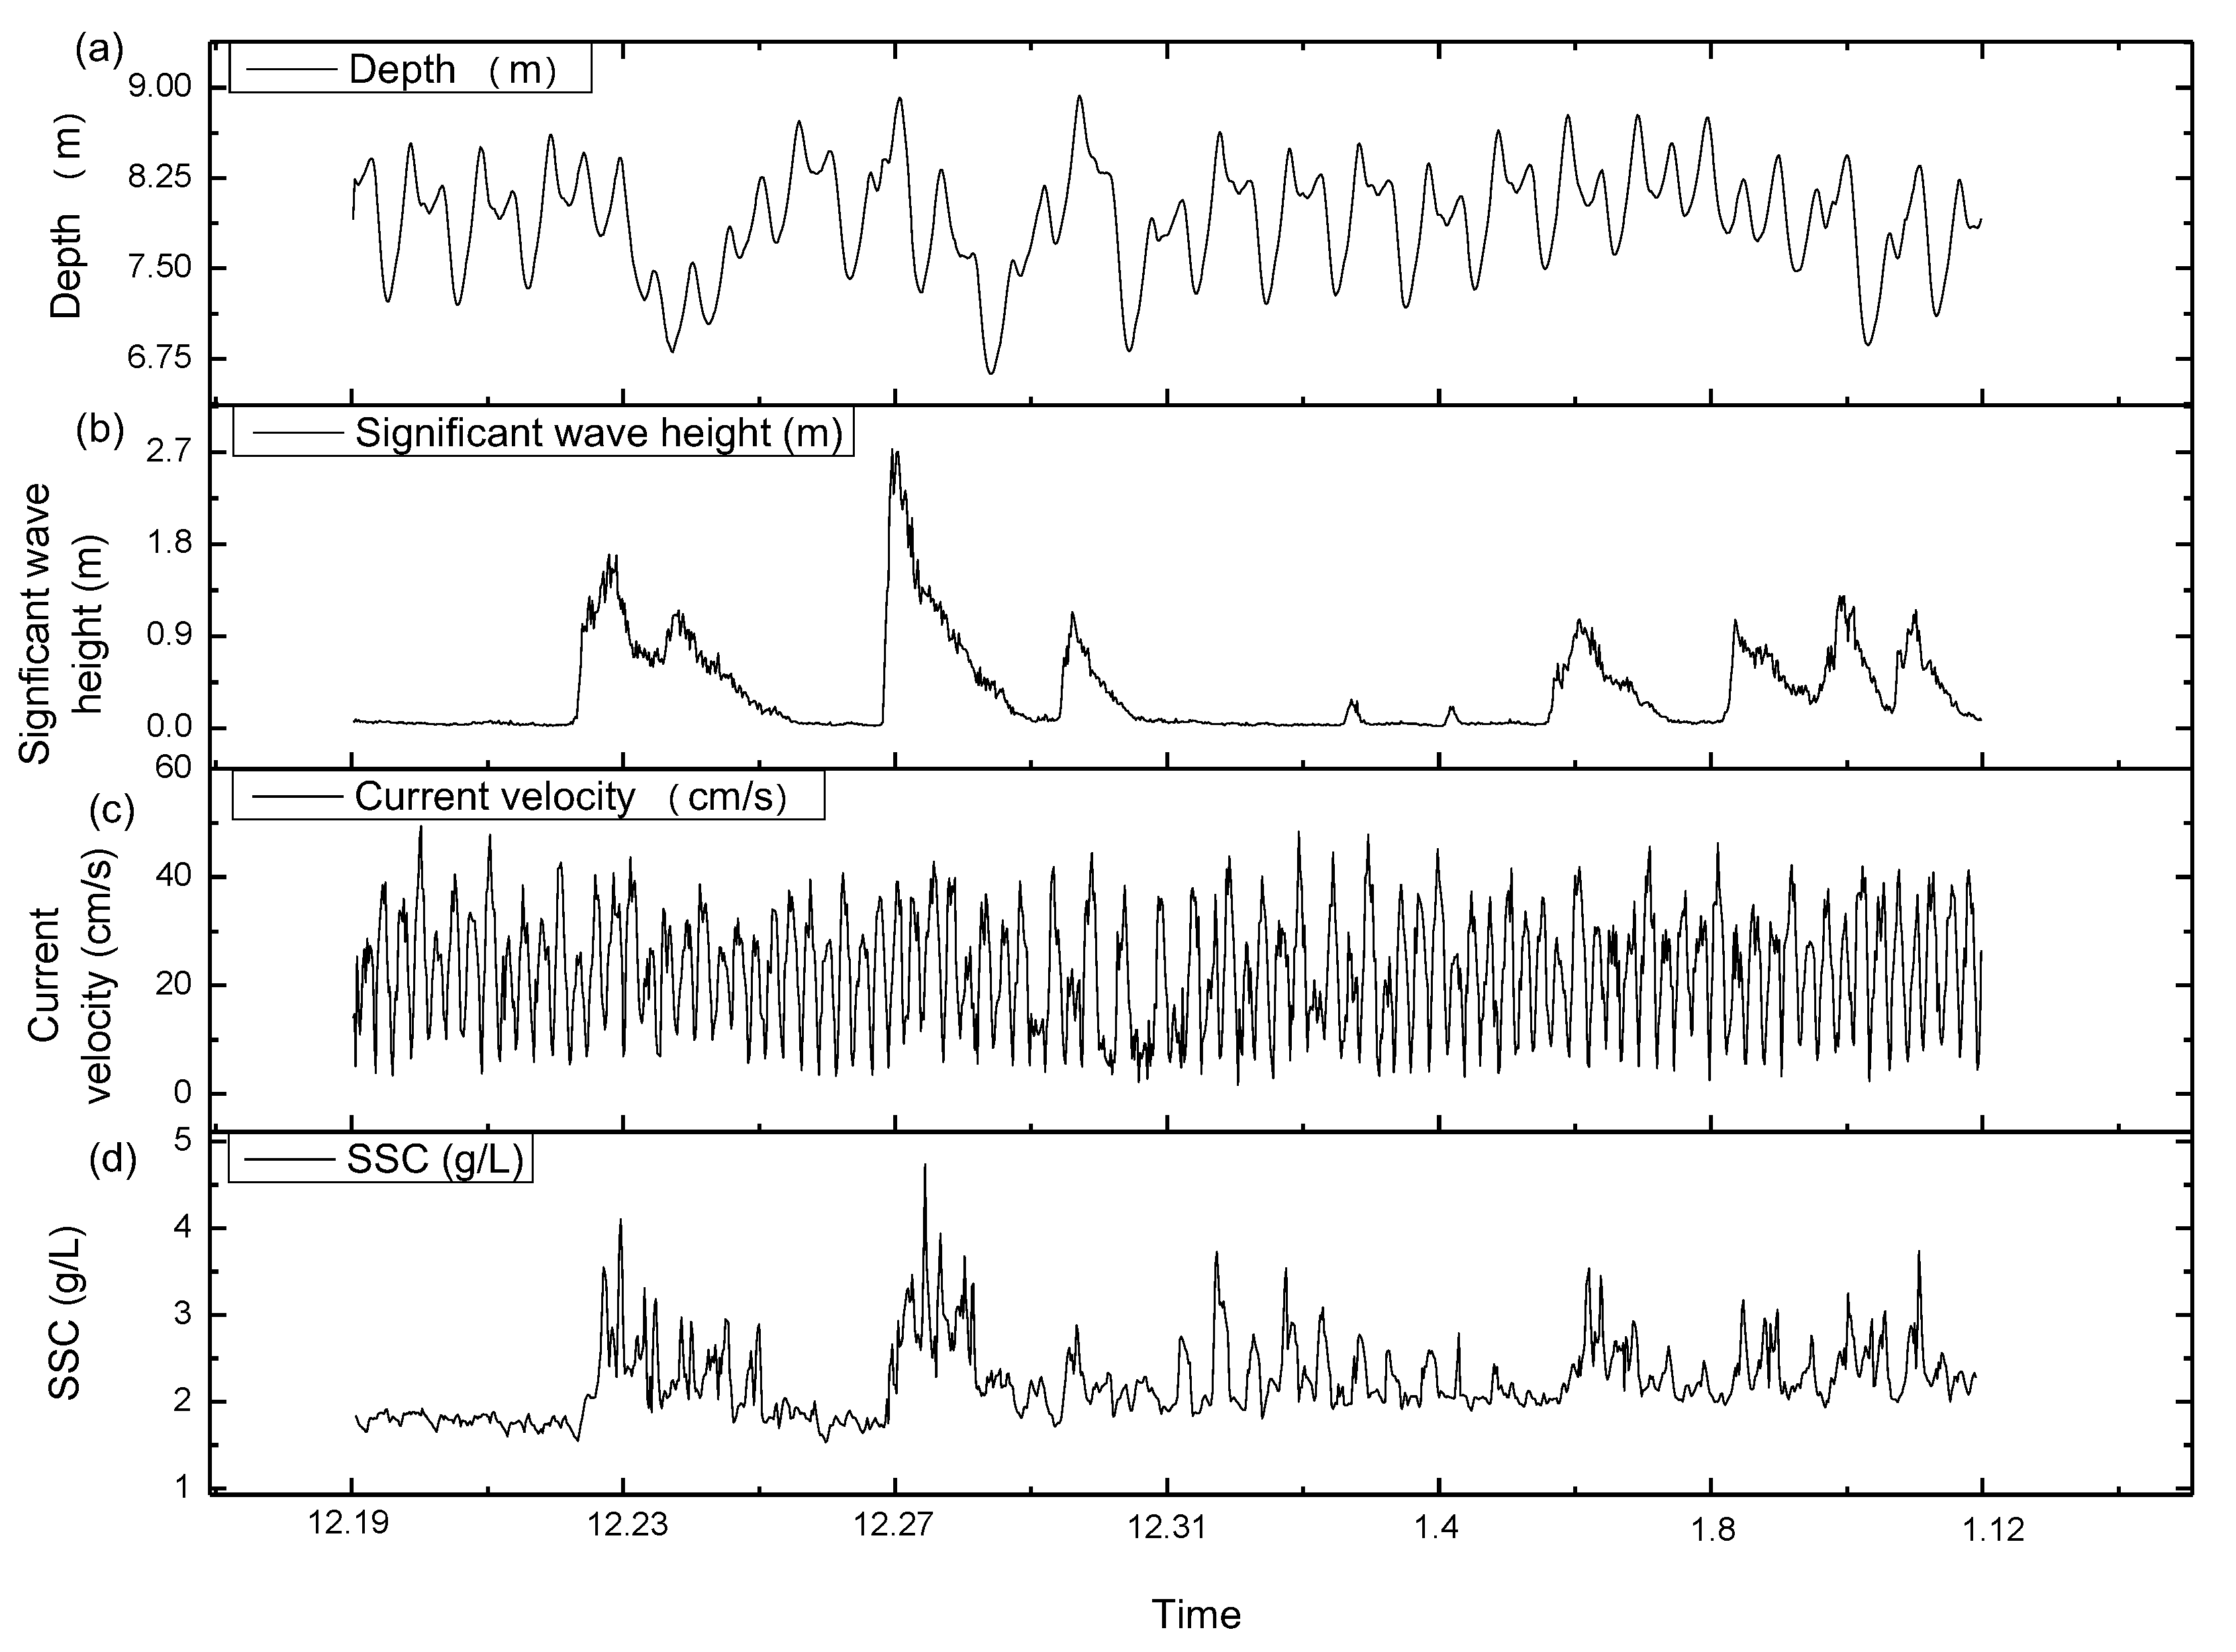
4.1. Hydrodynamic Parameters
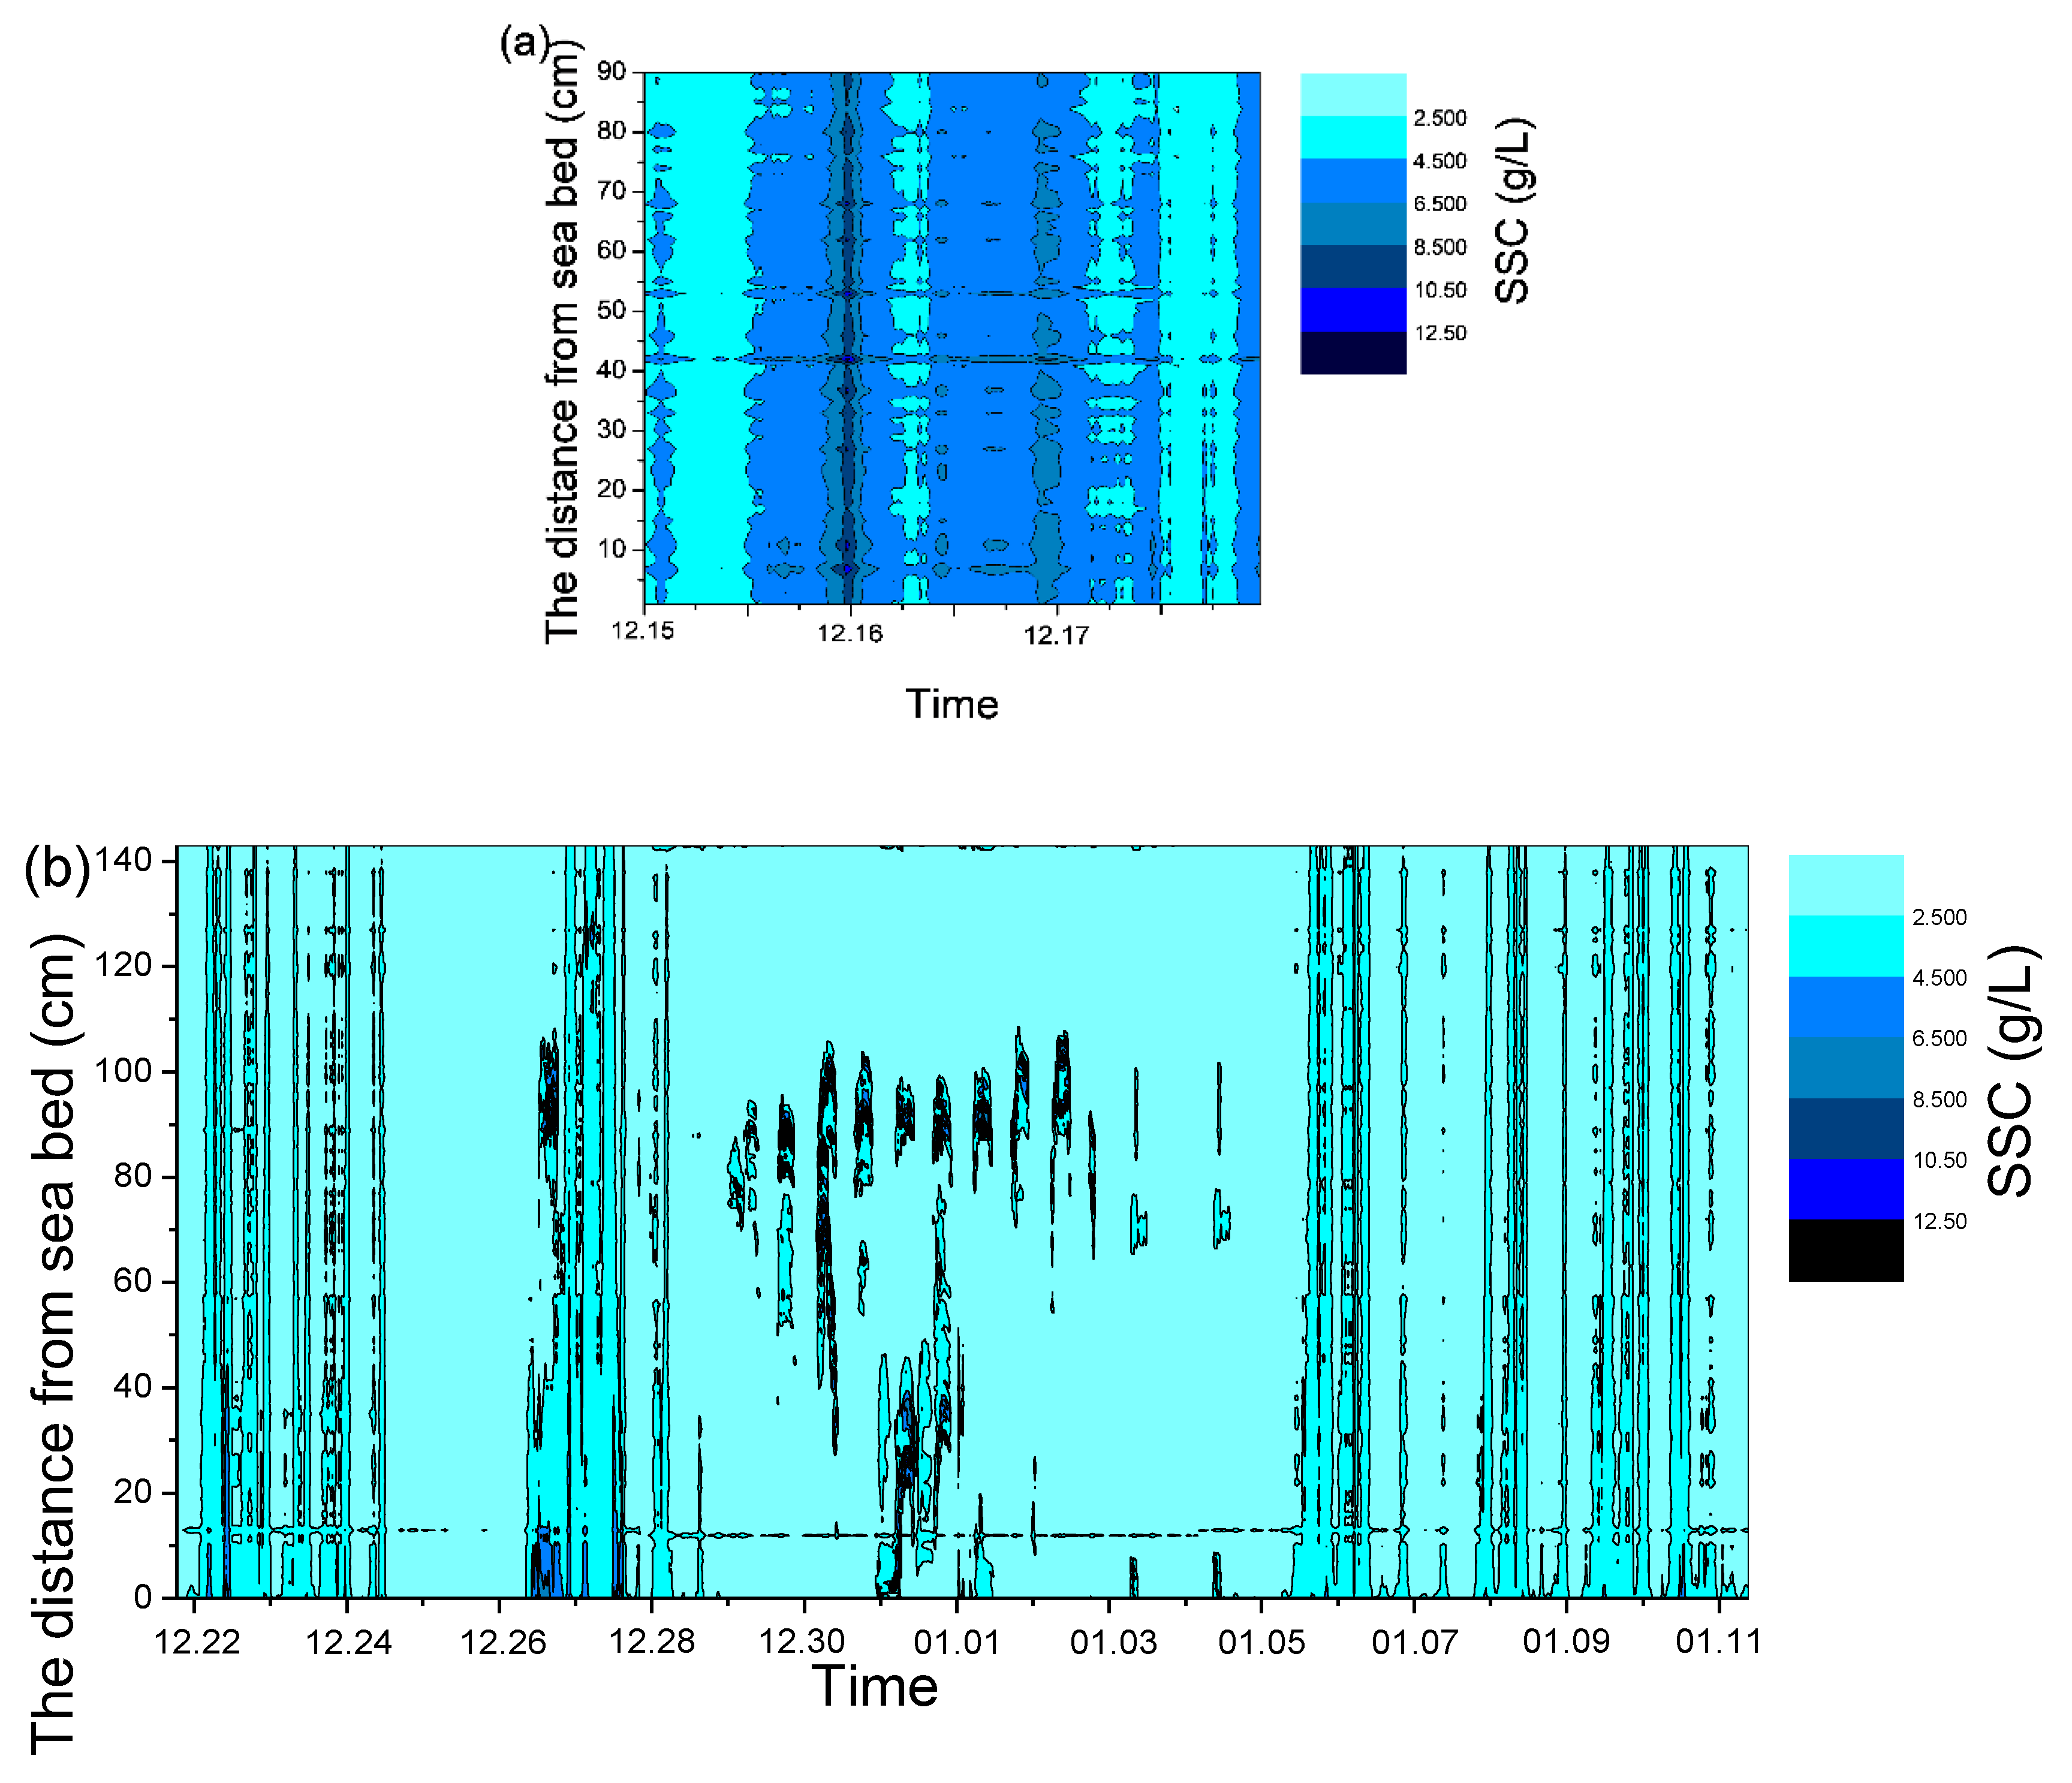
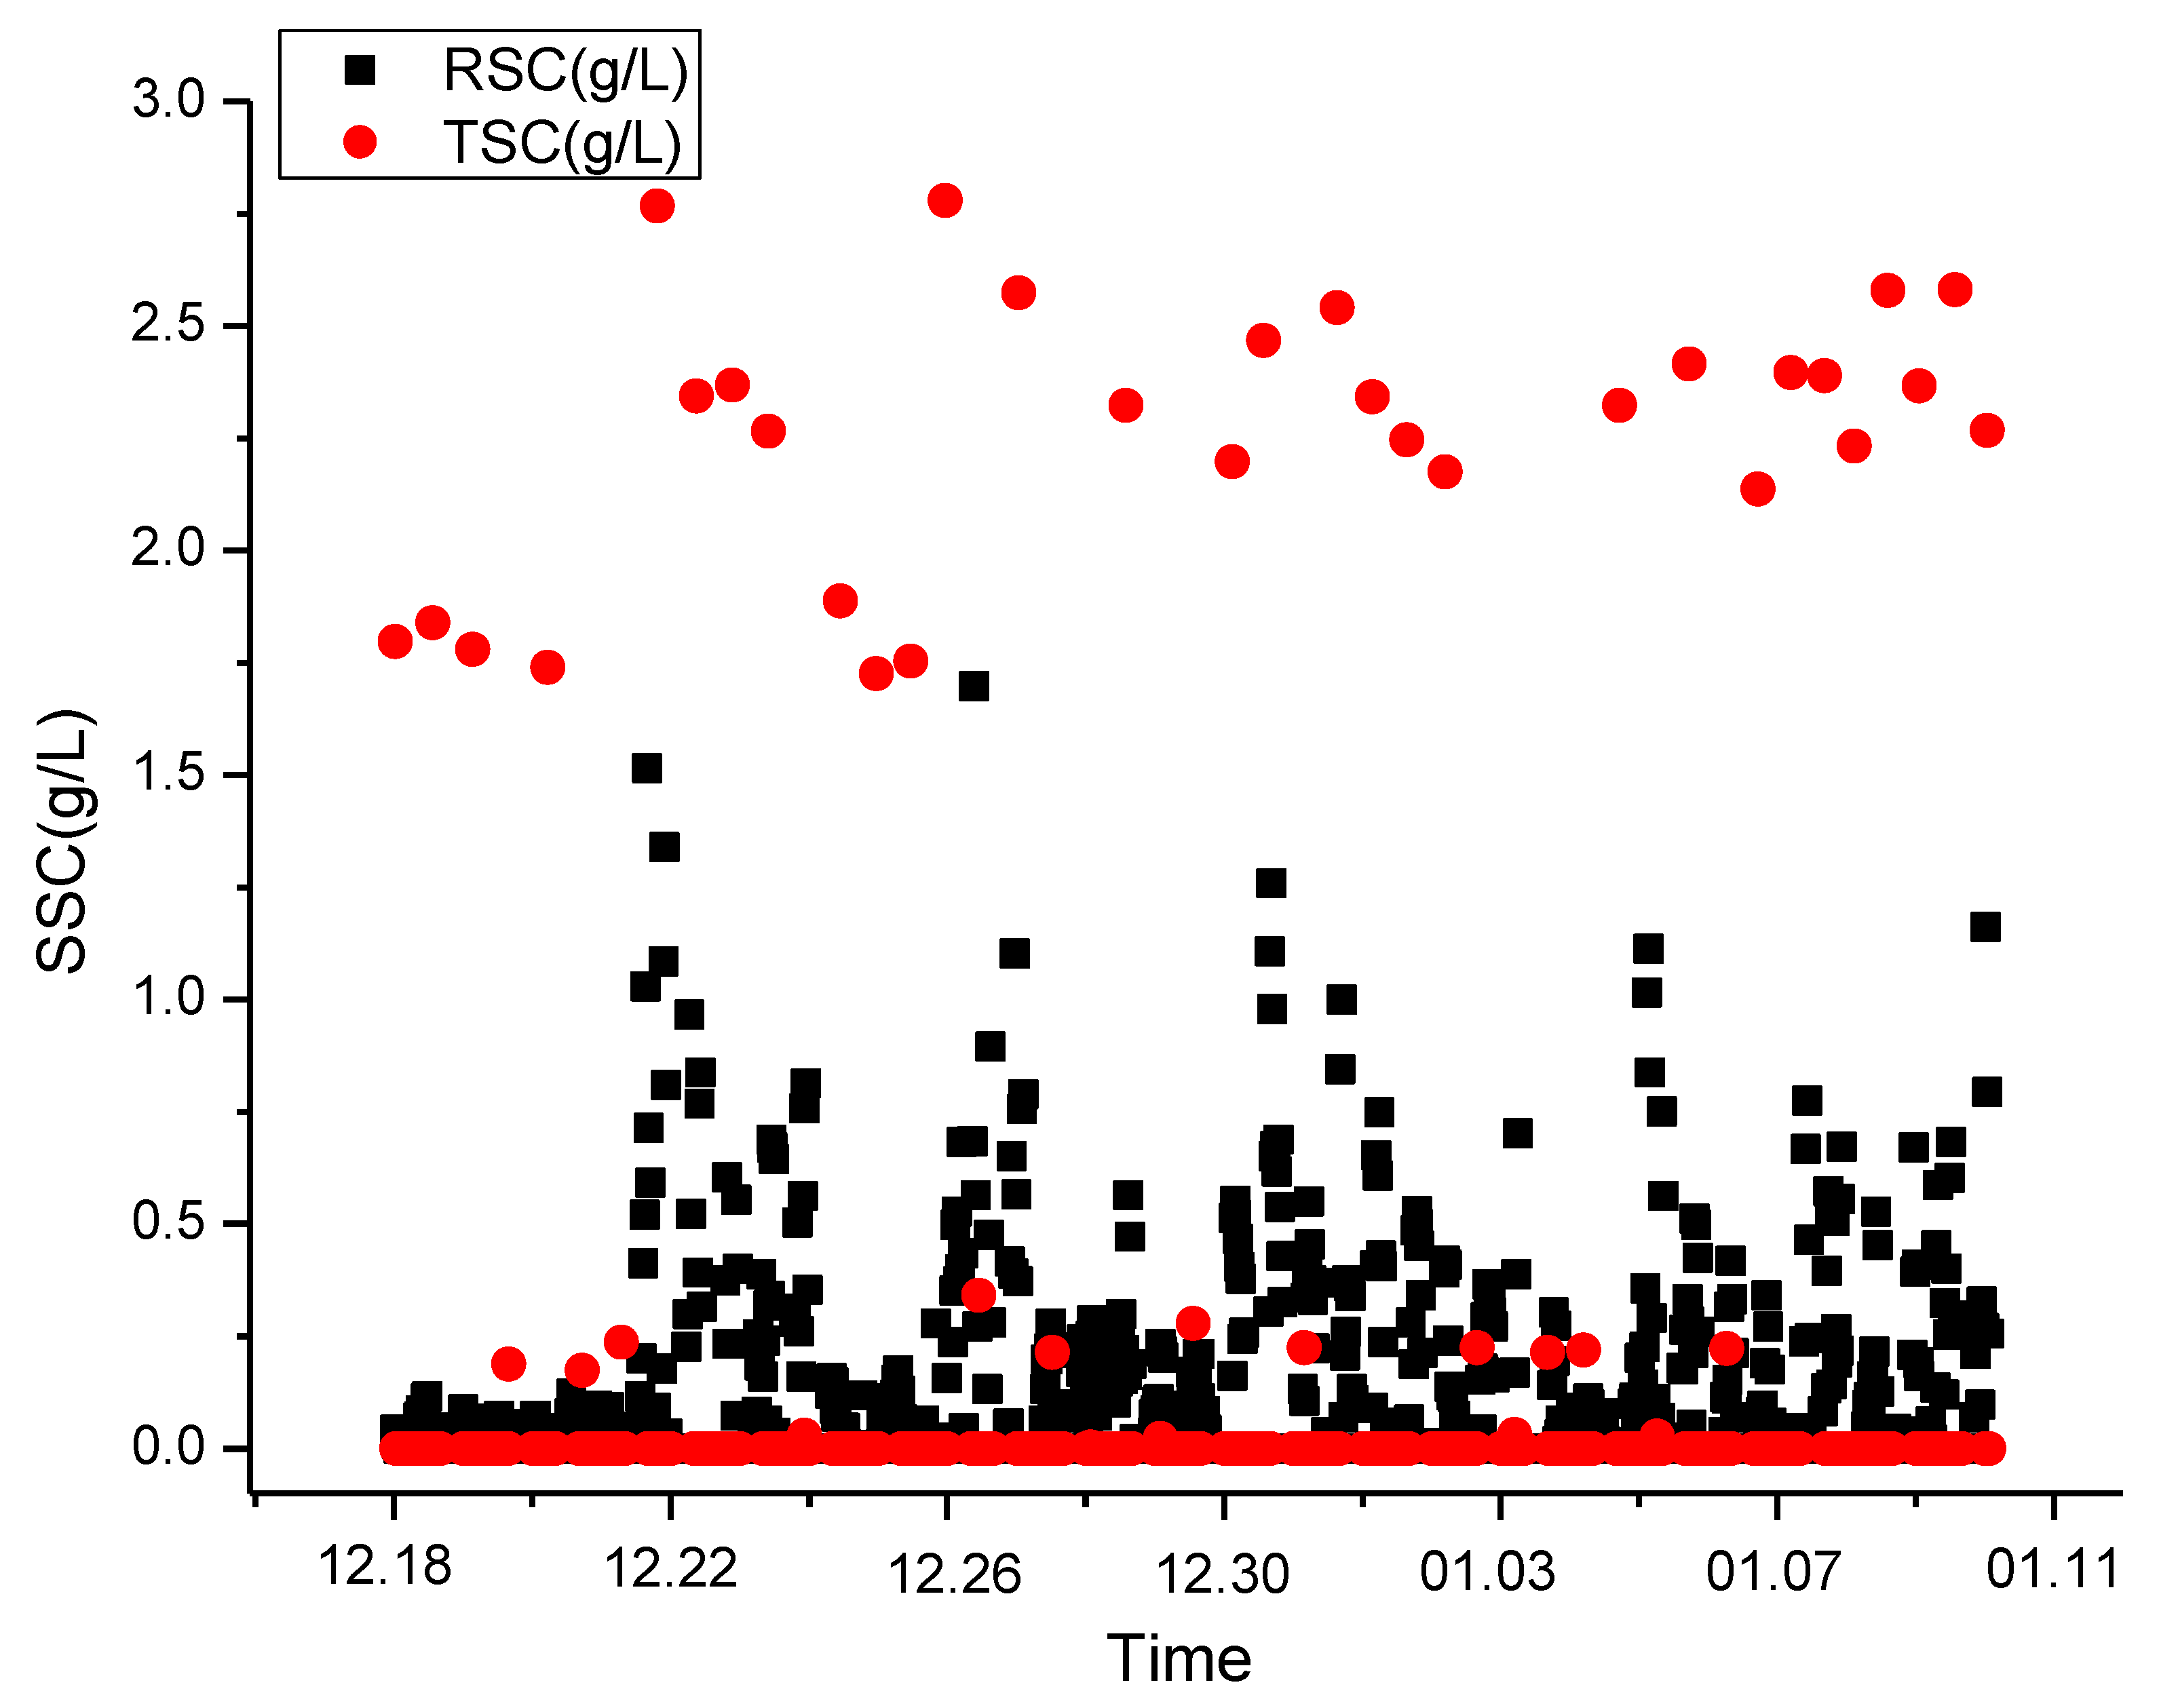
4.2. Suspended Sediment Concentration
4.3. Physical and Mechanical Properties of Seabed Sediment
5. Discussion
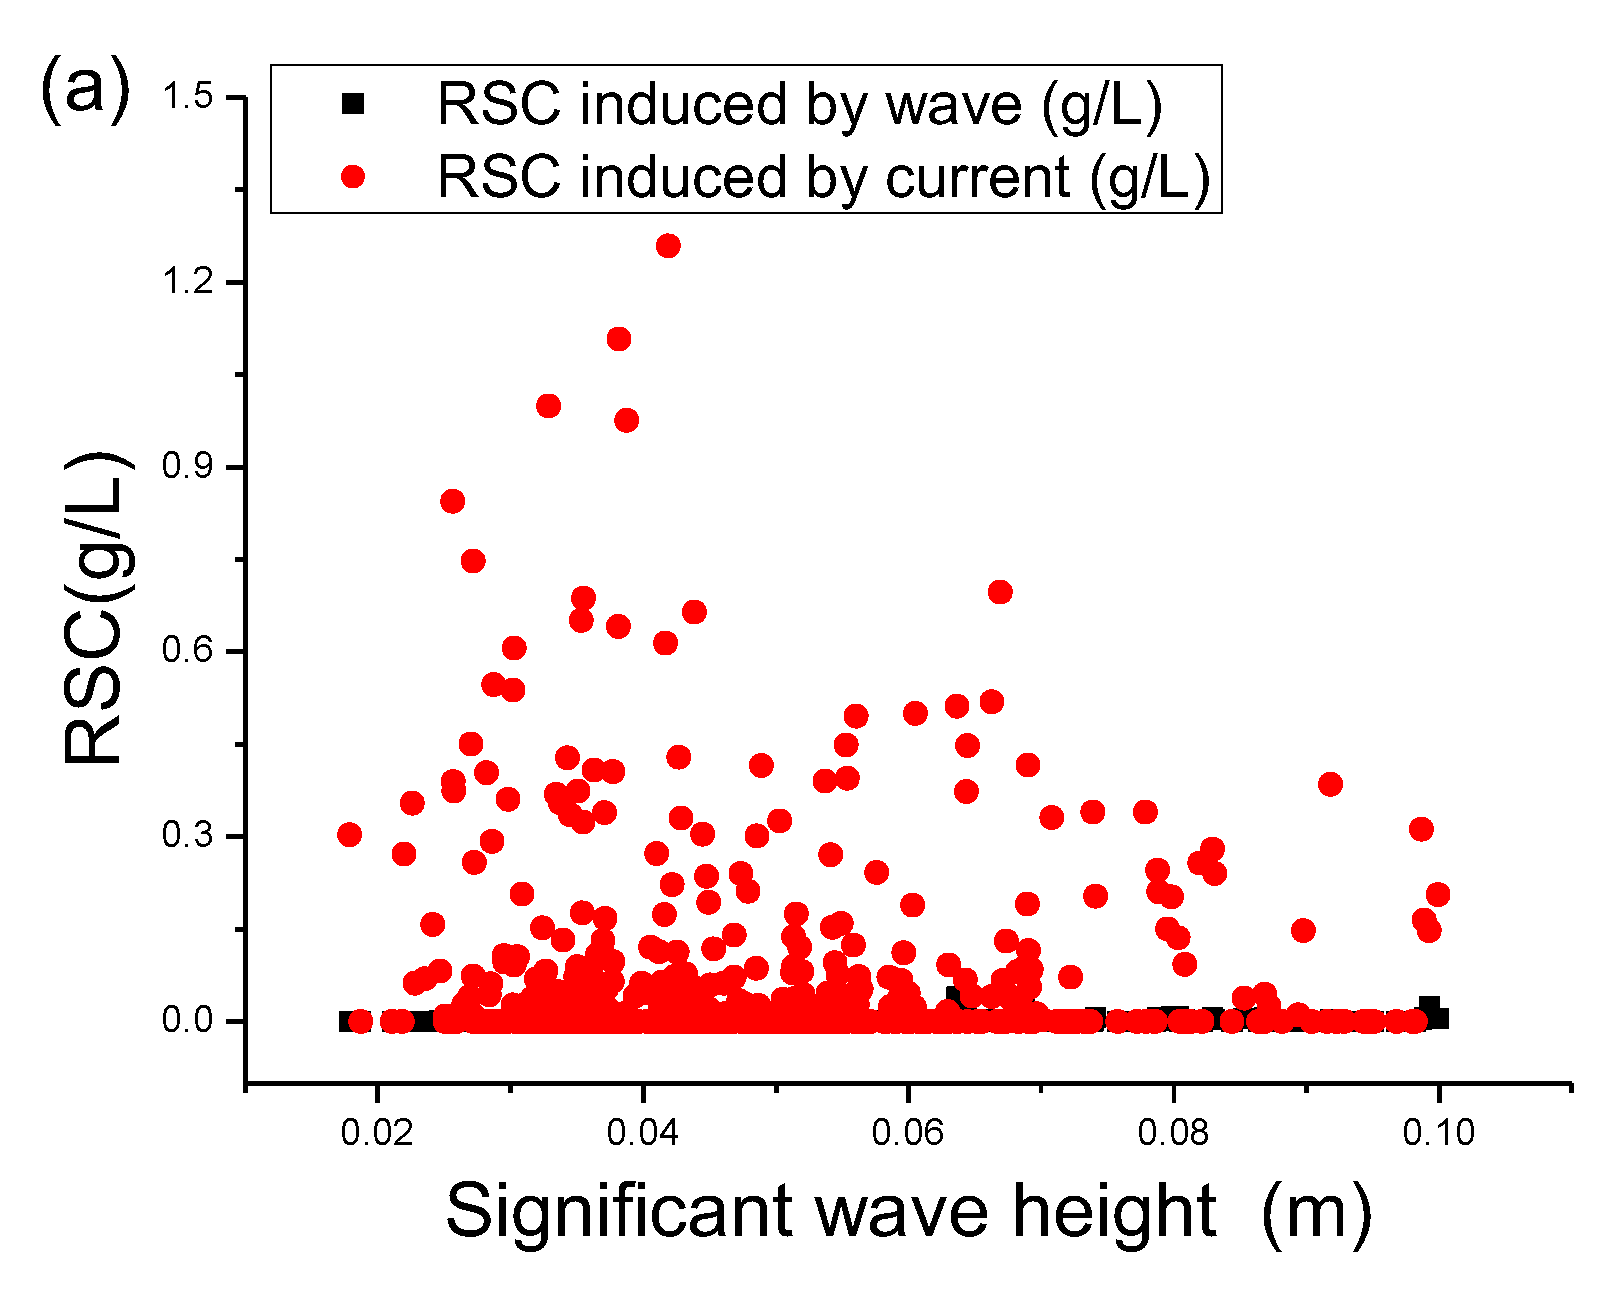
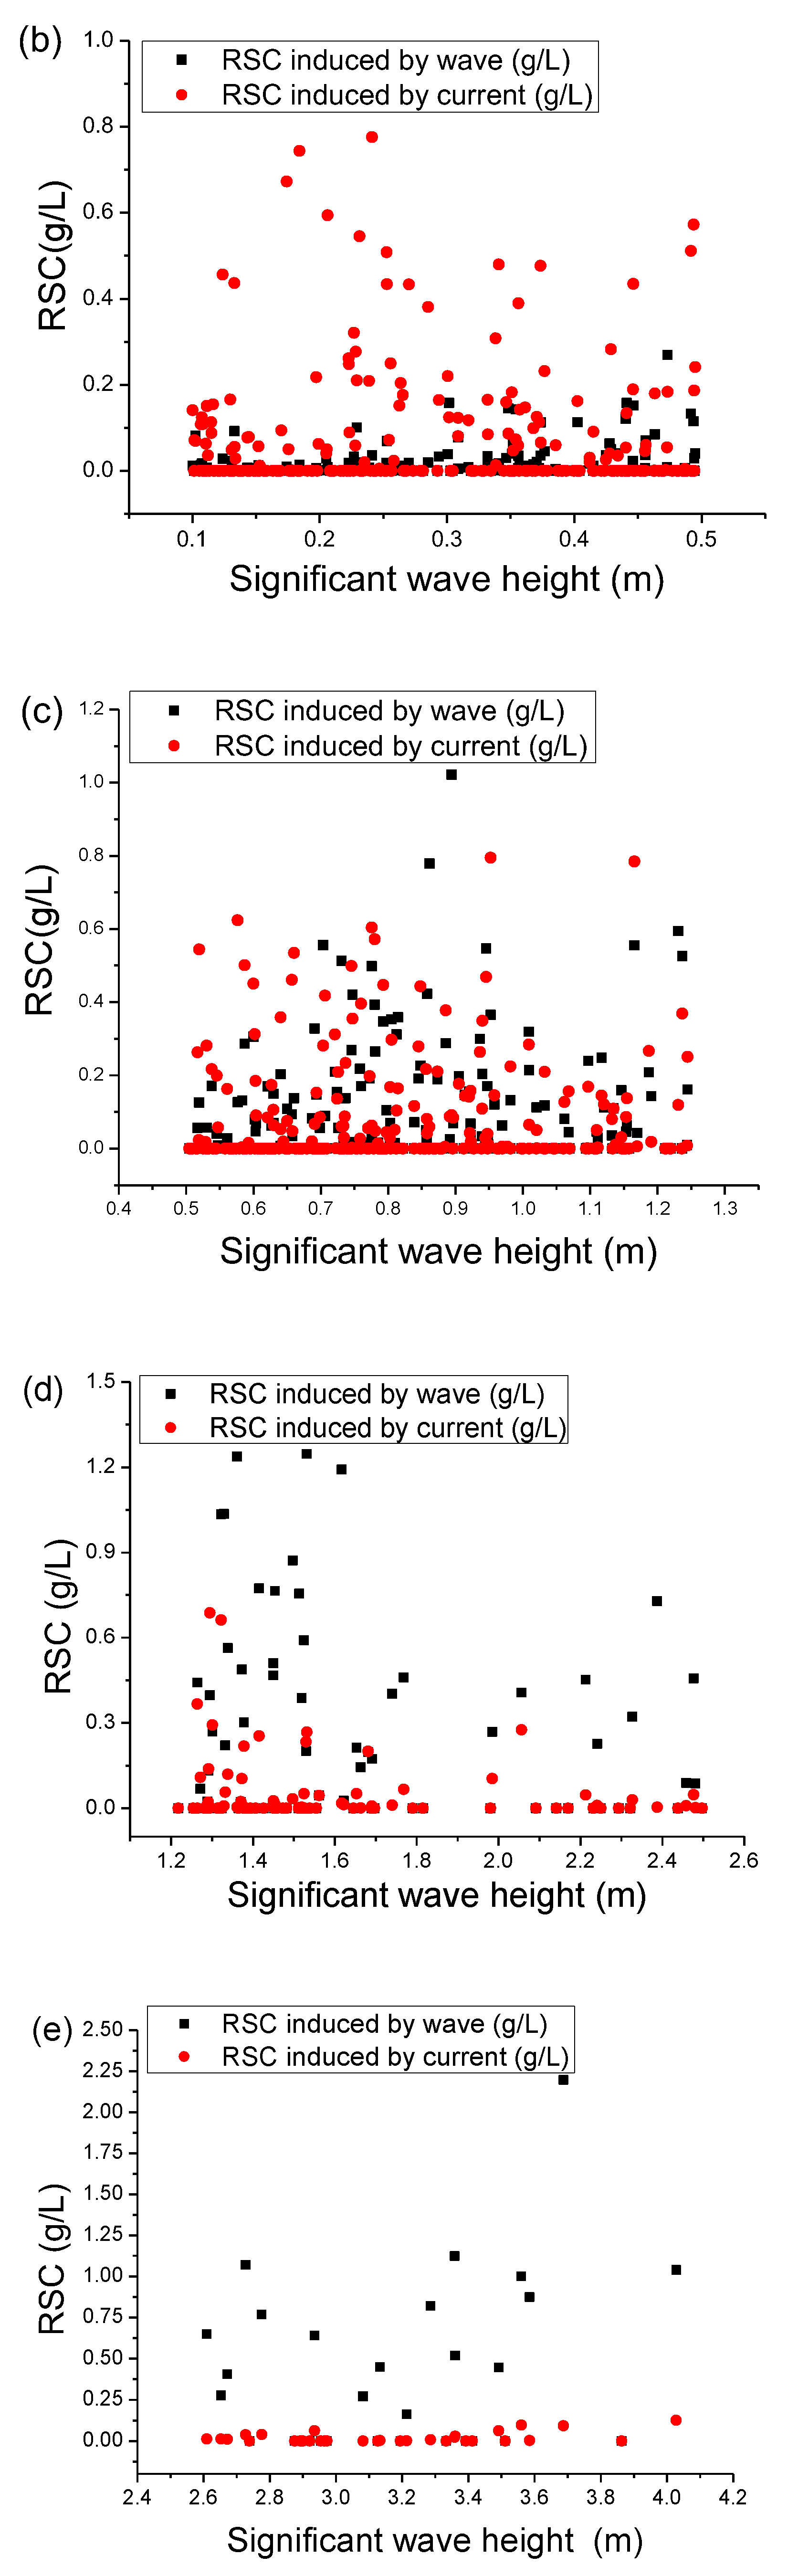
5.1. Contribution of Waves and Currents to Resuspension
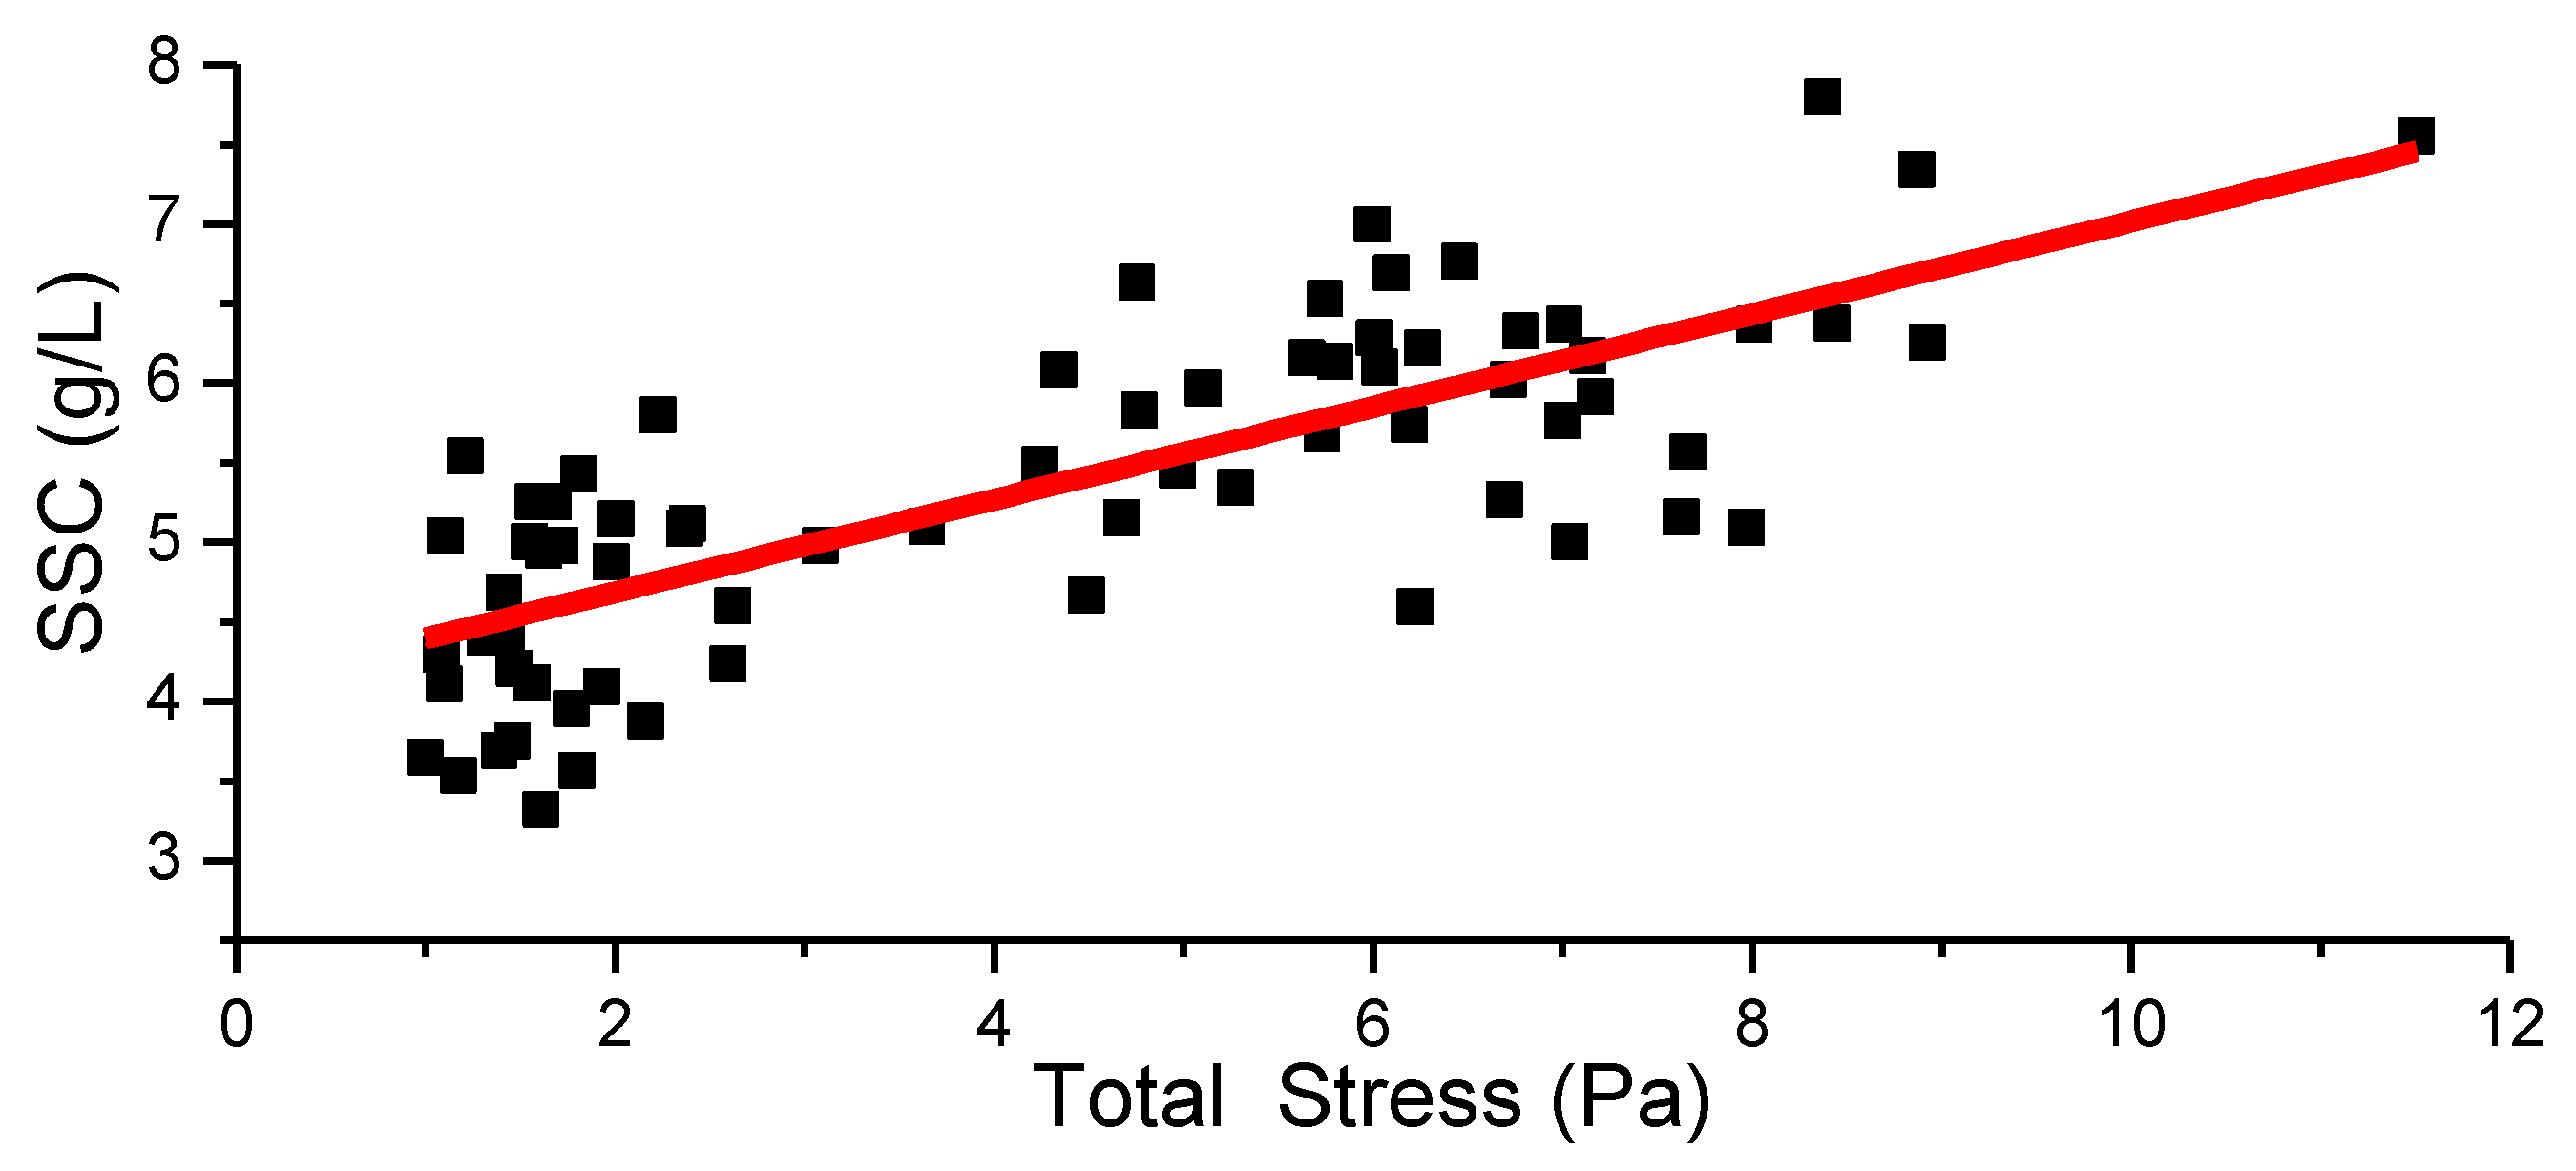
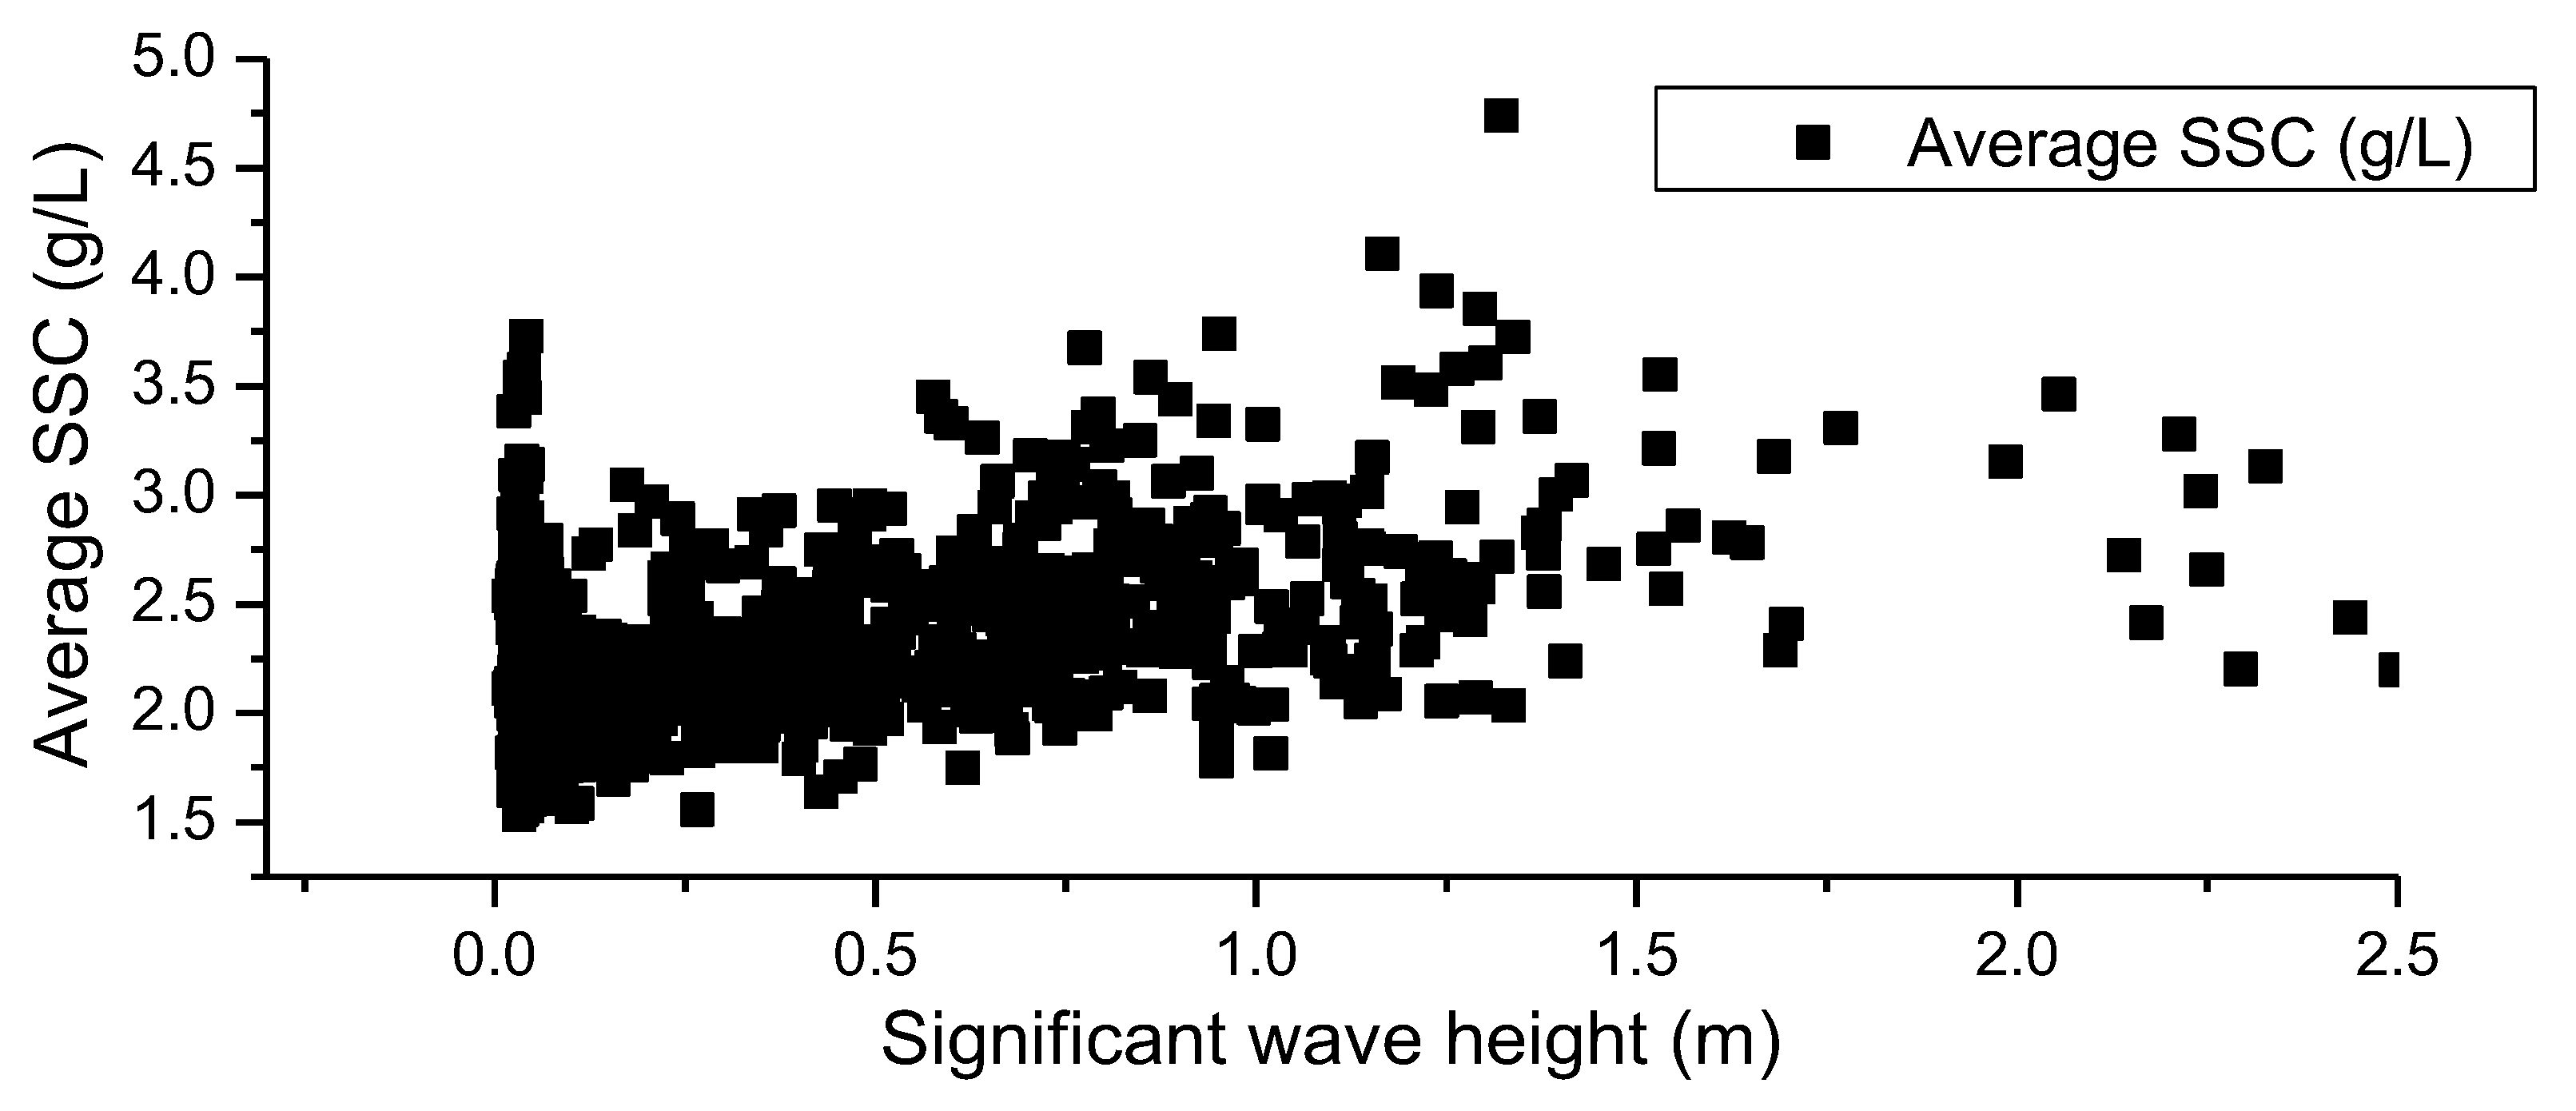
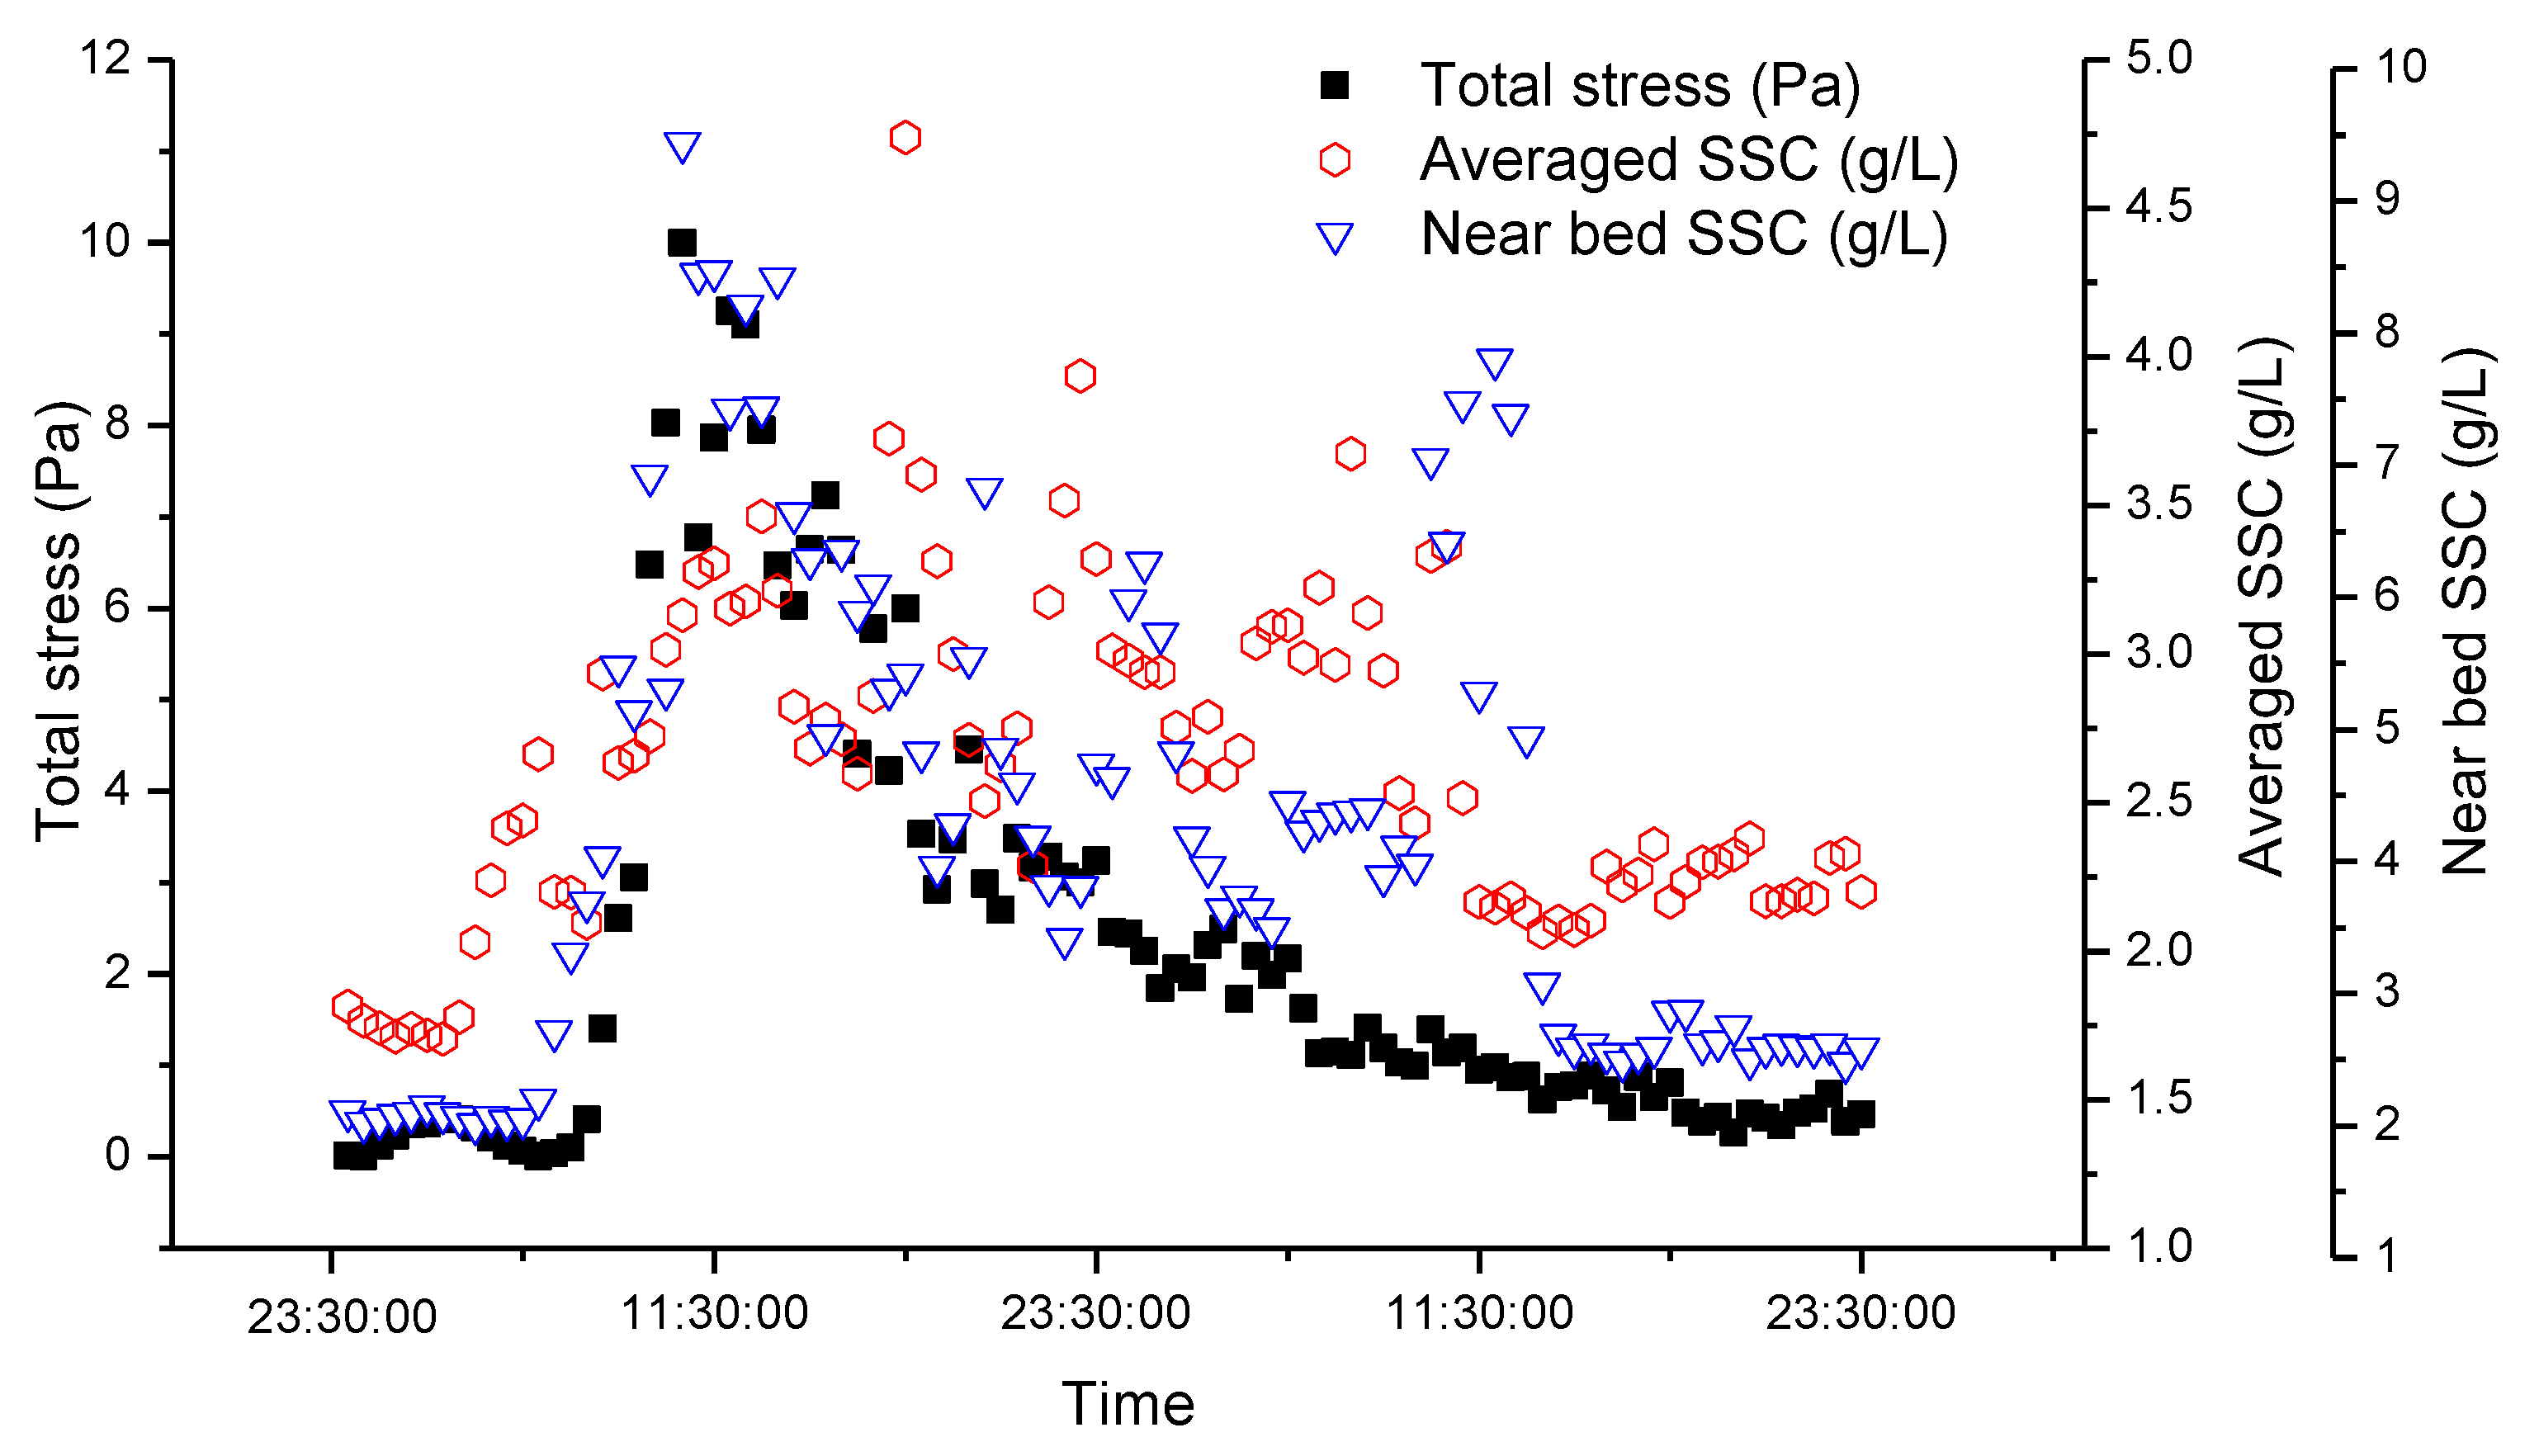
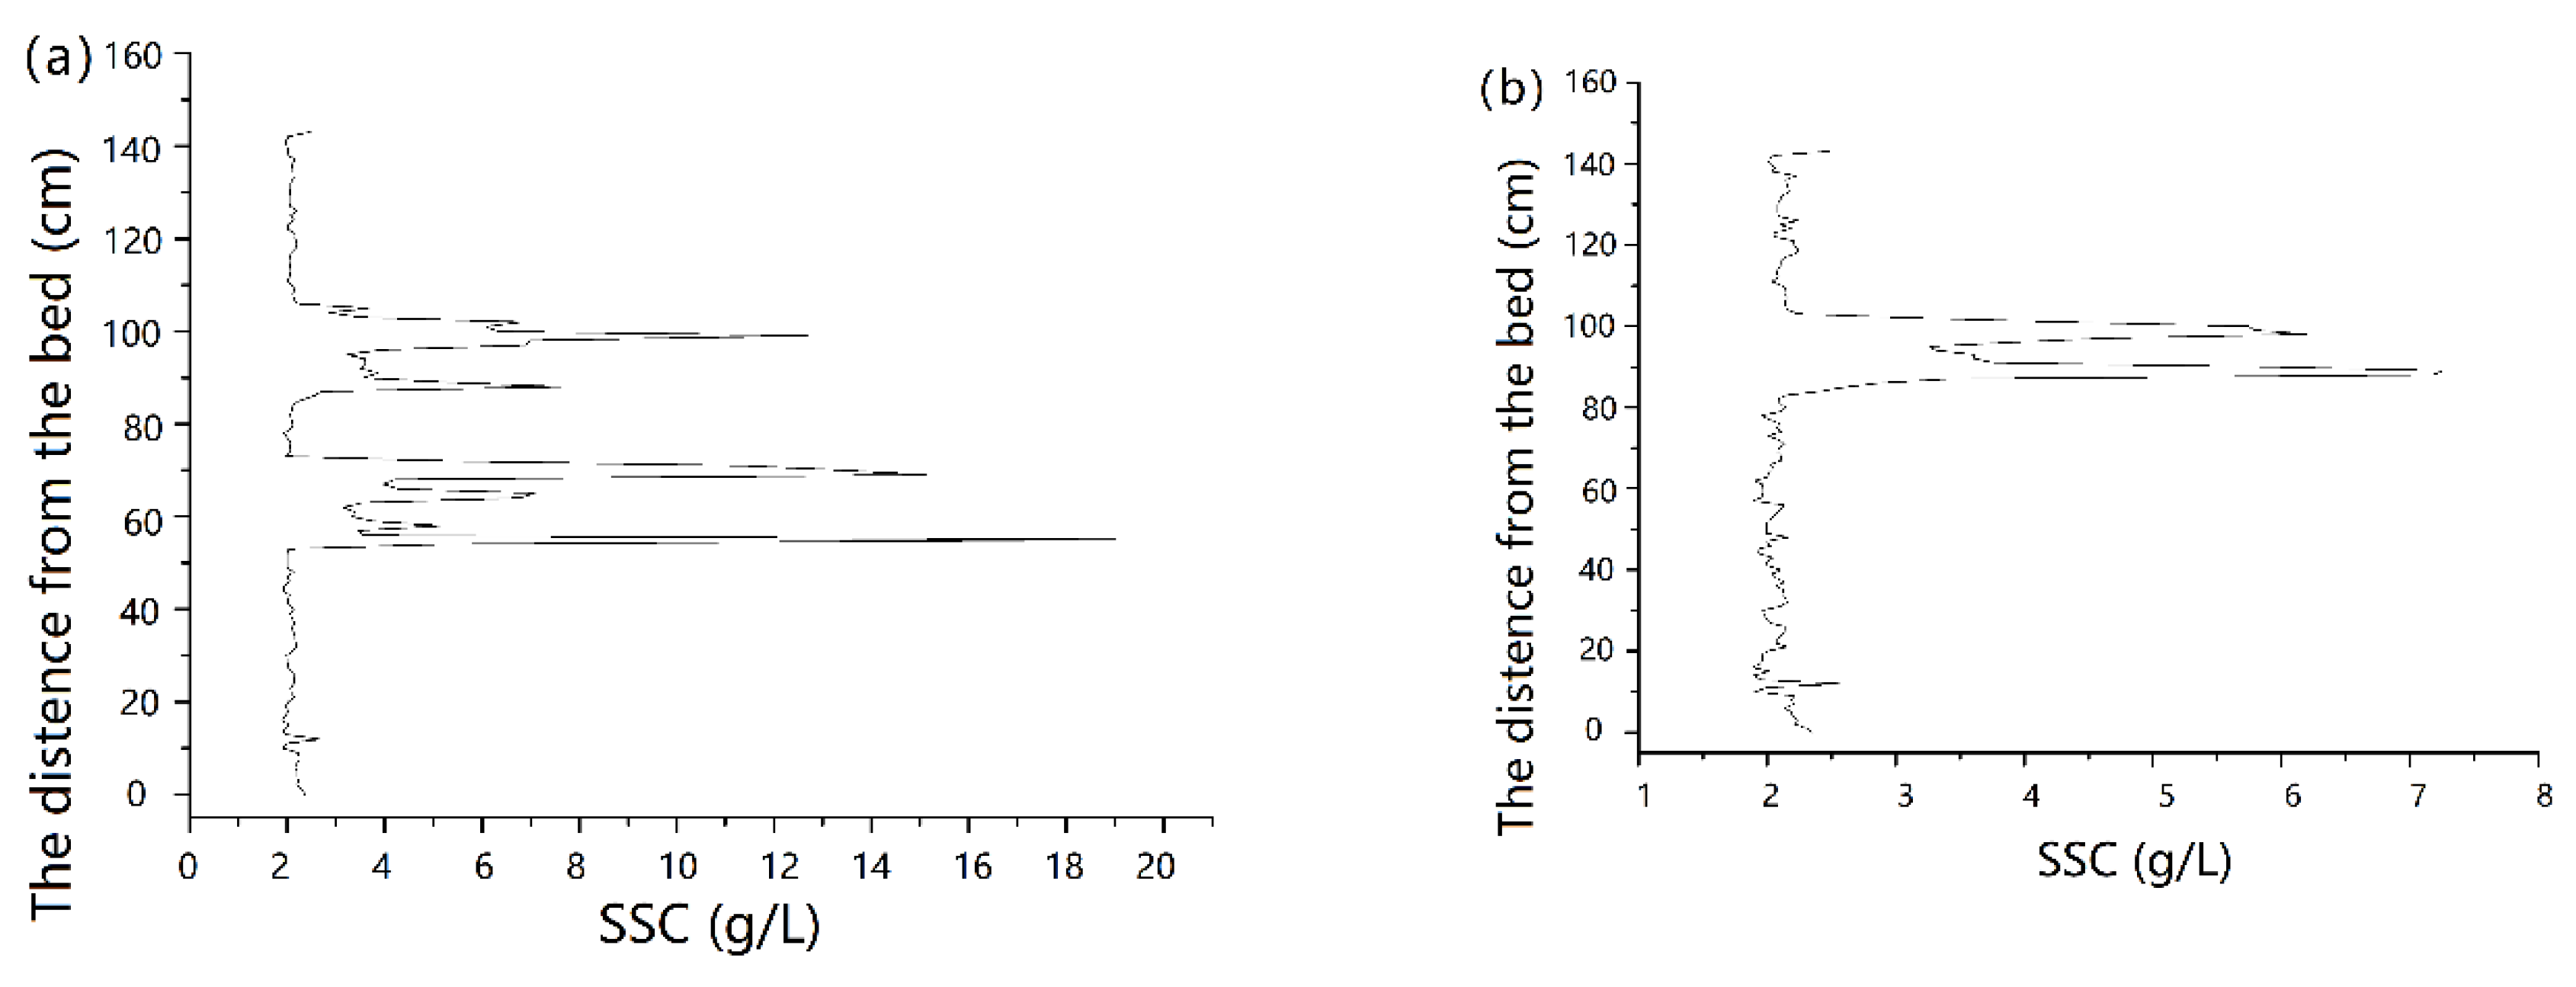
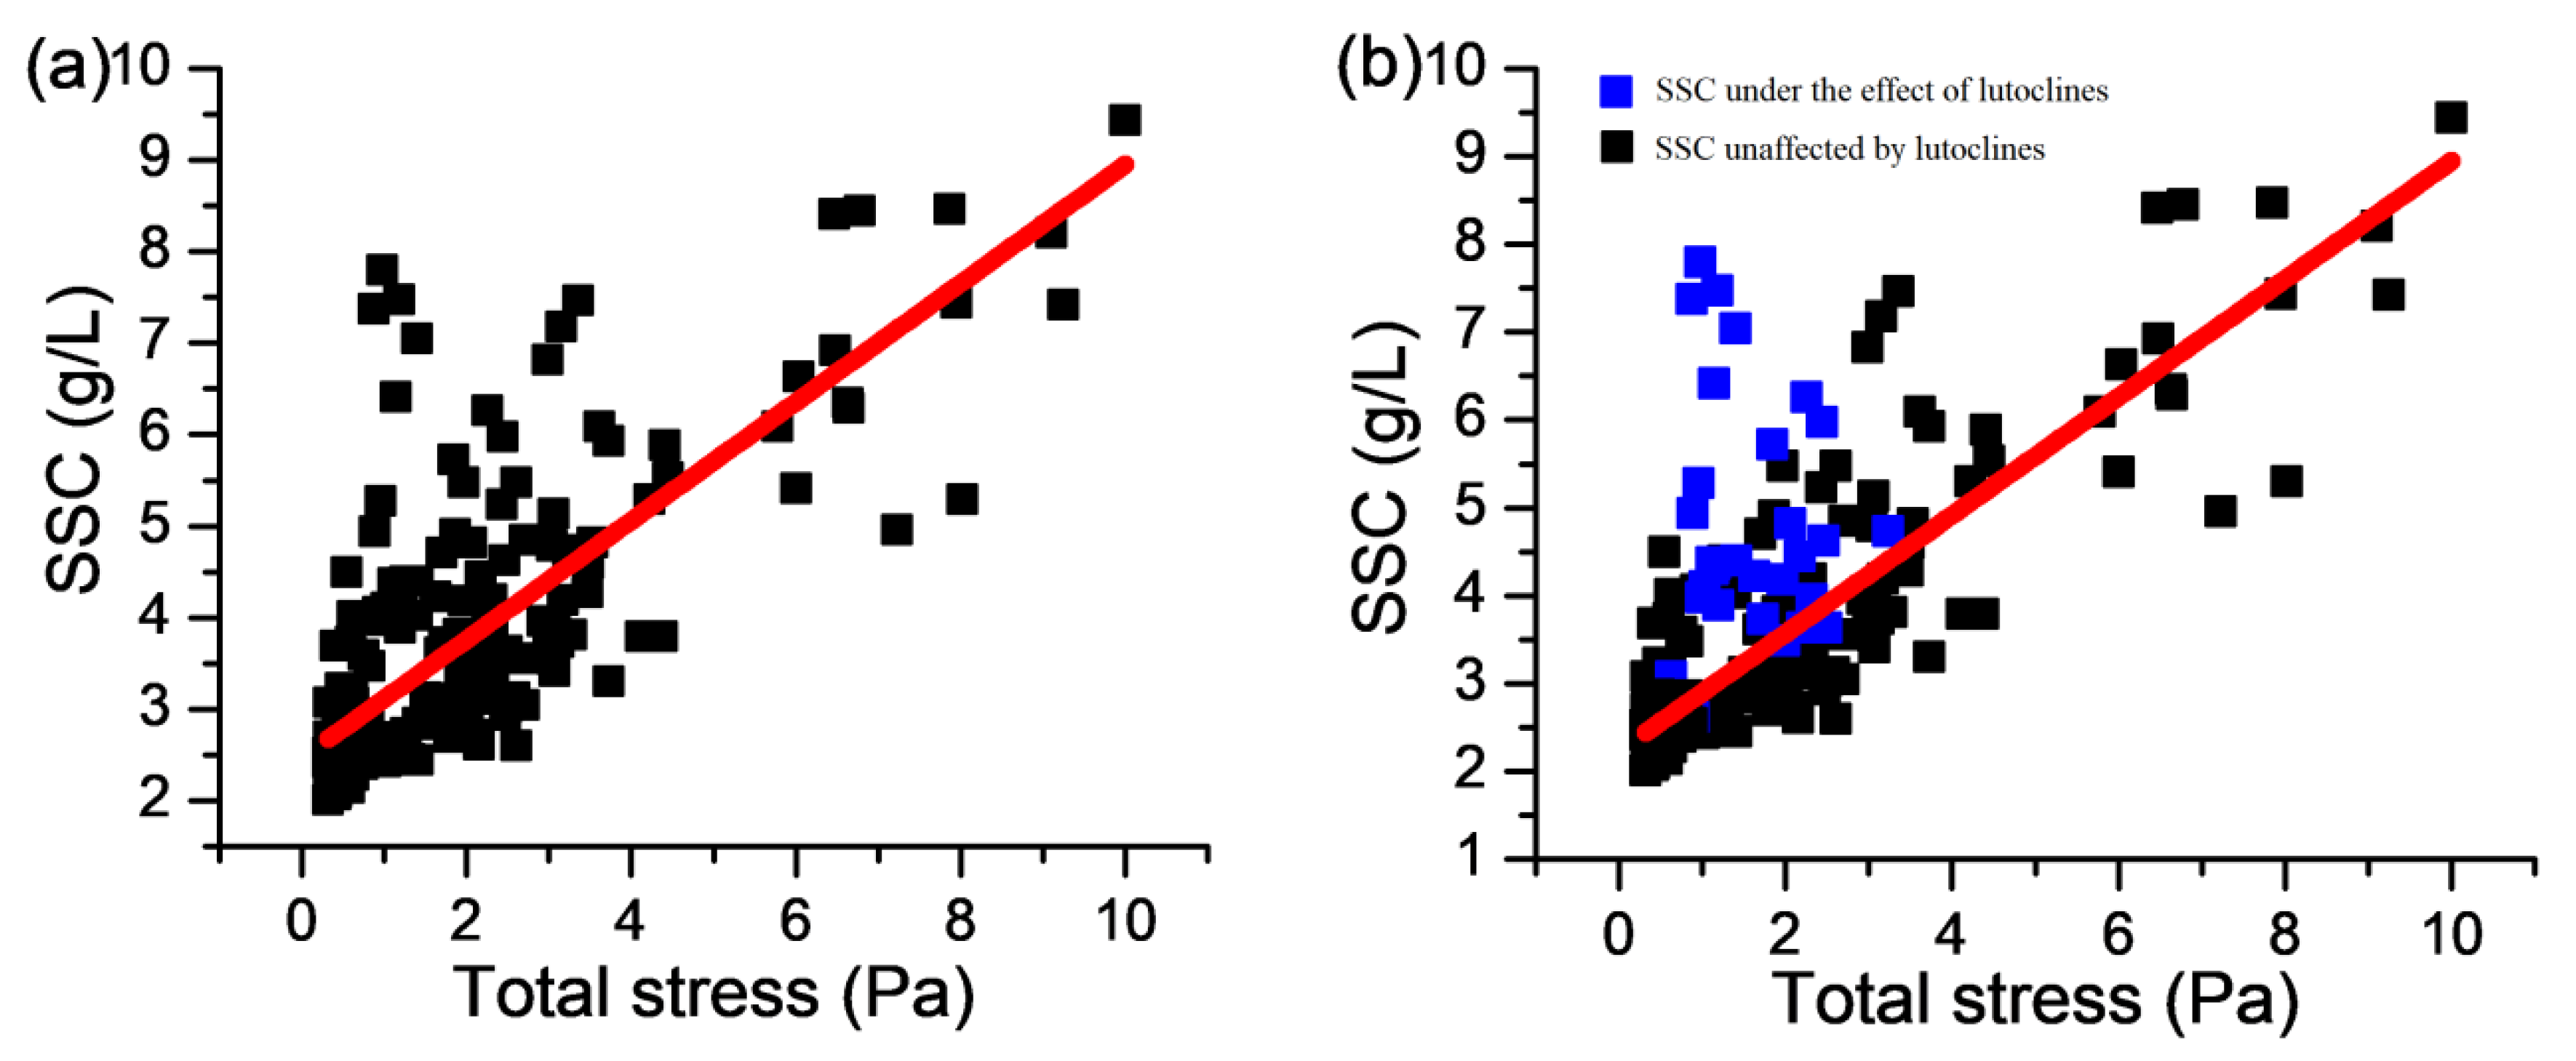
5.2. Relationship between SSC and Resuspension
6. Conclusions
Author Contributions
Funding
Acknowledgments
Conflicts of Interest
References
- Neto, J.B.; Smith, B.; McAllister, J. Heavy metal concentrations in surface sediments in a nearshore environment, Jurujuba Sound, Southeast Brazil. Environ. Pollut. 2000, 109, 1–9. [Google Scholar] [CrossRef]
- Yuan, C.-G.; Shi, J.-B.; He, B.; Liu, J.-F.; Liang, L.-N.; Jiang, G.-B. Speciation of heavy metals in marine sediments from the East China Sea by ICP-MS with sequential extraction. Environ. Int. 2004, 30, 769–783. [Google Scholar] [CrossRef] [PubMed]
- Chen, S.L.; Zhang, G.A.; Ying, S.L. Temporal and spatial changes of suspended sediment concentration and resuspension in the Yangtze River eatuary and its adjacent sea area. Acta Geogr. Sin. 2004, 59, 260–266. [Google Scholar]
- Kong, Y.Z.; Ding, P.X.; He, S.L.; He, C.; Xiao, W.J. Analysis of spatial and temporal variation characteristics of suspended sediment concentration in the Changjing River eatuary and adjacent sea area. Adv. Mar. Sci. 2006, 24, 446–454. [Google Scholar]
- Wan, X.N.; Li, J.F.; Shen, H.T. Distribution and diffusion of suspended sediment in the offshore area of Changjiang estuary, China. Geogr. Res. 2006, 25, 294–302. [Google Scholar]
- Zhang, W.; Xu, Z.; Dong, X.; Lin, N. Analysis on characteristics of temporal and spatial variation of suspended sediment in the Lingding Bay. J. Sediment Res. 2010, 4, 22–28. [Google Scholar]
- Zuo, S.H.; Li, J.F.; Wan, X.N.; Shen, H.; Fu, G. Characteristics of temporal and spatial variation of suspended sediment concentration and resuspension in the Changjiang River. J. Sediment Res. 2006, 3, 68–75. [Google Scholar]
- Ramaswamy, V.; Rao, P.S.; Rao, K.H.; Thwin, S.; Rao, N.S.; Raiker, V. Tidal influence on suspended sediment distribution and dispersal in the northern Andaman Sea and Gulf of Martaban. Mar. Geol. 2004, 208, 33–42. [Google Scholar] [CrossRef]
- Chen, J.; Dai, Z.; Chen, J.; Zhang, X.; Lu, H. Analysis on the net sediment transportation along arc-shaped coast in the northern bank, Hangzhou bay—A case study of Longquan-Nanzhu harbor segment. J. Sediment Res. 2009, 2, 53–59. [Google Scholar]
- Chen, B.; Gao, F.; Liu, J. Sediment transport mechanism in the Zhejiang inner continental shelf in summer. Acta Oceanol. Sin. 2017, 39, 96–105. [Google Scholar]
- Wu, D.A.; Zhang, R.S.; Yan, Y.X.; Li, R.J. Mechanism of suspended sediment transport in Dongdagang tidal channel of radial sand ridges. J. Hohai Univ. 2006, 34, 216–222. [Google Scholar]
- Li, G.X.; Wei, H.L.; Han, Y.S.; Chen, Y.J. Sedimentation in the Yellow River Delta, part I, flow and suspended sediment structure in the upper distributary and the estuary. Mar. Geol. 1998, 149, 93–111. [Google Scholar] [CrossRef]
- Li, G.X.; Wei, H.L.; Yue, S.H.; Cheng, Y.J.; Han, Y.S. Sedimentation in the Yellow River Delta, part II, suspended sediment dispersal and deposition on the subaqueous delta. Mar. Geol. 1998, 149, 113–131. [Google Scholar] [CrossRef]
- Wright, L.D.; Wiseman, W.J.; Yang, Z.S.; Bornhold, B.D.; Kaller, G.H.; Prior, D.B.; Suhayda, J.N. Processes of marine dispersal and deposition of suspended silts off the modern mouth of the Huanghe (Yellow River). Cont. Shelf Res. 1990, 1, 1–40. [Google Scholar] [CrossRef]
- Pang, C.G.; Xiu, H.D.; Zhao, E.B. Characteristics and regression equations for vertical distribution of suspended sediment concentration in the Yellow Sea and East China Sea. J. Sediment Res. 2009, 5, 69–75. [Google Scholar]
- Zhou, L.; Chen, B.; Liu, J.; Hu, G.; Liang, Y. Observation of currents and suspended sediment concentration off northern Jingsu coast China. Mar. Geol. Quat. Geol. 2009, 29, 17–24. [Google Scholar] [CrossRef]
- Zhang, Y.S.; Zhang, F.J.; Guo, X.W.; Zhang, M.P. Vertical flux of the settling particulate matter in the water column of the Yellow Sea in summer. Oceanol. Limnol. Sin. 2004, 35, 230–238. [Google Scholar]
- Zhang, Y.S.; Zhang, F.J.; Guo, X.W.; Zhang, M.P. Autumn vertical flux of settling particulate matter at three typical stations in the Yellow Sea. Geochimica 2005, 34, 123–128. [Google Scholar]
- Lavelle, J.W.; Mofjeld, H.O.; Baker, E.T. An in situ erosion rate for a fine-grained marine sediment. J. Geophys. Res. 1984, 89, 6543–6552. [Google Scholar] [CrossRef]
- Roman, M.R.; Tenorc, K.R. Tidal resuspension in Buzzards Bay, Massachusetts.I.Seasonal changes in theresuspension of organic carbon and chlorphyll. Estuar. Coast. Shelf Sci. 1978, 6, 37–46. [Google Scholar] [CrossRef]
- Houwing, E.J. Determination of the critical erosion threshold of cohesive sediment on intertidal mudflat along the Dutch Wadden Sea coast. Estuar. Coast. Shelf Sci. 1999, 4, 545–555. [Google Scholar] [CrossRef]
- Jago, C.F.; Jones, S.E. Observation and modelling of the dynamics of benthic fluff resuspended from a sandy bed in the southern North Sea. Cont. Shelf Res. 1998, 11, 1255–1282. [Google Scholar] [CrossRef]
- Thompson CE, L.; Couceiro, F.; Fones, G.R.; Helsby, R.; Amos, C.L.; Black, K.; Parker, E.R.; Greenwood, N.; Statham, P.J.; Kelly-Gerreyn, B.A. In situ flume measurements of resuspension in the North Sea. Estuar. Coast. Shelf Sci. 2011, 94, 77–88. [Google Scholar] [CrossRef]
- Wright, L.D.; Boon, J.D.; Xu, J.P.; Kim, S.C. The bottom boundary layer of the Bay Stem Plains environment of lower Chesapeake Bay. Estuar. Coast. Shelf Sci. 1992, 35, 17–36. [Google Scholar] [CrossRef]
- Wright, L.D.; Sherwood, C.R.; Sternberg, R.W. Field measurements of fair weather bottom boundary layer processes and sediment suspension on the Louisiana inner continental shelf. Mar. Geol. 1997, 140, 329–345. [Google Scholar] [CrossRef]
- You, Z. Fine sediment resuspension dynamics in a large semi-enclosed bay. Ocean Eng. 2005, 32, 1982–1993. [Google Scholar] [CrossRef]
- Green, M.O. Very small waves and associated sediment resuspension on an estuarine intertidal flat. Estuarine Coast. Shelf Sci. 2011, 93, 449–459. [Google Scholar] [CrossRef]
- Ferré, B.; De Madron, X.D.; Estournel, C.; Ulses, C.; Le Corre, G. Impact of natural (waves and currents) and anthropogenic (trawl) resuspension on the export of particulate matter to the open ocean, application to the Gulf of Lion (NW Mediterranean). Cont. Shelf Res. 2008, 28, 2071–2091. [Google Scholar] [CrossRef]
- Chen, S.L.; Gu, G.C.; Zhang, G.A. Setting velocity of suspended sediment in the Nanhui nearshore waters of Changjiang Esturary. J. Sediment Res. 2003, 6, 45–51. [Google Scholar]
- Kineke, G.C.; Sternberg, R.W. Measurements of high concentration suspended sediments using the optical backscatterance sensor. Mar. Geol. 1992, 108, 253–258. [Google Scholar] [CrossRef]
- Rose, C.P.; Thorne, P.D. Measurements of suspended sediment transport parameters in a tidal estuary. Cont. Shelf Res. 2001, 21, 1551–1575. [Google Scholar] [CrossRef]
- Shi, Z.; Ling, H.L. Vertical profiles of fine suspension concentration in the Changjiang Esturary. J. Sediment Res. 1999, 2, 59–64. [Google Scholar]
- Shi, N.C.; Larsen, L.H.; Downing, J.P. Predicting suspended sediment concentration on continental shelves. Mar. Geol. 1985, 62, 255–275. [Google Scholar] [CrossRef]
- Sternberg, R.W.; Berhane, I.; Ogston, A.S. Measurement of size and settling velocity of suspended aggregates on the northern California continental shelf. Mar. Geol. 1999, 154, 43–53. [Google Scholar] [CrossRef]
- Mehta, A.J. Laboratory Studies on Cohesive Sediment Deposition and Erosion. In Physical Processes in Estuaries; Springer: Berlin/Heidelberg, Germany, 1988; pp. 427–445. [Google Scholar]
- Liu, F. Sediment Transport and Dynamic Geomorphology Process in the Yellow River Estuary and Its Adjacent Sea. Ph.D. Thesis, East China Normal University, Shanghai, China, 2012; p. 117. [Google Scholar]
- Wright, L.D.; Wiseman, W.J.; Bornhold, B.D. Processes of marine dispersal anf deposal and deposition of Yellow River silts by gravity-driven underflows. Nature 1988, 14, 629–632. [Google Scholar] [CrossRef]
- Prior, D.B.; Suhayda, J.N.; Lu, N.Z.; Bornhold, B.D.; Keller, W.J.; Wright, L.D.; Yang, Z.S. Storm Wave Reactivation of a Submarine Landslide. Nature 1989, 341, 47–50. [Google Scholar] [CrossRef]
- Liang, B.; Liu XL, H.; Wu, Y.; Lee, D. Wave Climate Hindcasts for the Bohai Sea, Yellow Sea, and East China Sea. J. Coast. Res. 2016, 32, 172–180. [Google Scholar]
- Ren, M.; Shi, Y. Sediment discharge of the Yellow River (China) and its effect on the sedimentation of the Bohai and the Yellow Sea. Cont. Shelf Res. 1986, 6, 785–810. [Google Scholar] [CrossRef]
- Wang, Y.; Aubrey, D.G. The characteristics of the China coastline. Cont. Shelf Res. 1987, 7, 249–329. [Google Scholar] [CrossRef]
- Liu, J.P.; Milliman, J.D.; Gao, S.; Cheng, P. Holocene development of the Yellow River subaqueous delta, North Yellow Sea. Mar. Geol. 2004, 209, 45–67. [Google Scholar] [CrossRef]
- Yang, Z.S.; Liu, J.P. A unique Yellow River-derived distal subaqueous delta in the Yellow Sea. Mar. Geol. 2007, 240, 169–176. [Google Scholar] [CrossRef]
- Wang, H.; Wang, A.; Bi, N.; Zeng, X.; Xiao, H. Seasonal distribution of suspended sediment in the Bohai Sea, China. Cont. Shelf Res. 2014, 90, 17–32. [Google Scholar] [CrossRef]
- Bi, N.S.; Yang, Z.S.; Wang, H.J.; Fan, D.J.; Sun, X.X.; Lei, K. Seasonal variation of suspended-sediment transport through the southern Bohai Strait. Estuar. Coast. Shelf Sci. 2011, 93, 239–247. [Google Scholar] [CrossRef]
- Liu, X.; Jia, Y.; Zheng, J.; Shan, H.; Li, H. Field and laboratory resistivity monitoring of sediment consolidation in China’s Yellow River estuary. Eng. Geol. 2013, 164, 77–85. [Google Scholar] [CrossRef]
- Yang, X.J. Study on the Consolidation Process of the Sediment in Yellow River, China. Ph.D. Thesis, Ocean University of China, Qingdao, China, 2009; p. 33. [Google Scholar]
- Huang, H.J.; Li, F.; Pang, J.Z.; Le, K.T.; Li, S.G. The Interaction between the Yellow River Delta and the Bohai and the Yellow Sea; Science Press: Beijing, China, 2005; p. 20. [Google Scholar]
- Ding, D.; Ren, Y.C.; Li, S.Q.; Zhou, Y.Q. Study on Storm Deposits in the Yellow Delta and Adjacent Area. Mar. Geol. Quat. Geol. 1995, 15, 25–34. [Google Scholar]
- Zhao, D. The Study of the Erosion of Diaokou Couse Coast in Yellow River Delta. Master’s Thesis, Ocean University of China, Qingdao, China, 2004; p. 17. [Google Scholar]
- Zong, H. Wind Wave Induced Sediment Resuspension in the Yellow River Mouth. Ph.D. Thesis, Ocean University of China, Qingdao, China, 2009; p. 70. [Google Scholar]
- Lund-Hansen, L.C.; Valeur, J.; Pejrup, M.; Jensen, A. Sediment fluxes, re-suspension and accumulation rates at two wind-exposed coastal sites and in a sheltered bay. Estuar. Coast. Shelf Sci. 1997, 44, 521–531. [Google Scholar] [CrossRef]
- Sanchez, A.; Wu, W.; Beck, T.M.B. A depth-averaged 2-D model of flow and sediment transport in coastal waters. Ocean Dyn. 2016, 66, 1475–1495. [Google Scholar] [CrossRef]
- Grant, W.D. Combined Wave and Current Interaction with a Rough Bottom. J. Geophys. Res. 1979, 84, 1797–1808. [Google Scholar] [CrossRef]
- Grabowski, R.C.; Droppo, I.G.; Wharton, G. Estimation of critical shear stress from cohesive strength meter-derived erosion thresholds. Limnol. Oceanogr. Methods 2010, 8, 678–685. [Google Scholar]
- He, S.L.; Sun, J.M. Characteristics of suspended sediment transport in the turbidity maximum of the Changjing River Estuary. Oceanol. Limnol. Sin. 1996, 27, 60–66. [Google Scholar]
- Jay, D.A.; Geyer, W.R.; Uncles, R.J. A review of recent development in estuarine scalar flux estimation. Estuaries 1997, 2, 262–280. [Google Scholar] [CrossRef]
- Lian, J.J.; Zhao, Z.D. Cohesive sediment entrainment from soft muddy bed by waves. J. Hydraul. Eng. 1998, 8, 48–52. [Google Scholar]
- Liu, X.; Jia, Y.; Zheng, J.; Yang, Z.; Shan, H. Application of a new cone penetration test system in beach and shallow-sea engineering geological investigation. In Proceedings of the National Engineering Geology Conference, Taiyuan, China, 18–21 October 2014; pp. 439–444. [Google Scholar]
- Jia, Y.; Dan, H.; Yang, X. Sediment Dynamics and Geologic Hazards in the Estuary of Yellow River, China; Science Press: Beijing, China, 2011; p. 127. [Google Scholar]
- Shan, H.X.; Chen, Y.; Liu, Z.Y.; Jia, Y.G.; Liu, H.J.; Guo, X.J. Determination of Slity Soil Bearing Capacity on Modern Yellow River Delta in China. Chin. J. Rock Mech. Eng. 2006, S2, 4089–4096. [Google Scholar]
- Ross, M.A. Vertical Structure of Estuarine Fine Sediment Suspension. Ph.D. Thesis, Unlverslty of Florlda, Gainesville, FL, USA, 1988. [Google Scholar]


| Physical Properties | Mechanical Properties | ||||
|---|---|---|---|---|---|
| Water content (%) | 23.7 | Void ratio | 0.66 | Cohesive forces (kPa) | 18.99 |
| Wet density (g/cm3) | 2.01 | Liquidity index | 0.6 | Internal angle of shearing resistance (°) | 24.34 |
| Degree of saturation (%) | 96.3 | Plasticity index | 7.23 | Coefficient of volume compressibility (MPa−1) | 0.14 |
| Depth (m) | 0–0.2 | 0.2–0.6 | 0.6–0.8 | 0.8–1.6 | 1.8–2.4 |
|---|---|---|---|---|---|
| Bearing capacity (KPa) | 130 | 210 | 170 | 290 | 220 |
© 2020 by the authors. Licensee MDPI, Basel, Switzerland. This article is an open access article distributed under the terms and conditions of the Creative Commons Attribution (CC BY) license (http://creativecommons.org/licenses/by/4.0/).
Share and Cite
Li, B.; Jia, Y.; Liu, J.P.; Liu, X.; Wang, Z. Effect of Wave, Current, and Lutocline on Sediment Resuspension in Yellow River Delta-Front. Water 2020, 12, 845. https://doi.org/10.3390/w12030845
Li B, Jia Y, Liu JP, Liu X, Wang Z. Effect of Wave, Current, and Lutocline on Sediment Resuspension in Yellow River Delta-Front. Water. 2020; 12(3):845. https://doi.org/10.3390/w12030845
Chicago/Turabian StyleLi, Bowen, Yonggang Jia, J. Paul Liu, Xiaolei Liu, and Zhenhao Wang. 2020. "Effect of Wave, Current, and Lutocline on Sediment Resuspension in Yellow River Delta-Front" Water 12, no. 3: 845. https://doi.org/10.3390/w12030845
APA StyleLi, B., Jia, Y., Liu, J. P., Liu, X., & Wang, Z. (2020). Effect of Wave, Current, and Lutocline on Sediment Resuspension in Yellow River Delta-Front. Water, 12(3), 845. https://doi.org/10.3390/w12030845