Article

Assessing the Benefits of Forested Riparian Zones: A Qualitative Index of Riparian Integrity Is Positively Associated with Ecological Status in European Streams

by
Francis J. Burdon
1,*,
Ellinor Ramberg
1,
Jasmina Sargac
1,
Marie Anne Eurie Forio
2,
Nancy de Saeyer
2,
Petra Thea Mutinova
3,4,
Therese Fosholt Moe
3,
Mihaela Oprina Pavelescu
5,
Valentin Dinu
5,
Constantin Cazacu
5,
Felix Witing
6,
Benjamin Kupilas
3,7,
Ulf Grandin
1,
Martin Volk
6,
Geta Rîşnoveanu
5,8,
Peter Goethals
2,
Nikolai Friberg
3,9,10,
Richard K. Johnson
1 and
Brendan G. McKie
1
1
Department of Aquatic Sciences and Assessment, Swedish University of Agricultural Sciences, 75007 Uppsala, Sweden
2
Aquatic Ecology Research Unit, Department of Animal Sciences and Aquatic Ecology, Ghent University, 9000 Ghent, Belgium
3
Norwegian Institute for Water Research (NIVA), 0349 Oslo, Norway
4
Institute for Biological Sciences, University of Rostock, 18059 Rostock, Germany
5
Department of Systems Ecology and Sustainability, University of Bucharest, 050095 Bucharest, Romania
6
Department of Computational Landscape Ecology, Helmholtz Centre for Environmental Research-UFZ, 04318 Leipzig, Germany
7
Institute of Landscape Ecology, University of Münster, 48149 Münster, Germany
8
Research Institute of the University of Bucharest, 050663 Bucharest, Romania
9
Freshwater Biological Section, Department of Biology, University of Copenhagen, 2100 Copenhagen, Denmark
10
water@leeds and School of Geography, University of Leeds, Leeds LS2 9JT, UK
*
Author to whom correspondence should be addressed.
Water 2020, 12(4), 1178; https://doi.org/10.3390/w12041178
Submission received: 9 March 2020 / Revised: 13 April 2020 / Accepted: 15 April 2020 / Published: 20 April 2020
(This article belongs to the Special Issue Ecosystem Functioning in Rivers and Riparian Zones)

Abstract

:
Developing a general, predictive understanding of ecological systems requires knowing how much structural and functional relationships can cross scales and contexts. Here, we introduce the CROSSLINK project that investigates the role of forested riparian buffers in modified European landscapes by measuring a wide range of ecosystem attributes in stream-riparian networks. CROSSLINK involves replicated field measurements in four case-study basins with varying levels of human development: Norway (Oslo Fjord), Sweden (Lake Mälaren), Belgium (Zwalm River), and Romania (Argeş River). Nested within these case-study basins include multiple, independent stream-site pairs with a forested riparian buffer and unbuffered section located upstream, as well as headwater and downstream sites to show cumulative land-use impacts. CROSSLINK applies existing and bespoke methods to describe habitat conditions, biodiversity, and ecosystem functioning in aquatic and terrestrial habitats. Here, we summarize the approaches used, detail protocols in supplementary materials, and explain how data is applied in an optimization framework to better manage tradeoffs in multifunctional landscapes. We then present results demonstrating the range of riparian conditions present in our case-study basins and how these environmental states influence stream ecological integrity with the commonly used macroinvertebrate Average Score Per Taxon (ASPT) index. We demonstrate that a qualitative index of riparian integrity can be positively associated with stream ecological status. This introduction to the CROSSLINK project shows the potential for our replicated study with its panoply of ecosystem attributes to help guide management decisions regarding the use of forested riparian buffers in human-impacted landscapes. This knowledge is highly relevant in a time of rapid environmental change where freshwater biodiversity is increasingly under pressure from a range of human impacts that include habitat loss, pollution, and climate change.

1. Introduction

Riparian zones are the interface between aquatic and terrestrial ecosystems that connect and help regulate ecological functions in both habitats [1,2]. They are three-dimensional zones encompassing hydrogeomorphic, vegetational, and food-web attributes which vary in space and time [1,3,4]. The importance of riparian zones far exceed their proportion of land cover because of their prominent location at the boundary between aquatic and terrestrial ecosystems [1,5]. For example, riparian zones are important habitats for maintaining biodiversity and provide multiple ecosystem services that include water purification, carbon storage, and recreational opportunities [6,7]. In particular, stream and terrestrial ecosystems can be highly connected by exchanges of organic matter and prey [3,8]. These ecosystem linkages include inputs of terrestrial detritus and prey that help sustain aquatic food webs [9,10], and the emergence of adult aquatic insects form an important source of prey for a wide range of riparian consumers that include spiders, birds, lizards, and bats [11,12]. However, human pressures from activities such as deforestation, agriculture, and urbanization frequently degrade stream-riparian networks [13], with potential consequences for cross-habitat linkages and ecosystem services through impacts on aquatic and terrestrial assemblages [7,11,14].
The impacts of human land uses on stream-riparian networks typify the “Anthropocene”—the current epoch of immense environmental upheaval caused by human activities [15,16]. These impacts disproportionately threaten freshwater biodiversity globally [17,18], and with land-use intensification set to continue there is a strong need for improved riparian management [19,20]. Thus, protecting and enhancing riparian zones are often seen as the first steps towards rehabilitating degraded waterbodies by buffering them from the impacts of adjacent human land uses. The conservation, rehabilitation, and restoration of riparian zones fits within the concept of nature-based solutions: “living solutions inspired and supported by nature that simultaneously provide environmental, social and economic benefits and help build resilience” ([21]; see also Table 1) and potentially mitigate adverse effects in catchments where human land uses have strong impacts [22]. In highly fragmented landscapes, riparian buffers (Table 1) can preserve natural habitat features, thus helping to ensure genetic and ecological connectivity amongst populations and communities [7,23,24,25]. Further, riparian buffers are often used to filter nutrients and fine inorganic sediment from adjacent land uses, and depending on the canopy-cover proffered, help shade stream reaches to reduce water temperatures and proliferations of aquatic vegetation [26,27,28].
However, the effectiveness of riparian buffers can depend on a variety of factors. For instance, buffers may be placed randomly on a stream network without integrated catchment management, meaning upstream human impacts can override any benefits of riparian management at the reach scale [29,30]. The uncertainties generated by this problem may contribute to the current situation where few countries have extensive national regulations for buffer properties, although some countries do require uniform riparian buffer strip widths (e.g., 5 m) [26]. Moreover, gaps in our current scientific knowledge and legal frameworks could mean such regulations are insufficient for meeting management goals (e.g., Water Framework Directive) or are impractical for land managers seeking to implement riparian buffers [26,31,32]. These challenges reflect the increased demand for knowledge on how freshwater ecosystems respond to various levels of perturbations (e.g., human land uses) and what level of mitigation is required for recovery to occur [33].
Here, we introduce the BiodivErSA-funded CROSSLINK project (see Table 1 for a glossary of terms) by highlighting the key questions it addresses and the methods underpinning the extensive data collection helping to better understand riparian zones in human-influenced landscapes (Table 2 and Supplementary Materials). CROSSLINK involves replicated field studies across four case-study basins (Figure 1) in Norway (forested and urban stream reaches in the Oslo Fjord basin), Sweden (forested and agricultural stream reaches in the Lake Mälaren basin), Belgium (forested, agricultural and urban reaches in the Zwalm river basin), and Romania (forested and agricultural stream reaches in the Argeş river basin). CROSSLINK conceptualizes stream-riparian networks as key components of blue-green infrastructure (BGI) that are subject to multiple human pressures including water extraction, hydropower generation, forestry, agriculture, and urbanization leading to ecological harm and stakeholder conflicts [18,34].
In the broadest terms, CROSSLINK aims to (1) evaluate how the extent, spatial arrangement and connectivity of riparian-stream BGI affects biodiversity, ecosystem functioning, ecosystem services, and resilience indicators in forested, rural, and urban settings; and (2) produce an optimization framework capable of balancing multiple values, uses and needs with longer-term adaptive capacity and resilience in riparian-stream BGI. Underpinning the latter objective is the multifunctionality of landscapes as a key concept for solving resource-use conflicts with an emphasis on trade-offs between agricultural production and other values [35].
In this introduction to the CROSSLINK project, we analyze data on riparian habitats described using the qualitative index of riparian integrity (the Riparian Condition Index—RCI) developed by Harding et al. [36] for New Zealand conditions and adapted here for Europe. The RCI is comprised of 13 attributes (Table 3) that are scored 1–5 (poor to good) for both banks and then averaged. Their summed total provides an overall index that can be associated with stream ecological responses (e.g., reference [37]). We first assessed the overall performance of the RCI for characterizing riparian integrity in study reaches with varying levels of human impact (from reference or least impacted to strongly impacted by adjacent and upstream agricultural and/or urban land uses). Our a priori expectation was that buffered sites would have higher RCI scores more similar to the reference site scores than unbuffered sites. Following Burdon et al. [37], we hypothesized that our estimates of riparian condition would be positively associated with stream ecological status after accounting for upstream human impacts. To test this hypothesis and thus assess the utility of the RCI for predicting stream ecological status we used the macroinvertebrate Average Score Per Taxon (ASPT) index [38], which is used in environmental reporting for the European Union’s Water Framework Directive (WFD) [39,40,41].
Finally, we adapted the conceptual framework introduced by Burdon et al. [42] for understanding the role of forested riparian buffers in heterogenous landscapes. This framework considers how the extent of change in a biotic response may be determined by the magnitude of a local “transition” (here the change from an “unbuffered” riparian state to a woody vegetation patch providing a forested riparian buffer) or contingent on the environmental context (e.g., the level of catchment degradation). More specifically, biotic changes in response to riparian “buffering” can be predicted to be the product of a community’s sensitivity (or tolerance; sensu “negative resilience” [43]) and the magnitude of the transition from an unbuffered to buffered state. In this example, the framework introduces a pivotal question: does the quality and quantity of the riparian buffer determine the ecological response, or is it environmentally contingent on other factors?

2. Materials and Methods

2.1. Study Design

CROSSLINK has a tiered study design (Figure S1, Supplementary Materials). First, the “paired approach” tested aspects of lateral and longitudinal connectivity. This approach required 10–12 streams in each case-study basins flowing through an impacted (agricultural, urban or mixed agricultural and urban) landscape, each with two paired sites: an upstream site with no riparian buffer (i.e., “unbuffered”), and a downstream “buffered” site with a riparian buffer (i.e., leading to 20–24 sites in total). Second, the “network approach” testing aspects of longitudinal connectivity involved 10–12 additional sites distributed throughout the river network (e.g., upstream and downstream of the site pairs). Within these sites we sought pristine or least impacted headwater sites and more degraded, downstream longitudinal sites to help characterize the range of responses in ecosystem attributes to cumulative impacts of catchment land uses. Hereafter, the headwater sites are described as “reference” sites, and the downstream longitudinal sites are described as “matrix” sites because of their location further downstream in our landscape matrices (i.e., the portion of the heterogeneous landscape in which stream-riparian segments are “embedded”).
To ensure consistency and feasibility, streams used were wadeable, 1st–3rd order (i.e., approximately 2–5 m wide), and with a stable streambed (i.e., not frequently hydrodynamically disturbed) dominated by gravels and cobbles. In the stream reaches categorized as reference, buffered, and unbuffered, we focused on the presence and extent of woody vegetation in the riparian zone. Reference sites typically had intact forest extending to the upstream catchment boundaries. Both buffered and unbuffered sites were in human-impacted landscapes (i.e., impacted by urban or agricultural land uses). Key criteria applied during site selection of buffered sites included requirements for minimum buffer length (i.e., >50 m moving upstream from the downstream end of the sampling reach), width (>2–3 × wetted stream width), extent (buffer on both banks of the stream segment), and composition (dominated by small and large trees). Unbuffered sites typically only had a few isolated trees within the riparian zone.
The main criteria for the matrix sites were their network position, being located lower down in the catchment and subjected to higher levels of human impacts. The matrix sites also lacked an extensive riparian buffer as defined by the criteria outlined above. At each site, the different components of sampling for CROSSLINK were conducted over two reaches differing in length, with a shorter effective sampling reach nested in a longer habitat assessment reach (Figure S2, Supplementary Materials). Key components of terrestrial and aquatic habitat sampling were conducted within the longer habitat assessment reach (50 m long). The biological sampling (i.e., biodiversity and ecosystem functioning measures) were conducted within the shorter effective sampling reach (30 m long), which had flowing water (i.e., run-riffle sequence) with hard-bottomed sections (i.e., with cobble, pebble, gravel, and/or bedrock substrates). Both reaches begun at the same point at the downstream end, which in the case of buffered sites was located as far downstream as possible within the woody riparian buffer. See Protocol S1, Supplementary Materials for more details.

2.2. Sampling Overview

We sampled multiple environmental, biodiversity, and ecosystem functioning attributes at sites in our CROSSLINK stream-riparian networks (Table 2). Detailed protocols for all our measured variables are provided in the Supplementary Materials.

2.3. Riparian Habitat Assessment

Riparian habitat characteristics were surveyed in the riparian zones adjacent to the habitat assessment reach (50 m) at each study site. The surveys were carried out in summer 2018, when leaf-out was complete for all tree/shrub species, and targeted both banks. We surveyed riparian condition using an assessment of 13 qualitative variables that could indicate poor riparian status. This assessment follows the protocol described by Harding et al. [36] but adapted here for European conditions (Table 3). The protocol requires observers to rank aspects of the riparian zone that might be indicative of poor quality and integrity. Attributes were graded from poor (1) to excellent (5) on each bank over the habitat assessment reach (50 m), and scores were summed to provide an index of riparian habitat quality (the Riparian Condition Index—RCI). For the analysis of total riparian condition and individual attributes, bank scores were averaged to provide a single value for riparian condition at each stream. To ensure consistency amongst observers we ran a technical workshop for the CROSSLINK project on field protocols where we discussed riparian attributes at representative sites in Sweden as a group to ensure attributes were characterized in a consistent manner.

2.4. Water Quality

Grab water samples were collected in plastic containers for water quality analyses during three different seasons (autumn 2017, spring and summer 2018). We collected water samples from just below the water surface (i.e., 10 cm) in the channel thalweg at the downstream end of each site. Site pairs were sampled on the same day. Water samples were stored cold and refrigerated upon return to the laboratory whereby they were analyzed within 24 h of collection following standard methods [50]. Water samples were analyzed for total organic carbon, total nitrogen, ammonium (NH4−N), nitrite- and nitrate-nitrogen (i.e., oxidized nitrogen, NO2−N + NO3−N), total phosphorus, dissolved reactive phosphorus (PO4−P), specific conductivity, pH, and alkalinity. Spot water measurements for turbidity (NTU), specific conductivity, dissolved oxygen (%), and temperature were collected at the time of water sampling using a handheld instrument (e.g., Manta +30 probe, Eureka Water Probes, Austin, TX, USA). Total organic carbon, alkalinity, turbidity, dissolved oxygen, and temperature were not measured at all sites at the same time so are excluded from our statistical analyses (see below). For further details on water quality sampling, see Protocol S2.

2.5. Macroinvertebrates

We sampled macroinvertebrates within the effective sampling reach (i.e., 30 m). The reach used had flowing water (i.e., run-riffle sequence) with hard-bottomed sections (i.e., with cobble, pebble, gravel, and/or bedrock substrates). The sampling area comprised the entire stream width along the predefined reach, but we avoided sampling areas affected by flow intermittency. Quantitative sampling requires that stream invertebrates are collected from a given area with a standard sampling effort. We standardized methods to ensure comparable data using one of two potential sampling methods: Surber sampling and quantitative kick-net sampling [51]. All samplers used 500 µm mesh netting, and Surber samplers were ≈0.0625 m2 (e.g., 25 × 25 cm) in dimensions. Kick-nets used were equivalent to the dimensions of the Surber sampler by using an area defined by a quadrat equaling the width of the net. Sampling effort was standardized for 60 s where coarse substrate was disturbed to a maximum depth of 10 cm from the surface of the streambed. A total of six replicate subsamples were collected (three from erosional/riffle-run habitats, and three from depositional/run-pool habitats) using identical protocols within the effective sampling reach. All subsamples were pooled together. Woody material and leaves were retained separately in a plastic bag to contribute to estimates of standing coarse particulate organic matter (CPOM). The final, pooled macroinvertebrate sample was sieved (500 μm mesh) to remove excess water and then preserved in a 500–1000 mL container with 96% ethanol to reach a final concentration of 70% for later sorting.
Macroinvertebrate samples were identified to the lowest practicable taxonomic level (e.g., species or genus) using standard identification guides. From this data, we calculated the Average Score Per Taxon (ASPT) index [38]. The ASPT index is calculated as the ratio of the score obtained in the Biological Monitoring Working Party (BMWP) index to the number of taxa scored in the sample (Equation (1)):
ASPT = BMWP   Index   Taxa
The BMWP index assigns scores from one to 10 to each macroinvertebrate taxa based on their sensitivity to organic pollution, ranging from zero (tolerant) to 10 (sensitive) [38]. The BMWP index is calculated as the sum of scores for all taxa present in a sample. BMWP index values greater than 100 are associated with unpolluted (“clean”) streams, whilst scores less than 10 typify heavily polluted streams. Similarly, a high ASPT score is considered indicative of a “clean” (i.e., unpolluted) site containing large numbers of high scoring taxa. The ASPT index is suitable for assessing the impact of organic pollution [38]. We calculated ASPT scores with Family-level macroinvertebrate data using the function “calcBMWP” in the R package “biotic” [52].

2.6. Data Analysis

Here, we analyzed data from the CROSSLINK project on riparian conditions, stream macroinvertebrates, and catchment-wide human impacts (land use and water quality) to demonstrate the potential value of the Riparian Condition Index (RCI) for management. We used linear mixed models (LMM) to test overall differences in the summed totals of the RCI, with site type and country and their interaction as the fixed effects and site “Block“ (for site pairs) as the random effect. To determine which individual attributes were contributing to impairment, we used two approaches. First, we tested each attribute individually in an LMM with site type and country and their interaction as the fixed effects and site “Block” (for site pairs) as the random effect. To visualize how attributes differed across site types, we performed a Non-Metric Multidimensional Scaling (NMDS) ordination for sites using RCI attribute scores. The function “metaMDS” in the R package “vegan” with Euclidean distances were used for the NMDS analysis of the untransformed data matrix [53]. Each attribute was treated as a “species” in the data matrix with a mean score between 1–5 at each site surveyed. We used the “adonis” and “pairwiseAdonis” R functions in the “vegan” package [53] to test for differences across all attributes between site types.
Second, we calculated log response ratios (LRR) between site pairs with the “batch_calc_ES” function in the R package “SingleCaseES” [54] to determine which attributes were most improved by the presence of a forested riparian buffer (i.e., compared with the upstream unbuffered reach). The log response ratio (LRR) is a common effect size metric (i.e., the log proportional change in the means of a treatment and control group) [55]. The LRR is particularly used in meta-analyses of ecological research [56], and for quantifying simple two-group experimental designs (i.e., buffered (B) vs unbuffered (U)) the calculation of LRR is straightforward (Equation (2)):
LRR = ln (   X ¯   B   X ¯   U )
Effect sizes of attributes were ranked and presented graphically at the overall European level and for each case-study basin. The livestock access attribute was excluded in the analysis of the Norwegian sites because it was given a constant value (5) reflecting the urban nature of the catchment. Similarly, the soil quality attribute was excluded in the analysis of the Belgian sites because it consistently had an intermediate value (3) at both sites. The linear mixed models were fitted with the “lmer” function in the “lmer4” R package, and post-hoc tests conducted using the “lmertest” R function [57].
We used an indicator of stream ecological integrity (i.e., the Average Score Per Taxon index (ASPT)) to assess the utility of the Riparian Condition Index (RCI) whilst controlling for catchment-wide human impacts. We used Principal Components Analysis (PCA) to describe catchment-wide anthropogenic impacts (i.e., upstream influences). The PCA decomposed log-transformed water quality variables (i.e., total inorganic nitrogen, ammonium, nitrite- and nitrate-nitrogen, total phosphorus, dissolved reactive phosphorus, specific conductivity, and pH) and logit-transformed upstream land-use cover variables (i.e., % of the catchment area covered by urban, arable cropping, orcharding and vineyards, pasture, forest, natural features, water, wetlands, and other) into site scores (Axis 1, henceforth PC1) explaining 37% of total variation. Upstream land-cover estimates were obtained from the CORINE Land Cover inventory [58]. First, we tested the association of the RCI with the ASPT index using a mixed model where we included PC1 as a fixed control variable and specified “country” and “site pairs” as random effects. We excluded forested reference sites from Sweden (n = 5) in the mixed model because these streams went into extreme low flows (or dried completely) in the summer prior to macroinvertebrate sampling, potentially explaining the lower than expected values for the ASPT index. This omission did not alter the conclusions inferred from the statistical test, although it did improve the model fit. The linear mixed model was fitted with the “lmer” R function.
The framework introduced in Burdon et al. [42] describes how the magnitude of change in a biotic response can be determined by the size of a local “transition” (here the change from an “unbuffered” riparian state to a woody vegetation patch providing a forested riparian buffer) or be context-dependent, reflecting the prevailing upstream environmental conditions. In our study, changes in response to riparian “buffering” can be predicted to be the product of the community’s sensitivity (or tolerance; sensu “negative resilience” [43]) and the magnitude of the transition from an unbuffered to buffered state (Equation (3)). This approach corresponds to a (local) sensitivity analysis [42]:
Δ Y i = Y i D × Δ R
where Y is an ecological metric characterizing the status of an ecosystem. The state of the system at i (i.e., a point in time or space) can be defined as the ecological status Yi relative to an existing level of perturbation D (e.g.,   Y i / D ). Here, ΔYi describes the response of the ecosystem to the transition between “impacted” and “buffered” states as defined by ΔR. By quantifying ΔYi, ΔR, and the existing level of impairment (e.g.,   Y i / D ) it is possible to test the extent to which the sensitivity (or tolerance) varies with ecological status (i.e., environmental context). We apply the general approach described in Equation 3 to assess stream macroinvertebrate responses using change in the ASPT index between unbuffered and buffered sites. We hypothesized that using the RCI to measure the “magnitude of transition” between buffered and unbuffered states would reveal the benefit conferred to the stream invertebrate community whilst controlling for “environmental context” (i.e., the existing level of environmental degradation at the upstream site).
To test our hypothesis regarding the magnitude of transition and environmental context, we calculated log response ratios for the ASPT and the RCI, with the latter being the response variable (ΔASPT) and the former a predictor (i.e., the “magnitude of transition” hypothesis, ΔRCI). We used upstream site scores of catchment-wide human impacts (PC1) to represent the “environmental context” hypothesis. We tested the contribution of each hypothesized driver [i.e., the magnitude of transition (ΔRCI) vs environmental context (PC1)] and their interaction to the change in stream ecological status (ΔASPT) between site pairs using a mixed model with “country” as the random effect. To fit the mixed models, we used the R function “blmer” and tested for significance using Wald tests. The variance explained by the fixed and random effects was determined following Nakagawa and Schielzeth [59]. We visualized the results using the “scatter3D” function in the “plot3D” R package. All analyses were conducted in R [60].

3. Results

3.1. Riparian Integrity across Case-Study Basins

The Riparian Condition Index (RCI) was able to distinguish buffered and forested reference sites from the more degraded unbuffered and downstream “matrix” site types across our four case-study basins (Figure 2). However, the differences between buffered and forested sites (“lsmeans,” t = −2.593, P = 0.052) and unbuffered and matrix site types (t = 2.450, P = 0.074) were not significant at α = 0.05. These differences were typically conserved across the case-study basins, with a few exceptions. In Belgium and Romania, RCI scores for the downstream matrix sites did not differ significantly from the buffered and forested sites (Figure S4, Supplementary Materials).
Overall, the Scandinavian countries generally had higher RCI scores indicating better riparian conditions, with Sweden achieving on average a higher level of riparian integrity than the other three countries, and Norway having overall better riparian status than Belgium (Figure S4, Supplementary Materials). However, accounting for interactions between country and site type revealed that Norway only had significantly better riparian status in their unbuffered sites when compared with Belgium (t = −2.831, P < 0.05). In contrast, Sweden had significantly better riparian status in their buffered sites when compared with Belgium (t = −3.962, P < 0.001), and the Swedish forested reference sites had consistently higher index scores when compared to the other case-study basins (e.g., Norway–Sweden, t = −2.713, P < 0.05).
There were differences in the 13 attributes used to calculate the RCI across site types (Figure S5, Supplementary Materials). An NMDS ordination highlighted the key differences between forested reference, buffered, unbuffered and downstream matrix site types (Figure 3). This analysis showed that forested and buffered sites differed from the more degraded sites (PERMANOVA, F3125 = 13.6, R2 = 0.26, P < 0.001) and were generally associated with high scores for shading, buffer properties such as vegetation composition, intactness, width, groundcover, and properties of adjacent land to the riparian zone (>30 m from the stream) including vegetation composition and groundcover. In contrast, the more degraded unbuffered and matrix sites typically had lower scores for these attributes and other undesirable features, such as low scores associated with increased access for livestock. The land slope attribute showed slightly higher scores in these degraded sites, indicating riparian banks that were less steep than the reference and buffered sites (Figure 3).

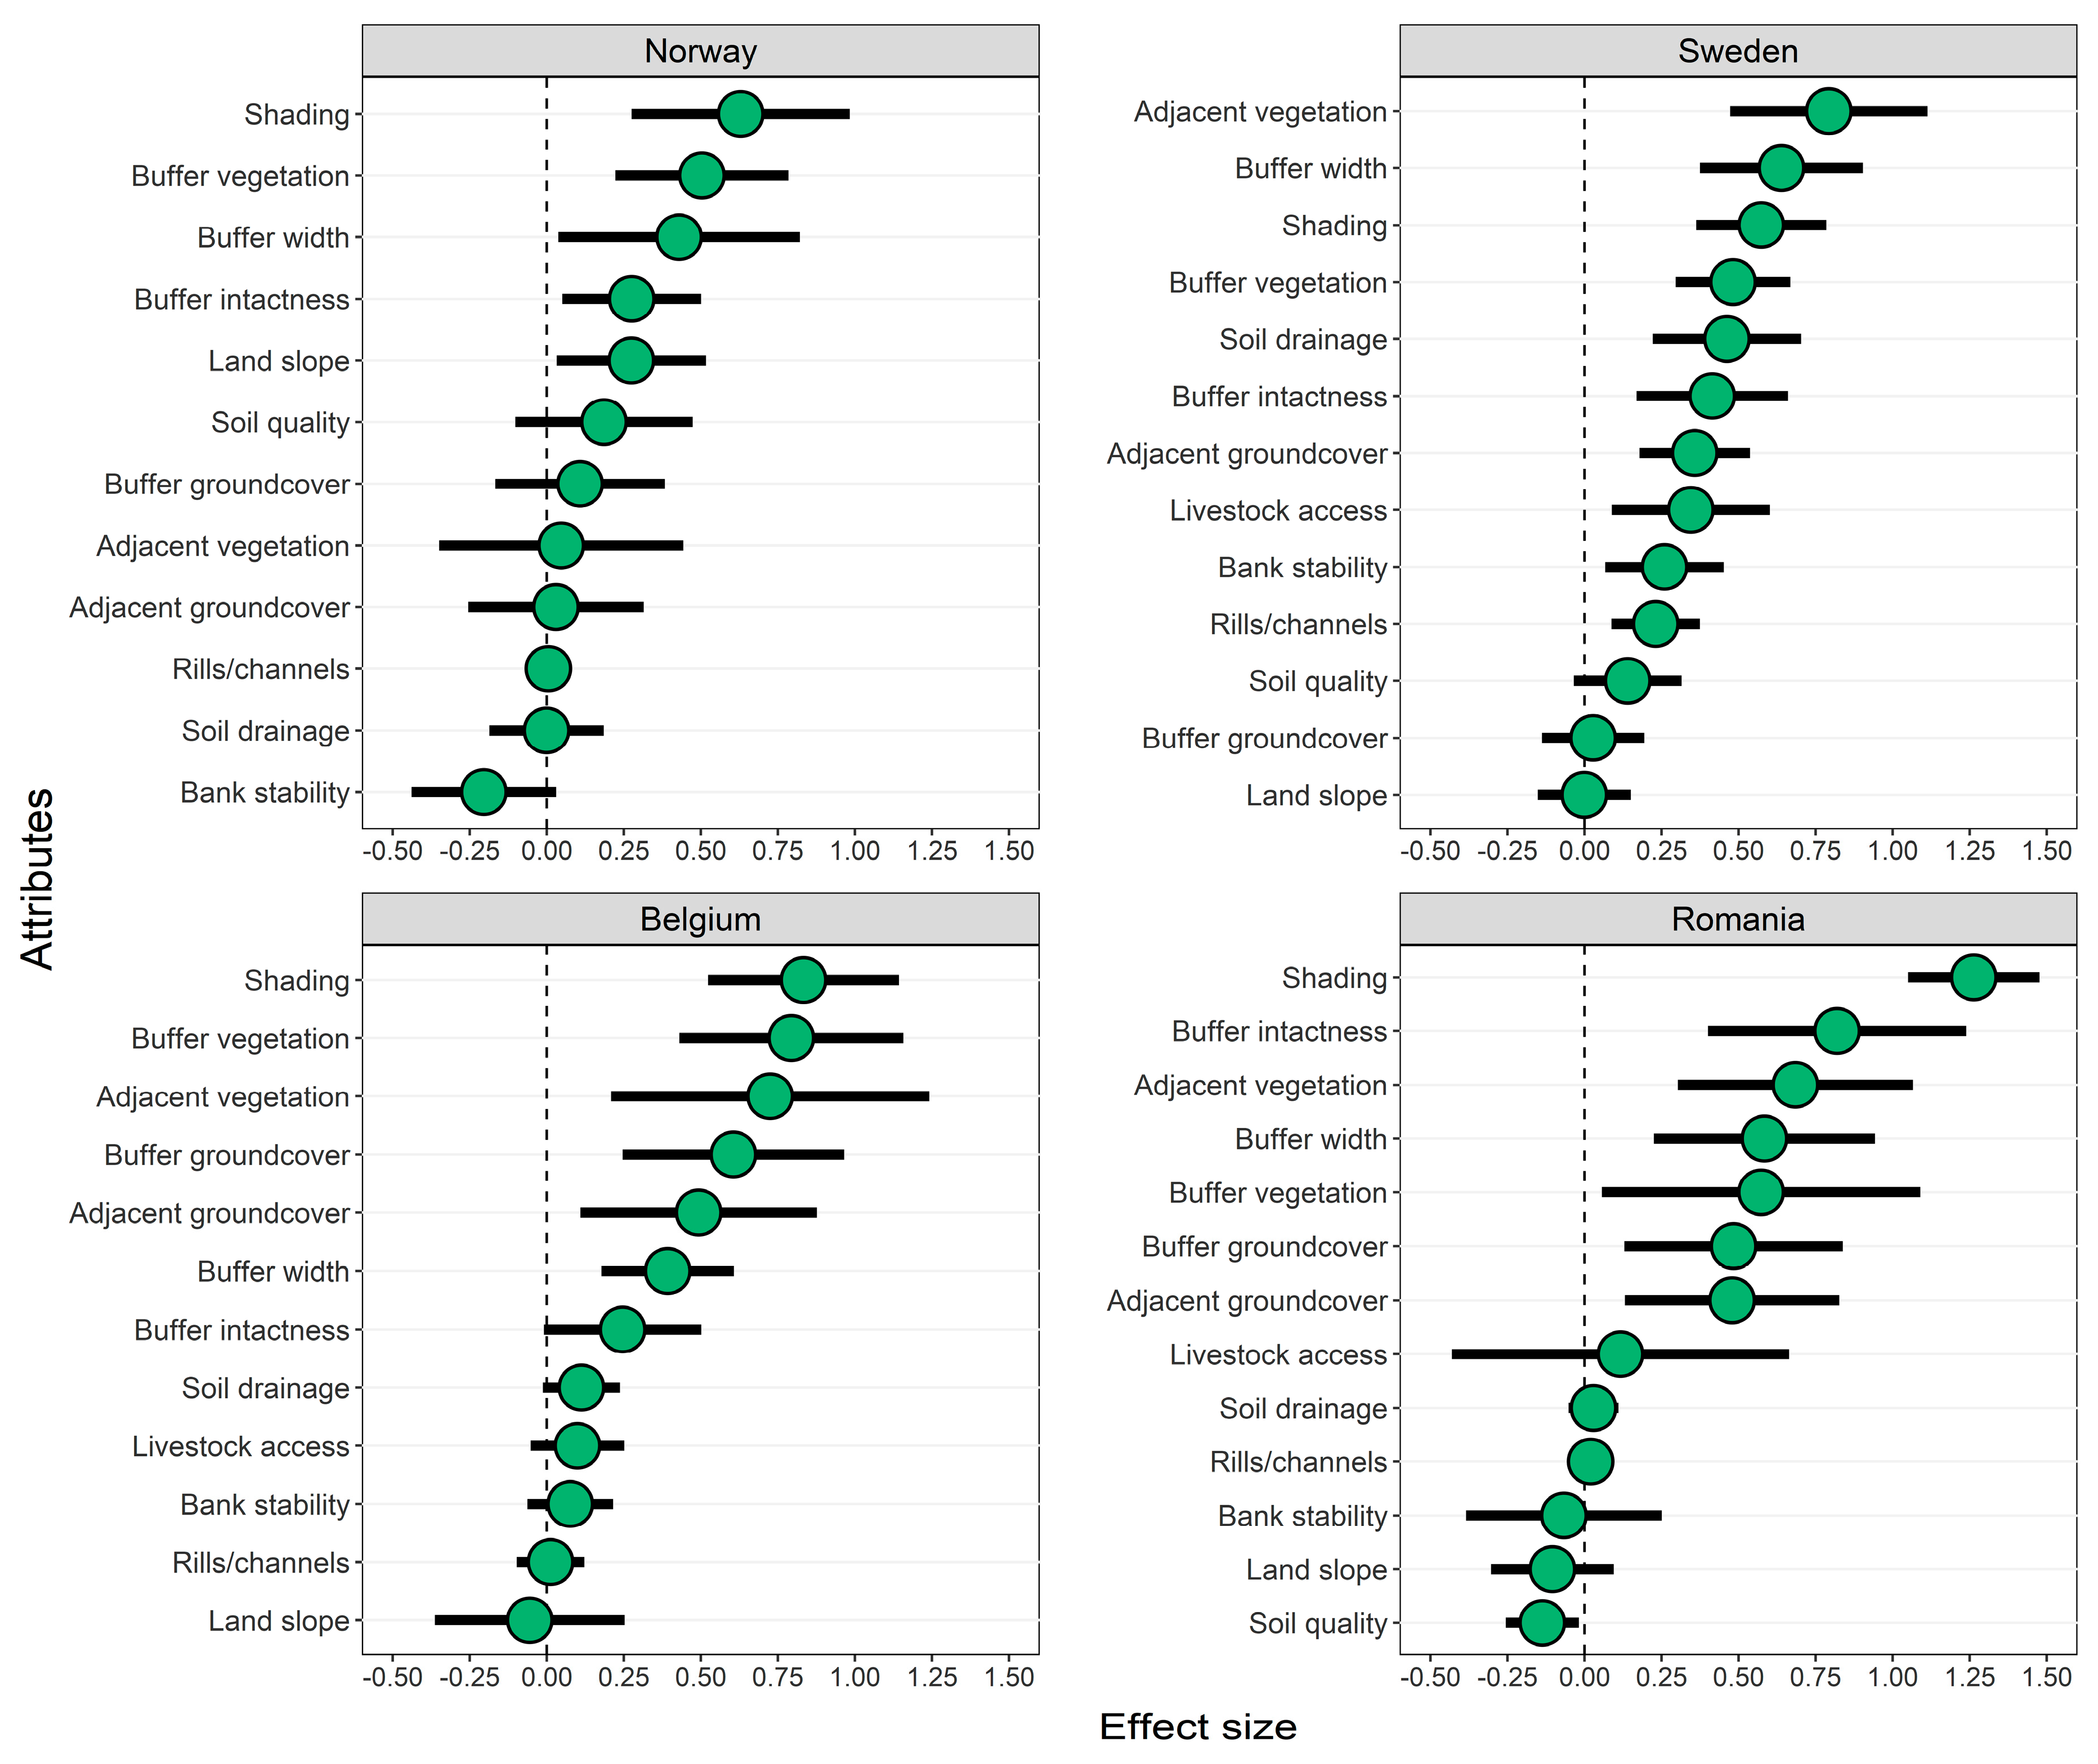
3.2. Effects of Forested Riparian Buffers

In statistics, an effect size is a quantitative measure of the size of the difference between two groups. We used effect sizes (log response ratios) to explicitly measure which attributes most strongly contributed to improved environmental conditions between the site pairs (i.e., unbuffered and buffered sites). This analysis strongly reflected the differences in attributes elucidated in Figure 3, with forested riparian buffers having a strong positive effect on channel shading (Figure 4). Attributes that responded with a moderate effect size to the presence of a forested riparian buffer included buffer properties such as vegetation composition (including adjacent land >30 m from the stream), width, and intactness. There were only weak positive effects sizes on the following attributes: buffer groundcover, soil drainage and livestock access. Effects sizes were negligible for rills and channels, soil quality, bank stability, and land slope.
We also used this approach (i.e., comparing effect sizes between unbuffered and buffered sites) in each case-study basin (Figure 5). Again, the dominant trends were conserved across countries, but with some notable exceptions. The presence of a forested riparian buffer had the strongest effect on shading in three of the case-study basins (Norway, Belgium, and Romania), with the exception of Sweden where adjacent vegetation and buffer width showed stronger effects between unbuffered and buffered sites (Figure 5). In the mostly urbanized catchments of the Oslo Fjord basin in Norway, effects of buffer presence on vegetation composition and groundcover of adjacent land to the riparian zone (>30 m from the stream) was negligible. Another interesting feature in the Oslo basin was the negative effect for bank stability in the presence of a forested riparian buffer, yet the land slope attribute showed a weak to moderate positive effect size. In contrast, land slope did not change with the presence of a forested riparian buffer in the three other case-study basins.
In the more agricultural catchments of Sweden’s Lake Mälaren basin, the sites also showed weak to moderate positive effect sizes in the presence of a forested riparian buffer for attributes typically associated with poor land management practices such as livestock access, soil drainage, and bank stability (Figure 5). Notably, in the agriculture-dominated Argeş basin of Romania, the presence of a forested riparian buffer only brought a negligible improvement in livestock access with a large uncertainty (Figure 5).

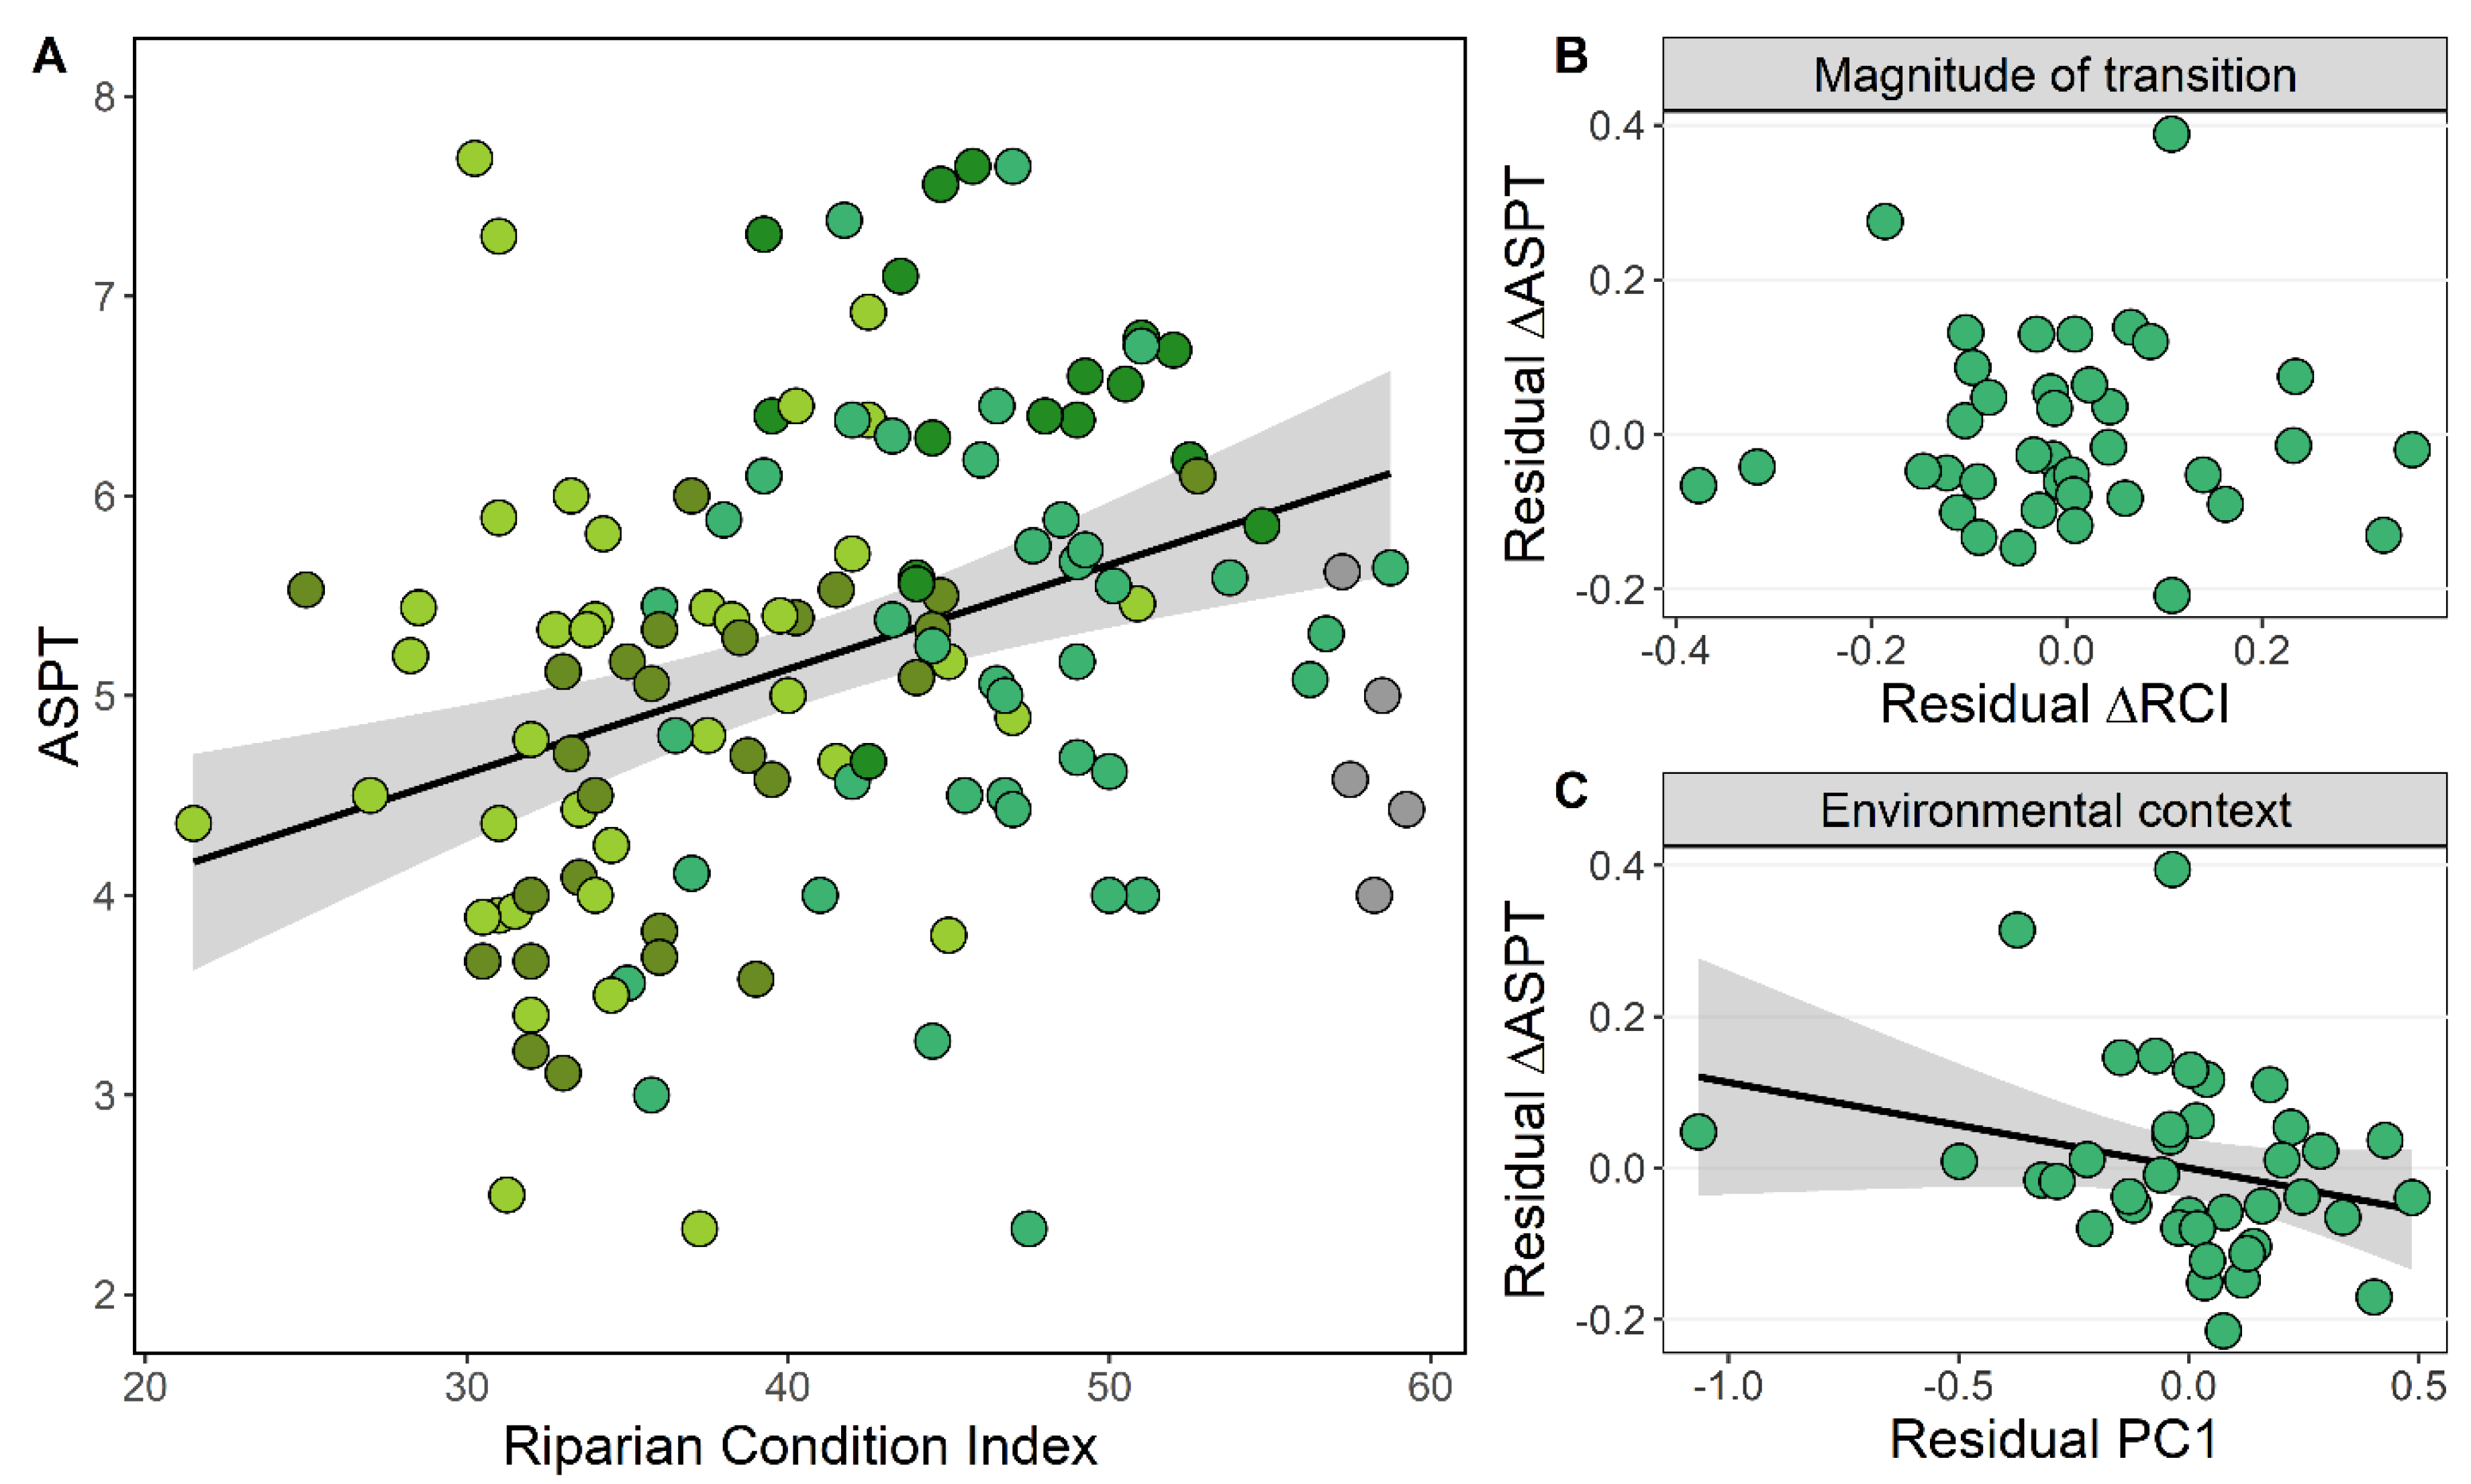
3.3. Riparian Condition and Stream Ecological Status

We found a positive, albeit weak, relationship between the Riparian Condition Index (RCI) and stream ecological status as indicated by the Average Score Per Taxon (ASPT) macroinvertebrate index (Figure 6A, Table 4). There was also a significant negative relationship between the level of human impacts in the upstream catchment (PC1) and the ASPT index (Table 4). There was no significant association between the change in stream ecological status (ΔASPT) between site pairs and the size of the improvement in riparian condition (ΔRCI) after accounting for the influence of catchment-wide human impacts (PC1) and their interaction (Figure 6B, Table 4). The effect size for an improvement in stream ecological status (ΔASPT) was negatively associated with the influence of catchment-wide human impacts (PC1) after accounting for the size of riparian improvement (ΔRCI) and their interaction (Figure 6C, Table 4).
However, the interaction between the improvement in riparian condition (ΔRCI) and catchment-wide human impacts (PC1) was significant (Table 4), and Figure 7 shows that the “magnitude of transition” hypothesis (i.e., ΔRCI) was contingent on the level of upstream degradation. In less impacted sites, the improvement in riparian condition (ΔRCI) had a negative relationship with the improvement in stream ecological status (ΔASPT; Figure 7). Contrasting with this result, sites that were more affected by upstream human activities showed that the size of the improvement in riparian condition (ΔRCI) was positively associated with the improvement in stream ecological status (ΔASPT; Figure 7).

4. Discussion

Riparian zones hugely influence fluxes that connect aquatic-terrestrial habitats, making them disproportionately important in terms of land area for these coupled meta-ecosystems [1,5]. For the CROSSLINK project we adapted and developed multiple approaches for measuring environmental, biodiversity, and ecosystem functioning attributes in stream-riparian networks (Table 2 and Supplementary Materials). Here, we demonstrate the value of our project by analyzing data collected for the Riparian Condition Index (RCI), a qualitative index of riparian integrity developed by Harding et al. [36] in New Zealand and adapted for European conditions. We used the RCI to describe the riparian ecological status of sites in four European countries (i.e., Norway, Sweden, Belgium, and Romania). We were able to demonstrate how our site types differed and what attributes used in the index were contributing to those changes. Our forested reference sites and sites with a forested riparian buffer typically had high scores for shading; buffer properties including vegetation composition, width, and intactness; and the vegetation composition of land adjacent to the riparian zone (i.e., >30m from the stream edge). In contrast, unbuffered sites and downstream “matrix” sites typically had lower overall scores, with key attributes indicating poor land management practices such as increased livestock access. Finally, we detected a weak positive association between riparian condition and stream ecological status, based on the macroinvertebrate ASPT index. Notably, in the presence of a forested riparian buffer, the effect size of improved stream ecological status did not scale with the effect size of the improvement in riparian condition (“magnitude of transition”). Instead, we saw evidence for the “environmental context” hypothesis, where improved stream ecological status in the presence of a forested riparian buffer declined overall when the existing upstream state was more degraded.

4.1. The Riparian Condition Index (RCI) in the European Context

Overall, the RCI was an effective means to describe characteristics among site types and was shown to be ecologically relevant with a positive influence on stream ecological status measured by a commonly used macroinvertebrate index (ASPT). We saw variation in index scores because of real differences in site properties between case-study basins. In the heavily urbanized streams of the Oslo Fjord catchment, we found that bank stability decreased in the presence of a forested riparian buffer (Figure 5), owing to the box culverting and impervious surfaces of upstream reaches resulting in higher scores indicating more stable bank habitat. Likewise, the presence of these features (i.e., box culverts) helped explain the shallower bank slopes recorded in the Norwegian buffered sites. Another real feature of the sites in Norway was the negligible effects of buffer presence on adjacent vegetation and groundcover, indicating that riparian buffers were typically constrained in the cityscape and did not “spillover” into the land >30m from the streams edge. Similarly, there were contrasting patterns in Sweden that reflected real differences in site characteristics. The forested reference sites in Sweden typically contained a mixture of mature coniferous and deciduous trees, with one of the sites located within an important nature reserve “Naturreservatet Fiby urskog” (Fiby primeval forest nature reserve) that has had relatively little human intervention since the end of the 18th century. For these reasons, the Swedish forested reference sites on average recorded better ecological status than the reference sites in the other European countries. Within the Lake Mälaren basin, the greater difference between the Swedish forested reference sites and buffered sites was influenced by differences in vegetation composition, with the forested riparian buffers strongly dominated by a mixture of deciduous tree species and a conspicuous absence of conifers. In contrast, the negligible difference between forested reference sites and buffered sites of the Argeş River basin in Romania was likely due to logging activity and the presence of livestock in both site types.
Indices that rely on observer-based judgements have obvious weaknesses but can be very useful for efficiently capturing the “gestalt” characteristics of an environment (i.e., an overall summation better perceived than the individual parts). Perhaps the most well-known observer-based index in stream ecology is the Stream Reach Inventory and Channel Stability Evaluation [61], also referred to as the Pfankuch Stability Index (PSI). The PSI is used extensively for catchment assessment and studies investigating relationships between channel stability and biota in North America and internationally [62,63]. The PSI is calculated by summing the scores assigned to 15 attributes (weighted in relation to their perceived importance) in three regions of the stream channel (i.e., upper banks, lower banks, and stream bottom), according to the observer’s evaluation of predetermined criteria [61]. The PSI has been shown to be a highly efficient means of describing bed-stability characteristics, but is prone to observer bias [64]. Despite using a technical workshop on field protocols to help ensure consistency in the determination of the RCI across case-study basins, we still detected evidence for differences in scoring arising from observer-specific judgements. For instance, field workers in Belgium were unable to perceive differences between buffered and unbuffered sites in the soil quality attribute, meaning we excluded this variable from our analyses of effect sizes (Figure 5). Other problems included anthropogenic features in urban landscapes indicating that some attributes of the RCI (e.g., “bank stability”) could be further modified to account for these properties. Overall, the RCI is an efficient and useful measure of riparian ecological integrity as demonstrated here, but not without some limitations (e.g., urban features, observer-specific biases). Despite these problems, the benefits for rapid habitat assessment are evident, and the RCI could be used widely by practitioners and citizen scientists to help monitor riparian ecological status.

4.2. Effects of Shading by Forested Riparian Buffers

A clear outcome from our analysis was the importance of forested riparian buffers for channel shading (Figure 4). Whilst unsurprising, this is a non-trivial result because management of shade is often seen as a key element in rehabilitating and restoring degraded streams [65,66]. Shading can reduce proliferations of filamentous green algae and macrophytes that contribute to impaired ecological status [67,68]. For example, excessive autotrophic biomass can increase ecosystem respiration in the water-column and interstitial spaces of the streambed [69,70], potentially leading to adverse impacts on pollution-sensitive EPT (Ephemeroptera, Plecoptera, Trichoptera) species through reductions in dissolved oxygen concentrations [71]. Excessive algal growth can also smother benthic substrate, thus reducing habitat availability for sensitive grazing mayflies and increasing abundances of tolerant taxa that include oligochaetes and chironomids [72]. Consequently, negative effects of shading on aquatic autotrophs may help explain why we saw a positive association between the RCI and ASPT indices after accounting for upstream impacts that included nutrient concentrations (i.e., PC1).
Further, a central tenet of the CROSSLINK project is that riparian buffers help rehabilitate stream habitats and enhance resilience for the impending problems posed by climate change [73]. Streams and river ecosystems are sensitive to climate change because they are intimately linked with the global hydrological cycle, are strongly influenced by atmospheric thermal regimes, and are frequently at risk from interactions between warming and existing anthropogenic stressors [42,74,75]. The strong influence of our forested riparian “buffers” in providing shade potentially also helps moderate stream temperatures; a pattern well supported by evidence [76,77,78]. For instance, planting deciduous riparian trees along temperate streams as an adaptation to climate change can reduce temperatures by 2–3 °C through channel shading [79]. Thus, our future analyses will be geared towards better understanding the magnitude of temperature regulation in the presence of forested riparian buffers and the environmental contingencies (e.g., water residence times) that influence this moderating influence.

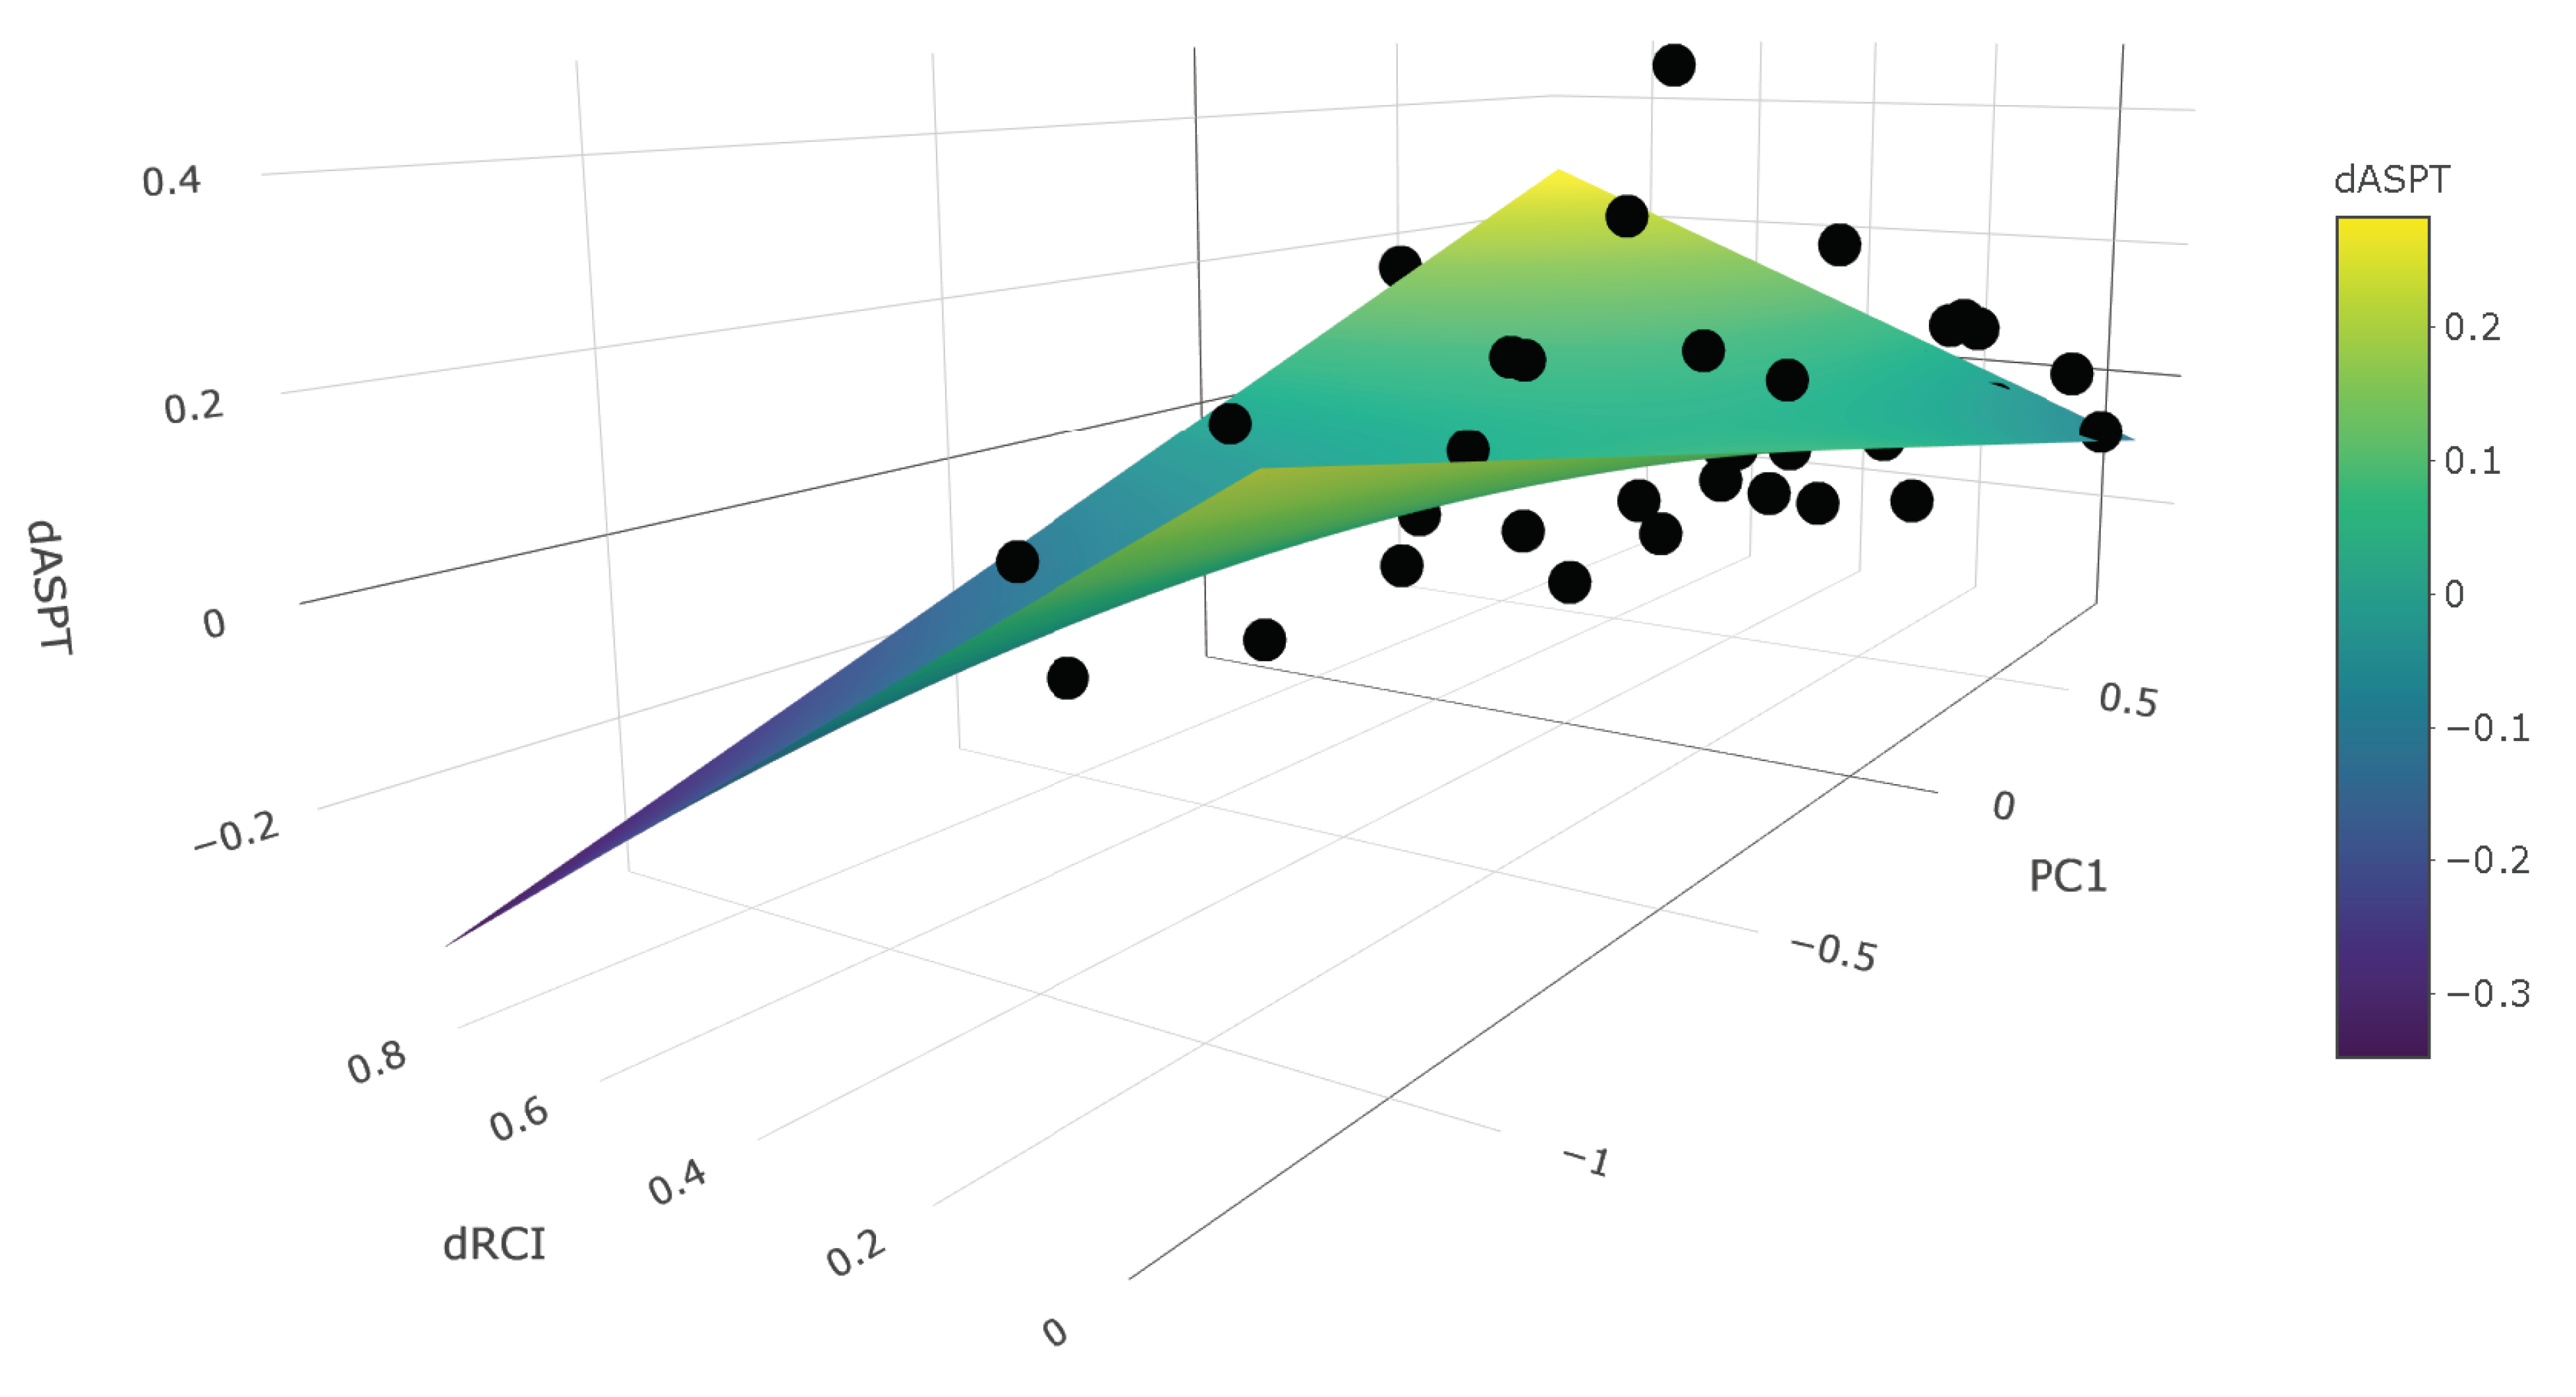
4.3. Magnitude of Transition and Environmental Context

Cost effective ecosystem management requires consideration of additional stressors, both locally and at whole catchment scales, that might limit or enhance the success of any given mitigation or restoration measure, including the rehabilitation of riparian buffers [80]. In our example (Figure 6B,C), the effect size of improved stream ecological status did not scale with the effect size of the improvement in riparian condition (i.e., the magnitude of transition hypothesis). Instead, we saw evidence for the overall effect size of improved stream ecological status by “buffering” becoming smaller when the existing upstream state was more degraded, supporting the environmental context hypothesis. However, adding another layer of complexity, we also detected a significant interaction between the drivers representing the magnitude of transition and environmental context hypotheses. This result indicated that the relationship between improved stream ecological status and the magnitude of transition (i.e., the improvement in riparian condition) was dependent on the level of upstream human impacts. Thus, although the maximum possible improvement in stream ecological status declined overall with increasing upstream degradation, the potential for a larger relative improvement with enhanced riparian management was more likely in degraded sites. Intriguingly, the negative influence of improving riparian condition on the ASPT index at low levels of upstream degradation (Figure 7) may have reflected a “subsidy-stress”-type response, where increased light availability in the more open unbuffered sites conferred a benefit (sensu “subsidy”) to normally sensitive invertebrate taxa [81]. The subsidy-stress relationship describes how at low levels, anthropogenic perturbations may enhance ecosystem functioning and species responses, whereas higher levels depress these responses [82]. Nonetheless, the pattern in our study (low upstream stress, negative response to riparian afforestation) may also have reflected the distribution of data points, and a study in small Danish streams showed there was no difference in invertebrate community composition between forested streams and sites in open landscapes [83].
As a caveat, we only used one metric (i.e., the ASPT) as a response in our example. In Burdon et al. [42], we found that ecological responses to the same environmental driver (i.e., here forested riparian buffers) was not only dependent on the environmental context but also the community metrics used. Thus, remediation strategies aiming to improve stream ecological status by rehabilitating degraded reaches not only need to consider upstream anthropogenic influences but also the most appropriate indicators [42]. Future research will consider other ecological responses and better describe riparian buffer properties and the key environmental contingencies that may alter responses (e.g., catchment size, network position, etc.). However, our findings here as a proof of concept should interest managers, because it suggests that the potential for improvement in stream ecological status using forested riparian buffers may be greater in more degraded streams for certain ecological metrics, provided sufficient effort goes into improving riparian conditions.

5. Conclusions

Acquiring a general, predictive understanding of ecological systems requires knowing how much structural and functional relationships can cross scales and contexts to form broader patterns. Here we introduced the BiodivERsA-funded project CROSSLINK that investigates questions about the role of forested riparian buffers in human-impacted landscapes by measuring a wide range of ecosystem attributes in stream and riparian habitats at a continental scale. Riparian zones are important because they provide habitat for biodiversity and act as the interface between land and water, thus influencing cross-habitat food-web interactions, system functioning, and the provision of ecosystem services in heterogenous landscapes. Our results have highlighted important attributes of forested riparian buffers, which include the provision of habitat and shading of the stream channel. We also saw evidence for improving stream ecological status through the presence of these landscape features, and the potential for improvement in certain metrics (i.e., ASPT) may be greater in more degraded streams, provided sufficient effort goes in to improving riparian conditions. Enhancing existing and planting new forested riparian buffers as “nature-based solutions” is increasingly required in modified catchments, where multiple pressures are causing ecological degradation and decreased resilience to climate change. However, evidence for the multifunctionality of riparian buffers is needed to inform and persuade regulators and land managers to implement effective nature-based solutions and devote greater resources towards this goal [84]. Our introduction to CROSSLINK highlights the potential for this project with its broad portfolio of ecosystem attributes to help improve management of forested riparian buffers in human-impacted landscapes.

Supplementary Materials

The following are available online at https://www.mdpi.com/2073-4441/12/4/1178/s1, Figure S1. Four CROSSLINK site types; Figure S2. The effective sampling reach and the habitat assessment reach; Figure S3. Riparian plots used to sample biodiversity indicators; Figure S4. Riparian Condition Index (RCI) values for site types in each CROSSLINK case-study basin; Figure S5. Mean RCI attributes for the four CROSSLINK site types; Protocol S1. Study sites and design; Protocol S2. Environmental data (Descriptions of field methods for environmental data); Protocol S3. Biodiversity data (Descriptions of field methods for biodiversity indicators); Protocol S4. Ecosystem functioning data (Descriptions of field methods for functional indicators); Protocol S5. Food web data (Descriptions of methods for biomarker analyses); Protocol S6. Societal Needs (Description of optimization framework).

Author Contributions

Conceptualization, F.J.B., M.V., G.R., P.G., N.F., R.K.J. and B.G.M.; methodology, all authors; software, F.J.B.; validation, F.J.B.; formal analysis, F.J.B.; investigation, F.J.B., E.R., J.S., M.A.E.F., N.d.S., P.T.M., T.F.M., M.O.P., V.D., C.C., F.W., B.K. and G.R.; resources, F.J.B., M.A.E.F., N.d.S., P.T.M., M.O.P., V.D., C.C., F.W. and B.K.; data curation, F.J.B., E.R., J.S., M.A.E.F., N.d.S., P.T.M., M.O.P., V.D., C.C., F.W., B.K. and B.G.M.; writing—original draft preparation, F.J.B.; writing—review and editing, F.J.B., E.R., M.A.E.F., F.W., B.K., U.G., M.V., G.R., P.G., N.F., R.K.J. and B.G.M.; visualization, F.J.B. and F.W.; supervision, F.J.B., M.V., G.R., P.G., N.F., R.K.J. and B.G.M.; project administration, F.J.B., M.A.E.F., B.K., M.V., G.R., P.G., N.F. and B.G.M.; funding acquisition, B.G.M., R.K.J., N.F., P.G., G.R., M.V. and T.F.M. All authors have read and agreed to the published version of the manuscript.

Funding

This research was conducted as part of the CROSSLINK project funded through the 2015–2016 BiodivERsA COFUND call for research proposals. National funders: the Swedish Research Council for Sustainable Development (FORMAS, project 2016-01945) and the Swedish Environmental Protection Agency; The Research Council of Norway (NFR, project 264499); The Research Foundation of Flanders (FWO, project G0H6516N), Belgium; the Romanian National Authority for Scientific Research and Innovation (CCCDI–UEFISCDI, project BiodivERsA3-2015-49-CROSSLINK, within PNCDI III); and the Federal Ministry of Education and Research (BMBF, project FKZ: 01LC1621A), Germany.

Acknowledgments

The comments by four anonymous reviewers improved the manuscript. We thank landowners for access to sites. Sweden: Hannah Fried-Petersen, Jenny Nilsson, James Weldon, Maidul Choudhury, Daan Van Pul, and Erik Gunnars contributed in the field and laboratory with technical support from Mikael Östlund and Joel Segersten. Karin Wallman and the Geochemical Laboratory processed water samples. Lars Eriksson from the Biodiversity Laboratory identified macroinvertebrate samples, with support from Magda-Lena Wiklund McKie. Joel Berglund at Länsstyrelsen Uppsala Län was an invaluable source of information regarding potential field sites. Norway: Eivind Ekholt Andersen, Jens Thaulow, Johnny Håll, Teis Friberg, Birk Fogde Ørnskov, Benoit Demars, and Markus Lindholm assisted in the field. Joanna Lynn Kemp and Jonas Persson identified the macroinvertebrate samples. Belgium: Lotte Baert, Koen Lock, and Niels De Troyer contributed in the field and laboratory. Koen Lock identified macroinvertebrate samples. Romania: Marius Bujor, Geta Niculae, Aglaia Pârvu, Zanfira Botoș, Liliana Gheorghe, Cristian Murgu, Cezara Tudose, Florentina Grigorescu, Raluca Zoican, Cristiana Bobeș, Miruna Mirică, Mădălina Ivan, Darmina Niță and Cristina Popescu contributed to field and laboratory work. Macroinvertebrates were identified by Mihaela Sava.

Conflicts of Interest

The authors declare no conflict of interest.

References

  1. Gregory, S.V.; Swanson, F.J.; McKee, W.A.; Cummins, K.W. An ecosystem perspective of riparian zones: Focus on links between land and water. Bioscience 1991, 41, 540–551. [Google Scholar] [CrossRef]
  2. Naiman, R.J.; Decamps, H. The ecology of interfaces: Riparian zones. Annu. Rev. Ecol. Syst. 1997, 28, 621–658. [Google Scholar] [CrossRef] [Green Version]
  3. Power, M.E.; Rainey, W.E. Food webs and resource sheds: Towards spatially delimiting trophic interactions. In The Ecological Consequences of Environmental Heterogeneity; Hutchings, M.J., John, E.A., Stewart, A.J., Eds.; Blackwell Science: London, UK, 2000; pp. 291–314. [Google Scholar]
  4. Marcarelli, A.M.; Baxter, C.V.; Benjamin, J.R.; Miyake, Y.; Murakami, M.; Fausch, K.D.; Nakano, S. Magnitude and direction of stream–forest community interactions change with time scale. Ecology 2020, in press. [Google Scholar] [CrossRef] [PubMed]
  5. Leroux, S.J.; Loreau, M. Subsidy hypothesis and strength of trophic cascades across ecosystems. Ecol. Lett. 2008, 11, 1147–1156. [Google Scholar] [CrossRef] [PubMed]
  6. Naiman, R.J.; Decamps, H.; Pollock, M. The role of riparian corridors in maintaining regional biodiversity. Ecol. Appl. 1993, 3, 209–212. [Google Scholar] [CrossRef] [PubMed]
  7. Hanna, D.E.L.; Raudsepp-Hearne, C.; Bennett, E.M. Effects of land use, cover, and protection on stream and riparian ecosystem services and biodiversity. Conserv. Biol. 2020, 34, 244–255. [Google Scholar] [CrossRef]
  8. Nakano, S.; Murakami, M. Reciprocal subsidies: Dynamic interdependence between terrestrial and aquatic food webs. Proc. Natl. Acad. Sci. USA 2001, 98, 166–170. [Google Scholar] [CrossRef] [Green Version]
  9. Burdon, F.J.; McIntosh, A.R.; Harding, J.S. Mechanisms of trophic niche compression: Evidence from landscape disturbance. J. Anim. Ecol. 2020, 89, 730–744. [Google Scholar] [CrossRef]
  10. Polis, G.A.; Anderson, W.B.; Holt, R.D. Toward an intergration of landscape and food web ecology: The dynamics of spatially subsidized food webs. Annu. Rev. Ecol. Syst. 1997, 28, 289–316. [Google Scholar] [CrossRef] [Green Version]
  11. Baxter, C.V.; Fausch, K.D.; Carl Saunders, W. Tangled webs: Reciprocal flows of invertebrate prey link streams and riparian zones. Freshw. Biol. 2005, 50, 201–220. [Google Scholar] [CrossRef]
  12. Burdon, F.J.; Harding, J.S. The linkage between riparian predators and aquatic insects across a stream-resource spectrum. Freshw. Biol. 2008, 53, 330–346. [Google Scholar] [CrossRef]
  13. Allan, J.D. Landscapes and riverscapes: The influence of land use on stream ecosystems. Annu. Rev. Ecol. Evol. Syst. 2004, 35, 257–284. [Google Scholar] [CrossRef] [Green Version]
  14. Carlson, P.E.; McKie, B.G.; Sandin, L.; Johnson, R.K. Strong land-use effects on the dispersal patterns of adult stream insects: Implications for transfers of aquatic subsidies to terrestrial consumers. Freshw. Biol. 2016, 61, 848–861. [Google Scholar] [CrossRef]
  15. Steffen, W.; Grinevald, J.; Crutzen, P.; McNeill, J. The Anthropocene: Conceptual and historical perspectives. Philos. Trans. R. Soc. A Math. Phys. Eng. Sci. 2011, 369, 842–867. [Google Scholar] [CrossRef] [PubMed]
  16. Tilman, D.; Clark, M.; Williams, D.R.; Kimmel, K.; Polasky, S.; Packer, C. Future threats to biodiversity and pathways to their prevention. Nature 2017, 546, 73. [Google Scholar] [CrossRef] [PubMed]
  17. Harrison, I.; Abell, R.; Darwall, W.; Thieme, M.L.; Tickner, D.; Timboe, I. The freshwater biodiversity crisis. Science 2018, 362, 1369. [Google Scholar] [CrossRef] [PubMed]
  18. Vorosmarty, C.J.; McIntyre, P.B.; Gessner, M.O.; Dudgeon, D.; Prusevich, A.; Green, P.; Glidden, S.; Bunn, S.E.; Sullivan, C.A.; Liermann, C.R.; et al. Global threats to human water security and river biodiversity. Nature 2010, 467, 555–561. [Google Scholar] [CrossRef]
  19. Correll, D.L. Principles of planning and establishment of buffer zones. Ecol. Eng. 2005, 24, 433–439. [Google Scholar] [CrossRef]
  20. Greenwood, M.J.; Harding, J.S.; Niyogi, D.K.; McIntosh, A.R. Improving the effectiveness of riparian management for aquatic invertebrates in a degraded agricultural landscape: Stream size and land-use legacies. J. Appl. Ecol. 2012, 49, 213–222. [Google Scholar] [CrossRef]
  21. European Commission. Towards an EU Research and Innovation Policy Agenda for Nature-Based Solutions & Re-Naturing Cities; European Commission: Brussels, Belgium, 2015. [Google Scholar]
  22. Friberg, N.; Angelopoulos, N.V.; Buijse, A.D.; Cowx, I.G.; Kail, J.; Moe, T.F.; Moir, H.; O’Hare, M.T.; Verdonschot, P.F.M.; Wolter, C. Effective river restoration in the 21st Century: From trial and error to novel evidence-based approaches. In Advances in Ecological Research; Dumbrell, A.J., Kordas, R.L., Woodward, G., Eds.; Academic Press: Cambridge, MA, USA, 2016; Volume 55, pp. 535–611. [Google Scholar]
  23. Honnay, O.; Jacquemyn, H.; Nackaerts, K.; Breyne, P.; Van Looy, K. Patterns of population genetic diversity in riparian and aquatic plant species along rivers. J. Biogeogr. 2010, 37, 1730–1739. [Google Scholar] [CrossRef]
  24. Tagwireyi, P.; Sullivan, S.M.P. Riverine landscape patches influence trophic dynamics of riparian ants. River Res. Appl. 2016, 32, 1721–1729. [Google Scholar] [CrossRef]
  25. Ficetola, G.F.; Padoa-Schioppa, E.; De Bernardi, F. Influence of landscape elements in riparian buffers on the conservation of semiaquatic amphibians. Conserv. Biol. 2009, 23, 114–123. [Google Scholar] [CrossRef] [PubMed]
  26. Lind, L.; Hasselquist, E.M.; Laudon, H. Towards ecologically functional riparian zones: A meta-analysis to develop guidelines for protecting ecosystem functions and biodiversity in agricultural landscapes. J. Environ. Manag. 2019, 249, 109391. [Google Scholar] [CrossRef] [PubMed]
  27. Lowrance, R.; Todd, R.; Fail, J.; Hendrickson, O.; Leonard, R.; Asmussen, L. Riparian forests as nutrient filters in agricultural watersheds. BioScience 1984, 34, 374–377. [Google Scholar] [CrossRef]
  28. Parkyn, S.M.; Davies-Colley, R.J.; Halliday, N.J.; Costley, K.J.; Croker, G.F. Planted Riparian Buffer Zones in New Zealand: Do They Live Up to Expectations? Restor. Ecol. 2003, 11, 436–447. [Google Scholar] [CrossRef]
  29. Wahl, C.M.; Neils, A.; Hooper, D. Impacts of land use at the catchment scale constrain the habitat benefits of stream riparian buffers. Freshw. Biol. 2013, 58, 2310–2324. [Google Scholar] [CrossRef]
  30. Bernhardt, E.S.; Palmer, M.A. River restoration: The fuzzy logic of repairing reaches to reverse catchment scale degradation. Ecol. Appl. 2011, 21, 1926–1931. [Google Scholar] [CrossRef]
  31. Mander, Ü.; Hayakawa, Y.; Kuusemets, V. Purification processes, ecological functions, planning and design of riparian buffer zones in agricultural watersheds. Ecol. Eng. 2005, 24, 421–432. [Google Scholar] [CrossRef]
  32. Cole, L.J.; Stockan, J.; Helliwell, R. Managing riparian buffer strips to optimise ecosystem services: A review. Agric. Ecosyst. Environ. 2020, in press. [Google Scholar] [CrossRef]
  33. Friberg, N. Pressure-response relationships in stream ecology: Introduction and synthesis. Freshw. Biol. 2010, 55, 1367–1381. [Google Scholar] [CrossRef]
  34. Dudgeon, D. Multiple threats imperil freshwater biodiversity in the Anthropocene. Curr. Biol. 2019, 29, R960–R967. [Google Scholar] [CrossRef] [PubMed]
  35. Seppelt, R.; Müller, F.; Schröder, B.; Volk, M. Challenges of simulating complex environmental systems at the landscape scale: A controversial dialogue between two cups of espresso. Ecol. Model. 2009, 220, 3481–3489. [Google Scholar] [CrossRef]
  36. Harding, J.S.; Clapcott, J.; Quinn, J.; Hayes, J.; Joy, M.; Storey, R.; Greig, H.; Hay, J.; James, T.; Beech, M.; et al. Stream Habitat Assessment Protocols for Wadeable Rivers and Streams of New Zealand; School of Biological Sciences, University of Canterbury: Christchurch, New Zealand, 2009. [Google Scholar]
  37. Burdon, F.J.; McIntosh, A.R.; Harding, J.S. Habitat loss drives threshold response of benthic invertebrate communities to deposited sediment in agricultural streams. Ecol. Appl. 2013, 23, 1036–1047. [Google Scholar] [CrossRef] [PubMed]
  38. Armitage, P.D.; Moss, D.; Wright, J.F.; Furse, M.T. The performance of a new biological water quality score system based on macroinvertebrates over a wide range of unpolluted running-water sites. Water Res. 1983, 17, 333–347. [Google Scholar] [CrossRef]
  39. Friberg, N.; Bonada, N.; Bradley, D.C.; Dunbar, M.J.; Edwards, F.K.; Grey, J.; Hayes, R.B.; Hildrew, A.G.; Lamouroux, N.; Trimmer, M.; et al. Biomonitoring of Human Impacts in Freshwater Ecosystems: The Good, the Bad and the Ugly. In Advances in Ecological Research; Woodward, G., Ed.; Academic Press: Cambridge, MA, USA, 2011; Volume 44, pp. 1–68. [Google Scholar]
  40. Davy-Bowker, J.; Clarke, R.T.; Johnson, R.K.; Kokes, J.; Murphy, J.F.; Zahrádková, S. A comparison of the European Water Framework Directive physical typology and RIVPACS-type models as alternative methods of establishing reference conditions for benthic macroinvertebrates. Hydrobiologia 2006, 566, 91–105. [Google Scholar] [CrossRef]
  41. Birk, S.; Hering, D. Direct comparison of assessment methods using benthic macroinvertebrates: A contribution to the EU Water Framework Directive intercalibration exercise. Hydrobiologia 2006, 566, 401. [Google Scholar] [CrossRef]
  42. Burdon, F.J.; Reyes, M.; Alder, A.C.; Joss, A.; Ort, C.; Räsänen, K.; Jokela, J.; Eggen, R.I.L.; Stamm, C. Environmental context and magnitude of disturbance influence trait-mediated community responses to wastewater in streams. Ecol. Evol. 2016, 6, 3923–3939. [Google Scholar] [CrossRef] [Green Version]
  43. Lake, P.S. Resistance, Resilience and Restoration. Ecol. Manag. Restor. 2013, 14, 20–24. [Google Scholar] [CrossRef]
  44. Sörensen, J. Urban, Pluvial Flooding: Blue-Green Infrastructure as a Strategy for Resilience; Lund University: Lund, Sweden, 2018. [Google Scholar]
  45. Lennon, M. Green infrastructure and planning policy: A critical assessment. Local Environ. 2015, 20, 957–980. [Google Scholar] [CrossRef] [Green Version]
  46. Turner, T. Greenways, blueways, skyways and other ways to a better London. Landsc. Urban Plan. 1995, 33, 269–282. [Google Scholar] [CrossRef]
  47. Walsh, C.J.; Booth, D.B.; Burns, M.J.; Fletcher, T.D.; Hale, R.L.; Hoang, L.N.; Livingston, G.; Rippy, M.A.; Roy, A.H.; Scoggins, M.; et al. Principles for urban stormwater management to protect stream ecosystems. Freshw. Sci. 2016, 35, 398–411. [Google Scholar] [CrossRef] [Green Version]
  48. Sörensen, J.; Persson, A.; Sternudd, C.; Aspegren, H.; Nilsson, J.; Nordström, J.; Jönsson, K.; Mottaghi, M.; Becker, P.; Pilesjö, P.; et al. Re-Thinking Urban Flood Management—Time for a Regime Shift. Water 2016, 8, 332. [Google Scholar] [CrossRef] [Green Version]
  49. Ossa-Moreno, J.; Smith, K.M.; Mijic, A. Economic analysis of wider benefits to facilitate SuDS uptake in London, UK. Sustain. Cities Soc. 2017, 28, 411–419. [Google Scholar] [CrossRef] [Green Version]
  50. Fölster, J.; Johnson, R.K.; Futter, M.N.; Wilander, A. The Swedish monitoring of surface waters: 50 years of adaptive monitoring. AMBIO 2014, 43, 3–18. [Google Scholar] [CrossRef] [Green Version]
  51. Hauer, F.R.; Resh, V.H. Chapter 20—Macroinvertebrates. In Methods in Stream Ecology, 2nd ed.; Academic Press: San Diego, CA, USA, 2007; pp. 435–454. [Google Scholar]
  52. Briers, R. Biotic: Calculation of Freshwater Biotic Indices. R Package Version 0.1.2. 2016. Available online: https://github.com/robbriers/biotic (accessed on 1 April 2020).
  53. Oksanen, J.; Blanchet, F.G.; Friendly, M.; Kindt, R.; Legendre, P.; McGlinn, D.; Minchin, P.R.; O’Hara, R.B.; Simpson, G.L.; Solymos, P.; et al. Vegan: Community Ecology Package; R Foundation for Statistical Computing: Vienna, Austria, 2019. [Google Scholar]
  54. Swan, D.M.; Pustejovsky, J.E. A gradual effects model for single-case designs. Multivar. Behav. Res. 2018, 53, 574–593. [Google Scholar] [CrossRef] [PubMed]
  55. Lajeunesse, M.J. On the meta-analysis of response ratios for studies with correlated and multi-group designs. Ecology 2011, 92, 2049–2055. [Google Scholar] [CrossRef]
  56. Hedges, L.V.; Gurevitch, J.; Curtis, P.S. The meta-analysis of response ratios in experimental ecology. Ecology 1999, 80, 1150–1156. [Google Scholar] [CrossRef]
  57. Bates, D.; Mächler, M.; Bolker, B.; Walker, S. Fitting linear mixed-effects models using lme4. J. Stat. Softw. 2015, 67, 48. [Google Scholar] [CrossRef]
  58. CLC. Corine Land Cover (CLC) Inventory; European Environment Agency, EEA: Copenhagen, Denmark, 2018; Available online: https://land.copernicus.eu/ (accessed on 1 April 2020).
  59. Nakagawa, S.; Schielzeth, H. A general and simple method for obtaining R2 from generalized linear mixed-effects models. Methods Ecol. Evol. 2013, 4, 133–142. [Google Scholar] [CrossRef]
  60. R Core Team. A Language and Environment for Statistical Computing; R Foundation for Statistical Computing: Vienna, Austria, 2019; Available online: http://www.R-project.org/ (accessed on 1 April 2020).
  61. Pfankuch, D.J. Stream Reach Inventory and Channel Stability Evaluation; USDA Forest Service, Northern Region, Intermountain Forest and Range Experiment Station: Ogden, UT, USA, 1975; p. 26.
  62. Death, R.G.; Winterbourn, M.J. Diversity patterns in stream benthic invertebrate communities: The influence of habitat stability. Ecology 1995, 76, 1446–1460. [Google Scholar] [CrossRef]
  63. Rosgen, D. A Watershed Assessment for River Stability and Sediment Supply (WARSSS); Wildland Hydrology: Fort Collins, CO, USA, 2006. [Google Scholar]
  64. Schwendel, A.C.; Death, R.G.; Fuller, I.C.; Joy, M.K. Linking disturbance and stream invertebrate communities: How best to measure bed stability. J. North Am. Benthol. Soc. 2011, 30, 11–24. [Google Scholar] [CrossRef]
  65. Rutherford, J.C.; Davies-Colley, R.J.; Quinn, J.; Stroud, M.J.; Cooper, A.B. Stream Shade: Towards a Restoration Strategy; National Institute of Water & Atmospheric Research Ltd.: Hamilton, New Zealand, 1997. [Google Scholar]
  66. Clews, E.; Vaughan, I.P.; Ormerod, S.J. Evaluating the effects of riparian restoration on a temperate river-system using standardized habitat survey. Aquat. Conserv. Mar. Freshw. Ecosyst. 2010, 20, S96–S104. [Google Scholar] [CrossRef]
  67. Quinn, J.M.; Cooper, A.B.; Stroud, M.J.; Burrell, G.P. Shade effects on stream periphyton and invertebrates: An experiment in streamside channels. N. Zeal. J. Mar. Freshw. Res. 1997, 31, 665–683. [Google Scholar] [CrossRef] [Green Version]
  68. Collins, K.E.; Febria, C.M.; Warburton, H.J.; Devlin, H.S.; Hogsden, K.L.; Goeller, B.C.; McIntosh, A.R.; Harding, J.S. Evaluating practical macrophyte control tools on small agricultural waterways in Canterbury, New Zealand. N. Zeal. J. Mar. Freshw. Res. 2019, 53, 182–200. [Google Scholar] [CrossRef]
  69. Burrell, T.K.; O’Brien, J.M.; Graham, S.E.; Simon, K.S.; Harding, J.S.; McIntosh, A.R. Riparian shading mitigates stream eutrophication in agricultural catchments. Freshw. Sci. 2013, 33, 73–84. [Google Scholar] [CrossRef]
  70. Rixen, T.; Baum, A.; Sepryani, H.; Pohlmann, T.; Jose, C.; Samiaji, J. Dissolved oxygen and its response to eutrophication in a tropical black water river. J. Environ. Manag. 2010, 91, 1730–1737. [Google Scholar] [CrossRef]
  71. Jacobsen, D.; Rostgaard, S.; Vásconez, J.J. Are macroinvertebrates in high altitude streams affected by oxygen deficiency? Freshw. Biol. 2003, 48, 2025–2032. [Google Scholar] [CrossRef]
  72. Bray, J.P.; Kilroy, C.; Gerbeaux, P.; Burdon, F.J.; Harding, J.S. Ecological processes mediate the effects of the invasive bloom-forming diatom Didymosphenia geminata on stream algal and invertebrate assemblages. Hydrobiologia 2020, 847, 177–190. [Google Scholar] [CrossRef]
  73. Palmer, M.A.; Lettenmaier, D.P.; Poff, N.L.; Postel, S.L.; Richter, B.; Warner, R. Climate change and river ecosystems: Protection and adaptation options. Environ. Manag. 2009, 44, 1053–1068. [Google Scholar] [CrossRef]
  74. Thomas, S.M.; Griffiths, S.W.; Ormerod, S.J. Beyond cool: Adapting upland streams for climate change using riparian woodlands. Glob. Chang. Biol. 2016, 22, 310–324. [Google Scholar] [CrossRef] [Green Version]
  75. Salo, T.; Stamm, C.; Burdon, F.J.; Räsänen, K.; Seppälä, O. Resilience to heat waves in the aquatic snail Lymnaea stagnalis: Additive and interactive effects with micropollutants. Freshw. Biol. 2017, 62, 1831–1846. [Google Scholar] [CrossRef]
  76. Broadmeadow, S.B.; Jones, J.G.; Langford, T.E.L.; Shaw, P.J.; Nisbet, T.R. The influence of riparian shade on lowland stream water temperatures in southern England and their viability for brown trout. River Res. Appl. 2011, 27, 226–237. [Google Scholar] [CrossRef]
  77. Battin, J.; Wiley, M.W.; Ruckelshaus, M.H.; Palmer, R.N.; Korb, E.; Bartz, K.K.; Imaki, H. Projected impacts of climate change on salmon habitat restoration. Proc. Natl. Acad. Sci. USA 2007, 104, 6720. [Google Scholar] [CrossRef] [PubMed] [Green Version]
  78. Johnson, R.K.; Almlöf, K. Adapting boreal streams to climate change: Effects of riparian vegetation on water temperature and biological assemblages. Freshw. Sci. 2016, 35, 984–997. [Google Scholar] [CrossRef]
  79. Kristensen, P.B.; Kristensen, E.A.; Riis, T.; Baisner, A.J.; Larsen, S.E.; Verdonschot, P.F.M.; Baattrup-Pedersen, A. Riparian forest as a management tool for moderating future thermal conditions of lowland temperate streams. Hydrol. Earth Syst. Sci. Discuss. 2013, 10, 6081–6106. [Google Scholar] [CrossRef]
  80. Göthe, E.; Degerman, E.; Sandin, L.; Segersten, J.; Tamario, C.; Mckie, B.G. Flow restoration and the impacts of multiple stressors on fish communities in regulated rivers. J. Appl. Ecol. 2019, 56, 1687–1702. [Google Scholar] [CrossRef]
  81. Niyogi, D.K.; Koren, M.; Arbuckle, C.J.; Townsend, C.R. Stream communities along a catchment land-use gradient: Subsidy-stress responses to pastoral development. Environ. Manag. 2007, 39, 213–225. [Google Scholar] [CrossRef]
  82. Odum, E.P.; Finn, J.T.; Eldon, H.F. Perturbation theory and the subsidy-stress gradient. BioScience 1979, 29, 349–352. [Google Scholar] [CrossRef]
  83. Jacobsen, D.; Friberg, N. Macroinvertebrate Communities in Danish Streams—The Effect of Riparian Forest Cover. In Freshwater Biology: Priorities and Development in Danish Research; Sand-Jensen, K., Pedersen, O., Eds.; Gad: Copenhagen, Denmark, 1997; pp. 208–222. [Google Scholar]
  84. Stutter, M.I.; Chardon, W.J.; Kronvang, B. Riparian buffer strips as a multifunctional management tool in agricultural landscapes: Introduction. J. Environ. Qual. 2012, 41, 297–303. [Google Scholar] [CrossRef] [Green Version]
Figure 1. Map of Europe showing the locations of the four case-study basins used in the CROSSLINK project: (1) Sweden (forested and agricultural stream reaches in the Lake Mälaren basin), (2) Belgium (forested, agricultural and urban reaches in the Zwalm river basin), (3) Norway (forested and urban stream reaches in the Oslo Fjord basin), and (4) Romania (forested and agricultural reaches in the Argeş river basin).
Water 12 01178 g001
Figure 2. Mean values (± 95% CI) of the Riparian Condition Index for site types in the CROSSLINK project (including sites in Norway, Sweden, Belgium, and Romania). “Matrix” refers to sites that were typically located further downstream in our catchment landscape matrices (i.e., the portion of the heterogeneous landscape in which stream-riparian segments are “embedded”).
Water 12 01178 g002
Figure 3. Unconstrained ordination (non-metric multidimensional scaling) of values for each attribute used in the Riparian Condition Index for the four site types used in the CROSSLINK project. This plot include data from sites in Norway, Sweden, Belgium, and Romania.
Water 12 01178 g003
Figure 4. Mean log response ratios (±95% CI) showing the change between downstream sites buffered with woody riparian vegetation (i.e., forested) and upstream sites without this type of buffer for each attribute used in the Riparian Condition Index. This plot include data from sites in Norway, Sweden, Belgium, and Romania.
Water 12 01178 g004
Figure 5. Mean log response ratios (±95% CI) for each CROSSLINK case-study basin. These effect sizes show the change between downstream sites buffered with woody riparian vegetation (i.e., forested) and upstream sites without this type of buffer for each attribute used in the Riparian Condition Index.
Water 12 01178 g005
Figure 6. Plot A shows the association of the Riparian Condition Index with a commonly used stream macroinvertebrate indicator, the Average Score Per Taxon (ASPT) index. Outlier sites in grey indicate “reference” forested sites in Sweden which went dry in the summer prior to macroinvertebrate sampling, potentially explaining lower than expected values for the ASPT. Plots B and C show the individual strength of the riparian “magnitude of transition” and the “environmental context” hypotheses after accounting for other influences across our four case-study basins. These analyses use the log response ratio for the Average Score Per Taxon index score at paired sites as the response variable (ΔASPT). The riparian “magnitude of transition” predictor uses the log response ratio for the Riparian Condition Index at paired sites (ΔRCI). The “environment context” predictor (PC1) is the Axis 1 sites scores from a PCA explaining 37% variation in catchment-wide human impacts (i.e., indicating the level of upstream degradation). See Table 4 for results from mixed models testing these responses.
Water 12 01178 g006
Figure 7. At paired sites across our four case-study basins, the size of the improvement in stream ecological status (ΔASPT) was positively associated with an interaction between the magnitude of the improvement in riparian condition (ΔRCI) and level of upstream human impacts (PC1). The result in this figure (see also Table 4) suggests that the riparian “magnitude of transition” effect on ΔASPT is dependent on the “environment context” (PC1). PC1 explains 37% variation in catchment-wide human impacts (i.e., indicating the level of upstream degradation).
Water 12 01178 g007
Table 1. Glossary of key terms related to the CROSSLINK project.
TermDefinition
BiodivERsABiodivERsA is a network of national and regional funding organizations promoting pan-European research on biodiversity and ecosystem services, funded under the Horizon 2020 European Research Area (ERA-NET) COFUND scheme.
CROSSLINKThe full title of the CROSSLINK project is “Understanding cross-habitat linkages between blue and green infrastructure to optimize management of biodiversity, ecosystem services and multiple human uses.” The CROSSLINK project is funded under the 2015 pan-European BiodivErSA call for international research projects on “Promoting synergies and reducing trade-offs between food supply, biodiversity and ecosystem services.” Specifically, CROSSLINK addresses the theme “Understanding and managing biodiversity dynamics in land-, river- and seascapes (habitat connectivity, green and blue infrastructures, and naturing cities) to improve ecosystem functioning and delivery of ecosystem services.”
Blue-green infrastructure (BGI)The concept of blue-green infrastructure emphasizes the importance of both “blue” (water) and “green” (vegetation) and the interaction between them [44]. The word infrastructure underscores the need for these different elements to be interlinked to work as a connected web of measures [45]. Elements of BGI are nature-based solutions that deliver multiple co-benefits to impacted environments such as urban (“grey”) cityscapes; benefits include water supply, flood mitigation, terrestrial biodiversity, cooling and climate change resilience, and human well-being [46,47,48].
Nature-based solution (NBS)Nature-based solutions are “living solutions inspired and supported by nature that simultaneously provide environmental, social and economic benefits and help build resilience” [21]. BGI can be NBS by providing natural ways to manage water resources and the environment [21]. The economic benefits of NBS have been promoted by the European Commission, as well as advocated by researchers [49].
Riparian bufferA riparian buffer is a vegetated area (a “buffer strip”) that helps to protect the stream from the impact of adjacent land uses [26]. A forested riparian buffer is a buffer strip dominated by woody vegetation, which in addition to helping protect the stream from human land-use impacts can also provide stream shading and crucial habitat diversity in fragmented landscapes.
Water Framework Directive (WFD)The European Water Framework Directive (2000/60/EC; WFD) is a policy statement that establishes a framework for water protection so that all waterbodies in Europe reach “good ecological status” by 2021 or 2027.
Table 2. Overview of ecosystem attributes and approaches used in the CROSSLINK project to describe the multiple ecological benefits of forested riparian buffers in human-impacted landscapes.
GroupResponseDescription
Environmental (Protocol S2)Water qualityGrab water samples and spot measurements for a wide range of water chemistry parameters
Thermal dynamicsSpot measurements and continuous logging of stream and riparian temperatures
Instream habitatTransect measurements of channel profiles and benthic habitat assessment
Hydromorphological impactsAssessment of human activities affecting hydrogeomorphic integrity
Riparian habitatAssessment of riparian condition and measurement of key habitat properties in six 50 m2 plots (Figure S3, Supplementary Materials)
Land useUse of CORINE land cover inventory to describe catchment land uses
Biodiversity (Protocol S3)MicrobialEnvironmental samples for microbial (e.g., bacterial) diversity from stream and riparian zone in effective sampling reach (ESR)
DiatomsSemi-quantitative sampling of benthic diatoms in ESR
MacroinvertebratesQuantitative sampling of aquatic macroinvertebrates in ESR
Riparian invertebratesSemi-quantitative sampling of terrestrial arachnids and predatory ground beetles in riparian plots
TreesRecording trees species and size (DBH) in riparian plots
Ecosystem functions (Protocol S4)Algal accrualMeasurement of periphyton biomass on standardized substrates in ESR
Sediment dynamicsMeasurement of near-bed organic and inorganic particulate accrual on standardized substrates in ESR
Organic-matter processingMeasuring stream and riparian organic-matter decomposition rates using litter bags and the cotton-strip assay
Carbon sequestrationUsing allometric scaling relationships to estimate tree biomass and carbon sequestration potential in riparian plots
Food webs (Protocol S5)Trophic diversityUse of stable isotopes (C and N) to describe community trophic niche breadths
Energy flowUsing Bayesian mixing models to estimate consumer diets based on stable isotope measurements of basal resources and prey
Trophic connectivityUse of fatty acid biomarkers (e.g., poly-unsaturated FAs) to describe trophic connectivity between stream and riparian food-web compartments
Societal needs (Protocol S6)Optimization frameworkApplying collected data as objective functions in an optimization framework to balance land-user needs with biodiversity and ecosystem benefits of forested riparian buffers
Table 3. Scores for riparian attributes used to calculate the Riparian Condition Index (RCI) (adapted for European conditions from Harding et al. [36]).
Attributes Score 1Score 2Score 3Score 4Score 5
Shading of water Little or no shading10%–25% shading25%–50%50%–80%>80%
Buffer width <1 m1–5 m5–15 m15–30 m>30 m
Buffer intactness Buffer absent50%–99% gaps20%–50% gaps1%–20% gapsCompletely intact
Vegetation comp. of buffer and/or adjacent land to 30 m from streambankBufferShort grazed pasture grasses to stream edge, or impervious surfacesWeedy shrubs or mainly long grasses 0.3–2 m or herbs/forbsDeciduous tree dominated; small tree dom. (2–5 m); or forest plantation with < 25% cover of > 5 m trees; or natural grassy veg.Regenerating forest or woodlot evergreens with > 25% cover sub-canopy (>5 m) trees but < 10% canopy trees (>12 m); or natural grassy veg.Maturing forest including >10% cover canopy trees (>12 m); or natural wetland or natural grassy vegetation
Adj. land
Bank stability Very low: uncohesive sediments and few roots and > 40% recently erodedLow: uncohesive sediments and few roots/low veg. cover and > 15%–40% recently erodedModerate: stabilized by geology (e.g., cobbles), veg. cover and/or roots and > 5%–15% recently erodedHigh: stabilized by geology (e.g., bedrock), veg. cover and/or roots; and 1%–5% recently erodedVery high: stabilized by geology (e.g., bedrock), veg. cover and/or roots; < 1% recently eroded
Livestock access High: unfenced and unmanaged with active livestock useModerate: some livestock accessLimited: unfenced but low stocking, bridges, troughs, natural deterrentsVery limited: temporary fencing of all livestock or naturally very limited accessNone: permanent fencing or no livestock
Riparian soil denitrification potential Soils dry/firm underfoot or moist–wet but frequent tile drains bypass riparian soils (≥3 per 100 m)1%–30% streambank soils moist but firm or moist-wet with infrequent bypass drains (1–2 per 100 m)≥30% streambank soils moist but firm underfoot. No drains.1%–30% streambank soils water-logged, soft underfoot with black soil. No drains.≥30% of streambanks water-logged, surface moist/fluid underfoot. No drains.
Land slope 0–30 m from stream bank >35°>20–35°>10–20°>5–10°0–5°
Groundcover of buffer and/or adjacent land to 30 m from streambankBufferBareShort/regularly grazed pasture (<3 cm)Pasture grasses or crops with bare flow paths or 2–3 cm tree litter layerModerate density grass or crops dense (>3 cm) tree litter layerHigh density long grasses or crops
Adj. land
Soil drainage Impervious (e.g., sealed) or extensively pugged and/or compacted soilLow permeability (e.g., high clay content) or moderately pugged/compacted soilLow-moderate permeability (e.g., silt/loam) and not pugged/compactedMod-high permeability (e.g., sandy loam) and not pugged/compactedVery high permeability (e.g., pumice/sand) and not pugged/compacted
Rills/channels Frequent rills (>9 per 100 m) or larger channels carry most runoffCommon rills (4–9 per 100 m) or 1–2 larger channels carry some runoffInfrequent rills (2–3 per 100 m) and no larger channelsRare rills (1 per 100 m) and no larger channelsNone
Table 4. Results from mixed models testing the influence of the Riparian Condition Index (RCI) on the macroinvertebrate Average Score Per Taxon (ASPT) index whilst controlling for catchment human impacts (PC1). The second model use log response ratios to describe the magnitude of change in the response (ΔASPT) and predictor (ΔRCI) variables between site-pairs (i.e., unbuffered upstream sites and downstream, buffered sites) whilst controlling for the existing level of ecological impairment (i.e., upstream PC1). PC1 is the Axis 1 sites scores from a Principal Components Analysis (PCA) explaining 37% variation in catchment-wide human impacts. CI, 95% confidence interval.
ResponsePredictorsEstimatesCIPMarginal R2Conditional R2
ASPT(Intercept)0.9970.497–1.498<0.0010.2780.887
log (RCI)0.1740.048–0.3000.007
PC1−0.267−0.365–−0.169<0.001
ΔASPT(Intercept)0.265−0.043–0.4300.0500.1400.467
ΔRCI−0.675−1.387–0.2060.093
PC1−0.177−0.268–0.0250.046
ΔRCI × PC10.531−0.035–0.9220.031

