Assessment of Flood Risk Exposure for the Foshan-Zhongshan Region in Guangdong Province, China


Abstract
1. Introduction
2. Materials and Methods
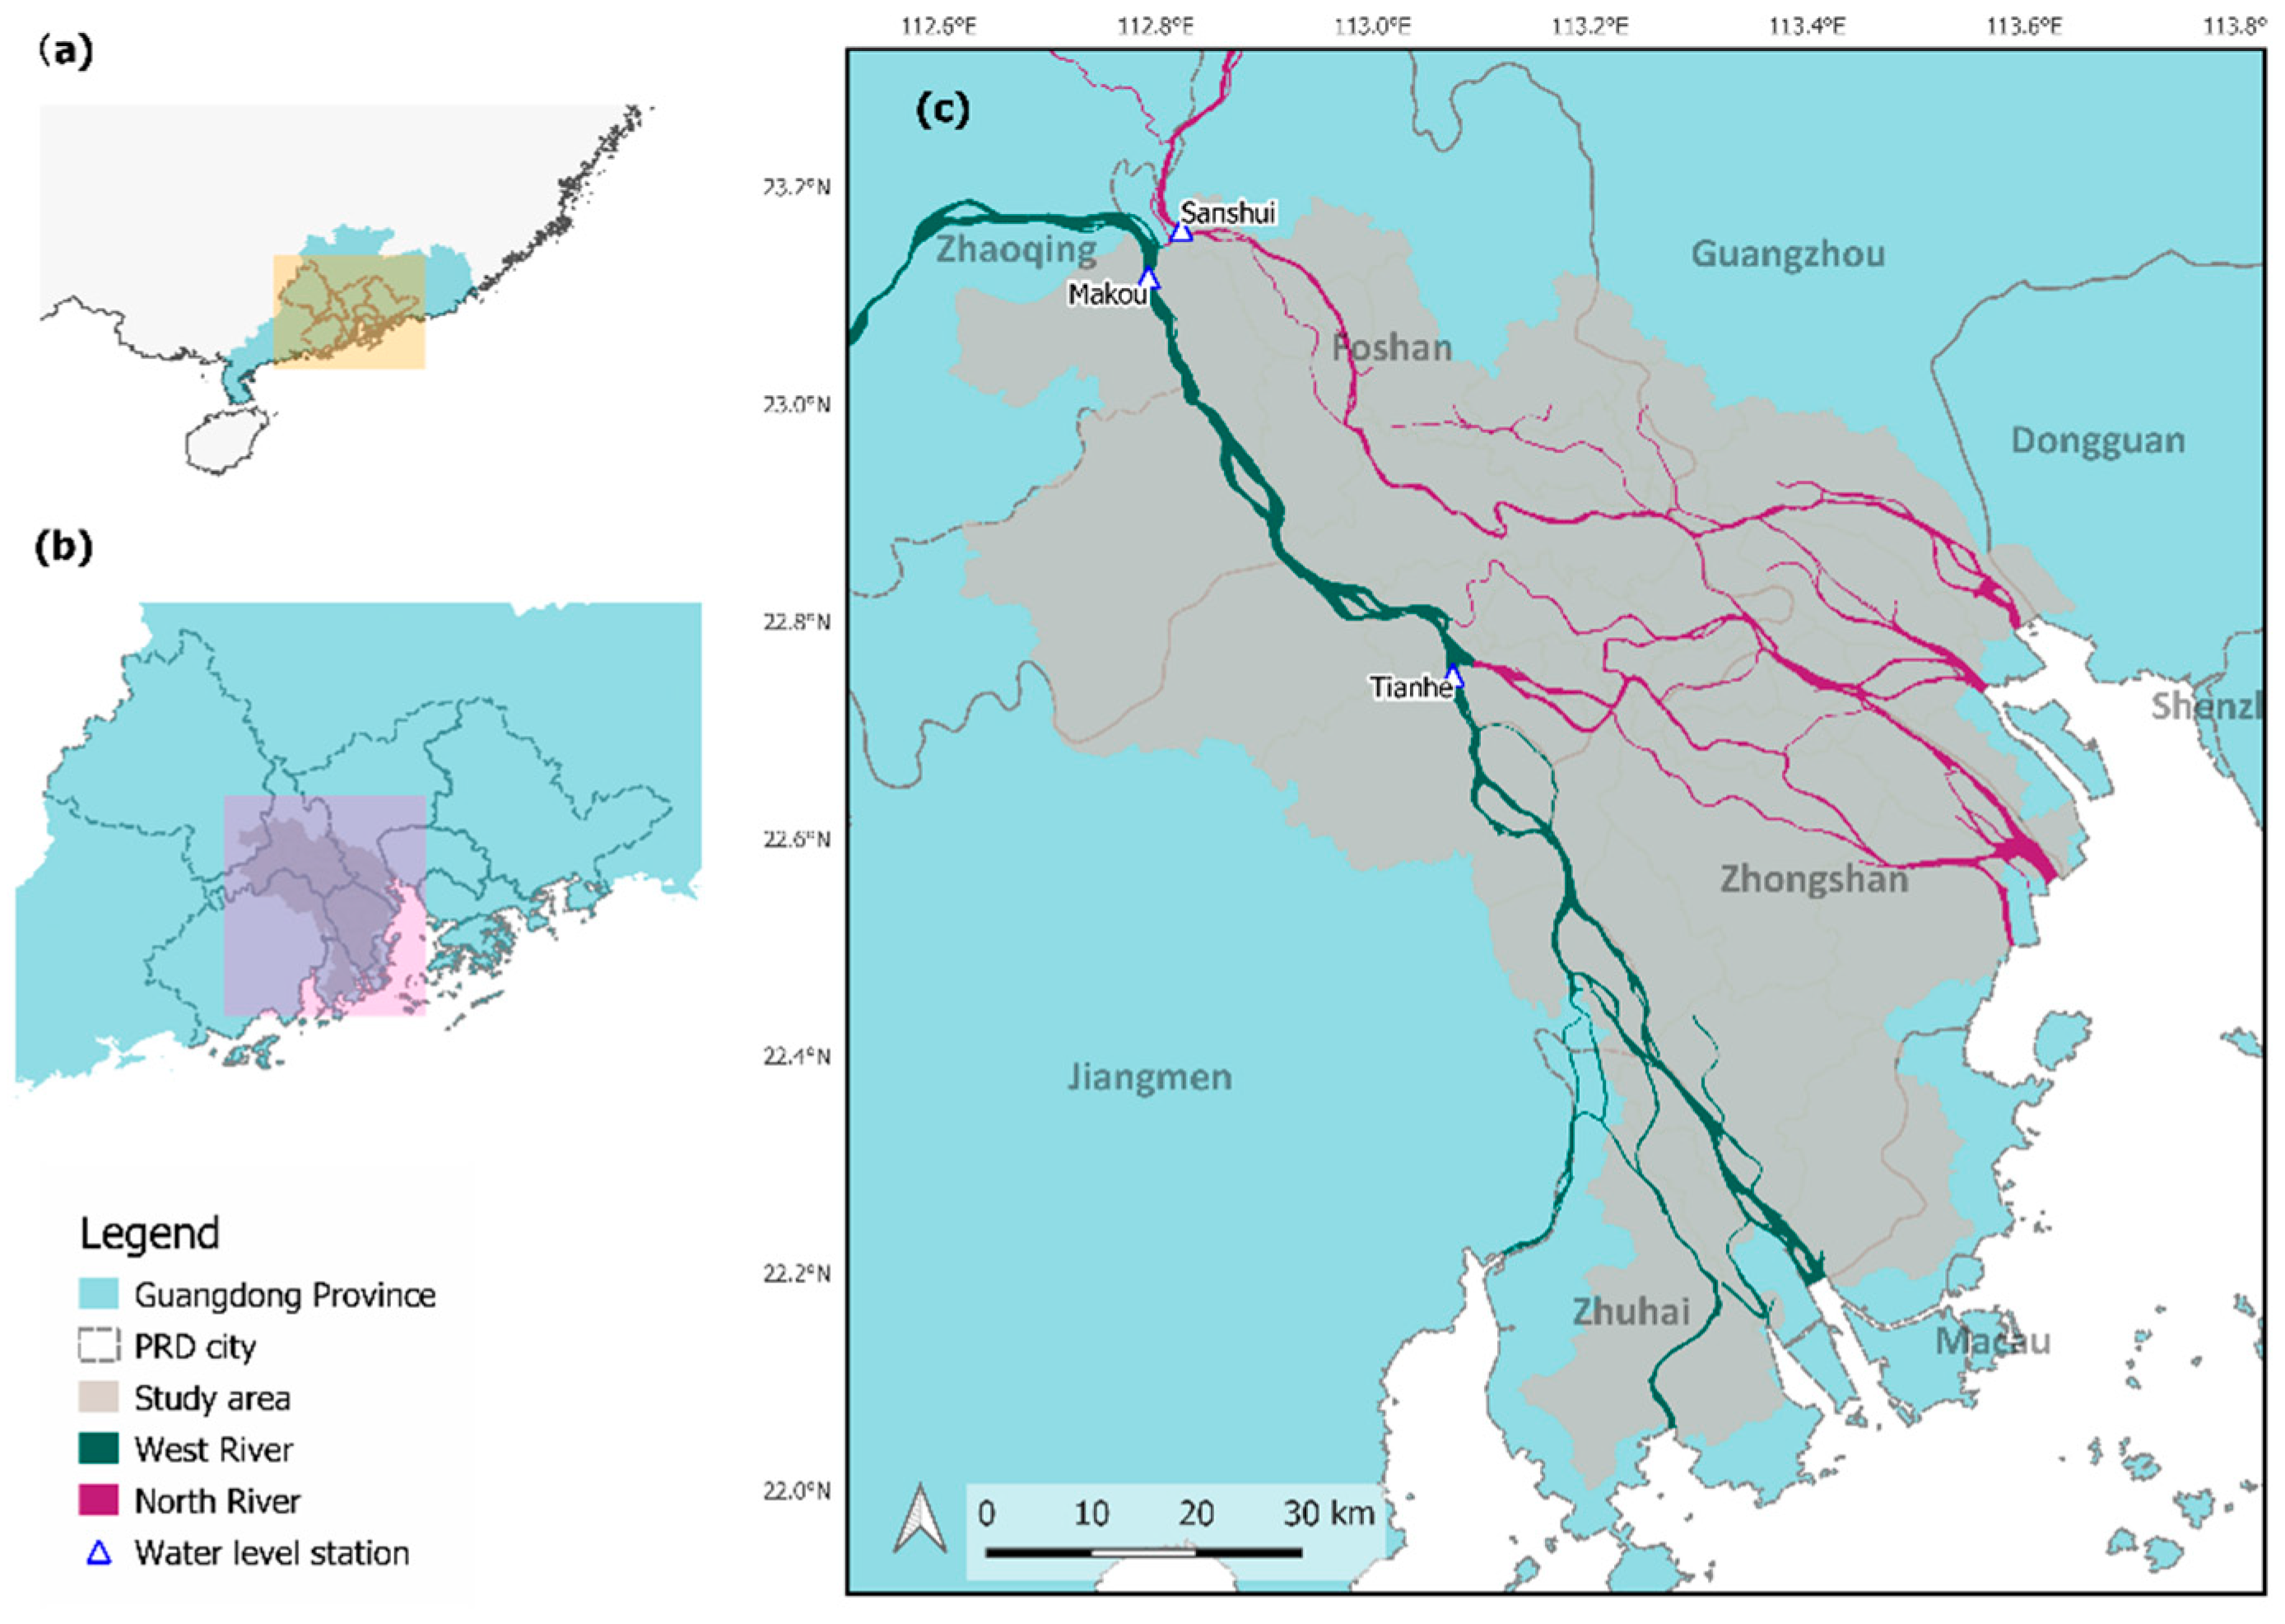
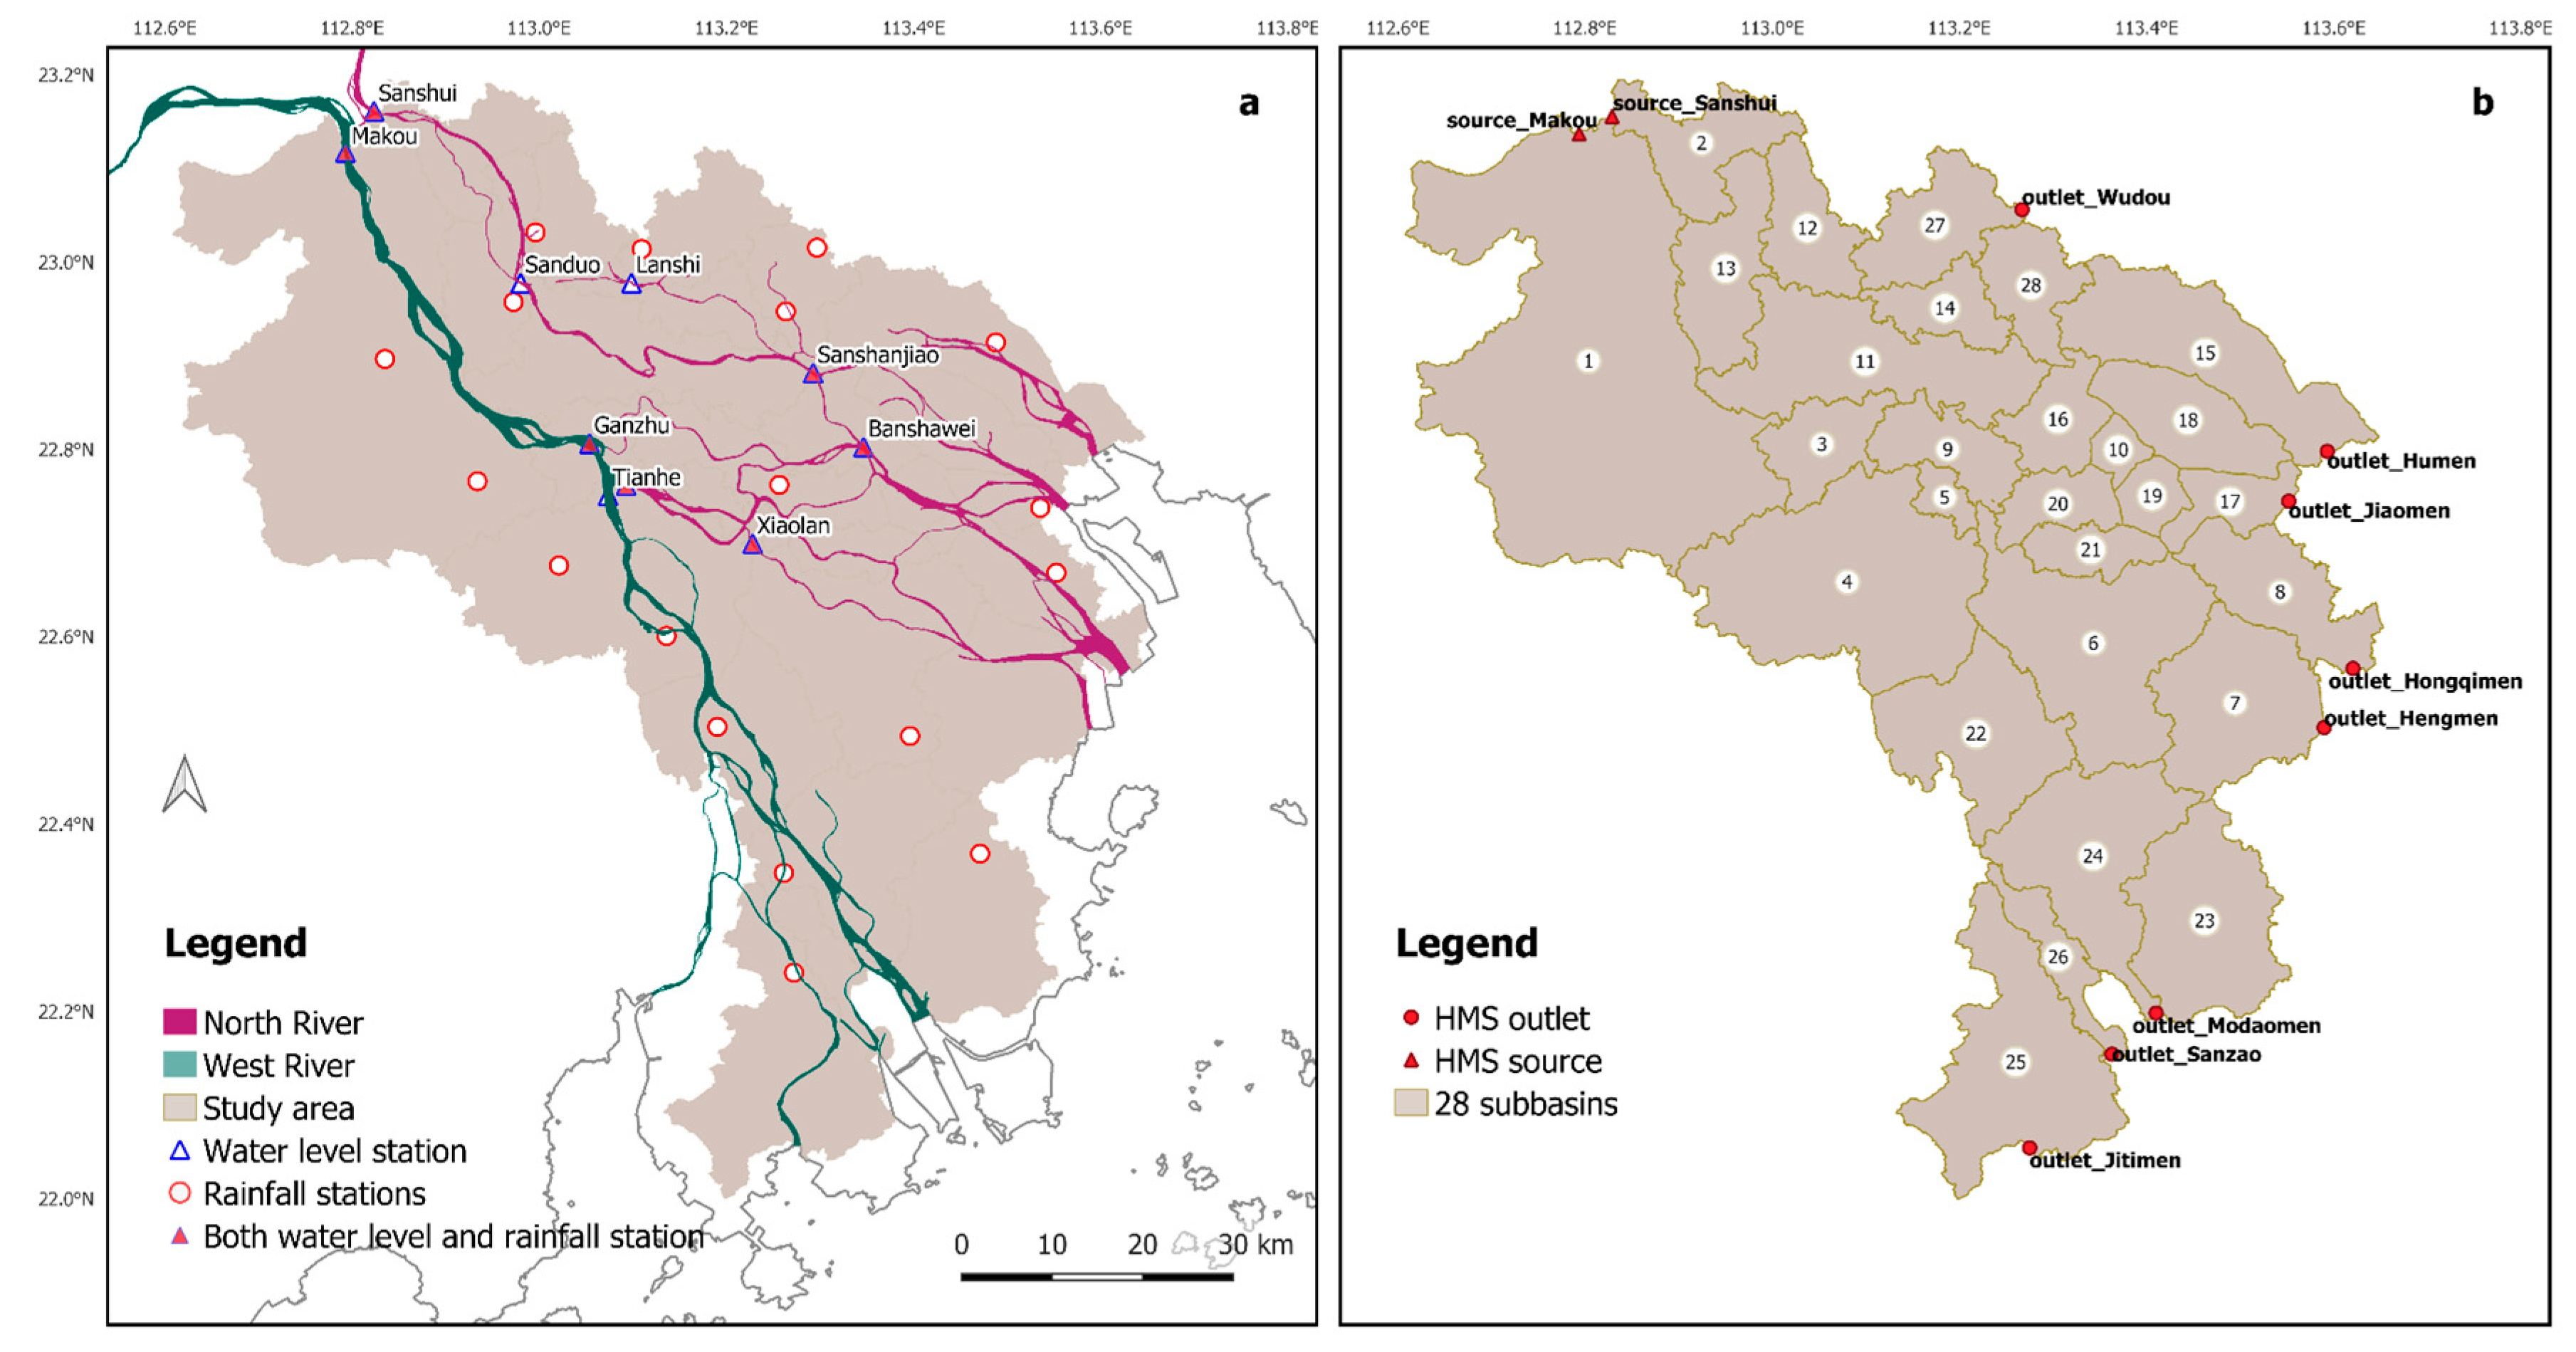
2.1. Study Area
2.2. Data
2.2.1. Meteorological and Hydrological Data
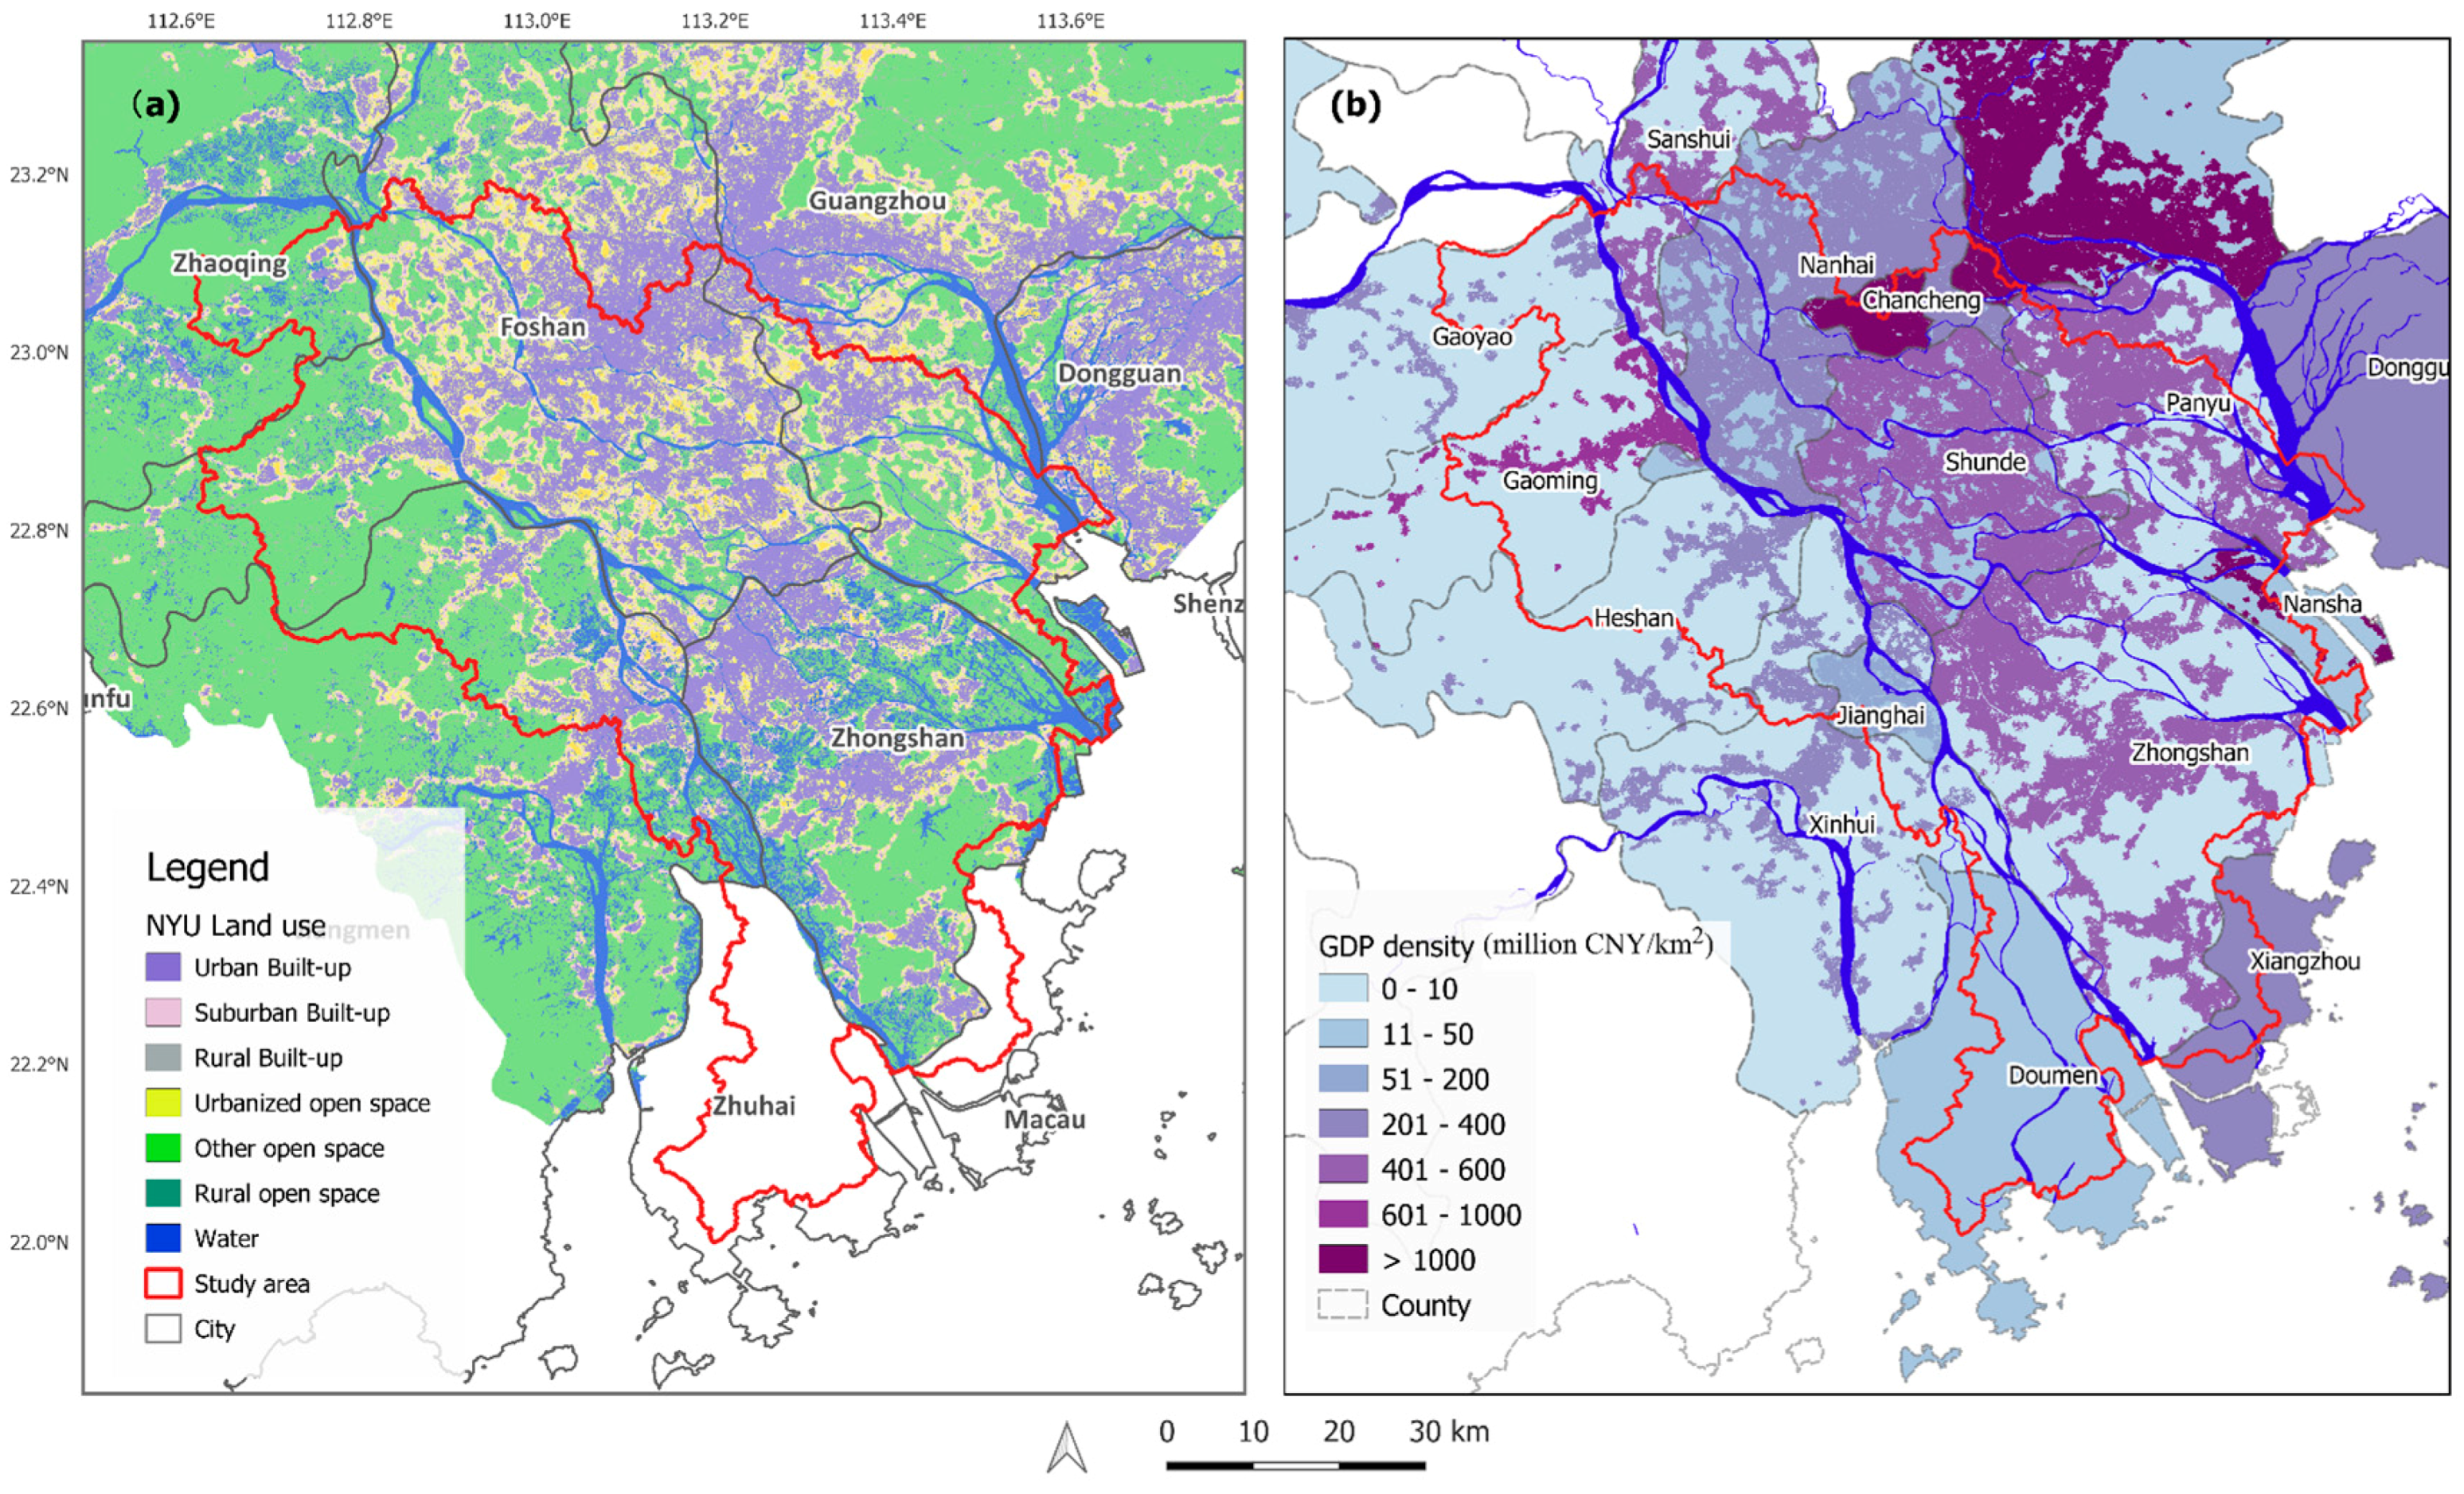
2.2.2. Topographical, Land Use and Land Cover Data
2.3. HEC-HMS Model
2.4. Estimation of the Inundation Extent
2.5. Evaluation of the GDP Exposure from Inundation
3. Results and Discussion
3.1. Historical Flood Events Reconstruction
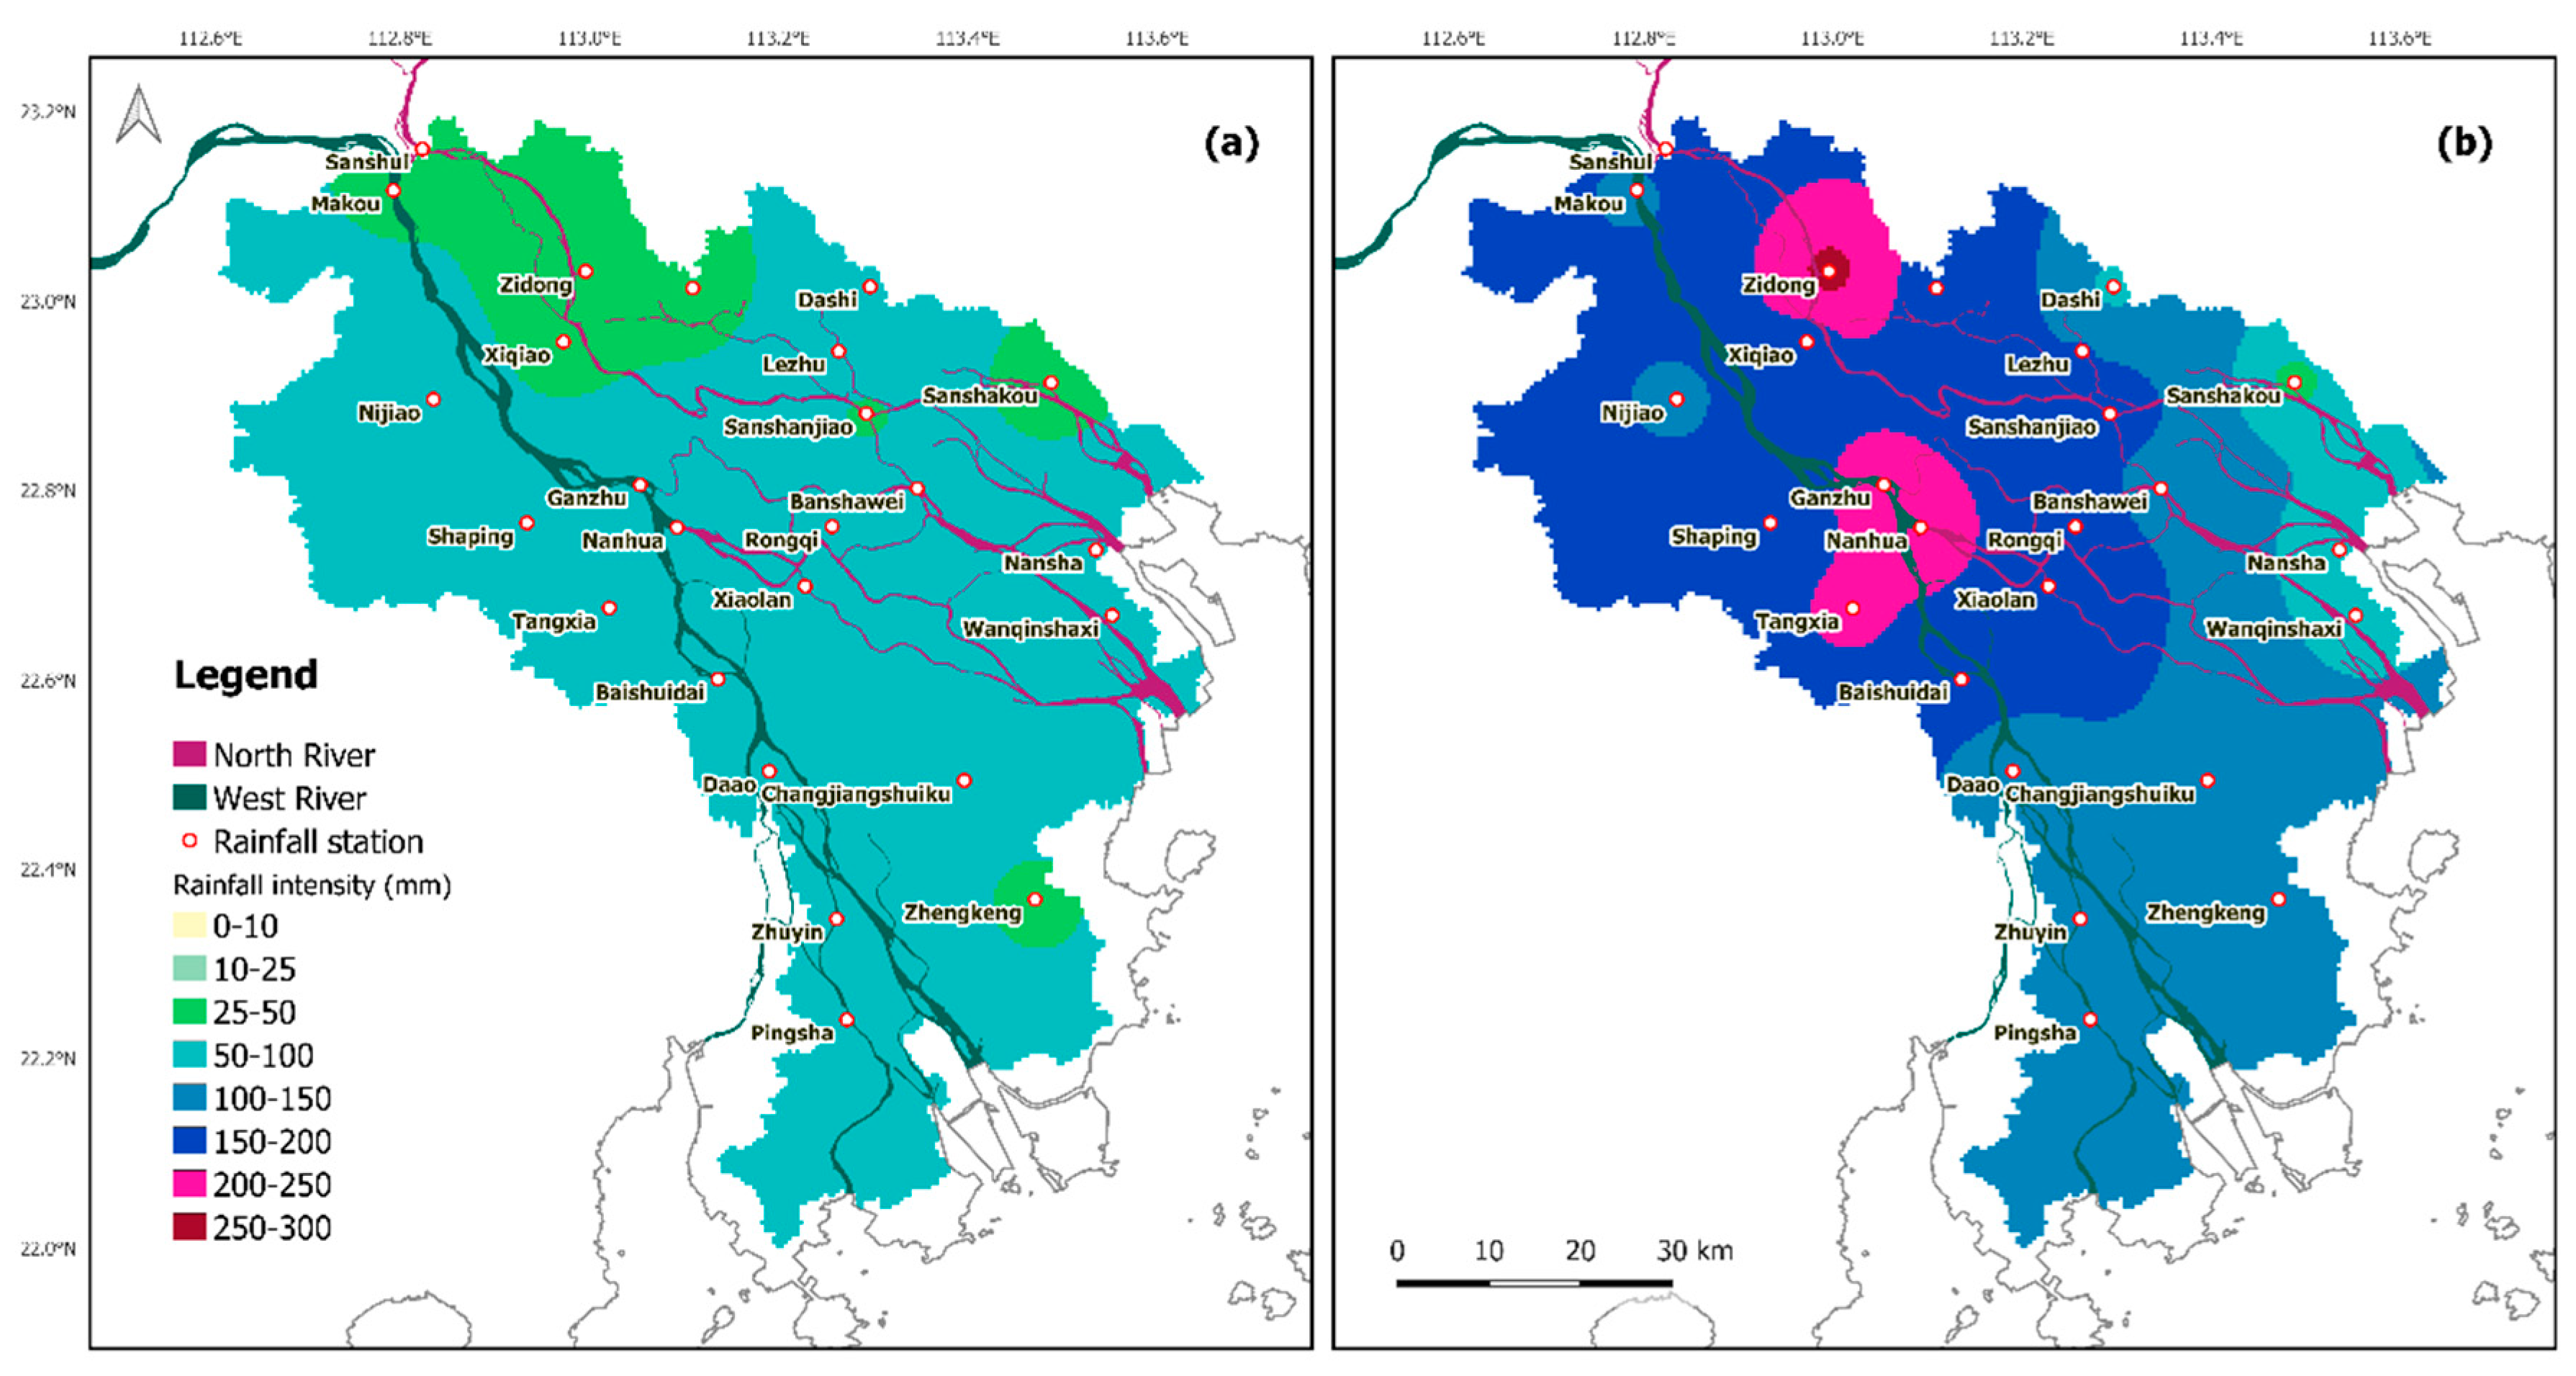
3.1.1. Meteorological and Hydrological Conditions
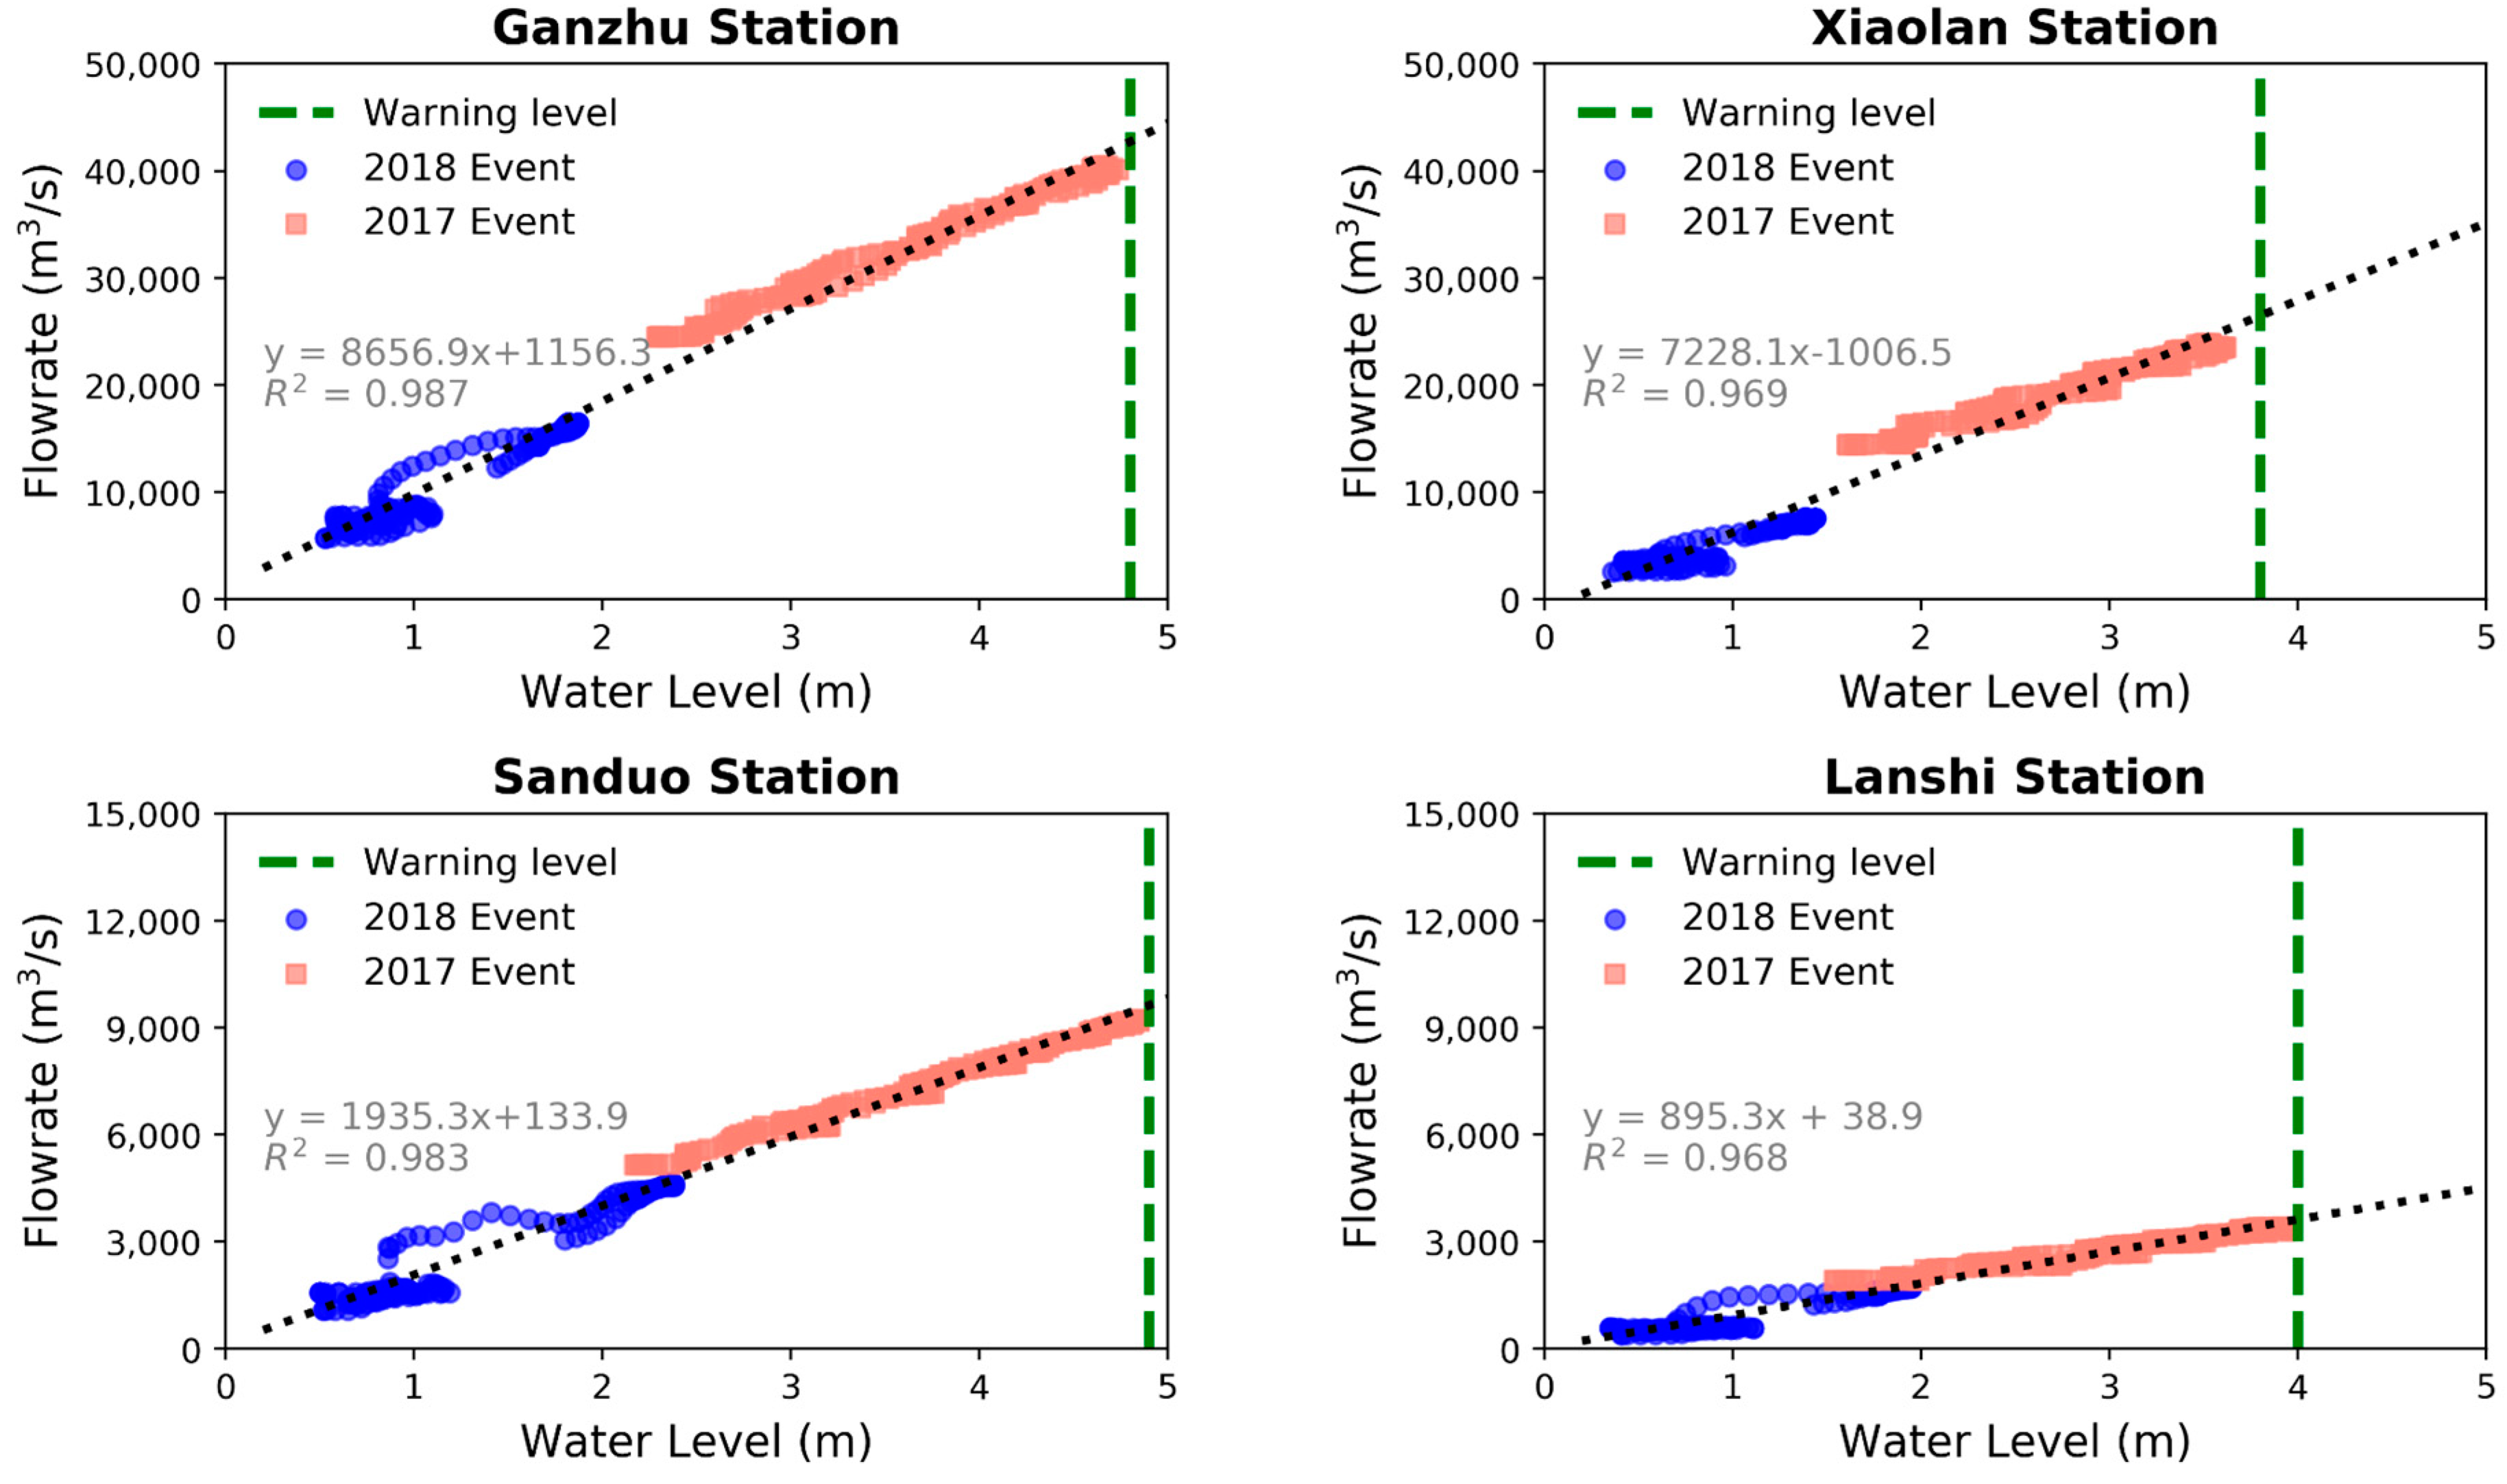
3.1.2. Rating Curves
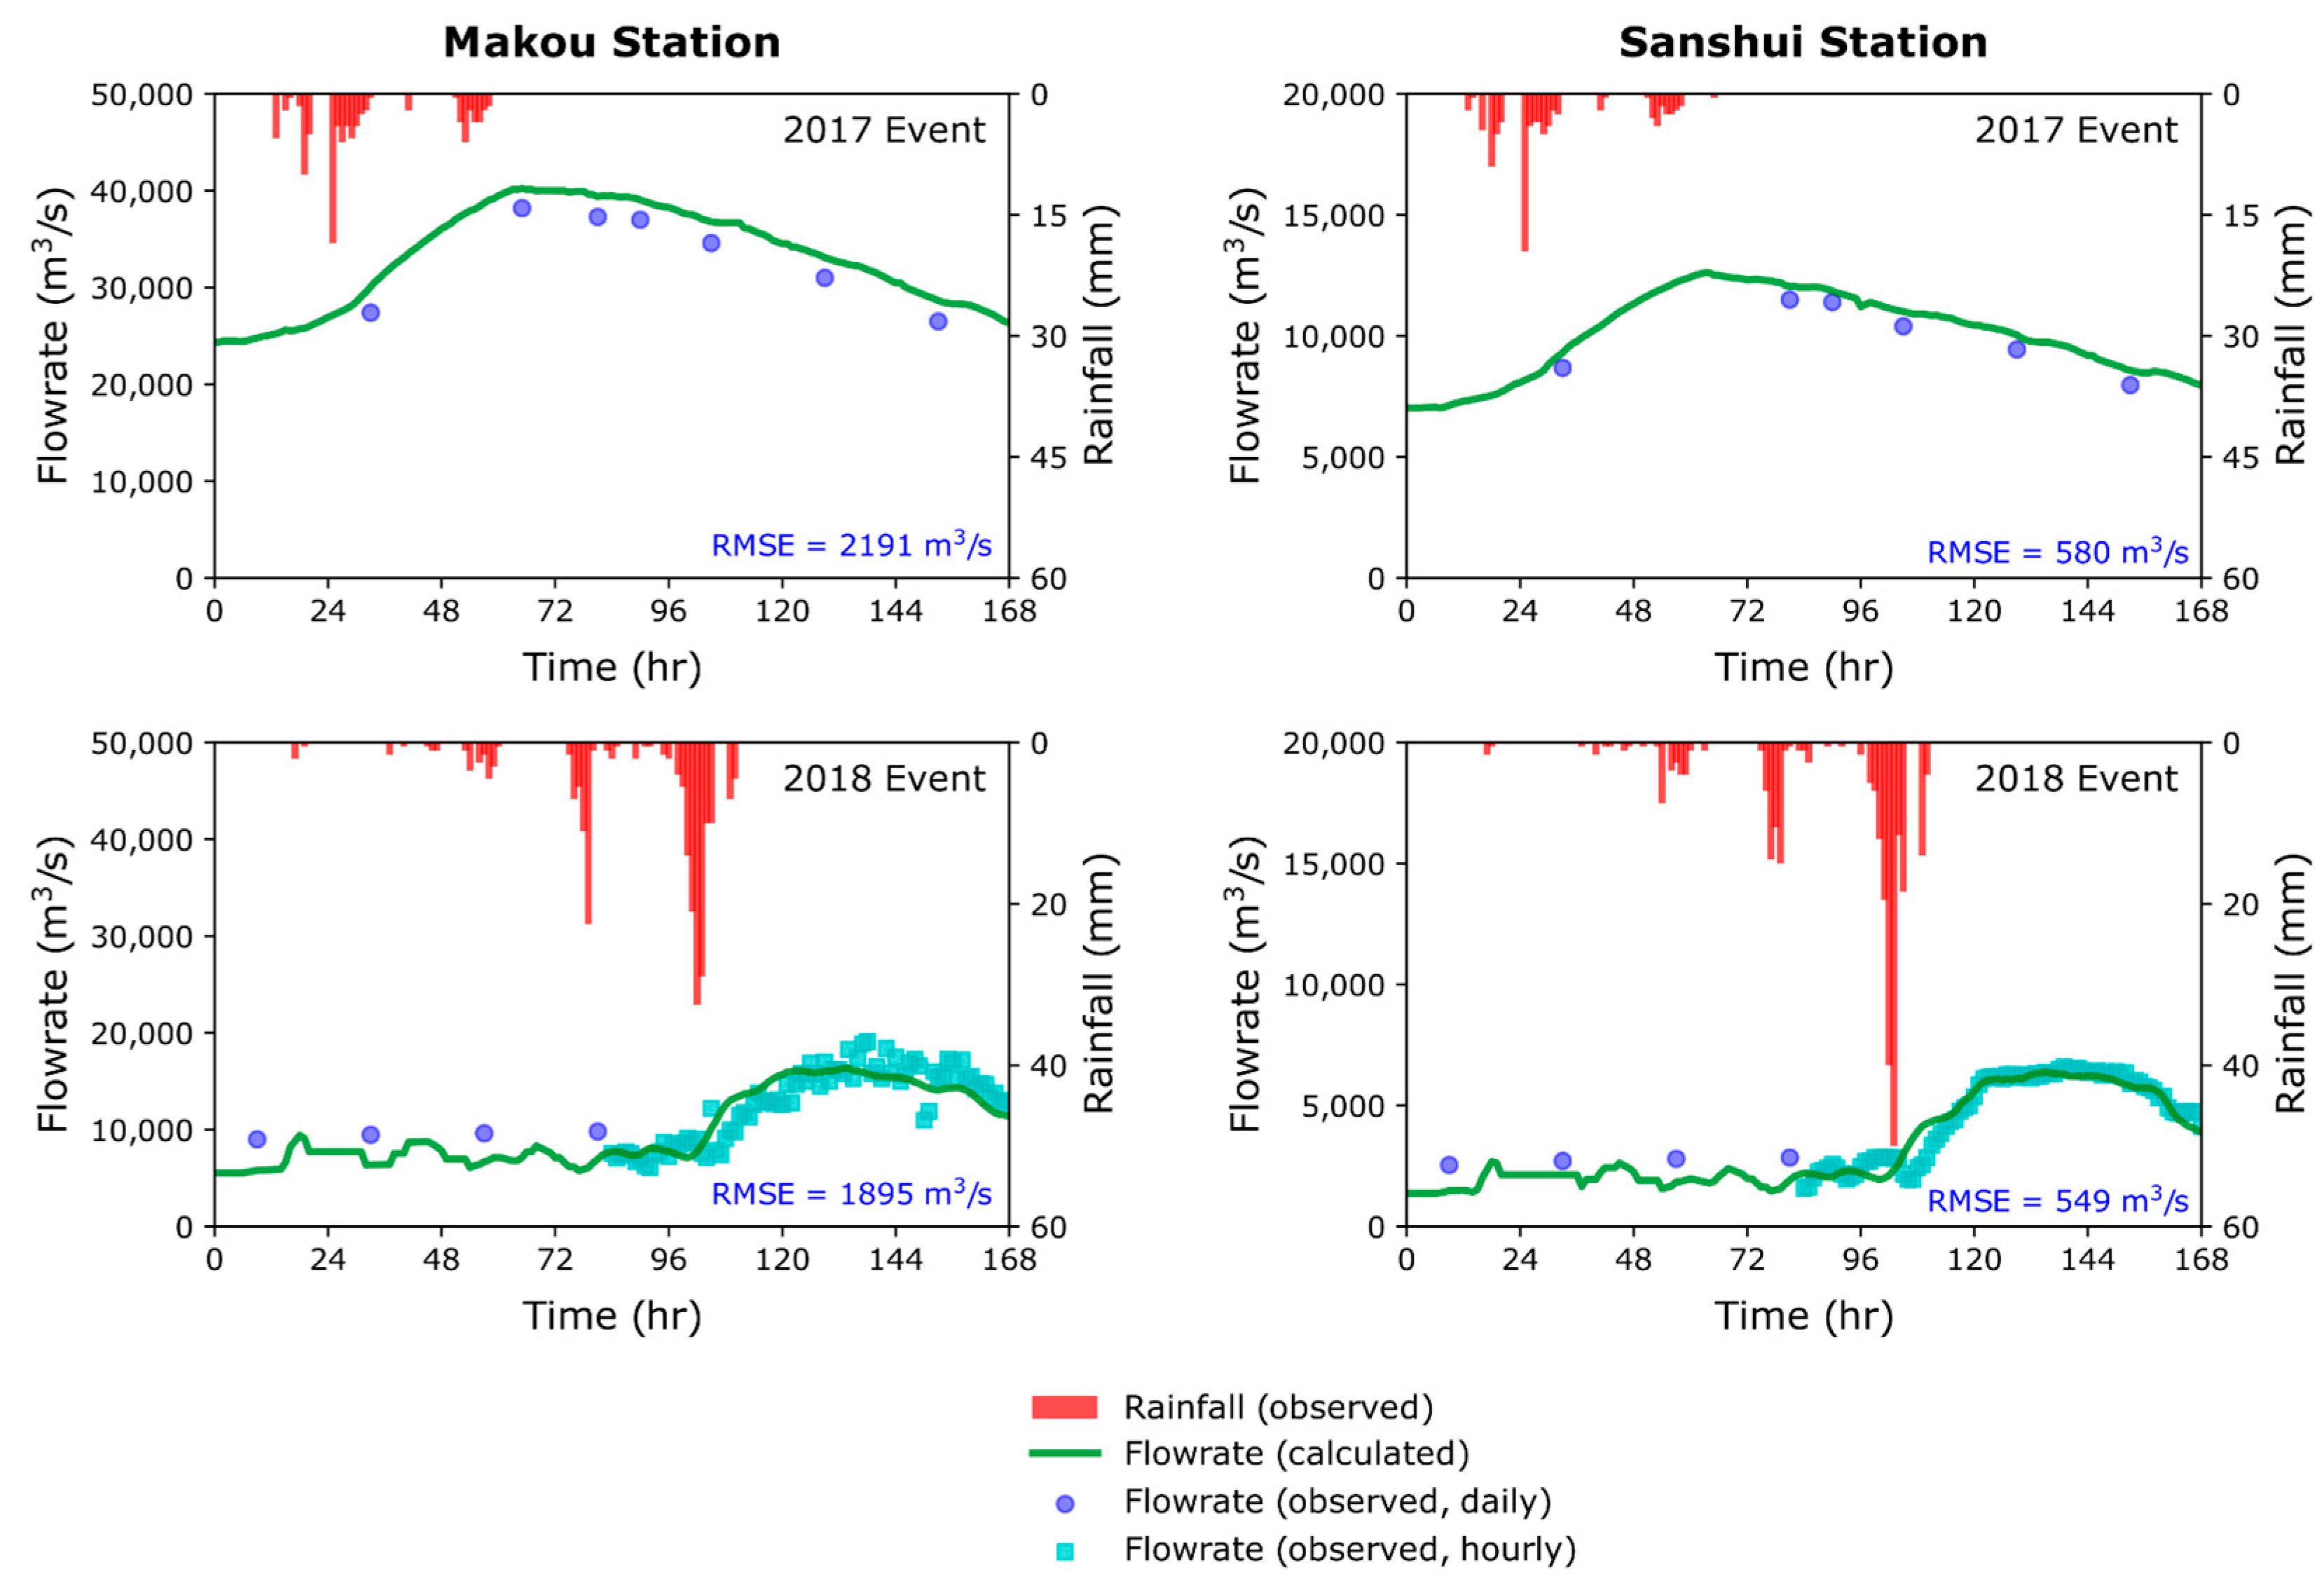
3.1.3. HEC-HMS Model Results
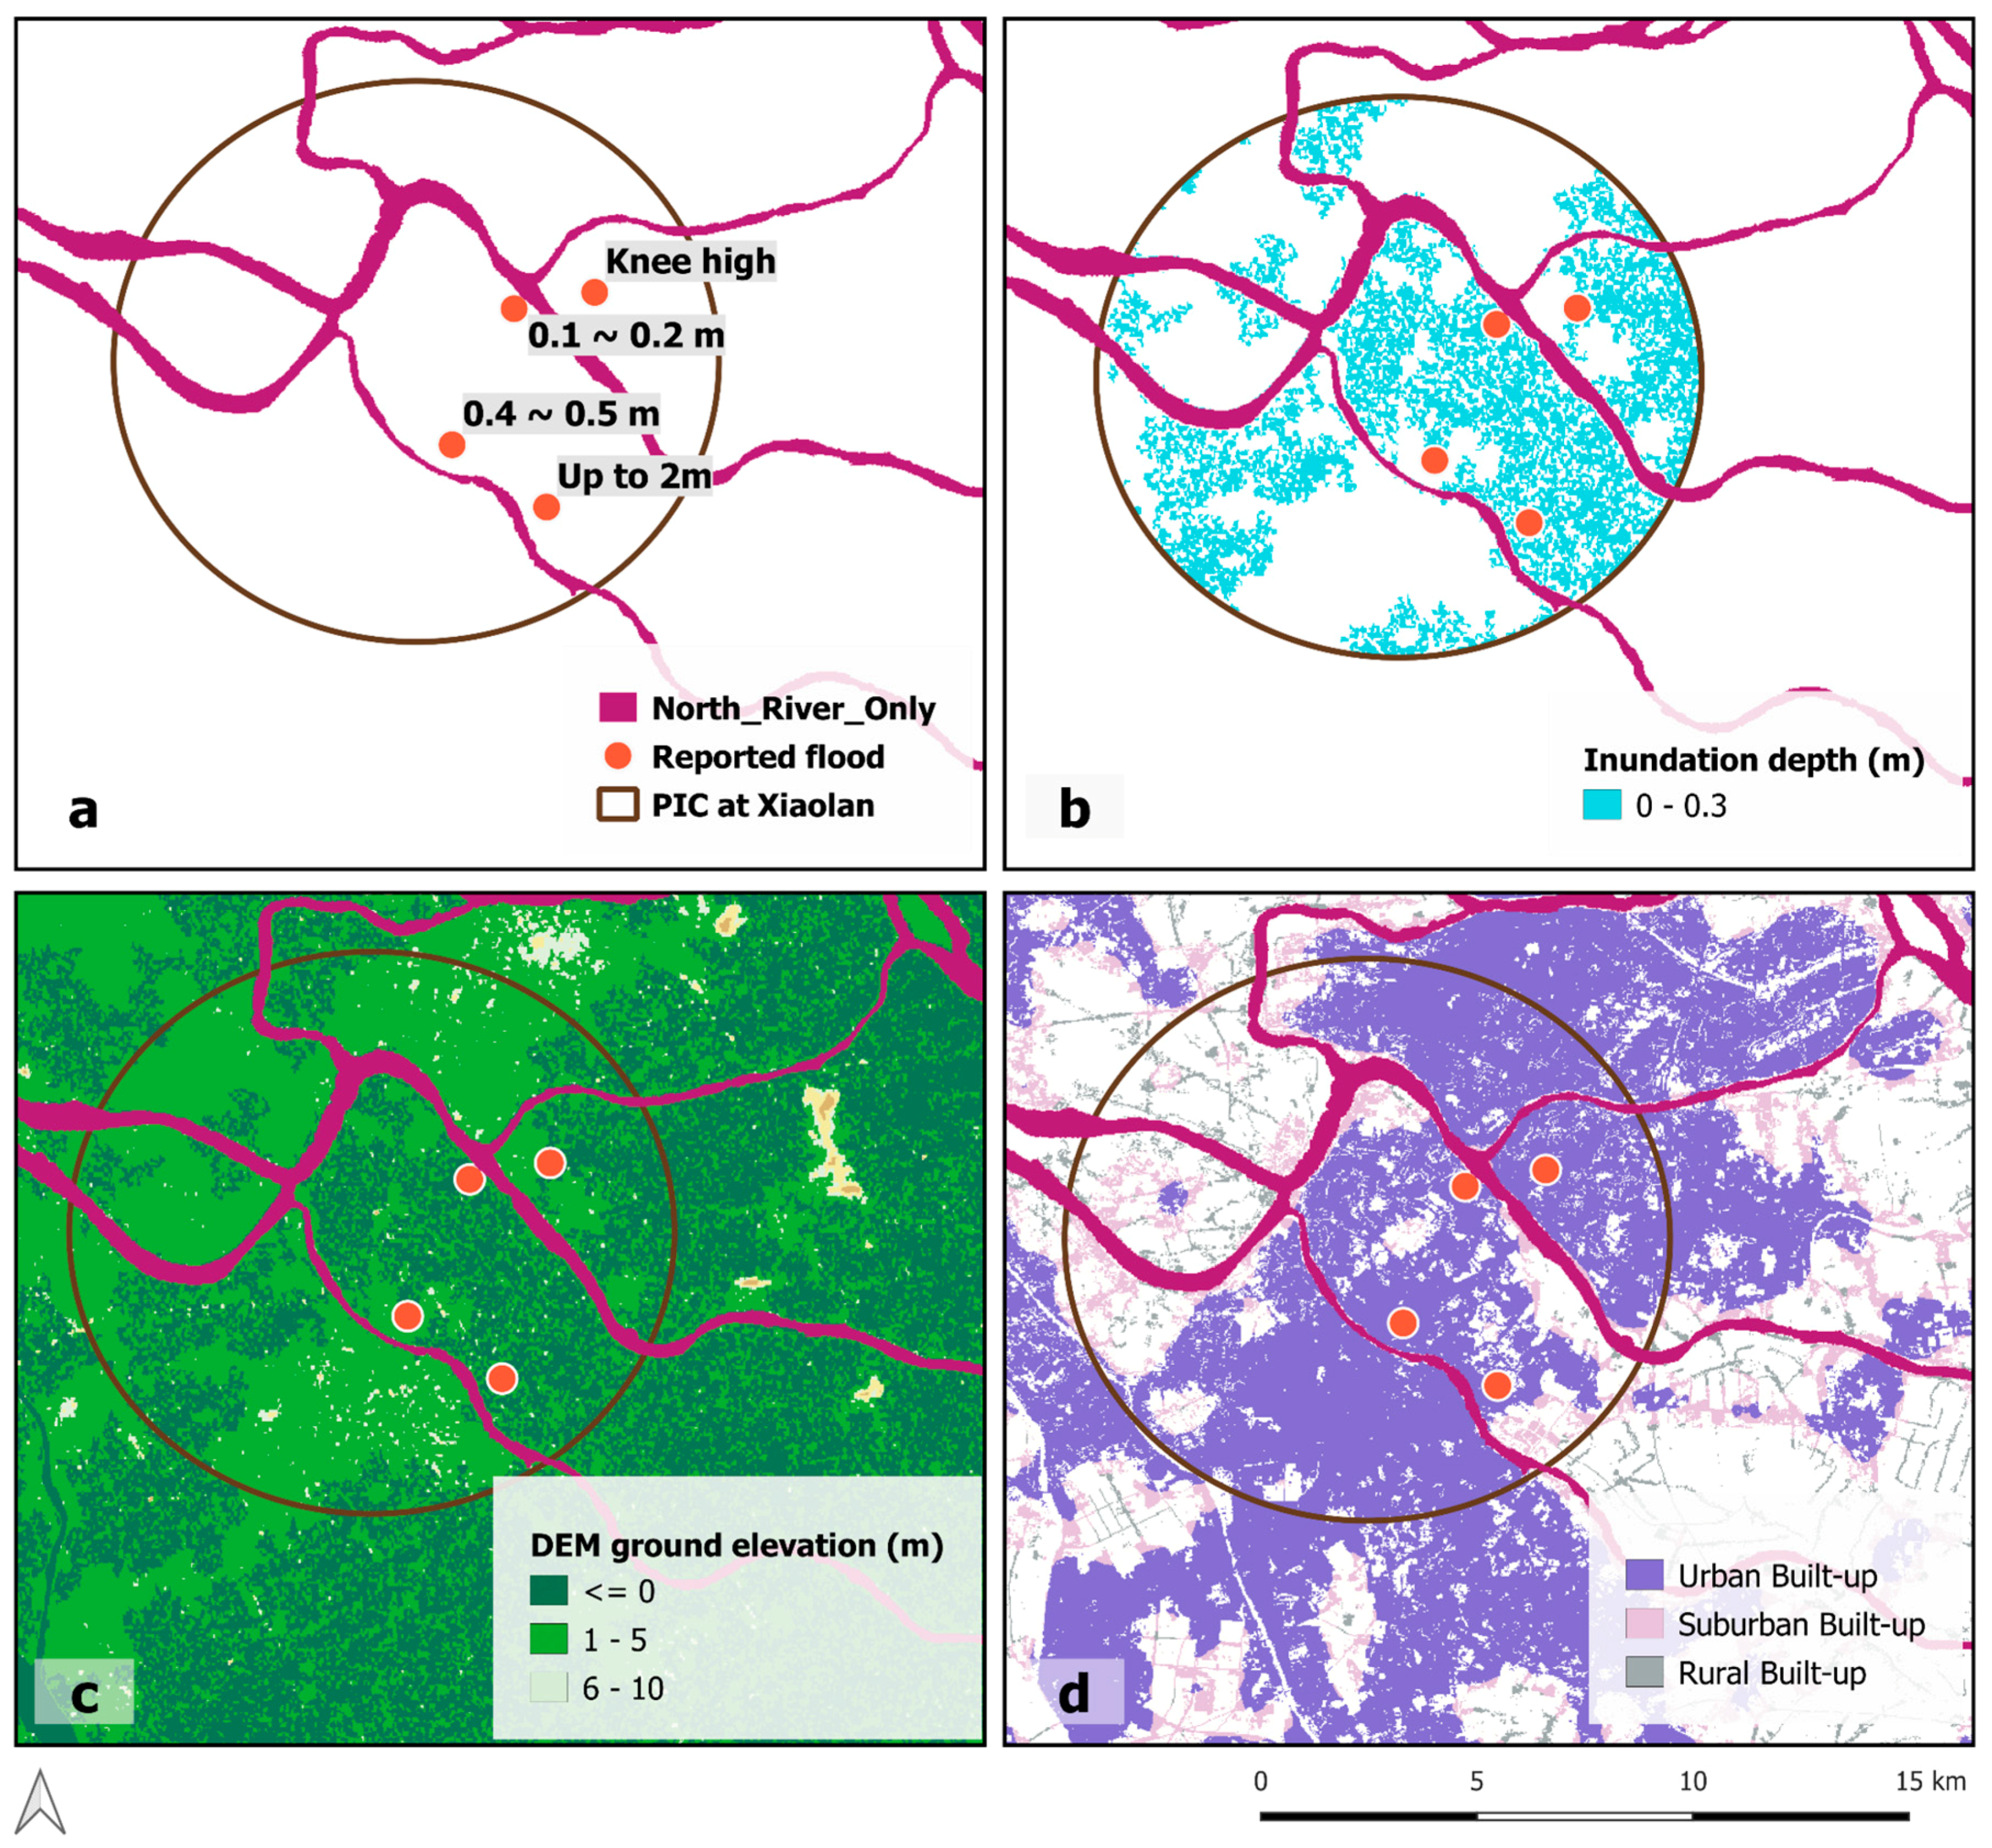
3.1.4. Inundation and Potential GDP Exposure at Risk
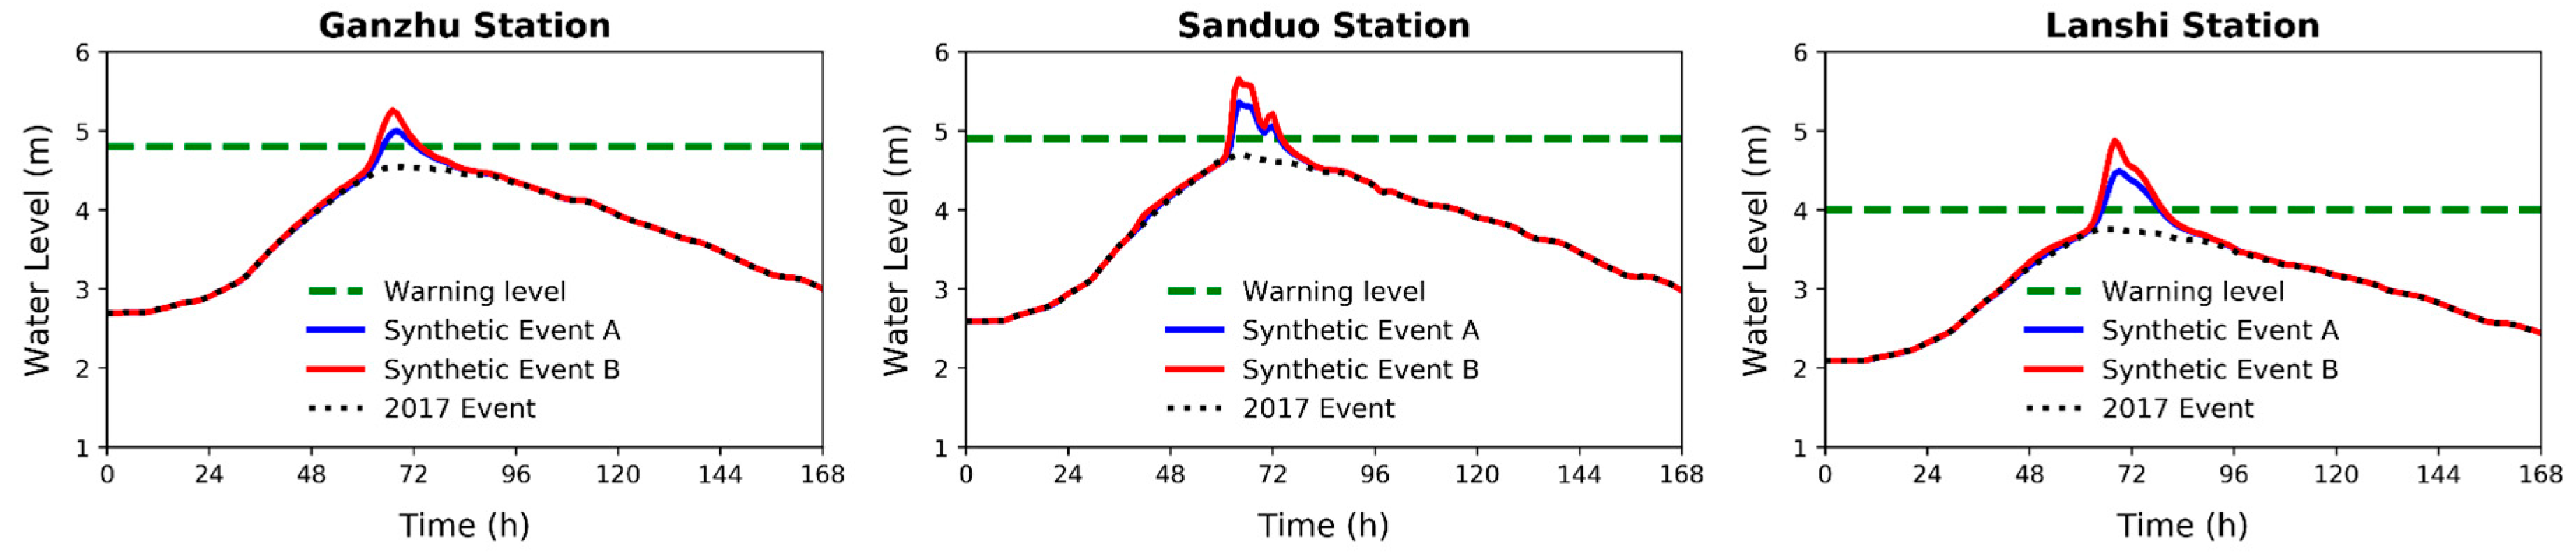
3.2. Synthetic Events
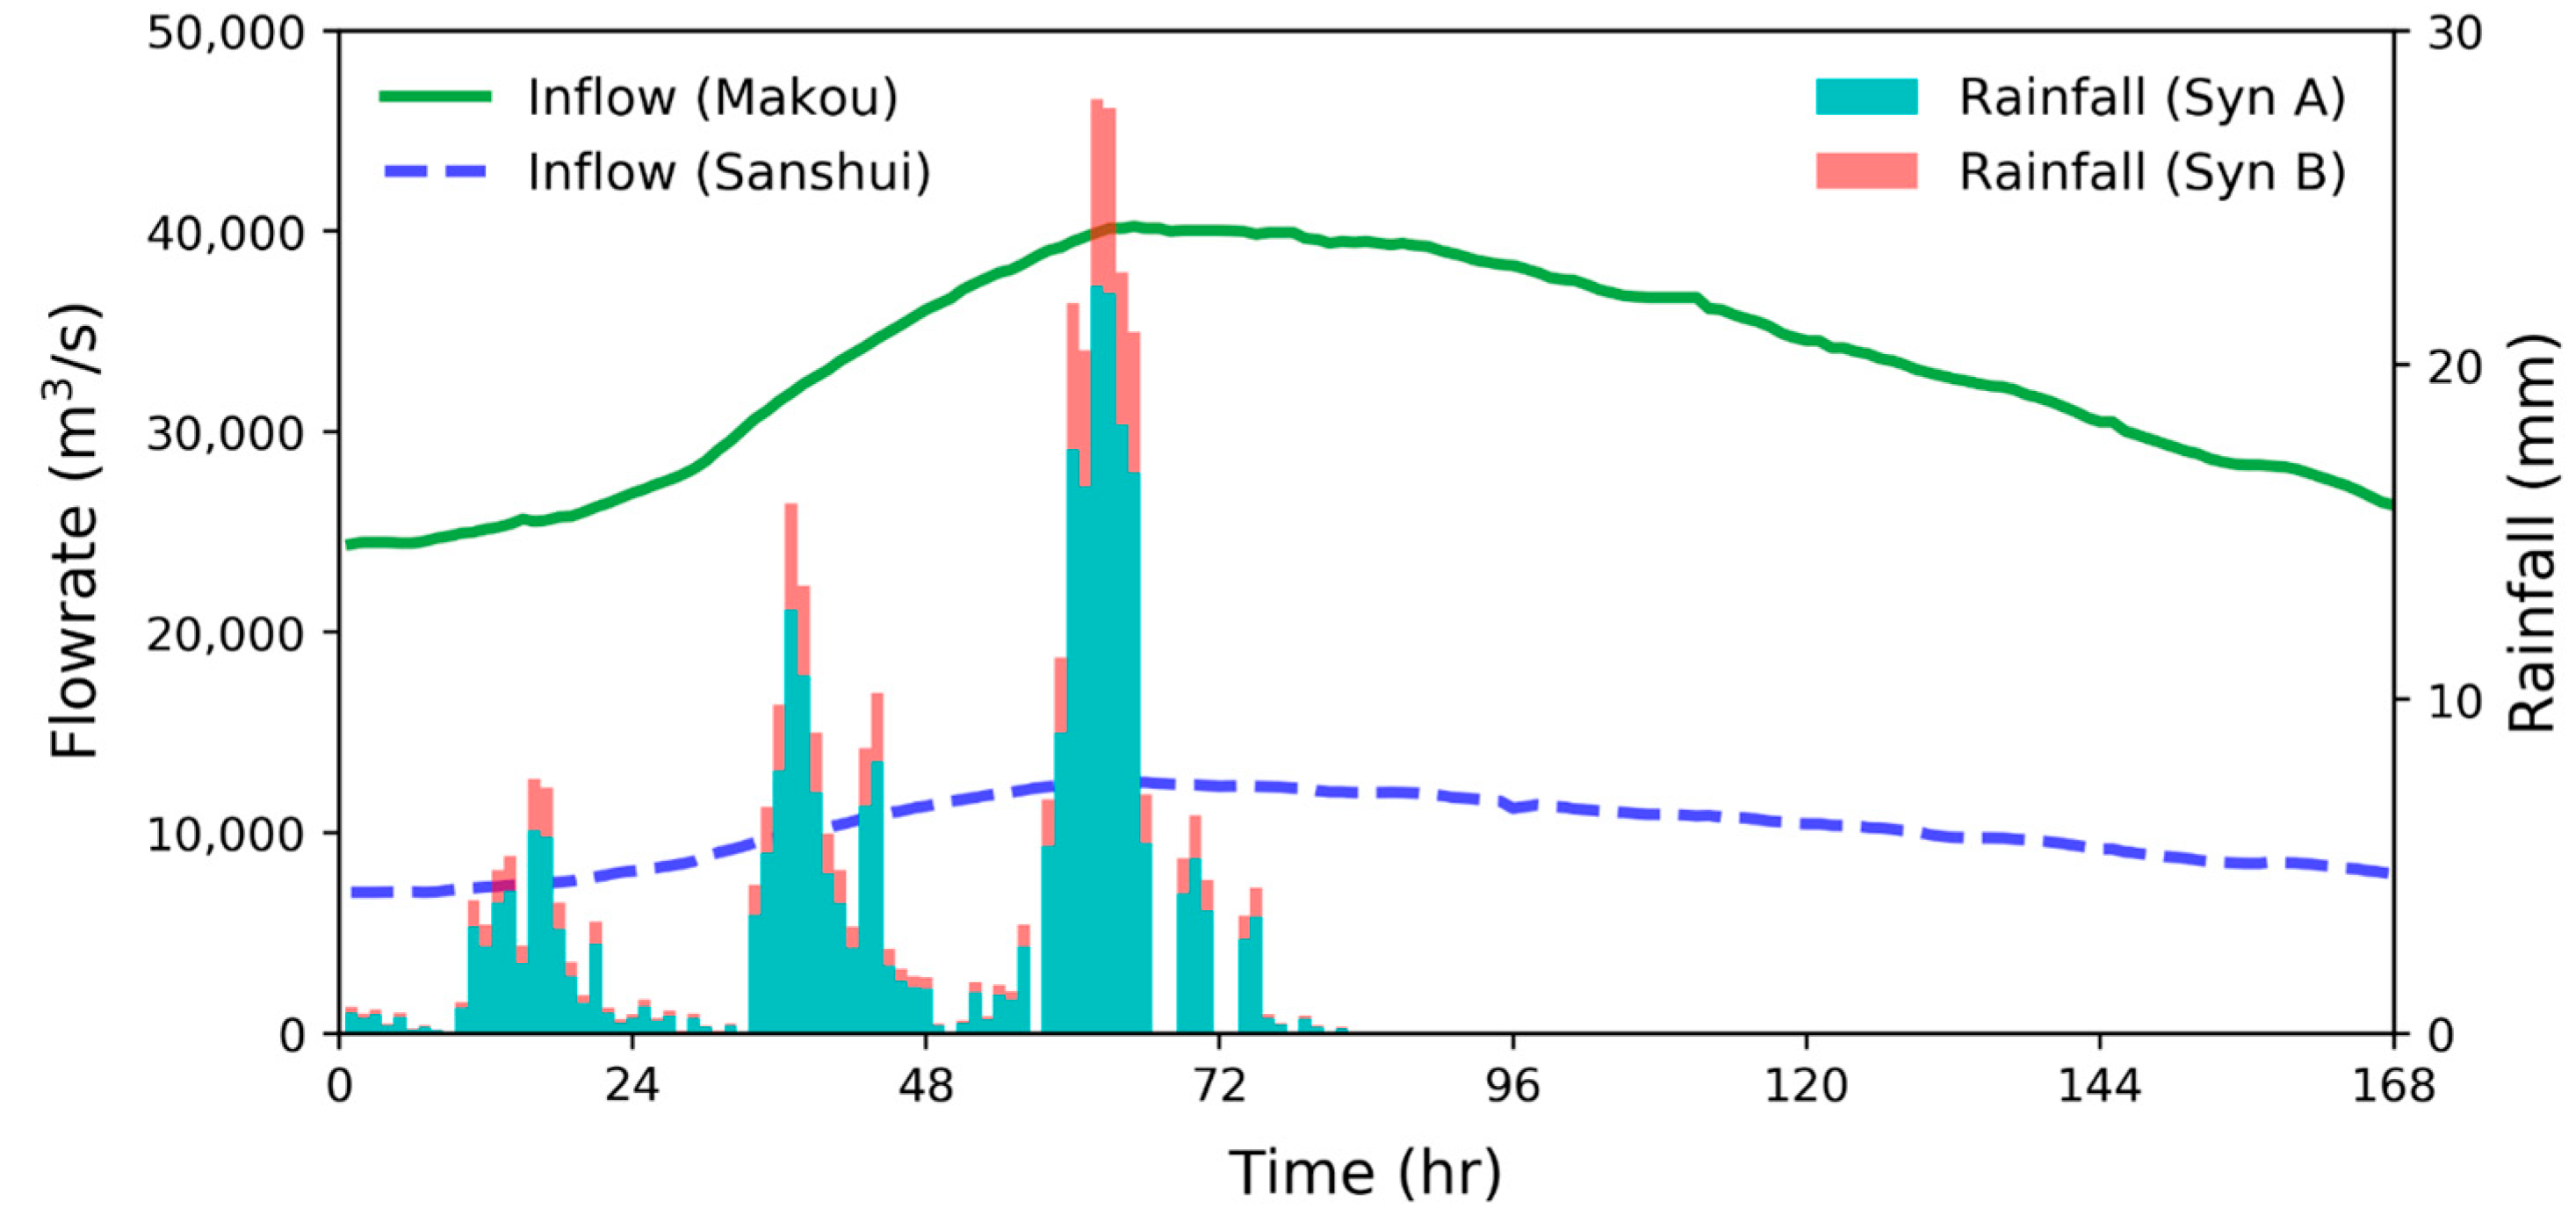
3.2.1. Design Rainfall and River Inflows
3.2.2. HEC-HMS Model Results
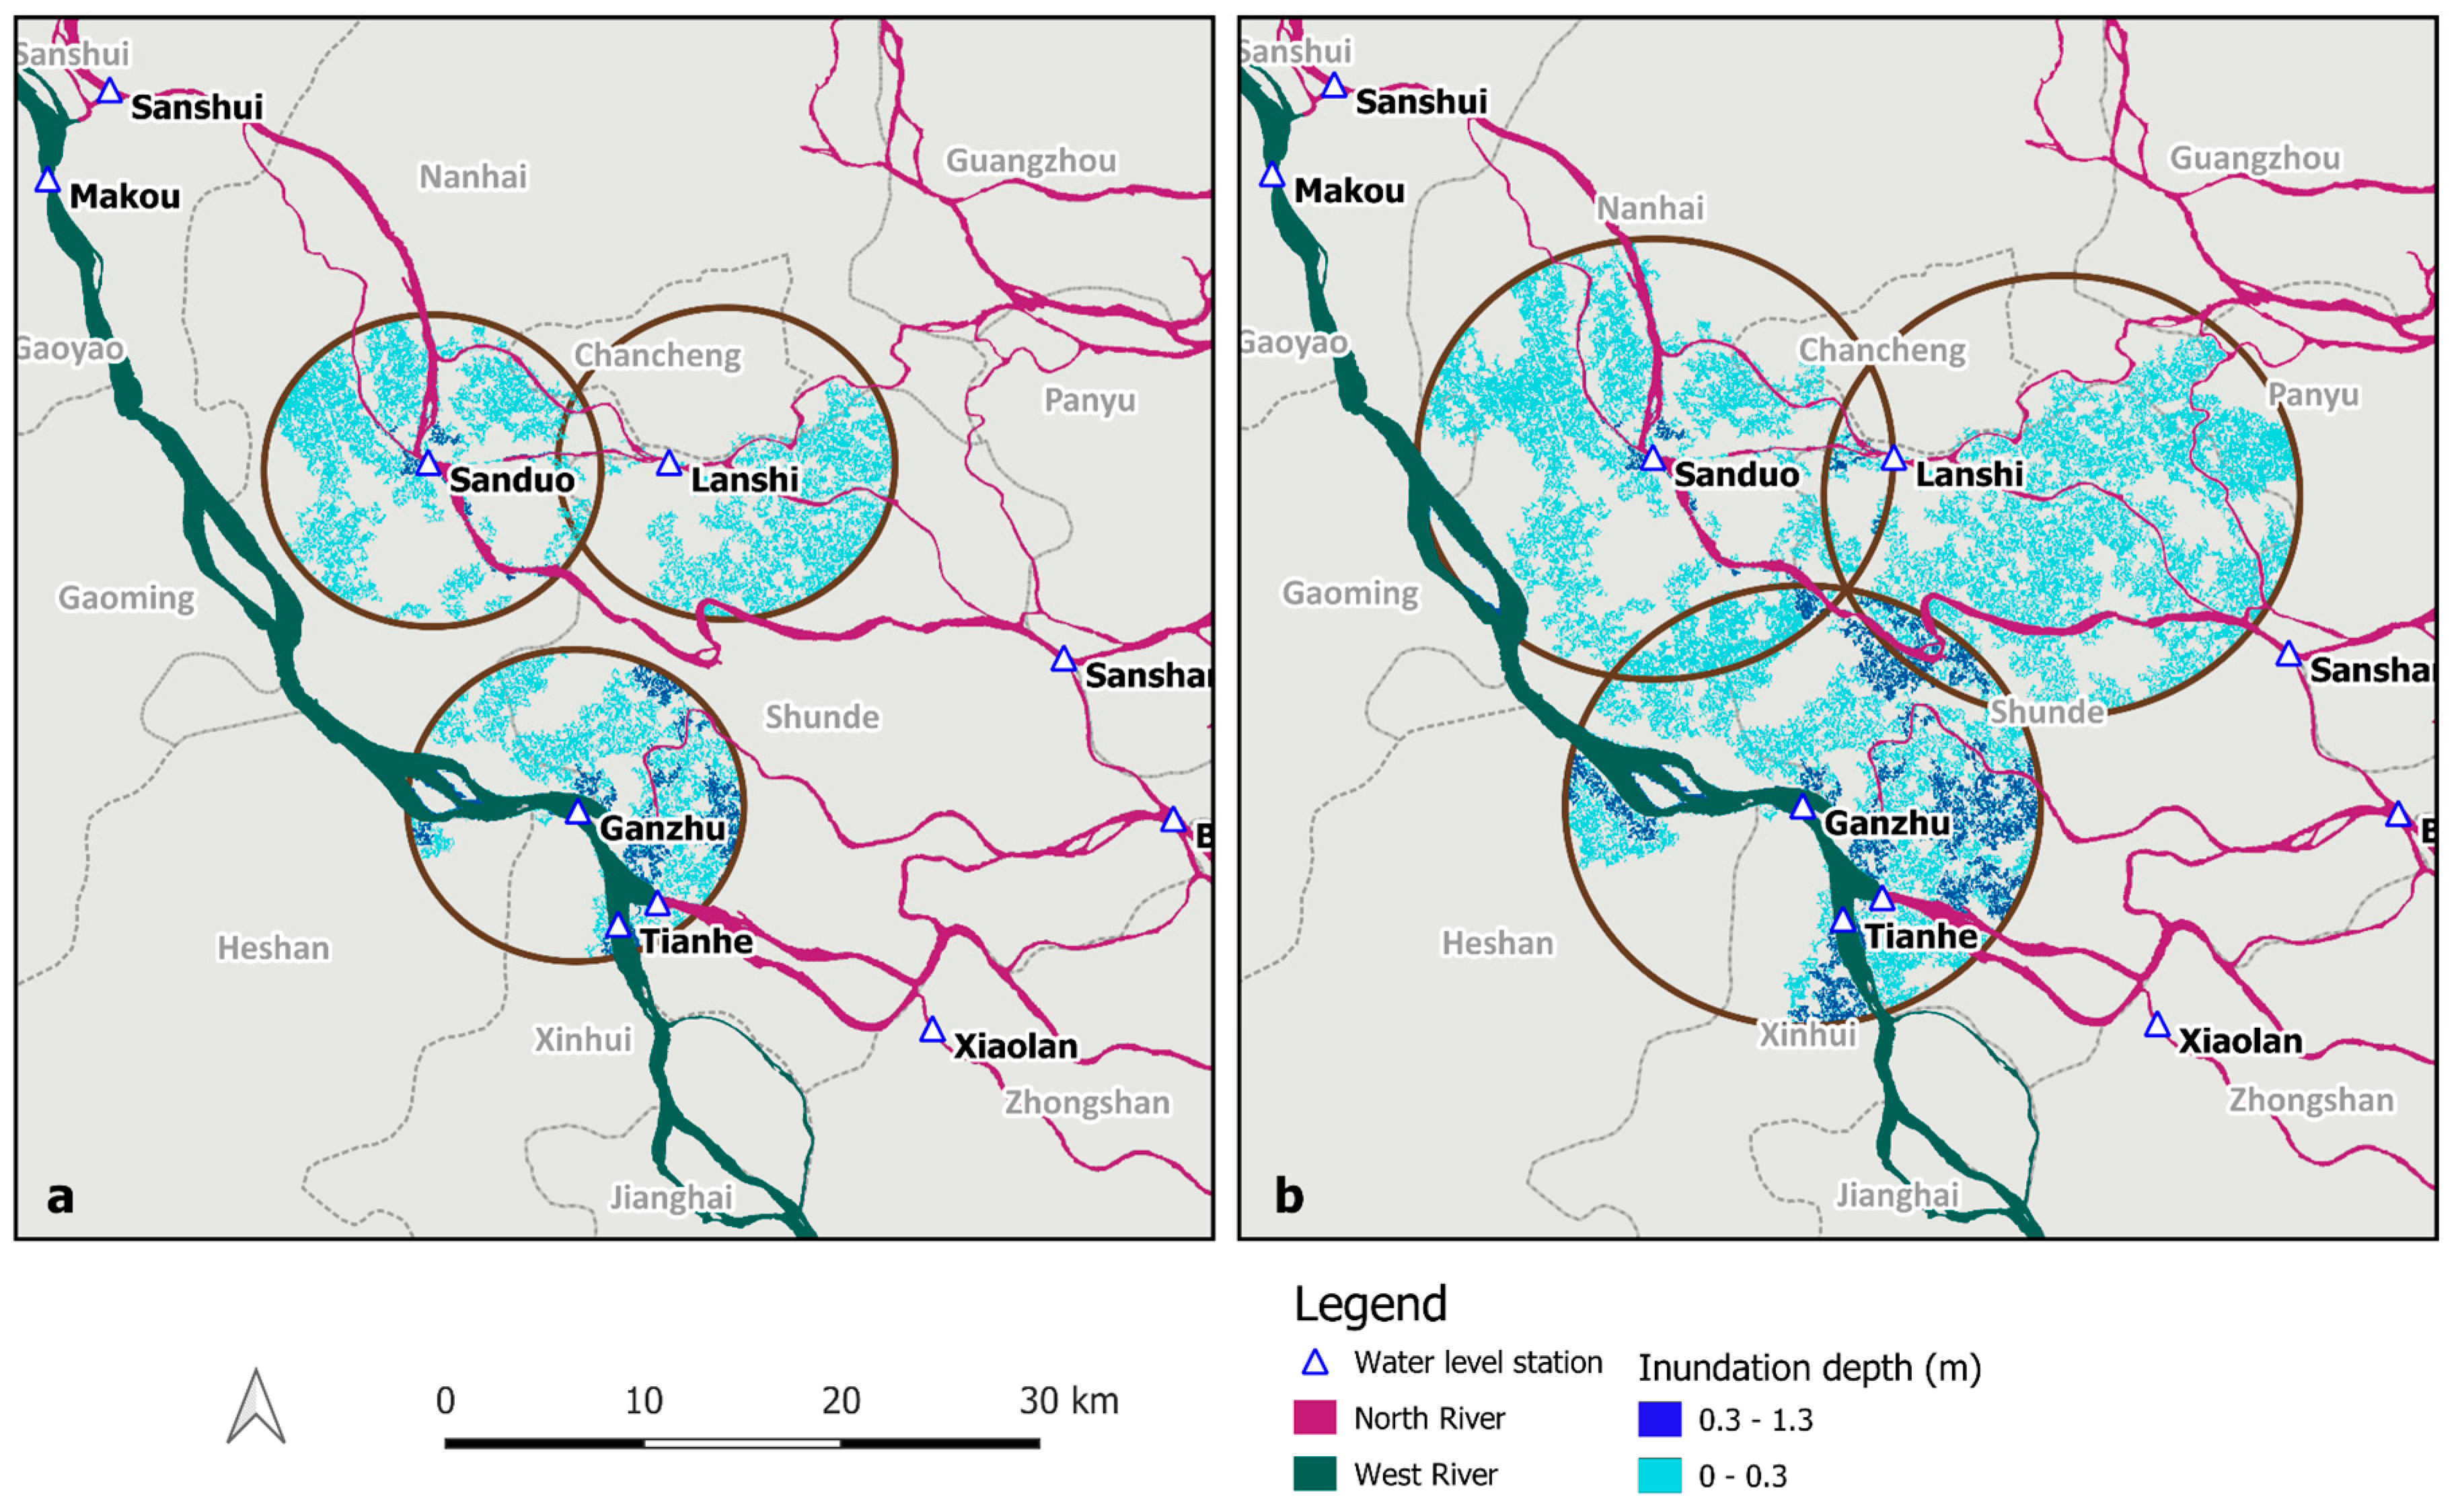
3.2.3. Potential Inundation Extent and GDP Exposure at Risk
4. Conclusions
Author Contributions
Funding
Acknowledgments
Conflicts of Interest
References
- Wei, H.; Hong, W. Innovation Research on Flood Risk Management System. In Innovation Research on Catastrophe Risk Management and Insurance System; Southwestern University of Finance and Economics Press: Chengdu, China, 2012; pp. 157–227. [Google Scholar]
- Munich Reinsurance Company. NatCatSERVICE Database. Available online: https://www.munichre.com/en/solutions/for-industry-clients/natcatservice.html (accessed on 21 October 2019).
- Jonkman, S.N.; Bočkarjova, M.; Kok, M.; Bernardini, P. Integrated hydrodynamic and economic modelling of flood damage in the Netherlands. Ecol. Econ. 2008, 66, 77–90. [Google Scholar] [CrossRef]
- Skakun, S.; Kussul, N.; Shelestov, A.; Kussul, O. Flood hazard and flood risk assessment using a time series of satellite images: A case study in Namibia. Risk Anal. 2014, 34, 1521–1537. [Google Scholar] [CrossRef] [PubMed]
- Pellicani, R.; Parisi, A.; Iemmolo, G.; Apollonio, C. Economic risk evaluation in urban flooding and instability-prone areas: The case study of San Giovanni Rotondo (Southern Italy). Geosciences 2018, 8, 112. [Google Scholar] [CrossRef]
- Hallegatte, S. An adaptive regional input-output model and its application to the assessment of the economic cost of Katrina. Risk Anal. 2008, 28, 779–799. [Google Scholar] [CrossRef]
- De Bono, A.; Mora, M.G. A global exposure model for disaster risk assessment. Int. J. Disaster Risk Reduct. 2014, 10, 442–451. [Google Scholar] [CrossRef]
- Wu, J.; Wang, C.; He, X.; Wang, X.; Li, N. Spatiotemporal changes in both asset value and GDP associated with seismic exposure in China in the context of rapid economic growth from 1990 to 2010. Environ. Res. Lett 2017, 12, 034002. [Google Scholar] [CrossRef]
- Revi, A.; Satterthwaite, D.; Aragón-Durand, F.; Corfee-Morlot, J.; Kiunsi, R.B.R.; Pelling, M.; Roberts, D.; Solecki, W. Urban areas. In Climate Change 2014: Impacts, Adaptation, and Vulnerability. Part A: Global and Sectoral Aspects. Contribution of Working Group II to the Fifth Assessment Report of the Intergovernmental Panel on Climate Change; Cambridge University Press: Cambridge, UK; New York, NY, USA, 2014; pp. 535–612. [Google Scholar]
- Zhao, R. The Xinanjiang model applied in China. J. Hydrol. 1992, 135, 371–381. [Google Scholar] [CrossRef]
- Li, Z.; Liu, P.; Zhang, W.; Chen, X.; Deng, C. Comparative Study on the Performance of SWAT and Xin’anjiang Models in Xunhe Basin. J. Water Resour. Res. 2014, 3, 307–314. [Google Scholar] [CrossRef]
- Hao, F.; Sun, M.; Geng, X.; Huang, W.; Ouyang, W. Coupling the Xinanjiang Model with Geomorphologic Instantaneous Unit Hydrograph for Flood Forecasting in Northeast China. Int. Soil Water Conserv. Res. 2015, 3, 66–76. [Google Scholar] [CrossRef]
- Yang, S.T.; Dong, G.T.; Zheng, D.H.; Xiao, H.L.; Gao, Y.F.; Lang, Y. Coupling Xinanjiang model and SWAT to simulate agricultural non-point source pollution in Songtao watershed of Hainan, China. Ecol. Model. 2011, 222, 3701–3717. [Google Scholar] [CrossRef]
- Wu, Y.; Chen, J. Modeling of soil erosion and sediment transport in the East River Basin in southern China. Sci. Total Environ. 2012, 441, 159–168. [Google Scholar] [CrossRef] [PubMed]
- 15. Zhang, J.; Ni, S.; Wu, W.; Huang, X.; Jiang, H.; Li, Q.; Wang, J.; Wu, G.; Zorn, C.; Yu, C. Evaluating the effectiveness of the pollutant discharge permit program in China: A case study of the Nenjiang River Basin. J. Environ. Manag. 2019, 251, 109501. [Google Scholar] [CrossRef] [PubMed]
- Peng, D.; Zhijia, L.; Fan, X. Application of TOPMODEL in Buliu River Catchment, Pearl River Basin and Comparison with Xin’anjiang Model. J. Lake Sci. 2009, 21, 441–444. [Google Scholar] [CrossRef][Green Version]
- Li, W.J.; Lin, K.R.; Zhao, T.T.G.; Lan, T.; Chen, X.H.; Du, H.W.; Chen, H.Y. Risk assessment and sensitivity analysis of flash floods in ungauged basins using coupled hydrologic and hydrodynamic models. J. Hydrol. 2019, 572, 108–120. [Google Scholar] [CrossRef]
- Chen, Y.; Xu, Y.P.; Yin, Y.X. Impacts of land use change scenarios on storm-runoff generation in Xitiaoxi basin, China. Quatern. Int. 2009, 208, 121–128. [Google Scholar] [CrossRef]
- Grimaldi, S.; Petroselli, A.; Arcangeletti, E.; Nardi, F. Flood mapping in ungauged basins using fully continuous hydrologic–hydraulic modeling. J. Hydrol. 2013, 487, 39–47. [Google Scholar] [CrossRef]
- Oleyiblo, J.O.; Li, Z.J. Application of HEC-HMS for Flood Forecasting in Misai and Wan’an Catchments in China. Water Sci. Eng. 2010, 3, 14–22. [Google Scholar] [CrossRef]
- Du, J.K.; Qian, L.; Rui, H.Y.; Zuo, T.H.; Zheng, D.P.; Xu, Y.P.; Xu, C.-Y. Assessing the effects of urbanization on annual runoff and flood events using an integrated hydrological modeling system for Qinhuai River basin, China. J. Hydrol. 2012, 464–465, 127–139. [Google Scholar] [CrossRef]
- Zhang, H.L.; Wang, Y.J.; Wang, Y.Q.; Li, D.X.; Wang, X.K. Quantitative comparison of semi- and fully-distributed hydrologic models in simulating flood hydrographs on a mountain watershed in Southwest China. J. Hydrodyn. 2013, 25, 877–885. [Google Scholar] [CrossRef]
- Guangdong Bureau of Statistics. Guangdong Statistical Yearbook 2017. Available online: http://stats.gd.gov.cn/gdtjnj/index.html (accessed on 25 April 2019).
- US Army Corps of Engineers. Hydrologic Modeling System HEC-HMS Technical Reference Manual, March 2000. Available online: https://www.hec.usace.army.mil/software/hec-hms/documentation/HEC-HMS_Technical%20Reference%20Manual_(CPD-74B).pdf (accessed on 1 April 2020).
- Urban Hydrology for Small Watersheds; Technical Release 55; USDA: Washington, DC, USA, 1986.
- Liu, J. A study on diversion points and distribution feature on the Pearl River Delta river network. Pearl River 2015, 1, 90–95. [Google Scholar]
- Wang, J.; Yu, G.; Chen, Z. Simulation on tidal flow rate at sea area of Lingding channel at the estuary of Pearl River. Acta Oceanol. Sin. 1992, 14, 26–34. [Google Scholar]
- Long, J.; Li, S. Application of the finite element combined solution to the Zhujiang Estuary hydrodynamic research. Acta Oceanol. Sin. 2007, 29, 10–14. [Google Scholar]
- Wei, X.; Zhu, Y.; Zhang, W.; Sun, S. Study on salt flux value simulation during dry season at the estuary of Pearl River. Trop. Geogr. 2012, 32, 216–222. [Google Scholar] [CrossRef]
- Guangdong Provincial Local Records Database. Pearl River Delta General Introduction. Available online: http://www.gd-info.gov.cn/books/10651/932.html (accessed on 28 July 2017).
- Delkash, M.; Bakhshayesh, B.E. An examination of rectangular side weir discharge coefficient equations under subcritical condition. Int. J. Hydraul. Eng. 2014, 24–34. [Google Scholar] [CrossRef]
- Singh, R.; Manivannan, D.; Satyanarayana, T. Discharge coefficient of rectangular side weirs. J. Irrig. Drain. Eng. 1994, 120, 814–819. [Google Scholar] [CrossRef]
- Huang, Y.; Jiang, D.; Fu, J. 1 km grid GDP data of China (2005, 2010). Acta Geogr. Sin. 2014, 69, 40–143. [Google Scholar]
- Department of Water Resources of Guangdong Province. Public flood information of the 20-year flood in the West River. Available online: http://zwgk.gd.gov.cn/006941135/201707/t20170706_712531.html (accessed on 31 July 2018).
- Lin, Q.W. Journalist Captured Pictures of the Flood Impact on Zhongshan City. ZSBTC. Available online: http://zsbtv.com.cn/a/ats/content_84733.shtml (accessed on 16 January 2018).
- Wu, J.; Lu, J.; Liu, X.P.; Hou, Y.X.; Yang, Q.; Wen, J.Z.; Guo, C.Y.; Hu, H.J. Flood Peak Coming to Zhongshan Yinggezui, Approaching Warning level. Southern Metropolis Daily. Available online: http://finance.ifeng.com/a/20170706/15514783_0.shtml (accessed on 16 January 2018).
- Intergovernmental Panel on Climate Change (IPCC). Managing the Risks of Extreme Events and Disasters to Advance Climate Change Adaptation. In A Special Report of Working Groups I and II of the Intergovernmental Panel on Climate Change; Cambridge University Press: Cambridge, UK; New York, NY, USA, 2012; 582p. [Google Scholar]
- Foshan Municipal Administration of State Land, Urban and Rural Planning. Planning Guidelines of Sponge City for the Foshan City. 2016. Available online: http://fszrzy.foshan.gov.cn/attachment/0/47/47656/762585.pdf (accessed on 5 March 2018).


| Data Source | Stations | Resolution | Duration |
|---|---|---|---|
| Hydrological Bureau of Guangdong Province—Foshan Municipal Administration (http://www.gdsw.gov.cn/fsfj.html) | Makou, Sanshui | Hourly discharge | 7–10 June 2018 |
| Pearl River Hydrological Bureau of Water Resources Committee of Pearl River, Ministry of Water Resources (http://www.zwsw.gov.cn/syqxx/index.shtml) | Makou, Sanshui | Daily discharge (at 8:00 am) | July 2017, June 2018 |
| Pearl River Navigation Administration, Ministry of Transport (www.zjhw.gov.cn) | Makou, Sanshui, Tianhe | Daily discharge and water level (at 8:00 am) | June–August 2014–2017, June 2018 |
| City | County | GDP_Primary (%) | GDP_Non-Primary (%) |
|---|---|---|---|
| Zhongshan | - | 1.85 | 98.15 |
| Foshan | Chancheng | 0.03 | 99.97 |
| Nanhai | 1.95 | 98.05 | |
| Shunde | 1.56 | 98.44 | |
| Gaoming | 2.36 | 97.64 | |
| Sanshui | 2.99 | 97.01 | |
| Jiangmen | Heshan | 7.91 | 92.09 |
| Jianghai | 3.25 | 96.75 | |
| Pengjiang | 1.12 | 98.88 | |
| Guangzhou | Panyu | 1.71 | 98.29 |
| Nansha | 4.47 | 95.53 |
| Event | Day 1 | Day 2 | Day 3 | Day 4 | Day 5 | Day 6 | Day 7 |
|---|---|---|---|---|---|---|---|
| 2017 Event | 16.46 | 59.52 | 45.04 | 5.58 | 7.78 | 12.45 | 16.79 |
| 2018 Event | 3.76 | 13.38 | 41.28 | 86.91 | 154.39 | 0.21 | 0.02 |
| Event | Station | Maximum Flood Depth (m) | Total Flood Area (km2) | Total Overflow (million, m3) |
|---|---|---|---|---|
| Syn A | Sanduo | 1.26 | 65.5 | 19.4 |
| Lanshi | 0.27 | 46.5 | 12.5 | |
| Ganzhu | 1.23 | 60.0 | 28.4 | |
| Syn B | Sanduo | 1.23 | 119.4 | 33.8 |
| Lanshi | 0.17 | 127.4 | 22.2 | |
| Ganzhu | 1.25 | 140.2 | 76.9 |
| Event | Station | Maximum Flood Depth (m) | Total Flooded Area (km2) | GDP at Risk (billion CNY) | |
|---|---|---|---|---|---|
| Syn A | Sanduo | 1.26 | 65.5 | 0.6 | 4.3 |
| Ganzhu | 1.23 | 60.0 | 3.7 | ||
| Syn B | Sanduo | 1.23 | 119.4 | 1.3 | 11.2 |
| Ganzhu | 1.25 | 140.2 | 9.9 | ||
© 2020 by the authors. Licensee MDPI, Basel, Switzerland. This article is an open access article distributed under the terms and conditions of the Creative Commons Attribution (CC BY) license (http://creativecommons.org/licenses/by/4.0/).
Share and Cite
Zhang, Q.; Jian, W.; Lo, E.Y.M. Assessment of Flood Risk Exposure for the Foshan-Zhongshan Region in Guangdong Province, China. Water 2020, 12, 1159. https://doi.org/10.3390/w12041159
Zhang Q, Jian W, Lo EYM. Assessment of Flood Risk Exposure for the Foshan-Zhongshan Region in Guangdong Province, China. Water. 2020; 12(4):1159. https://doi.org/10.3390/w12041159
Chicago/Turabian StyleZhang, Qi, Wei Jian, and Edmond Yat Man Lo. 2020. "Assessment of Flood Risk Exposure for the Foshan-Zhongshan Region in Guangdong Province, China" Water 12, no. 4: 1159. https://doi.org/10.3390/w12041159
APA StyleZhang, Q., Jian, W., & Lo, E. Y. M. (2020). Assessment of Flood Risk Exposure for the Foshan-Zhongshan Region in Guangdong Province, China. Water, 12(4), 1159. https://doi.org/10.3390/w12041159