4.2. The Verification of Overset Method
The heave and pitch motion of the model in waves is intense, the accuracy of the numerical method, based simply on the Dynamic Fluid Body Interaction, is reduced due to grid quality deterioration. Therefore, the overset grid is more appropriate in this case. The overset mesh method in this paper refers to the solution adopted in [
8,
18,
23].
4.2.1. Grid Parameter
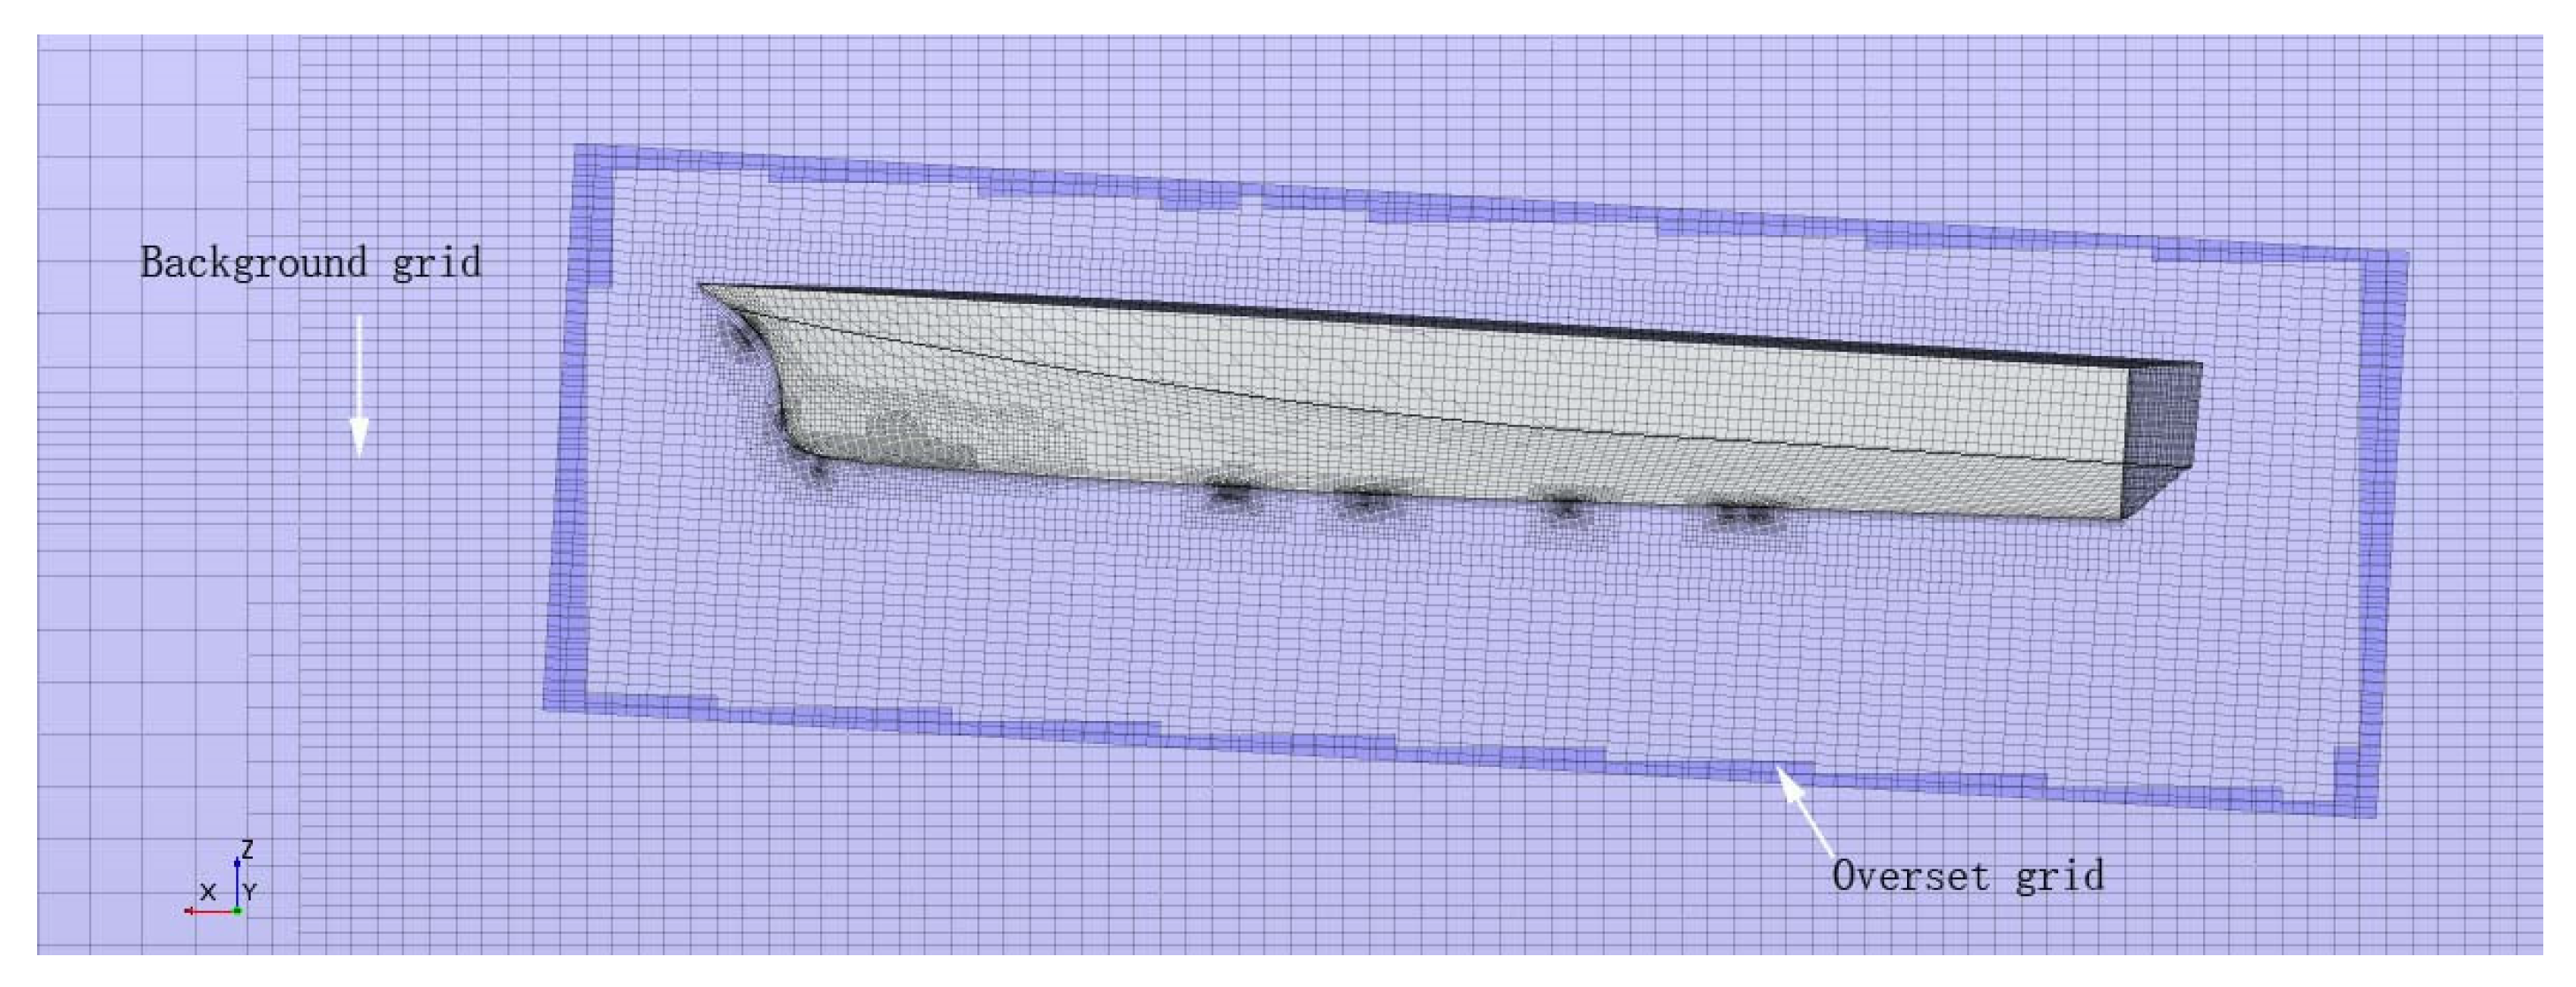
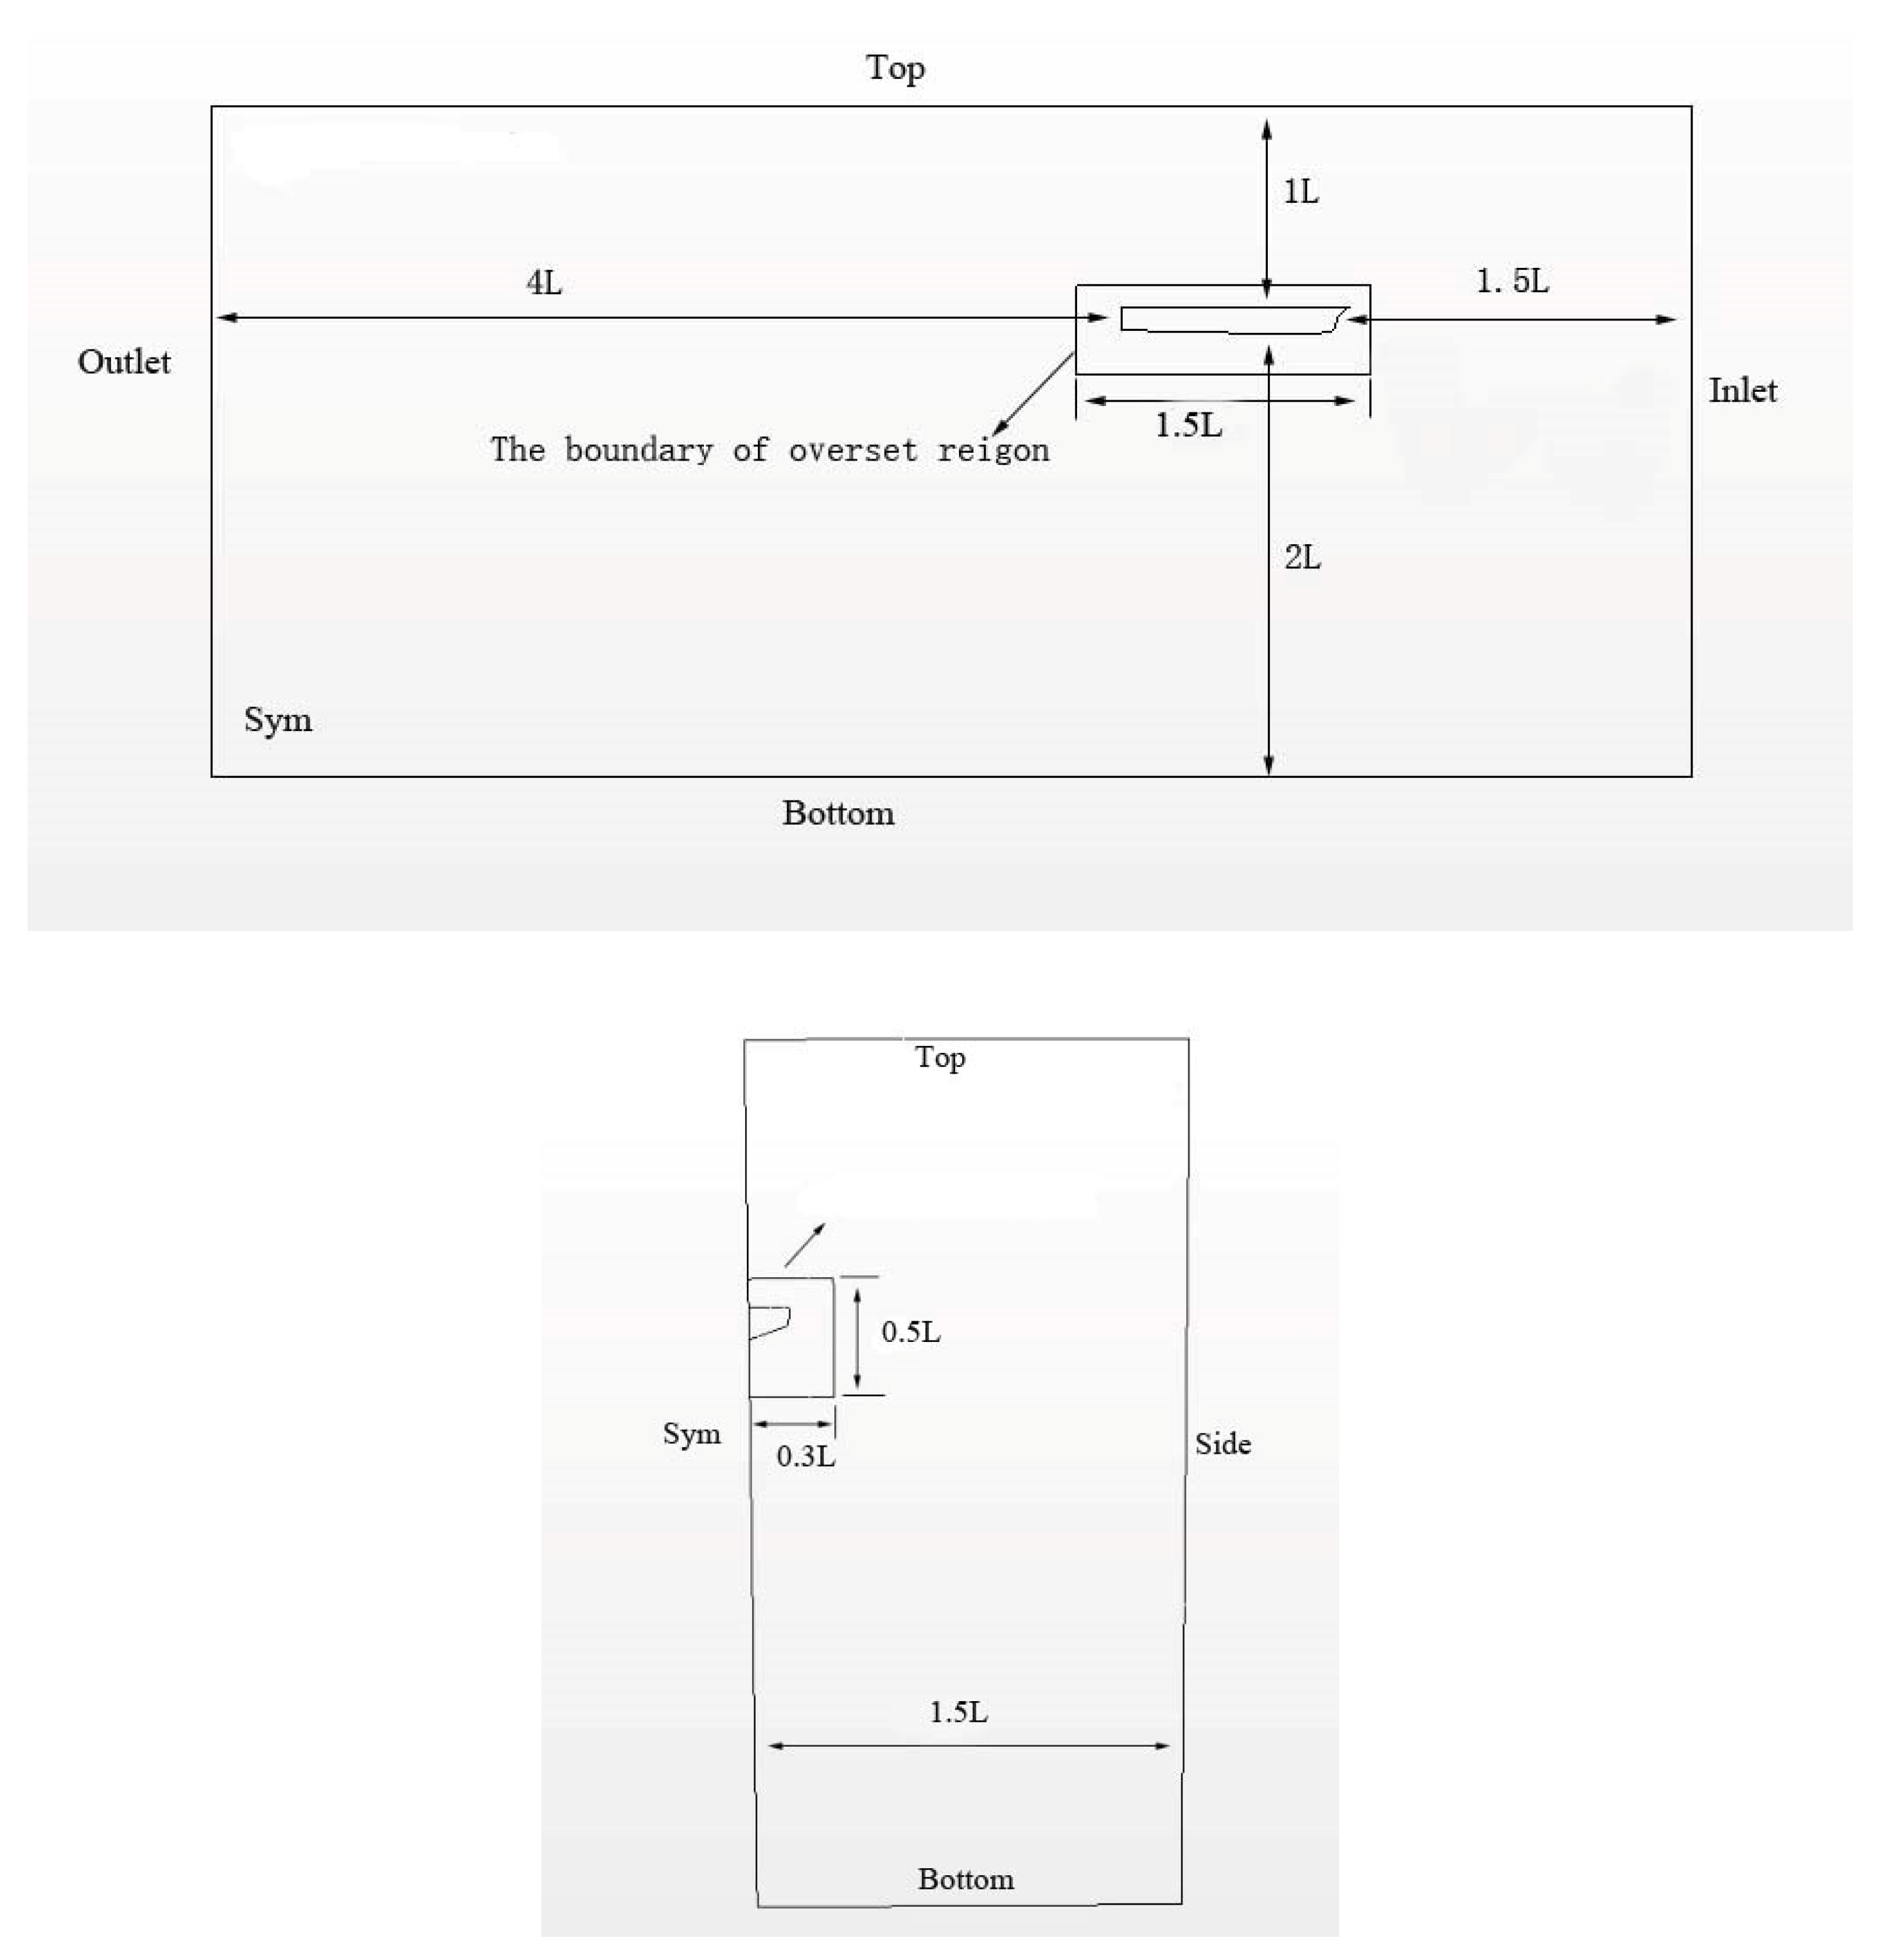
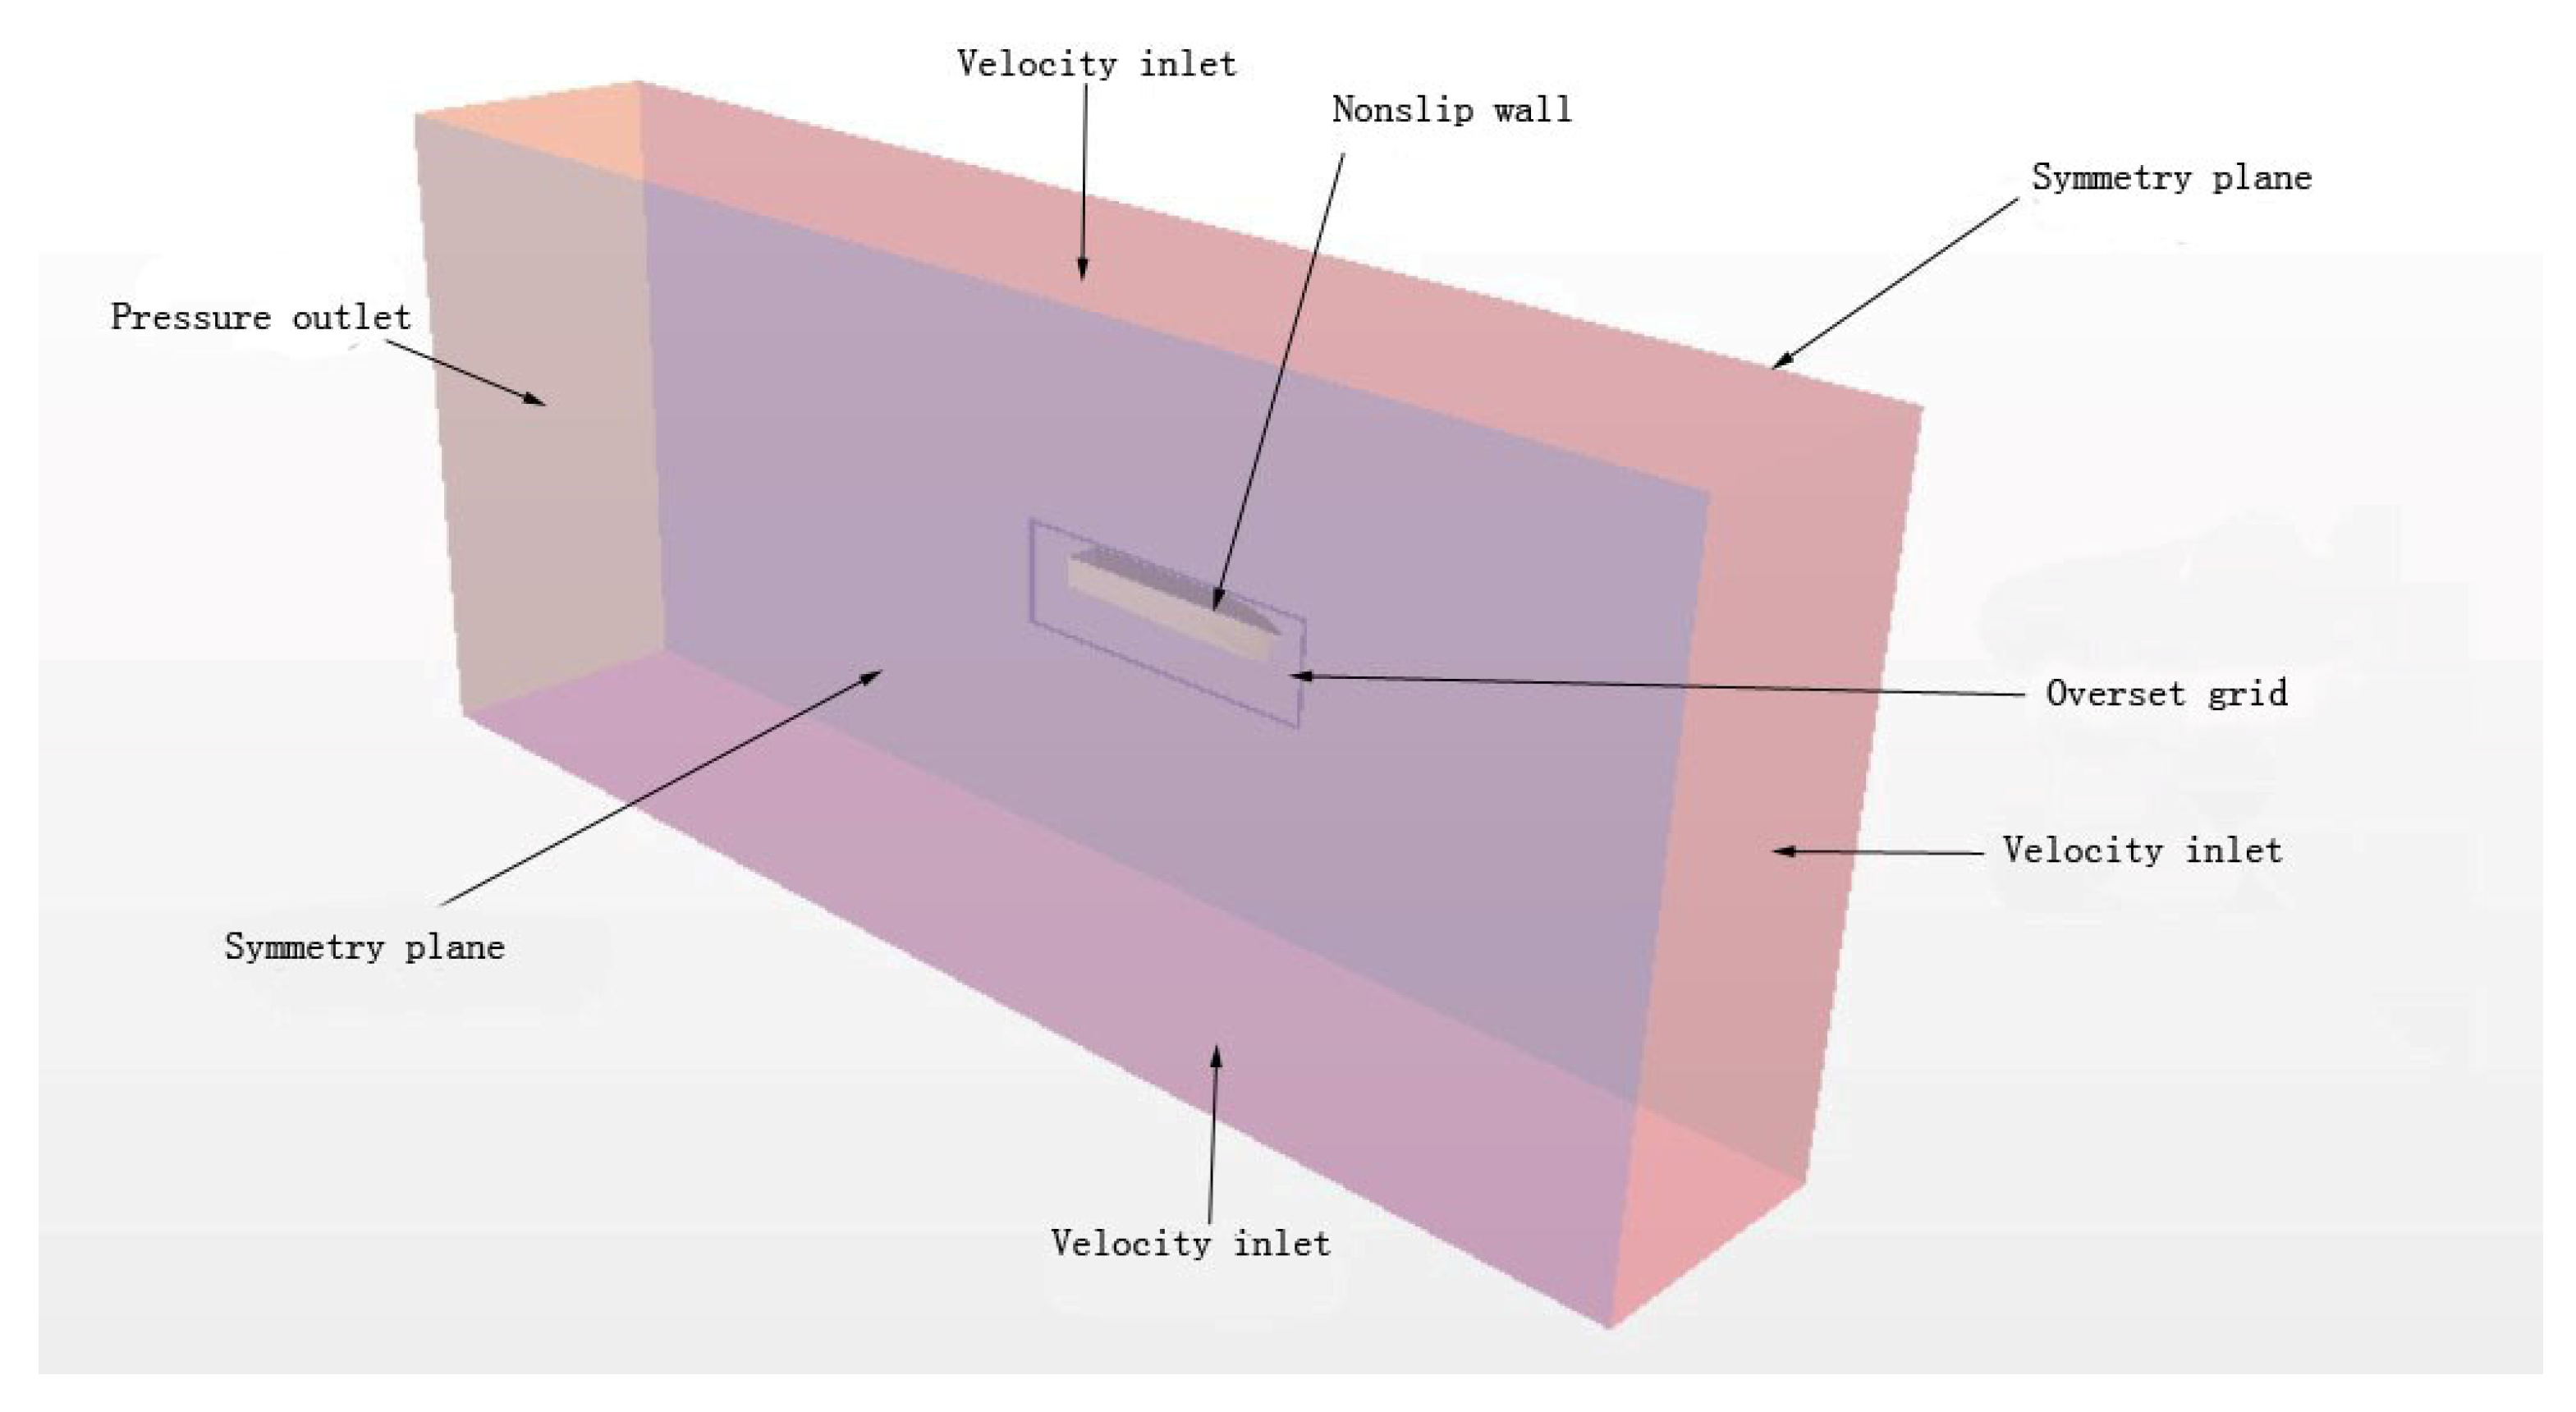
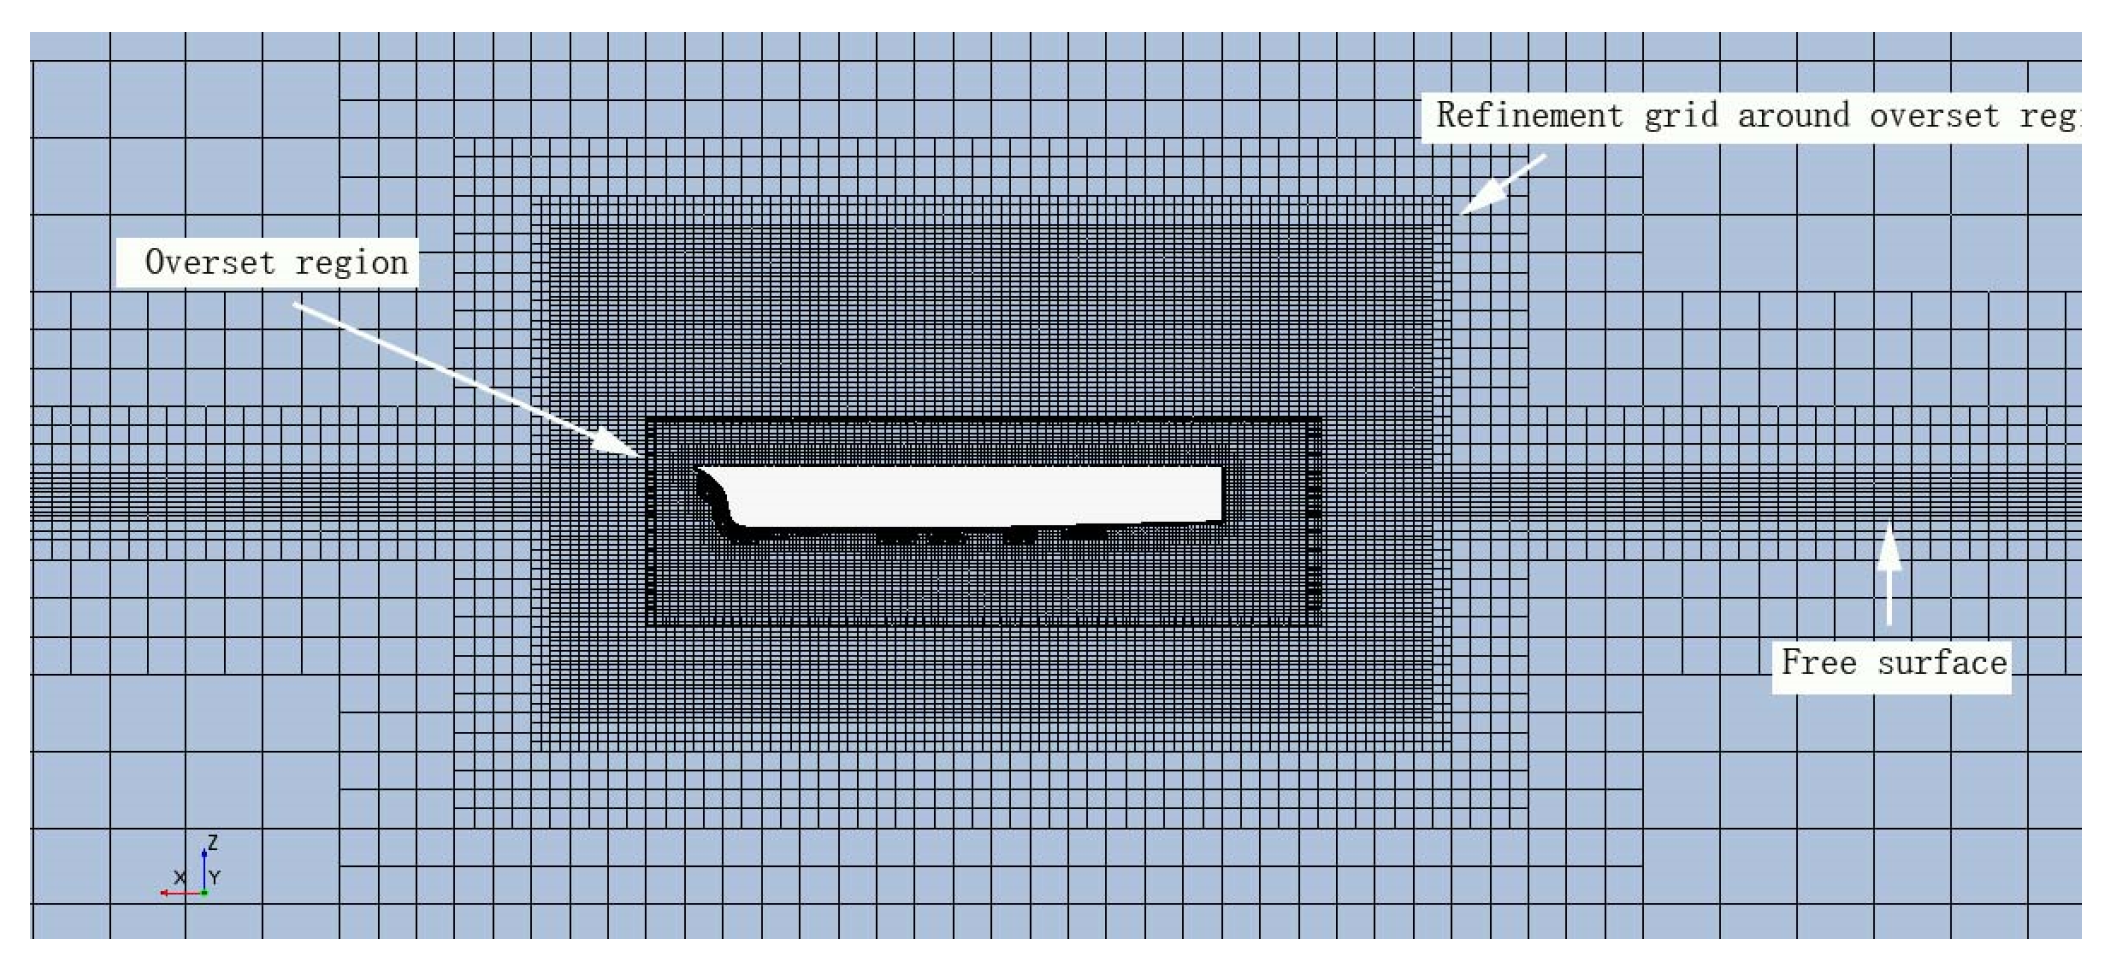
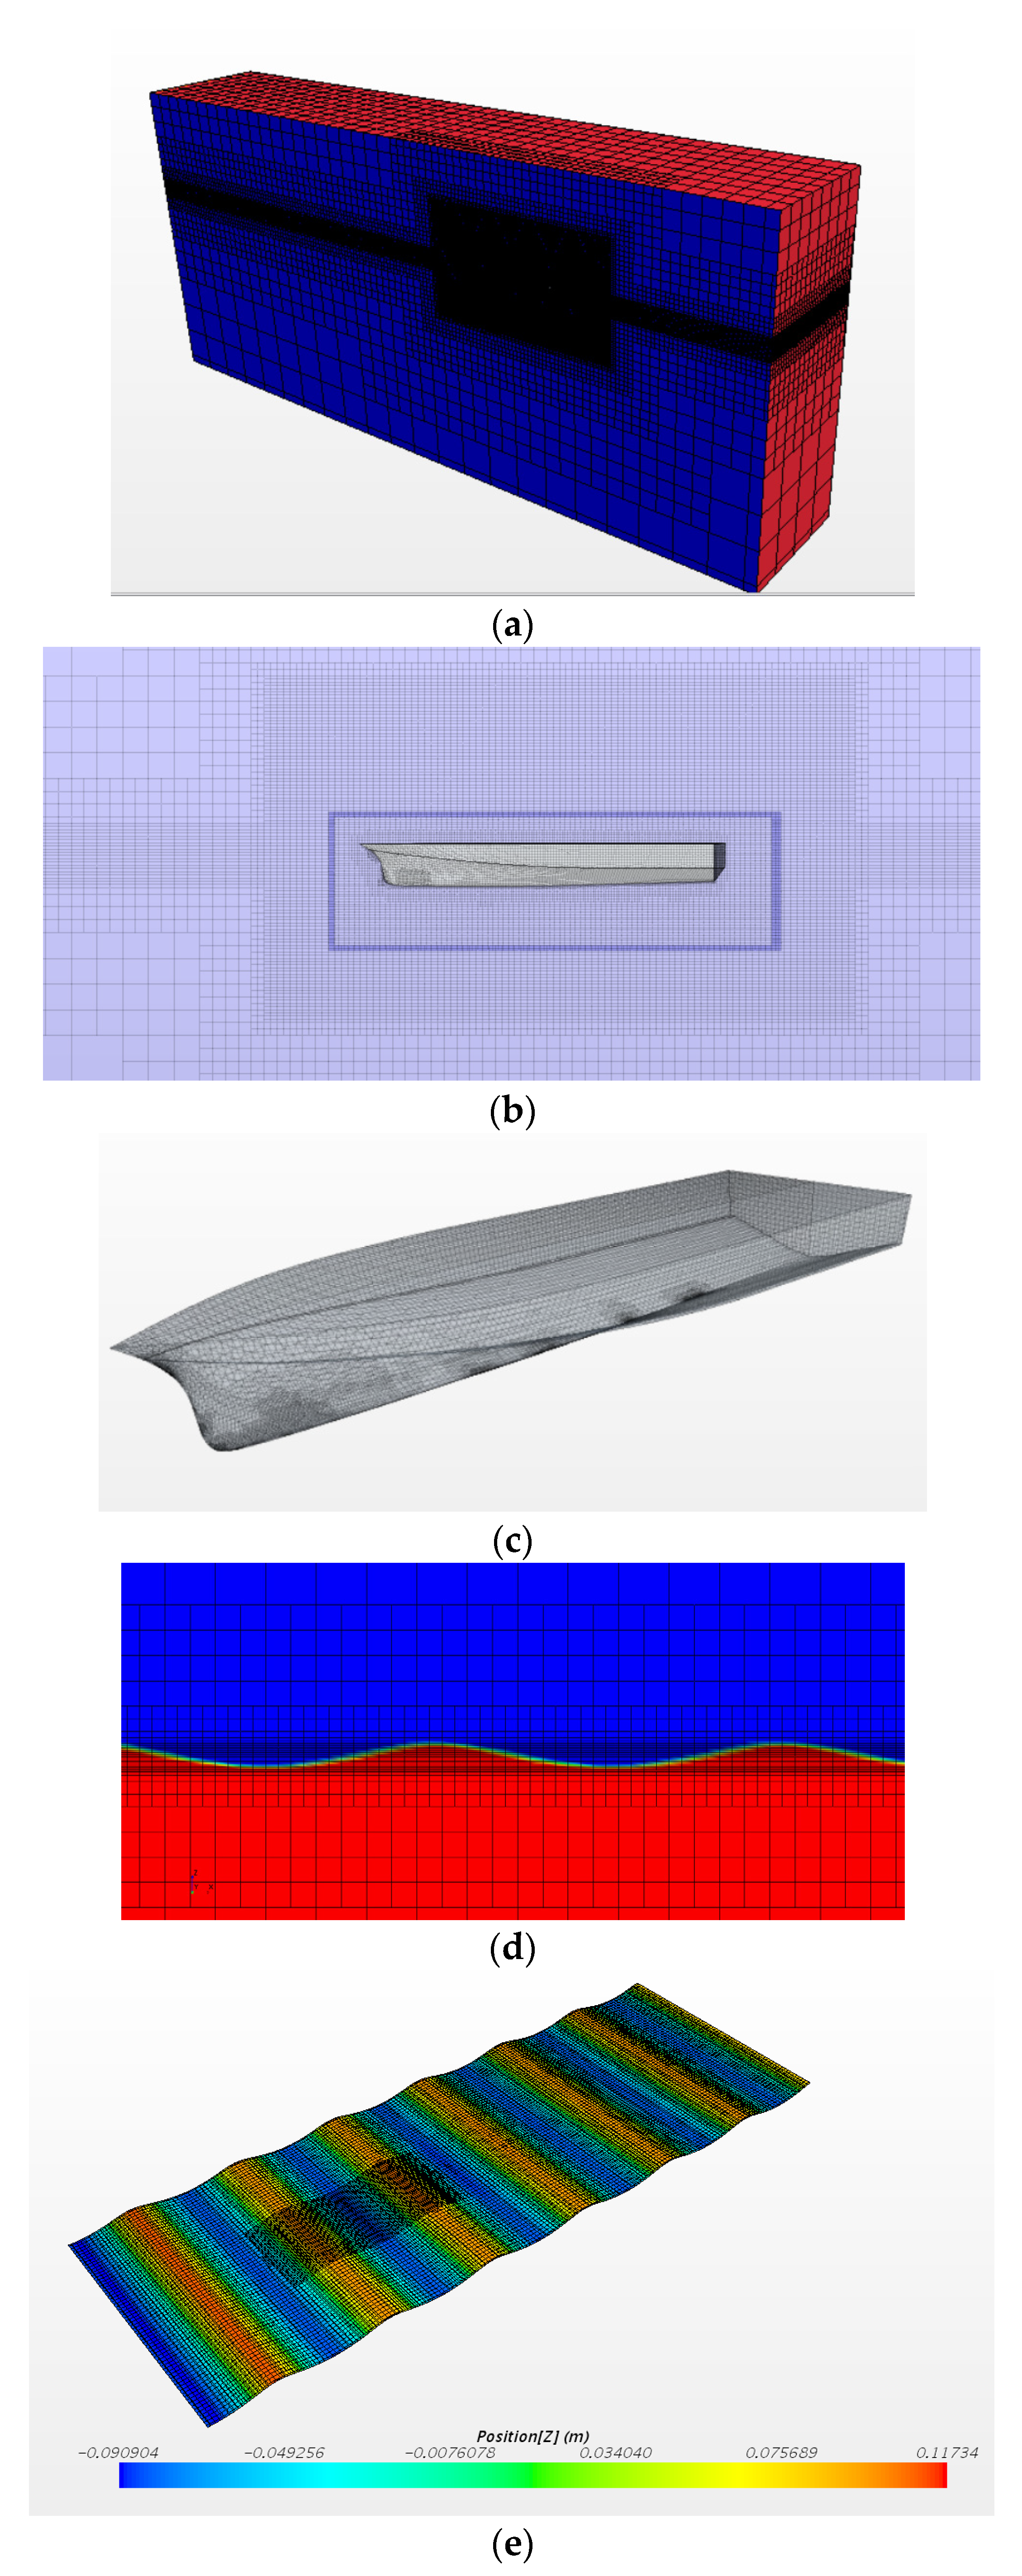
In the computational domains, the grids of two regions are refined: the region around the overset region and the free surface. The grids in the overset region are small, the size of the background region grid around the overset region needs to be consistent with that of the boundary of the overset region. And the grids around the free surface are also refined in order to track the free surface accurately, and the whole free surface is guaranteed to be included in the refinement region. The refinement regions are presented in
Figure 7.
To verify the grid parameters, the sailing of USV01 in calm water was numerical simulated, the numerical results of resistance was compared with the test results, the model and the setting of the test is consistent with
Section 3, the test condition is changed to calm water, towing speed is 8 m/s.
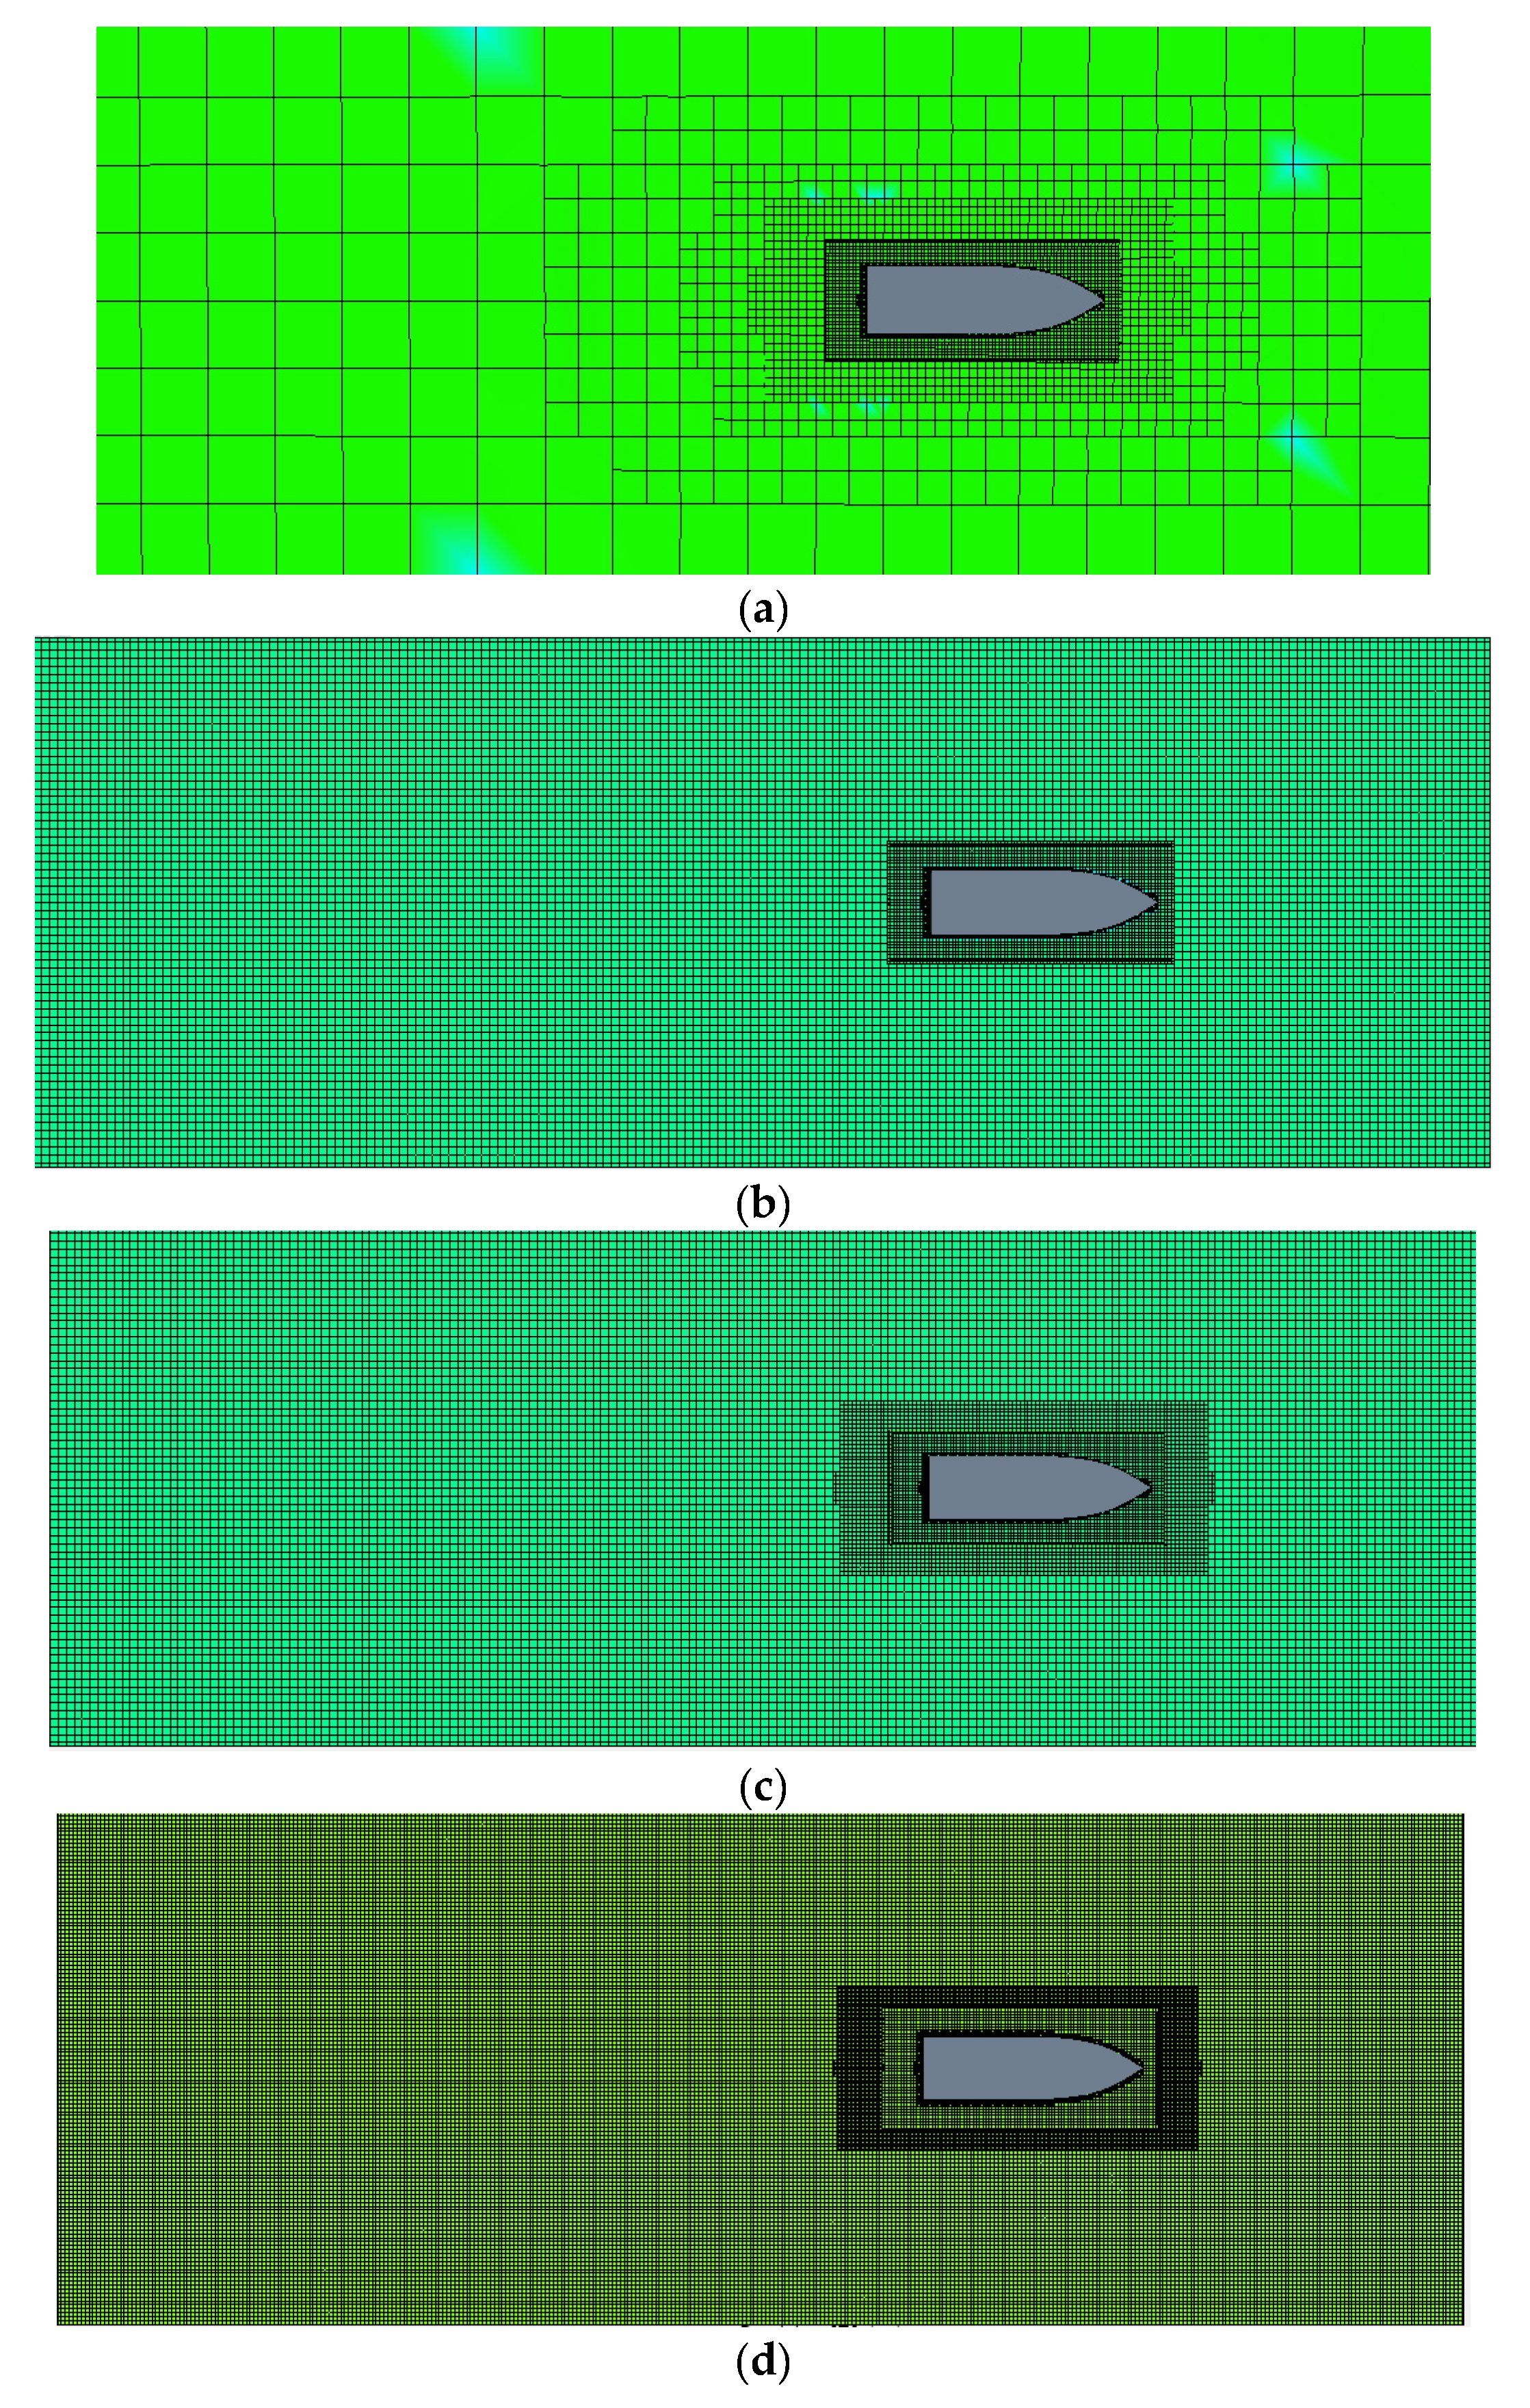
The grid parameter is presented in
Table 4, four grids were adopted in the verification. Only in grid 1, the free surface is not refined, the refinement of the other three grids are different in the size. The grids on the hull and the free surface are presented in
Figure 8.
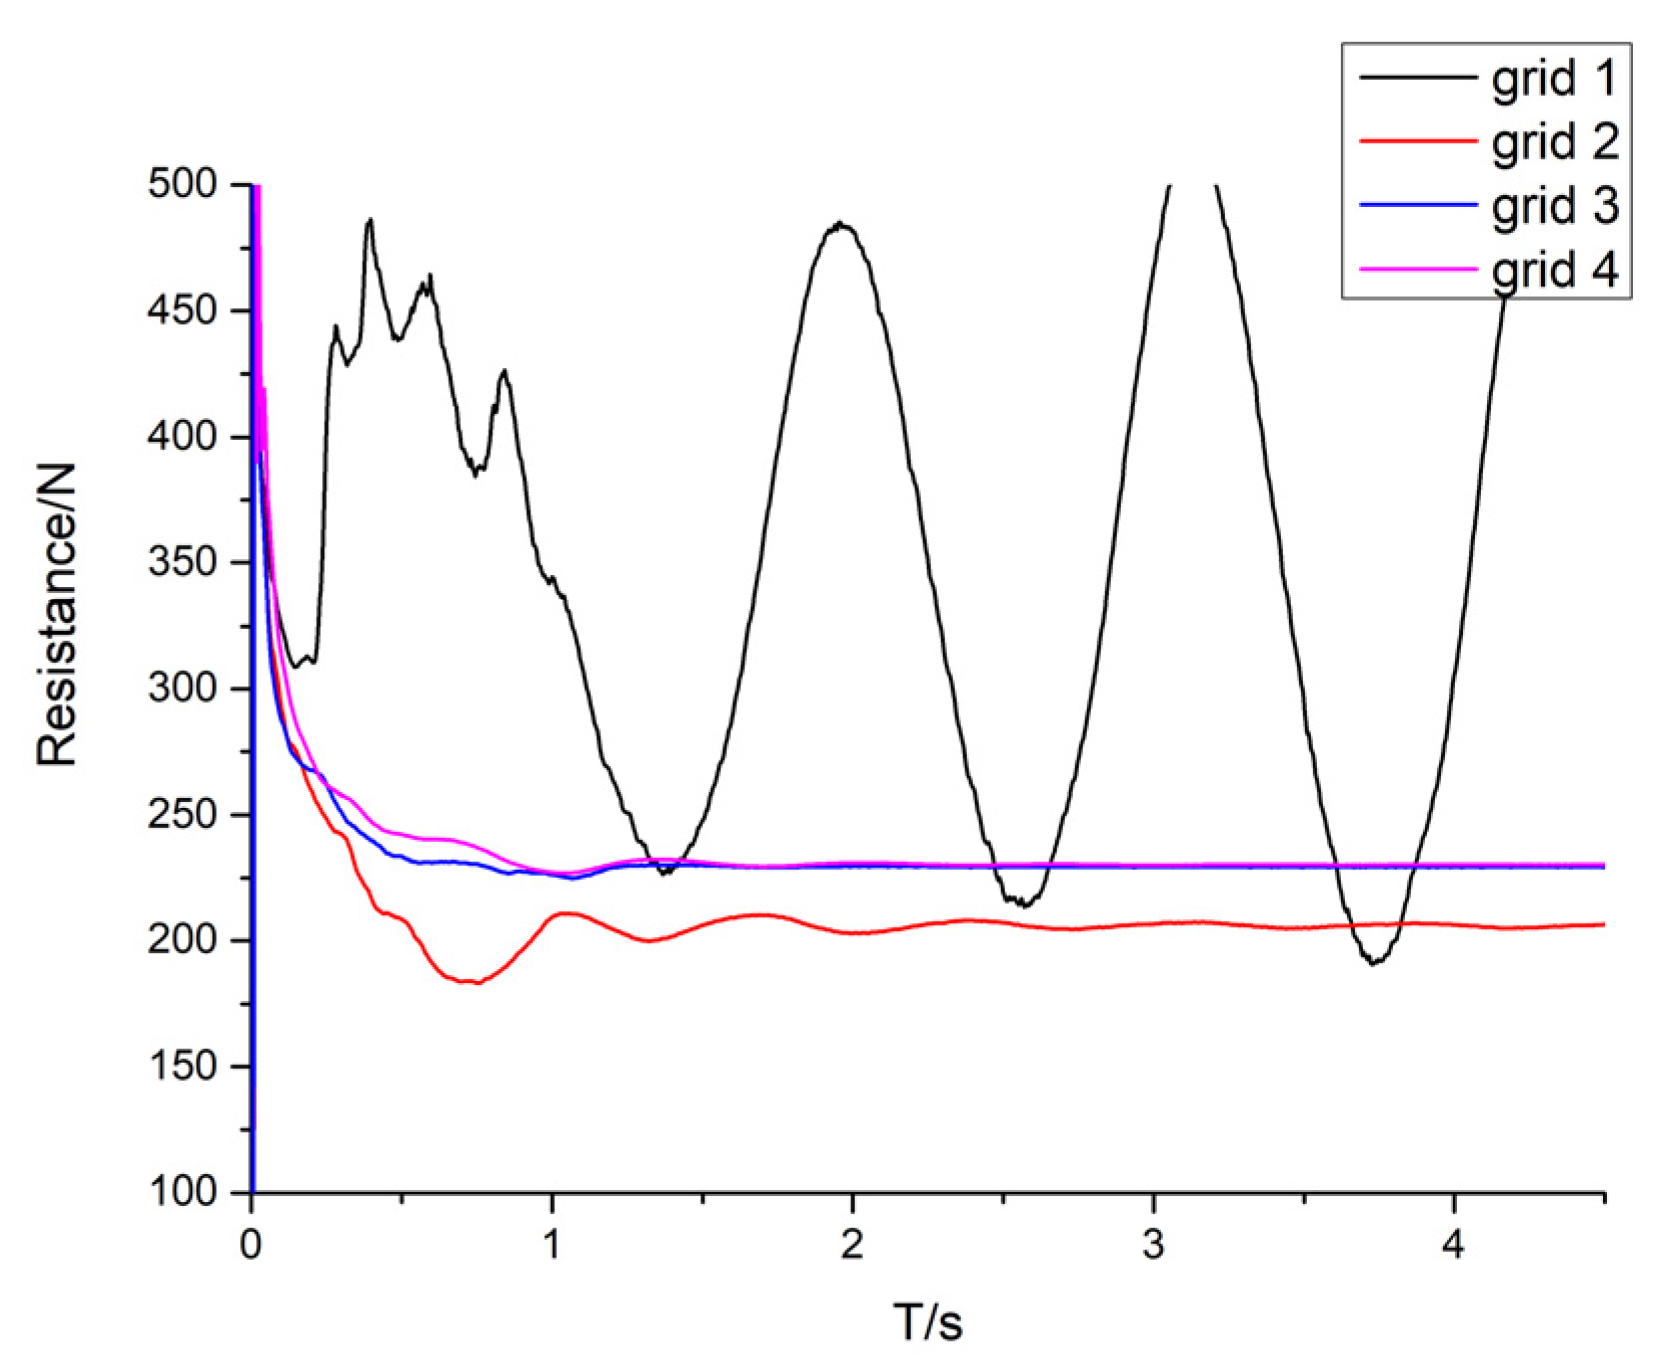
The numerical results of the four grids are presented in
Table 5, the resistance curves are presented in
Figure 9.
Table 5 and
Figure 9 indicate that, due to the lack of refinement grid around free surface, the resistance curve of grid 1 cannot converge, and the resistance curves of the other three grids show good convergence. Comparing the numerical results of grid 2 and 3, both the grids were refined, but the numerical results of the grid 2 show a large deviation, the size of the refinements of grid 2 is too large to ensure the accuracy of numerical results. It proves that the refinement grid around free surface is necessary in tracking the free surface. Moreover, the size of grid refinement should be small enough to ensure the accuracy of numerical simulation.
Comparing the numerical results of grid 3 and 4, the deviations and difference of the grids are both small. The two schemes of grids refinement can both guarantee the requirement of numerical simulation, but the size of grid 4 is too small, and the total number of the grids is too large, the computing efficiency will drop significantly.
Summing up the above, parameters of grid can satisfy the accuracy of numerical simulation and improve the computational efficiency at the same time. Subsequent grid settings are all referenced to that of grid 3.
4.2.2. Value of y+
As mentioned in
Section 2.4, the value of y
+ has influence on the accuracy of calculation, under normal conditions the value of y
+ ranges from 30 to 300.
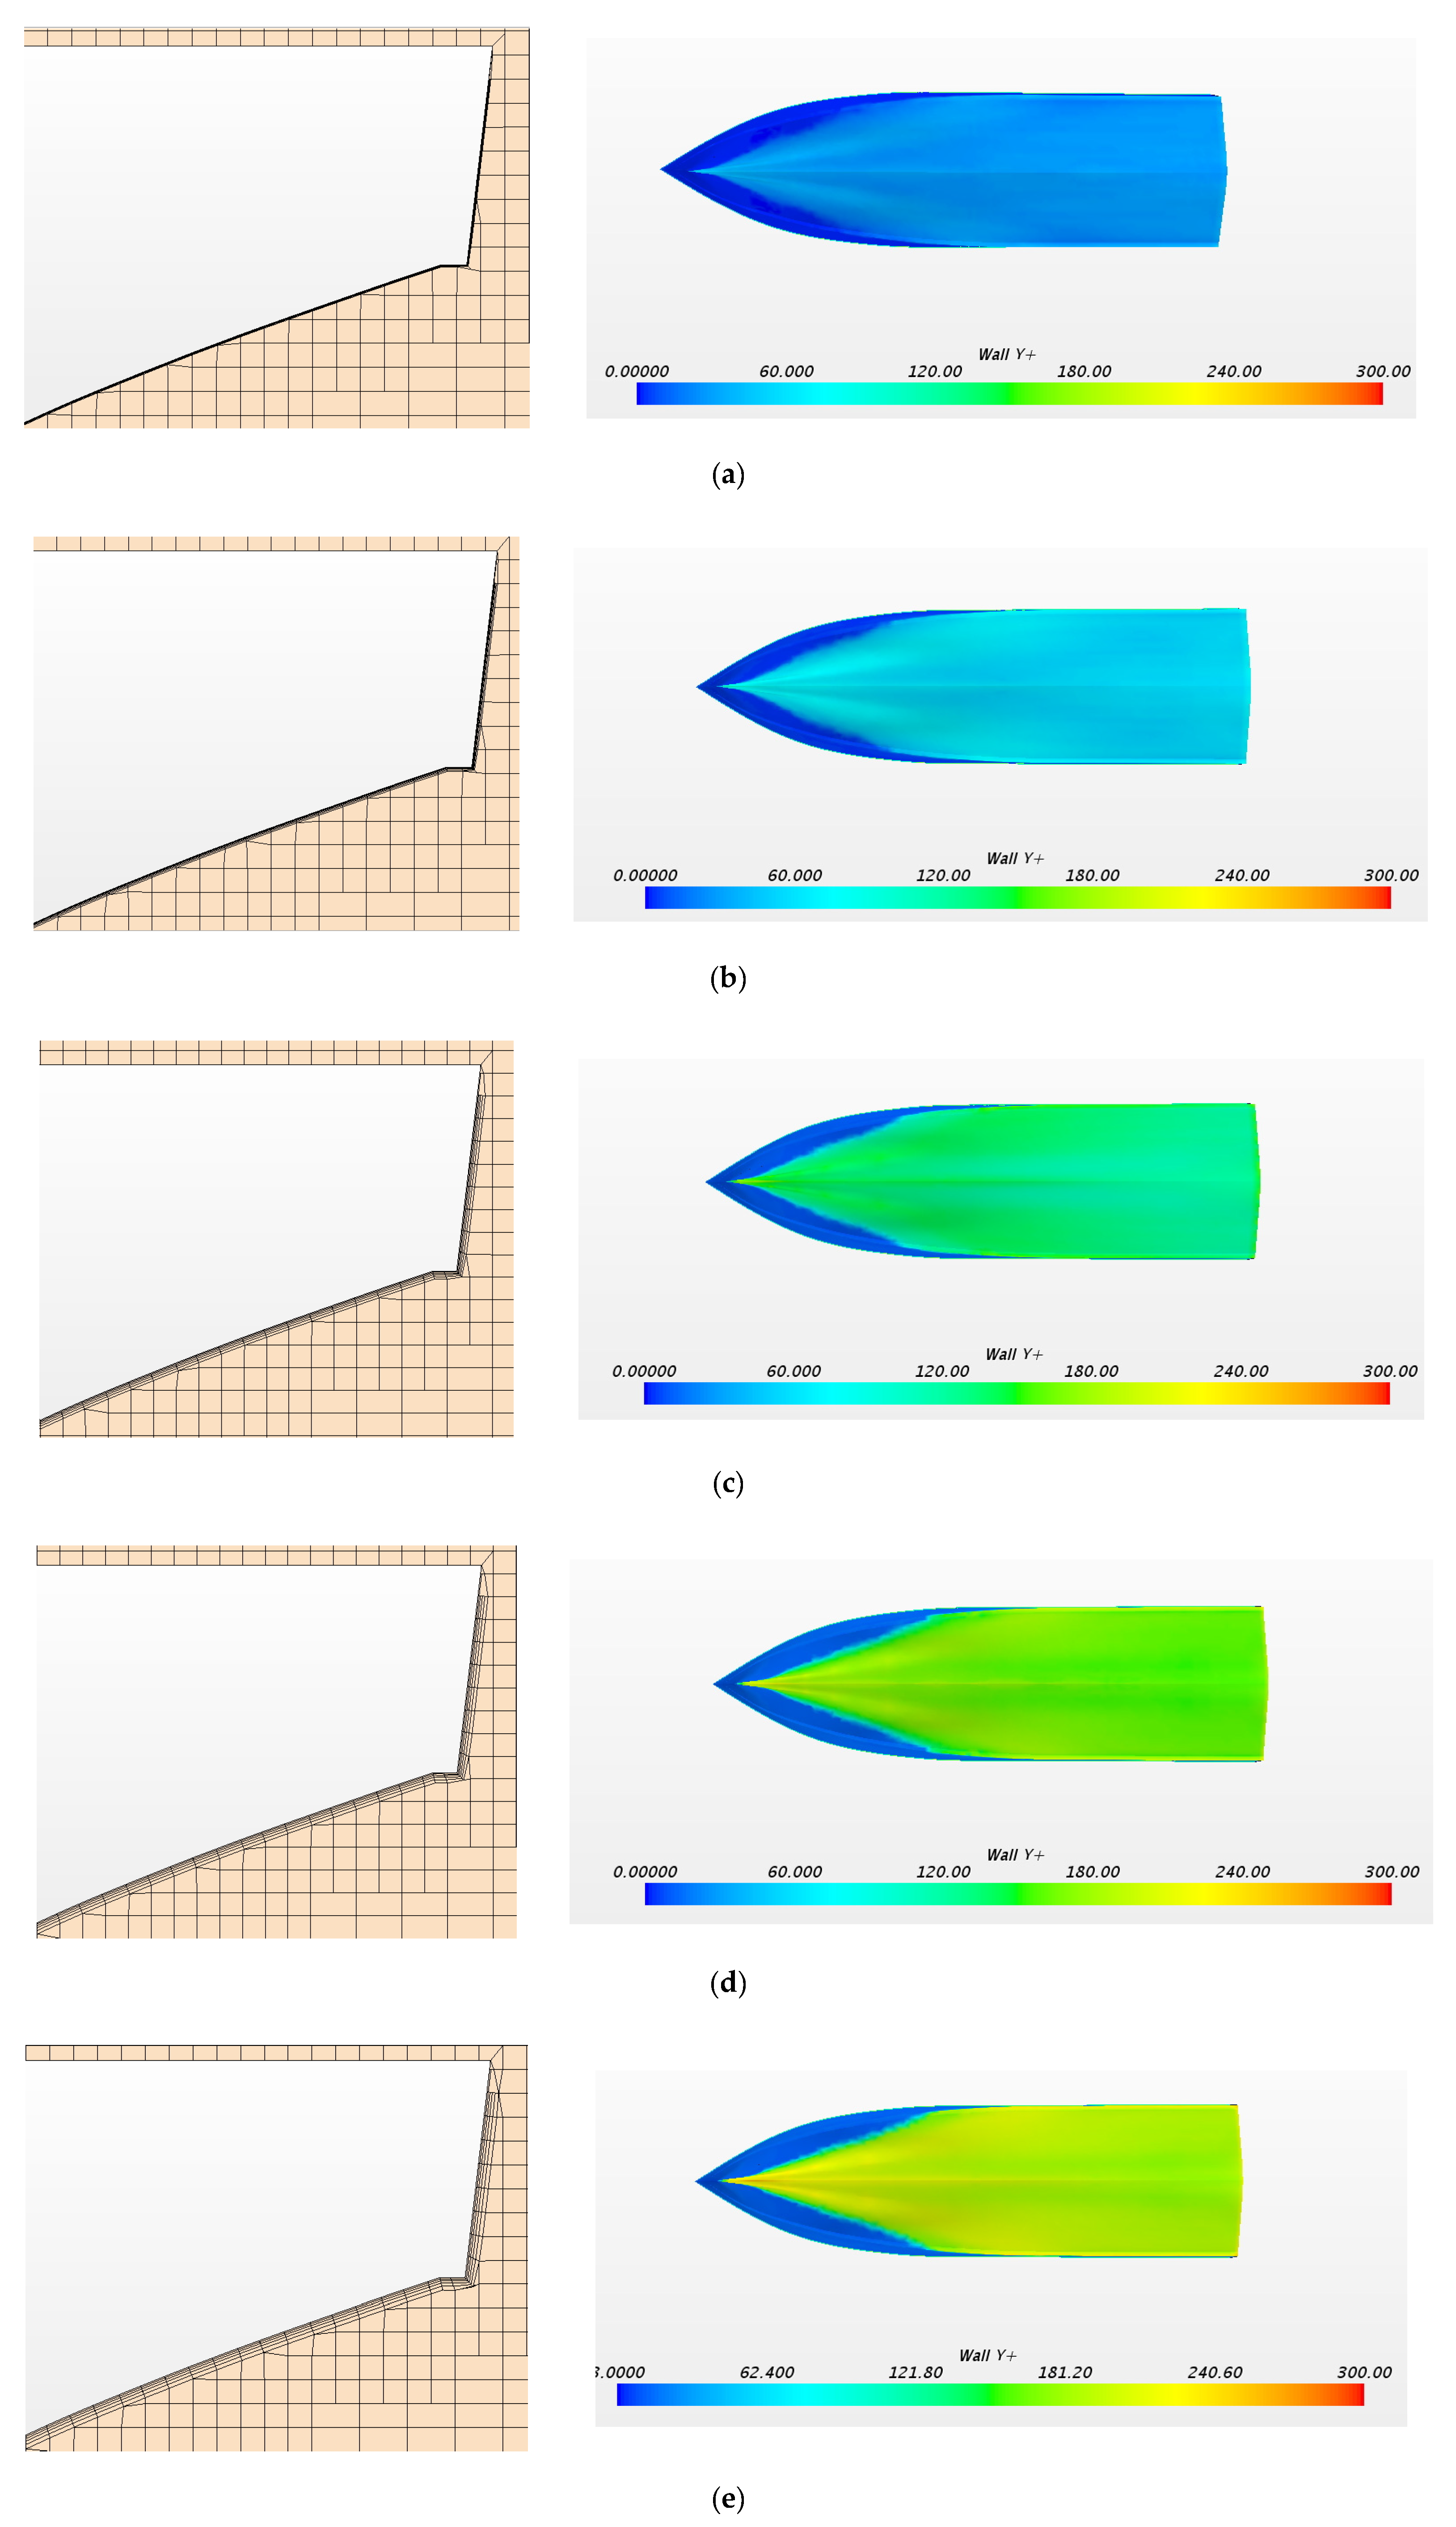
For verification, the influence of y
+, the values of 50, 100, 200, 250, and 300 were adopted, the boundary layer grid generated according to different values of y
+ are presented in
Figure 10.
The
Figure 10 indicates that the trim motion of the planing craft leads to a great change of the waterline of the vessel. The decrease of the waterline length makes the y
+ value of hull less than the theoretical value during the sailing.
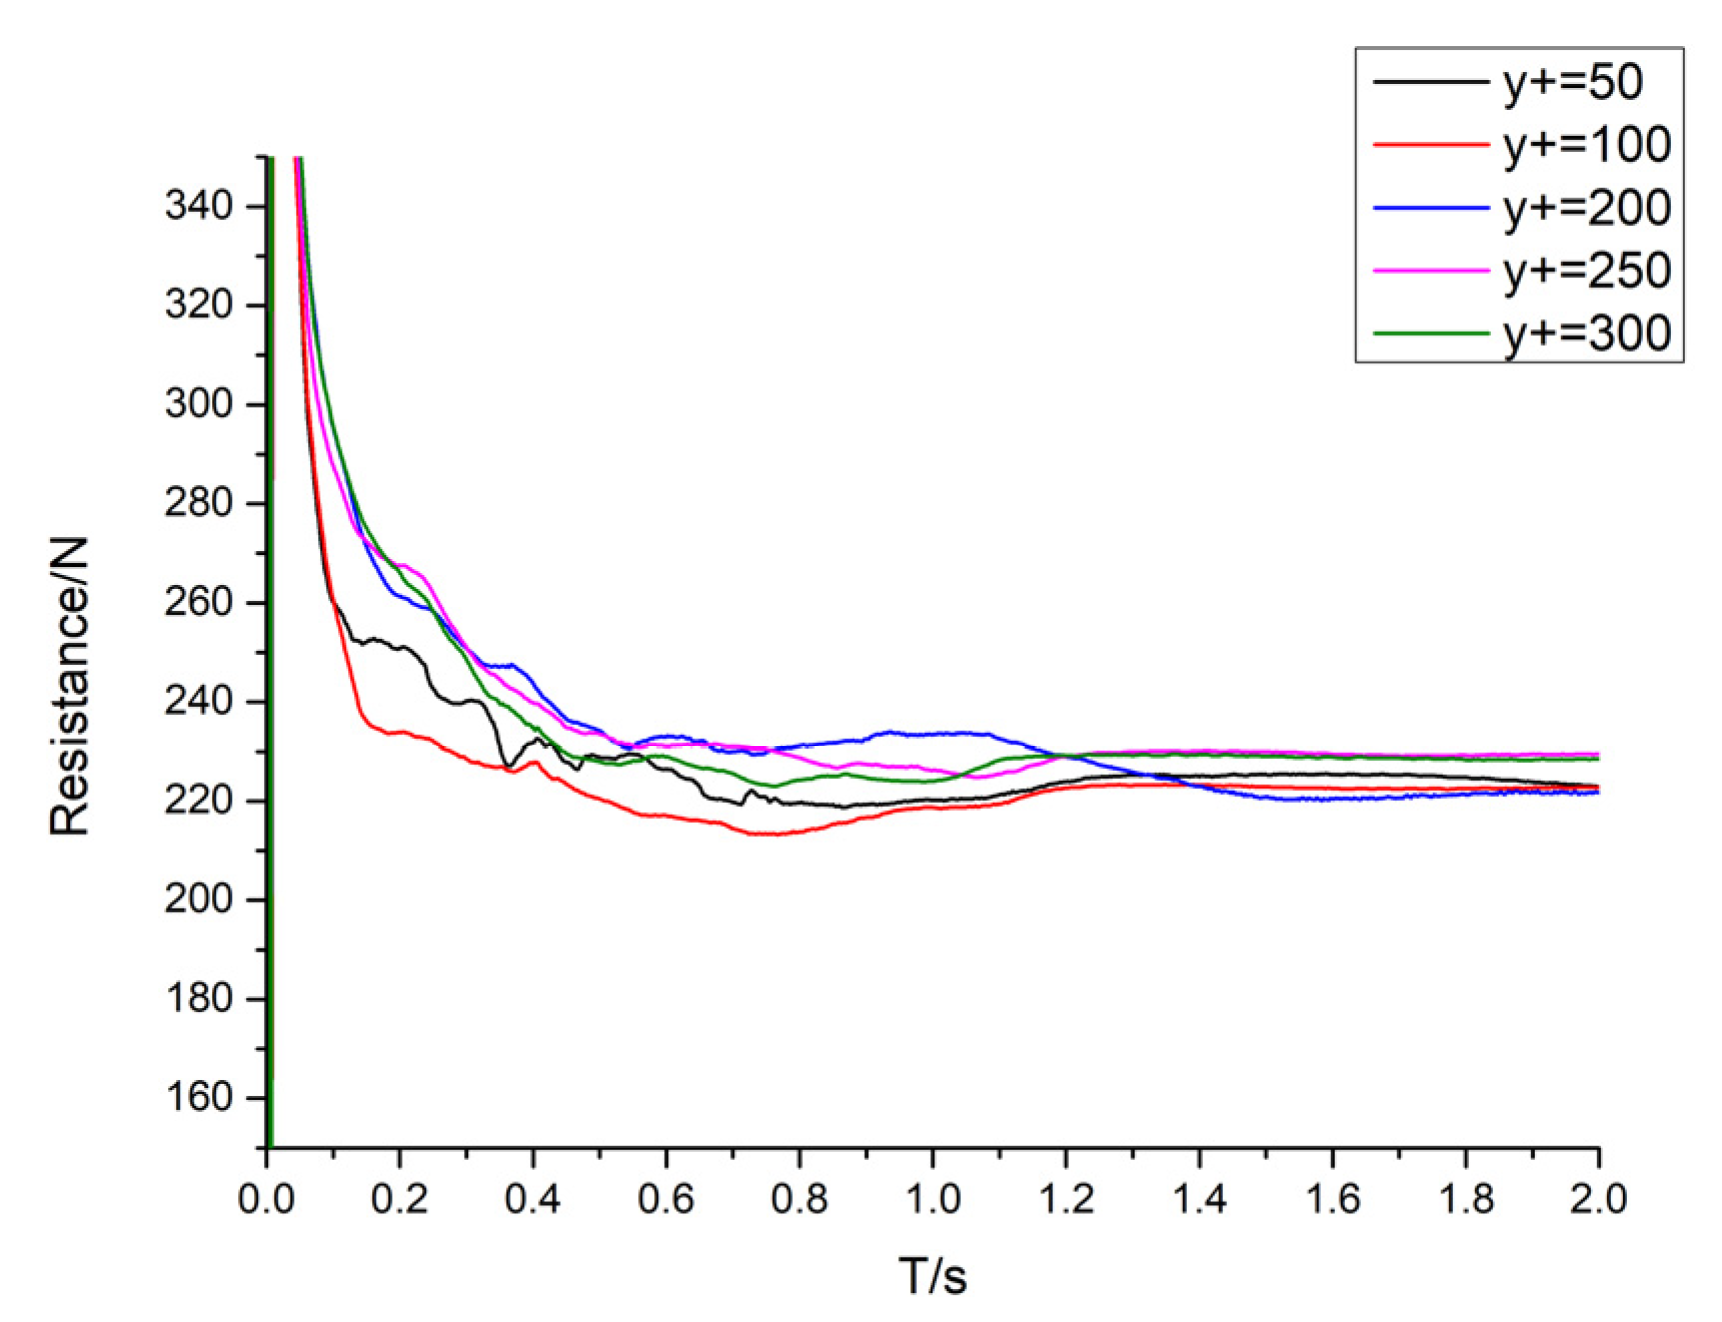
The numerical results and the resistance curves of different y
+ are presented in
Table 6 and
Figure 11, respectively.
The
Table 6 and
Figure 11 indicate that resistance curves corresponding different y+ have similar convergence. The deviations of different values of y
+ are all less than 10%, but the deviation which y
+ = 250 is the smallest. Due to the intense motion of the planing craft, the waterline length sharply reduces. A low y
+ value greatly affect the accuracy. In subsequent numerical simulations, the y
+ value was set at 250.
4.2.3. Time Step of Iteration
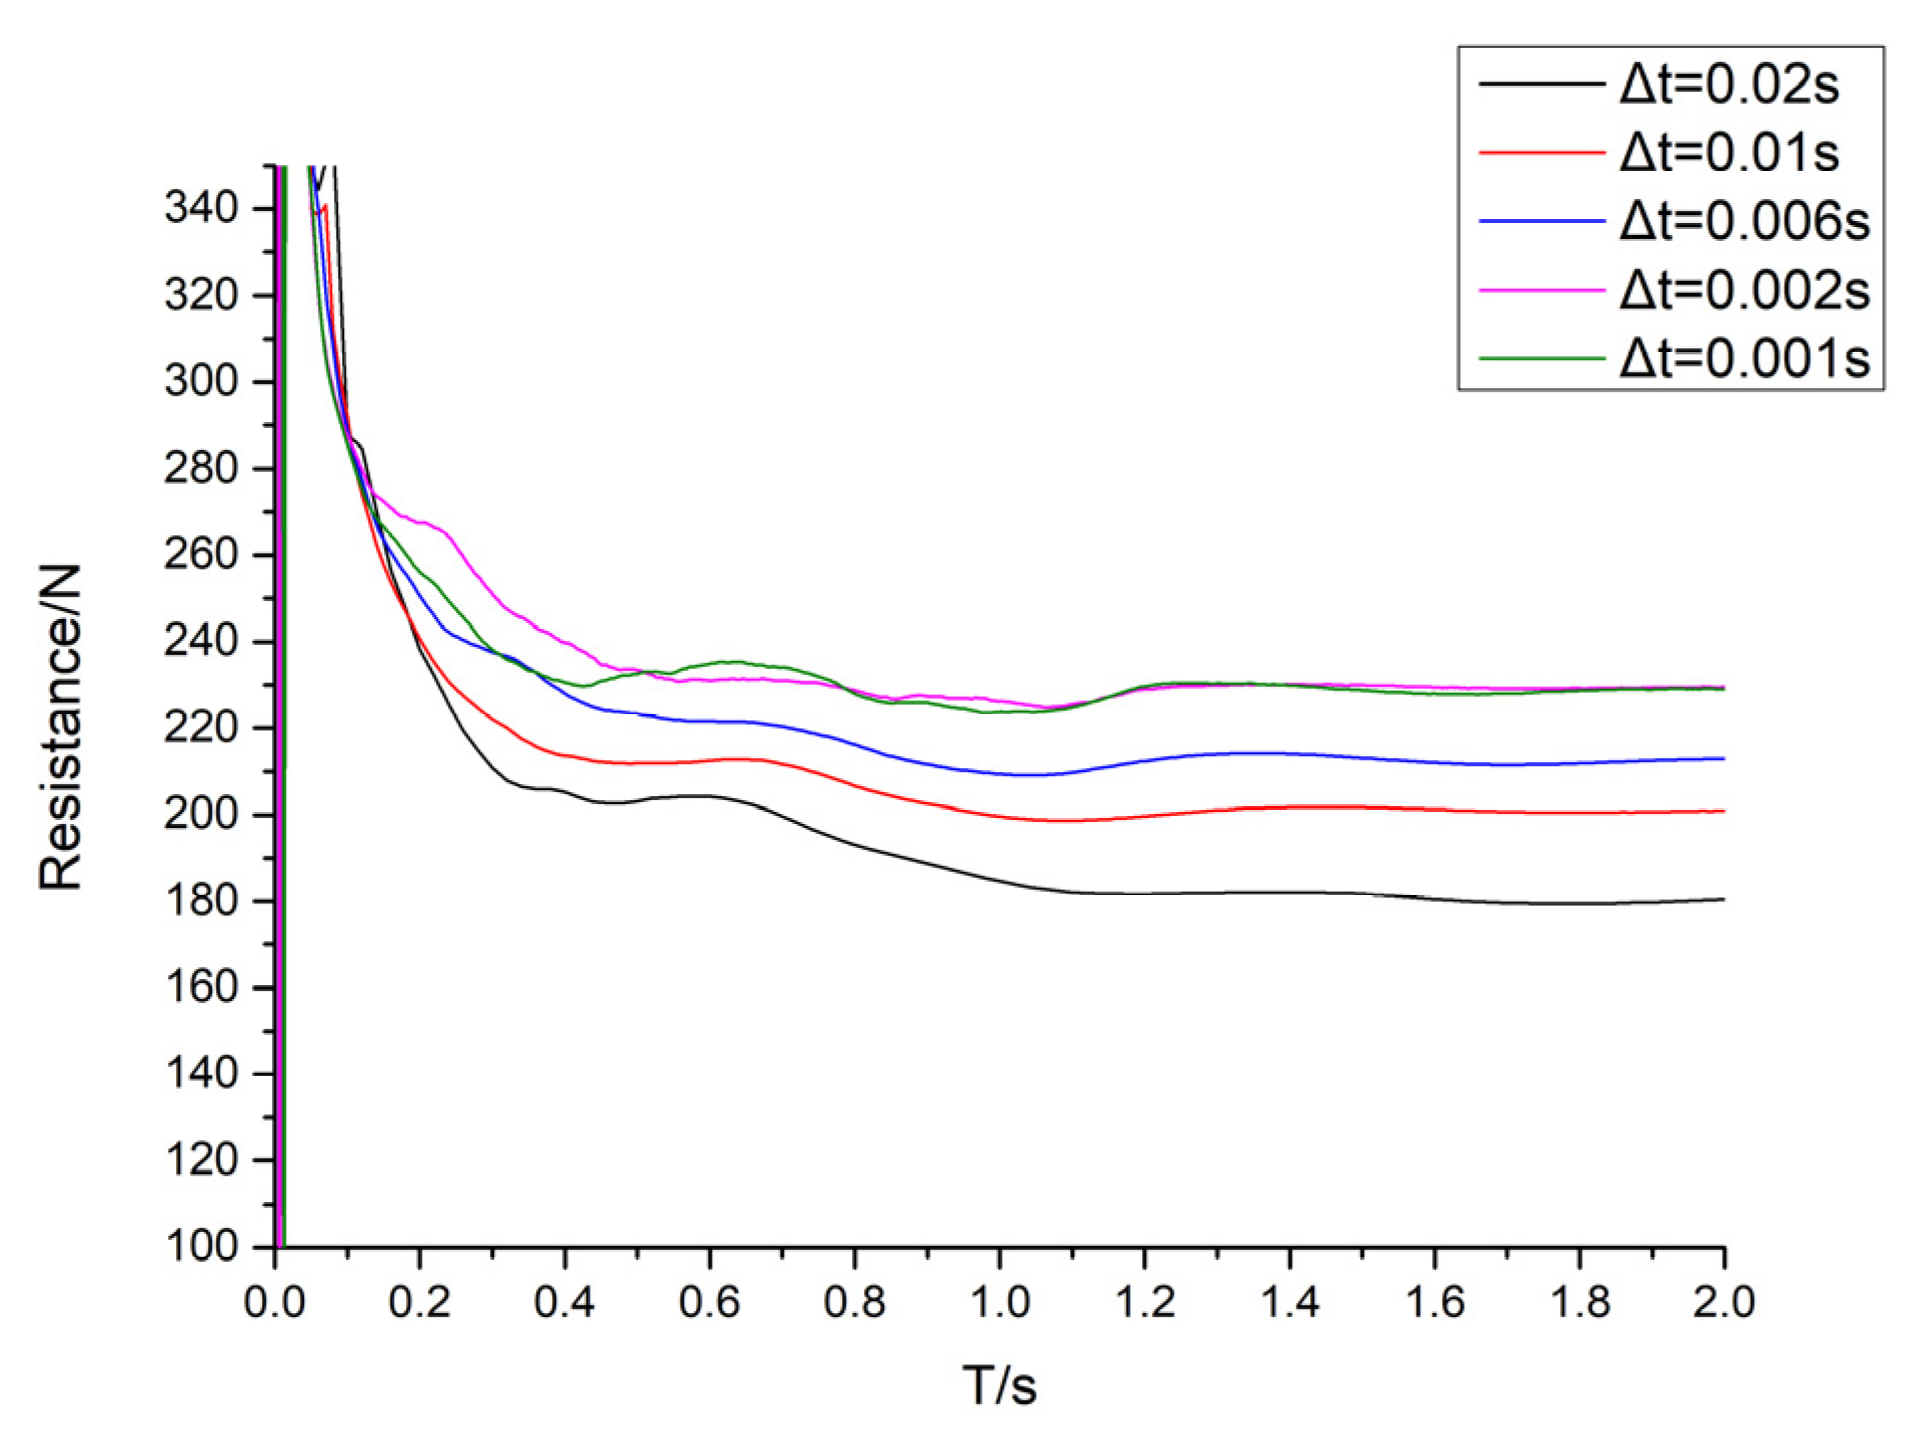
The ∆t (time step) of iteration should be set at the value which allows the physical field to move no less than the distance of the minimum free surface mesh in each iteration, thus improving the calculation efficiency, with the aim of ensuring accuracy.
To verify the value of ∆t, four values: 0.001 s, 0.002 s, 0.006 s, 0.01 s, 0.02 s were adopted and the numerical results corresponding to different values were compared in
Table 7 and the resistance curves of different y
+ are presented
Figure 12.
The comparison between results of different values of ∆t indicate that the convergence trends of the five resistance curves are consistent, but different values will affect the accuracy of numerical results. The deviations of the results become larger with the increasing of ∆t, this indicates a short time interval between two iterations will benefit the accuracy of the numerical results. But a too small value of ∆t can lead to a waste of computational efficiency. The results of ∆t = 0.001 s and 0.002 s are almost the same and the accuracy is high, ∆t = 0.002 s is adopted for its better accuracy and computational efficiency.
Summing up the above, the influence of the grid parameter, value of y+, and the time step of iteration on the accuracy and computational efficiency are verified. The results show that the numerical method has good convergence and high accuracy in simulating of the sailing of USV01 in calm water. Based on the overset method which has been verified, the numerical simulation validation for the seakeeping test of USV01 will be carried out.
4.3. Validation of Numerical Method
On the basis of the verification of overset method, the grid parameters refer to grid 3, the value of y+ is set at 250, the ∆t is set at 0.002 s. In this way both the accuracy and computational efficiency are guaranteed.
In the numerical simulation of seakeeping tests, the setting of calculation domains, grid parameters, and ∆t are referenced to the
Section 4.1 and
Section 4.2, meanwhile, in the wave conditions the flow field of the free surface is more complicated, the refinement region around the free surface needs to contain the entire wave surface and the vertical refinement grid should be not less than 10 layers. When the motion of the model in regular wave tends to stabilize and sails at least five wave lengths, the response amplitude operators of the model were obtained. The calculation grids of the numerical simulations of seakeeping tests are presented in
Figure 13.
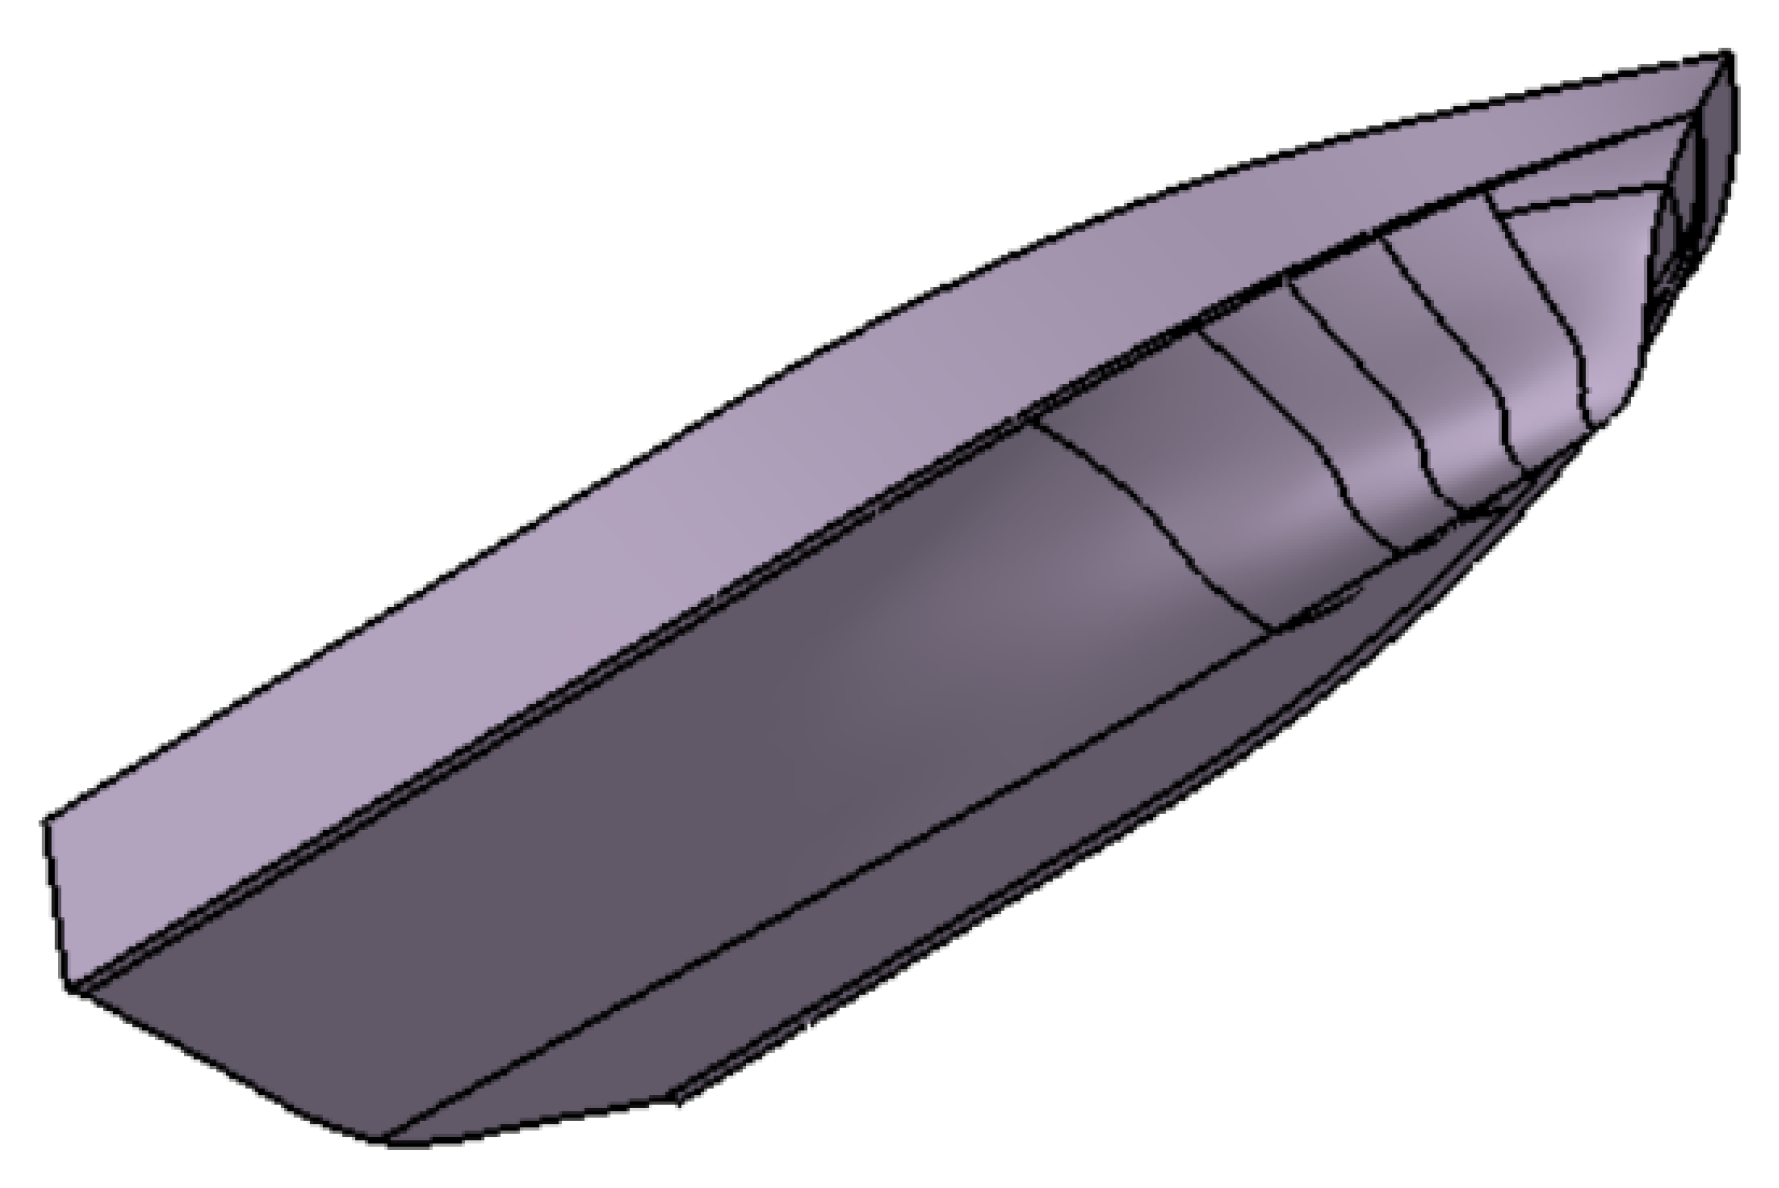
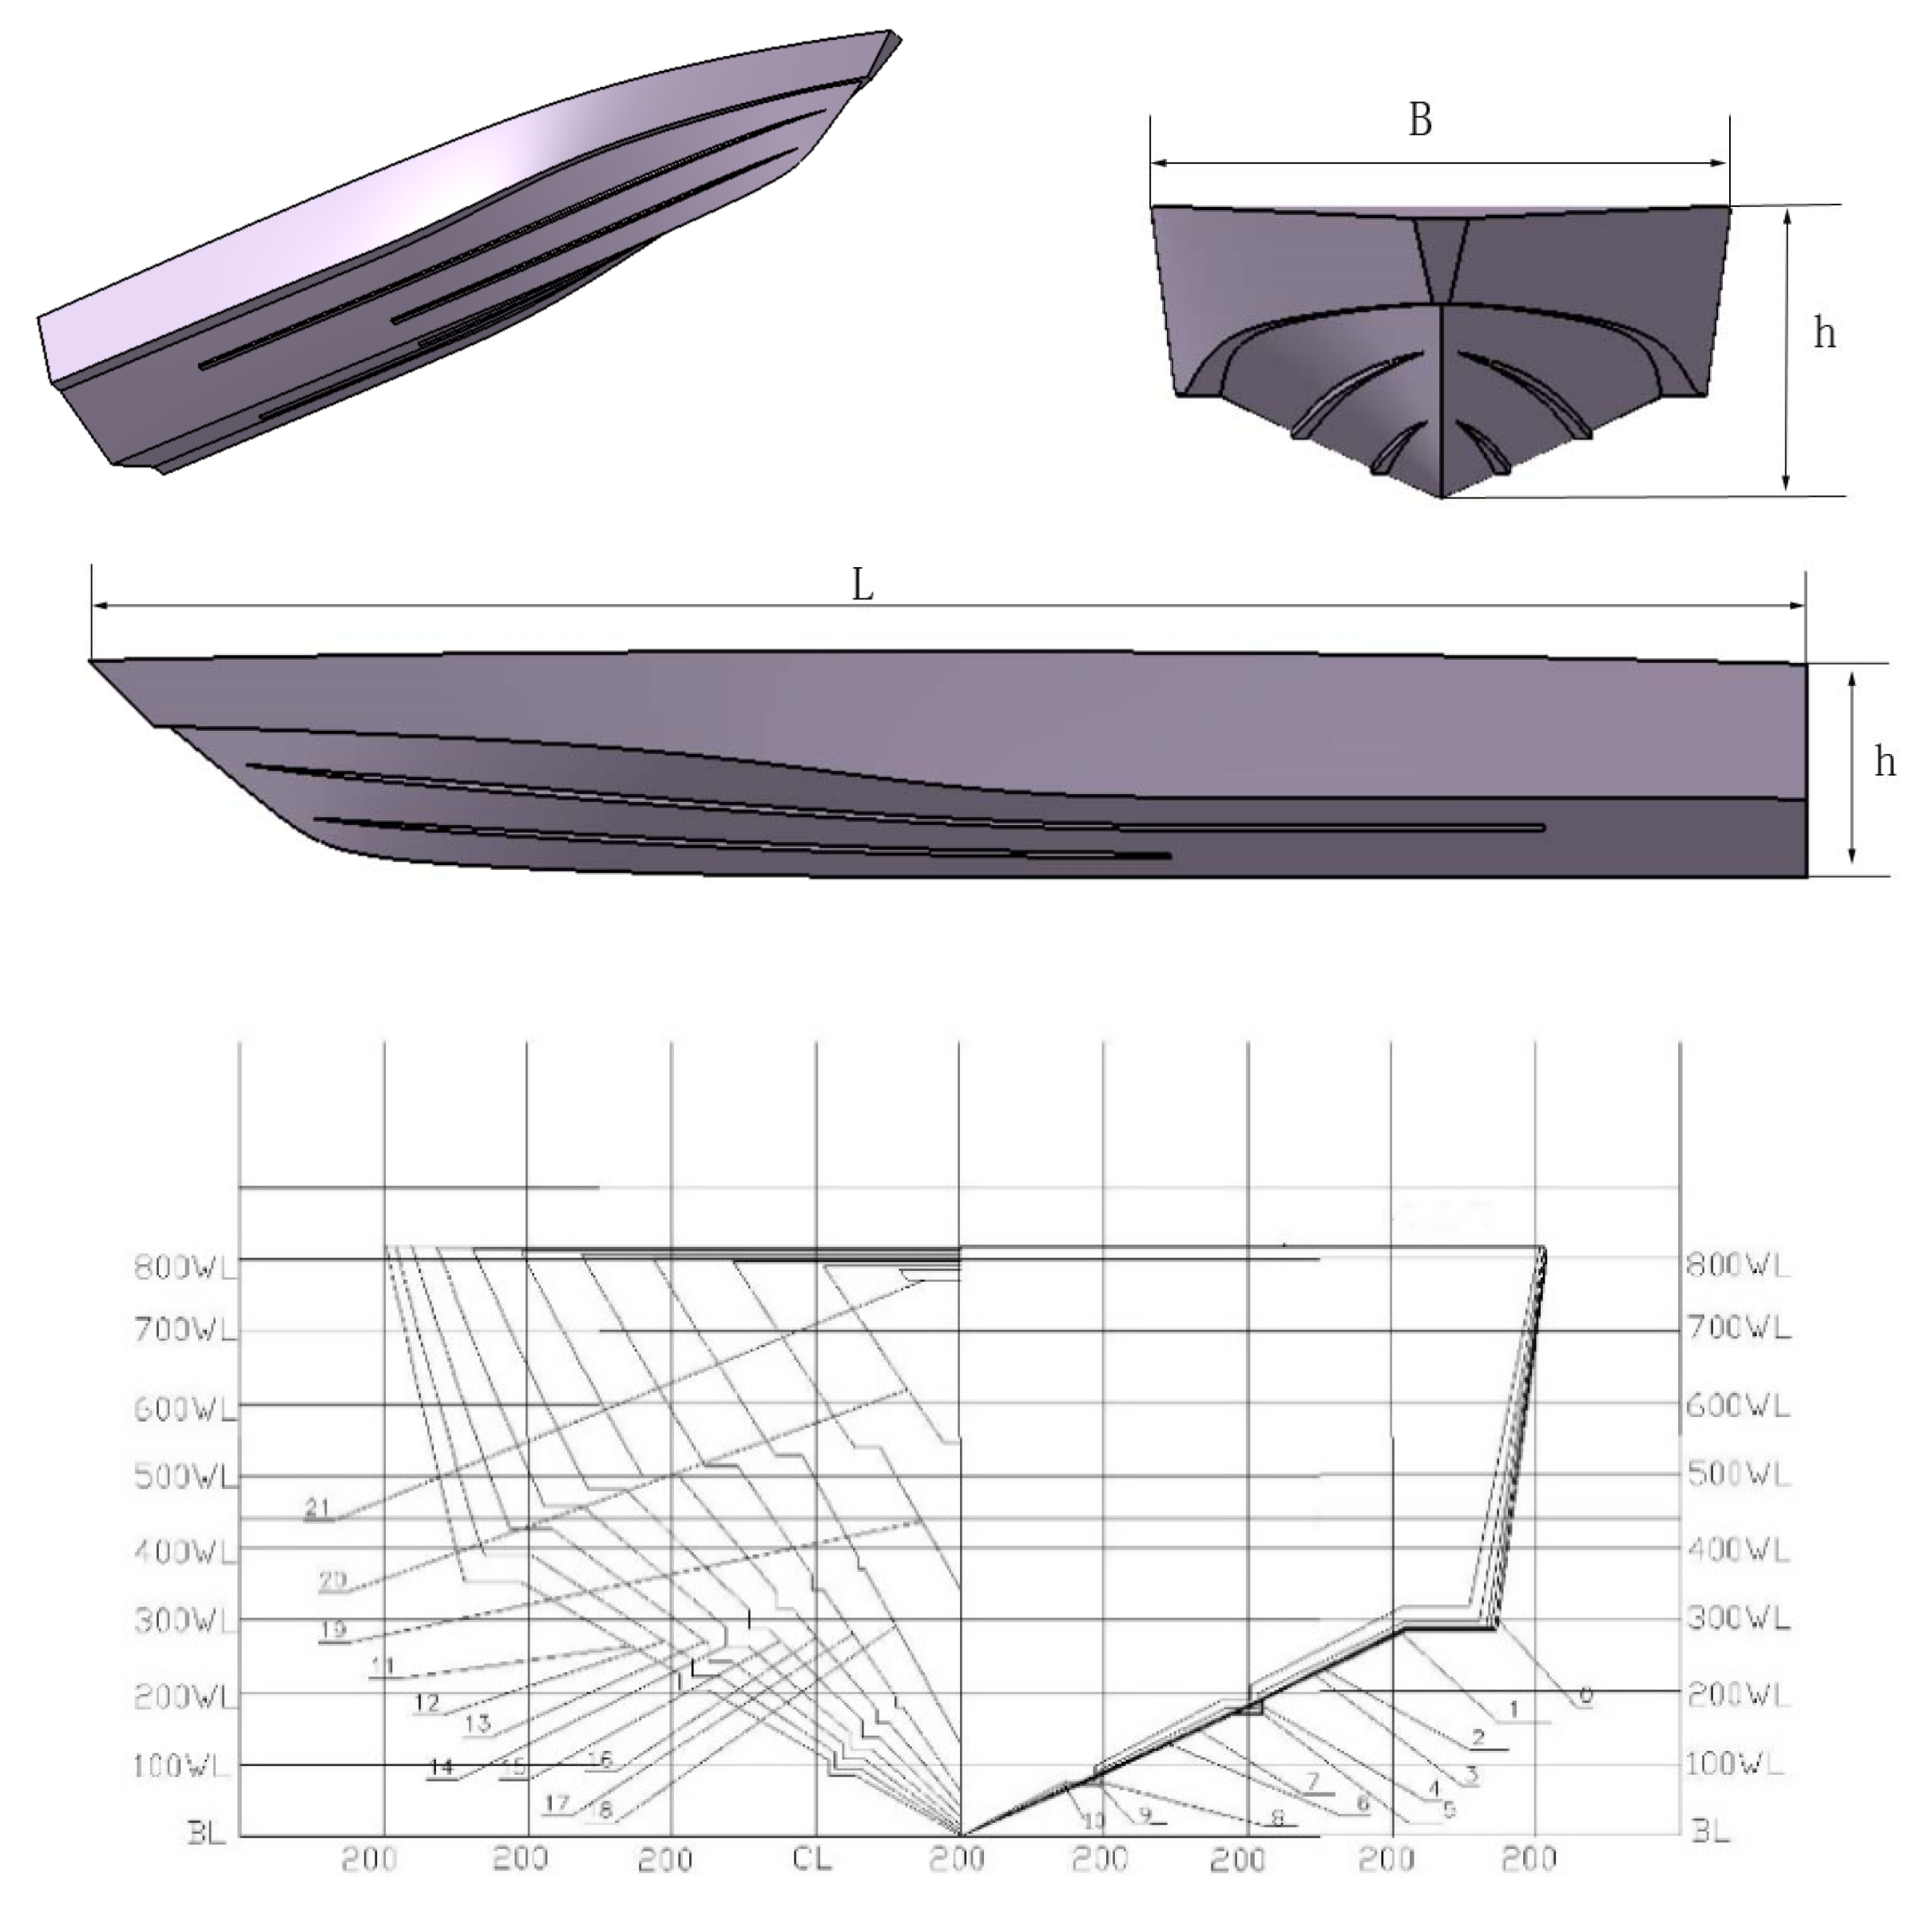
The 3D model in the numerical simulation is quite the same as the model of USV01, which is shown in
Figure 1, and regular wave conditions (1–6;
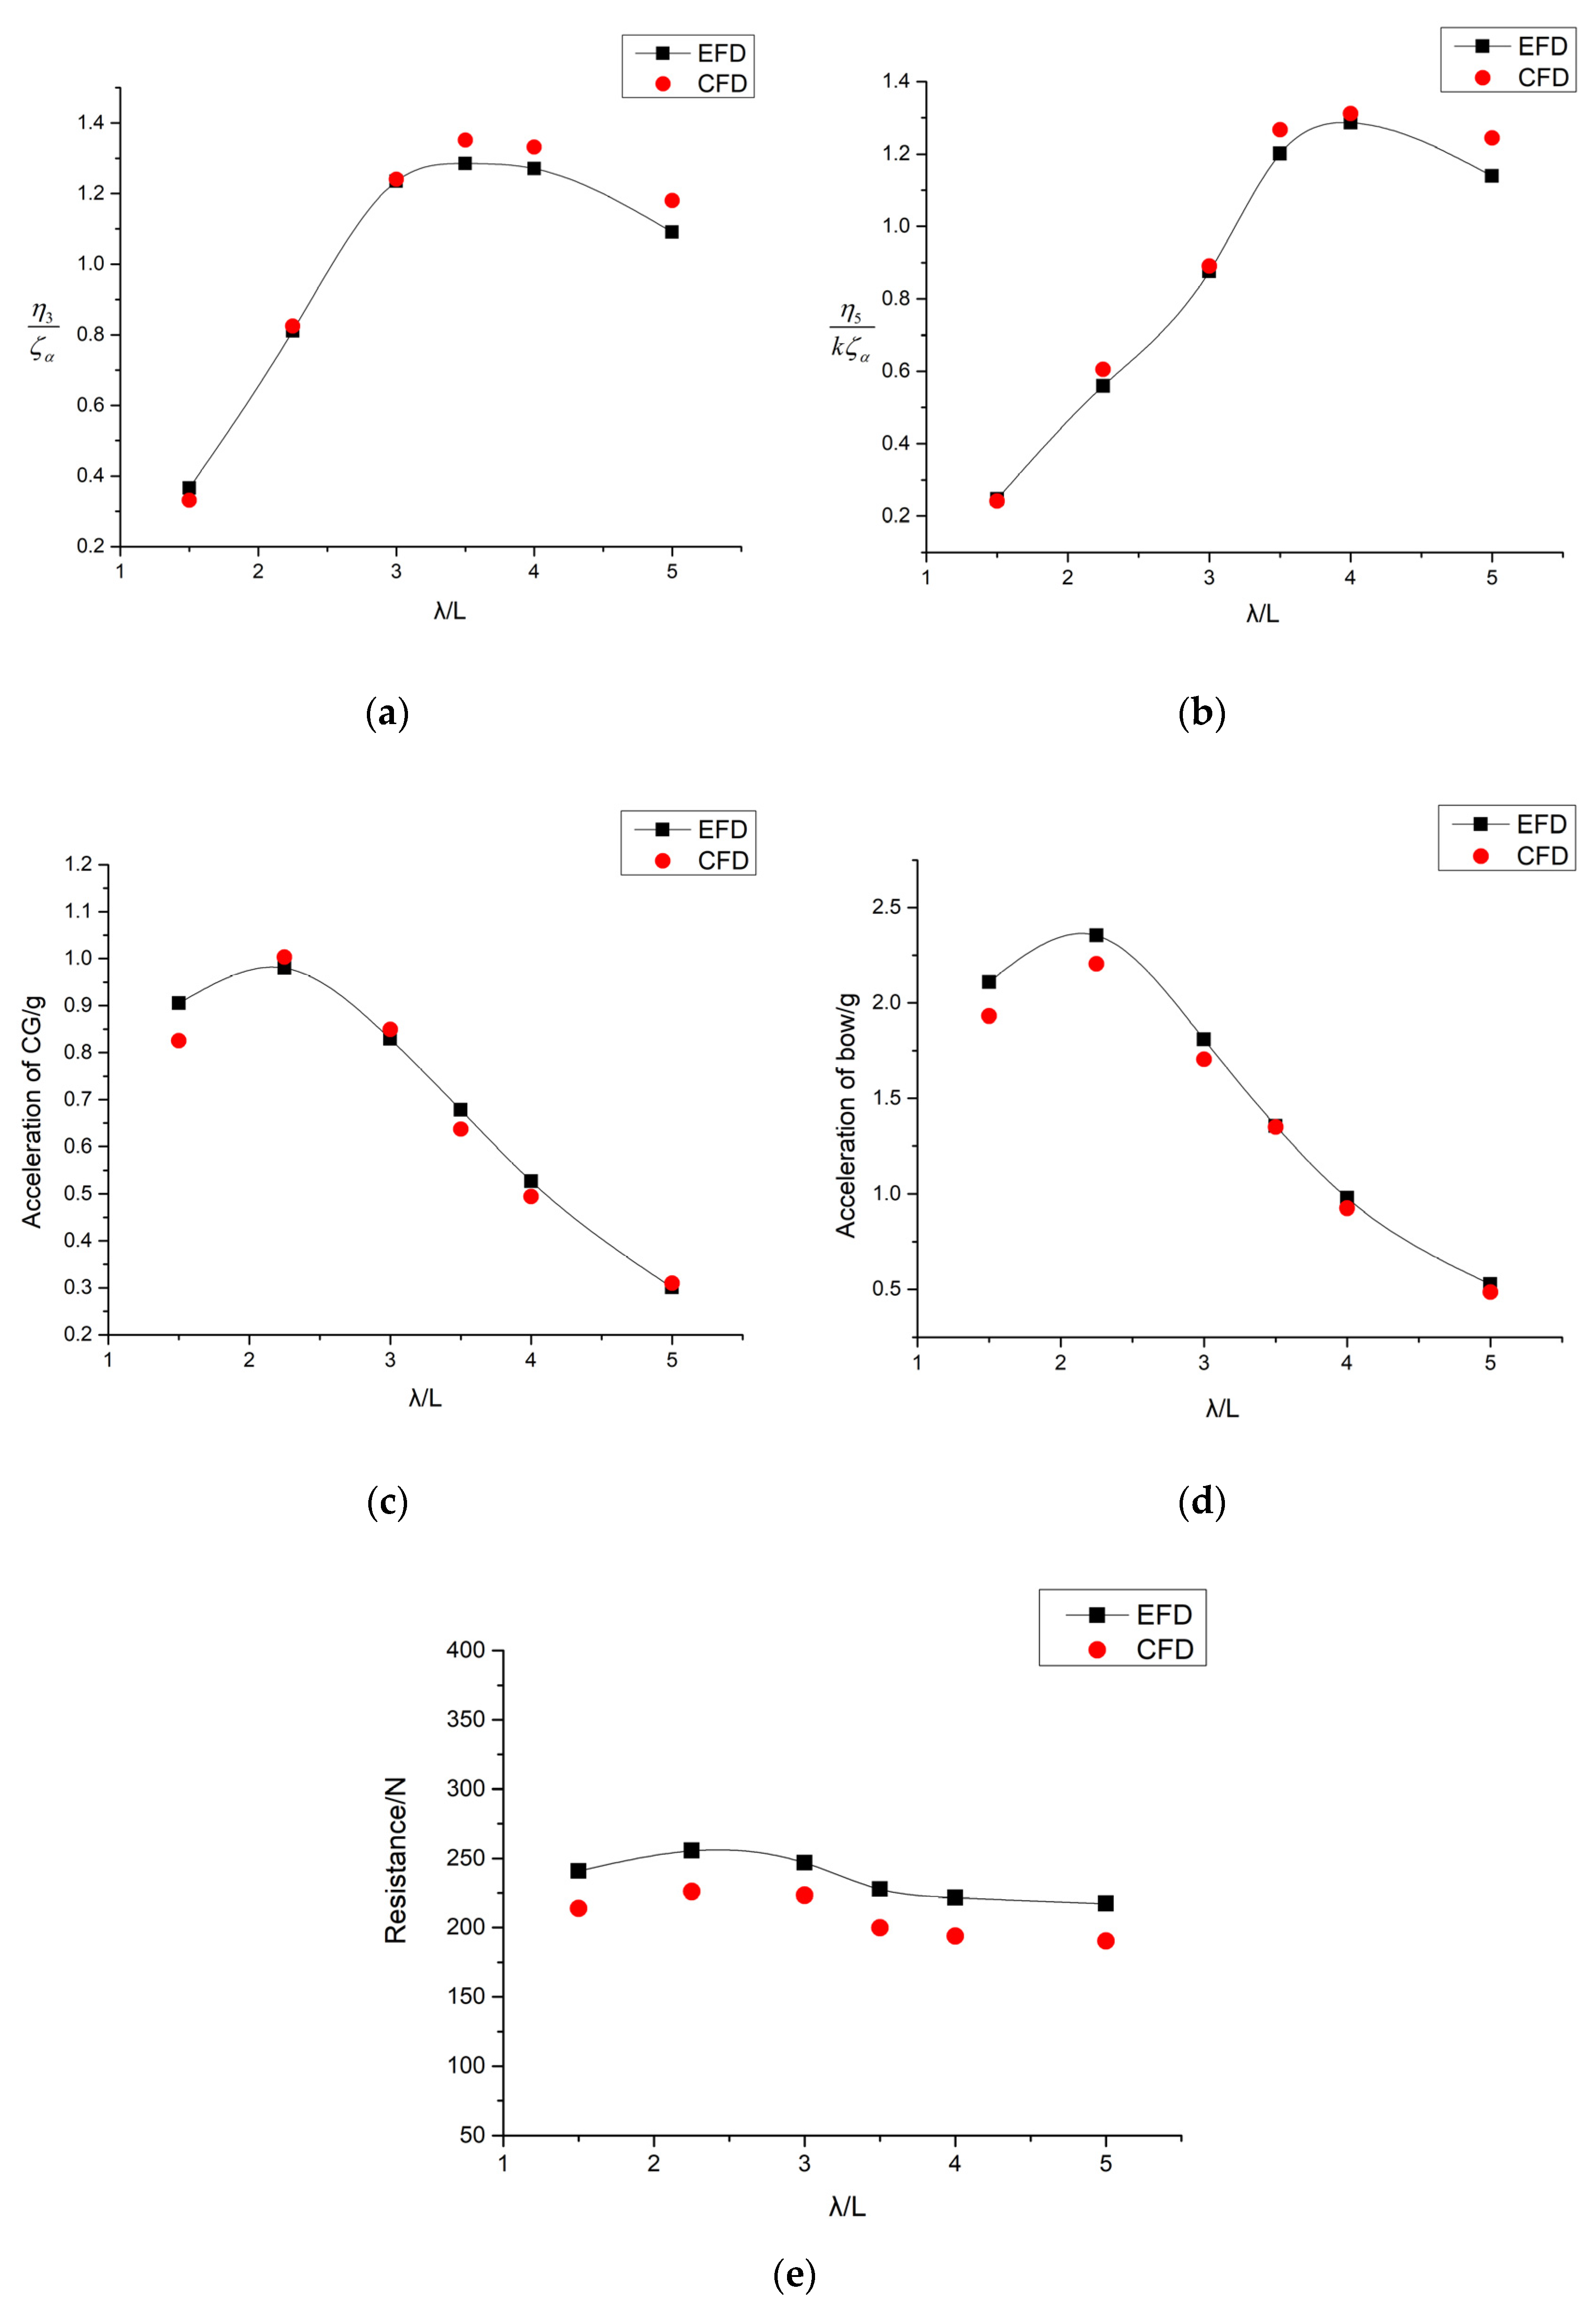
Table 4) were adopted in the simulation. The response amplitude operators (RAOs) of the model, including the amplitude values of the heave, pitch angle and acceleration of the CG and bow and the average resistance under head wave conditions, were numerically predicted. After the model sailed steadily in regular wave at least five wavelengths, the curves of the motion response and resistance were acquired. The peak peak values of the motion response can be accessed directly, the average resistance is obtained by averaging the convergence resistance curve. The comparisons between the numerical and test results are presented in
Table 8 and
Figure 14, respectively.
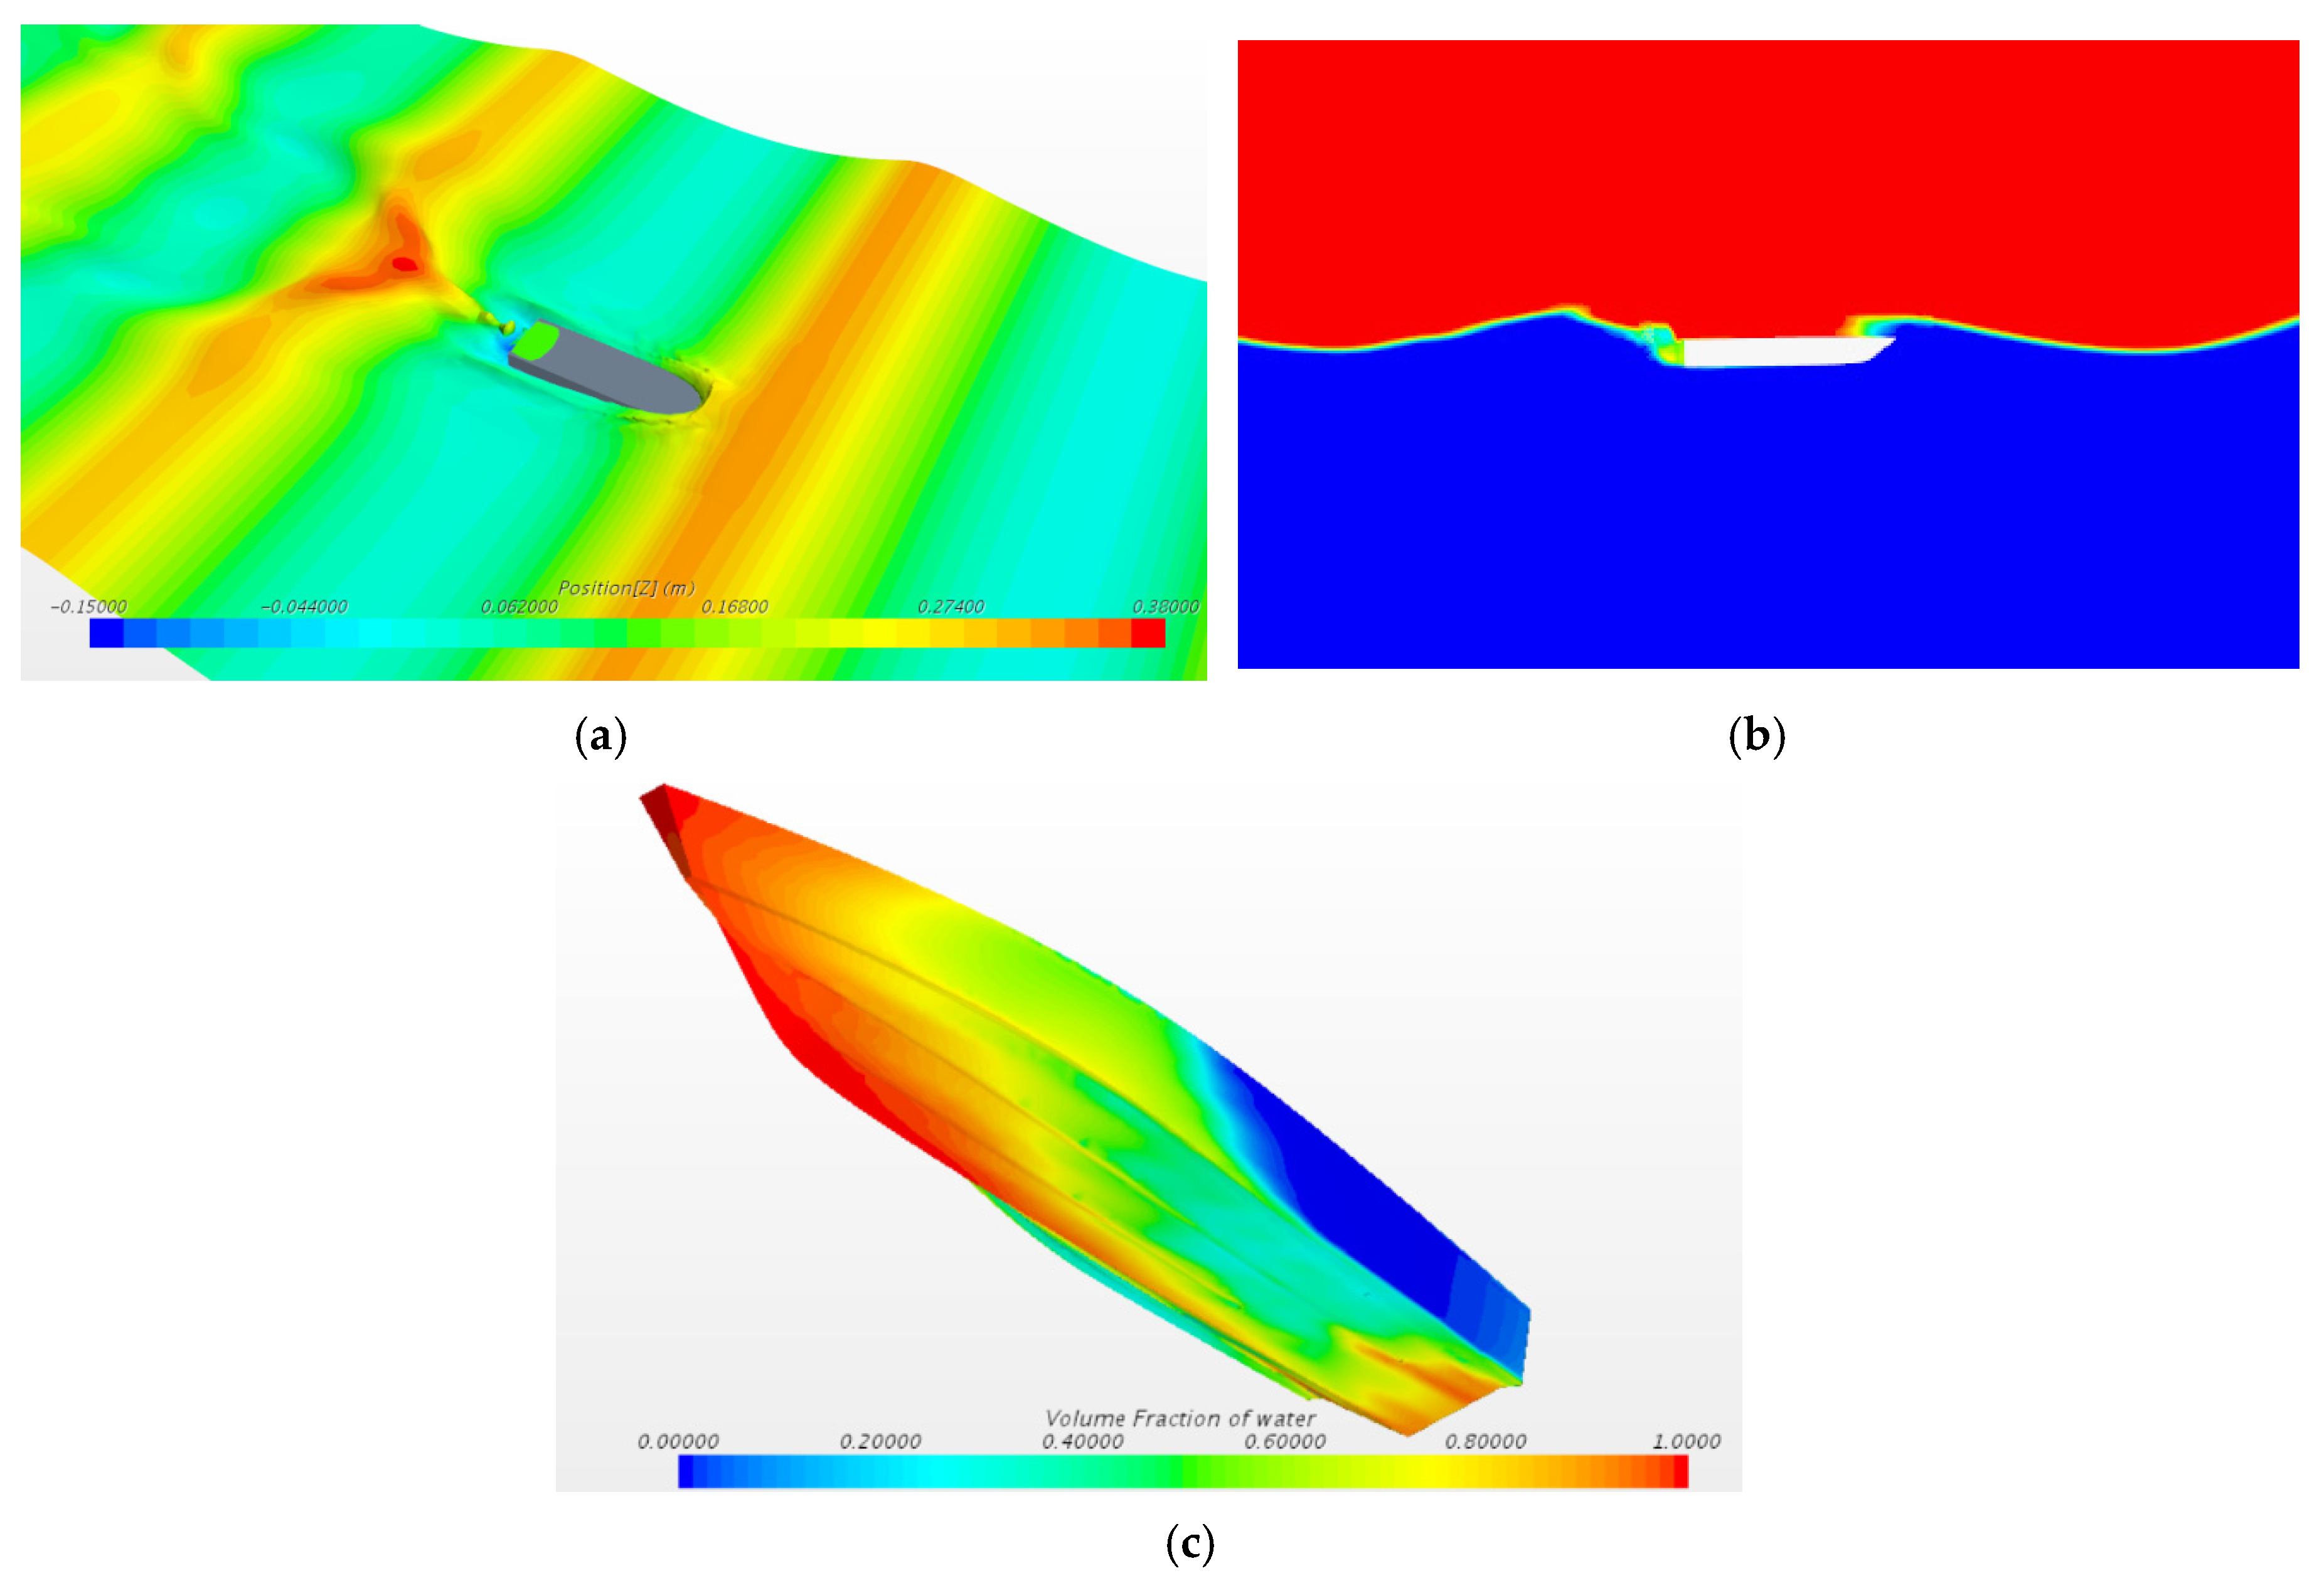
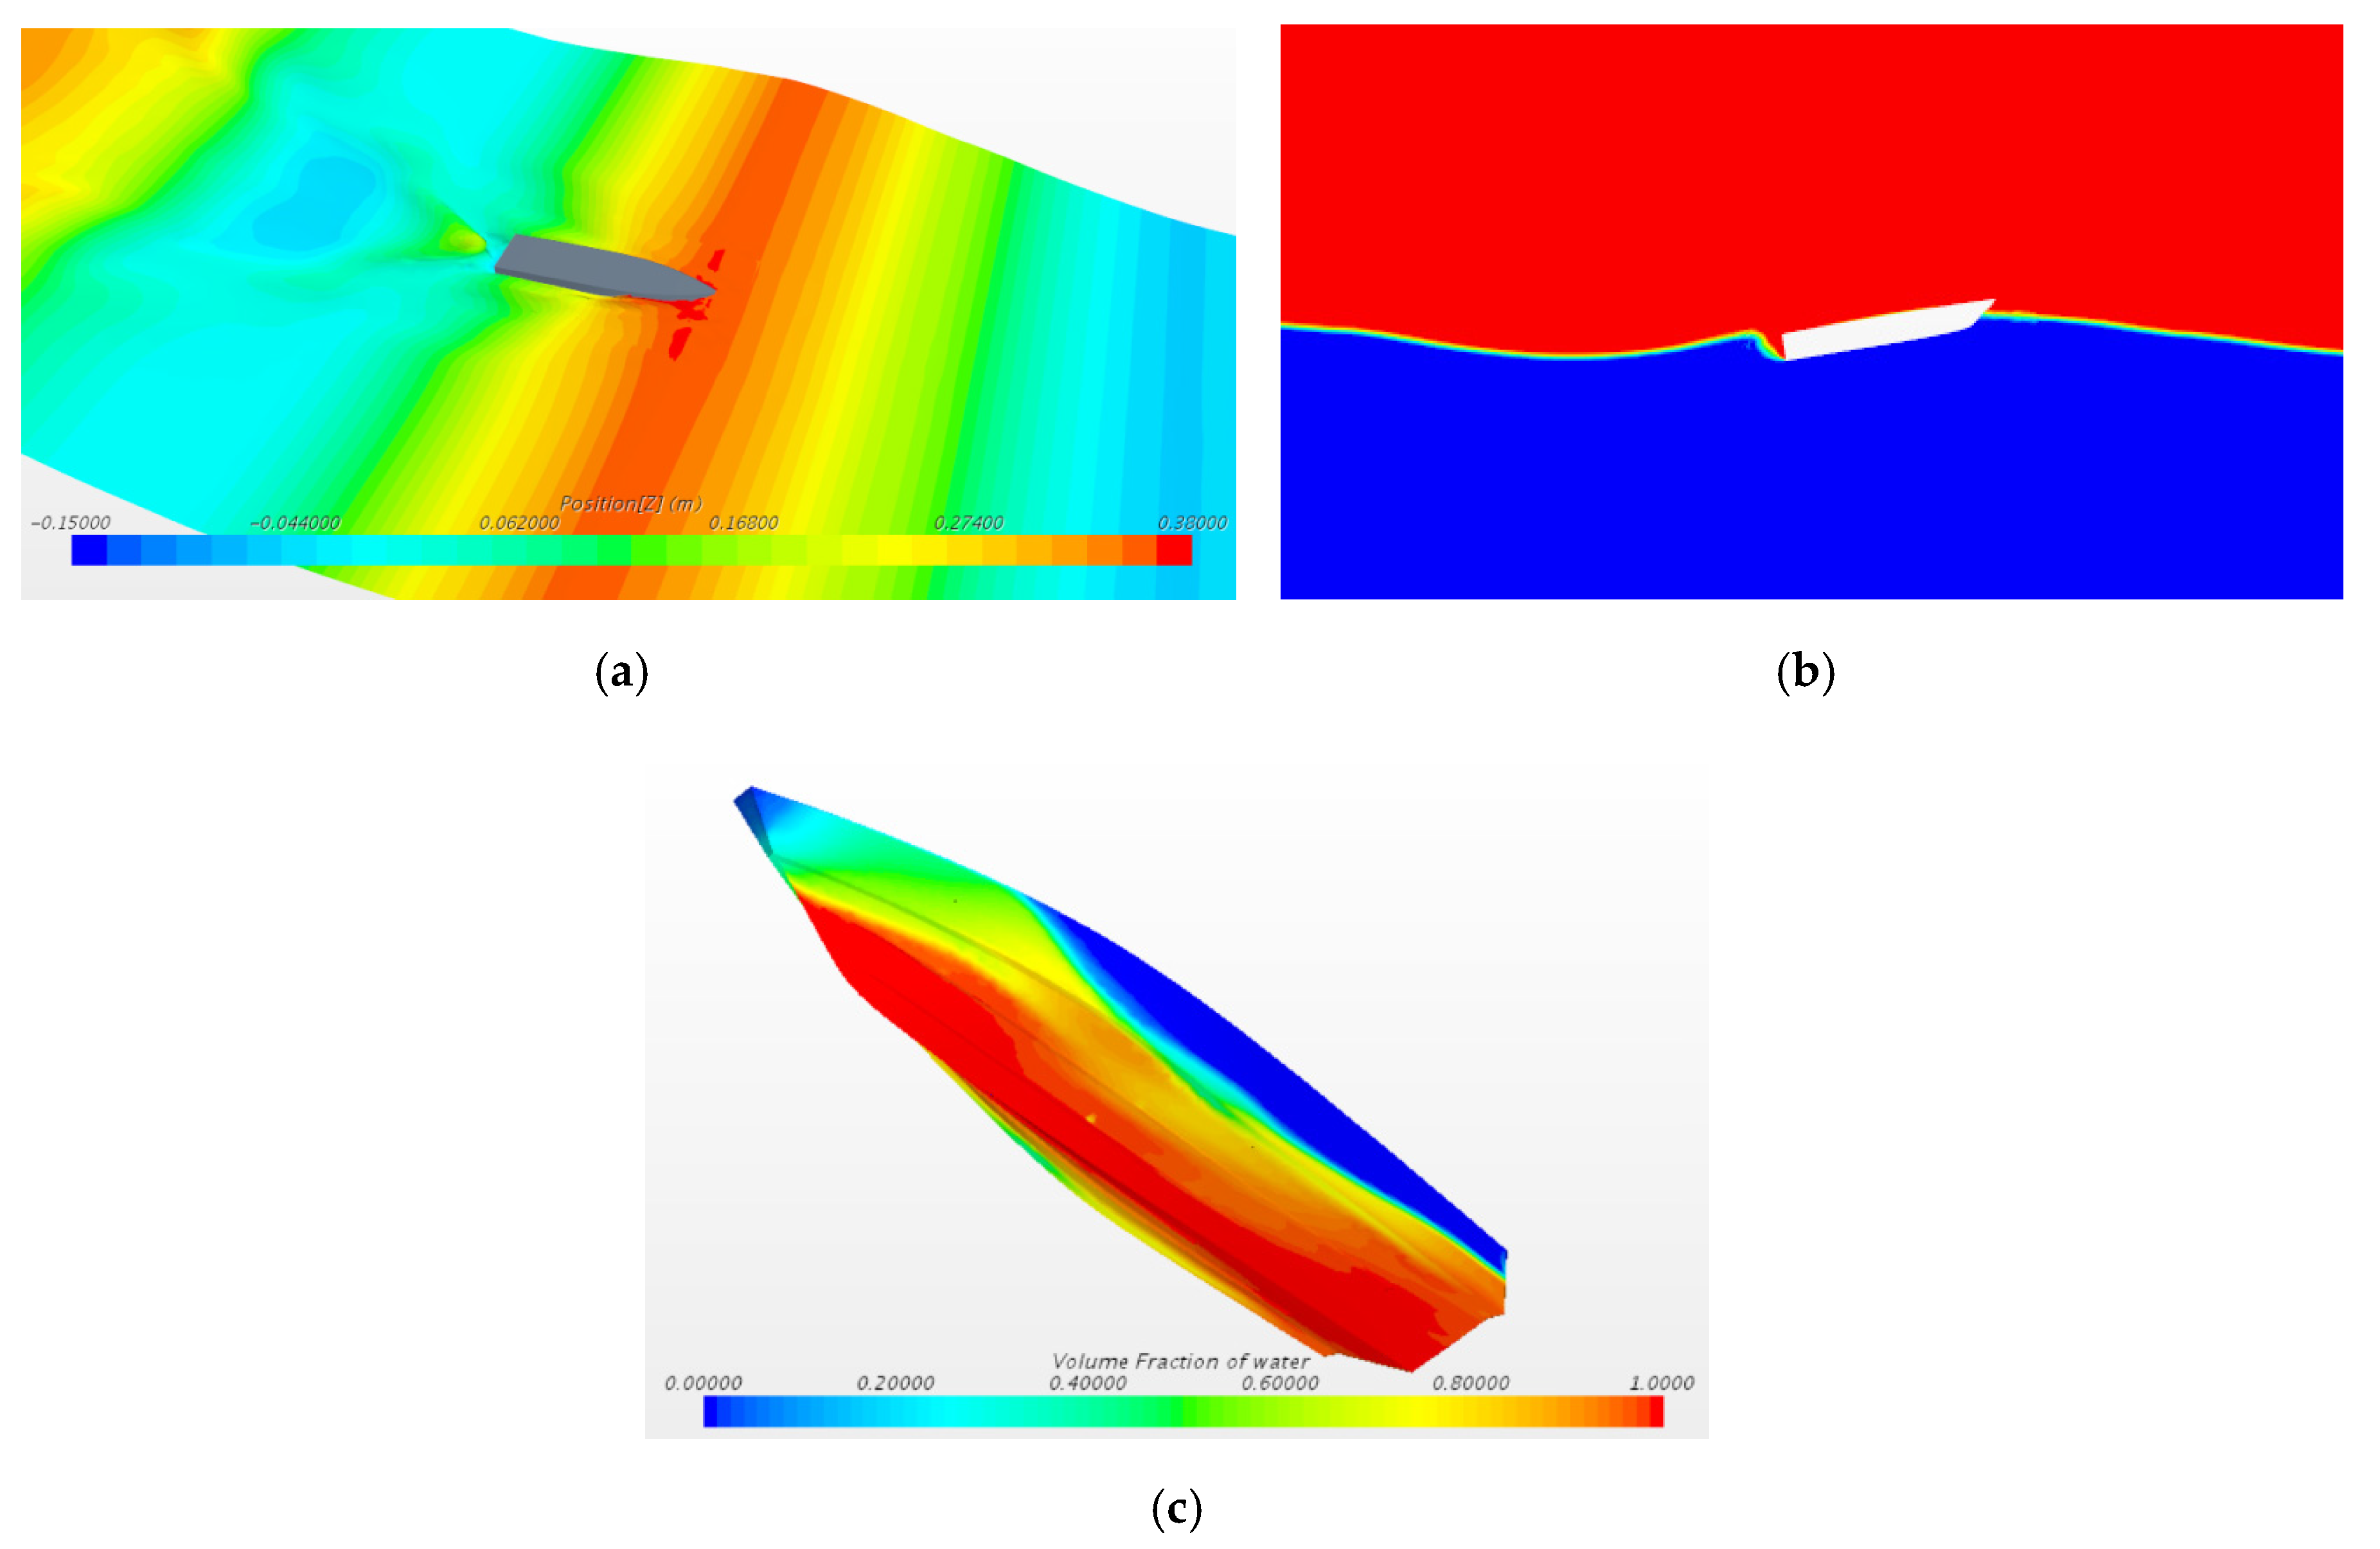
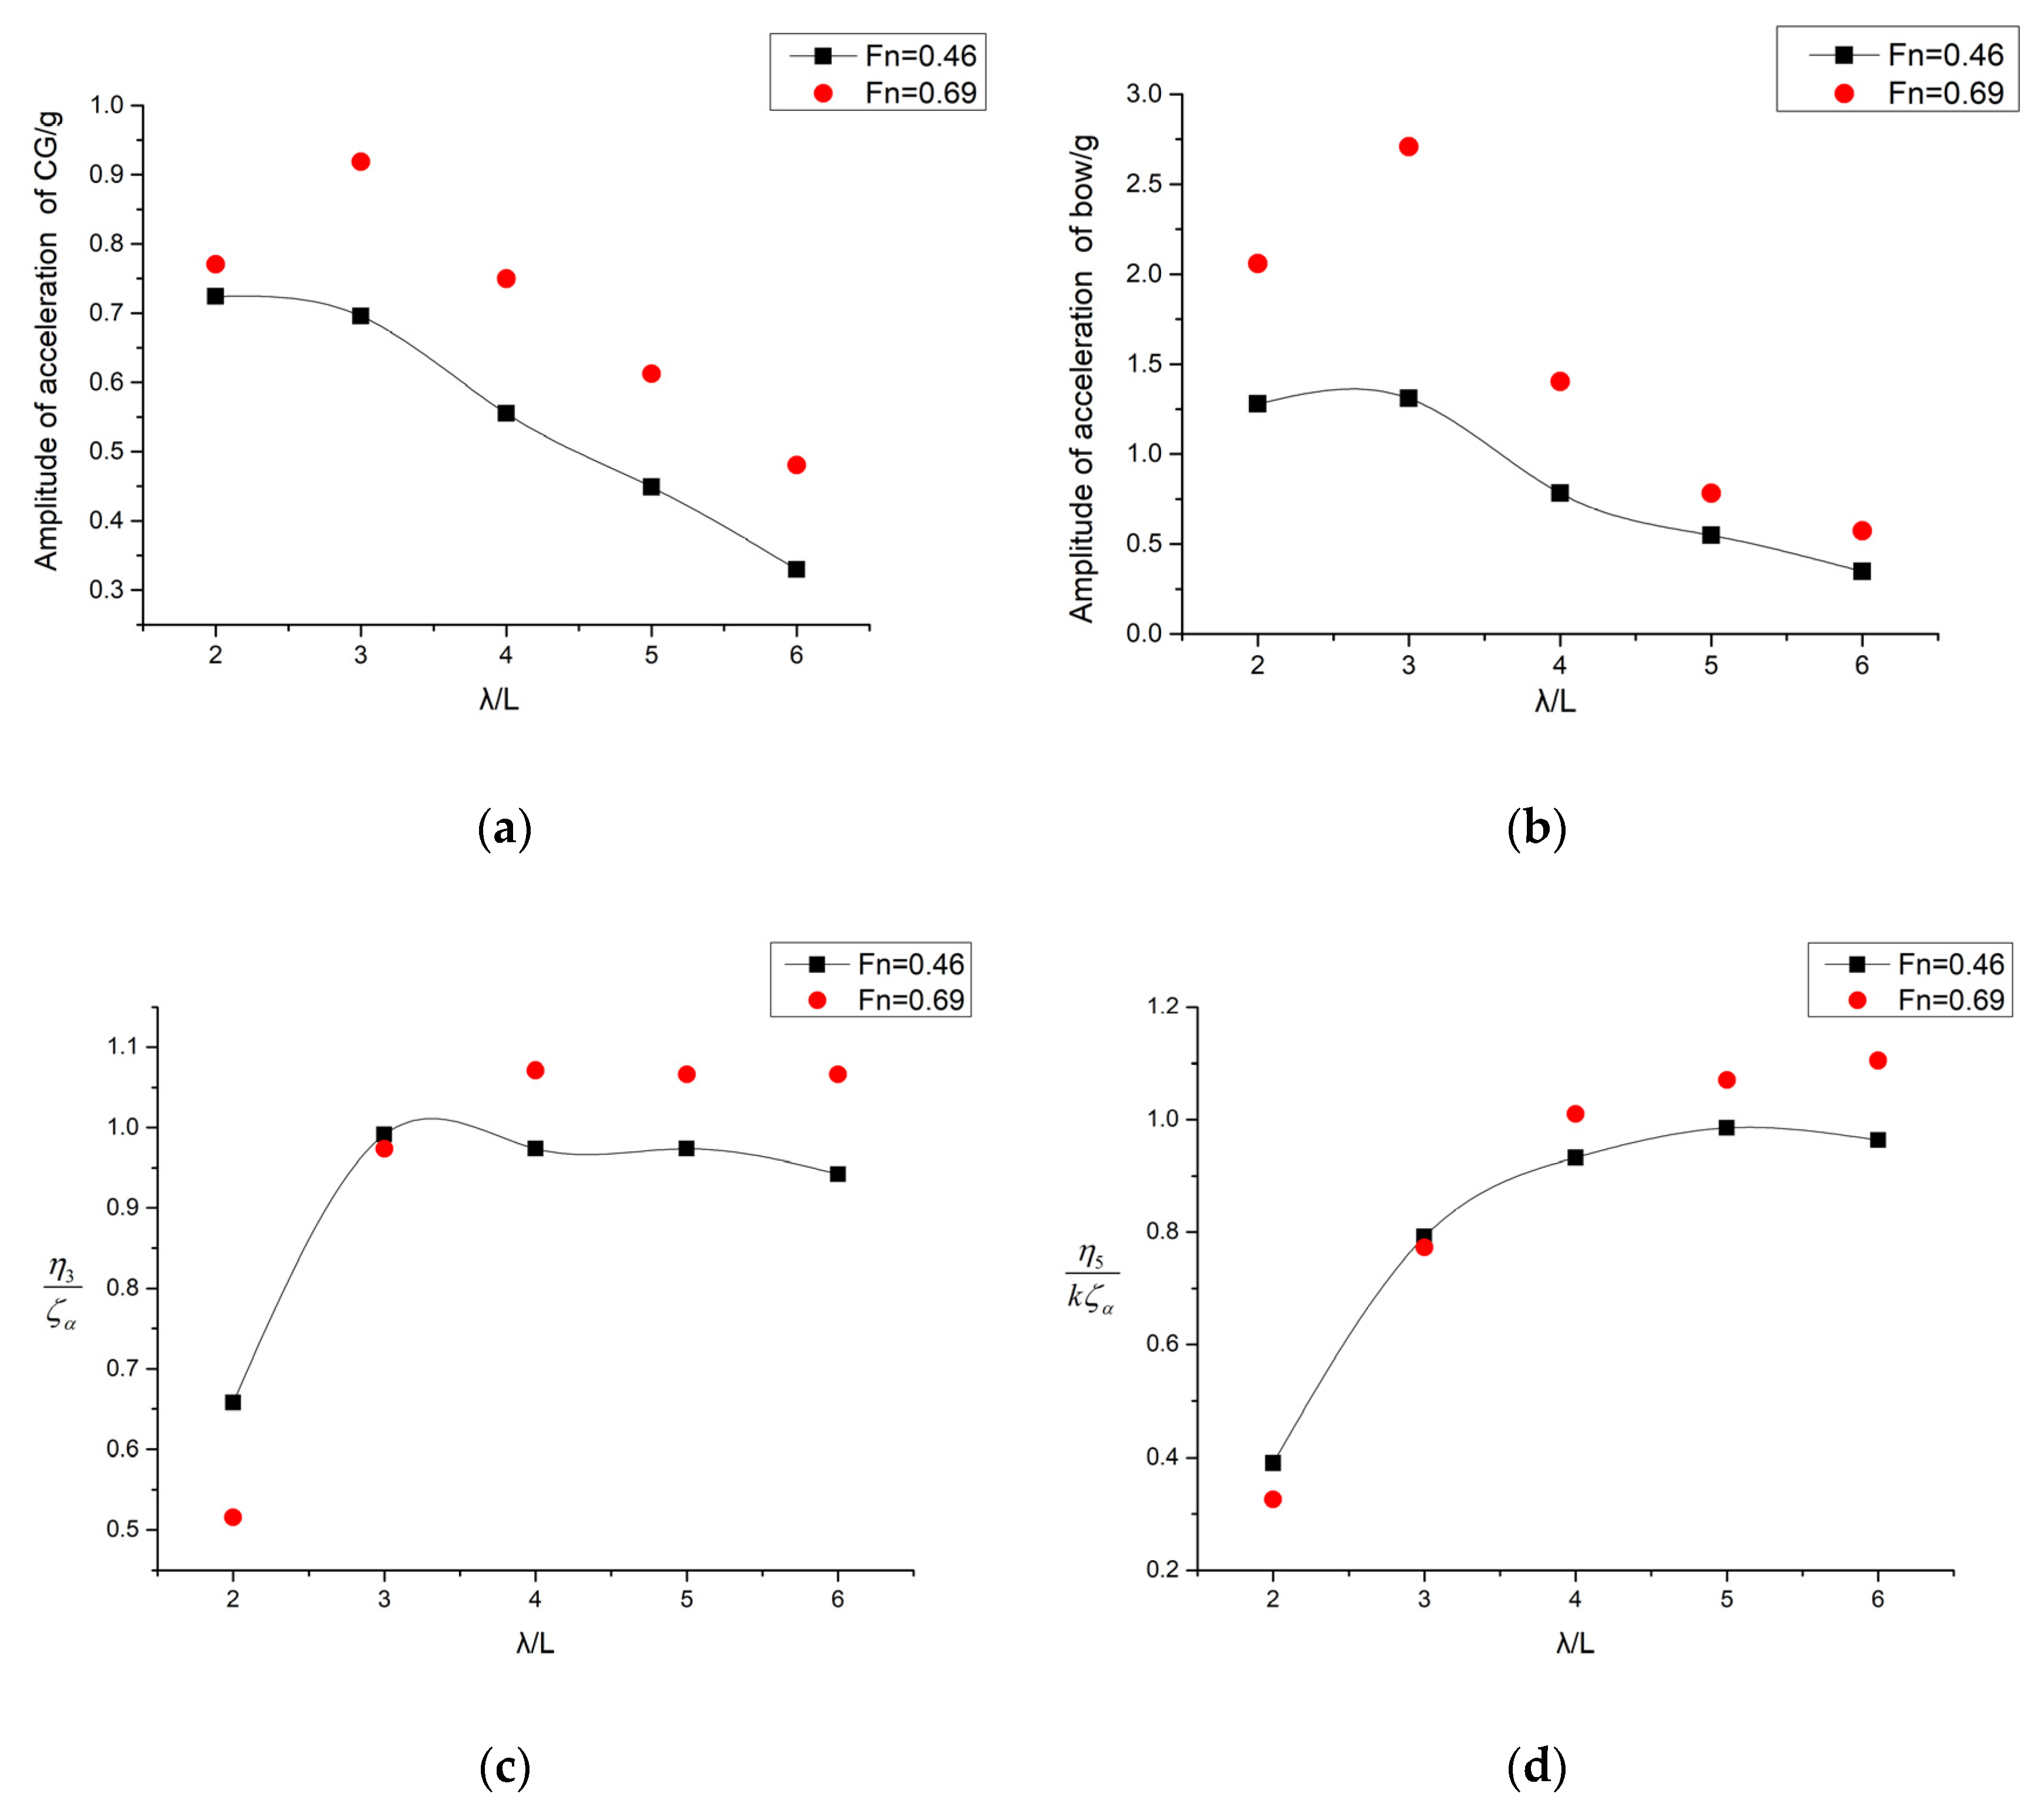
The RAOs of numerical results presented a similar variation tendency with those of the tested results: they reach the maximum values in the resonance wave length region and then decrease.
By comparing the RAOs of the model in different conditions, the resonance region of the pitch and heave is quite the same (the region is in condition 4 (λ/L = 3.5)). Before reaching the resonance region, the encounter frequency Is larger than the natural frequency of pitching and heave; the resonance phenomenon does not occur and the values of amplitude are far less than 1. In the resonance region, the encounter frequency is the same as the natural frequency of heave and pitch (the frequency is 6.446 rad/s (λ/L = 3.5)), and the amplitudes reach the max. After reaching the resonance region, the wave slope angle decrease as the wave length increase, causing the amplitudes to decrease, but they always remain around 1.
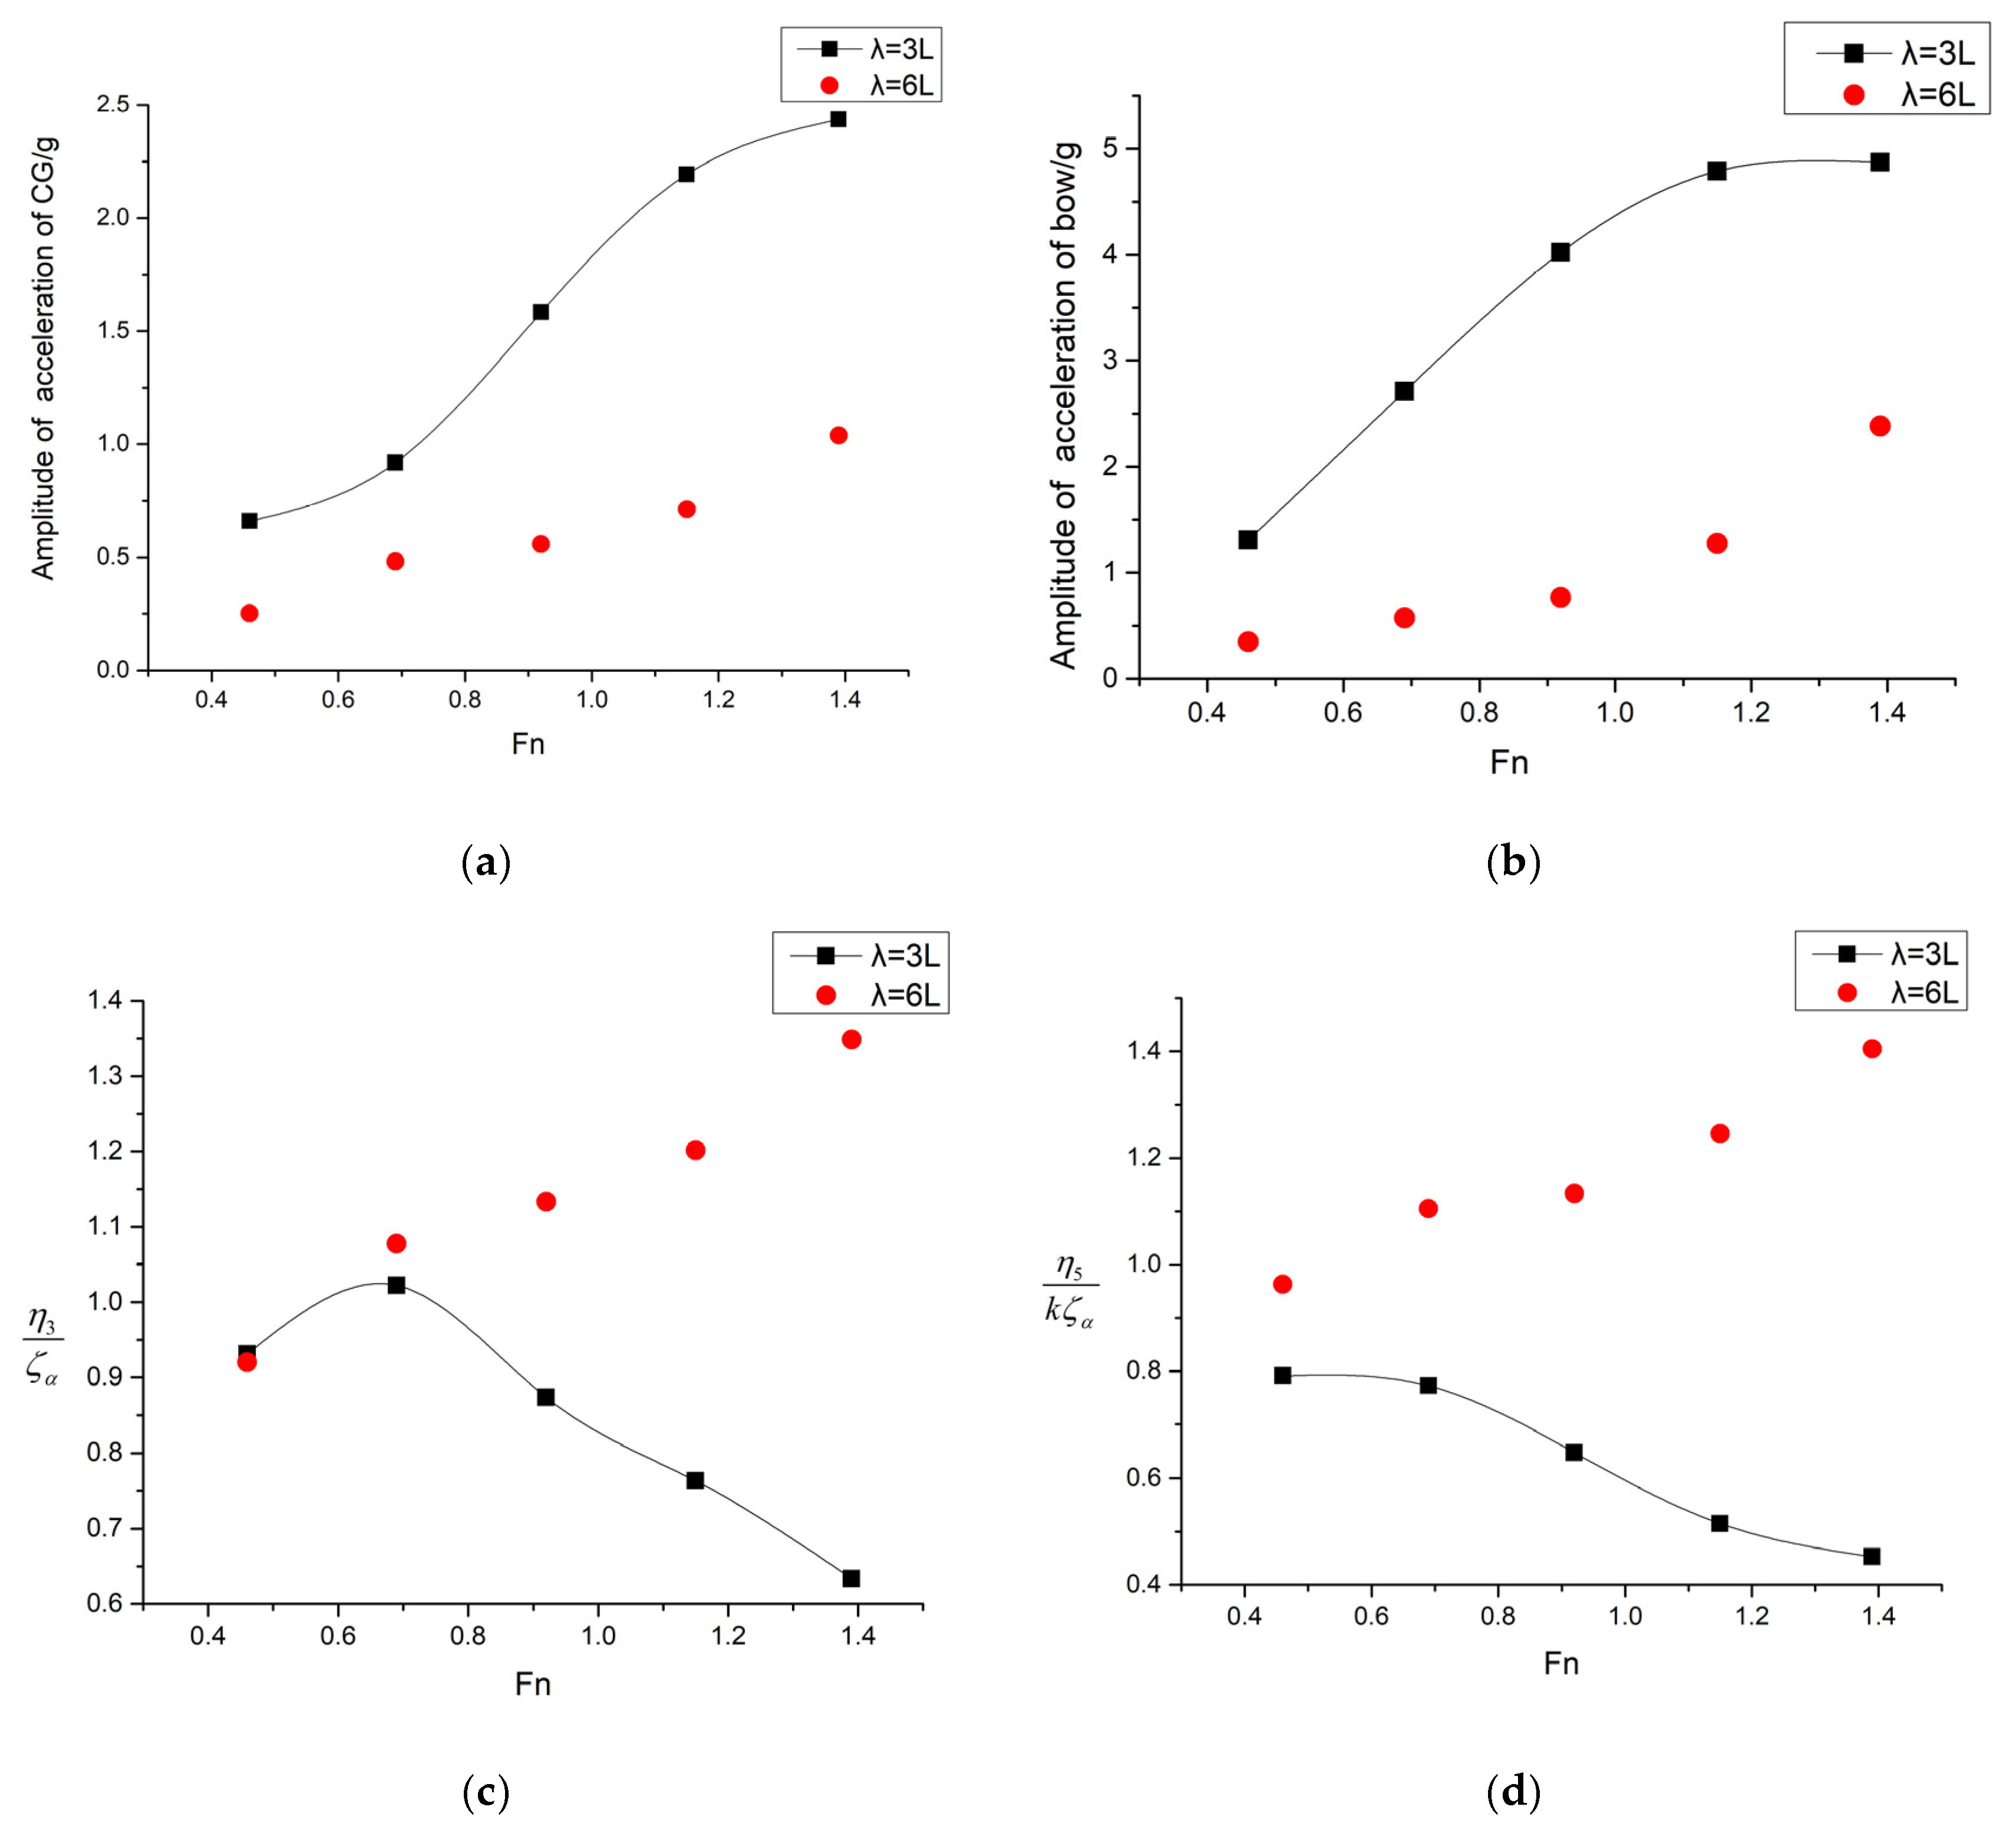
The resonance region of the acceleration of the CG and bow is different (the region is in condition 2 (λ/L = 2.25)). Under the short wave length conditions (λ/L ≤ 2.25), the vertical motion of the model is more intense due to the larger wave slope angle and wave disturbances, when the λ/L reaches 3.5, the pitch motion become more intense due to the resonance phenomenon. This indicates that the resonance region of the acceleration shifts to the shorter wave length direction compared with that of heave and pitch, the natural frequency of the vertical motion of the vessel is larger than that of pitch and heave, and the natural frequency of vertical motion is 9.261 rad/s (λ/L = 2.25). Under any condition, the amplitudes of the acceleration of the bow are significantly greater than that of CG. This indicates that the bow will slap on the free surface during navigation, and the excessive value of bow acceleration may threaten navigation safety.
The deviation of the numerical method is mainly due to the deformation of the grid and the complex flow fields around the model. The relative deviations of the numerical methods are greatly affected by the wave conditions. Before reaching the resonance region, the deviation between the calculated and test values is small. However, when the waves reach the resonance region, the amplitudes of the heave and pitch increased gradually, the motion of the model in the waves become more intense, and the deviation become larger.
The maximum deviations of the calculated heave, pitch, and acceleration of the CG and bow are 9.33%, 9.14%, 8.83%, and 8.48%, respectively. The average deviations are 4.95%, 4.79%, 4.81%, and 5.73%, respectively. All the deviations of the RAOs are less than 10%. The deviations of the numerical results of the RAOs all become larger in their resonance regions. In the short wave length condition (λ/L = 1.5 and 2.25), the short encountering period increases the frequency of the vertical motion, and the amplitudes of the acceleration increase sharply. This makes the nonlinear characteristics of the vertical motion increase sharply, and the deviation between the numerical and test results become larger in these conditions. As for the pitch and heave, the variation in the deviations is similar to that of the acceleration, but the wave length of their resonance region is larger.
In terms of average resistance, the values of average resistance are similar in any condition, the deviation between the numerical and test values is similar in different conditions, and the numerical results of the average resistance of the vessel in regular wave are all lower than those of the test results. The maximum value is 12.54%, the average value is 11.55%. Meanwhile, compared with the RAOs, the deviation of the resistance is greater. In wave conditions, the proportion of hull wave-making resistance in the total resistance is large as the flow field around the hull becomes more complicated by the wave disturbance. The grids around the hull cannot accurately track the free surface, the complex flow field around the hull brings deviation to the numerical prediction of wave-making resistance, this makes the numerical result of the resistance mean a certain deviation compared with the experimental value, but the variation tendency are similar.
Summing up the above, the numerical method accurately predicted the variation trends of the model’s motion response in regular wave. Compared with the corresponding test results, the relative deviations of the numerical results of the RAOs are less than 10%. This shows that the numerical method has a high accuracy in predicting the motion response of the model in regular wave. However, increasing nonlinear characteristics of the motion will make deviation of the numerical results become larger. Meanwhile, the complex flow field around the hull made it difficult to predict the wave-making resistance accurately and the deviation of the numerical results of the resistance are larger than that of the RAOs.


