Article

Distribution Characteristics and Spatial Differences of Phosphorus in the Main Stream of the Urban River Stretches of the Middle and Lower Reaches of the Yangtze River

1
Basin Water Environmental Research Department, Changjiang River Scientific Research Institute, Wuhan 430010, China
2
Key Lab of Basin Water Resource and Eco-Environmental Science in Hubei Province, Wuhan 430010, China
*
Authors to whom correspondence should be addressed.
Water 2020, 12(3), 910; https://doi.org/10.3390/w12030910
Submission received: 26 December 2019 / Revised: 18 January 2020 / Accepted: 20 March 2020 / Published: 23 March 2020
(This article belongs to the Special Issue Water Quality Assessments for Urban Water Environment)

Abstract

:
Excessive phosphorus is the main problem of water pollution in the main stream of the Yangtze River, while it is not clear about the distribution characteristics and spatial differences of phosphorus in the urban river stretches of the middle and lower reaches of the Yangtze River. In this study, a field survey in June 2014 revealed that the average particulate phosphorus (PP) concentration ranged from 0.195 mg/L to 0.105 mg/L from Wuhan (WH) in the middle reaches of the Yangtze River to Shanghai (SH, 1081 km from WH) in the lower reaches of the Yangtze River, and the average PP-to-the total phosphorus (TP) ratio decreased from 85.71% in WH to 45.65% in SH, while the average soluble reactive phosphate (SRP) concentration ranged from 0.033 to 0.125 mg/L, and the average SRP-to-total dissolved phosphorus (TDP) ratio increased from 60.73% in WH to 88.28% in SH. In general, PP was still an important form of TP in the middle and lower reaches of the Yangtze River. The concentrations of PP and SRP at different sampling locations and water depths in the same monitoring section showed differences, which might be related to the transportation and sedimentation of suspended sediment (SS) and differences in the location of urban sewage outlets. Historical data showed that the concentration and particle size of the SS decreased over time, while the discharge of wastewater also increased over time in the Yangtze River Basin. The measured results showed that there was a significant positive correlation between SS and PP. As a result, the concentration of SRP might increase in the middle and lower reaches of the Yangtze River. If the SRP concentration is not properly controlled, the degree of eutrophication of water body could significantly increase in the Yangtze River estuary, the riparian zone of the urban river stretches, the tributary slow-flow section, and the corresponding lakes connected with the Yangtze River.

Graphical Abstract

1. Introduction

With changing natural conditions and economic and social development in the Yangtze River Basin, the hydrological characteristics and the pollutants caused by human activities have changed; thus, altering the concentrations of major pollutants. In 2006, concentrations of chemical oxygen demand (COD), ammonia nitrogen, total phosphorus (TP), and total nitrogen (TN) exceed the standard of Grade III based on the National Surface Water Environmental Quality Standards (GB 3838-2002) in China (China 2002) [1]. The contribution rates of COD and ammonia nitrogen from point sources accounted for 54.2% and 55.9% of contribution, respectively, indicating that COD and ammonia nitrogen mainly came from point source pollution, which is closely related to the large-scale discharge of industrial and domestic wastewater. However, the contribution rates of TN and TP from point sources were only 21.4% and 24.5%, respectively, indicating that nitrogen and phosphorus were mainly from nonpoint source pollution [1]. In the past ten years, under the guidance of the water pollution prevention and control policy aimed at reducing COD and ammonia nitrogen in the aquatic environment, the treatment effect of ammonia nitrogen and COD was remarkable in the Yangtze River Basin, but the prevention and control of TP were relatively weak. Thus, TP had become the primary excess pollutant in the main stream of the Yangtze River. Meanwhile, the eutrophication of rivers due to hydrodynamic reasons are generally less severe than those of relatively static water bodies, such as lakes and reservoirs, but the accumulation of nutrients increases the risk of eutrophication of rivers. TN/TP ratio can change the limiting characteristics of nutrients in water body and become one of the key factors regulating the growth of phytoplankton growth.
At present, various phosphorus studies and reports have mainly concentrated on phosphorus forms and its distribution characteristics in the Three Gorges Reservoir [2,3,4,5] and phosphorus in the sediment and water bodies of shallow lakes in the middle and lower reaches of the Yangtze River [6,7,8]. However, a previous study of the spatial distribution of phosphorus in the Yangtze River often used the phosphorus concentration of the sampling point to represent the phosphorus concentration of a monitoring section, which did not truly reflect the phosphorus concentration of the monitoring section. Since phosphorus and suspended sediment (SS) are closely related in the water body, phosphorus could be adsorbed onto the surface of SS and settle to the bottom, resulting in the uneven vertical distribution of phosphorus; additionally, the spatial layout and location of the sewage outlets of each city were also different, which revealed that phosphorus was inconsistent in different positions of the same monitoring section. However, few reports have analyzed and evaluate phosphorus pollution in the main urban river stretches along the middle and lower reaches of the Yangtze River [9,10]. It is well known that the middle and lower reaches of the Yangtze River are economically developed with large population, but fragile ecological environment. Yangtze River Basin has a large amount of pollutants discharged, with many hidden risks, and the pressure of drinking water safety is high [9]. Therefore, in order to protect the water environment quality of the Yangtze River, it is necessary to understand distribution characteristics and spatial differences of phosphorus in the middle and lower reaches of the Yangtze River.
The middle and lower reaches of the Yangtze River enter the flood season in June each year. Nutrients, such as phosphorus, enter the Yangtze River with urban sewage outlets and surface runoff, which leads to an increase in phosphorus content in the water body. The objectives of this study were to (1) determine the concentration levels of phosphorus in water body along main stream of the urban river stretches of the middle and lower reaches of the Yangtze River in the flood season (June 2014); (2) investigate the spatial distributions of particulate phosphorus (PP) and soluble reactive phosphate (SRP) in the main urban river stretches; (3)analyze the influence of cities on phosphorus distribution in water body in the main stream; and (4) study the possible changes in PP and SRP under the current situation. This work is expected to contribute to the understanding of the distribution behaviors of phosphorus in the main stream of the urban river stretches of the middle and lower reaches of the Yangtze River and provide a reference for water environment management and protection. In addition, our results can also be used as reference levels for future phosphorus monitoring programs of water body from the Yangtze River.

2. Sampling, Testing and Data Analysis

2.1. Sampling Sites and Sample Collection

In July 2014, water samples was collected at 14 representative sites (Figure 1), namely the upper reach of Wuhan (UWH), the lower reach of Wuhan (LWH), the upper reach of Jiujiang (UJJ), the lower reach of Jiujiang (LJJ), the upper reach of Anqing (UAQ), the lower reach of Anqing (LAQ), the upper reach of Nanjing (UNJ), the lower reach of Nanjing (LNJ), the upper reach of Zhenjiang (UZJ), the lower reach of Zhenjiang (LZJ), the upper reach of Nantong (UNT), the lower reach of Nantong (LNT), the upper reach of Shanghai (USH), and the lower reach of Shanghai (LSH). In the main stream of the urban river stretches of the middle and lower reaches of the Yangtze River, UWH, LWH, UJJ, LJJ, UAQ, LAQ, UNJ, LNJ, UZJ, LZJ, UNT, LNT, USH, and LSH were 616, 684, 879, 916, 1030, 1062, 1318, 1368,1399, 1436, 1567, 1600, 1651, and 1697 km from the Three Gorges Dam.
The upper reach of the urban river stretch included the central line, whereas the lower reach of the urban river stretch included the left and right shore and the central line, in which the central line was midstream in the river, and the left and right vertical lines were 50–100 m from the shores.
At each sampling site, water samples from the surface (0.2 times the water depth), middle (0.5 times the water depth), and bottom (0.8 times the water depth) of the column were obtained to analyze the concentrations of nitrogen and phosphorus nutrients. Some of the water samples were directly processed by digestion to measure TP and TN; the other water samples were immediately filtered through 0.45 μm cellulose acetate membranes to measure total dissolved phosphorus (TDP) and soluble reactive phosphate (SRP). Another 1 L water sample of each sampling site was immediately filtered through a 0.45 μm cellulose acetate membranes and then entrapped and dried to a constant weight of solid material at 103–105 °C to measure suspended sediment (SS). Moreover, the temperature (T), pH, electrical conductivity (EC), dissolved oxygen (DO), turbidity (TURB), chlorophyll-a (chl-a), and oxidation-reduction potential (ORP) were field measured with a multiparameter water quality sonde (USA, YSI EXO2). All water samples were collected on a hydrological ship.

2.2. Sample Measurement

Concentrations of TP and TDP were determined by potassium persulfate digestion and the ammonium molybdate spectrophotometric method (GB 11893-89). The PP concentration was measured by subtracting the TDP concentration from the TP concentration. The SRP in each sample was determined by the molybdenum blue/ascorbic acid method [4]. Concentrations of TN were determined by using a national standard entitled the alkaline potassium persulfate digestion-UV spectrophotometric method (HJ 636-2012). SS was determined by using the gravimetric national standard method (GB 11901-89). All water samples were measured on hydrological ship. After the water samples were collected, for every 10 water samples tested, one of the water samples should be randomly selected for parallel sample analysis. The relative error of the measured value of the parallel sample must be less than 5%. In addition, quality control samples were also added when testing water samples, and the determination results of quality control samples must be within the range of their standard values, so as to ensure the accuracy of the test results of each collected water sample.

2.3. Data Collection and Analysis

The concentrations of TN, TP, TDP, PP, and SRP in upper and lower reaches of the urban river stretches along the middle and lower reaches of Yangtze River were obtained from a field survey in July 2014. Hydrologic and sediment data were collected from the Changjiang Sediment Bulletin [11], while wastewater discharge in the Yangtze River Basin was obtained from the Water resources bulletin of the Yangtze River Basin and the southwestern rivers [12]. Correlation analysis of PP and SS were carried out using SPSS (IBM SPSS Statistics 22.0).

3. Results and Discussion

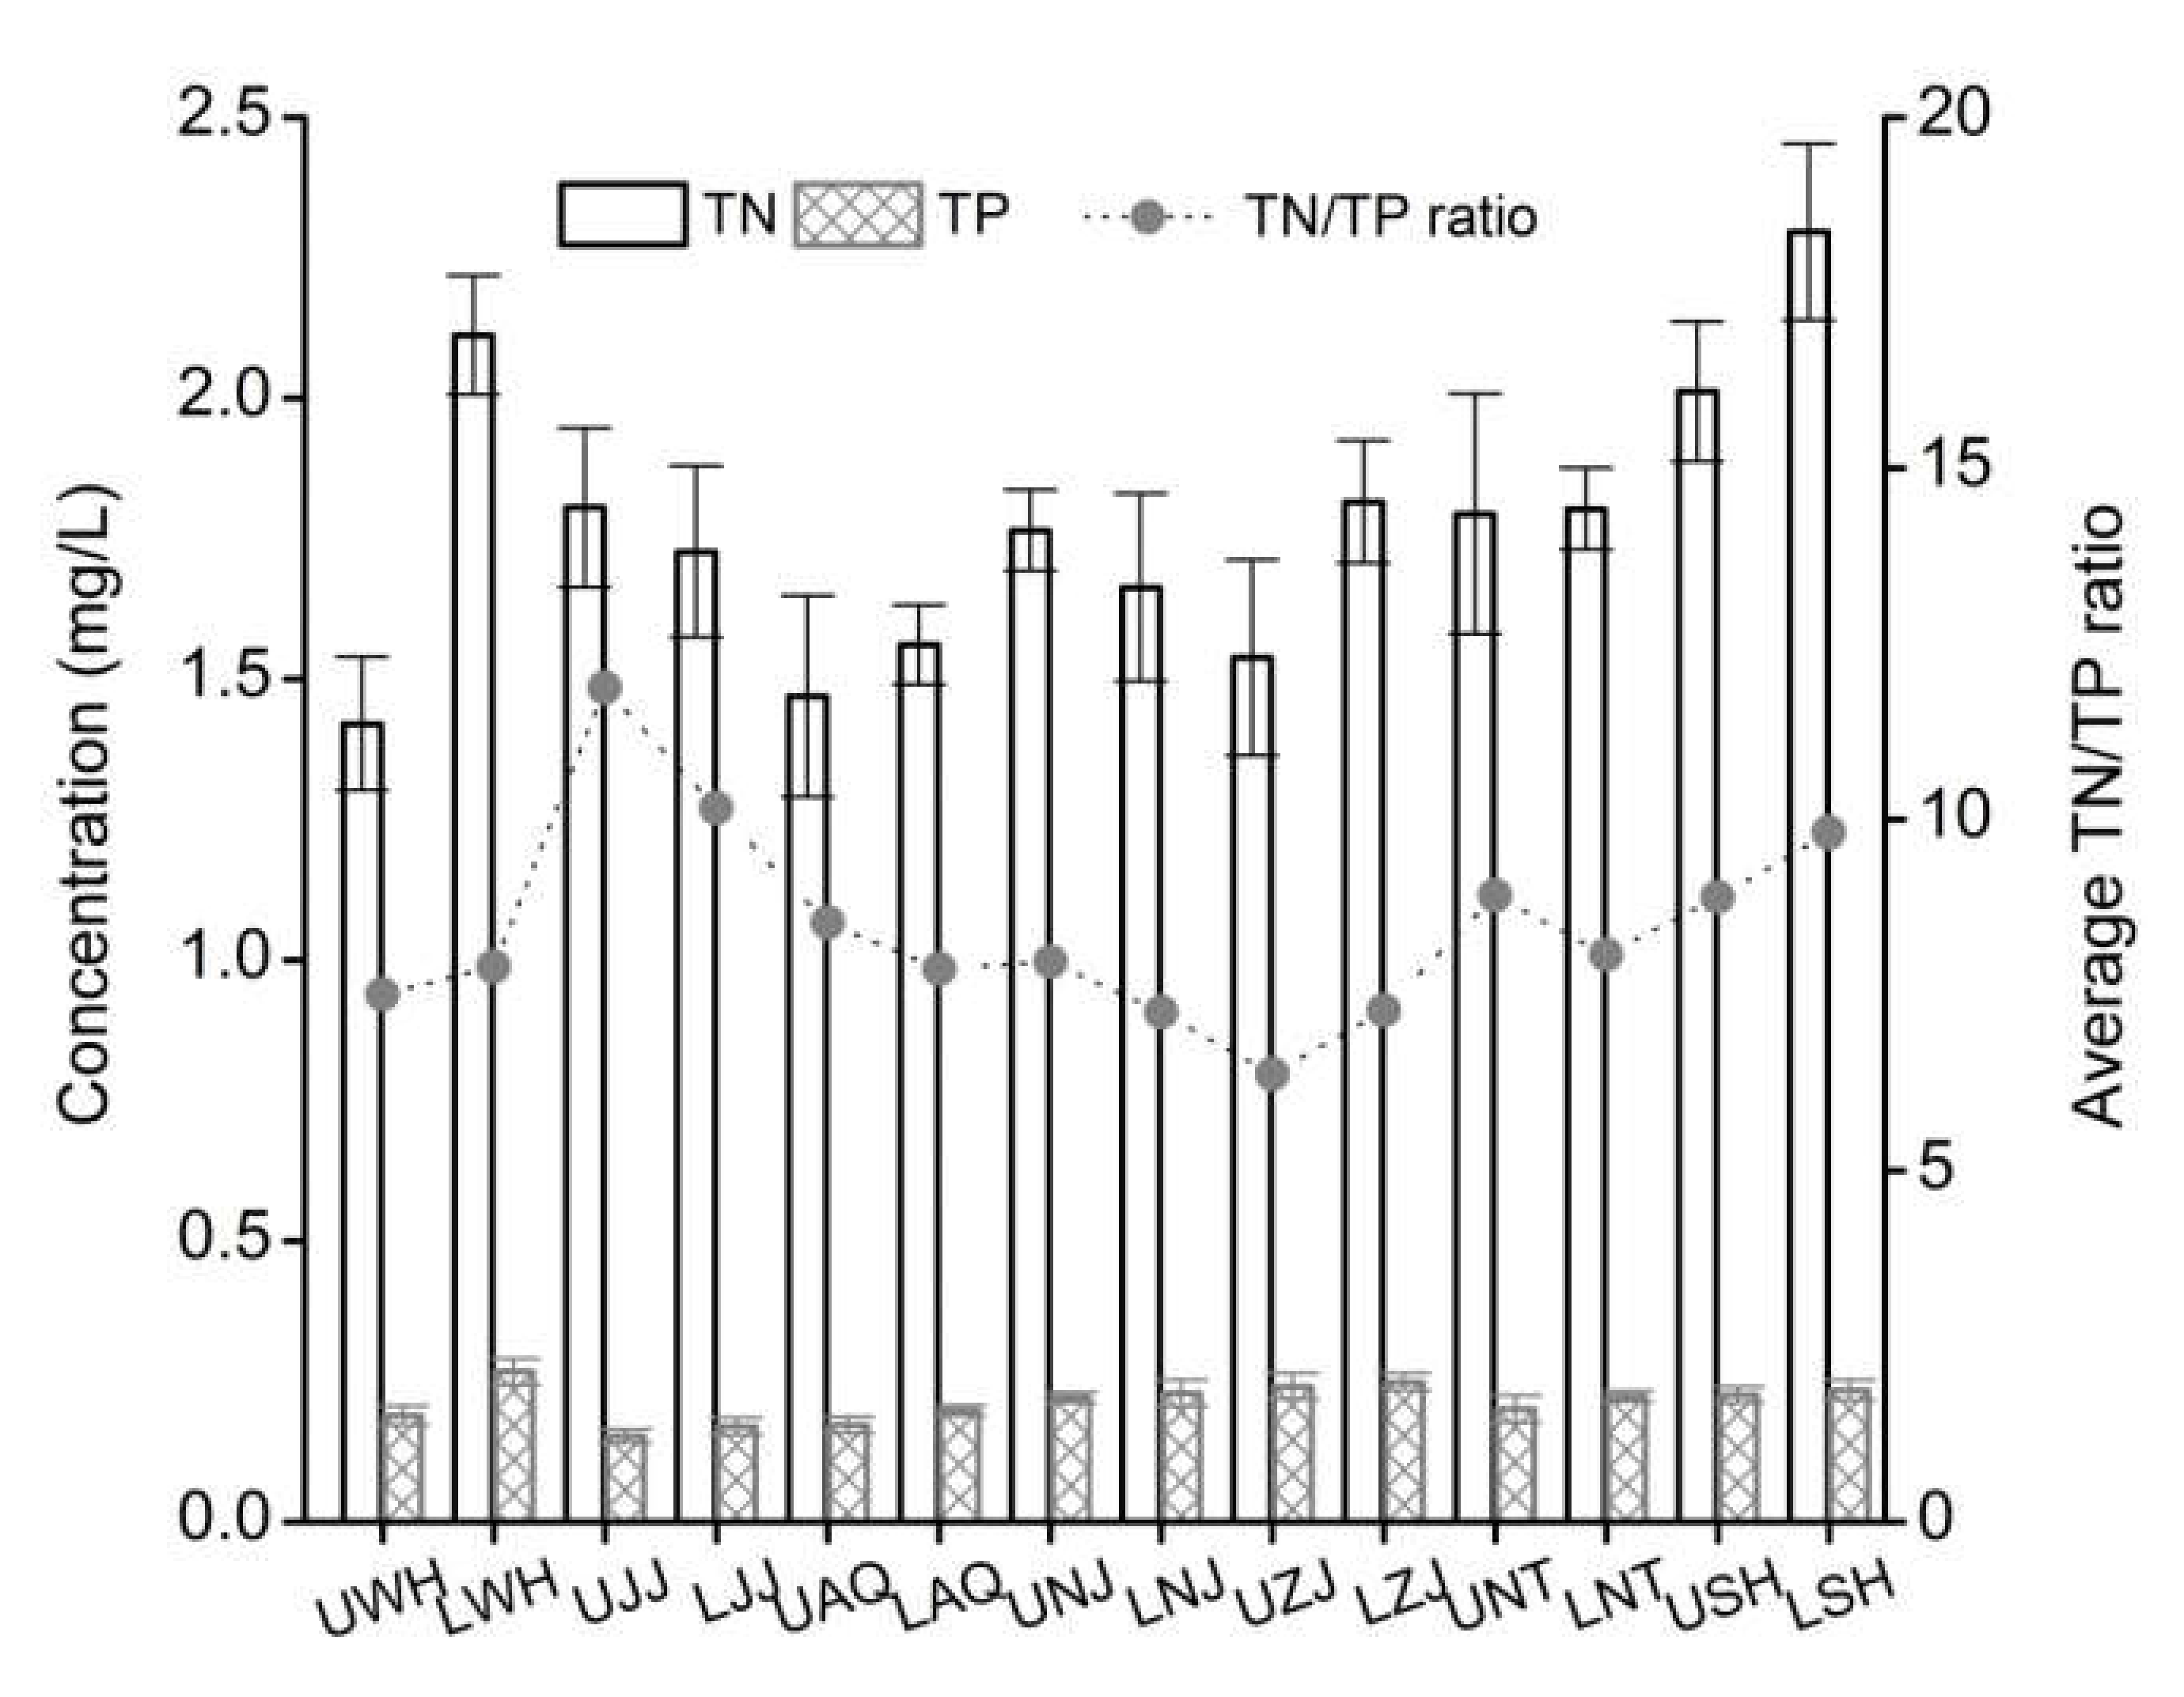
3.1. Water Physicochemical Properties

Major physical and chemical parameters at different sampling points are summarized in Table 1. The physical and chemical parameters of main urban river stretches were the average values of the upstream and downstream of the city. During the flood season, the water was weakly alkaline in general, and the average pH values ranged from 7.98 to 8.13. The average DO concentrations ranged from 6.85 to 7.77 mg/L, which satisfied the standard of class I-II water as outlined in the "Environmental Quality Standards for Surface Water" (GB 3838-2002). Moreover, along the main stream of the urban river stretches from the middle to lower reaches of the Yangtze River, the average turbidity level observably increased from 30.88 nephelometric turbidity units (NTU) in Wuhan (WH) to 64.40 NTU in Nanjing (NJ) and then decreased to 51.28 NTU in Shanghai (SH), which increased by 66.1% overall. The average temperature range was 21.8–23.9 °C, which tended to slightly decrease from the middle reach to the lower reach of the Yangtze River. The average EC level ranged from 151.5 to 243.0 μs/cm, and the average chlorophyll-a level ranged from 3.15 to 4.15 μg/L. The average ORP level moderately decreased from 533.4 mv in WH to 418.2 mv in SH, which decreased by 21.60% overall (Table 1).

3.2. Distribution Characteristics of Phosphorus in the Main Urban River Stretches

Phosphorus is the first controlling element that restricts algae growth in most fresh water, which is also an important factor that causes water eutrophication [13,14,15]. The form of phosphorus in the water body is TDP and PP. The main existing form of TDP is SRP, while PP are mainly adsorbed on the surface of sediment particles as well as combined with living cells and organic clastic molecules. Therefore, it is crucially important to accurately monitor the quantity of various forms of phosphorus concentration and its change in water bodies, which is conducive for the comprehensive assessment of the state of the water environment.

3.2.1. Distribution of TP, PP, and Percent of PP to TP

TP is one of the important indicators for water quality evaluation. The TP and PP concentrations of main urban river stretches were the average values of the upstream and downstream of the city. As shown in Figure 2, the average TP concentration range from WH to SH was 0.161–0.245 mg/L, which exhibited an upward trend from JJ to ZJ along the Yangtze River. The average TP concentrations in the river sections of JJ and AQ were up to the standard class III, and the average TP concentrations in other urban river sections were class IV, with TP concentration analysis referring to the environmental quality standards for surface water (GB 3838-2002). Overall, as a result of intensive human activities and developed economies, water pollution affected the ecological environment of the middle and lower reaches of the Yangtze River [16,17]. Phosphorus mainly exists in the particle state in surface water [2], and PP is the main existing form of phosphorus in river systems and estuarine areas [18]. PP is also known as potential bioavailable phosphorus, which is the principal repository of bioavailable phosphorus (BAP) [19]. PP contributed a greater proportion of TP in the Yangtze River basin [4,5,20]. A survey from 1997 to 1998 showed that the ratio of PP-to-TP was approximately 93% in the wet season in the middle and lower reaches of the Yangtze River [21], and a 1998 and 1999 survey showed that the ratio of PP-to-TP reached up to 70%–90% [22].
Taking this into account in this survey, the average PP concentration range from WH to SH was 0.105–0.195 mg/L, with the minimum and maximum values in SH and WH, respectively (Figure 2). When comparing the PP concentrations in WH to those in SH, more than 46.18% of PP was trapped and deposited in the main urban river stretches of the middle and lower reaches of the Yangtze River. The average PP-to-TP ratio decreased from 85.71% to 45.65% from WH to SH. Although PP was still the main form of TP in the middle and lower reaches of the Yangtze River, the PP-to-TP ratio exhibited a decreasing trend when compared with the results of historical literature [21,22].
The SS and PP concentrations of main urban river stretches were the average values of the upstream and downstream of the city. As shown in Figure 3, the average SS and PP concentrations decreased from 151.42 mg/L and 0.195 mg/L in WH to 90.62 mg/L and 0.105 mg/L in SH, respectively, exhibited similar decreases of 40.15% and 46.15%, respectively. SS and PP showed a significant positive correlation (r = 0.793, P < 0.01). Therefore, combining with the related literature [4,5], it was concluded that SS is the most important carrier of PP.
Overall, the average PP-to-TP ratio showed a decreasing trend from WH to SH, possibly because the average velocity of the river had a tendency to slow along the middle and lower reaches of the Yangtze River [23] and the SS settled gradually with the PP, the reducing the PP-to-TP ratio overall.

3.2.2. Distribution of TDP, SRP, and Percent of SRP to TDP

TDP is an important component of phosphorus in the water body [24,25]. The TDP and SRP concentrations of the urban section are the average values of the upstream and downstream of the city. As shown in Figure 4, the average TDP concentration range from WH to SH was 0.033–0.125 mg/L. The average TDP concentration along the middle and lower reaches of the Yangtze River demonstrated a gradually increasing trend, which reached its maximum in SH, approximately 3.8 times that observed in WH.
SRP is a directly accessible phosphorus source for aquatic organisms, and it can be directly absorbed and used by aquatic plants and animals, such as phytoplankton, which causes eutrophication problems [25]. SRP gradually becomes one of the main factors for researching the phosphorus cycle and the biological effect of phosphorous in the aquatic environment. The average SRP concentration was 0.020-0.110 mg/L from WH to SH, which showed an overall increasing trend (Figure 4). The average SRP-to-TDP ratio increased from 60.73% in WH to 88.28% in SH, which indicated that inorganic phosphorus existed in the main form of SRP, which was consistent with results of previous literature [20].
From the natural point of view, the average velocity of the river had a tendency to slow [23], resulting in sedimentation of PP and an increase in the SRP concentration. From the perspective of human activities, according to the "Emission Standards for Pollutants in Urban Sewage Treatment Plants" (GB 18918-2002), even if the TP emission concentration reached the Class A standard (0.5 mg/L), it would not satisfy the class V water standard (GB 3838-2002), and phosphorus emission concentrations in urban river sections were still very high. Therefore, the SPR concentration exhibited an increasing trend along the middle and lower reaches of the Yangtze River.

3.2.3. Effect of Phosphorus Distribution on Water Eutrophication

Different TN/TP ratios of water body had certain effects on the growth and reproduction of phytoplankton [26,27,28,29]. The nutrient restriction criteria for eutrophication assessment are as follows: when the TN/TP ratio in water is <7, nitrogen is a limiting nutrient element; when the TN/TP ratio in water is >30, phosphorus will become a limiting factor for algae growth; when the TN/TP ratio is between 7 and 30, it represents the suitable proportion of algae growth; when phytoplankton are physiologically and biochemically active, they absorb TN and TP at a ratio of 16:1 [30,31].
The spatial distribution of TP and TN in the middle and lower reaches of the Yangtze River is given in Figure 5. The TN and TP concentrations of the upper reach of the urban river stretch are the average values of the surface, middle and bottom water samples in the central line of the upstream, whereas the TN and TP concentrations of the lower reaches of the urban river stretch are the average values of the water samples in different water layers (surface, middle and bottom) in the left shore, the central line and right shore of the downstream. The average nitrogen and phosphorus concentrations of water samples ranged from 1.42–2.30 mg/L to 0.152–0.267 mg/L, respectively, whereas the average range of the average ratio of TN/TP was 6.4–11.9 in the reaches of major cities along the middle and lower Yangtze River. The maximum and minimum values appeared in the UZJ and UJJ reaches of the Yangtze River, respectively.
Overall, in the flood season, the TN/TP ratios of water bodies were adapted for algae growth in the middle and lower reaches of the Yangtze River. However, due to its short residence time, strong exchange capacity and high flow velocity, the main stream of the middle and lower reaches of the Yangtze River had a low risk of large-scale cyanobacterial blooms.

3.3. The Impact of Cities on Phosphorus Distribution

The PP and SRP concentrations of the upper reach of the urban river stretch are the average values of the surface, middle and bottom water samples in the central line of the upstream, whereas the PP and SRP concentrations of the lower reaches of the urban river stretch are the average values of the water samples in different water layers (surface, middle and bottom) in the left shore, the central line and right shore of the downstream. As shown in Table 2, the average PP concentrations in the upper reaches of the urban sections were 0.106–0.171 mg/L, while the average PP concentrations in the lower reaches of the urban sections were 0.104–0.220 mg/L. Overall, the average PP concentrations of the lower reaches were relatively higher than those of the upper reaches. In particular, the average PP concentration in the lower reach of the WH section was 28.6% higher than that in the corresponding upper reach.
Moreover, the average SRP concentrations in the upper reaches of the urban sections were 0.015–0.111 mg/L, while the average SRP concentrations in the lower reach of urban sections were 0.024–0.110 mg/L. The average PP concentrations of the lower reach were also relatively higher than those of the upper reach.
In summary, the average PP and SRP concentrations of the lower reaches were relatively higher than those of the upper reaches. It can be concluded that urban sewage discharge contributes a large amount of phosphorus in the Yangtze River Basin. Therefore, the phosphorus emissions from the sewage treatment plants in major cities along the Yangtze River should also be monitored and controlled.

3.4. Spatial Differences of Phosphorus

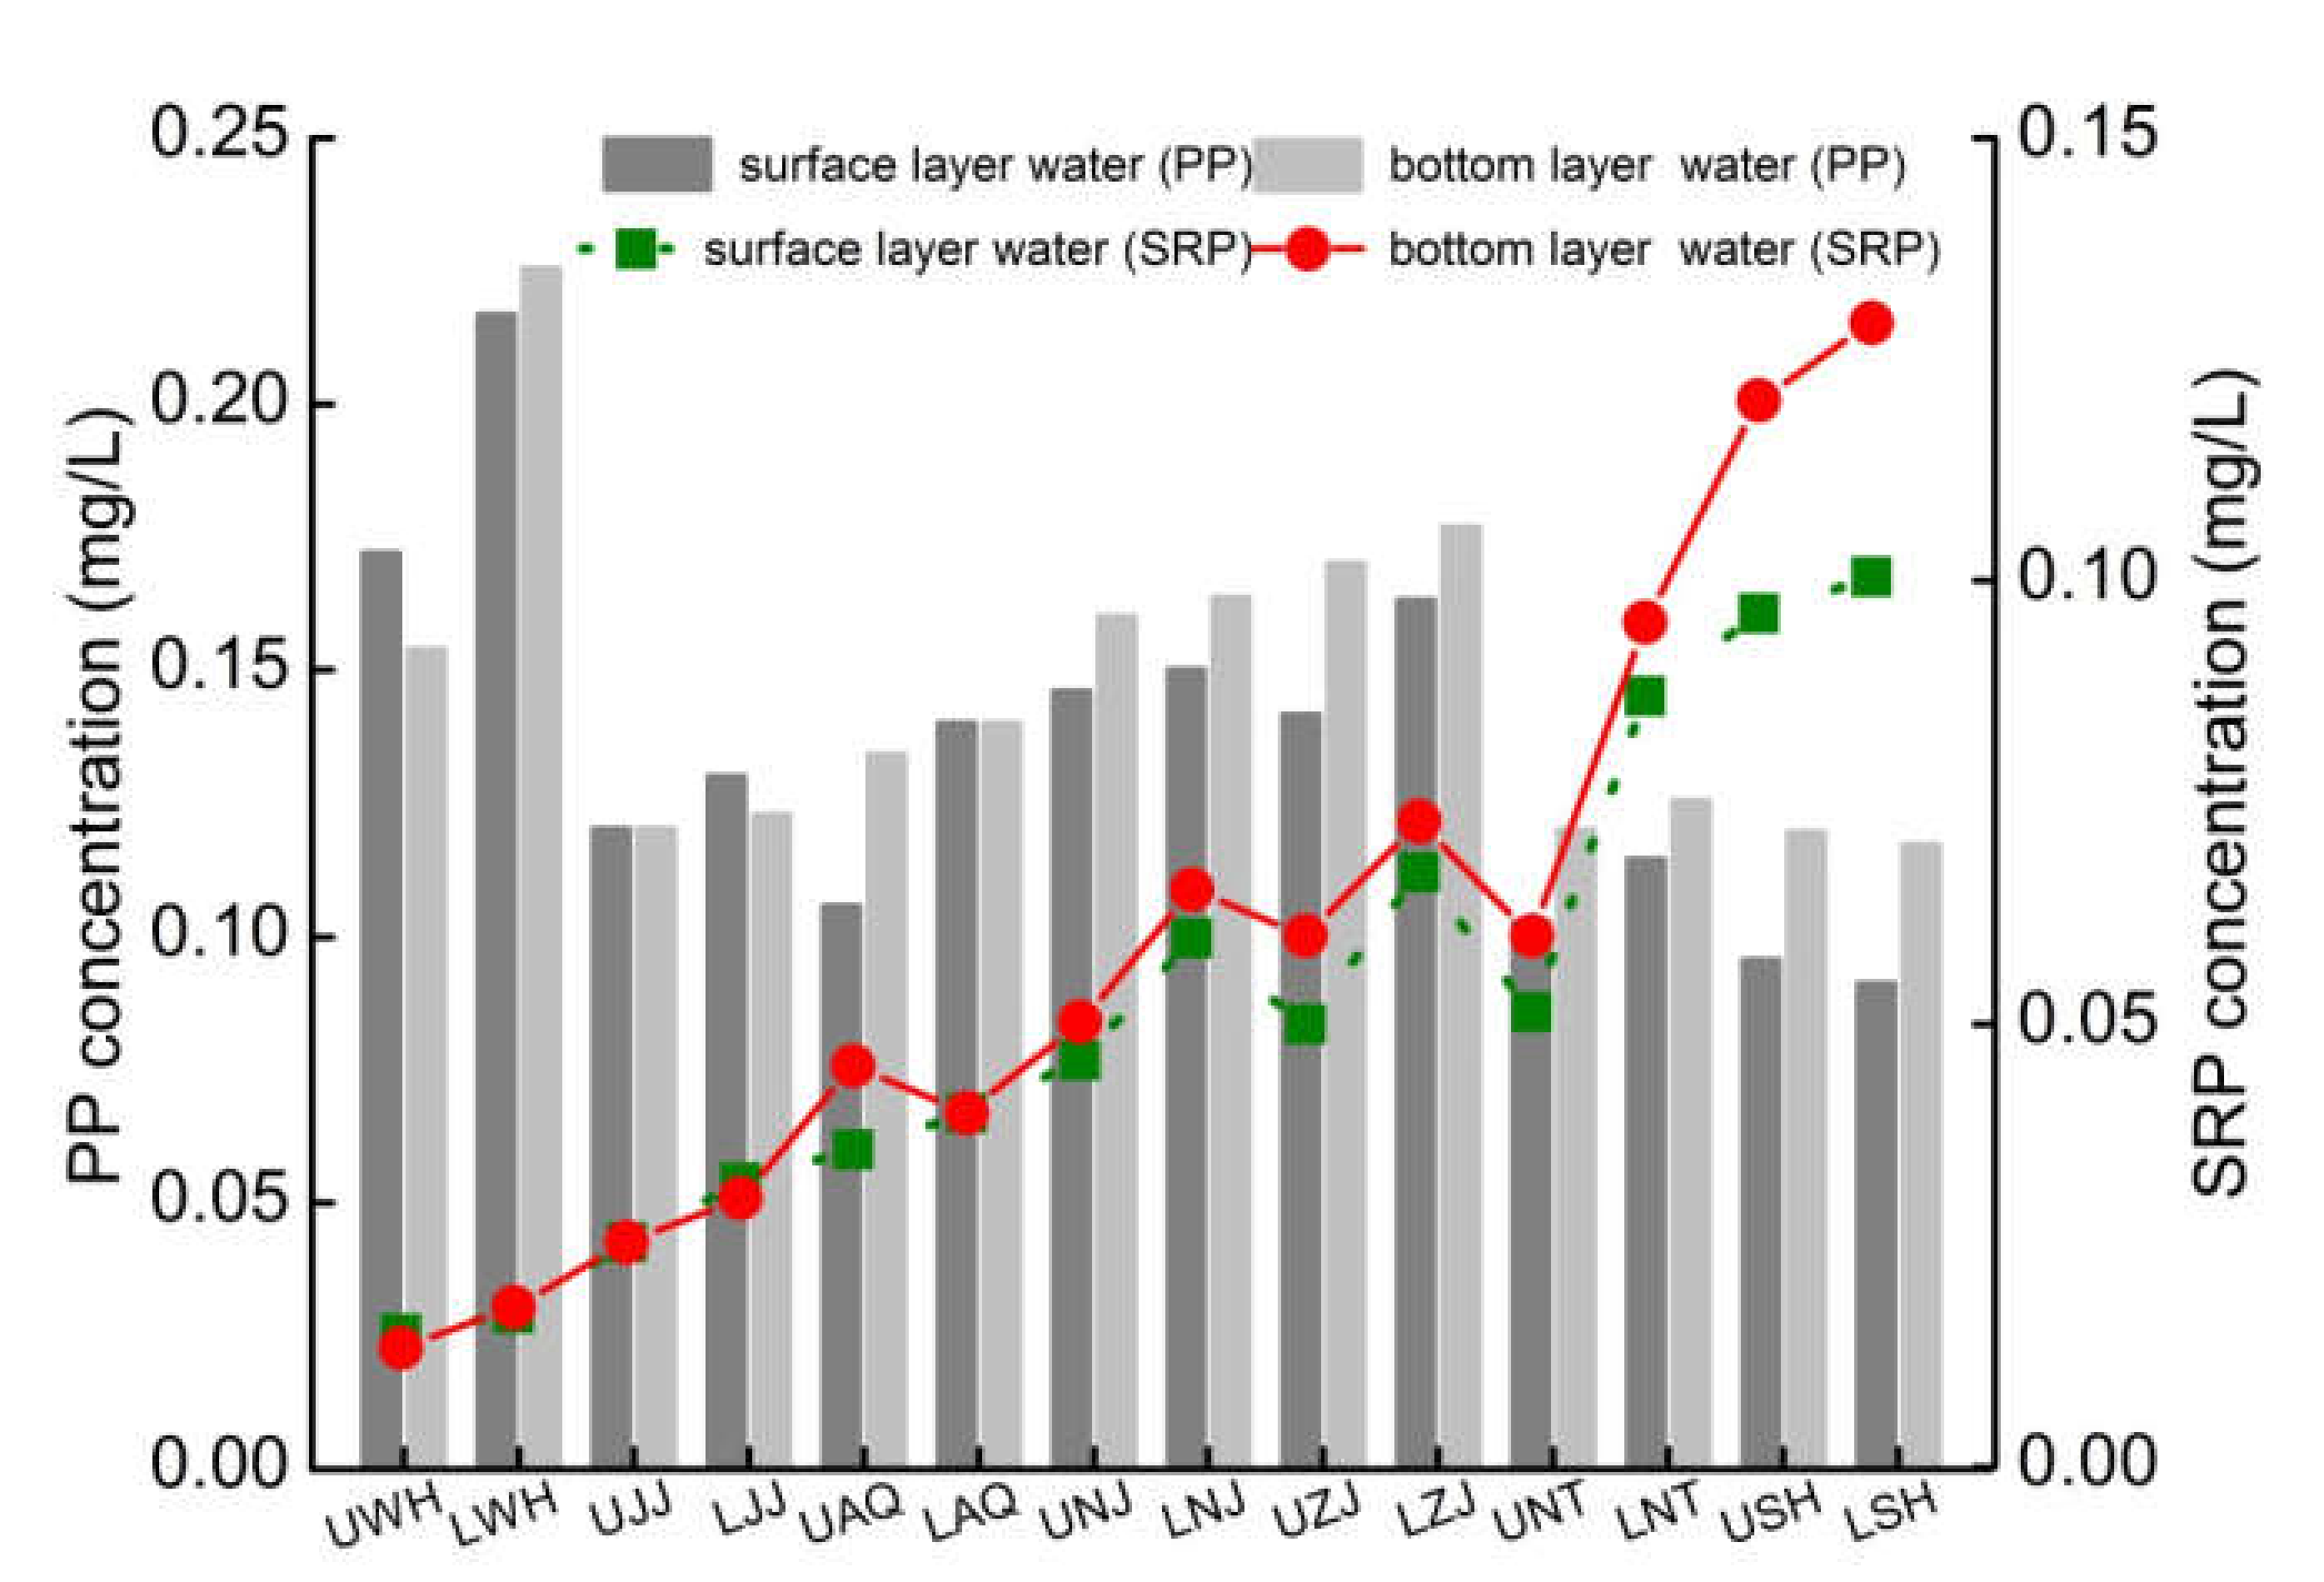
3.4.1. PP and SRP in Surface and Bottom Layer Water

Figure 6 shows the PP distribution of the surface water and the bottom water from the central line in the upper and lower reaches of the urban river stretches. Generally, the PP concentrations of the surface and the bottom layers of the lower reaches at each urban section were higher than that of the corresponding layers of the upper reaches. Comparing vertically, the PP concentration distribution of each sampling section was uneven at each layer; on the whole, the PP concentration of the bottom layer was relatively higher than the surface concentration. Spatial differences in the SRP concentration were similar to those of the PP concentration.
Based on the monitoring data, there were certain differences between the TP and SRP concentrations in the surface water and the bottom water of each sampling section. Because the distribution of phosphorus was closely related to that of the SS in the water body, phosphorus could have been adsorbed onto the surface of SS and settled to the bottom, resulting in the uneven vertical distribution of phosphorus.

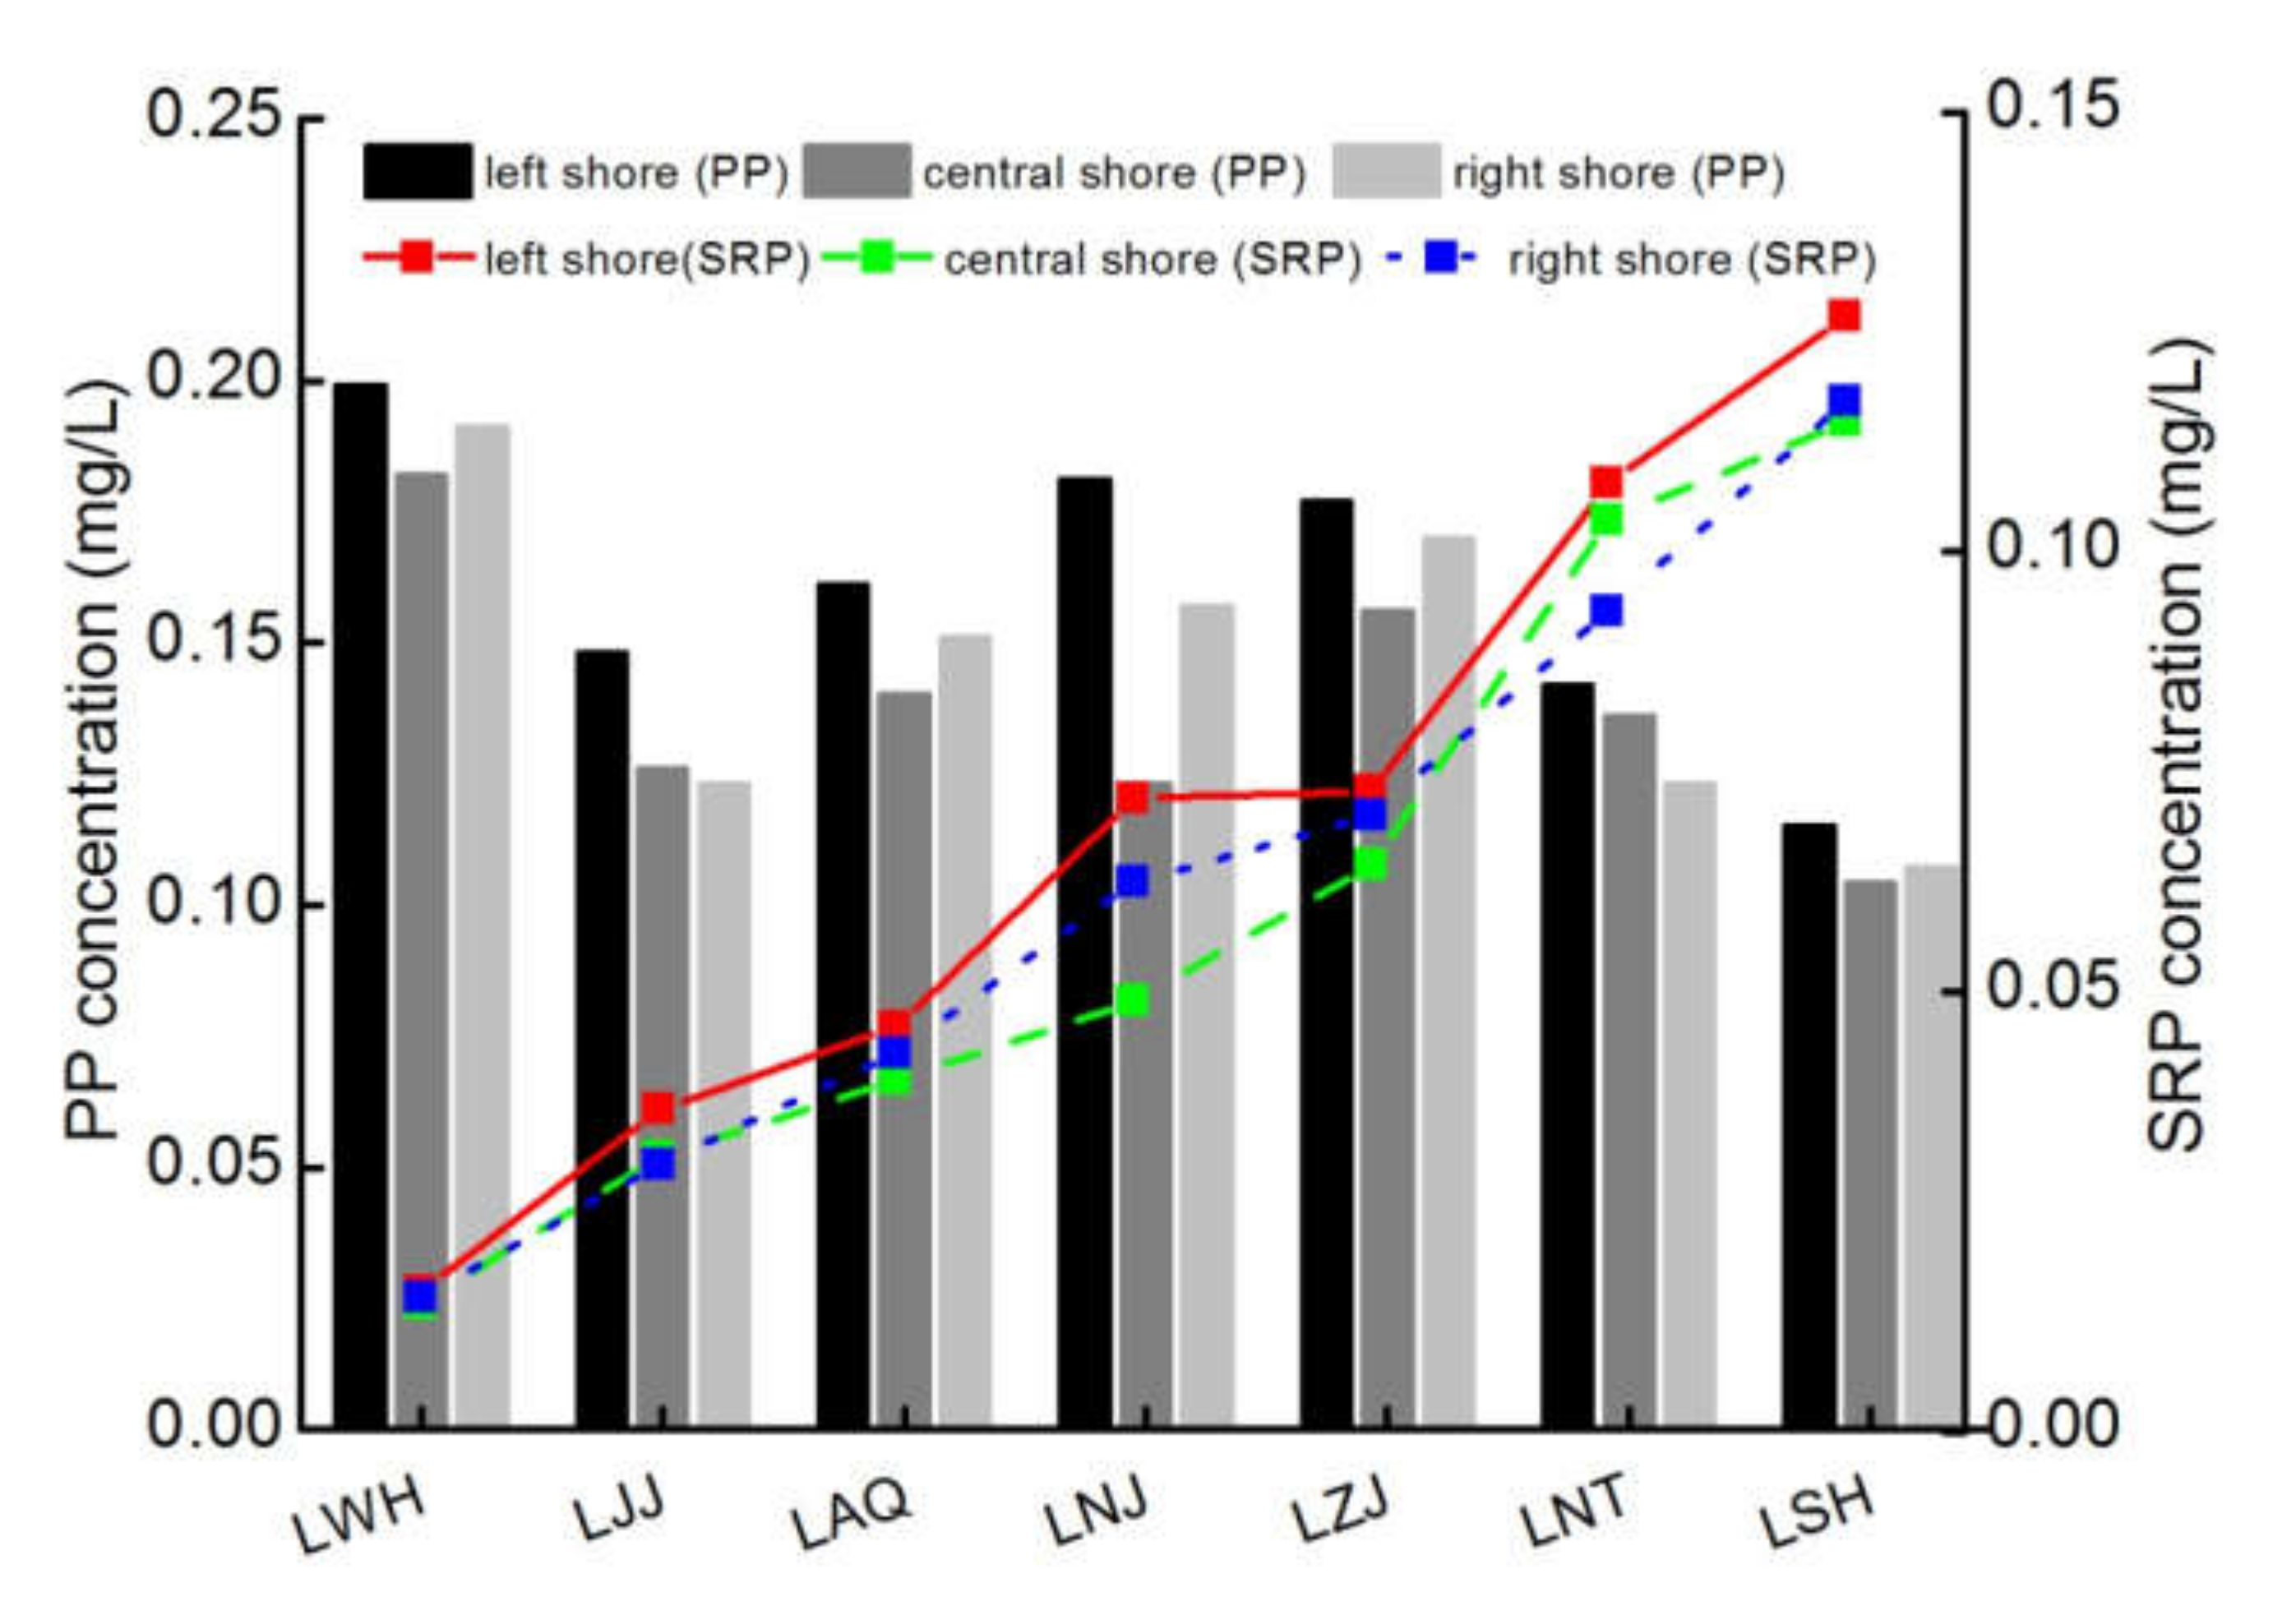
3.4.2. PP and SRP in the Left and Right Shores and the Central Line of Urban Lower Reaches

When comparing the PP concentrations in the left and right shore samples and in the central line from LWH to LSH, the PP concentrations of the left and right shores were higher than that of the central line in surface water samples (Figure 7). Spatial differences in the SRP concentration were similar to those of the PP concentration. Therefore, there were certain differences between the TP and SRP concentrations in the left and right shores and the central line of each sampling section. The main possible reason was that phosphorus could not be quickly diluted with slow water flow to the shore, which easily led to phosphorous accumulating near the shores; on the other hand, the concentration differences may be related to the location of the sewage outlets in the urban river stretches.

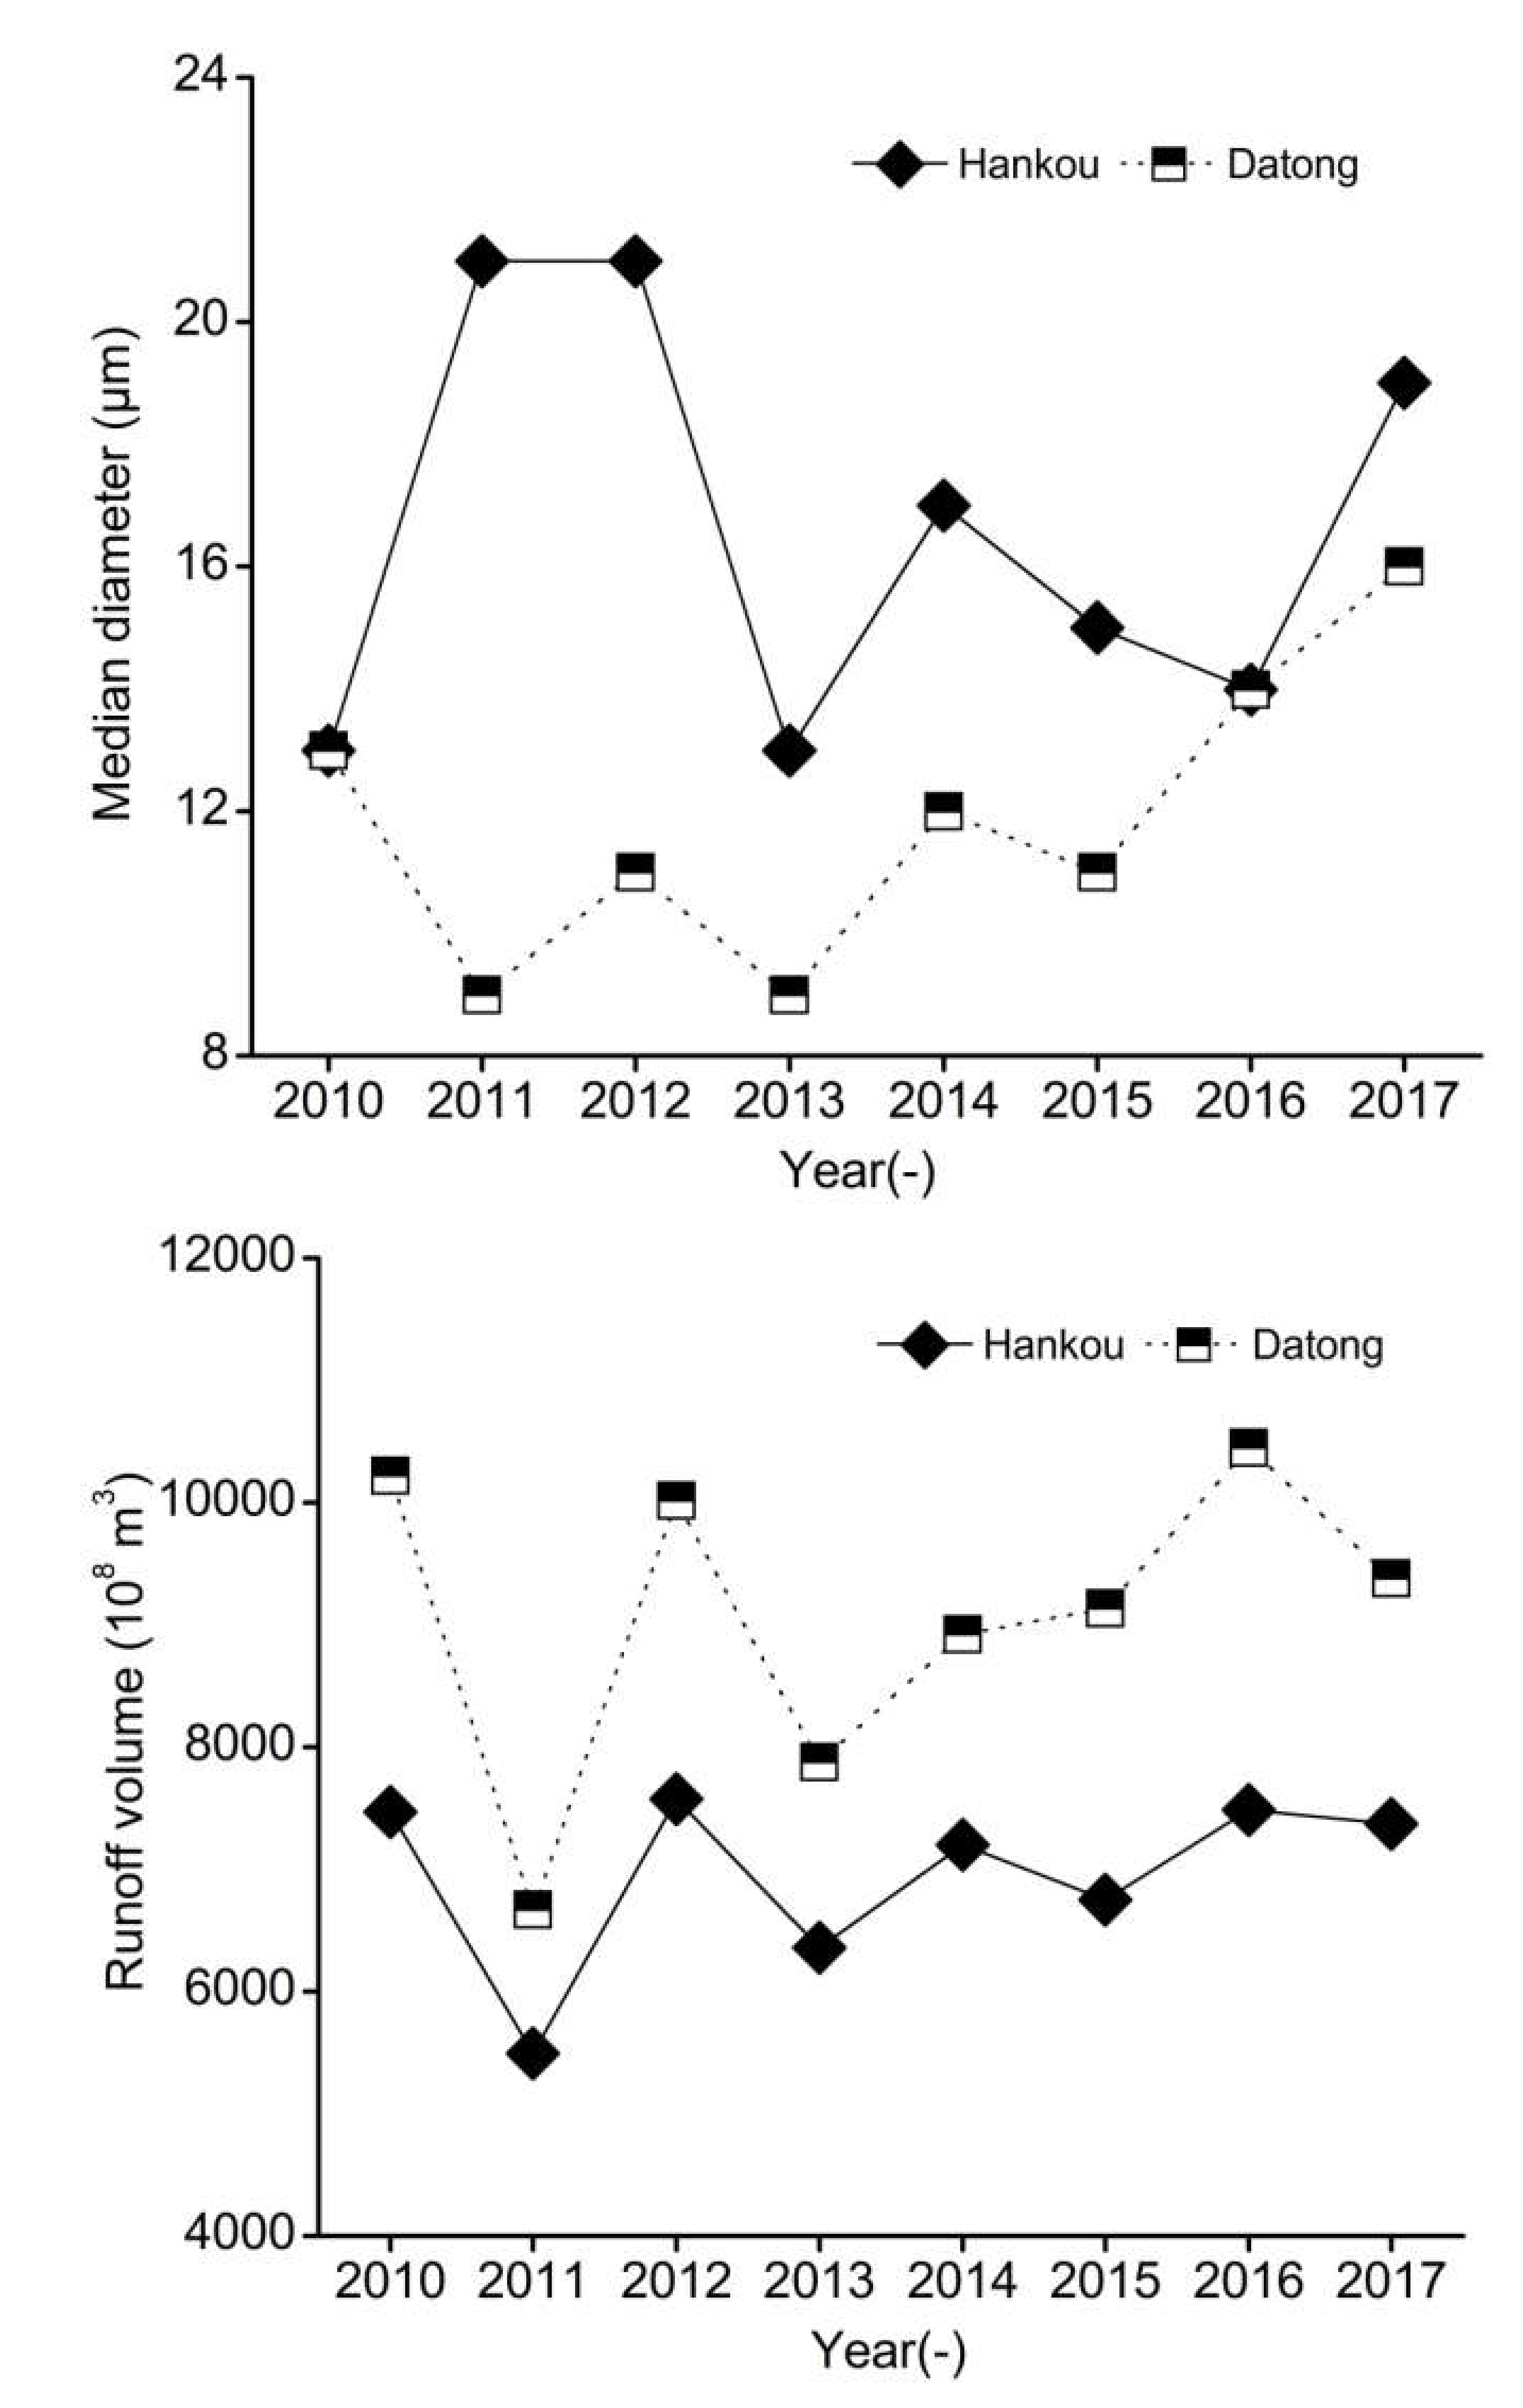
3.5. The Possible Changes in PP and SRP under the Current Situation

3.5.1. The Possible Changes of PP

Based on historical monitoring data [11], the annual total discharged SS loads and the corresponding mean concentrations of Hankou Station decreased from 111 million tons and 149 mg/L in 2010 to 69.8 million tons and 94 mg/L in 2017, which were reduced by 37.18% and 36.91%, respectively, whereas the annual total discharged SS loads and the corresponding mean concentrations of Datong Station decreased from 185 million tons and 181 mg/L in 2010 to 104 million tons and 111 mg/L in 2017, which were reduced by 43.78% and 38.67%, respectively (Figure 8). The discharged SS volume and the corresponding mean concentrations tended to decrease in the main stream of the middle and lower reaches of the Yangtze River. The field survey results (June 2014) indicated that the SS in the middle and lower reaches of the Yangtze River was positively correlated with PP (Figure 3). The sedimentation of SS led to a decrease in PP along the middle and lower reaches of the Yangtze River. Therefore, it could be inferred that the PP concentration would show a decreasing trend with the decrease of the discharged SS volume and the corresponding mean concentrations in the middle and lower reaches of the Yangtze River.

3.5.2. The Possible Changes in SRP

The historical statistical results indicated that the annual median diameter and total runoff volume of Hankou changed from 13 μm and 747.2 billion tons in 2010 to 19 μm and 737.2 billion tons in 2017, respectively, whereas the annual median diameter and total runoff volume of Datong changed from 13 μm and 1022.0 billion tons in 2010 to 16 μm and 937.8 billion tons in 2017, respectively (Figure 9). Therefore, after the Three Gorges Reservoir (TGR) was fully operational in 2010, based on historical monitoring data from Hankou Station and Datong Station [11], the runoff volume of the middle and lower reaches of the Yangtze River did not change much, but the median diameter of the SS increased overall. Predictably, under the condition of stable runoff volume and TP concentration in the middle and lower reaches of the Yangtze River, the insufficient supply of discharged SS and the corresponding increase in median particle size would cause the high ratio of SRP discharge along the middle and lower reaches of Yangtze River. If the current trend continues to develop, SRP will not be well controlled, and the SRP concentration will continue to increase.
In summary, although there was no eutrophication problem along the middle and lower reaches of the Yangtze River, the phosphorus pollution problem was still very prominent. As shown in Figure 10, in general, the SS concentration had a decreasing trend in the middle and lower reaches of the Yangtze River; moreover, the discharge of wastewater in the Yangtze River Basin had also increased overall with the development of the social economy [12], with the result that the SRP had an increasing trend overall. It could be deduced that the pollution of phosphorus will still be adverse in the middle and lower reaches of the Yangtze River in the future. Pertinent research has also showed that phosphorus was in the cumulative state in the Yangtze River Basin, and the accumulation might continue in comparison with the experience of large river basins in Europe and the United States [32]. The continuous increase of phosphorus in the Yangtze River might first cause eutrophication of the water body in sensitive areas, even the risk of blooms; secondly, phosphorus can directly cause harm to human skin, causing various skin inflammations, and vomiting, diarrhea, headaches, and even poisoning.

4. Conclusions and Suggestions

Based on monitoring data from June 2014, this paper studied the distribution characteristics and spatial differences of phosphorus in the main urban stretches of the Yangtze River. Combined with historical statistical results, the possible changes in PP and SRP were analyzed under the current situation. Moreover, the following suggestions were concluded with regard to the monitoring and control of phosphorus along the middle and lower reaches of the Yangtze River. The main conclusions and suggestions are as follows:
(1)
Based on onsite data analysis in June 2014, the average PP changed from 0.195 mg/L to 0.105 mg/L from WH to SH, and the average PP-to-TP ratio decreased from 85.71% in WH to 45.65% in SH, which showed a gradual decrease, while the average SRP changed from 0.033 to 0.125 mg/L, and the average SRP-to-TDP ratio increased from 60.73% in WH to 88.28% in SH, showing a gradual upward trend. In general, PP was still the principal form of TP in the middle and lower reaches of the Yangtze River; however, the PP-to-TP ratio had a decreasing trend compared with that of historical data.
(2)
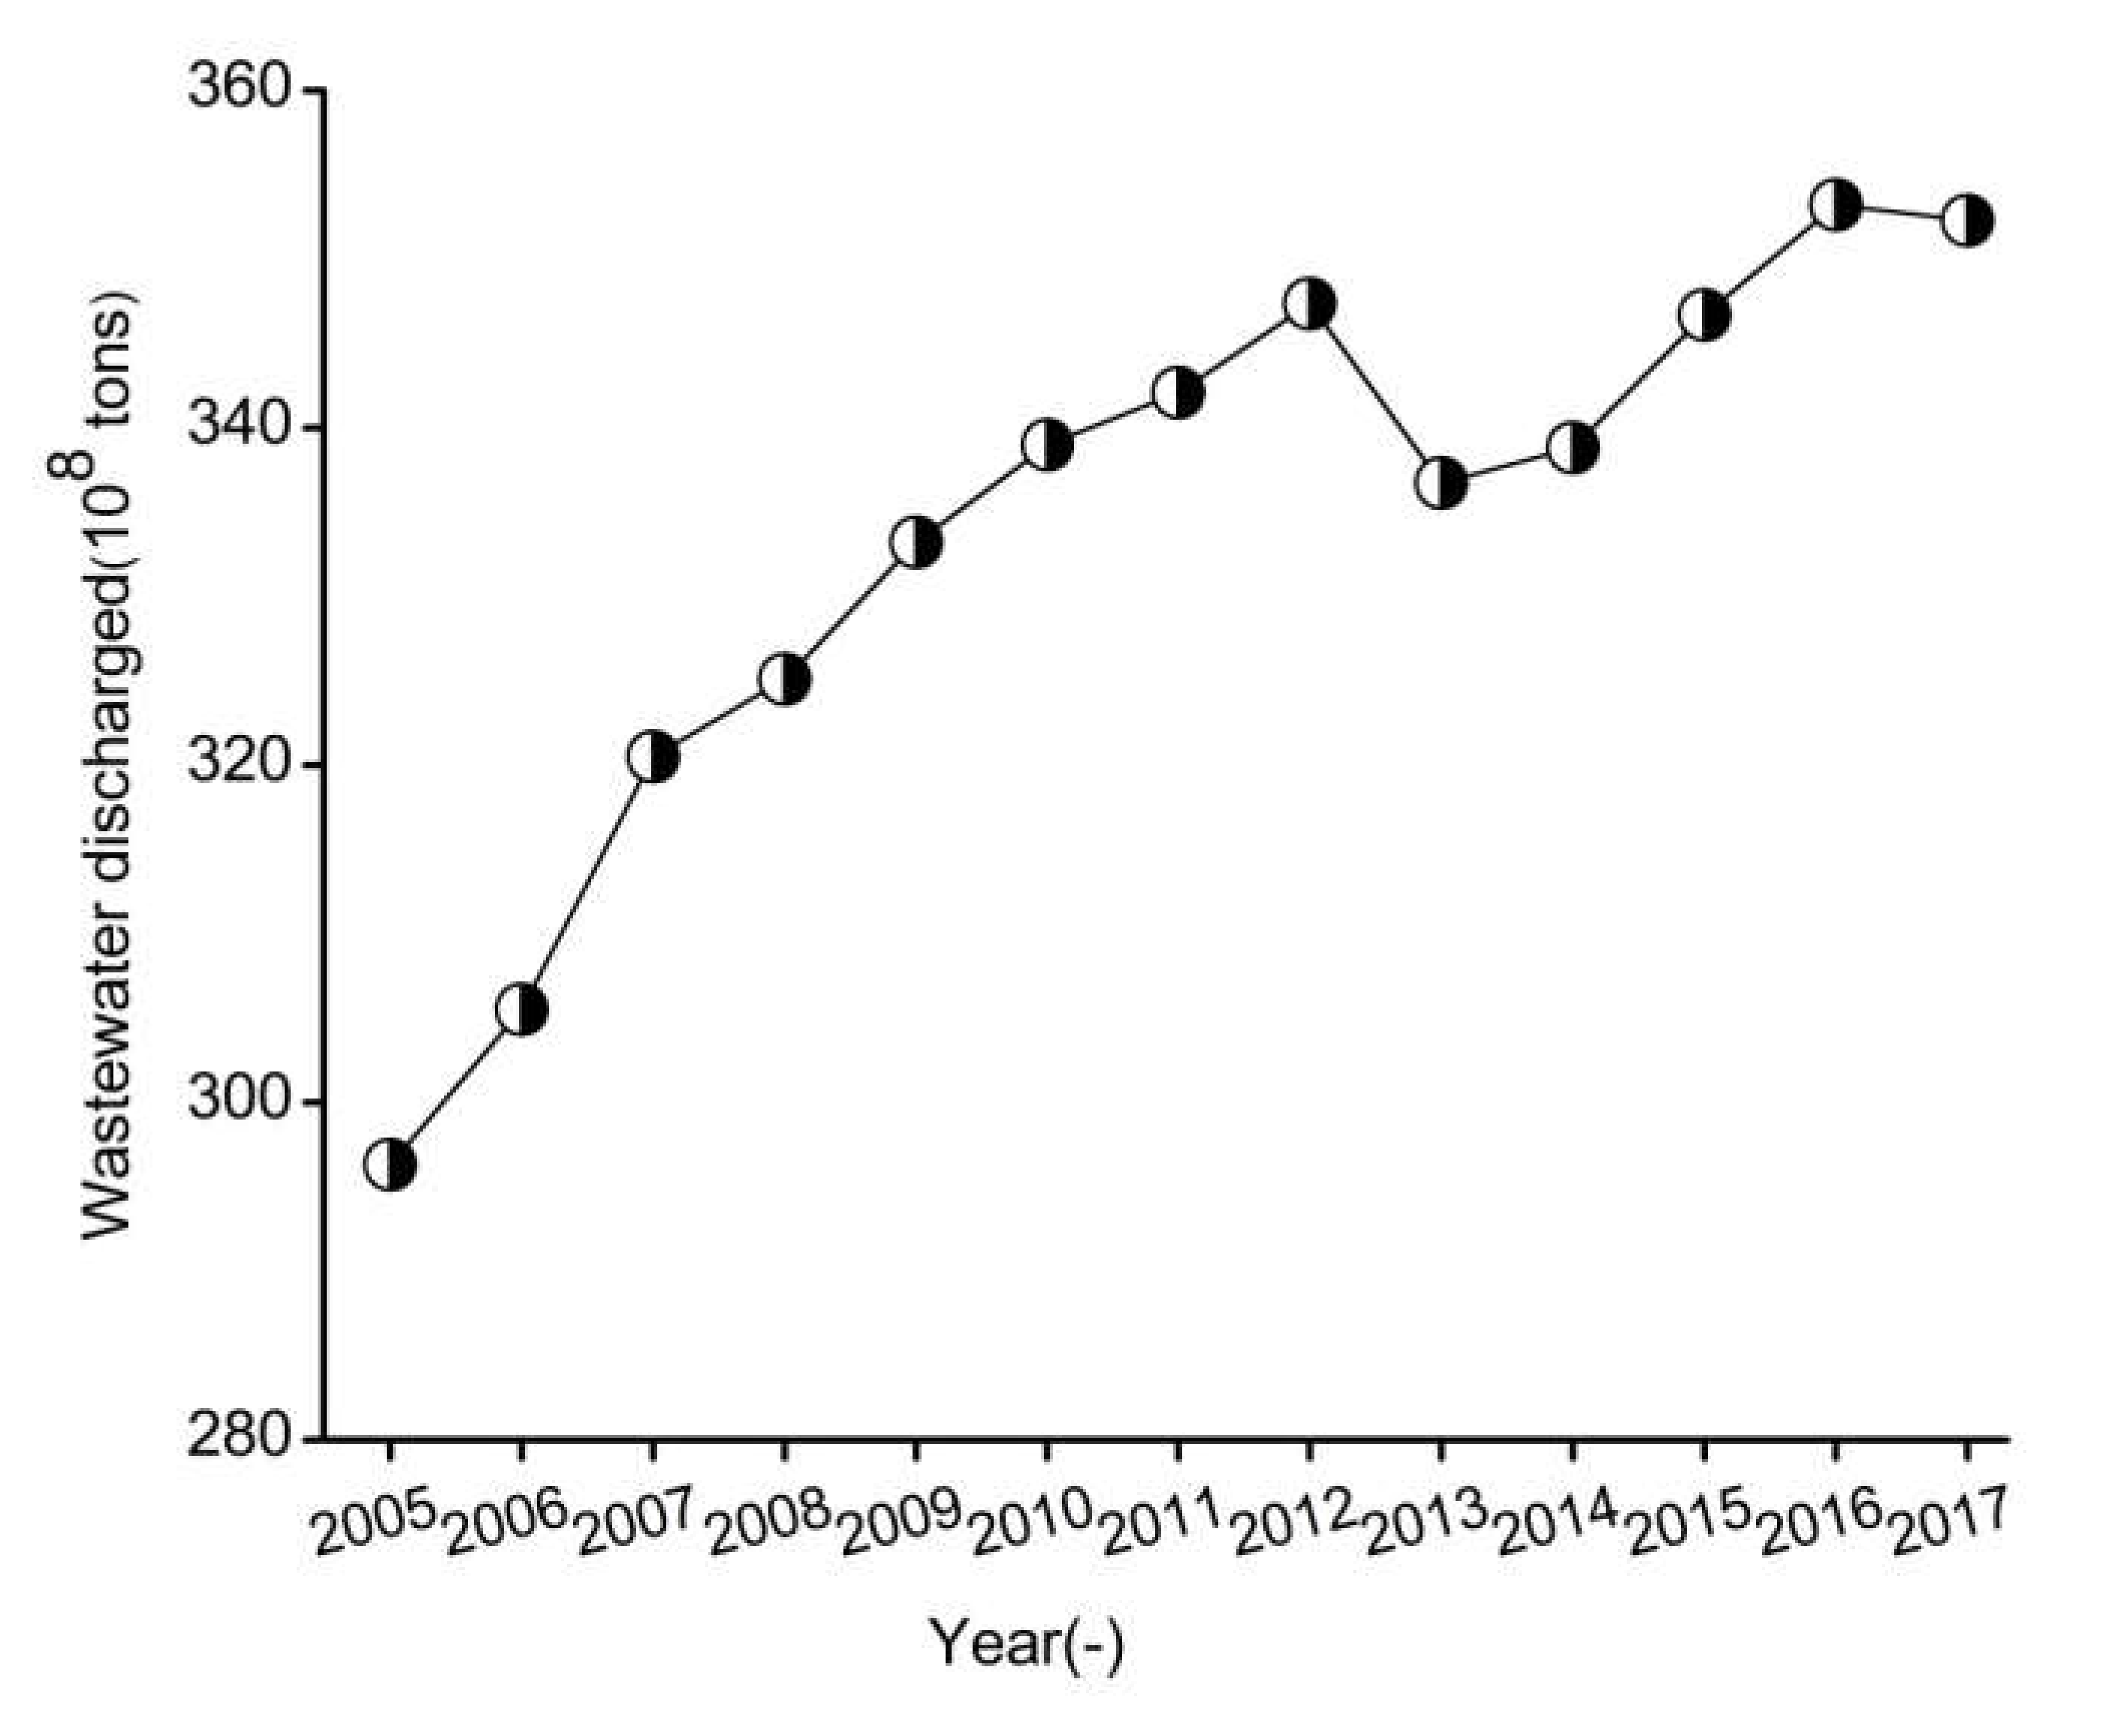
Overall, the average PP and SRP concentrations of the lower reach of each city were relatively higher than those of the upper reach, which was highly likely to be associated with the discharge of wastewater in urban river stretches along the Yangtze River Basin. Therefore, phosphorus emissions of municipal wastewater treatment plants should also be monitored and analyzed in the main urban river stretches, and the water environmental capacity of phosphorus of the main urban river stretches would also need to be calculated and analyzed to strictly control phosphorus emissions of urban river stretches along the middle and lower reaches of the Yangtze River.
(3)
Actual monitoring data showed that the concentrations of the PP and SRP of different sampling locations and water depths in same monitoring section showed differences. As a result, the phosphorus concentration of the sampling point did not represent the phosphorus concentration of the monitoring section. Therefore, the phosphorus flux of the monitoring section needs to be monitored.
(4)
Combined with an evaluation of long-term monitoring data and field surveys, the SRP had an increasing tendency on the whole. The risk of water eutrophication was not optimistic, especially in the Yangtze River estuary, the riparian zone of the urban river stretches, the tributary slow-flowing river section and in the corresponding naturally connected lakes. Therefore, the research in the middle and lower reaches of the Yangtze River should focus on strengthening the emergency monitoring and rapid warning of phosphorus pollution in sensitive areas.
This work could help people understand the distribution behavior of phosphorus in the urban rivers in the middle and lower reaches of the Yangtze River and provided a reference for water environment management and protection. The current research results could also provide a reference level for phosphorus monitoring of the Yangtze River. Based on historical monitoring data, combined with model prediction, the migration and transformation of phosphorus in the middle and lower reaches of the Yangtze River should be focused on in the future, so as to provide decision-making for management departments.

Author Contributions

Conceptualization, L.D.; methodology, L.L. and X.T.; investigation, Z.H. and L.L., L.D., and L.Z.; resources, M.W. and R.L.; L.D. wrote the manuscript and all authors contributed to improving the paper. All authors have read and agreed to the published version of the manuscript.

Funding

This research was funded by the Strategic Priority Research Program of the Chinese Academy of Sciences (Grant No. XDA23040303), the State-level Public Welfare Scientific Research Institutes Basic Scientific Research Business Project of China (Grant No. CKSF2019380SH, CKSF2017062/SH), the Young Elite Scientist Sponsorship Program by CAST (Grant No. 2015QNRC001).

Acknowledgments

We thank the reviewers for their useful comments and suggestions.

Conflicts of Interest

The authors declare no conflict of interest.

References

  1. CWRC (Changjiang Water Resource Commission). The Comprehensive Planning of the Yangtze River Water Resources; Changjiang Press: Wuhan, China, 2008. (In Chinese) [Google Scholar]
  2. Duan, S.; Liang, T.; Zhang, S.; Wang, L.; Zhang, X.; Chen, X. Seasonal changes in nitrogen and phosphorus transport in the lower Changjiang River before the construction of the Three Gorges Dam. Estuar. Coast. Shelf Sci. 2008, 79, 239–250. [Google Scholar] [CrossRef]
  3. Sun, C.; Shen, Z.; Liu, R.; Xiong, M.; Ma, F.; Zhang, O. Historical trend of nitrogen and phosphorus loads from the upper Yangtze River basin and their responses to the Three Gorges Dam. Environ. Sci. Pollut. Res. 2013, 20, 8871–8880. [Google Scholar] [CrossRef] [PubMed]
  4. Tang, X.; Wu, M.; Li, R. Distribution, sedimentation, and bioavailability of particulate phosphorus in the mainstream of the Three Gorges Reservoir. Water Res. 2018, 140, 44–55. [Google Scholar] [CrossRef] [PubMed]
  5. Tang, X.; Wu, M.; Li, R. Phosphorus distribution and bioavailability dynamics in the mainstream water and surface sediment of the Three Gorges Reservoir between 2003 and 2010. Water Res. 2018, 145, 321–331. [Google Scholar] [CrossRef] [PubMed]
  6. Jin, X.; Wang, S.; Bu, Q.; Wu, F. Laboratory Experiments on Phosphorous Release from the Sediments of 9 Lakes in the Middle and Lower Reaches of Yangtze River Region, China. Water Air Soil Pollut. 2006, 176, 233–251. [Google Scholar] [CrossRef]
  7. Jin, X.C.; Wang, S.R.; Chu, J.Z.; Wu, F.C. Organic Phosphorus in Shallow Lake Sediments in Middle and Lower Reaches of the Yangtze River Area in China. Pedosphere 2008, 18, 394–400. [Google Scholar] [CrossRef]
  8. Wu, P.; Qin, B.; Yu, G. Estimates of long-term water total phosphorus (TP) concentrations in three large shallow lakes in the Yangtze River basin, China. Environ. Sci Pollut Res. Int. 2016, 23, 4938–4948. [Google Scholar] [CrossRef]
  9. Liu, R.; Chen, Y.; Sun, C.; Zhang, P.; Wang, J.; Yu, W. Uncertainty analysis of total phosphorus spatial-temporal variations in the Yangtze River Estuary using different interpolation methods. Mar. Pollut Bull. 2014, 86, 68–75. [Google Scholar] [CrossRef]
  10. Zhou, J.; Zhang, M.; Lu, P. The effect of dams on phosphorus in the middle and lower Yangtze river. Water Resour Res. 2013, 49, 3659–3669. [Google Scholar] [CrossRef]
  11. CWRC (Changjiang Water Resource Commission). Changjiang Sediment: Bulletin; Changjiang Press: Wuhan, China; pp. 2010–2017. (In Chinese)
  12. CWRC (Changjiang Water Resource Commission). Water Resources Bulletin of the Yangtze River Basin and the Southwestern Rivers; Changjiang Press: Wuhan, China, 2005–2017. (In Chinese) [Google Scholar]
  13. Han, C.N.; Zheng, B.H.; Qin, Y.W.; Ma, Y.Q.; Yang, C.C.; Liu, Z.C.; Cao, W.; Chi, M.H. Impact of upstream river inputs and reservoir operation on phosphorus fractions in water-particulate phases in the Three Gorges Reservoir. Sci. Total Environ. 2018, 610, 1546–1556. [Google Scholar] [CrossRef]
  14. Heffernan, J.; Barry, J.; Devlin, M.; Fryer, R. A simulation tool for designing nutrient monitoring programmes for eutrophication assessments. Environmetrics 2010, 21, 3–20. [Google Scholar] [CrossRef]
  15. King, K.W.; Balogh, J.C.; Agrawal, S.G.; Tritabaugh, C.J.; Ryan, J.A. Phosphorus concentration and loading reductions following changes in fertilizer application and formulation on managed turf. J. Environ. Monit. 2012, 14, 2929–2938. [Google Scholar] [CrossRef] [PubMed]
  16. Huang, J.; Wang, X.; Xi, B.; Xu, Q.; Tang, Y.; Jia, K. Long-term variations of TN and TP in four lakes fed by Yangtze River at various timescales. Environ. Earth Sci. 2015, 74, 3993–4009. [Google Scholar] [CrossRef]
  17. Huang, Q.; Shen, H.; Wang, Z.; Liu, X.; Fu, R. Influences of natural and anthropogenic processes on the nitrogen and phosphorus fluxes of the Yangtze Estuary, China. Reg. Environ. Chang. 2006, 6, 125–131. [Google Scholar] [CrossRef]
  18. Sonzogni, W.C.; Chapra, S.C.; Armstrong, D.E.; Logan, T.J. Bioavailability of PhosphorusI nputs to Lakes. J. Environ. Qual. 1982, 11, 555–563. [Google Scholar] [CrossRef]
  19. Ellison, M.E.; Brett, M.T. Particulate phosphorus bioavailability as a function of stream flow and land cover. Water Res. 2006, 40, 1258–1268. [Google Scholar] [CrossRef]
  20. Shen, Z. Phosphorus and Silicate Fluxes in the Yangtze River. Acta Oceanol. Sin. 2006, 61, 741–751. [Google Scholar]
  21. Duan, S.; Zhang, S.; Chen, X.; Zhang, X.; Wang, L.; Yan, W. Concentrations of nitrogen and phosphorus and nutrient transport to estuary of the Yangtze River. Environ. Sci. 2000, 21, 53–57. (In Chinese) [Google Scholar]
  22. Xu, K.; Hayashi, S.; Murakami, S.; Maki, H.; Xu, B.; Watanabe, M. Characteristics of Water Quality in the ChangjiangRiver: Observations Conducted in 1998 and 1999. Acta Geogr. Sin. 2004, 59, 118–124. [Google Scholar]
  23. Guo, L.; He, Q. Freshwater flocculation of suspended sediments in the Yangtze River, China. Ocean. Dynam. 2011, 61, 371–386. [Google Scholar] [CrossRef]
  24. Paerl, H.W.; Xu, H.; McCarthy, M.J.; Zhu, G.; Qin, B.; Li, Y. Controlling harmful cyanobacterial blooms in a hyper-eutrophic lake (Lake Taihu, China): The need for a dual nutrient (N & P) management strategy. Water Res. 2011, 45, 1973–1983. [Google Scholar] [PubMed]
  25. Xu, H.; Paerl, H.W.; Qin, B.; Zhu, G.; Gao, G. Nitrogen and phosphorus inputs control phytoplankton growth in eutrophic Lake Taihu, China. Limnol. Oceanogr. 2010, 55, 420–432. [Google Scholar] [CrossRef] [Green Version]
  26. Bergström, A.-K. The use of TN: TP and DIN: TP ratios as indicators for phytoplankton nutrient limitation in oligotrophic lakes affected by N deposition. Aquat. Sci. 2010, 72, 277–281. [Google Scholar] [CrossRef]
  27. Cao, X.; Wang, J.; Liao, J.; Sun, J.; Huang, Y. The threshold responses of phytoplankton community to nutrient gradient in a shallow eutrophic Chinese lake. Ecol. Indic. 2016, 61, 258–267. [Google Scholar] [CrossRef]
  28. Carstensen, J.; Klais, R.; Cloern, J.E. Phytoplankton blooms in estuarine and coastal waters: Seasonal patterns and key species. Estuar. Coast. Shelf Sci. 2015, 162, 98–109. [Google Scholar] [CrossRef] [Green Version]
  29. Paudel, B.; Velinsky, D.; Belton, T.; Pang, H. Spatial variability of estuarine environmental drivers and response by phytoplankton: A multivariate modeling approach. Ecol. Inform. 2016, 34, 1–12. [Google Scholar] [CrossRef]
  30. Kim, B.; Choi, K.; Kim, C.; Lee, U.H.; Kim, Y.H. Effects of the summer monsoon on the distribution and loading of organic carbon in a deep reservoir, Lake Soyang, Korea. Water Res. 2000, 34, 3495–3504. [Google Scholar] [CrossRef]
  31. Nie, Z.Y.; Liang, X.Q.; Xing, B.; Ye, Y.S.; Qian, Y.C.; Yu, Y.W. The current water trophic status in Tiaoxi River of Taihu Lake watershed and corresponding coping strategy based on N/P ratio analysis. Acta Ecol. Sin. 2012, 32, 44–55. [Google Scholar]
  32. Powers, S.M.; Bruulsema, T.W.; Burt, T.P. Long-term accumulation and transport of anthropogenic phosphorus in three river basins. Nat. Geosci. 2016, 9, 353–356. [Google Scholar] [CrossRef]
Figure 1. Location of sampling sites along the middle and lower reaches of the Yangtze River.
Water 12 00910 g001
Figure 2. Distribution of total phosphorus (TP), particulate phosphorus (PP), and PP-to-TP (%) of water samples in the main urban river stretches along the middle and lower reaches of Yangtze River.
Water 12 00910 g002
Figure 3. Distribution of PP and suspended sediment (SS) of water samples in the main urban river stretches along the middle and lower reaches of Yangtze River.
Water 12 00910 g003
Figure 4. Distribution of total dissolved phosphorus (TDP), soluble reactive phosphate (SRP), and SRP to TDP (%) of water samples in the main urban river stretches along the middle and lower reaches of the Yangtze River.
Water 12 00910 g004
Figure 5. Comparison of total nitrogen (TN), TP, and TN/TP ratio in the upper reaches and the lower reaches of the urban river stretches along the middle and lower reaches of the Yangtze River.
Water 12 00910 g005
Figure 6. Comparison of PP and SRP concentrations of the surface water and bottom water from the central line in the upper and lower reaches of the urban river stretches.
Water 12 00910 g006
Figure 7. Comparison of PP and SRP concentrations in surface water samples from the lower reaches of urban river stretches. Legend: the lower reach of Wuhan (LWH), the lower reach of Jiujiang (LJJ), the lower reach of Anqing (LAQ), the lower reach of Nanjing (LNJ), the lower reach of Zhenjiang (LZJ), the lower reach of Nantong (LNT), and the lower reach of Shanghai (LSH).
Water 12 00910 g007
Figure 8. Variations in the annual mean SS concentrations and total sediment discharged volumes between 2010 and 2017.
Water 12 00910 g008
Figure 9. Variation in the annual mean median particle size of SS and total runoff volume between 2010 and 2017.
Water 12 00910 g009
Figure 10. Wastewater discharge in the Yangtze River Basin between 2005 and 2017.
Water 12 00910 g010
Table 1. Water physicochemical parameters of the main urban river stretches along the middle and lower reaches of Yangtze River.
Sampling SitesParameters
pH (-)DO (mg/L)TURB (NTU)T (°C)EC (µs/cm)chl-a (μg/L)ORP (mv)
Wuhan (WH)7.98 ± 0.057.77 ± 0.1730.88 ± 5.8123.9 ± 0.4228.0 ± 35.14.15 ± 0.44533.4 ± 37.1
Jiujiang (JJ)8.06 ± 0.056.85 ± 0.1448.38 ± 7.4123.0 ± 0.3243.0 ± 43.23.63 ± 0.45500.8 ± 37.6
Anqing (AQ)8.08 ± 0.036.92 ± 0.1959.55 ± 5.7223.4 ± 0.6210.3 ± 54.14.00 ± 0.18496.4 ± 33.5
NanJing (NJ)8.13 ± 0.017.21 ± 0.1364.40 ± 7.7223.7 ± 0.4151.5 ± 45.73.88 ± 0.41483.6 ± 47.6
Zhengjiang (ZJ)8.00 ± 0.027.67 ± 0.2460.98 ± 4.6723.5 ± 0.1170.0 ± 49.64.25 ± 0.19451.5 ± 42.5
Nantong (NT)8.04 ± 0.076.78 ± 0.2159.13 ± 3.3722.3 ± 0.4228.5 ± 40.93.53 ± 0.28414.1 ± 27.8
Shanghai (SH)8.01 ± 0.136.22 ± 0.0451.28 ± 2.5821.8 ± 0.5174.5 ± 47.83.15 ± 0.34418.2 ± 35.3
Table 2. The PP and SRP concentrations from the upper reaches and the lower reaches of the urban river stretches along the middle and lower reaches of the Yangtze River (mg/L).
The Urban River StretchPP ConcentrationSRP Concentration
The Upper ReachThe Lower ReachThe Upper ReachThe Lower Reach
WH0.171 ± 0.0120.220 ± 0.0060.015 ± 0.0010.024 ± 0.001
JJ0.132 ± 0.0020.120 ± 0.0050.017 ± 0.0010.032 ± 0.001
AQ0.122 ± 0.0090.138 ± 0.0020.041 ± 0.0060.040 ± 0.001
NJ0.151 ± 0.0070.159 ± 0.0090.050 ± 0.0030.060 ± 0.003
ZJ0.171 ± 0.0100.169 ± 0.0110.060 ± 0.0070.070 ± 0.004
NT0.111 ± 0.0070.123 ± 0.0090.060 ± 0.0060.091 ± 0.006
SH0.106 ± 0.0110.104 ± 0.0130.111 ± 0.0100.110 ± 0.013

