The Impact of Hydraulic Fracturing on Groundwater Quality in the Permian Basin, West Texas, USA


Abstract
1. Introduction
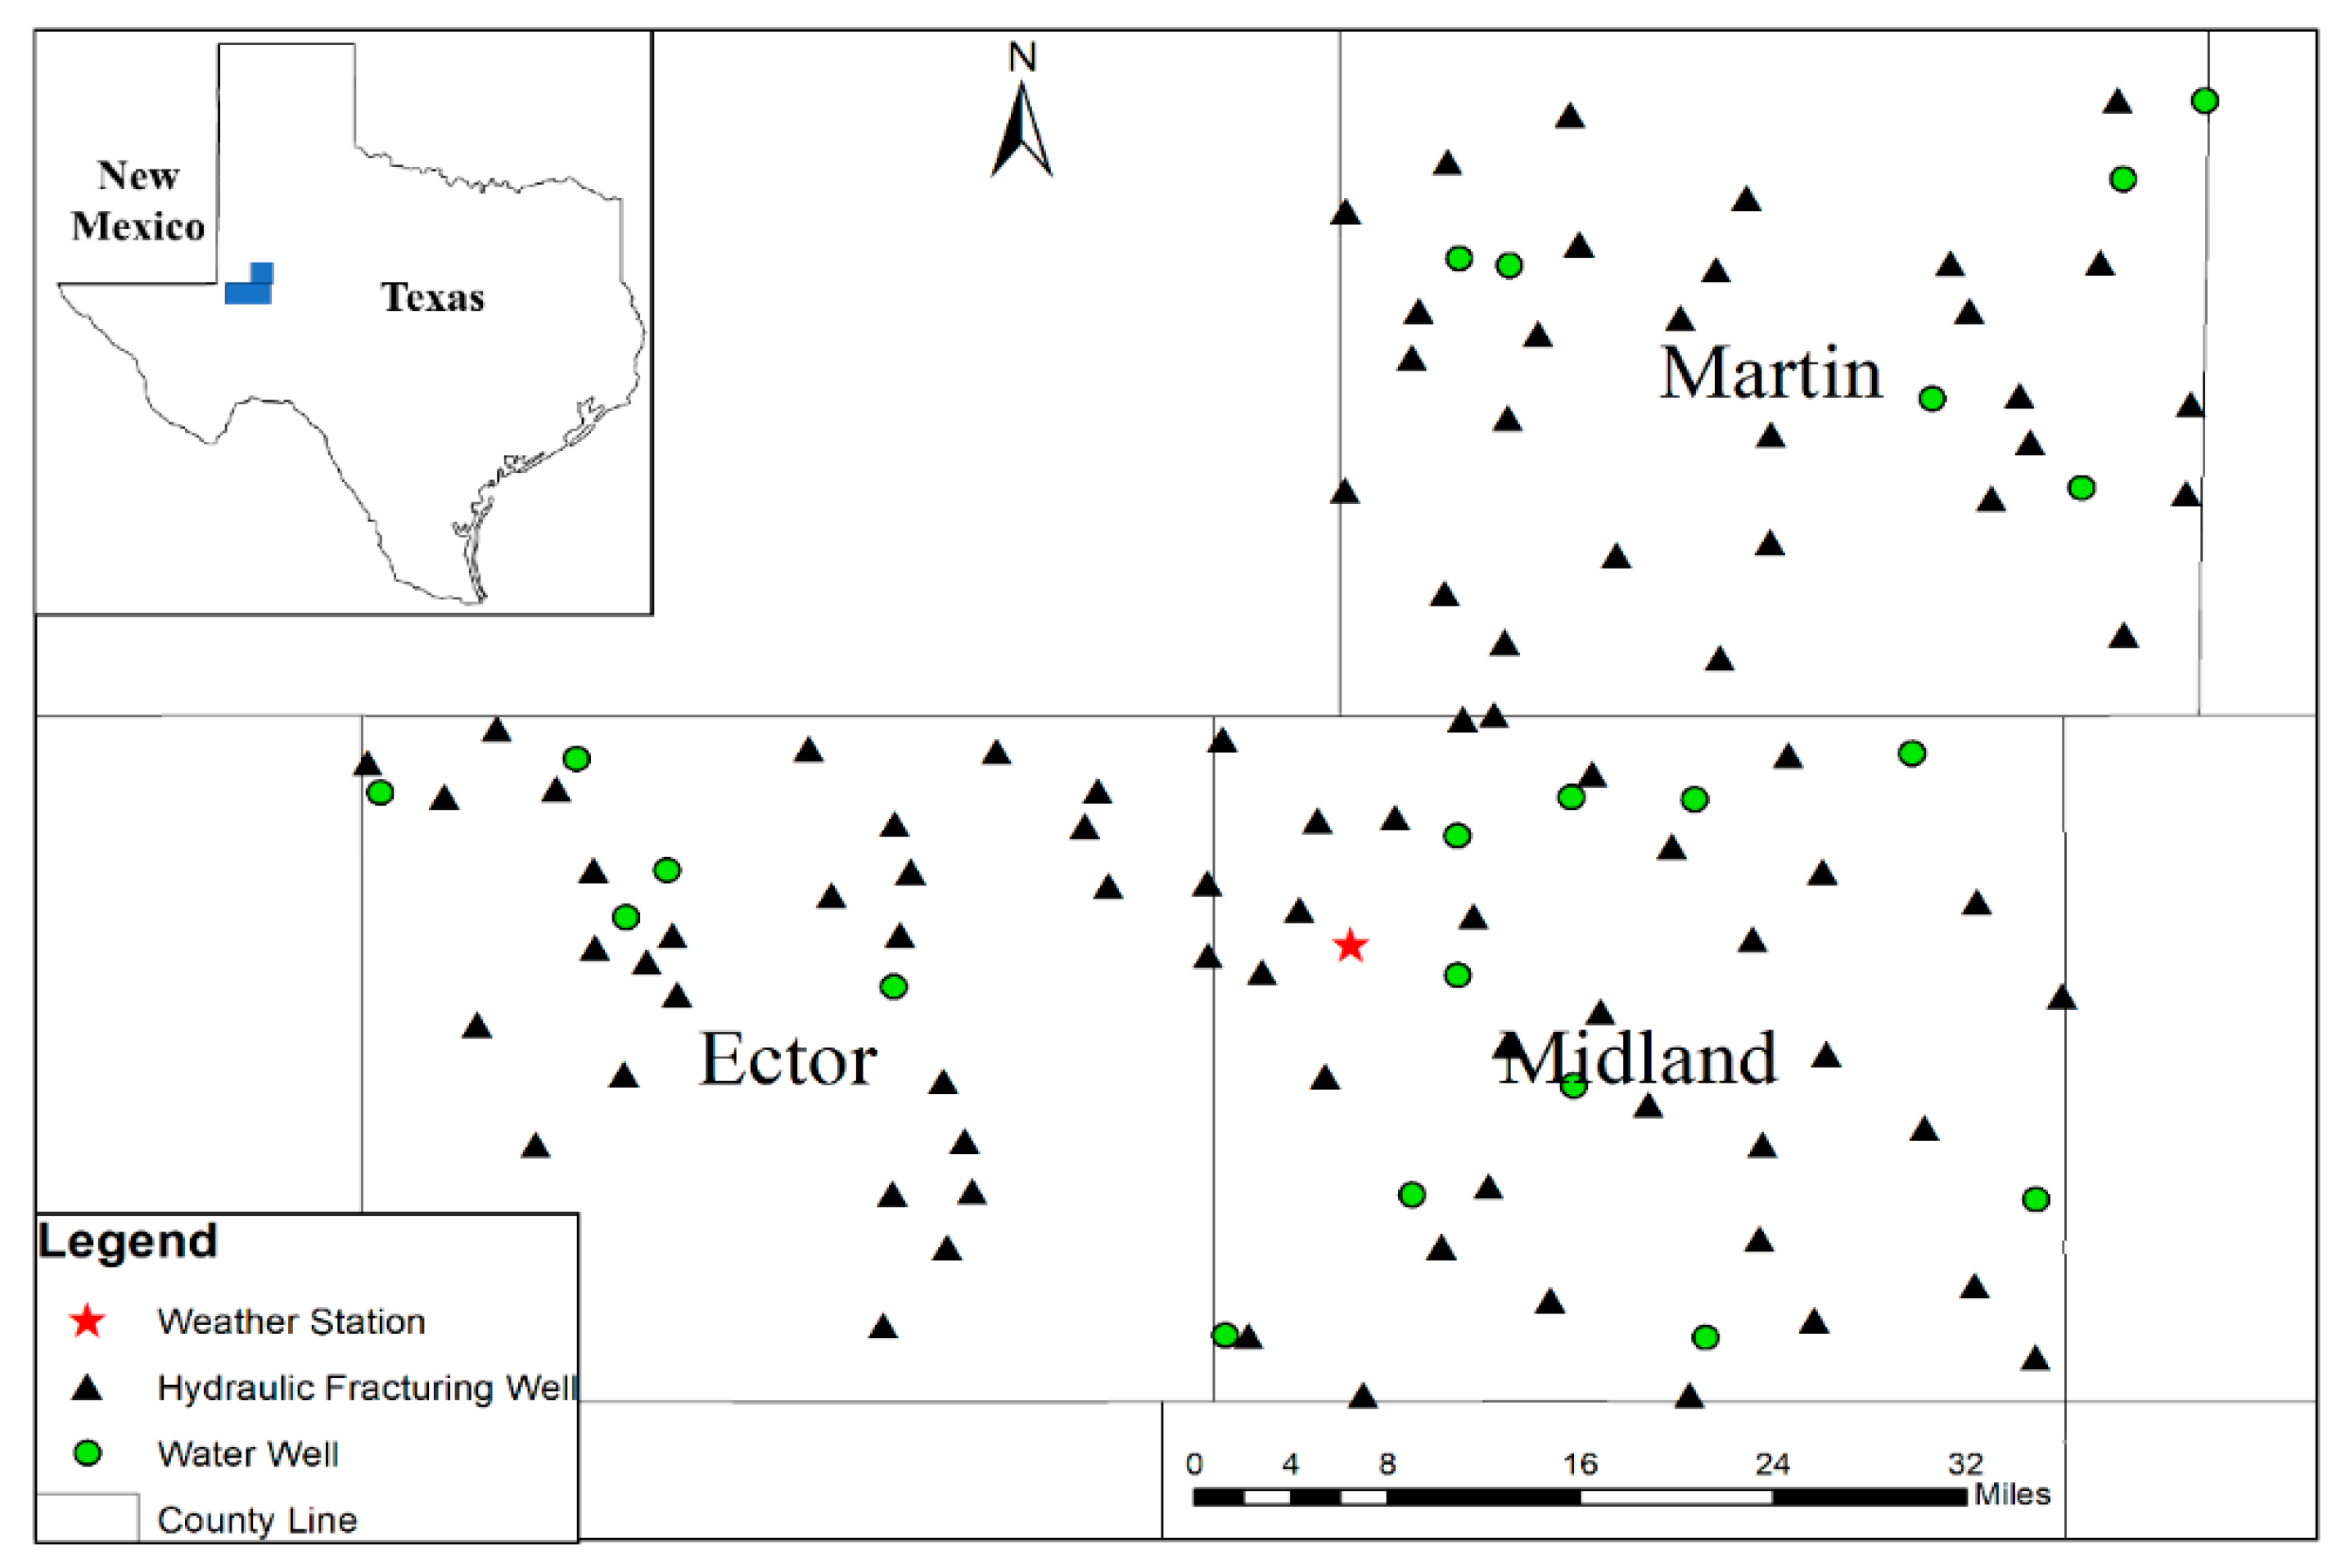
2. Study Area
3. Materials and Methods
3.1. Hydraulic Fracturing Information
3.2. Groundwater Quality Analysis
4. Results and Discussion
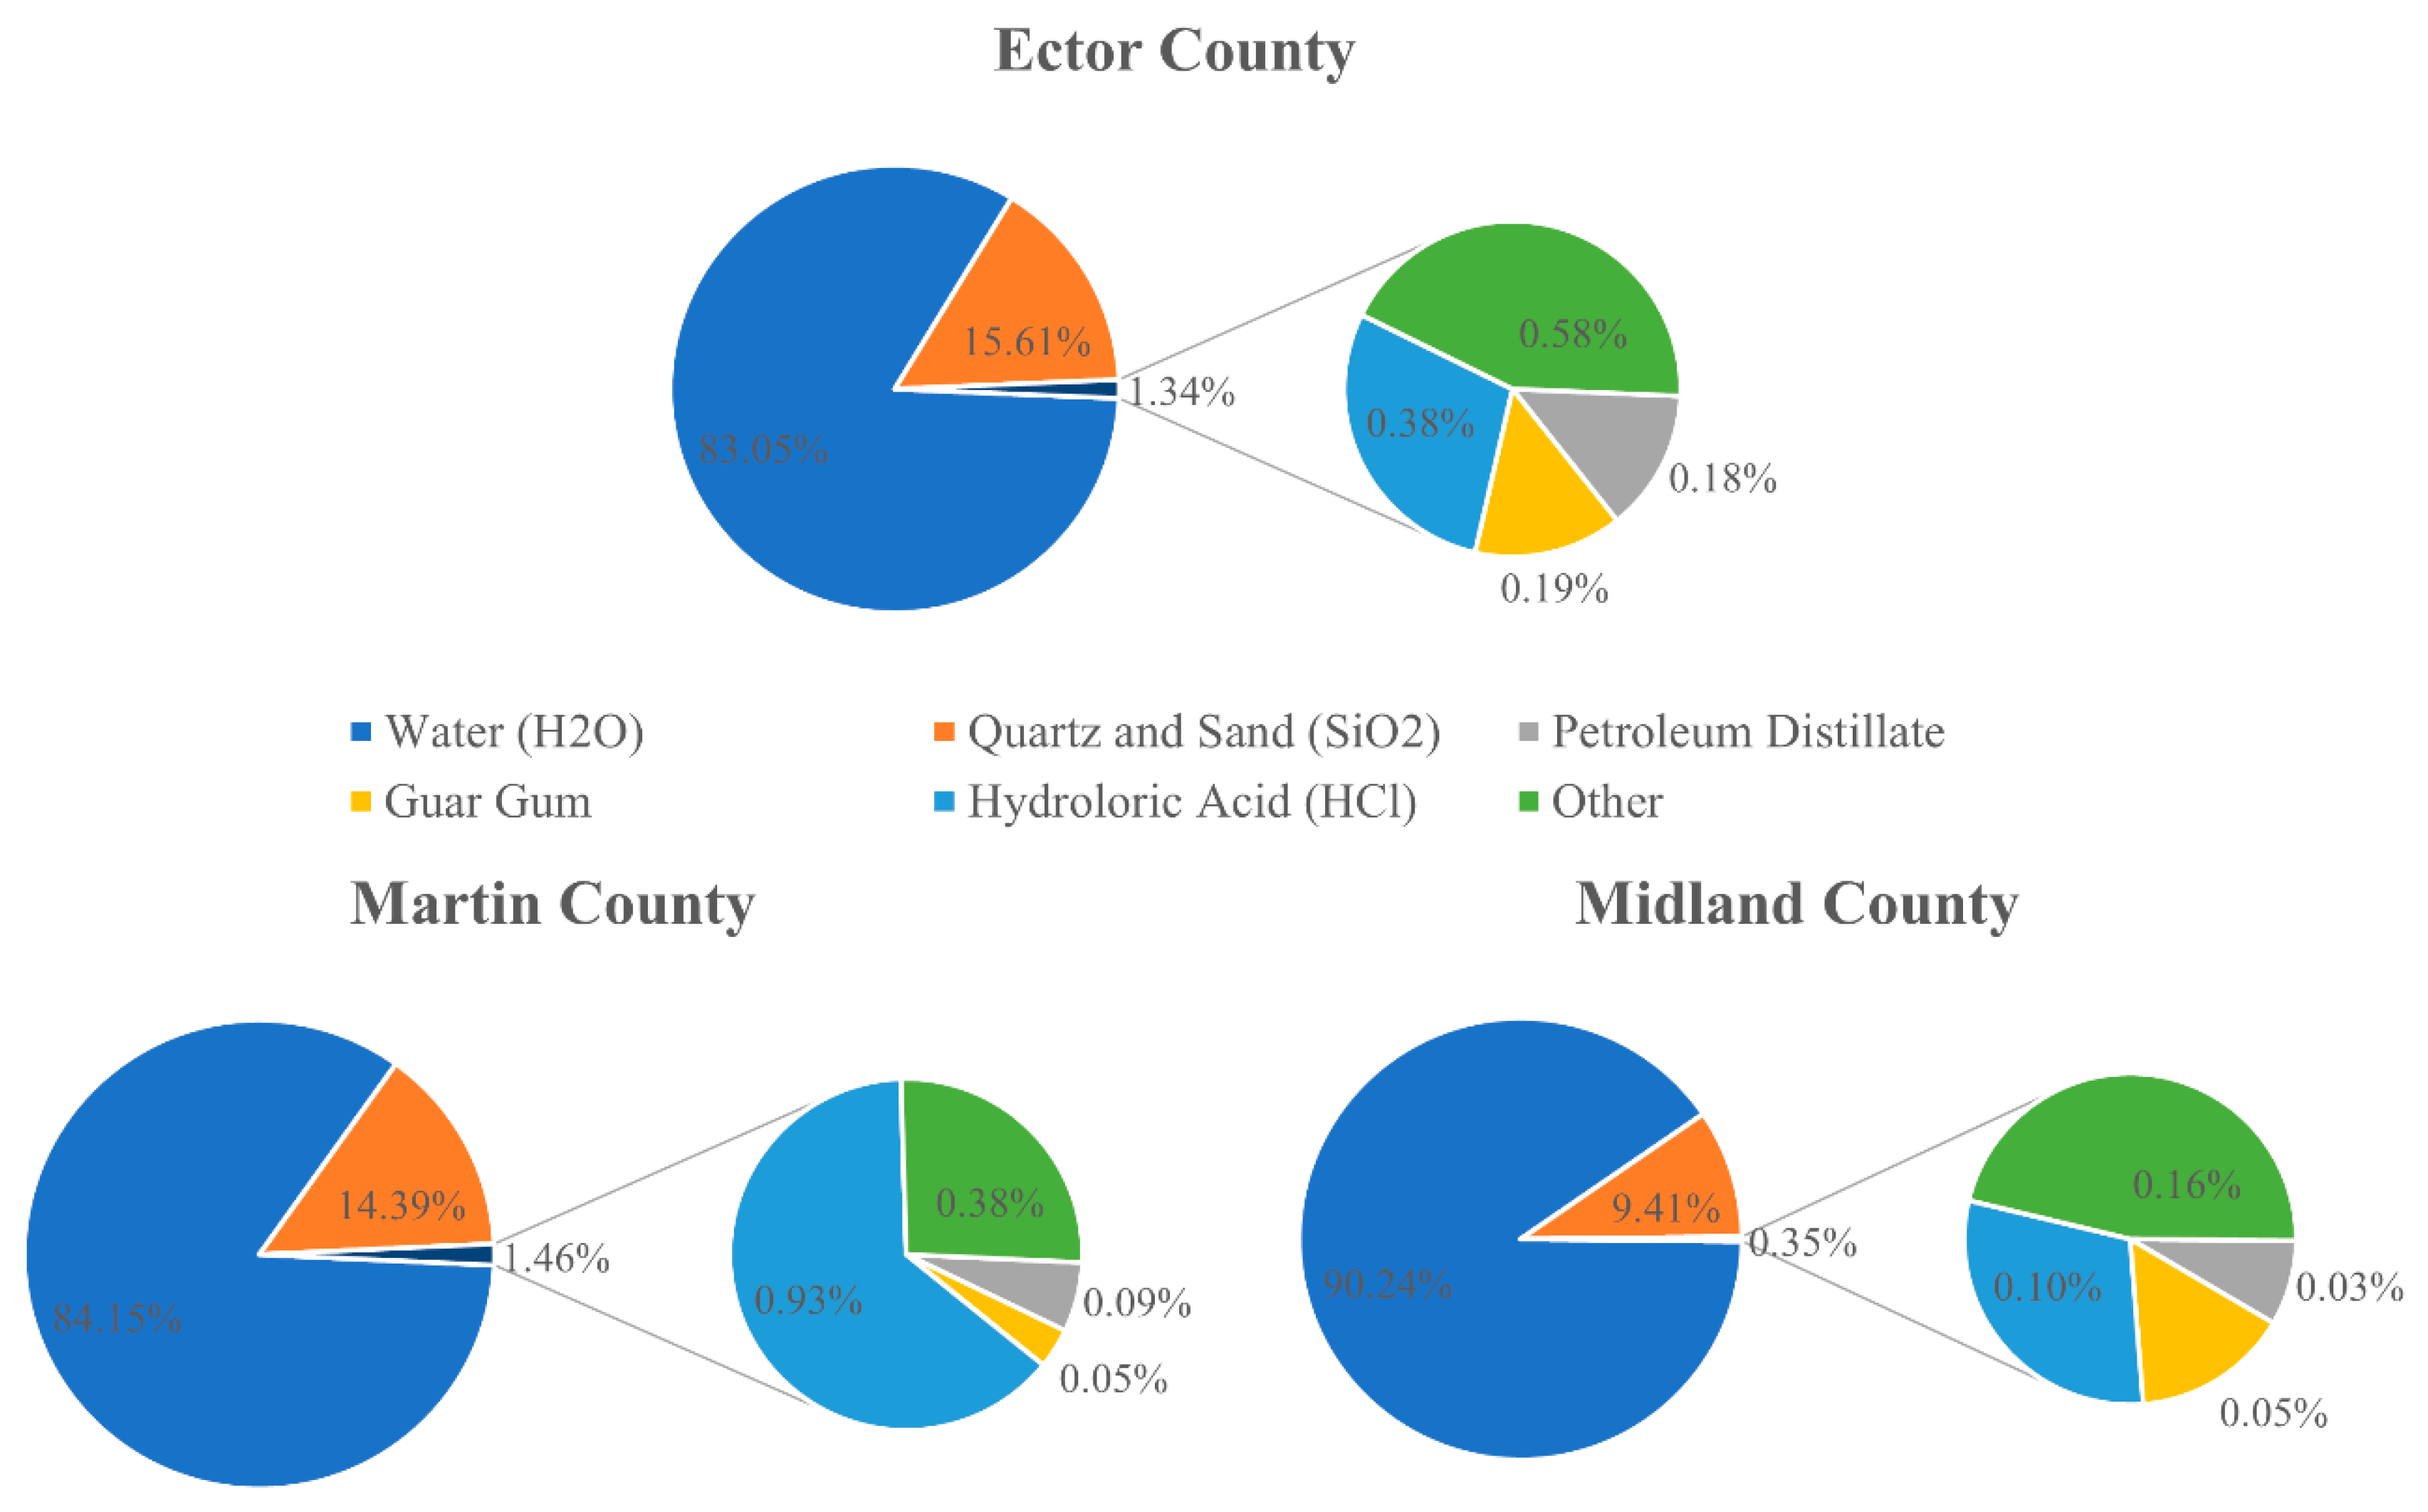
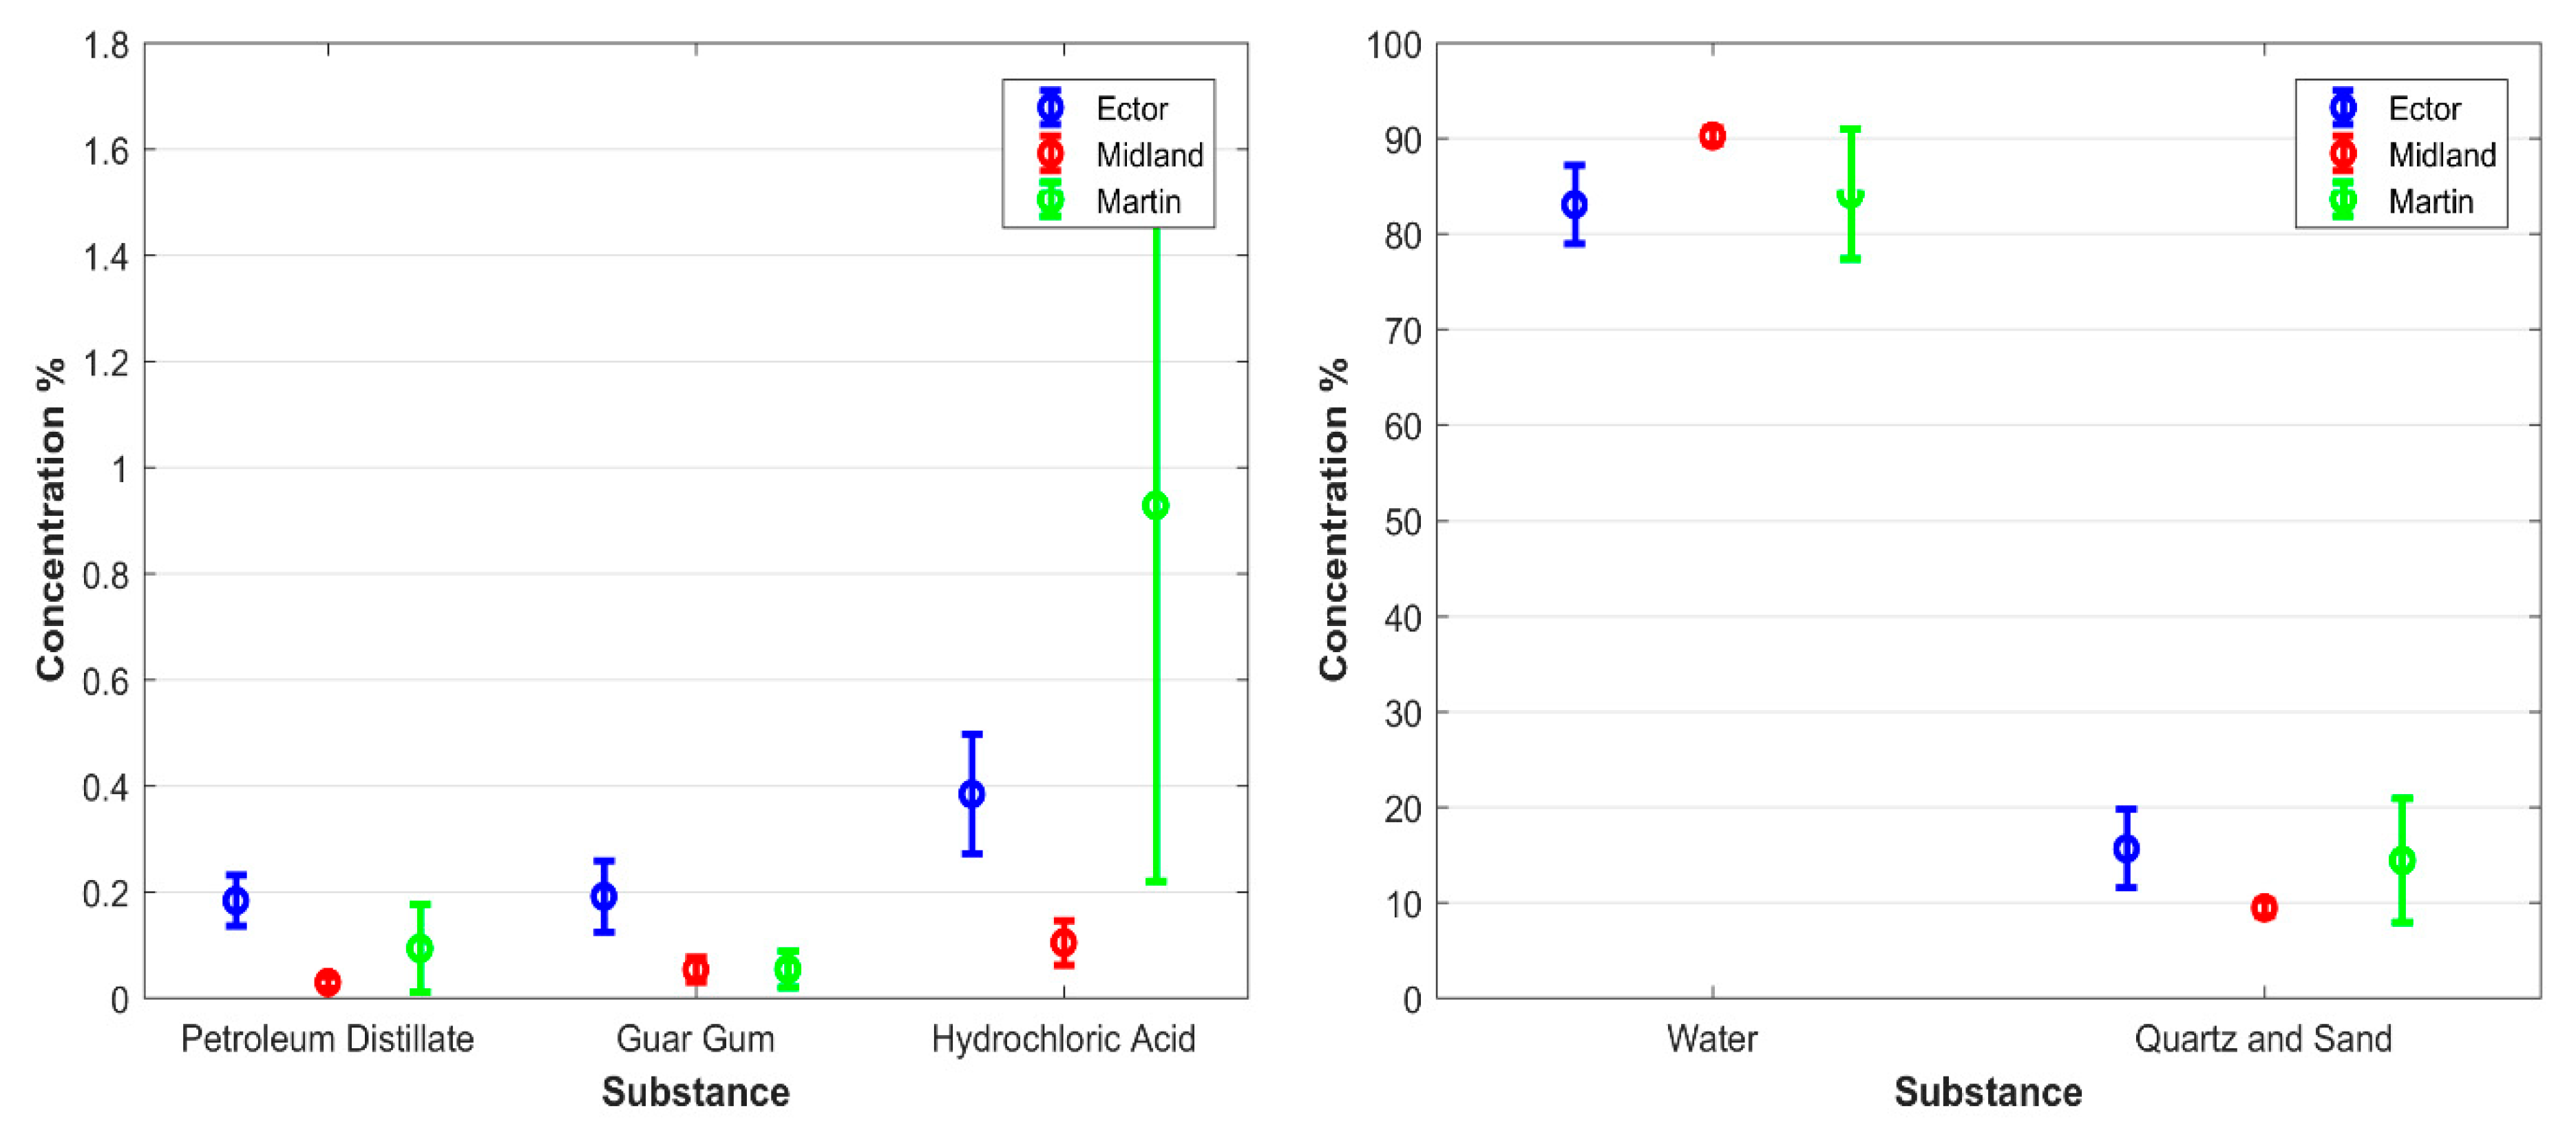
4.1. Hydraulic Fracturing
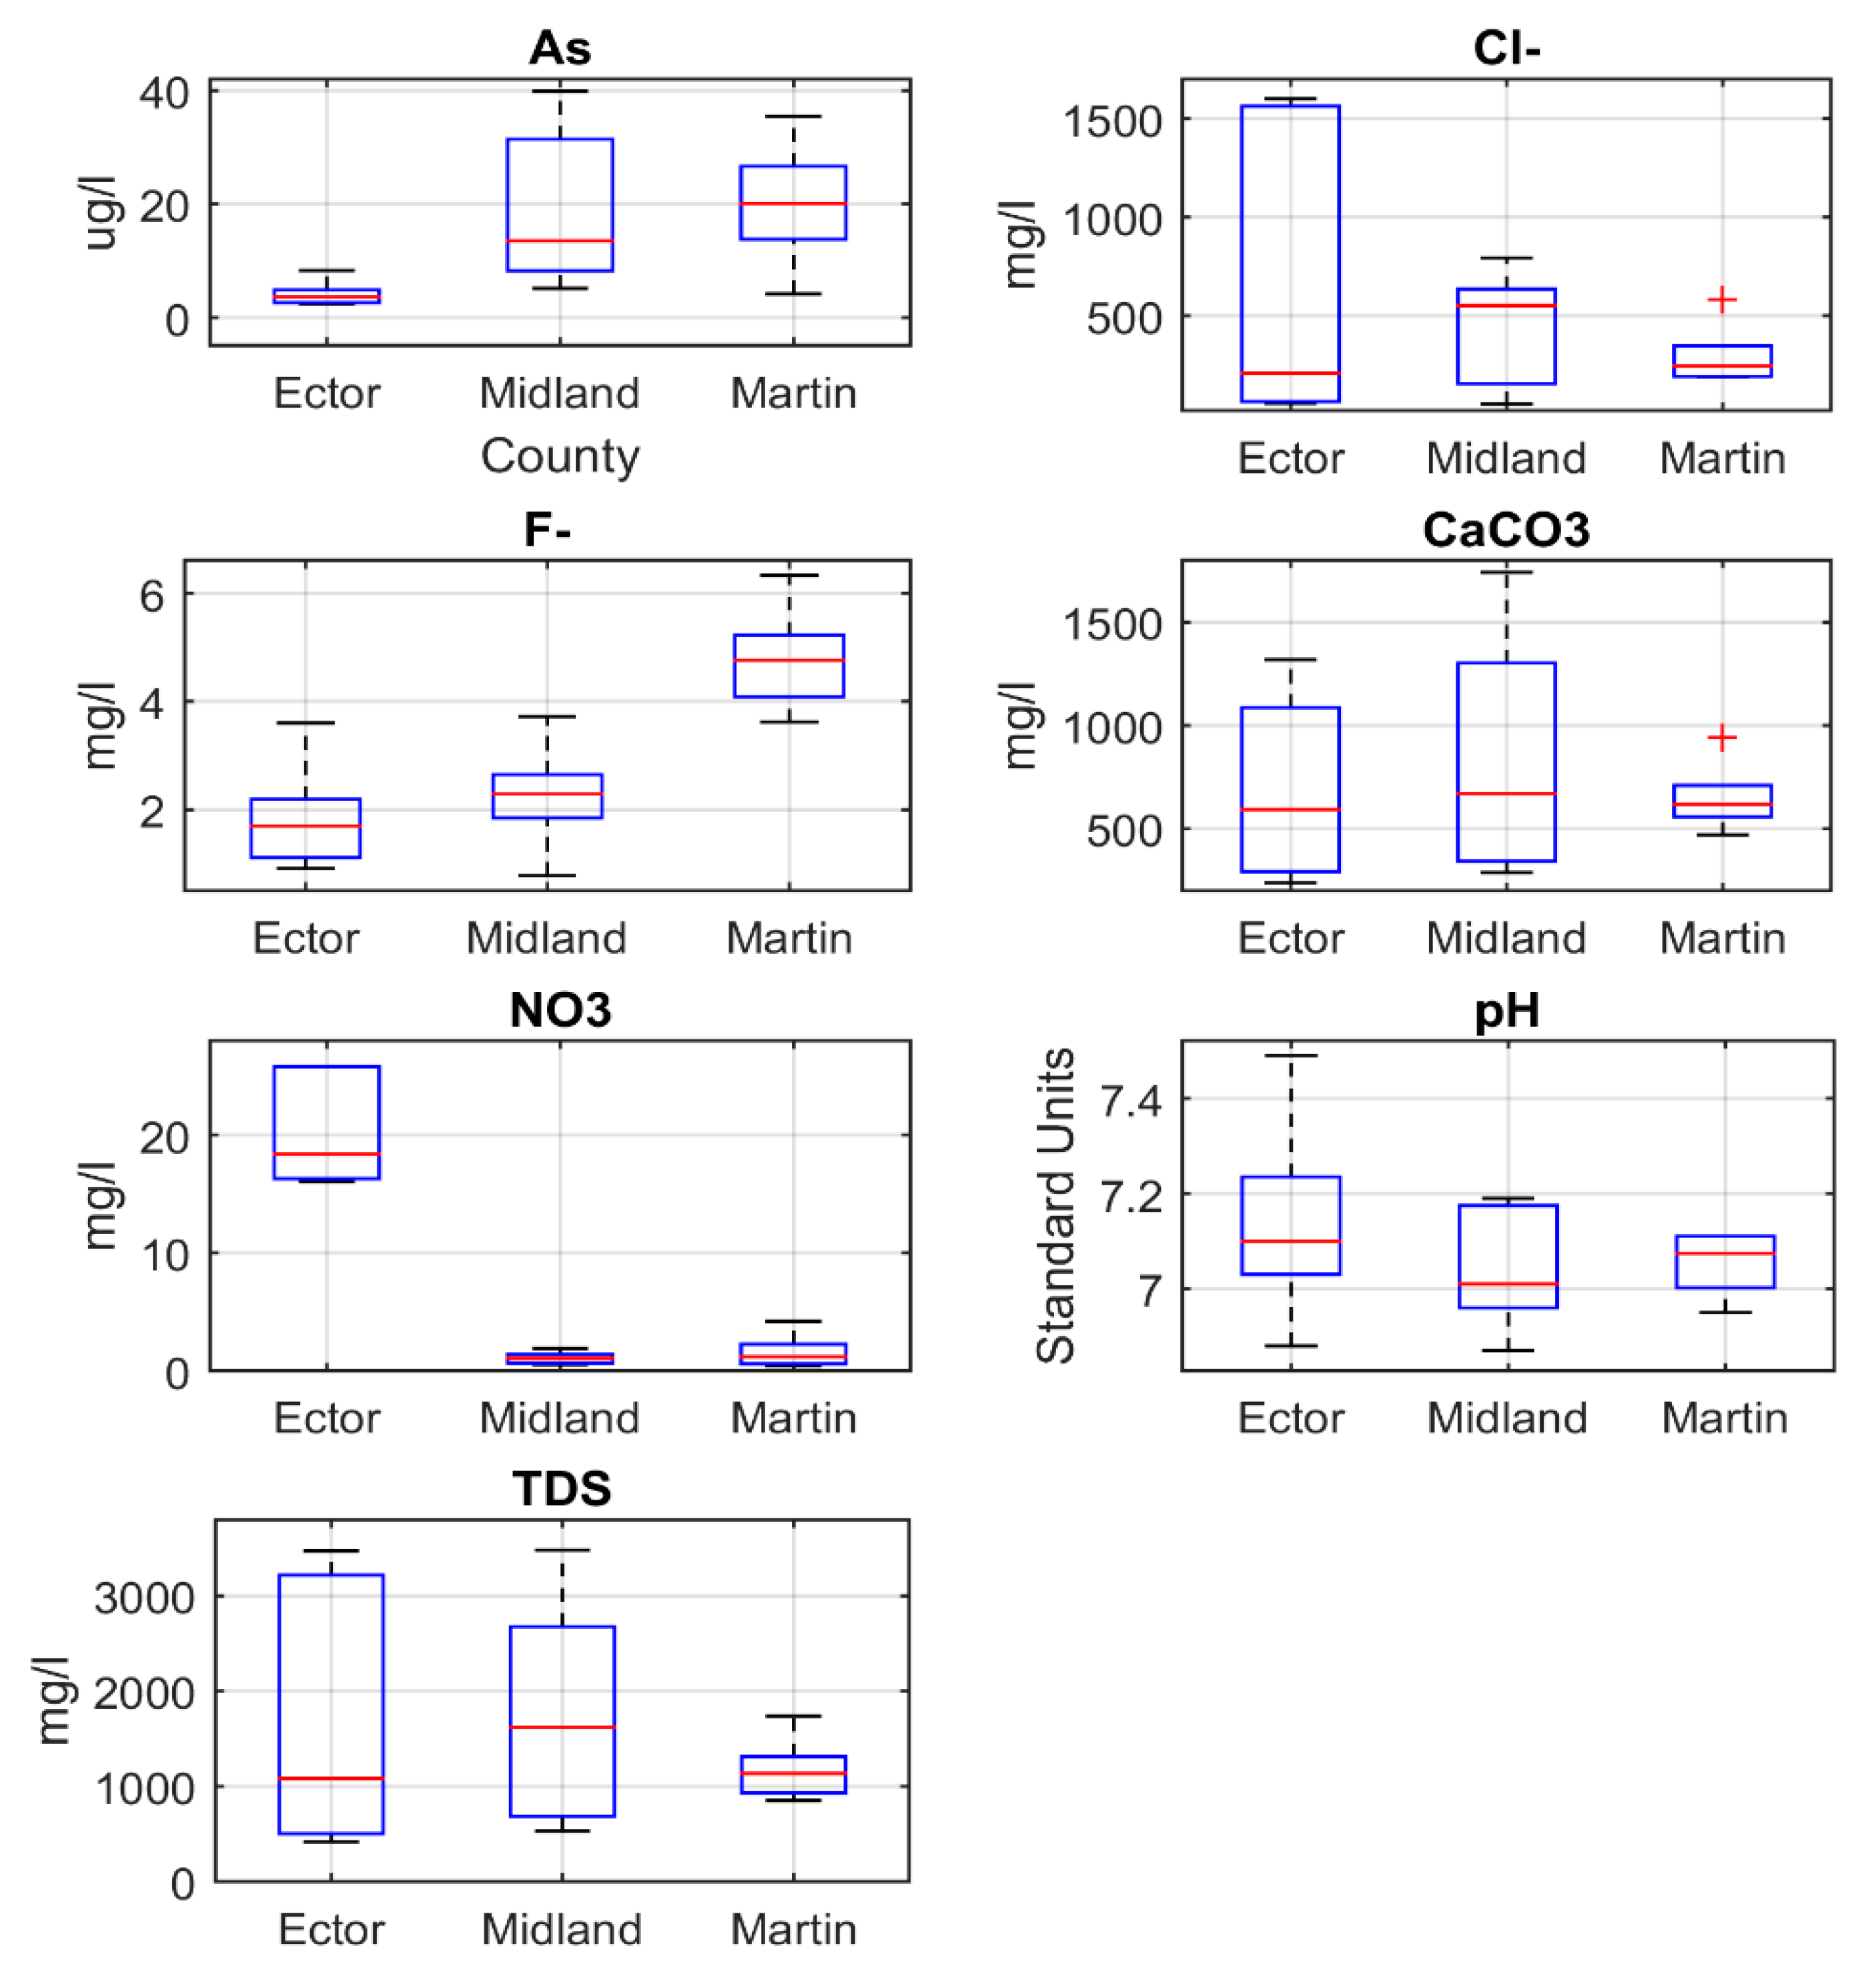
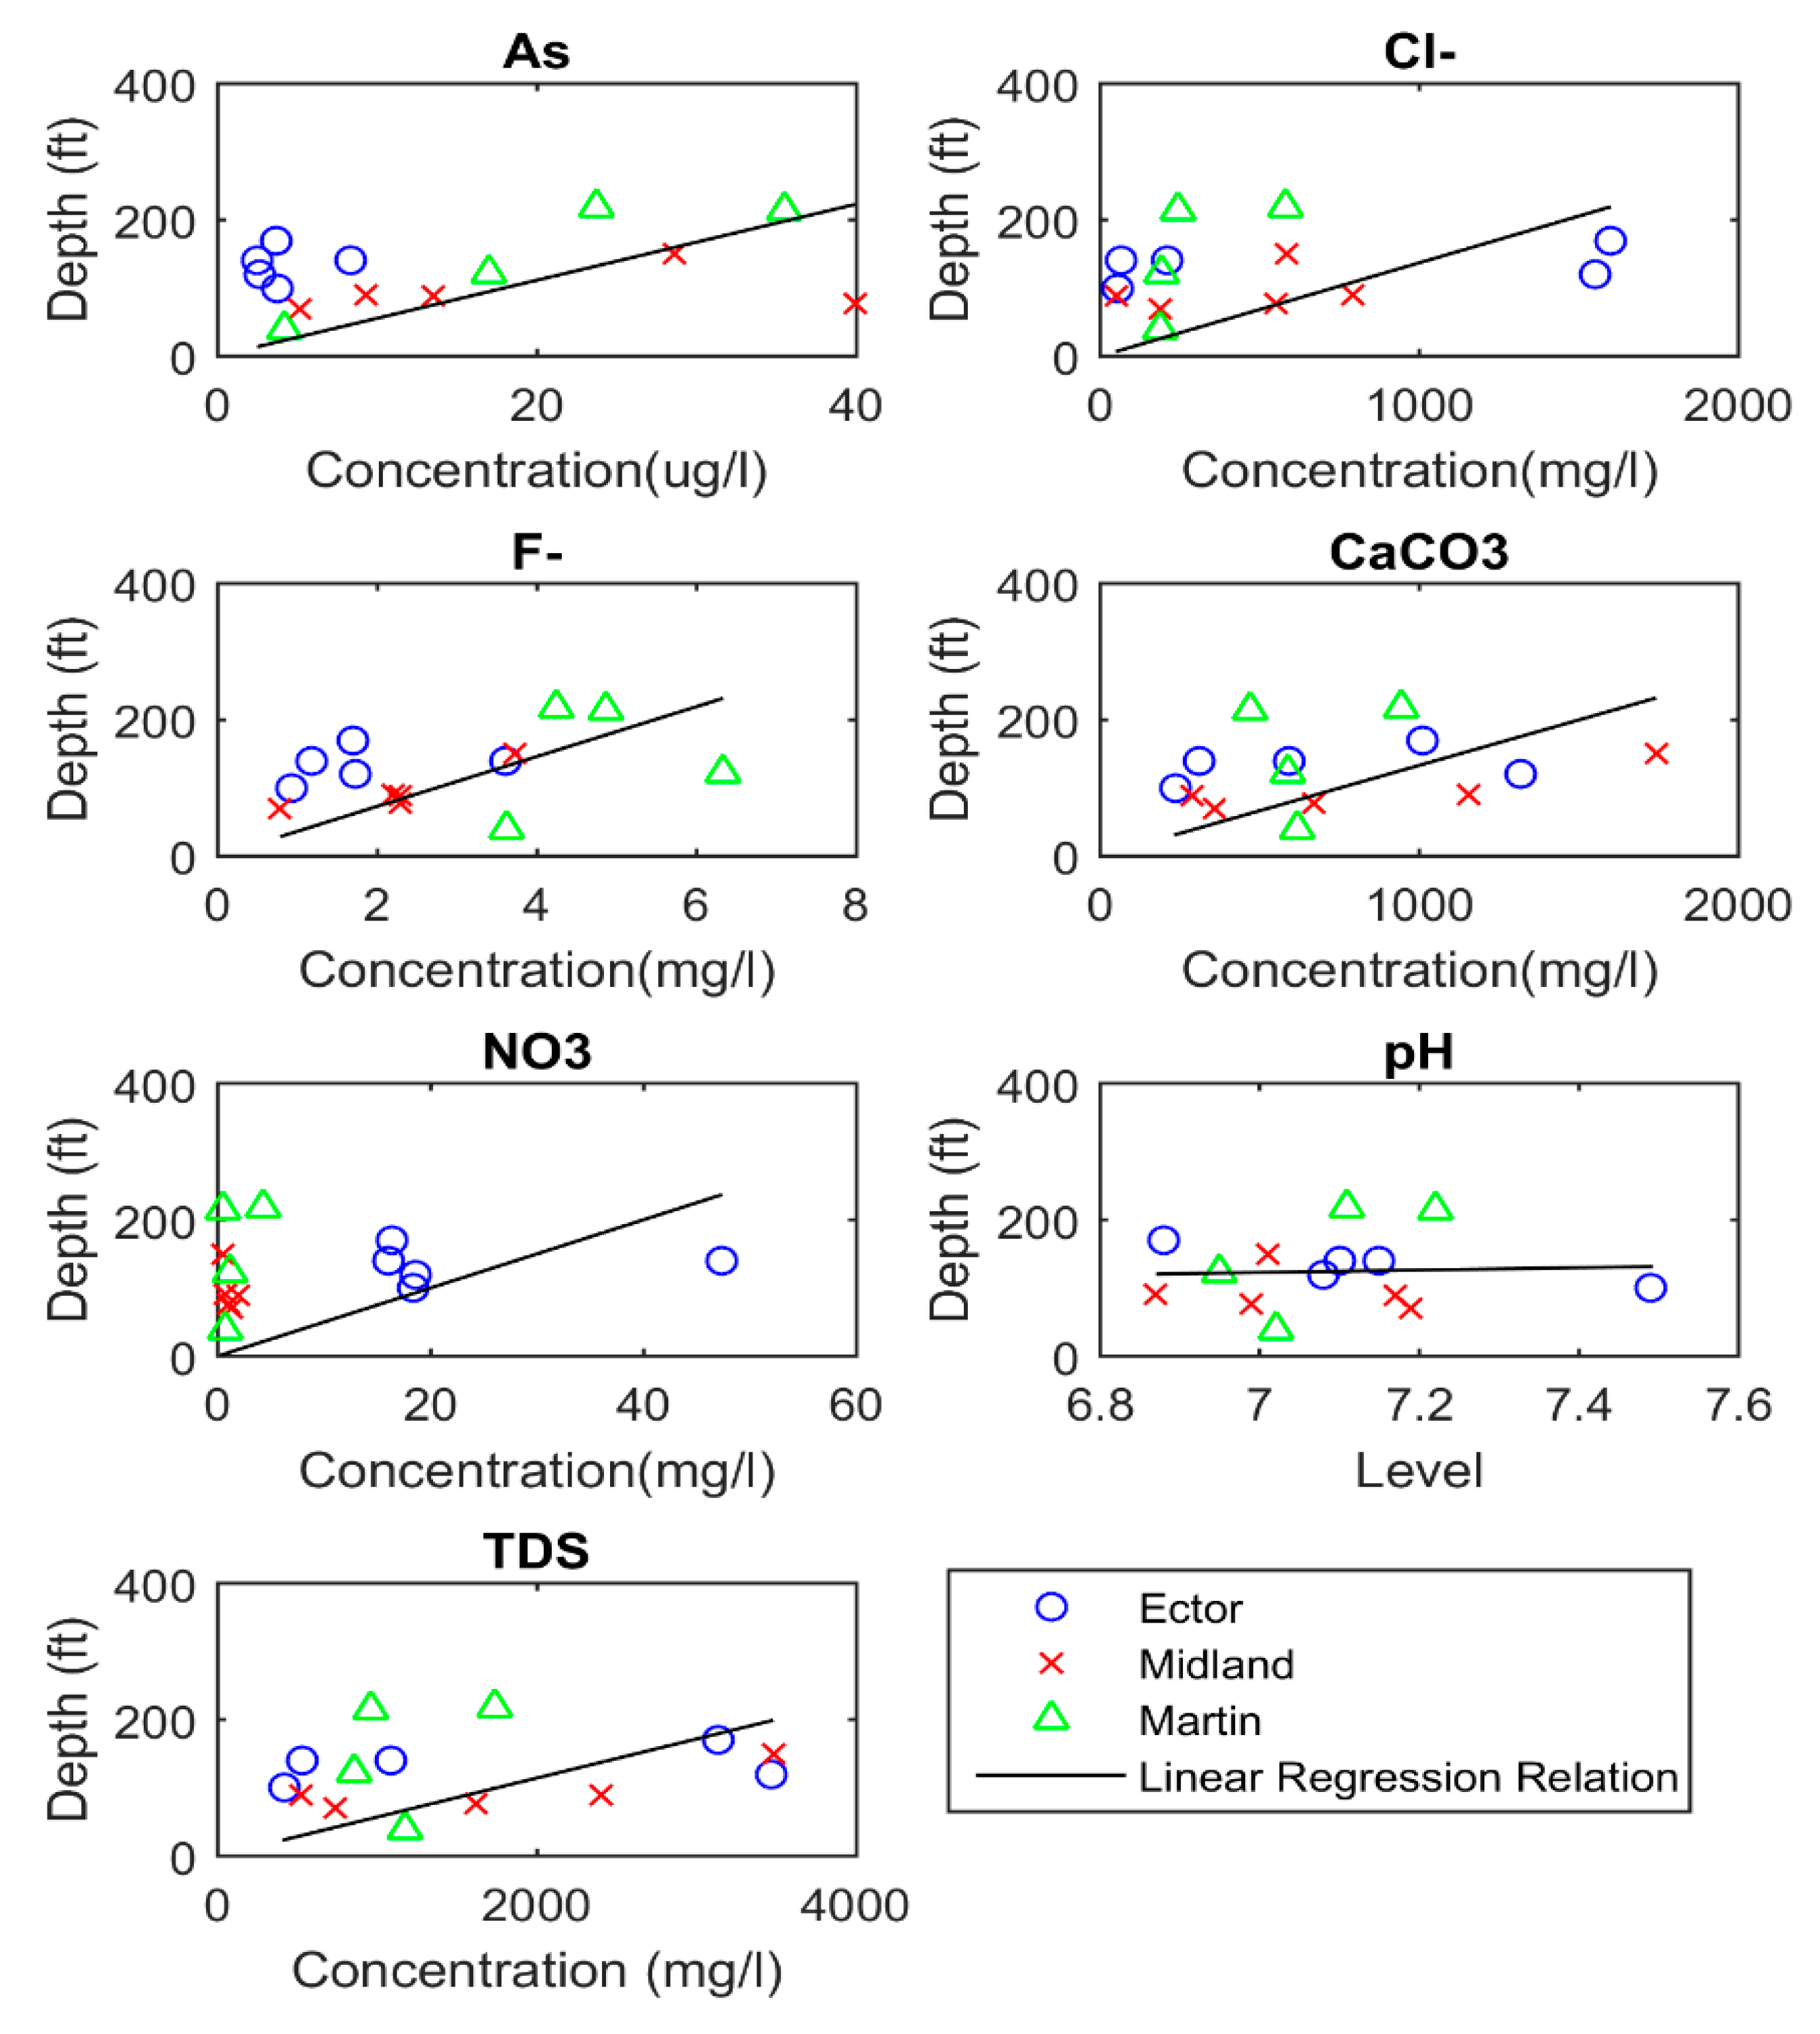
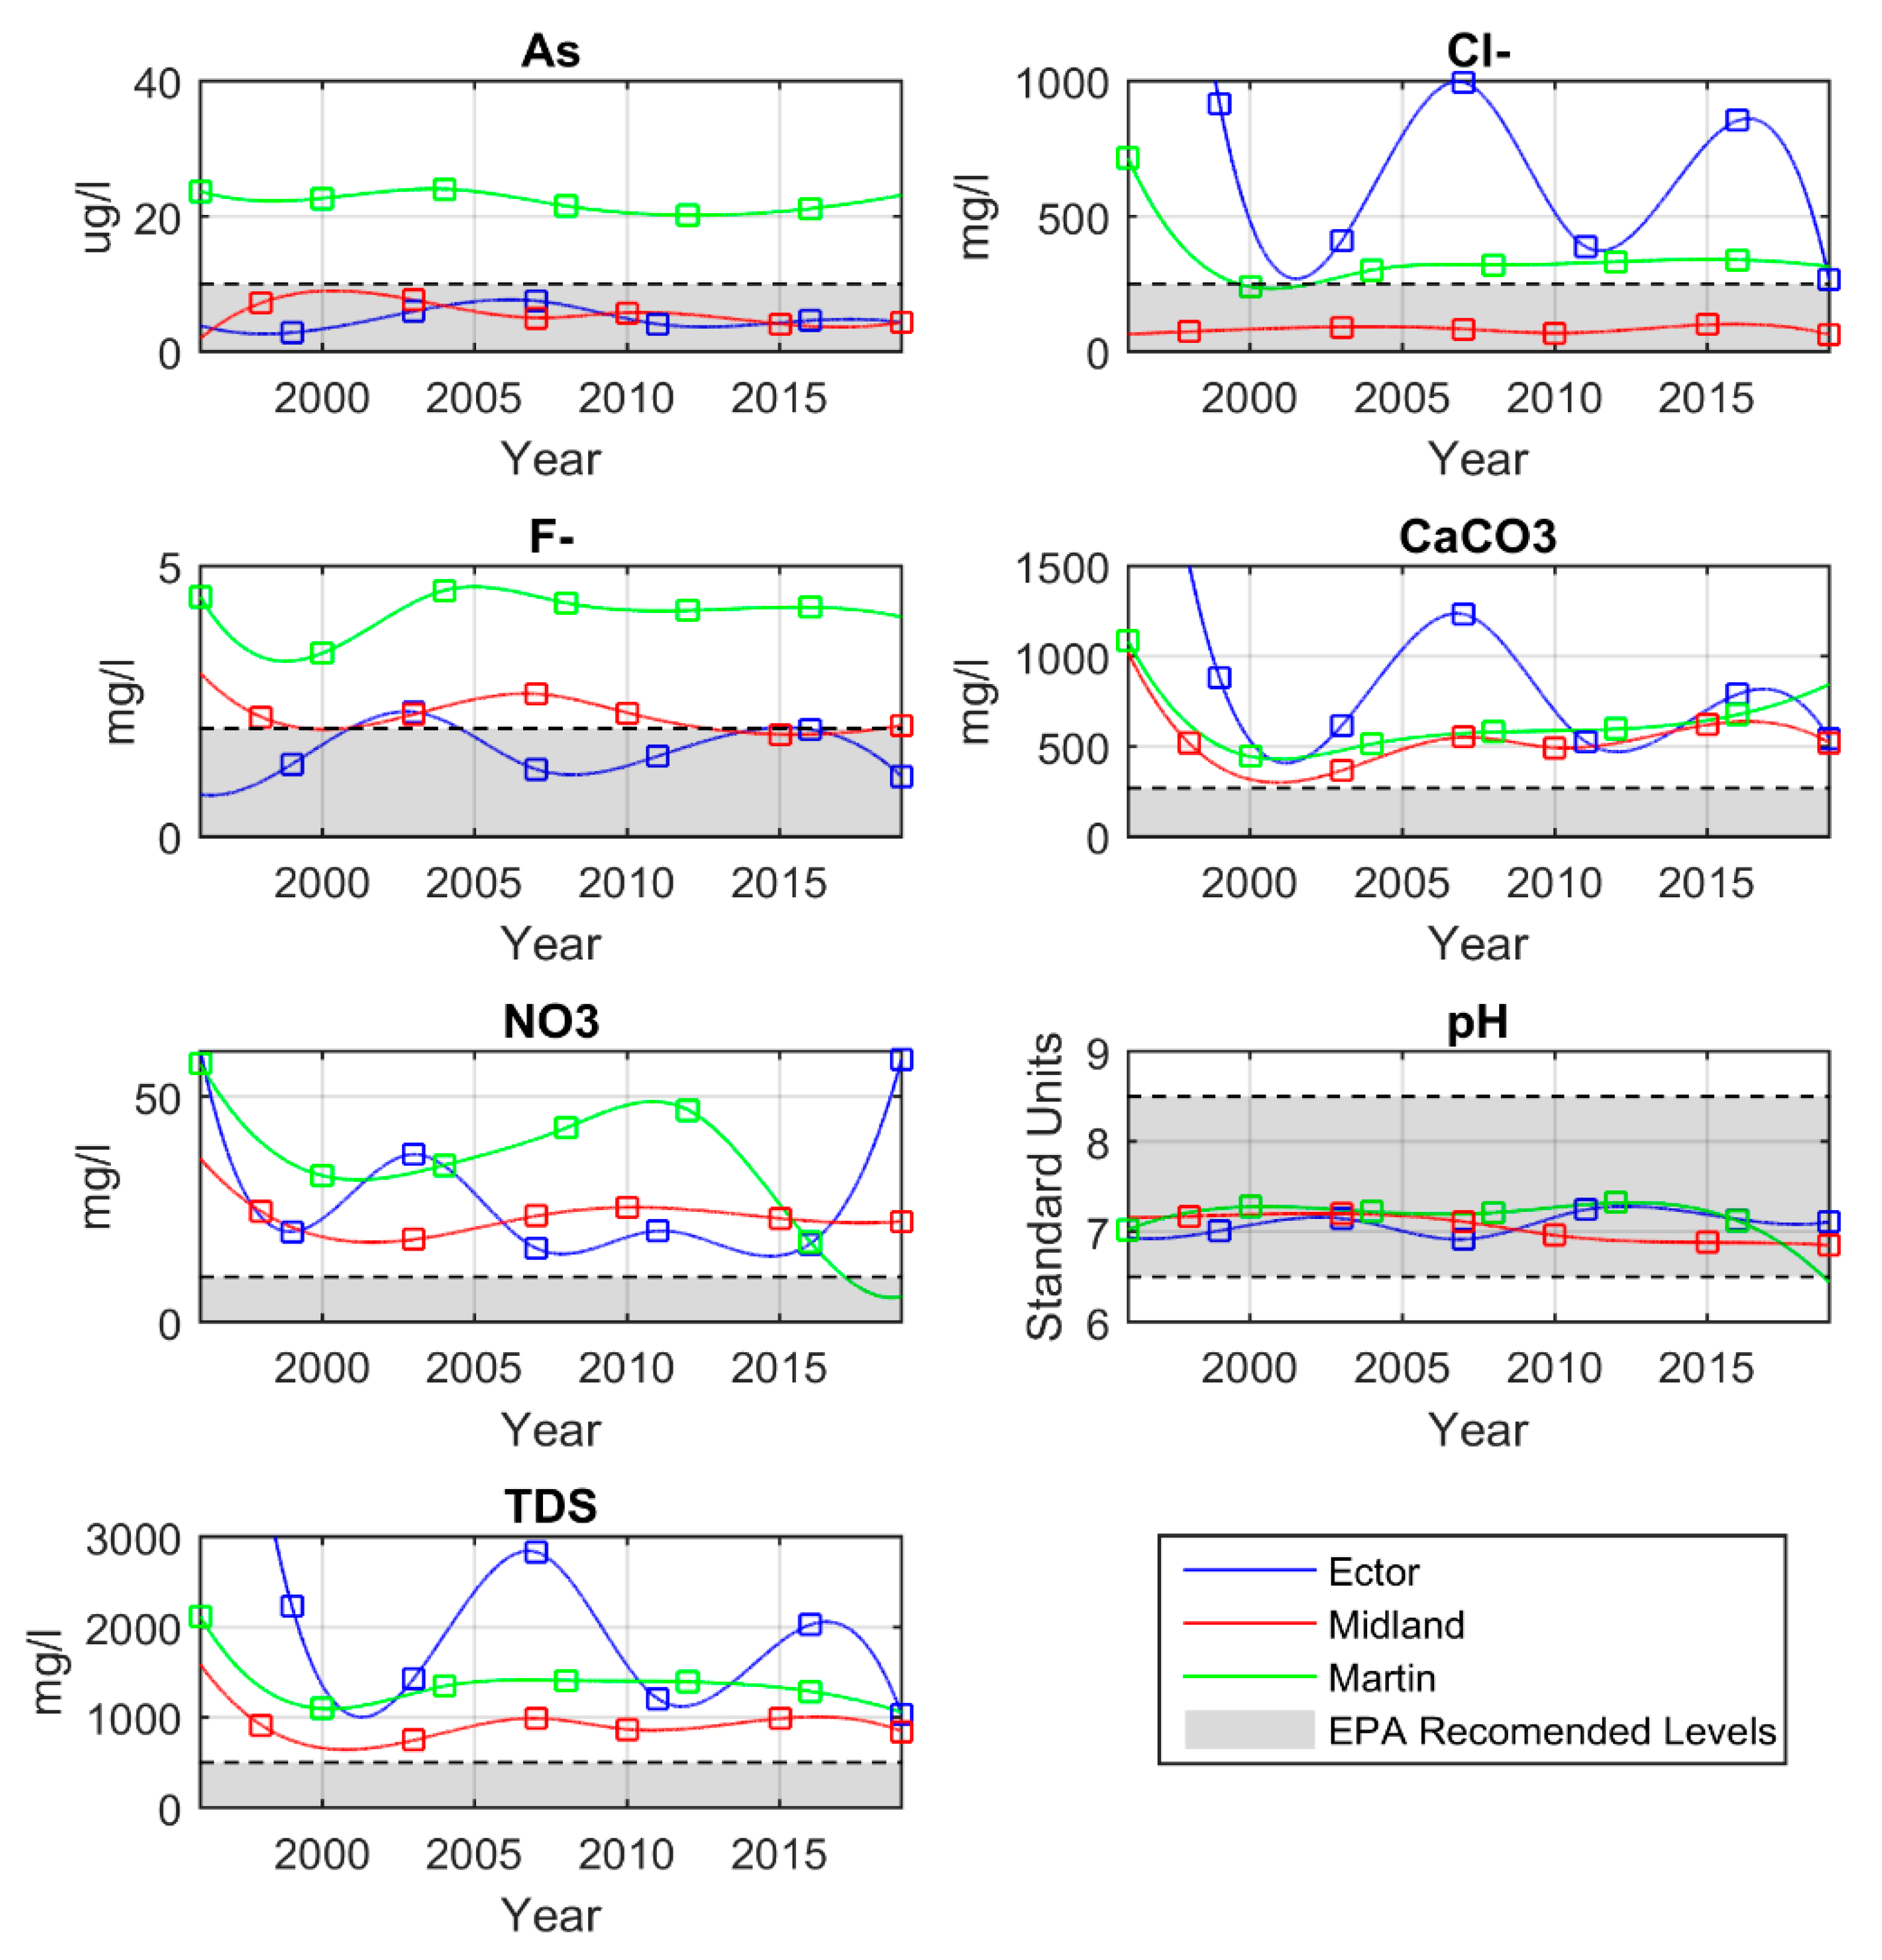
4.2. Groundwater Quality
5. Conclusions
Author Contributions
Funding
Conflicts of Interest
References
- Fabryka-Martin, J. Hydrology: The Study of Water and Water Problems: A Challenge for Today and Tomorrow; Universities Council on Water Resources: Carbondale, IL, USA, 1983. [Google Scholar]
- UTSA Economic Impact of Oil and Gas Activities in the West Texas Energy Consortium Study Region; University of Texas San Antonio: San Antonio, TX, USA, 2012.
- U.S. Department of Energy. Permian Basin Wolfcamp Shale Play; U.S. Department of Energy: Washington, DC, USA, 2018.
- Clifford, K. Land Rush in Permian Basin, where Oil Is Stacked like a Layer Cake. 2017. Available online: https://www.nytimes.com/2017/01/17/business/energy-environment/exxon-mobil-permian-basin-oil.html (accessed on 24 May 2019).
- Merrill, T.W.; Schizer, D.M. The Shale Oil and Gas Revolution, Hydraulic Fracturing, and Water Contamination: A Regulatory Strategy. Minn. Law Rev. 2013, 98, 145. [Google Scholar] [CrossRef][Green Version]
- William, N.; Jasinski, R.; Nelson, E. Hydraulic Fracturing Process and Compositions. U.S. Patent 5,551,516, 3 September 1995. [Google Scholar]
- Montcoudiol, N.; Isherwood, C.; Gunning, A.; Kelly, T.; Younger, P.L. Shale gas impacts on groundwater resources: Understanding the behavior of a shallow aquifer around a fracking site in Poland. Proc. Energy Procedia 2017, 125, 106–115. [Google Scholar] [CrossRef]
- Mehany, M.S.H.M.; Kumar, S. Analyzing the feasibility of fracking in the U.S. using macro level life cycle cost analysis and assessment approaches-A foundational study. Sustain. Prod. Consum. 2019, 20, 375–388. [Google Scholar] [CrossRef]
- Long, S.C. Direct and indirect challenges for water quality from the hydraulic fracturing industry. J. Am. Water Works Assoc. 2014, 106, 53–57. [Google Scholar] [CrossRef]
- EPA Hydraulic Fracturing for Oil and Gas: Impacts from the Hydraulic Fracturing Water Cycle on Drinking Water Resources in the United States; US EPA: Washington, DC, USA, 2016.
- Marcus, D.L.; Bonds, C. Results of the reactant sand-fracking pilot test and implications for the in situ remediation of chlorinated VOCs and metals in deep and fractured bedrock aquifers. J. Hazard. Mater. 1999, 68, 125–153. [Google Scholar] [CrossRef]
- Hildenbrand, Z.L.; Carlton, D.D.; Fontenot, B.E.; Meik, J.M.; Walton, J.L.; Thacker, J.B.; Korlie, S.; Shelor, C.P.; Kadjo, A.F.; Clark, A.; et al. Temporal variation in groundwater quality in the Permian Basin of Texas, a region of increasing unconventional oil and gas development. Sci. Total Environ. 2016, 562, 906–913. [Google Scholar] [CrossRef]
- Backstrom, J. Groundwater regulation and hyarulic fracturing: Reporting water in the Permain. STRATA Working Paper. 2018, pp. 1–34. Available online: https://www.strata.org/pdf/2018/groundwater-regulations.pdf (accessed on 11 October 2019).
- UNSD. United Nations Conference on Environment and Development; UNSD: New Yokr, NY, USA, 1992. [Google Scholar]
- USDA. Soil Survey of Midland County, Texas; UNSD: New Yokr, NY, USA, 1973. [Google Scholar]
- Ashworth, J.; Christian, P. Evaluation of Ground-Water Resources In Parts of Midland, Reagan, and Upton Counties, Texas; Texas Water Development Board: Austin, TX, USA, 1989.
- Simmers, I.; Hendrickx, J.M.H.; Kruseman, G.P.; Rushton, K.R. Recharge of Phreatic Aquifers in (Semi-) Arid Areas; Balkema, A.A., Ed.; IAH Publication: Hannover, Germany, 1997; ISBN 9789054106944. [Google Scholar]
- George, P.; Mace, R.; Petrossian, R. Aquifers of Texas; Texas Water Development Board: Austin, TX, USA, 2011.
- U.S. Census Bureau. Population Estimates; U.S. Census Bureau: Suitland, MD, USA, 2008.
- U.S. Census Bureau. Population Estimates; U.S. Census Bureau: Suitland, MD, USA, 2016.
- FracFocus. Hydraulic Fracturing Data 2016. Available online: http://fracfocus.org/ (accessed on 15 October 2019).
- Elliott, E.G.; Ettinger, A.S.; Leaderer, B.P.; Bracken, M.B.; Deziel, N.C. A systematic evaluation of chemicals in hydraulic-fracturing fluids and wastewater for reproductive and developmental toxicity. J. Expo. Sci. Environ. Epidemiol. 2017, 27, 90–99. [Google Scholar] [CrossRef]
- Frac Focus. Chemical Disclosure Registry. Available online: http://fracfocus.org/ (accessed on 28 November 2019).
- TWDB. Groundwater Data; Texas Water Development Board: Austin, TX, USA, 2016.
- Cumming, G. Understanding The New Statistics: Effect Sizes, Confidence Intervals, and Meta-Analysis; Multivariate Applications Series; Routledge: Abingdon-on-Thames, UK, 2011; ISBN 041587968X. [Google Scholar]
- Rozell, D.J.; Reaven, S.J. Water Pollution Risk Associated with Natural Gas Extraction from the Marcellus Shale. Risk Anal. 2012, 32, 1382–1393. [Google Scholar] [CrossRef]
- Michalski, R.; Ficek, A. Environmental pollution by chemical substances used in the shale gas extraction—A review. Desalin. Water Treat. 2016, 57, 1336–1343. [Google Scholar] [CrossRef]
- Vengosh, A.; Jackson, R.B.; Warner, N.; Darrah, T.H.; Kondash, A. A critical review of the risks to water resources from unconventional shale gas development and hydraulic fracturing in the United States. Environ. Sci. Technol. 2014, 48, 8334–8348. [Google Scholar] [CrossRef]
- US EPA. National Primary Drinking Water Regulations; United States Environmental Protection Agency: Washington, DC, USA, 2017.
- UALR. One-Way Analysis of Variance (ANOVA) Example Problem; UALR: Little Rock, AR, USA, 2014. [Google Scholar]
- Vasudev, R. How are Logistic Regression and Ordinary Least Squares Regression (Linear Regression) Related? Why the “Regression” in Logistic? Available online: https://towardsdatascience.com/how-are-logistic-regression-ordinary-least-squares-regression-related-1deab32d79f5 (accessed on 28 November 2019).
- Rodriguez, J.; Heo, J.; Park, J.; Lee, S.S.; Miranda, K. Inorganic Pollutants in the Water of Midland and Odessa, Permian Basin, West Texas. Air Soil Water Res. 2019, 12, 1–7. [Google Scholar] [CrossRef]
- Kaya, E. Spline Interpolation Techniques. J. Tech. Sci. Technol. 2017, 47–52. [Google Scholar]
- Ahlfeld, D.P.; Pinder, G.F. Solving Stochastic Groundwater Problems using Sensitivity Theory and Hermite Interpolating Polynomials. In Developments in Water Science; Elsevier: Amsterdam, The Netherlands, 1988; pp. 179–184. [Google Scholar]
- Thompson, M.; Desjardins, P.; Pickering, J.; Driskill, B. An integrated view of the petrology, sedimentology, and sequence stratigraphy of the Wolfcamp Formation Delaware basin Texas. In Proceedings of the SPE/AAPG/SEG Unconventional Resources Technology Conference 2018, Houston, TX, USA, 23–25 July 2018. [Google Scholar]
- Detrow, S. Hydrochloric Acid’s Role In The Fracking Process. 6 July 2012. Available online: https://stateimpact.npr.org/pennsylvania/2012/07/06/hydrochloric-acids-role-in-the-fracking-process/ (accessed on 15 October 2019).
- US EPA. Hydrochloric Acid (Hydrogen Chloride); US EPA: Wahsington, DC, USA, 2000.
- Jain, N.; Garg, K.; Karmakar, N.C.; Palei, S.K. Guar Gum in Hydraulic Fracturing in Indian Shale Mines. In Proceedings of the Present technology and Safety Scenario in Mining and Allied Industries, Varanasi, India, 25–27 February 2013. [Google Scholar]
- Lagier, F.; Cartier, A.; Somer, J.; Dolovich, J.; Malo, J.L. Occupational asthma caused by guar gum. J. Allergy Clin. Immunol. 1990, 85, 785–790. [Google Scholar] [CrossRef]
- Denger, D.L. Hydraulic fracturing fluid considerations in Marcellus Shale completions. In Proceedings of the EPA Hydraulic Fracturing Tech Workshop, Washington, DC, USA, 24–25 February 2011; Available online: https://www.epa.gov/hfstudy/hydraulic-fracturing-fluid-considerations-marcellus-shale-completions-feb-24-25-2011 (accessed on 11 October 2019).
- Horwitt, D. Drilling around the law. Environmental Working Group. 2010. Available online: https://www.ewg.org/sites/default/files/report/EWG-2009drillingaroundthelaw.pdf (accessed on 11 October 2019).
- US EPA. Safe Drinking Water Act (SDWA); US EPA: Kansas City, KS, USA, 2017.
- WHO (World Health Organization). Arsenic in Drinking Water; WHO: Geneva, Switzerland, 2011. [Google Scholar]
- Angeles Martínez-Mier, E. Fluoride: Its Metabolism, Toxicity, and Role in Dental Health. J. Evid. -Based Complement. Altern. Med. 2012, 17, 28–32. [Google Scholar] [CrossRef]
- Rafiqul Islam, M. A Study on the TDS Level of Drinking Mineral Water in Bangladesh. Am. J. Appl. Chem. 2016, 4, 164. [Google Scholar] [CrossRef]
- Kendrick, J.S.; Williamson, D.F.; Parker, R.A.; Kendrick, J.S. The box plot: A simple visual method to interpret data. Ann Intern Med 110: 916 The Box Plot: A Simple Visual Method to Interpret Data. Acad. Clin. 1989, 10, 916–921. [Google Scholar]
- Reddi, B.A.J. Why is saline so acidic (and does it really matter?). Int. J. Med. Sci. 2013, 10, 747–750. [Google Scholar] [CrossRef]
- Total Dissolved Solid—An Overview. ScienceDirect Topics. Available online: https://www.sciencedirect.com/topics/engineering/total-dissolved-solid (accessed on 21 November 2019).
- Fontenot, B.E.; Hunt, L.R.; Hildenbrand, Z.L.; Carlton, D.D., Jr.; Oka, H.; Walton, J.L.; Hopkins, D.; Osorio, A.; Bjorndal, B.; Hu, Q.H.; et al. An Evaluation of Water Quality in Private Drinking Water Wells Near Natural Gas Extraction Sites in the Barnett Shale Formation. Environ. Sci. Technol. 2013, 47, 10032–10040. [Google Scholar] [CrossRef]
- Healy, D. Hydraulic Fracturing or “Fracking”: A Short Summary of Current Knowledge and Potential Environmental Impacts; Environmental Protection Agency: Loch Garman, Ireland, 2012.
- Peckham, S.; Awofeso, N. Water fluoridation: A critical review of the physiological effects of ingested fluoride as a public health intervention. Sci. World J. 2014, 2014, 1–10. [Google Scholar] [CrossRef]
- Mall, A. New Report on Fracking Chemicals, Including One That Is a Potential “Chemical Terrorism Agent”. NRDC. Available online: https://www.nrdc.org/experts/amy-mall/new-report-fracking-chemicals-including-one-potential-chemical-terrorism-agent (accessed on 21 November 2019).
- Oenema, O.; Boers, P.C.M.; Van Eerdt, M.M.; Fraters, B.; Van Der Meer, H.G.; Roest, C.W.J.; Schröder, J.J.; Willems, W.J. Leaching of nitrate from agriculture to groundwater: The effect of policies and measures in The Netherlands. Proc. Environ. Pollut. 1998, 102, 471–478. [Google Scholar] [CrossRef]
- NASS; USDA. Cesus of Agriculture—Ector County Texas; USDA: Washington, DC, USA, 2012.
- Groundwater Pollution—An Overview. ScienceDirect Topics. Available online: https://www.sciencedirect.com/topics/earth-and-planetary-sciences/groundwater-pollution (accessed on 21 November 2019).
- Jackson, R.B.; Vengosh, A.; Darrah, T.H.; Warner, N.R.; Down, A.; Poreda, R.J.; Karr, J.D. Increased stray gas abundance in a subset of drinking water wells near Marcellus shale gas extraction. Proc. Natl. Acad. Sci. USA 2013, 110, 11250–11255. [Google Scholar] [CrossRef] [PubMed]
- Spellman, F.R. Environmental Impacts of Hydraulic Fracturing; Taylor and Francis Group: Abingdon, UK, 2013; p. 75. [Google Scholar]
- Zhang, D.; Yang, T. Environmental impacts of hydraulic fracturing in shale gas development in the United States. Pet. Explor. Dev. 2015, 42, 876–883. [Google Scholar] [CrossRef]


| Well Number | Latitude | Longitude | Well Depth | |
|---|---|---|---|---|
| Ector County | 2759503 | 32.0598611 | −102.6697389 | 100 |
| 4503301 | 31.9594444 | −102.6400000 | 120 | |
| 4504120 | 31.9888889 | −102.6152778 | 170 | |
| 4505705 | 31.9151944 | −102.4789167 | 140 | |
| 2758902 | 32.0383340 | −102.7875000 | 140 | |
| Average depth | 134 | |||
| Midland County | 2858402 | 32.0635778 | −101.8672833 | 77 |
| 2763901 | 32.0110306 | −102.1407194 | 90 | |
| 2764804 | 32.0358340 | −102.0719440 | 150 | |
| 2857703 | 32.0341670 | −101.9980560 | 70 | |
| 4507602 | 31.9225000 | −102.1402780 | 89 | |
| 4522604 | 31.6936940 | −102.2800440 | 225 | |
| 4516208 | 31.8526690 | −102.0708250 | 131 | |
| 4515801 | 31.7829360 | −102.1674170 | 170 | |
| 4417410 | 31.6922220 | −101.9911110 | 250 | |
| 4410809 | 31.7796610 | −101.7927470 | 160 | |
| Average depth | 141 | |||
| Martin County | 2850301 | 32.2322220 | −101.7655560 | 39 |
| 2835205 | 32.4783330 | −101.6916670 | N/A | |
| 2748106 | 32.3738890 | −102.1091670 | 218 | |
| 2739901 | 32.3776389 | −102.1391944 | 214 | |
| 2842705 | 32.2888890 | −101.8552780 | 122 | |
| 2835401 | 32.4283330 | −101.7402780 | 30 | |
| Average depth | 125 |
| Water (H2O) | Quartz and Sand (SiO2) | Petroleum Distillate | Guar Gum | Hydrochloric Acid (HCl) | ||
|---|---|---|---|---|---|---|
| Ector County | %Total | 83.05% | 15.61% | 0.18% | 0.19% | 0.38% |
| X | 83.05 | 15.61 | 0.18 | 0.19 | 0.38 | |
| Midland County | %Total | 90.24% | 9.41% | 0.03% | 0.05% | 0.10% |
| X | 90.24 | 9.41 | 0.03 | 0.05 | 0.10 | |
| Martin County | %Total | 84.15% | 14.39% | 0.09% | 0.05% | 0.93% |
| X | 84.15 | 14.39 | 0.09 | 0.05 | 0.93 |
| As (ug/L) | Cl− (mg/L) | F− (mg/L) | CaCO3 (mg/L) | NO3 (mg/L) | pH | TDS (mg/L) | |
|---|---|---|---|---|---|---|---|
| Ector | 4.16 | 696.32 | 1.82 | 693.89 | 23.35 | 7.14 | 1726.90 |
| Midland | 20.76 | 529 | 2.25 | 981.96 | 0.89 | 7.02 | 2059.42 |
| Martin | 20.10 | 302.50 | 4.76 | 654.10 | 1.63 | 7.08 | 1178.99 |
| F0 | cdf (F0) | |
|---|---|---|
| As | 3.5 | 93.65% |
| Cl− | 0.81 | 53.22% |
| F− | 11.81 | 99.85% |
| CaCO3 | 0.25 | 21.74% |
| NO3 | 13.13 | 99.9% |
| pH | 0.58 | 42.36% |
| TDS | 0.44 | 34.30% |
| As (ug/L) | Cl− (mg/L) | F− (mg/L) | CaCO3 (mg/L) | NO3 (mg/L) | pH | TDS (mg/L) | ||
|---|---|---|---|---|---|---|---|---|
| Ector | 1999 | 2.80 | 917 | 1.34 | 881 | 20.01 | 7.01 | 2237 |
| 2003 | 5.95 | 408.67 | 2.30 | 614.67 | 37.16 | 7.15 | 1431.33 | |
| 2007 | 7.50 | 995.50 | 1.25 | 1233.50 | 16.38 | 6.915 | 2834 | |
| 2011 | 4.07 | 387.83 | 1.49 | 528 | 20.17 | 7.24 | 1208 | |
| 2016 | 4.59 | 853.50 | 1.98 | 789.77 | 17.34 | 7.14 | 2026.09 | |
| 2019 | 4.27 | 266.10 | 1.11 | 544.73 | 58.23 | 7.11 | 1032.07 | |
| Midland | 1998 | 7.21 | 73.86 | 2.21 | 518 | 24.45 | 7.17 | 915 |
| 2003 | 7.63 | 91.20 | 2.26 | 366.67 | 18.27 | 7.20 | 747 | |
| 2007 | 5.00 | 83.40 | 2.64 | 551.40 | 23.46 | 7.11 | 990.20 | |
| 2010 | 5.76 | 68.18 | 2.29 | 493.40 | 25.40 | 6.96 | 868.60 | |
| 2015 | 4.10 | 99.46 | 1.89 | 620 | 22.96 | 6.88 | 986.40 | |
| 2019 | 4.35 | 63.10 | 2.06 | 521.61 | 22.29 | 6.85 | 846.74 | |
| Martin | 1996 | 23.70 | 713.95 | 4.435 | 1083.50 | 57.21 | 7.02 | 2117.50 |
| 2000 | 22.66 | 239.70 | 3.39 | 445.33 | 32.43 | 7.28 | 1096.33 | |
| 2004 | 24.02 | 301.20 | 4.55 | 514 | 34.73 | 7.22 | 1345.40 | |
| 2008 | 21.53 | 320.48 | 4.32 | 580 | 43.01 | 7.21 | 1408.75 | |
| 2012 | 20.15 | 332.05 | 4.18 | 596.75 | 46.96 | 7.32 | 1394.25 | |
| 2016 | 21.13 | 339 | 4.24 | 676.72 | 17.77 | 7.12 | 1288.39 |
© 2020 by the authors. Licensee MDPI, Basel, Switzerland. This article is an open access article distributed under the terms and conditions of the Creative Commons Attribution (CC BY) license (http://creativecommons.org/licenses/by/4.0/).
Share and Cite
Rodriguez, J.; Heo, J.; Kim, K.H. The Impact of Hydraulic Fracturing on Groundwater Quality in the Permian Basin, West Texas, USA. Water 2020, 12, 796. https://doi.org/10.3390/w12030796
Rodriguez J, Heo J, Kim KH. The Impact of Hydraulic Fracturing on Groundwater Quality in the Permian Basin, West Texas, USA. Water. 2020; 12(3):796. https://doi.org/10.3390/w12030796
Chicago/Turabian StyleRodriguez, Jose, Joonghyeok Heo, and Kee Han Kim. 2020. "The Impact of Hydraulic Fracturing on Groundwater Quality in the Permian Basin, West Texas, USA" Water 12, no. 3: 796. https://doi.org/10.3390/w12030796
APA StyleRodriguez, J., Heo, J., & Kim, K. H. (2020). The Impact of Hydraulic Fracturing on Groundwater Quality in the Permian Basin, West Texas, USA. Water, 12(3), 796. https://doi.org/10.3390/w12030796