Combined Use of Graphical and Statistical Approaches for Analyzing Historical Precipitation Changes in the Black Sea Region of Turkey


Abstract
1. Introduction
2. Materials and Methods
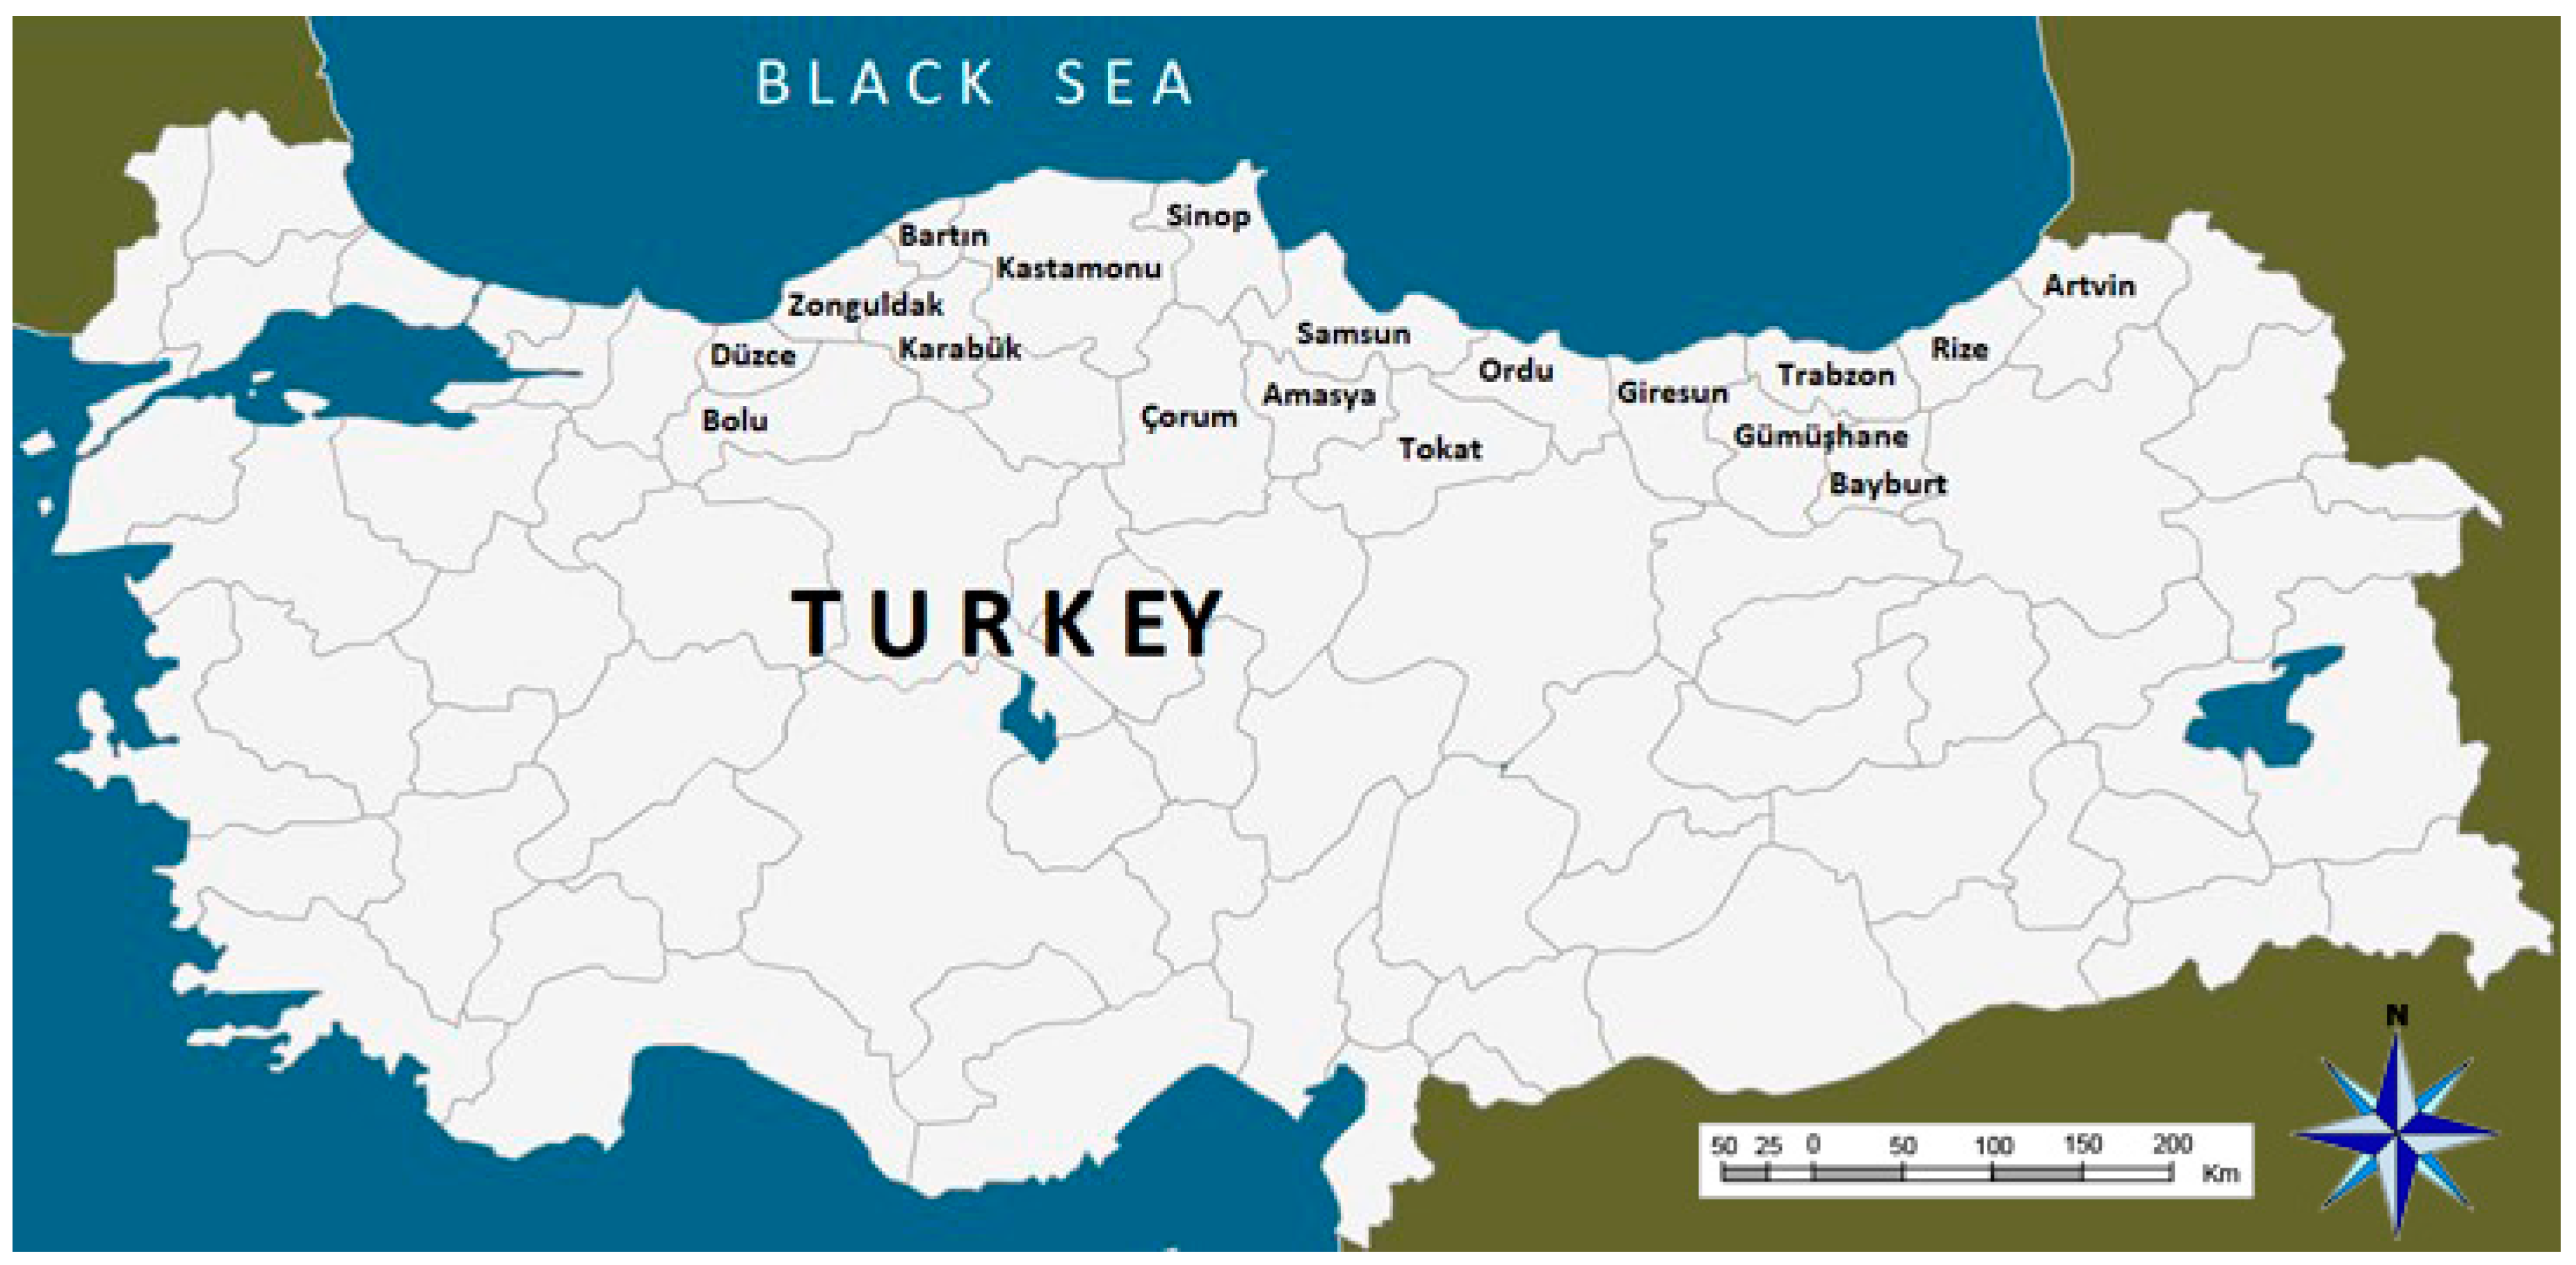
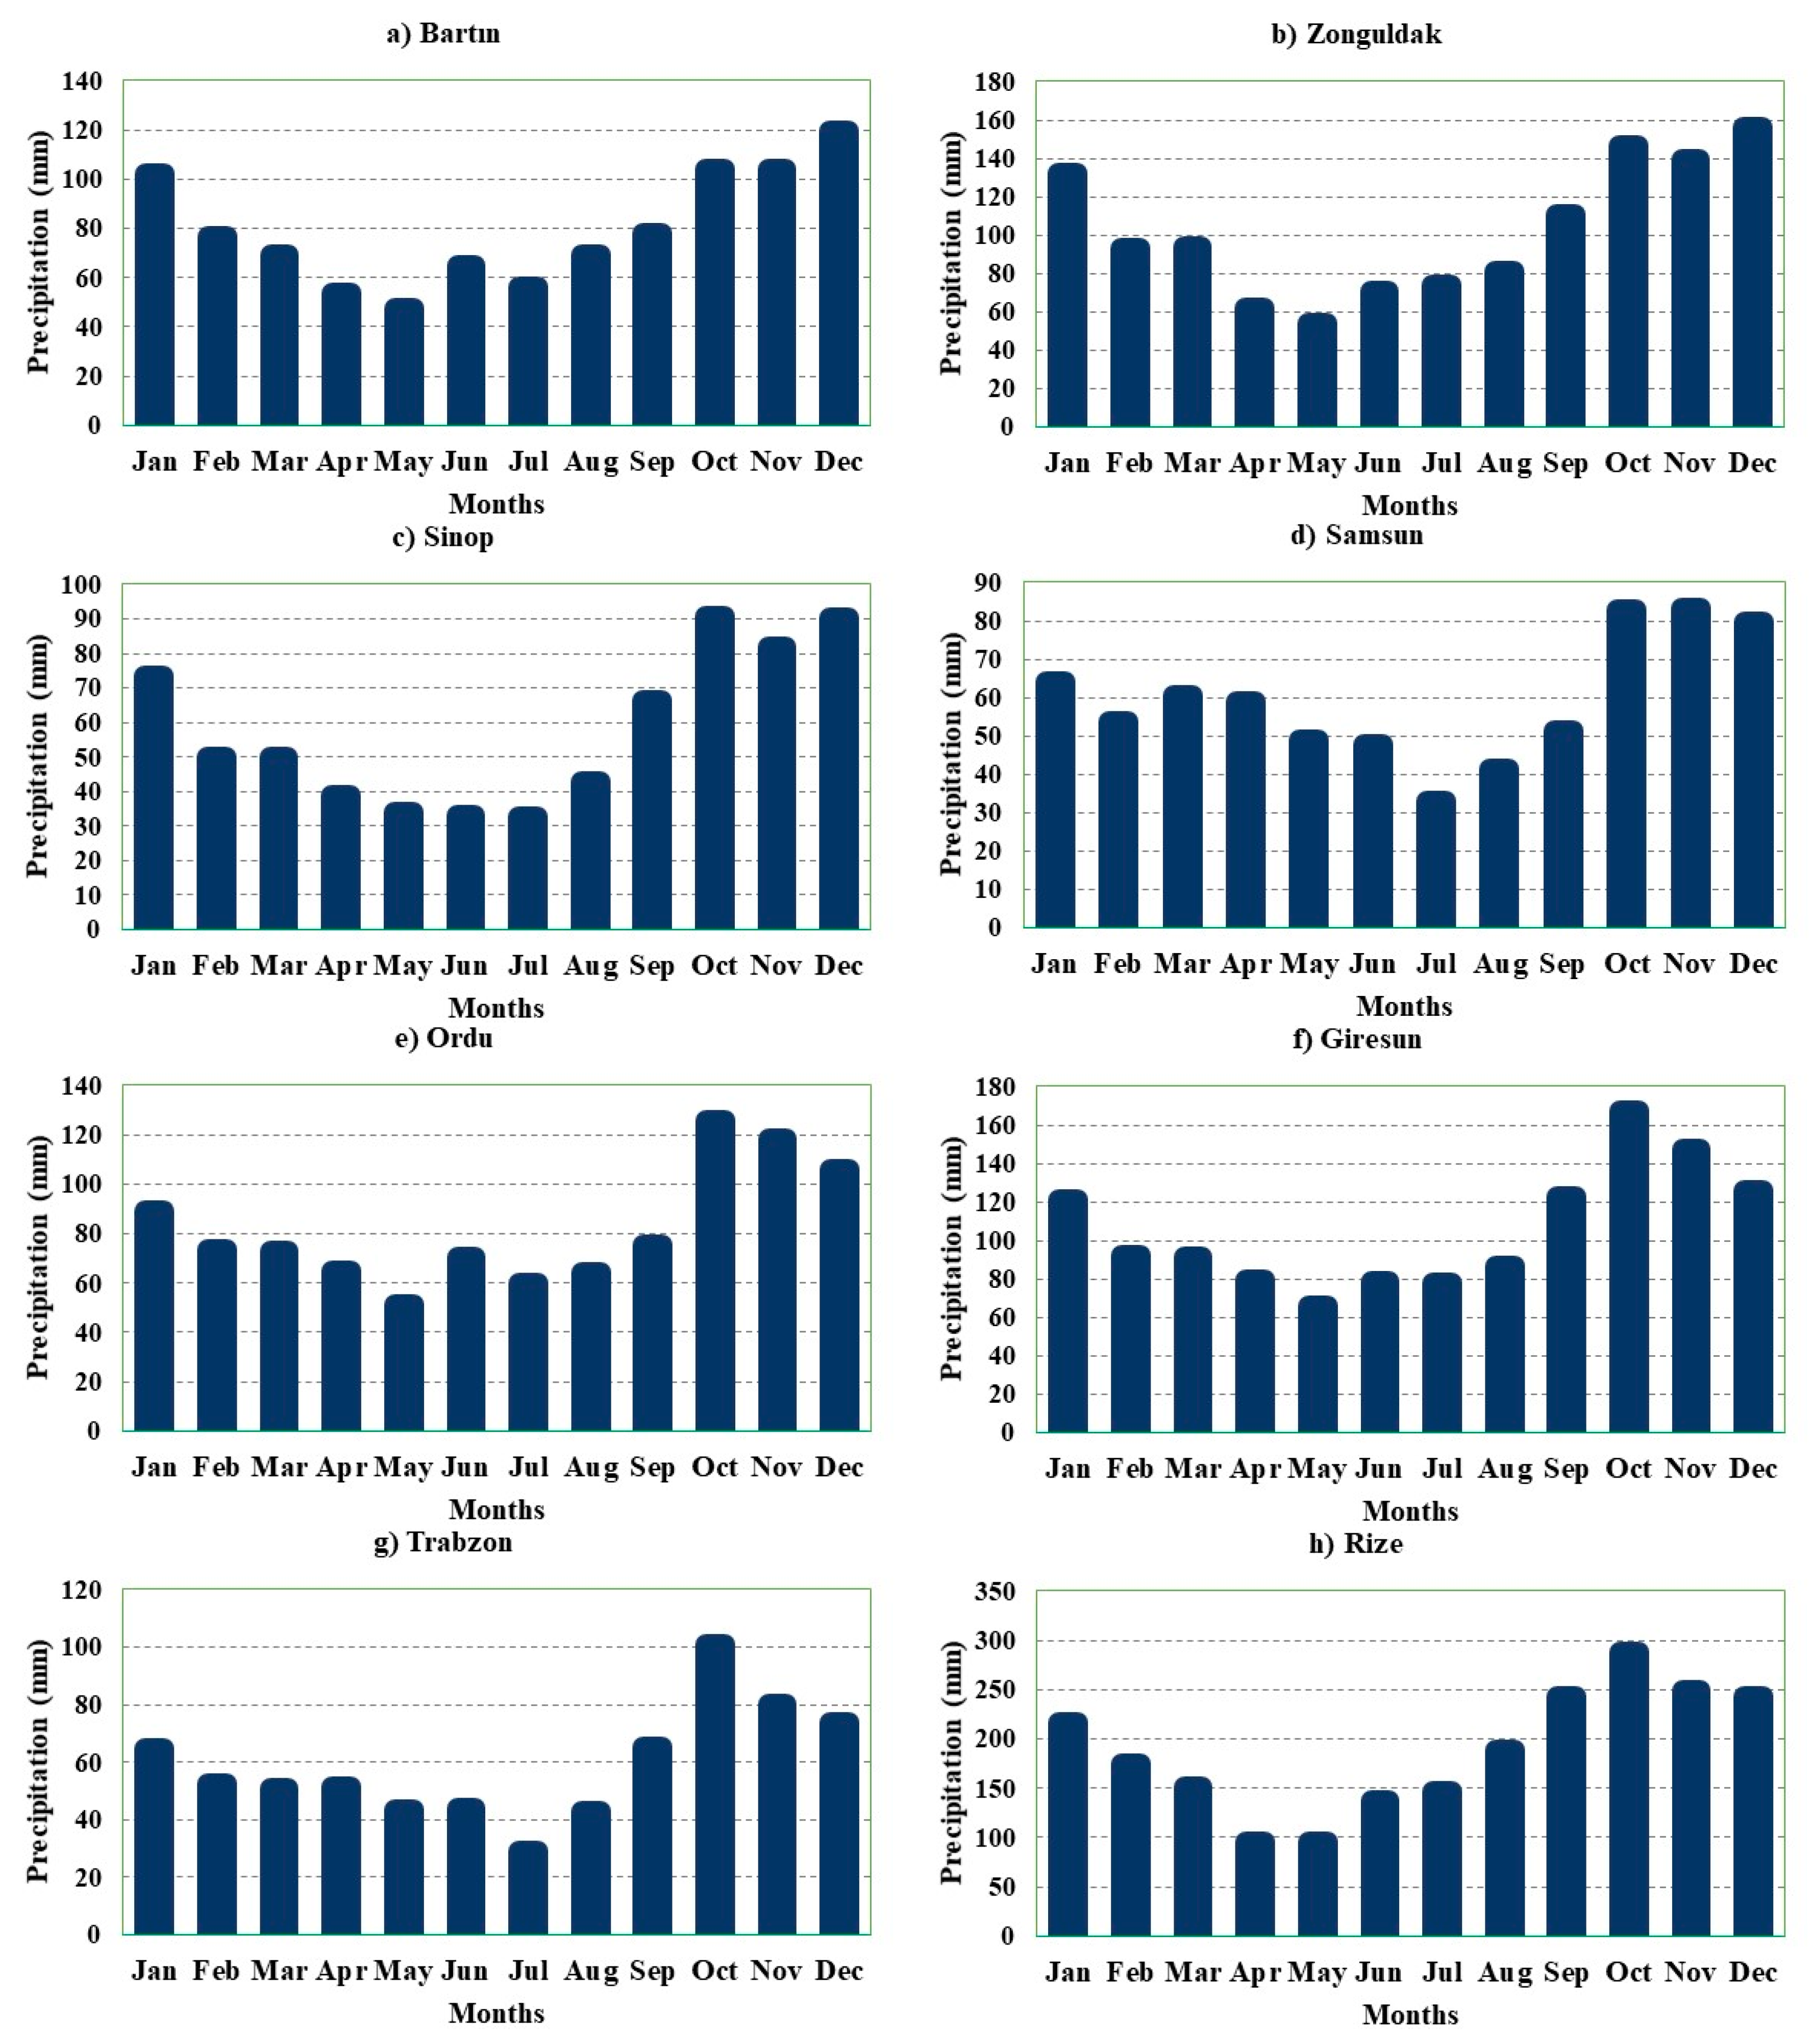
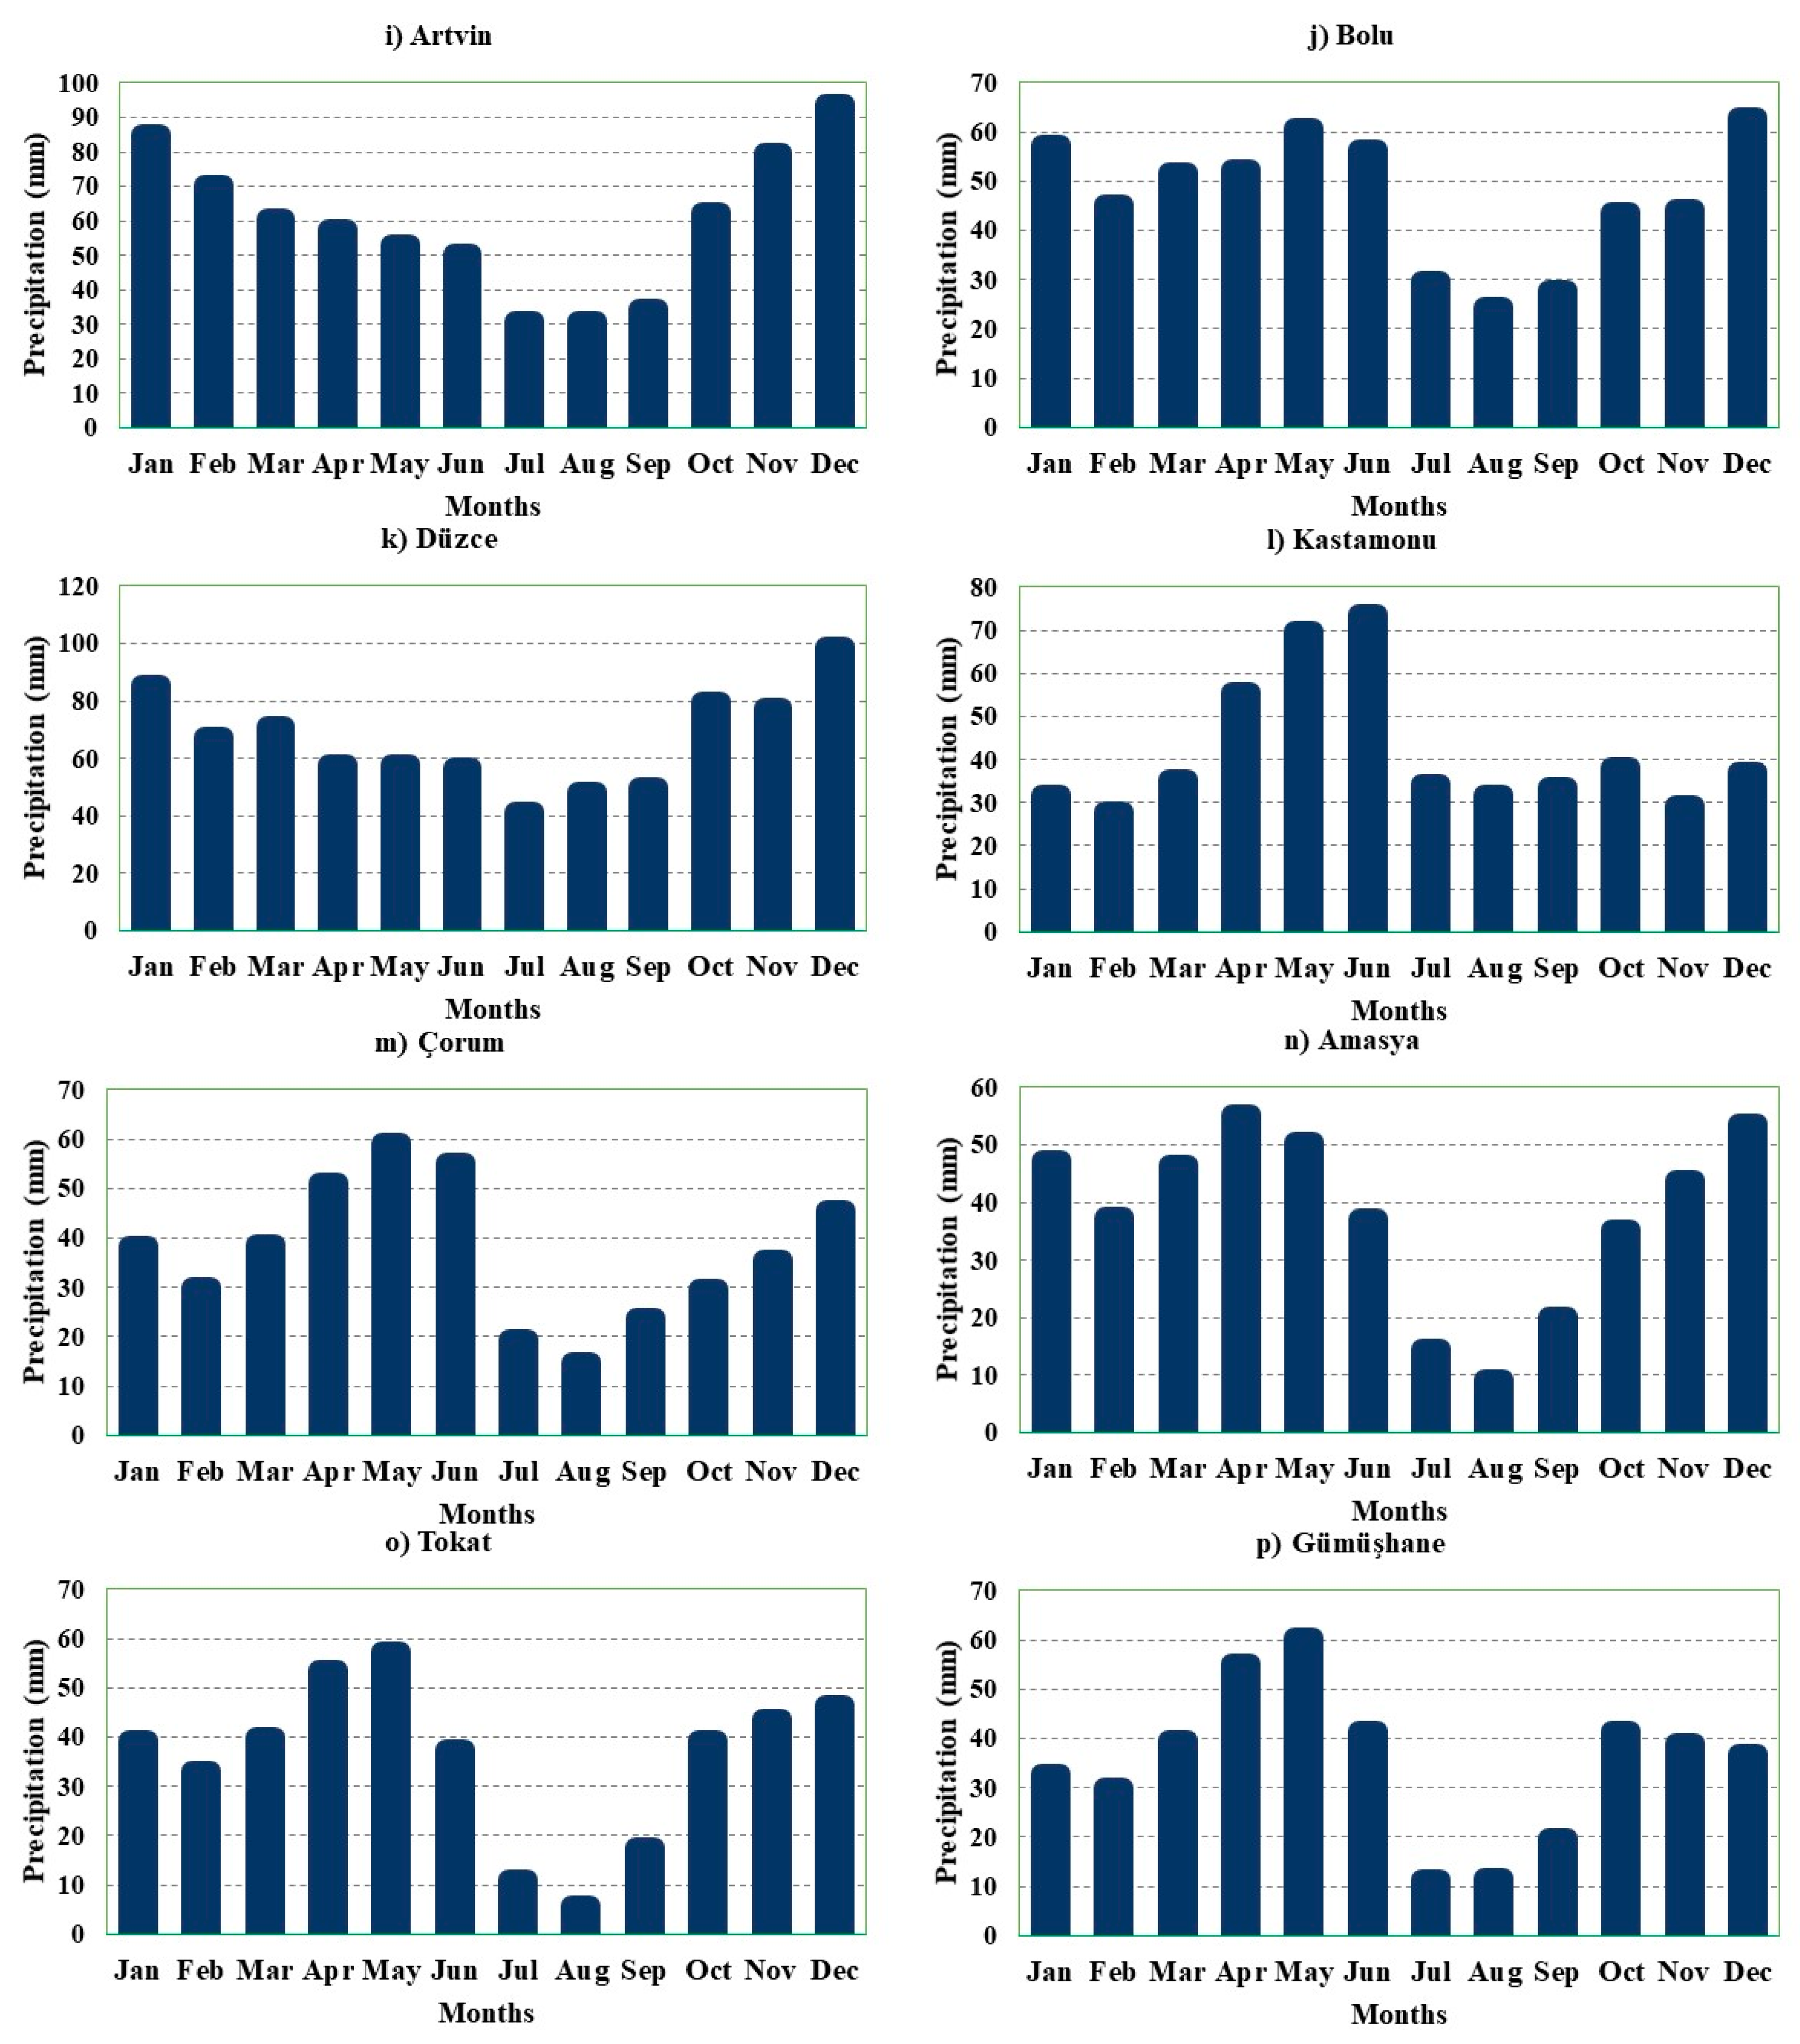
2.1. Study Area and Data
2.2. Methods
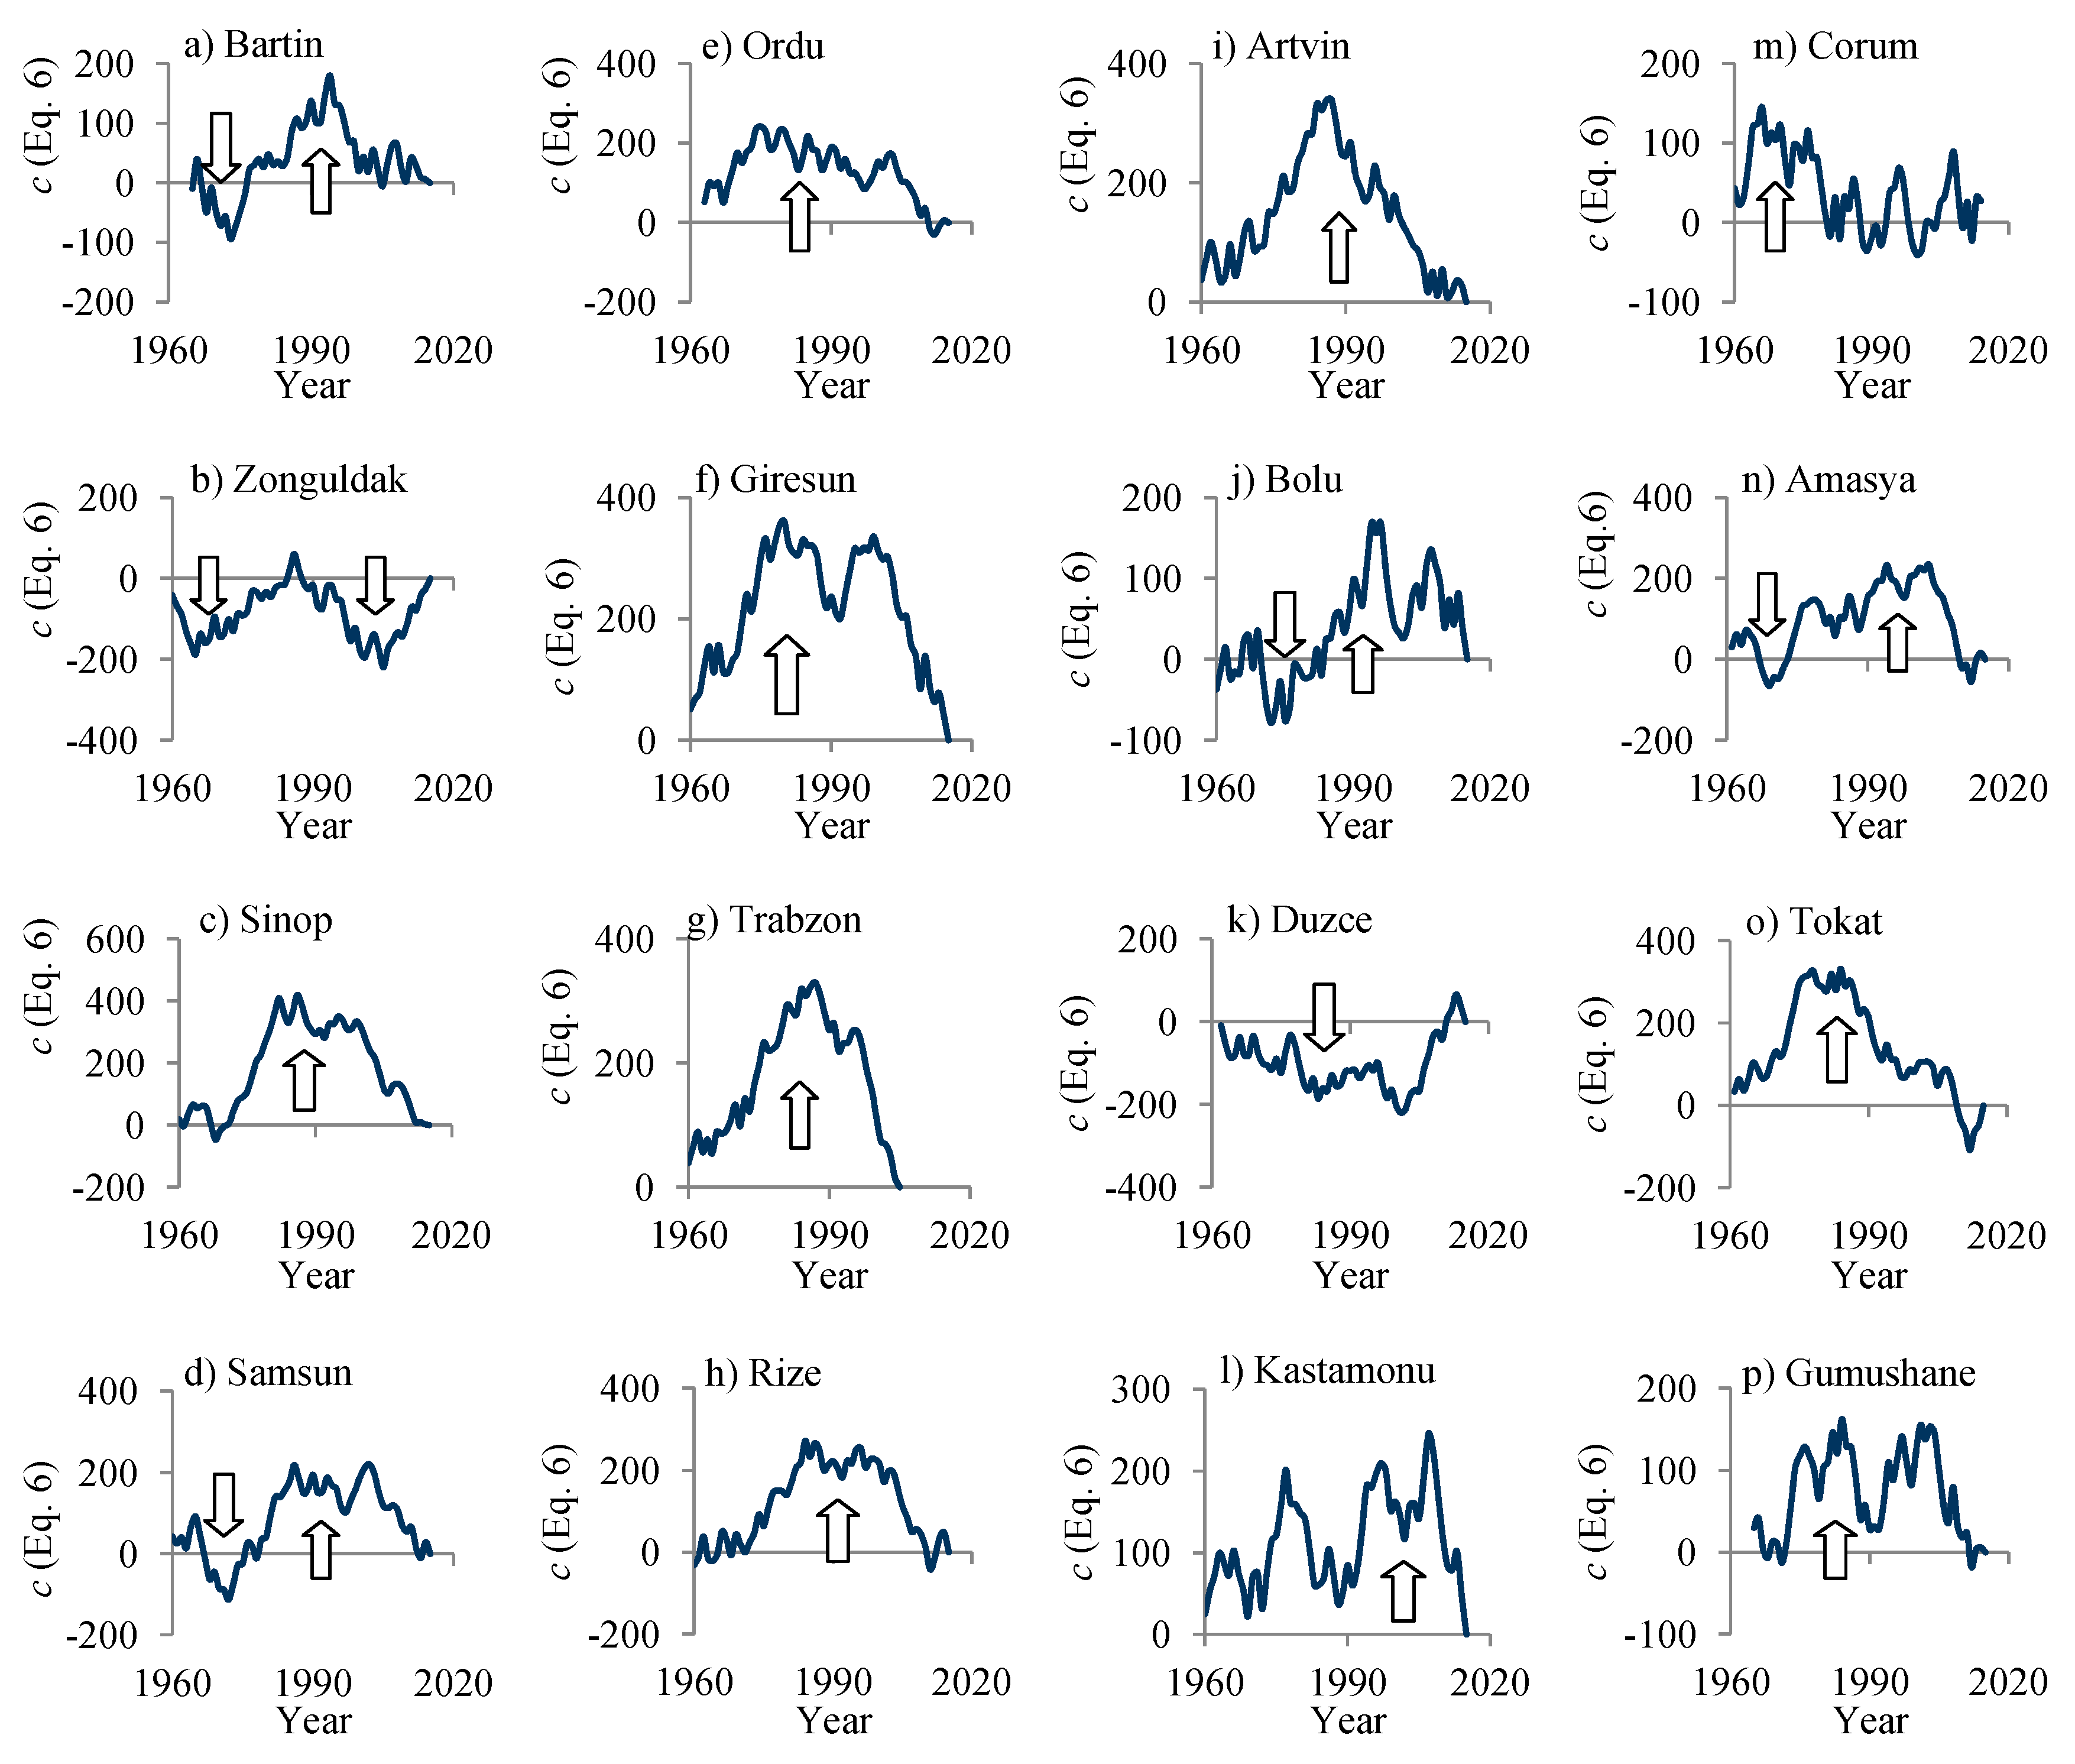
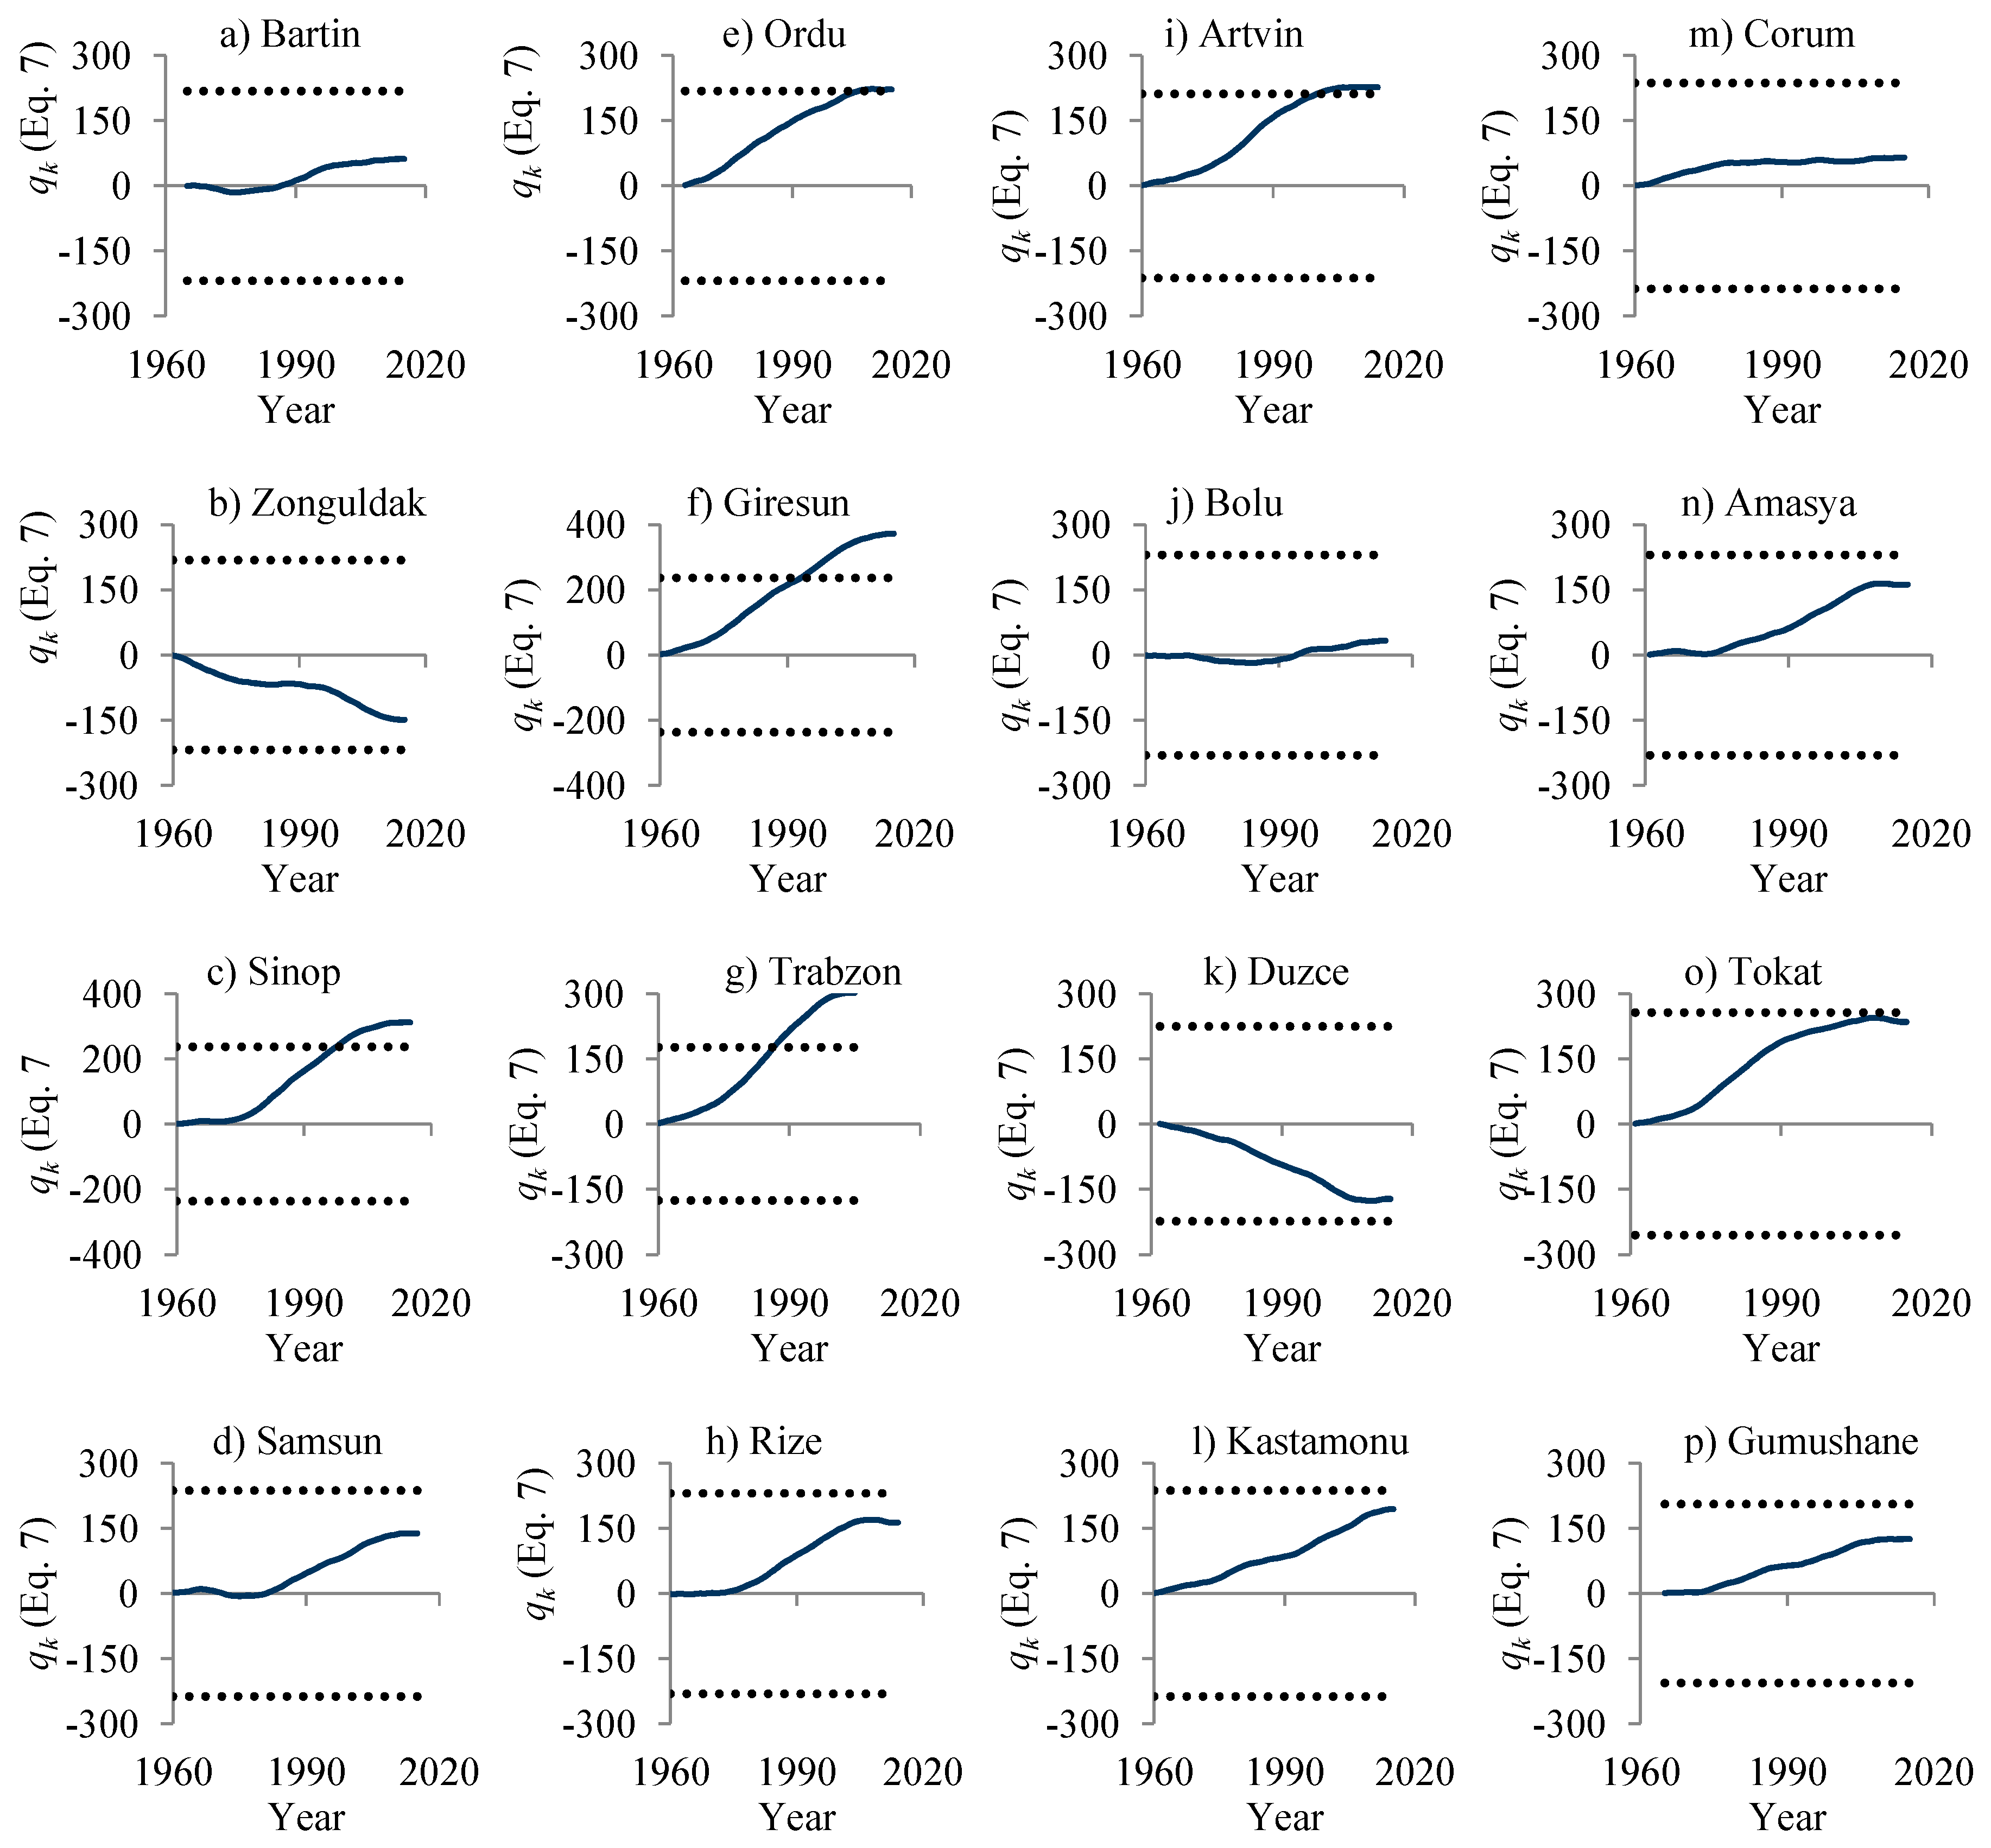
2.2.1. Refined Graphical–statistical CSD Trend Test and Diagnosis
2.2.2. Mann–Kendall (MK) Test
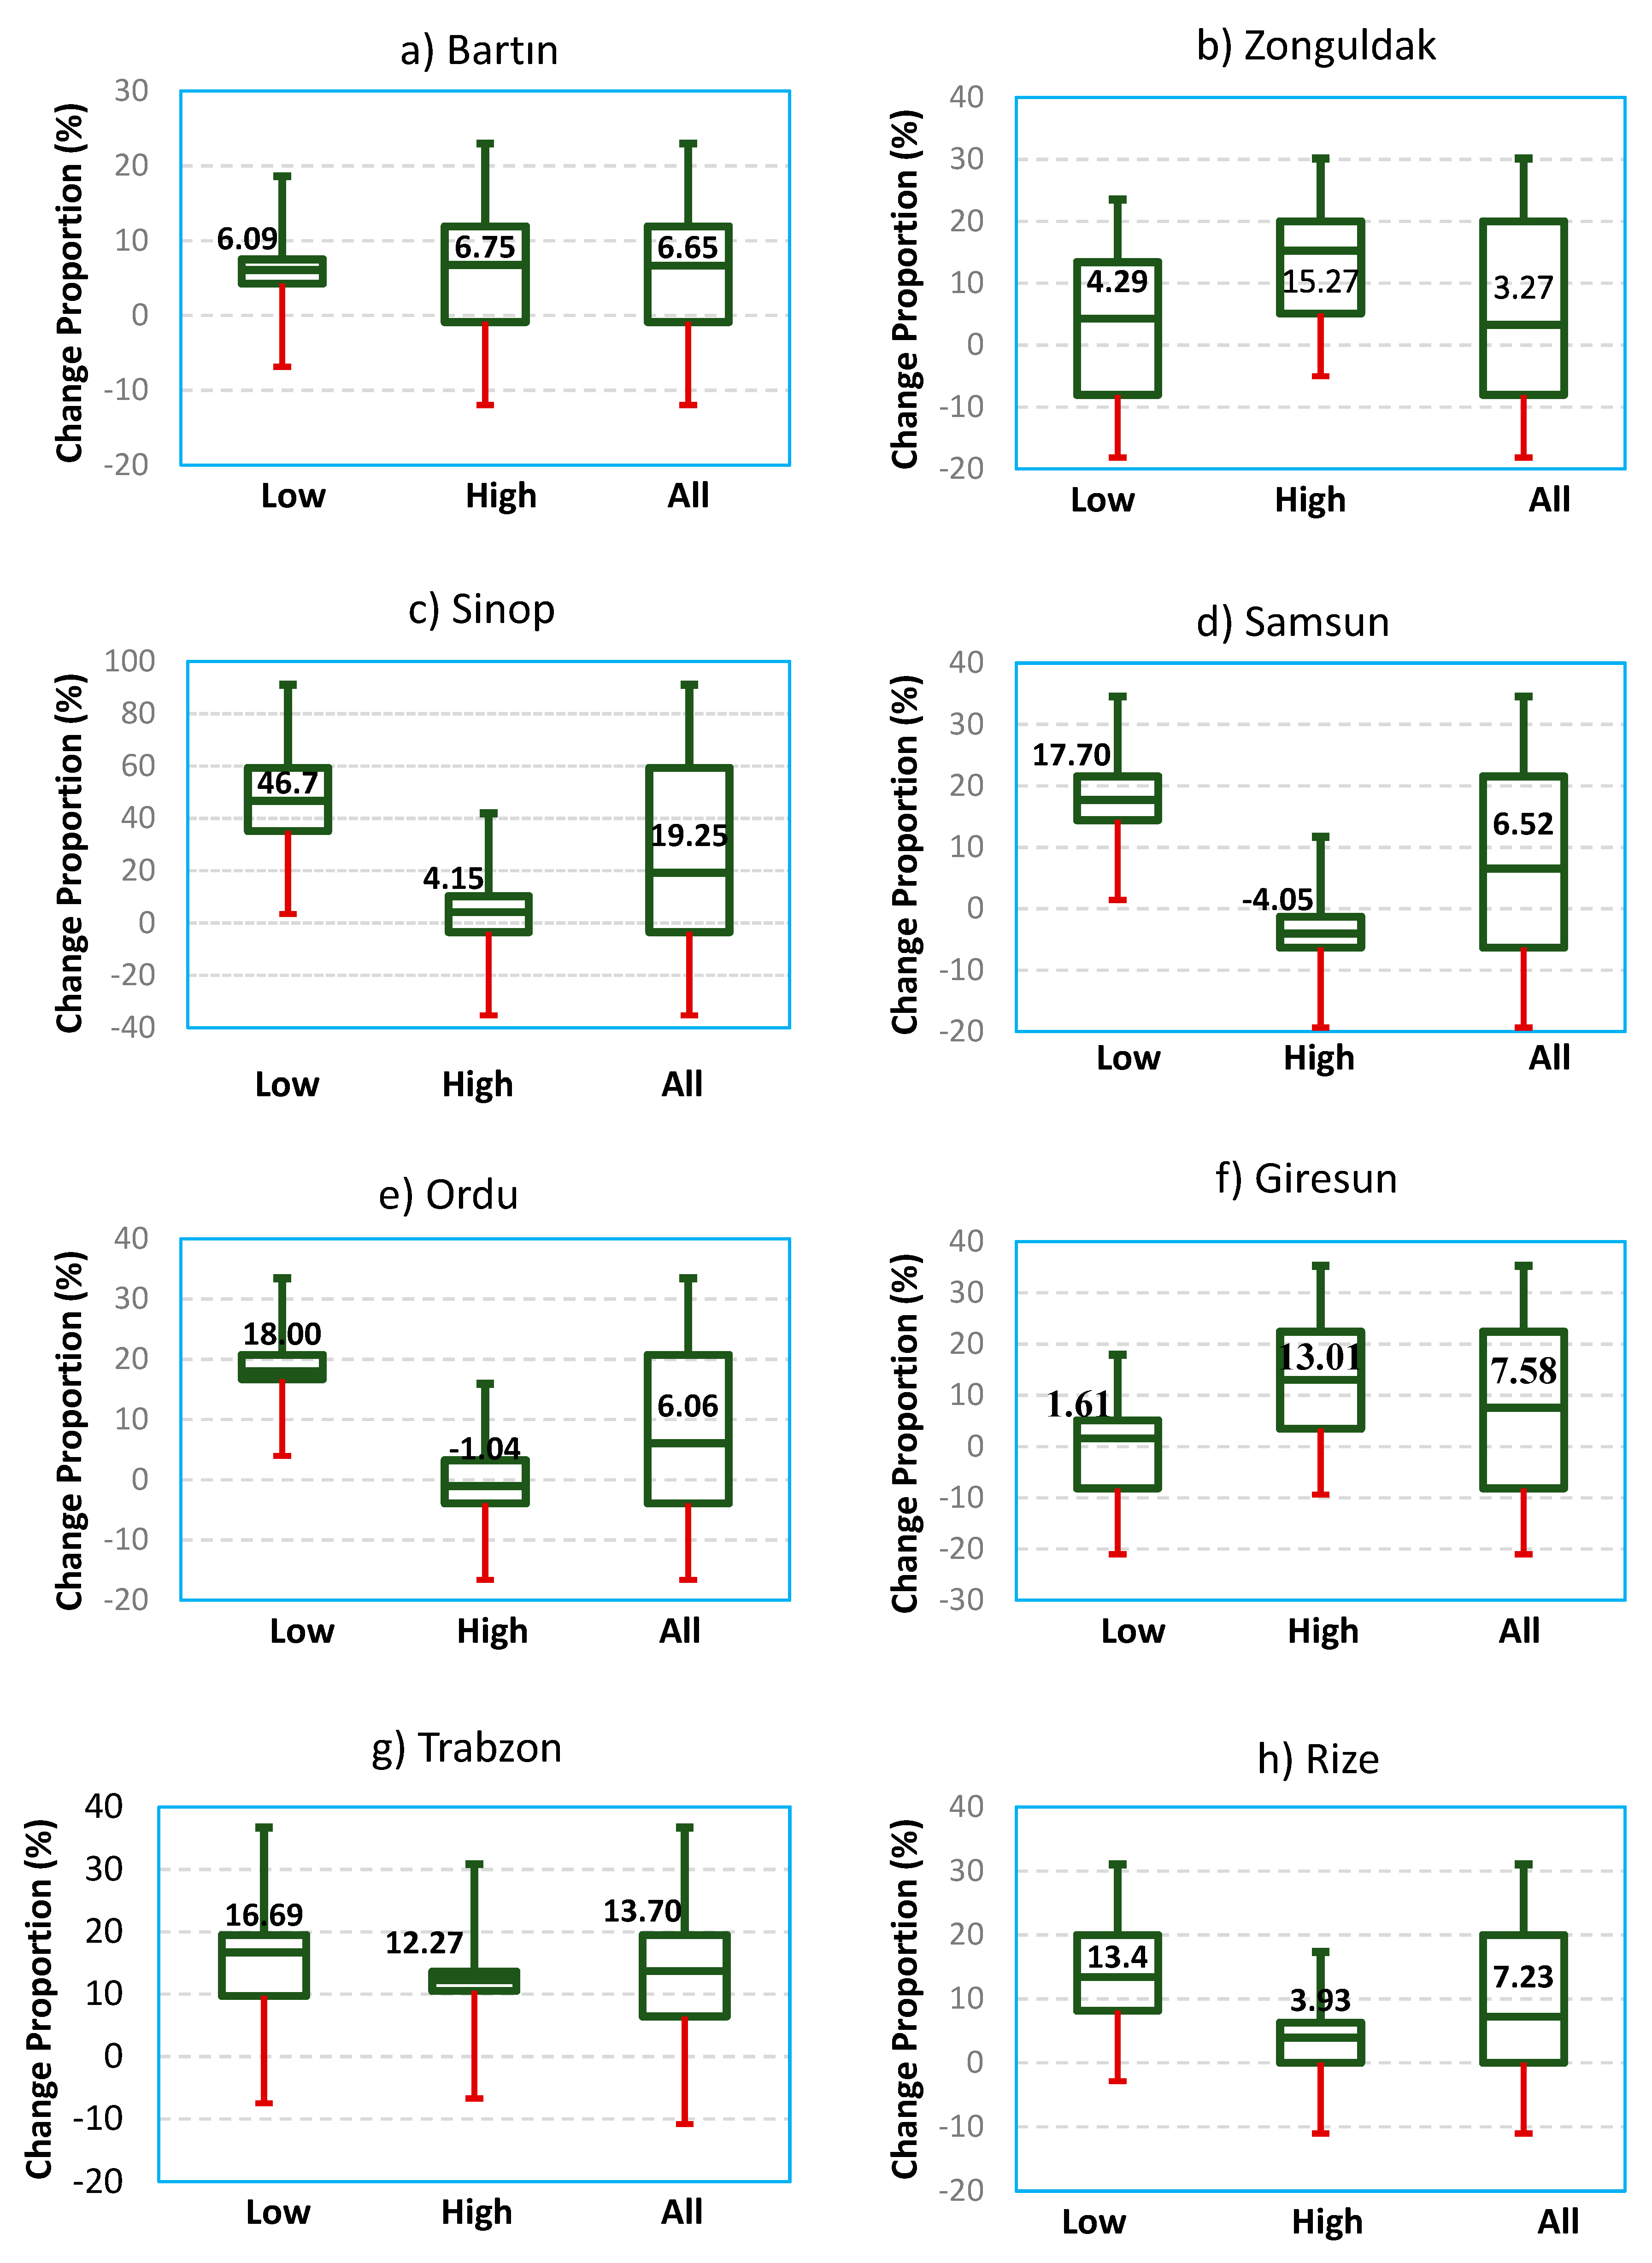
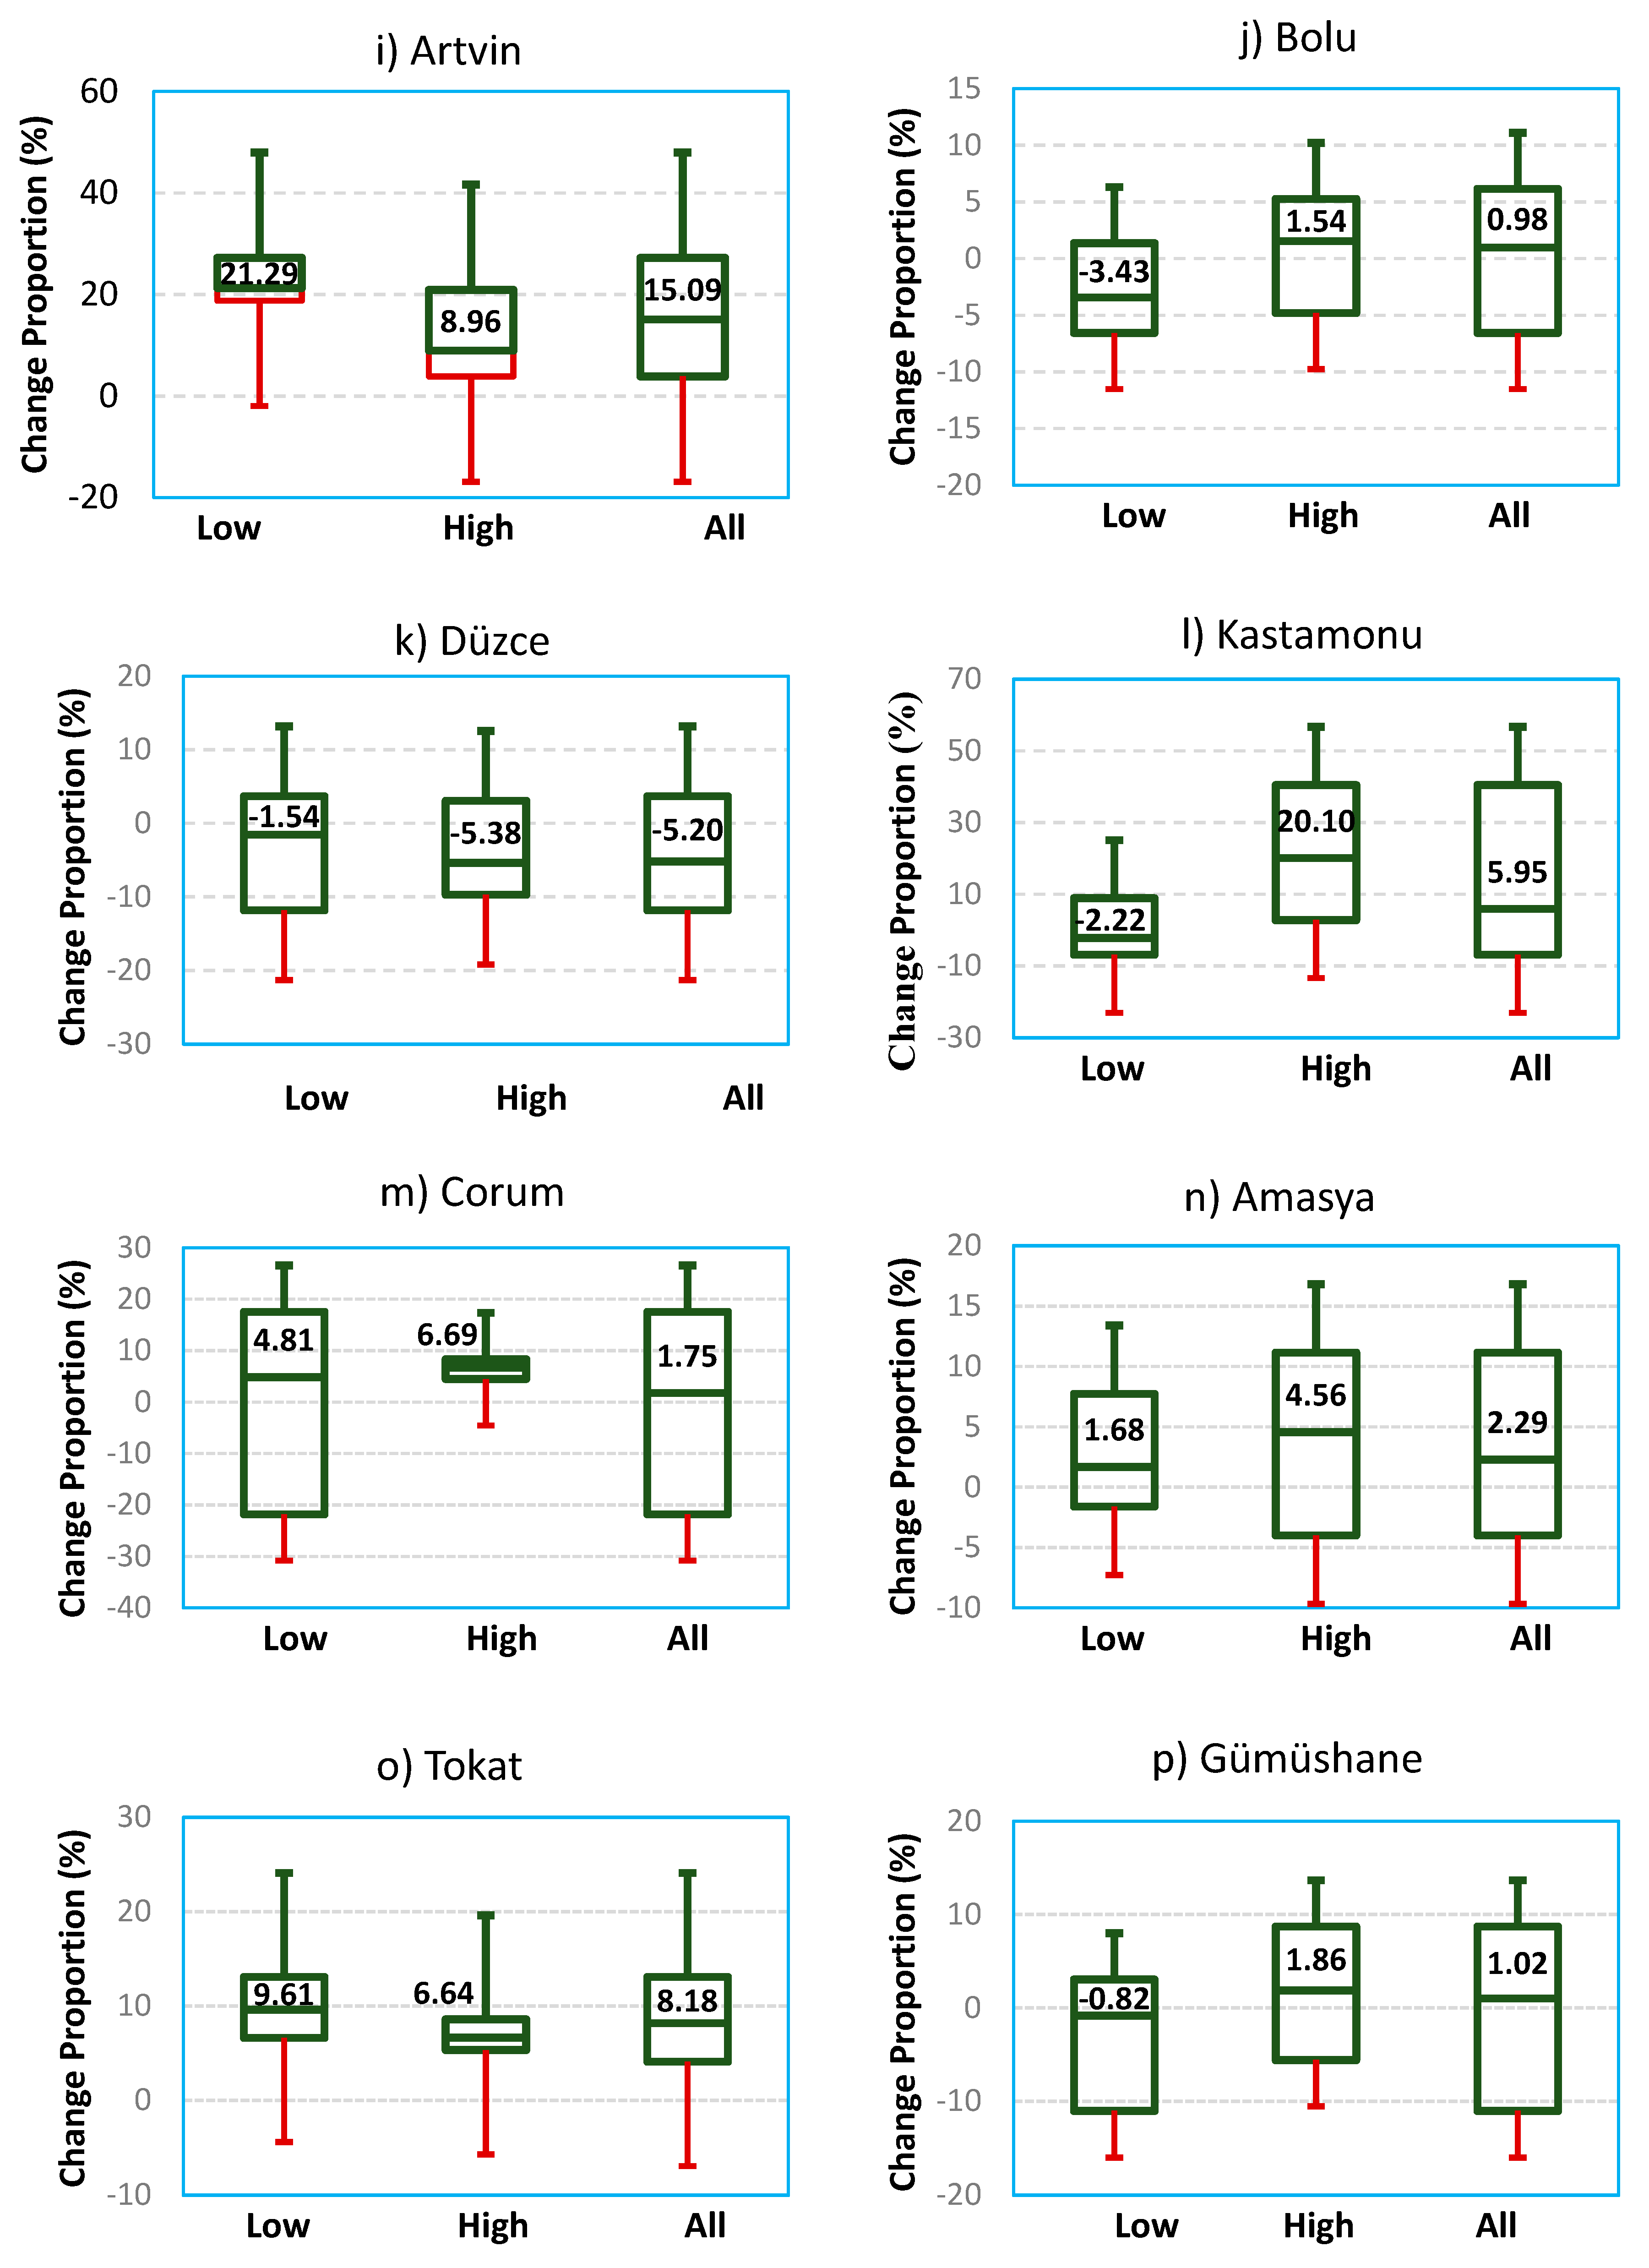
2.2.3. ITA and Change Boxes
2.2.4. Trend Magnitude
3. Results and Discussion
4. Conclusions
Author Contributions
Funding
Conflicts of Interest
References
- Akinsanola, A.A.; Ogunjobi, K.O. Recent homogeneity analysis and long-term spatio-temporal rainfall trends in Nigeria. Theor. Appl. Clim. 2015, 128, 275–289. [Google Scholar] [CrossRef]
- Pendergrass, A.G.; Knutti, R.; Lehner, F.; Deser, C.; Sanderson, B. Precipitation variability increases in a warmer climate. Sci. Rep. 2017, 7, 17966. [Google Scholar] [CrossRef] [PubMed]
- Mathbout, S.; Lopez-Bustins, J.A.; Martin-Vide, J.; Bech, J.; Rodrigo, F.S. Spatial and temporal analysis of drought variability at several time scales in Syria during 1961–2012. Atmos. Res. 2018, 200, 153–168. [Google Scholar] [CrossRef]
- Tabari, H.; Willems, P. More prolonged droughts by the end of the century in the Middle East. Environ. Res. Lett. 2018, 13, 104005. [Google Scholar] [CrossRef]
- Vicente-Serrano, S.M. Differences in Spatial Patterns of Drought on Different Time Scales: An Analysis of the Iberian Peninsula. Water Resour. Manag. 2006, 20, 37–60. [Google Scholar] [CrossRef]
- Doblas-Miranda, E.; Martínez-Vilalta, J.; Lloret, F.; Álvarez, A.; Ávila, A.; Bonet, F.J.; Brotons, L.; Castro, J.; Yuste, J.C.; Díaz, M.; et al. Reassessing global change research priorities in Mediterranean terrestrialecosystems: How far have we come and where do we go from here? Glob. Ecol. Biogeogr. 2015, 24, 25–43. [Google Scholar] [CrossRef]
- Tabari, H.; Willems, P. Lagged influence of Atlantic and Pacific climate patterns on European extreme precipitation. Sci. Rep. 2018, 8, 5748. [Google Scholar] [CrossRef]
- Giorgi, F. Climate change hot-spots. Geophys. Res. Lett. 2006, 33, L08707. [Google Scholar] [CrossRef]
- Tabari, H.; Hosseinzadehtalaei, P.; AghaKouchak, A.; Willems, P. Latitudinal heterogeneity and hotspots of uncertainty in projected extreme precipitation. Environ. Res. Lett. 2019, 14, 124032. [Google Scholar] [CrossRef]
- Ávila, Á.; Guerrero, F.C.; Escobar, Y.C.; Justino, F. Recent Precipitation Trends and Floods in the Colombian Andes. Water 2019, 11, 379. [Google Scholar] [CrossRef]
- McKitrick, R.; Christy, J. Assessing changes in US regional precipitation on multiple time scales. J. Hydrol. 2019, 578, 124074. [Google Scholar] [CrossRef]
- Nashwan, M.; Shahid, S.; Xiaojun, W. Uncertainty in Estimated Trends Using Gridded Rainfall Data: A Case Study of Bangladesh. Water 2019, 11, 349. [Google Scholar] [CrossRef]
- Pandey, B.K.; Khare, D. Identification of trend in long term precipitation and reference evapotranspiration over Narmada river basin (India). Glob. Planet. Chang. 2018, 161, 172–182. [Google Scholar] [CrossRef]
- Tabari, H. Statistical Analysis and Stochastic Modelling of Hydrological Extremes. Water 2019, 11, 1861. [Google Scholar] [CrossRef]
- Onyutha, C. Identification of sub-trends from hydro-meteorological series. Stoch. Environ. Res. Risk Assess. 2015, 30, 189–205. [Google Scholar] [CrossRef]
- Onyutha, C. Statistical analyses of potential evapotranspiration changes over the period 1930–2012 in the Nile River riparian countries. Agric. Forest. Meteorol. 2016, 226–227, 80–95. [Google Scholar] [CrossRef]
- Tabari, H.; Hosseinzadehtalaei, P. Temporal variability of precipitation over Iran: 1966–2005. J. Hydrol. 2011, 396, 313–320. [Google Scholar] [CrossRef]
- Westra, S.; Alexander, L.; Zwiers, F.W. Global Increasing Trends in Annual Maximum Daily Precipitation. J. Clim. 2013, 26, 3904–3918. [Google Scholar] [CrossRef]
- Karandish, F.; Mousavi, S.S.; Tabari, H. Climate change impact on precipitation and cardinal temperatures in different climatic zones in Iran: Analyzing the probable effects on cereal water-use efficiency. Stoch. Environ. Res. Risk Assess. 2016, 31, 2121–2146. [Google Scholar] [CrossRef]
- Shiru, M.S.; Shahid, S.; Chung, E.S.; Alias, N. Changing characteristics of meteorological droughts in Nigeria during 1901–2010. Atmos. Res. 2019, 223, 60–67. [Google Scholar] [CrossRef]
- Dudley, R.; Hirsch, R.; Archfield, S.; Blum, A.; Renard, B. Low streamflow trends at human-impacted and reference basins in the United States. J. Hydrol. 2020, 580, 124254. [Google Scholar] [CrossRef]
- Kundzewicz, Z.W.; Robson, A. Detecting Trend and Other Changes in Hydrological Data; World Climate Program—Water, WMO/UNESCO, WCDMP-45, WMO/TD-No.1013; WMO: Geneva, The Netherlands, 2000; p. 157. [Google Scholar]
- Onyutha, C. Statistical Uncertainty in Hydrometeorological Trend Analyses. Adv. Meteorol. 2016, 2016, 1–26. [Google Scholar] [CrossRef]
- Wu, H.; Qian, H. Innovative trend analysis of annual and seasonal rainfall and extreme values in Shaanxi, China, since the 1950s. Int. J. Clim. 2016, 37, 2582–2592. [Google Scholar] [CrossRef]
- Wang, X.; Xiao, J.; Li, X.; Cheng, G.; Ma, M.; Zhu, G.; Arain, M.A.; Black, T.A.; Jassal, R.S. No trends in spring and autumn phenology during the global warming hiatus. Nat. Commun. 2019, 10, 2389. [Google Scholar] [CrossRef] [PubMed]
- Sen, Z. An innovative trend analysis methodology. J. Hydrol. Eng. 2012, 17, 1042–1046. [Google Scholar] [CrossRef]
- Onyutha, C. An improved method to quantify trend slope and its significance. Front. Earth Sci. 2020; under review. [Google Scholar]
- Şen, Z. Trend identification simulation and application. J. Hydrol. Eng. 2014, 19, 635–642. [Google Scholar] [CrossRef]
- Şen, Z. Innovative trend significance test and applications. Theor. Appl. Clim. 2015, 127, 939–947. [Google Scholar] [CrossRef]
- Güçlü, Y.S. Multiple Şen-innovative trend analyses and partial Mann-Kendall test. J. Hydrol. 2018, 566, 685–704. [Google Scholar] [CrossRef]
- Alashan, S. An improved version of innovative trend analyses. Arab. J. Geosci. 2018, 11, 50. [Google Scholar] [CrossRef]
- Güçlü, Y.S.; Dabanli, I.; Sisman, E.; Sen, Z. Air quality (AQ) identification by innovative trend diagram and AQ index combinations in Istanbul megacity. Atmospheric Pollut. Res. 2019, 10, 88–96. [Google Scholar] [CrossRef]
- Tabari, H.; Taye, M.T.; Onyutha, C.; Willems, P. Decadal Analysis of River Flow Extremes Using Quantile-Based Approaches. Water Resour. Manag. 2017, 2, 527–3387. [Google Scholar] [CrossRef]
- Öztopal, A.; Şen, Z. Innovative Trend Methodology Applications to Precipitation Records in Turkey. Water Resour. Manag. 2016, 31, 727–737. [Google Scholar] [CrossRef]
- Şen, Z. Innovative Trend Methodologies in Science and Engineering. In Innovative Trend Methodologies in Science and Engineering; Springer: Cham, Switzerland, 2017. [Google Scholar]
- Mohorji, A.M.; Şen, Z.; Almazroui, M. Trend Analyses Revision and Global Monthly Temperature Innovative Multi-Duration Analysis. Earth Syst. Environ. 2017, 1, 9. [Google Scholar] [CrossRef]
- Amrhein, V.; Greenland, S.; McShane, B. Scientists rise up against statistical significance. Nature 2019, 567, 305–307. [Google Scholar] [CrossRef]
- Deniz, A.; Toros, H.; Incecik, S. Spatial variations of climate indices in Turkey. Int. J. Clim. 2011, 31, 394–403. [Google Scholar] [CrossRef]
- Duzenli, E.; Tabari, H.; Willems, P.; Yilmaz, M.T. Decadal variability analysis of extreme precipitation in Turkey and its relationship with teleconnection patterns. Hydrol. Process. 2018, 32, 3513–3528. [Google Scholar] [CrossRef]
- Sensoy, S.; Demircan, M.; Ulupınar, U.; Balta, I. Turkey Climate. DMI. 2008. Available online: http://www.dmi.gov.tr/iklim/iklim.aspx (accessed on 20 February 2020). (In Turkish)
- Akçar, N.; Yavuz, V.; Ivy-Ochs, S.; Kubik, P.W.; Vardar, M.; Schlüchter, C. Palaeoglacial records from Kavron Valley, NE Turkey: Field and cosmogenic exposure dating evidence. Quat. Int. 2007, 164, 170–183. [Google Scholar] [CrossRef]
- Tatli, H.; Dalfes, N.; Menteş, S. A statistical downscaling method for monthly total precipitation over Turkey. Int. J. Clim. 2004, 24, 161–180. [Google Scholar] [CrossRef]
- Sariş, F.; Hannah, D.M.; Eastwood, W.J. Spatial variability of precipitation regimes over Turkey. Hydrol. Sci. J. 2010, 55, 234–249. [Google Scholar] [CrossRef]
- Biyik, G.; Unal, Y.; Onol, B. Assessment of Precipitation Forecast Accuracy over Eastern Black Sea Region using WRF-ARW. In Proceedings of the 11th Plinius Conference on Mediterranean Storms, Barcelona, Spain, 7–10 September 2009. [Google Scholar]
- Mann, H.B. Nonparametric Tests against Trend. Econometrica 1945, 13, 245. [Google Scholar] [CrossRef]
- Kendall, M.G. Rank Correlation Methods, 4th ed.; Griffin, C., Ed.; Griffin: London, UK, 1975. [Google Scholar]
- Theil, H. A rank-invariant method of linear and polynomial regression analysis. Nederl. Akad. Wetench. Ser. A 1950, 53, 386–392. [Google Scholar]
- Sen, P.K. Estimates of the regression coefficient based on Kendall’s tau. J. Am. Stat. Assoc. 1968, 63, 1379–1389. [Google Scholar] [CrossRef]
- Tabari, H.; Willems, P. Seasonally varying footprint of climate change on precipitation in the Middle East. Sci. Rep. 2018, 8, 4435. [Google Scholar] [CrossRef] [PubMed]
- Baglee, A.; Connell, R.; Haworth, A.; Rabb, B.; Bugler, W.; Ulug, G.; Capalov, L.; Hansen, D.S.; Glenting, C.; Jensen, C.H.; et al. Climate Risk Case Study, Plot Climate Change Adaptation Market Study: Turkey. 2013. Available online: https://www.ebrd.com/downloads/sector/sei/turkey-adaptation-study.pdf (accessed on 20 February 2020).
- Onyutha, C.; Tabari, H.; Rutkowska, A.; Nyeko-Ogiramoi, P.; Willems, P. Comparison of different statistical downscaling methods for climate change rainfall projections over the Lake Victoria basin considering CMIP3 and CMIP5. HydroResearch 2016, 12, 31–45. [Google Scholar] [CrossRef]
- Yue, S.; Pilon, P.; Cavadias, G. Power of the Mann–Kendall and Spearman’s rho tests for detecting monotonic trends in hydrological series. J. Hydrol. 2002, 259, 254–271. [Google Scholar] [CrossRef]
- Pirnia, A.; Golshan, M.; Darabi, H.; Adamowski, J.F.; Rozbeh, S. Using the Mann–Kendall test and double mass curve method to explore stream flow changes in response to climate and human activities. J. Water Clim. Chang. 2018, 10, 725–742. [Google Scholar] [CrossRef]
- Tang, L.; Zhang, Y. Considering Abrupt Change in Rainfall for Flood Season Division: A Case Study of the Zhangjia Zhuang Reservoir, Based on a New Model. Water 2018, 10, 1152. [Google Scholar] [CrossRef]
- Onyutha, C. Trends and variability in African long-term precipitation. Stoch. Environ. Res. Risk Assess. 2018, 32, 2721–2739. [Google Scholar] [CrossRef]
- Vido, J.; Nalevanková, P.; Valach, J.; Šustek, Z.; Tadesse, T. Drought Analyses of the Horné Požitavie Region (Slovakia) in the Period 1966–2013. Adv. Meteorol. 2019, 2019, 1–10. [Google Scholar] [CrossRef]
- Onyutha, C.; Tabari, H.; Taye, M.T.; Nyandwaro, G.N.; Willems, P. Analyses of rainfall trends in the Nile River Basin. HydroResearch 2016, 13, 36–51. [Google Scholar] [CrossRef]


| Station | Full Period | First Half | Second Half | Xmin | Xmax | Xmean | SD | Cv | Csx |
|---|---|---|---|---|---|---|---|---|---|
| Bartın | 1965–2015 | 1964–1989 | 1990–2015 | 0 | 349.1 | 86.7 | 61.65 | 0.71 | 1.15 |
| Zonguldak | 1960–2015 | 1960–1987 | 1988–2015 | 0 | 359.8 | 101.3 | 68.6 | 0.68 | 0.86 |
| Sinop | 1960–2015 | 1960–1987 | 1988–2015 | 0 | 324.0 | 57.2 | 42.9 | 0.75 | 1.44 |
| Samsun | 1960–2015 | 1960–1987 | 1988–2015 | 0 | 350.3 | 58.8 | 40.4 | 0.69 | 1.68 |
| Ordu | 1963–2015 | 1963–1989 | 1990–2015 | 0.3 | 267.6 | 85.8 | 50.7 | 0.59 | 1.00 |
| Giresun | 1960–2015 | 1960–1987 | 1988–2015 | 0.2 | 521.6 | 104.97 | 61.89 | 0.59 | 1.41 |
| Trabzon | 1960–2015 | 1960–1983 | 1984–2005 | 2.8 | 293.0 | 68.1 | 43.8 | 0.64 | 1.28 |
| Rize | 1960–2015 | 1960–1987 | 1988–2015 | 8.2 | 516.6 | 186.4 | 102.1 | 0.55 | 0.84 |
| Artvin | 1960–2015 | 1960–1987 | 1988–2015 | 0.9 | 342.2 | 59.2 | 43.2 | 0.73 | 1.99 |
| Bolu | 1960–2015 | 1960–1987 | 1988–2015 | 0 | 174.4 | 46.4 | 29.1 | 0.63 | 0.94 |
| Duzce | 1960–2015 | 1961–1987 | 1988–2015 | 0 | 227.2 | 68.5 | 43.1 | 0.63 | 0.75 |
| Kastamonu | 1960–2015 | 1960–1987 | 1988–2015 | 0 | 278.7 | 41.6 | 31.7 | 0.76 | 1.80 |
| Corum | 1960–2015 | 1960–1987 | 1988–2015 | 0 | 220.1 | 36.8 | 28.4 | 0.77 | 1.37 |
| Amasya | 1960–2015 | 1960–1987 | 1988–2015 | 0 | 144.6 | 38.3 | 28.4 | 0.74 | 0.87 |
| Tokat | 1961–2015 | 1960–1987 | 1988–2015 | 0 | 141.1 | 36.1 | 27.3 | 0.76 | 0.87 |
| Gumushane | 1965–2015 | 1965–1989 | 1990–2015 | 0 | 141.9 | 38.5 | 26.8 | 0.70 | 0.78 |
| Rainfall Station | Full Time Series | First Half Sub−series | Second Half Sub−series | ||||||||||||
|---|---|---|---|---|---|---|---|---|---|---|---|---|---|---|---|
| Win | Spr | Sum | Aut | Ann | Win | Spr | Sum | Aut | Ann | Win | Spr | Sum | Aut | Ann | |
| Bartin | −0.63 | −0.48 | 0.20 | 0.26 | 0.57 | −1.69 | −2.44 | 0.68 | 0.21 | −0.83 | 1.58 | 1.64 | −0.84 | 2.88 | 0.03 |
| Zonguldak | −0.61 | −1.14 | −1.31 | −0.43 | −1.22 | −1.65 | −1.66 | −0.01 | −0.11 | −1.89 | 2.58 | 1.41 | −1.64 | 2.77 | −1.99 |
| Sinop | 0.62 | 0.51 | 0.98 | 0.14 | 2.11 | −2.32 | −1.38 | 0.65 | −2.16 | −1.52 | 1.48 | 0.67 | 0.40 | −0.38 | 0.36 |
| Samsun | −0.06 | −0.19 | 1.22 | 0.04 | 0.97 | −1.92 | −0.42 | 1.01 | −2.28 | −1.00 | 1.59 | 0.84 | 0.79 | 1.71 | 0.86 |
| Ordu | 0.63 | 1.92 | −0.74 | 1.25 | 1.88 | 0.45 | 1.76 | 0.08 | 1.40 | 1.93 | −0.75 | −0.31 | 1.37 | 0.20 | 0.92 |
| Giresun | −0.26 | 0.73 | 0.53 | 0.19 | 3.08 | 0.00 | 0.23 | 1.21 | −0.31 | 1.68 | 1.35 | 0.01 | −0.36 | 0.66 | 1.36 |
| Trabzon | 1.93 | 1.53 | 1.64 | 1.58 | 3.35 | 0.15 | −0.99 | 0.64 | −0.36 | −0.09 | 1.53 | 2.01 | 0.33 | 0.32 | 1.99 |
| Rize | −0.29 | −1.16 | 1.35 | −0.70 | 1.75 | −0.04 | −2.24 | −0.43 | −0.37 | −0.64 | −0.81 | 0.41 | 1.37 | −0.92 | 0.47 |
| Artvin | 0.30 | 1.51 | 1.47 | 0.70 | 2.64 | 1.15 | 0.07 | −1.31 | 1.17 | 0.21 | −2.16 | 1.21 | 0.86 | −2.39 | −0.76 |
| Bolu | −0.98 | 0.72 | 0.39 | 0.07 | 0.32 | 0.24 | −1.58 | −0.16 | 1.22 | −0.69 | 1.52 | 1.94 | 0.12 | 1.99 | 1.31 |
| Duzce | −1.15 | −1.33 | −0.71 | −0.87 | −1.61 | −0.87 | −0.93 | 0.60 | 0.20 | −0.31 | −0.48 | 0.18 | −0.71 | 0.75 | −0.83 |
| Kastamonu | 0.01 | 1.36 | 0.94 | −0.47 | 1.40 | 0.33 | 1.19 | 0.16 | 0.37 | 0.96 | 1.31 | 0.91 | 1.39 | 2.19 | 1.82 |
| Corum | −1.32 | 0.29 | 1.13 | −0.38 | 0.79 | −0.20 | 1.12 | −0.28 | 0.56 | 1.00 | 0.86 | −1.05 | −0.21 | 2.49 | −0.19 |
| Amasya | −0.99 | 1.10 | 2.11 | −0.73 | 1.22 | −2.02 | −0.43 | 1.59 | −0.46 | 0.35 | 1.86 | 0.37 | 1.60 | 3.11 | 1.94 |
| Tokat | −1.21 | 1.33 | 0.89 | −0.06 | 1.80 | −0.81 | 1.15 | 0.51 | 1.23 | 1.60 | 0.42 | −1.13 | 0.44 | 2.48 | −0.62 |
| Gumushane | −0.91 | 0.41 | −0.25 | 1.36 | 0.99 | 0.09 | −0.41 | 0.11 | 1.15 | 1.03 | 1.01 | 0.36 | −0.62 | 2.90 | 0.90 |
| Rainfall Station | Full Time Series | First Half Sub−series | Second Half Sub−series | ||||||||||||
|---|---|---|---|---|---|---|---|---|---|---|---|---|---|---|---|
| Win | Spr | Sum | Aut | Ann | Win | Spr | Sum | Aut | Ann | Win | Spr | Sum | Aut | Ann | |
| Bartin | −0.71 | −0.35 | 0.19 | 0.29 | 0.95 | −4.6 | −3.54 | 1.28 | 0.82 | −4.95 | 3.19 | 2.14 | −1.84 | 6.47 | −0.72 |
| Zonguldak | −0.51 | −0.63 | −0.97 | −0.43 | −1.45 | −2.3 | −3.46 | −0.05 | −0.01 | −6.77 | 6.06 | 1.31 | −3.26 | 6.62 | −6.78 |
| Sinop | 0.40 | 0.24 | 0.51 | 0.09 | 2.46 | −3 | −1.52 | 0.97 | −2.20 | −6.22 | 1.55 | 0.79 | 0.67 | −0.42 | 0.78 |
| Samsun | 0.04 | −0.05 | 1.21 | 0.01 | 1.20 | −2.8 | −0.55 | 1.24 | −3.39 | −3.65 | 2.46 | 0.79 | 1.43 | 1.92 | 2.61 |
| Ordu | 0.33 | 0.88 | −0.54 | 1.16 | 2.22 | 0.6 | 1.52 | −0.10 | 2.44 | 9.24 | −0.9 | −0.51 | 2.68 | 0.49 | 1.33 |
| Giresun | −0.18 | 0.41 | 0.36 | 0.15 | 3.44 | −0 | 0.59 | 1.34 | −0.42 | 3.94 | 1.76 | 0.26 | −1.59 | 1.31 | 5.86 |
| Trabzon | 1.33 | 0.60 | 0.68 | 1.34 | 4.32 | 0.63 | −0.93 | 0.89 | −0.58 | −0.09 | 2.7 | 2.77 | 0.24 | 1.24 | 6.61 |
| Rize | −0.53 | −0.81 | 1.07 | −0.92 | 3.94 | −0.5 | −3.07 | −1.24 | −0.64 | −4.15 | −2.1 | 0.37 | 5.12 | −1.82 | 3.21 |
| Artvin | 0.13 | 0.35 | 0.64 | 0.49 | 2.23 | 2.35 | 0.01 | −0.71 | 1.80 | 0.58 | −5.8 | 1.00 | 0.95 | −8.19 | −2.55 |
| Bolu | −0.14 | 0.21 | 0.38 | 0.06 | 0.39 | 0.03 | −1.54 | −0.13 | 1.68 | −0.92 | 1.85 | 2.19 | 0.16 | 2.83 | 2.36 |
| Duzce | −1.28 | −0.37 | −0.39 | −0.71 | −1.85 | −1.4 | −1.58 | 0.83 | 0.50 | −1.32 | −1.3 | 0.47 | −2.26 | 1.17 | −1.84 |
| Kastamonu | −0.04 | 0.49 | 0.56 | −0.17 | 1.39 | 0.41 | 1.36 | 0.01 | 0.43 | 2.16 | 1.21 | 1.39 | 2.92 | 1.88 | 5.40 |
| Corum | −0.59 | 0.06 | 0.30 | −0.13 | 0.30 | −0.2 | 0.94 | −0.52 | 0.99 | 1.88 | 1.33 | −0.91 | −0.59 | 2.77 | −0.71 |
| Amasya | −0.80 | 0.33 | 0.37 | −0.53 | 0.83 | −2.6 | −0.51 | 1.27 | −0.59 | 0.71 | 2.96 | 0.73 | 1.12 | 3.90 | 4.26 |
| Tokat | −0.53 | 0.43 | 0.28 | 0.02 | 1.27 | −0.9 | 0.82 | 0.24 | 1.88 | 3.34 | 0.24 | −0.96 | 0.28 | 1.89 | −1.25 |
| Gumushane | −0.29 | 0.20 | −0.03 | 0.50 | 0.87 | 0.07 | −0.52 | 0.15 | 1.13 | 2.62 | 1.12 | 0.71 | −0.32 | 2.26 | 1.94 |
| Rainfall Station | Full Time Series | First Half Sub−series | Second Half Sub−series | ||||||||||||
|---|---|---|---|---|---|---|---|---|---|---|---|---|---|---|---|
| Win | Spr | Sum | Aut | Ann | Win | Spr | Sum | Aut | Ann | Win | Spr | Sum | Aut | Ann | |
| Bartin | −0.26 | −0.49 | 0.26 | 0.32 | 0.50 | −0.63 | −2.31 | 0.63 | 0.30 | −1.17 | 1.76 | 1.45 | −0.66 | 2.71 | −0.49 |
| Zonguldak | −0.73 | −0.94 | −1.38 | −0.76 | −1.16 | −1.63 | −1.72 | −0.02 | 0.02 | −1.92 | 2.70 | 1.52 | −1.52 | 2.53 | −1.70 |
| Sinop | 0.78 | 0.62 | 1.11 | −0.11 | 2.18 | −2.75 | −1.32 | 0.77 | −1.80 | −1.88 | 1.18 | 0.85 | 0.49 | −0.86 | 0.38 |
| Samsun | 0.09 | −0.11 | 2.36 | −0.17 | 1.32 | −2.23 | −0.49 | 1.01 | −2.43 | −1.01 | 1.32 | 0.85 | 1.02 | 1.22 | 1.05 |
| Ordu | 0.96 | 1.84 | −0.77 | 1.10 | 2.11 | 1.04 | 0.88 | −0.04 | 1.28 | 1.97 | −0.66 | −0.93 | 1.42 | 0.29 | 0.48 |
| Giresun | −0.31 | 0.70 | 0.48 | 0.19 | 3.28 | −0.54 | 0.24 | 0.97 | −0.10 | 1.68 | 0.29 | 0.04 | −0.45 | 0.53 | 1.48 |
| Trabzon | 1.35 | 1.40 | 1.58 | 1.18 | 3.39 | 0.21 | −1.00 | 0.58 | −0.32 | −0.05 | 0.74 | 2.17 | 0.24 | −0.03 | 2.01 |
| Rize | −0.46 | −1.34 | 1.19 | −1.02 | 1.77 | −0.36 | −2.23 | −0.53 | −0.26 | −0.57 | −1.44 | 0.22 | 1.26 | −1.18 | 0.55 |
| Artvin | 0.12 | 1.35 | 1.93 | 0.97 | 2.25 | 0.79 | 0.02 | −1.13 | 1.28 | 0.30 | −2.31 | 1.09 | 0.85 | −2.23 | −0.69 |
| Bolu | −0.48 | 0.63 | 0.72 | −0.12 | 0.56 | 0.19 | −1.42 | −0.10 | 1.40 | −0.61 | 1.52 | 1.76 | 0.13 | 1.50 | 1.05 |
| Duzce | −1.66 | −0.78 | −0.66 | −1.08 | −1.54 | −0.13 | −0.79 | 0.64 | 0.52 | −0.33 | −0.17 | 0.25 | −0.79 | 0.51 | −0.83 |
| Kastamonu | −0.12 | 0.98 | 0.85 | −0.75 | 1.58 | 0.42 | 1.17 | 0.02 | 0.40 | 1.01 | 1.05 | 0.77 | 1.40 | 1.96 | 1.92 |
| Corum | −1.32 | 0.19 | 0.58 | −0.69 | 0.41 | −0.34 | 1.21 | −0.28 | 0.69 | 1.03 | 0.38 | −1.15 | −0.26 | 2.13 | −0.38 |
| Amasya | −1.26 | 0.86 | 1.61 | −1.39 | 1.36 | −1.42 | −0.38 | 1.06 | −0.46 | 0.30 | 1.80 | 0.71 | 1.03 | 1.93 | 2.04 |
| Tokat | −0.88 | 1.13 | 0.99 | −0.33 | 2.03 | −0.21 | 0.96 | 0.13 | 1.04 | 1.63 | 0.22 | −0.87 | 0.18 | 1.37 | −0.54 |
| Gumushane | −0.43 | 0.39 | −0.13 | 1.60 | 1.19 | 0.53 | −0.44 | 0.12 | 1.23 | 1.48 | 1.05 | 0.48 | −0.49 | 2.27 | 1.19 |
| Station | Low Group | High Group | All Group | ||||||
|---|---|---|---|---|---|---|---|---|---|
| Min | Mean | Max | Min | Mean | Max | Min | Mean | Max | |
| Bartin | 4.25 | 6.09 | 7.50 | −0.88 | 6.75 | 11.90 | −0.88 | 6.65 | 11.90 |
| Zonguldak | −8.04 | 4.29 | 13.39 | 5.12 | 15.27 | 3.27 | 13.39 | 3.27 | 20.00 |
| Sinop | 35.17 | 46.70 | 59.29 | −3.49 | 4.15 | 10.24 | 59.29 | 19.25 | 59.29 |
| Samsun | 14.42 | 17.70 | 21.54 | −6.33 | −4.05 | −1.29 | −6.33 | 6.52 | 21.54 |
| Ordu | 16.69 | 18.00 | 20.69 | −3.90 | −1.04 | 3.22 | −3.90 | 6.06 | 20.69 |
| Giresun | −8.18 | 1.61 | 5.08 | 3.48 | 13.01 | 22.42 | −8.18 | 7.58 | 22.42 |
| Trabzon | 9.72 | 16.69 | 19.46 | 10.52 | 12.27 | 13.60 | 6.43 | 13.70 | 19.46 |
| Rize | −35.57 | 13.40 | 4.82 | 3.65 | 3.93 | 21.12 | −35.57 | 7.23 | 21.12 |
| Artvin | 18.81 | 21.29 | 27.23 | 3.86 | 8.96 | 15.09 | 3.86 | 15.09 | 27.23 |
| Bolu | −6.57 | −3.43 | 1.35 | −4.80 | 1.54 | 5.26 | −6.57 | 0.98 | 6.15 |
| Duzce | −11.81 | −1.54 | 3.68 | −9.72 | −5.38 | 3.06 | −11.81 | −5.20 | 3.68 |
| Kastamonu | −6.83 | −2.22 | 8.91 | 2.80 | 20.10 | 5.95 | −6.83 | 5.95 | 40.51 |
| Corum | −21.80 | 4.81 | 17.53 | 4.47 | 6.69 | 8.29 | −21.80 | 1.75 | 17.53 |
| Amasya | −1.60 | 1.68 | 7.73 | −4.00 | 4.56 | 2.29 | −4.00 | 2.29 | 11.15 |
| Tokat | 6.64 | 9.61 | 13.08 | 5.33 | 6.64 | 8.18 | 13.09 | 8.18 | 13.09 |
| Gumushane | −11.02 | −0.82 | 3.04 | −5.58 | 1.86 | 8.70 | −11.02 | 1.02 | 8.70 |
© 2020 by the authors. Licensee MDPI, Basel, Switzerland. This article is an open access article distributed under the terms and conditions of the Creative Commons Attribution (CC BY) license (http://creativecommons.org/licenses/by/4.0/).
Share and Cite
Cengiz, T.M.; Tabari, H.; Onyutha, C.; Kisi, O. Combined Use of Graphical and Statistical Approaches for Analyzing Historical Precipitation Changes in the Black Sea Region of Turkey. Water 2020, 12, 705. https://doi.org/10.3390/w12030705
Cengiz TM, Tabari H, Onyutha C, Kisi O. Combined Use of Graphical and Statistical Approaches for Analyzing Historical Precipitation Changes in the Black Sea Region of Turkey. Water. 2020; 12(3):705. https://doi.org/10.3390/w12030705
Chicago/Turabian StyleCengiz, Taner Mustafa, Hossein Tabari, Charles Onyutha, and Ozgur Kisi. 2020. "Combined Use of Graphical and Statistical Approaches for Analyzing Historical Precipitation Changes in the Black Sea Region of Turkey" Water 12, no. 3: 705. https://doi.org/10.3390/w12030705
APA StyleCengiz, T. M., Tabari, H., Onyutha, C., & Kisi, O. (2020). Combined Use of Graphical and Statistical Approaches for Analyzing Historical Precipitation Changes in the Black Sea Region of Turkey. Water, 12(3), 705. https://doi.org/10.3390/w12030705