Article

Towards an Assessment of the Ephemeral Gully Erosion Potential in Greece Using Google Earth

1
Remote Sensing Engineer, Mesimeri P.O. Box 413, 57500 Epanomi, Greece
2
European Commission, Joint Research Centre (JRC), 21027 Ispra, Italy
*
Author to whom correspondence should be addressed.
Water 2020, 12(2), 603; https://doi.org/10.3390/w12020603
Submission received: 10 February 2020 / Revised: 19 February 2020 / Accepted: 20 February 2020 / Published: 23 February 2020
(This article belongs to the Special Issue The Effect of Hydrology on Soil Erosion)

Abstract

:
Gully erosion may cause considerable soil losses and produce large volumes of sediment. The aim of this study was to perform a preliminary assessment on the presence of ephemeral gullies in Greece by sampling representative cultivated fields in 100 sites randomly distributed throughout the country. The almost 30-ha sampling surfaces were examined with visual interpretation of multi-temporal imagery from the online Google Earth for the period 2002–2019. In parallel, rill and sheet erosion signs, land uses, and presence of terraces and other anti-erosion features, were recorded within every sample. One hundred fifty-three ephemeral gullies were identified in total, inside 22 examined agricultural surfaces. The mean length of the gullies was 55.6 m, with an average slope degree of 9.7%. Vineyards showed the largest proportion of gullies followed by olive groves and arable land, while pastures exhibited limited presence of gullies. Spatial clusters of high gully severity were observed in the north and east of the country. In 77% of the surfaces with gullies, there were no terraces, although most of these surfaces were situated in slopes higher than 8%. It was the first time to use visual interpretation with Google Earth image time-series on a country scale producing a gully erosion inventory. Soil conservation practices such as contour farming and terraces could mitigate the risk of gully erosion in agricultural areas.

1. Introduction

Gully erosion is a key process of land degradation and desertification posing a significant threat to ecosystem services [1]. Gullies are defined as erosional channels deeper than 0.5 m, caused by concentrated water flow during and immediately after a heavy rainfall event [2]. Gullies have dynamic character, affected by topography, soil properties, vegetation cover, climate, and land management. Topography and soil properties are practically constant in time, whereas vegetation cover and land management may vary with time. Erosion-prone conditions include erodible soils, soft subsurface, or instable slopes; though, anthropogenic influences are usually the main driver of gully erosion potential [3]. Understanding the dynamics of this phenomenon in agricultural lands (especially, with regard to climate or land use changes) is important for land managers in order to assess the potential of gully initiation in a specific area of interest [4].
Verstraeten and Poesen (1999) [5] argue that gully erosion contributes significantly to soil degradation in different landscapes by: (1) causing considerable soil losses as they allow massive movement of soil particles by overland flow; (2) producing large sediment volumes (as an immediate result of massive soil loss); and (3) expanding connectivity in the landscape, thus increasing the potential of sediment transfer to watercourses, with respective acceleration of known offsite erosion effects [4]. Gullies are evidence of past intense soil erosion processes causing landscape changes, but also indicators of the impact of environmental change, caused by the geomorphological characteristics of the landscape, land use changes and extreme climatic events [6].
Gullies can be formed in any land use and if they are well-established, they are called ‘permanent gullies’ or ‘classic gullies’ [4,7]. They can also be formed in agricultural lands and be removed by tillage operations (farmers can easily refill them), so they are called ‘ephemeral gullies’ [8]. Usually, ephemeral gullies are less than 0.5 m deep, their formation starts with small erosional channels and then accelerates (or aggravates) with subsequent runoff events [9].
As the soil losses due to gullies are extremely high [10], there is a high interest to investigate gullies as part of environmental change, soil erosion risk, land degradation, and record of the past [11]. Scientists recognize that soil losses due to ephemeral gullies may be significantly greater than those losses attributable to sheet and rill erosion [12]. Many ephemeral gullies that develop within croplands are tillage induced, as farmers tend to redistribute the soil during plowing [13]. In case of an eventual reactivation of the gully during overland flow events, water runoff removes this additional soil material, thus reducing topsoil thickness over the entire tilled portion of the landscape [14]. Once the gullies develop, they form erosional channels, grow larger, facilitate water runoff, and accelerate water erosion rates in a feedback loop [10].
The most known conceptual model specifically developed for ephemeral gully erosion estimation is the ephemeral gully erosion model (EGEM) [15]. Several attempts have contributed to gully erosion detection and mapping using remote sensing and geographic information systems (GIS). For example, Rundquist (2002) [16] determined a ranking schema of fields for potential development of ephemeral gullies by using multi-temporal remote-sensing maps of fractional vegetation cover extracted from 16-day composites of normalized difference vegetation index (NDVI) layers, together with precipitation figures and topographic data. Hessel and Van Asch (2003) [17] studied the rolling hills region of the Chinese Loess Plateau, an area with one of the highest erosion rates on earth using the Limburg soil erosion model (LISEM) [18]. Although LISEM is a mechanistic model originally developed for storm events, the authors adapted it with regard to the positioning of existing gully heads, thus enabling it to assess the amount of material produced by permanent gullies (but only) during runoff events.
More recently, Nwakwasi (2018) [19] predicted gully erosion rates and identified the major factors contributing to gully erosion development in Southeastern Nigeria, using the negative binomial regression model. It was revealed that heavy rainfalls, extractive industries, and excess farming activities were the most influencing factors for gully initiation and formation. Zabihi et al. (2018) [20] used three bivariate statistical predictive models of susceptibility of a site to gully erosion from elevation, slope aspect, slope degree, slope length, topographical wetness index (TWI), plan curvature, profile curvature, land use, lithology, distance from river, drainage density, and distance from a road. All the models achieved prediction by about 80%. Finally, Domazetović et al. (2019) [21] developed a GIS using multicriteria analysis (namely, the GAMA model), allowing at the same time, automation and simplification of multicriteria grouping, weighting, coefficient assignment, and aggregation, towards a generic gully susceptibility modelling. The model has been tested in Pag Island, Croatia, with promising results.
Taking 2010 as a reference year, Panagos et al. (2015) [22] have put Greece among the five European countries with the highest risk for erosion (4.13 t ha−1 yr−1), higher than the pan European mean (2.46 t ha−1 yr−1). However, quantitative erosion studies in Greece have focused mainly to the sheet erosion form, neglecting so far, the magnitude and distribution of rill and gully formations throughout the country [23,24,25]. Few studies have also reported coastal erosion problems [26,27], while pan-European assessments addressed the wind erosion problem [28]. According to an outdated (before 1986) rough estimation by A. Vousaros, in Greece, there were over 800 active torrents transporting more than 30 Million m3 of solid material [29].
Greece was included in a Mediterranean-wide study on determination of channel initiation thresholds for gully erosion according to the geomorphic and power-law equations [30]. The field study sites were located in Lesvos Island and targeted to permanent gullies found in rangelands; grazing is one of the most common contributors to soil erosion in Greece, especially in the islands. The thresholds for Lesvos follow a significantly lower regression slope and a significantly higher intercept than the threshold determined for the other two concurrent Mediterranean studies (Alentejo, Portugal and Sierra de Gata, Spain); this fact indicates less sensitivity in Lesvos than the other sites. It is noted, however, that many of the gullies detected in the Lesvos study were initiated by landslides, as identified from their typical morphology [30].
On the contrary to the lack of enough scientific research on the gully erosion problem in Greece, there is adequate evidence on the significance of gully erosion in the country, including articles in local newspapers and magazines of environmental or societal concern, several items of gray literature, and some reference in legal documents. Most of these items are related either to coastal erosion or permanent gullies. The legal references are associated to private or public works, where evidence of gully formulations is listed among reporting parameters prior to acceptance.
The main goal of this study was to assess ephemeral gully erosion potential in the agricultural lands of Greece. For this purpose, the agricultural land was sampled throughout the country, focusing on ephemeral gullies. The sampled surfaces were examined with visual interpretation of multi-temporal imagery available on Google Earth.
Use of Google Earth has been limited in gully erosion studies up until now. Gilad et al. (2012) [31] mapped gullies within only natural lands contributing sediment to the Great Barrier Reef in Australia and Boardman (2016) [32] studied gully erosion at the agricultural field level in Western Rother valley in the southern part of England. In practice, only the latter focuses on agricultural lands, while it was limited at a small geographic scale (60 km2). In the current study, we propose a methodology for gully erosion estimation in agricultural lands on a country scale.

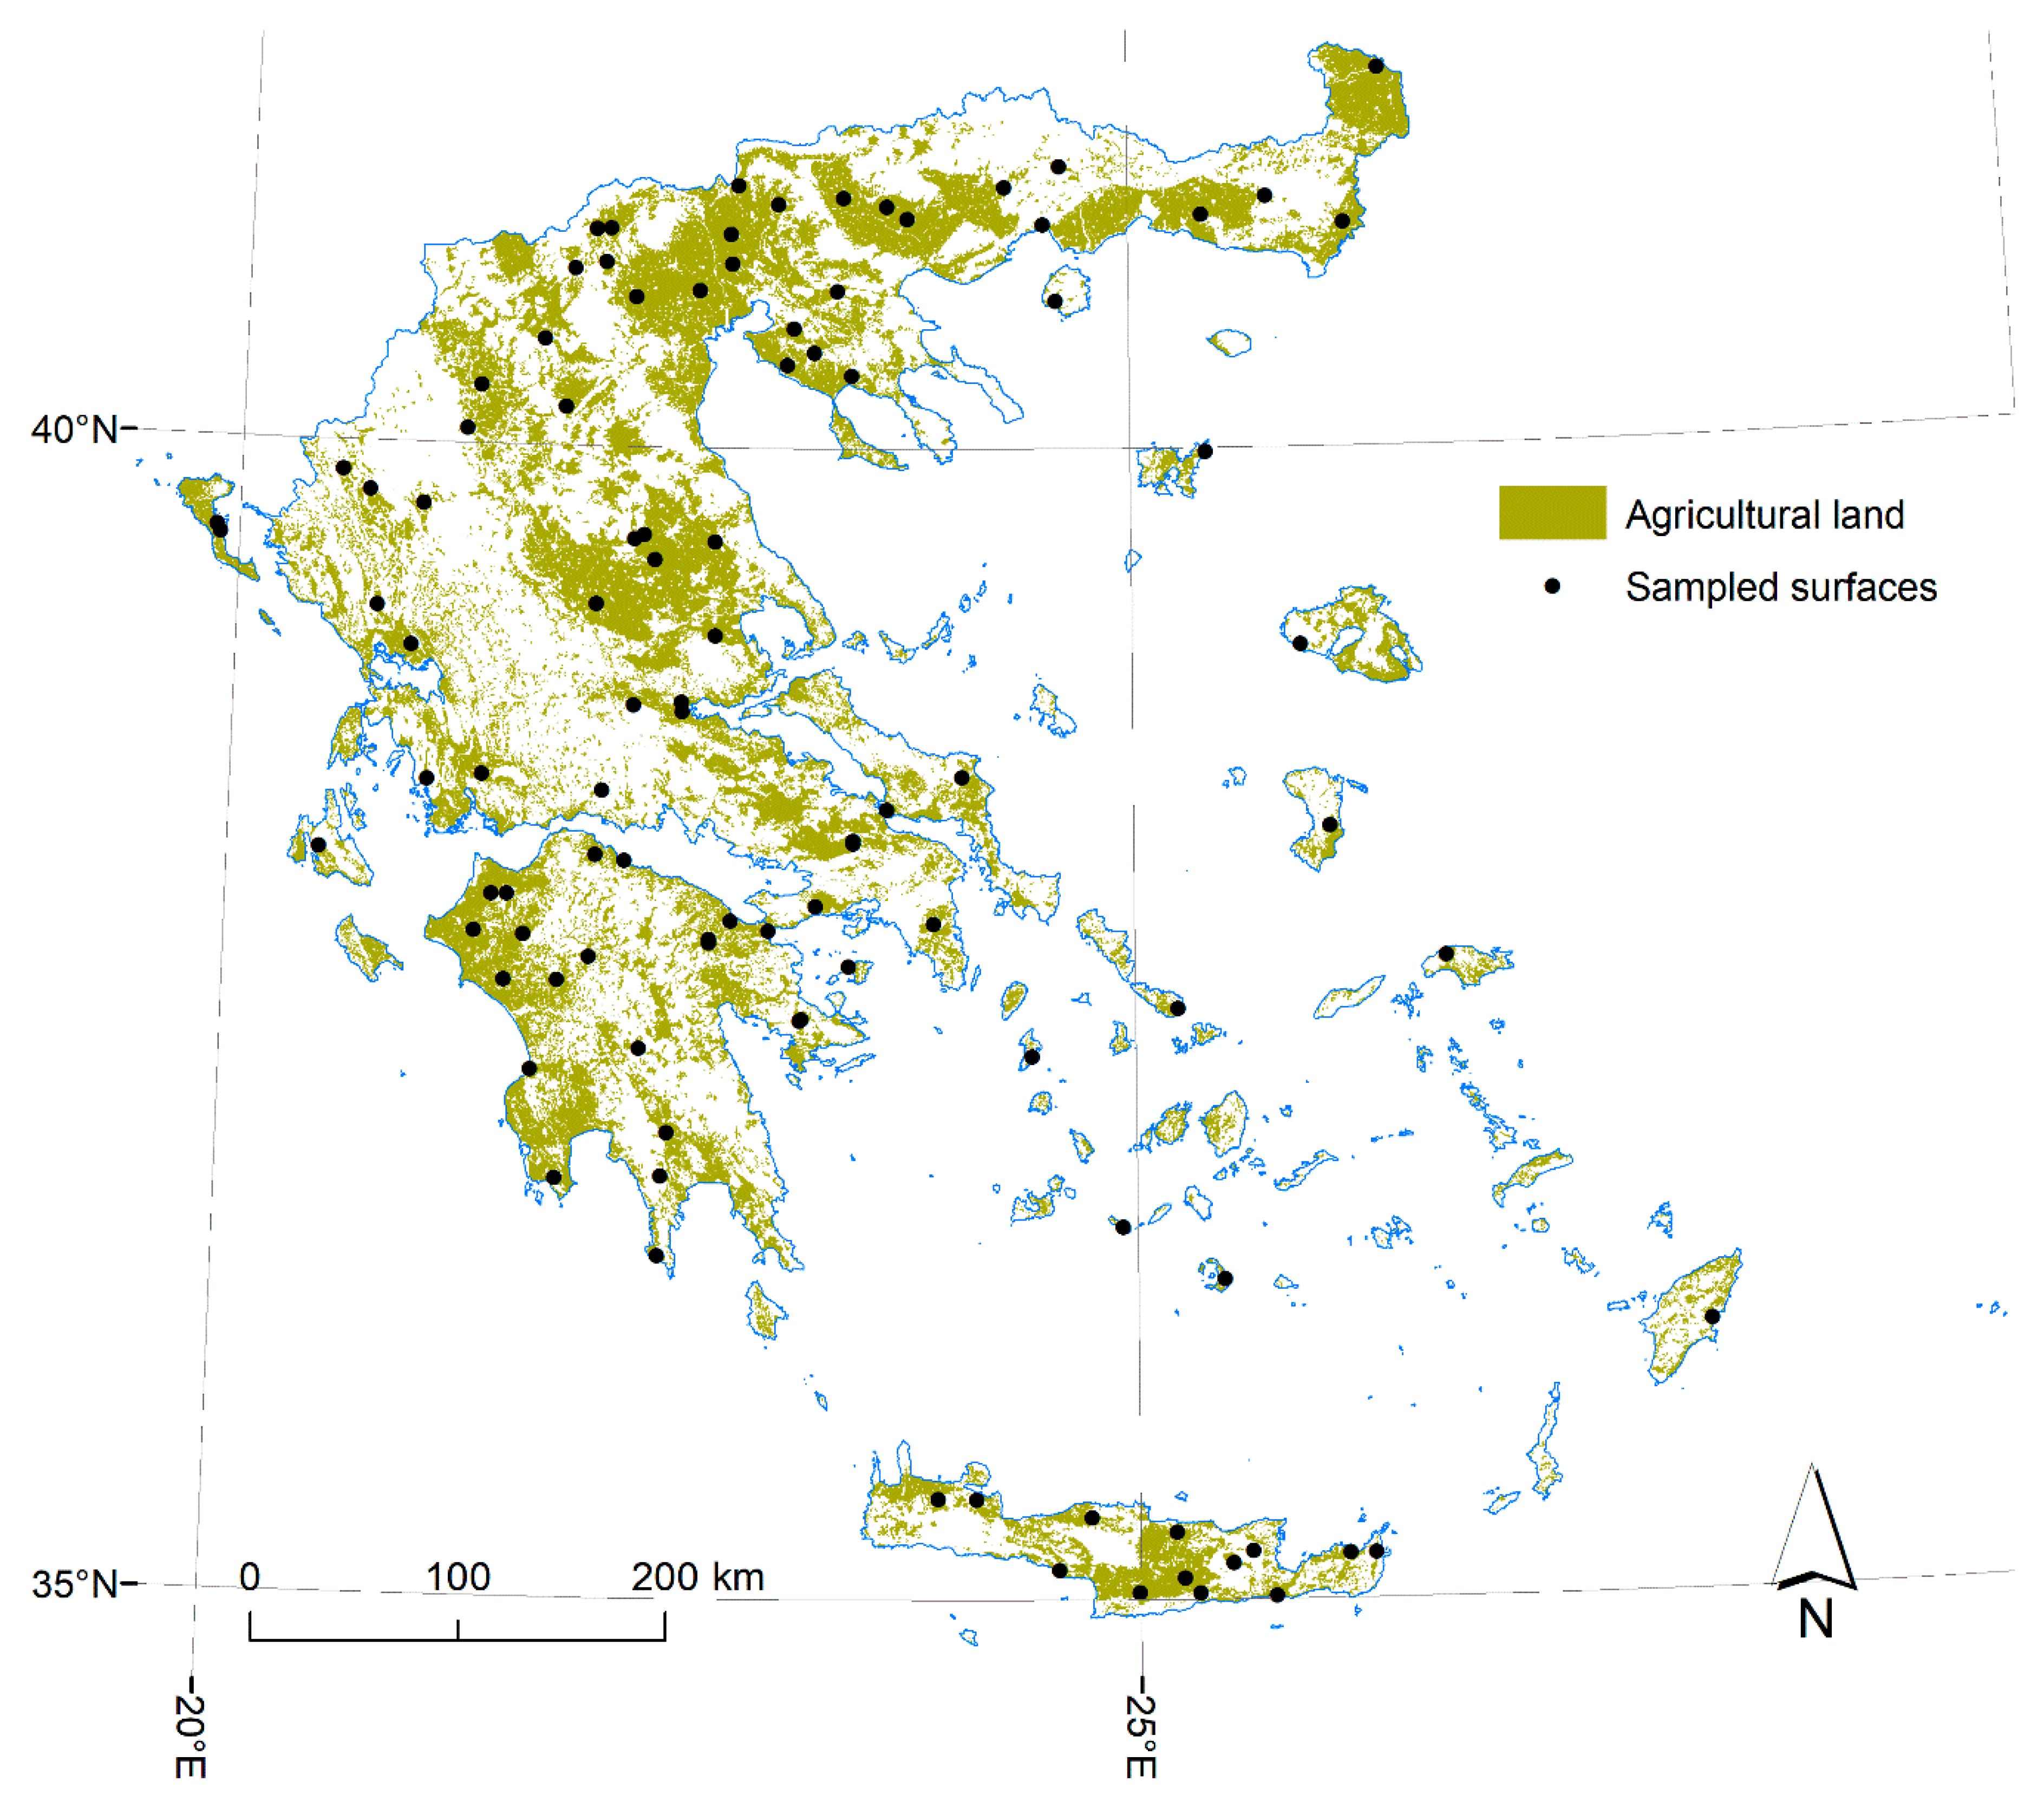
2. Materials and Methods

One hundred surfaces were selected throughout the agricultural lands of Greece using a random number generator of x,y coordinates within the country’s outline. Then, circular surfaces of 300 m radius were traced and the contained surfaces (each having an extent of 28.3 ha) were examined for signs of ephemeral gullies. It was considered that a 600-m diameter circle was adequate for detecting and identifying an entire gully or part of it.
Provided that the agricultural lands in Greece cover an extent of 5,170,968 ha (source: CORINE Land Cover, 2018), the total sampled agricultural surfaces account for about 0.055%, with all agricultural land use categories included in the sample (Figure 1). According to the CORINE nomenclature, agricultural lands correspond to the 2nd class of the 1st level classification. Random sampling has also been employed by Gilad et al. (2012) [31], which though was dedicated exclusively to natural lands; moreover, it was calibrated with geostatistical analysis of drainage network data in order to exclude areas where gully formation potential was lower.
According to Marzolff et al. (2011) [33], short-term data collection for gullies are not representative of longer-term gully development and demonstrate the necessity for medium- to long-term monitoring. In this research, the detection and recognition of the ephemeral gullies was based on visual interpretation of diachronic Google Earth (GE) imagery, ranging from 2002 to 2019 for most of the samples. The frequency of available GE image scenes was higher in the later years and mostly after 2010. GE comprises a time-series repository of archived, very high-resolution satellite imagery (usually around 0.5 m, such as WorldView, Pleiades, GeoEye, etc.) in visible mode (RGB), available online. The selected samples contained from 4 up to 61 images, acquired on different dates, averaging at about 15 images per sample. GE provides the necessary spatial detail and temporal sequence, to assess gullies’ presence and evolution; for example, to indicate channel initiation, to measure gully length, or to distinguish ephemeral from permanent gullies.
As users of GE know, the time series covering a specific site is never complete, with many images missing due mainly to cloudy days. However, this fact would not affect seriously the high possibility of capturing existing ephemeral gullies, because the latter remain for a long period before they disappear by the farmers’ soil tillage operations. This is especially true for the field preparation period, which might be quite long before seeding. In addition, the average number of images per sample (15 images) and the variety in season of image acquisition further empowers the possibility to capture ephemeral gullies before they disappear. Certainly, the possibility of some missed ephemeral gullies due to discontinuity of monitoring renders the true number of ephemeral gullies higher than the detected ones.
The ephemeral gullies were identified only as features within agricultural fields; gullies found between agricultural fields and natural lands or clearly inside natural land patches were not recorded. The identification capacity depended on the clarity of each image, thus rendering the scale of interpretation to vary between 50 and 100 m in terms of an ‘eye altitude’. Eye altitude is the estimated altitude at which the observer is supposed to ‘fly’ over the imaged area. The visual interpretation criteria for indicating possible ephemeral gullies within agricultural fields were like those followed by Boardman (2016) [32]; specifically:
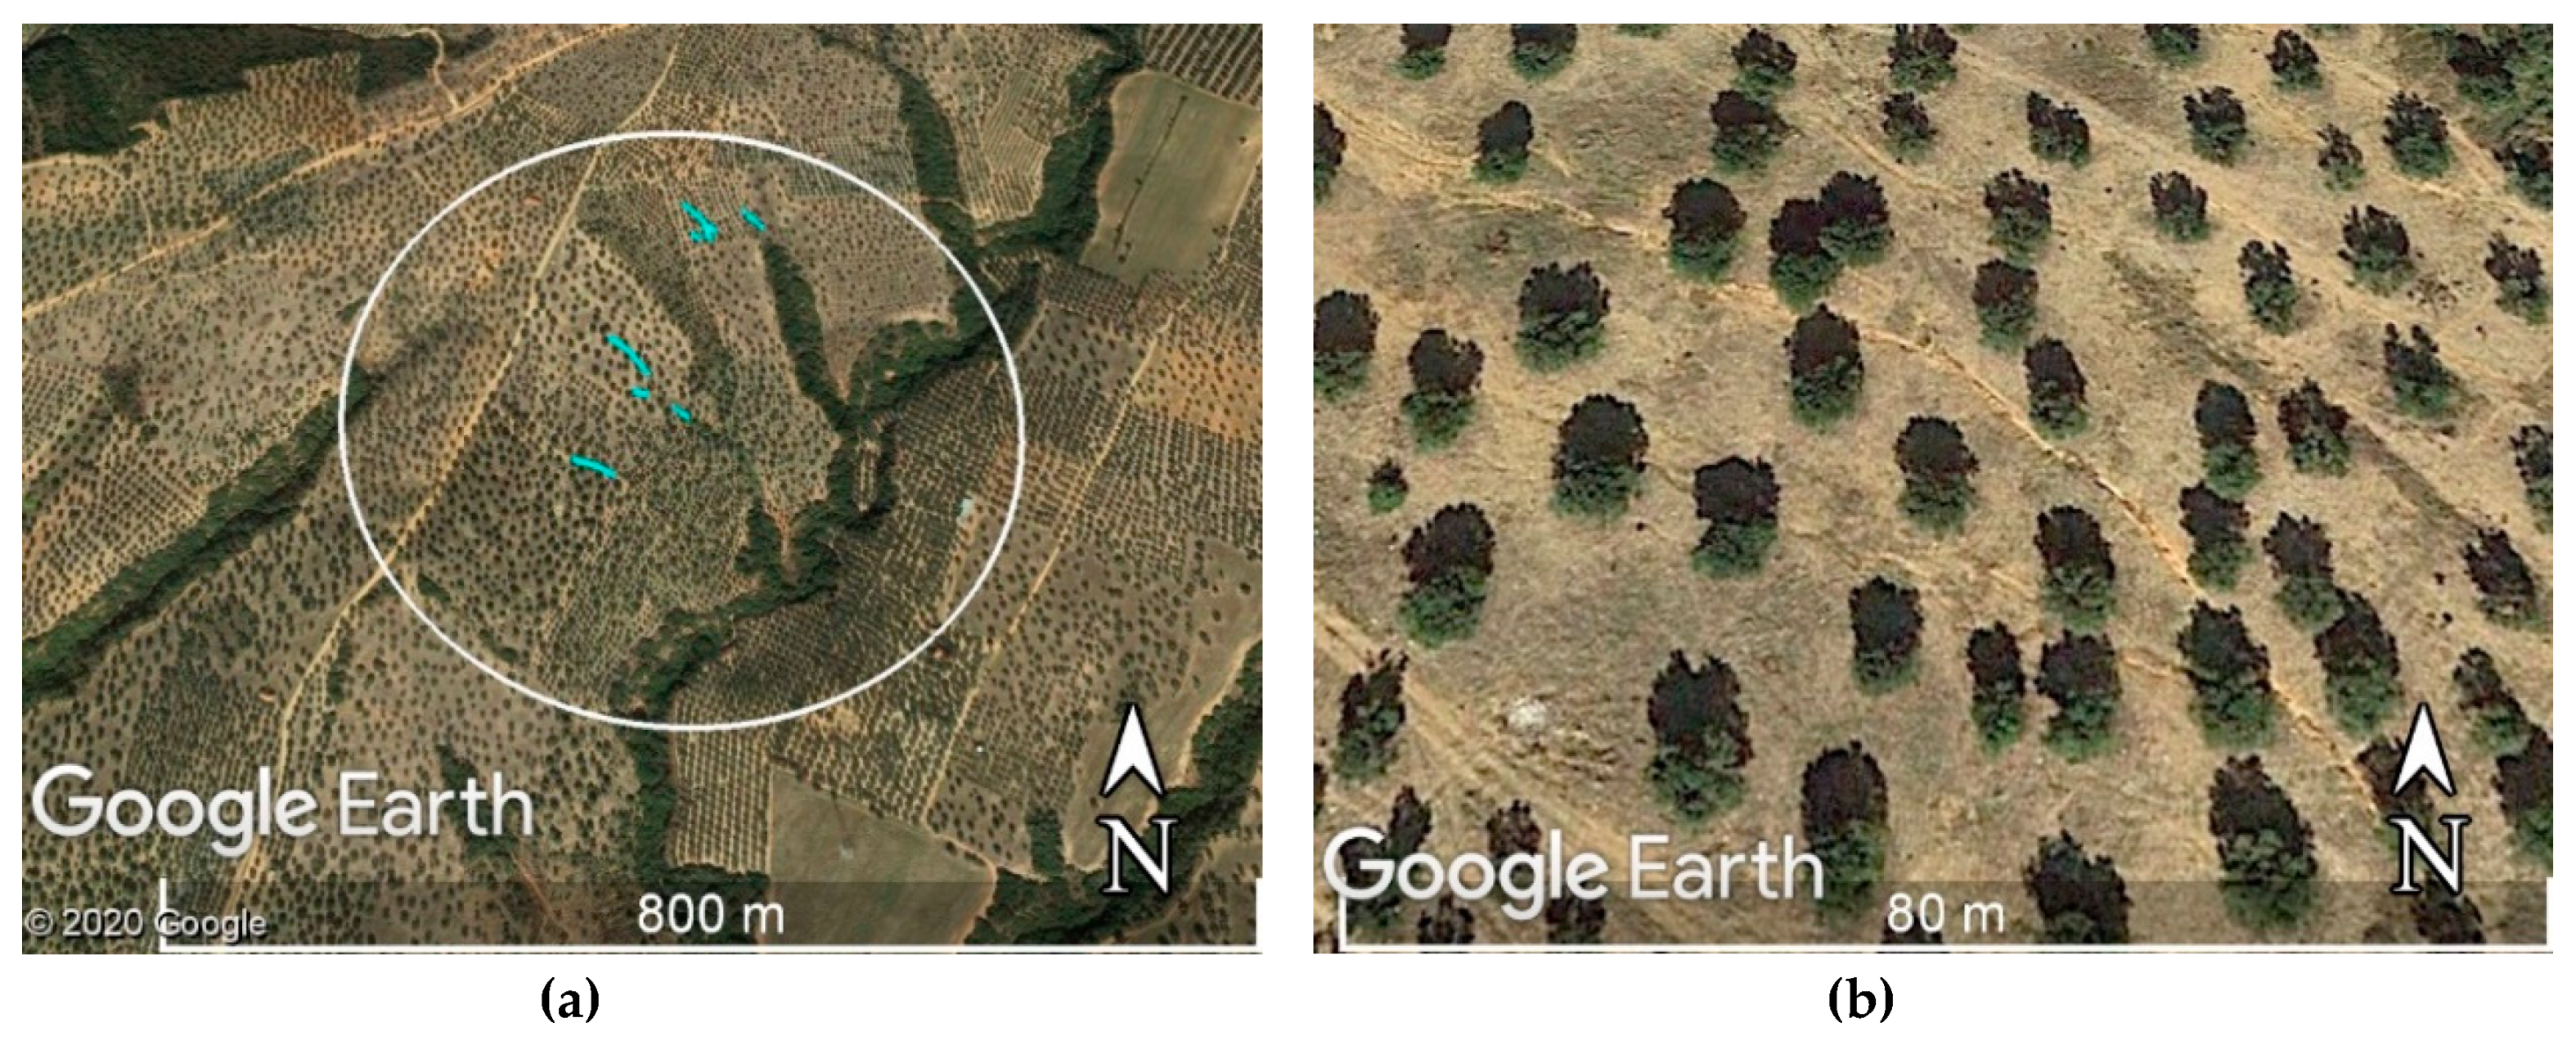
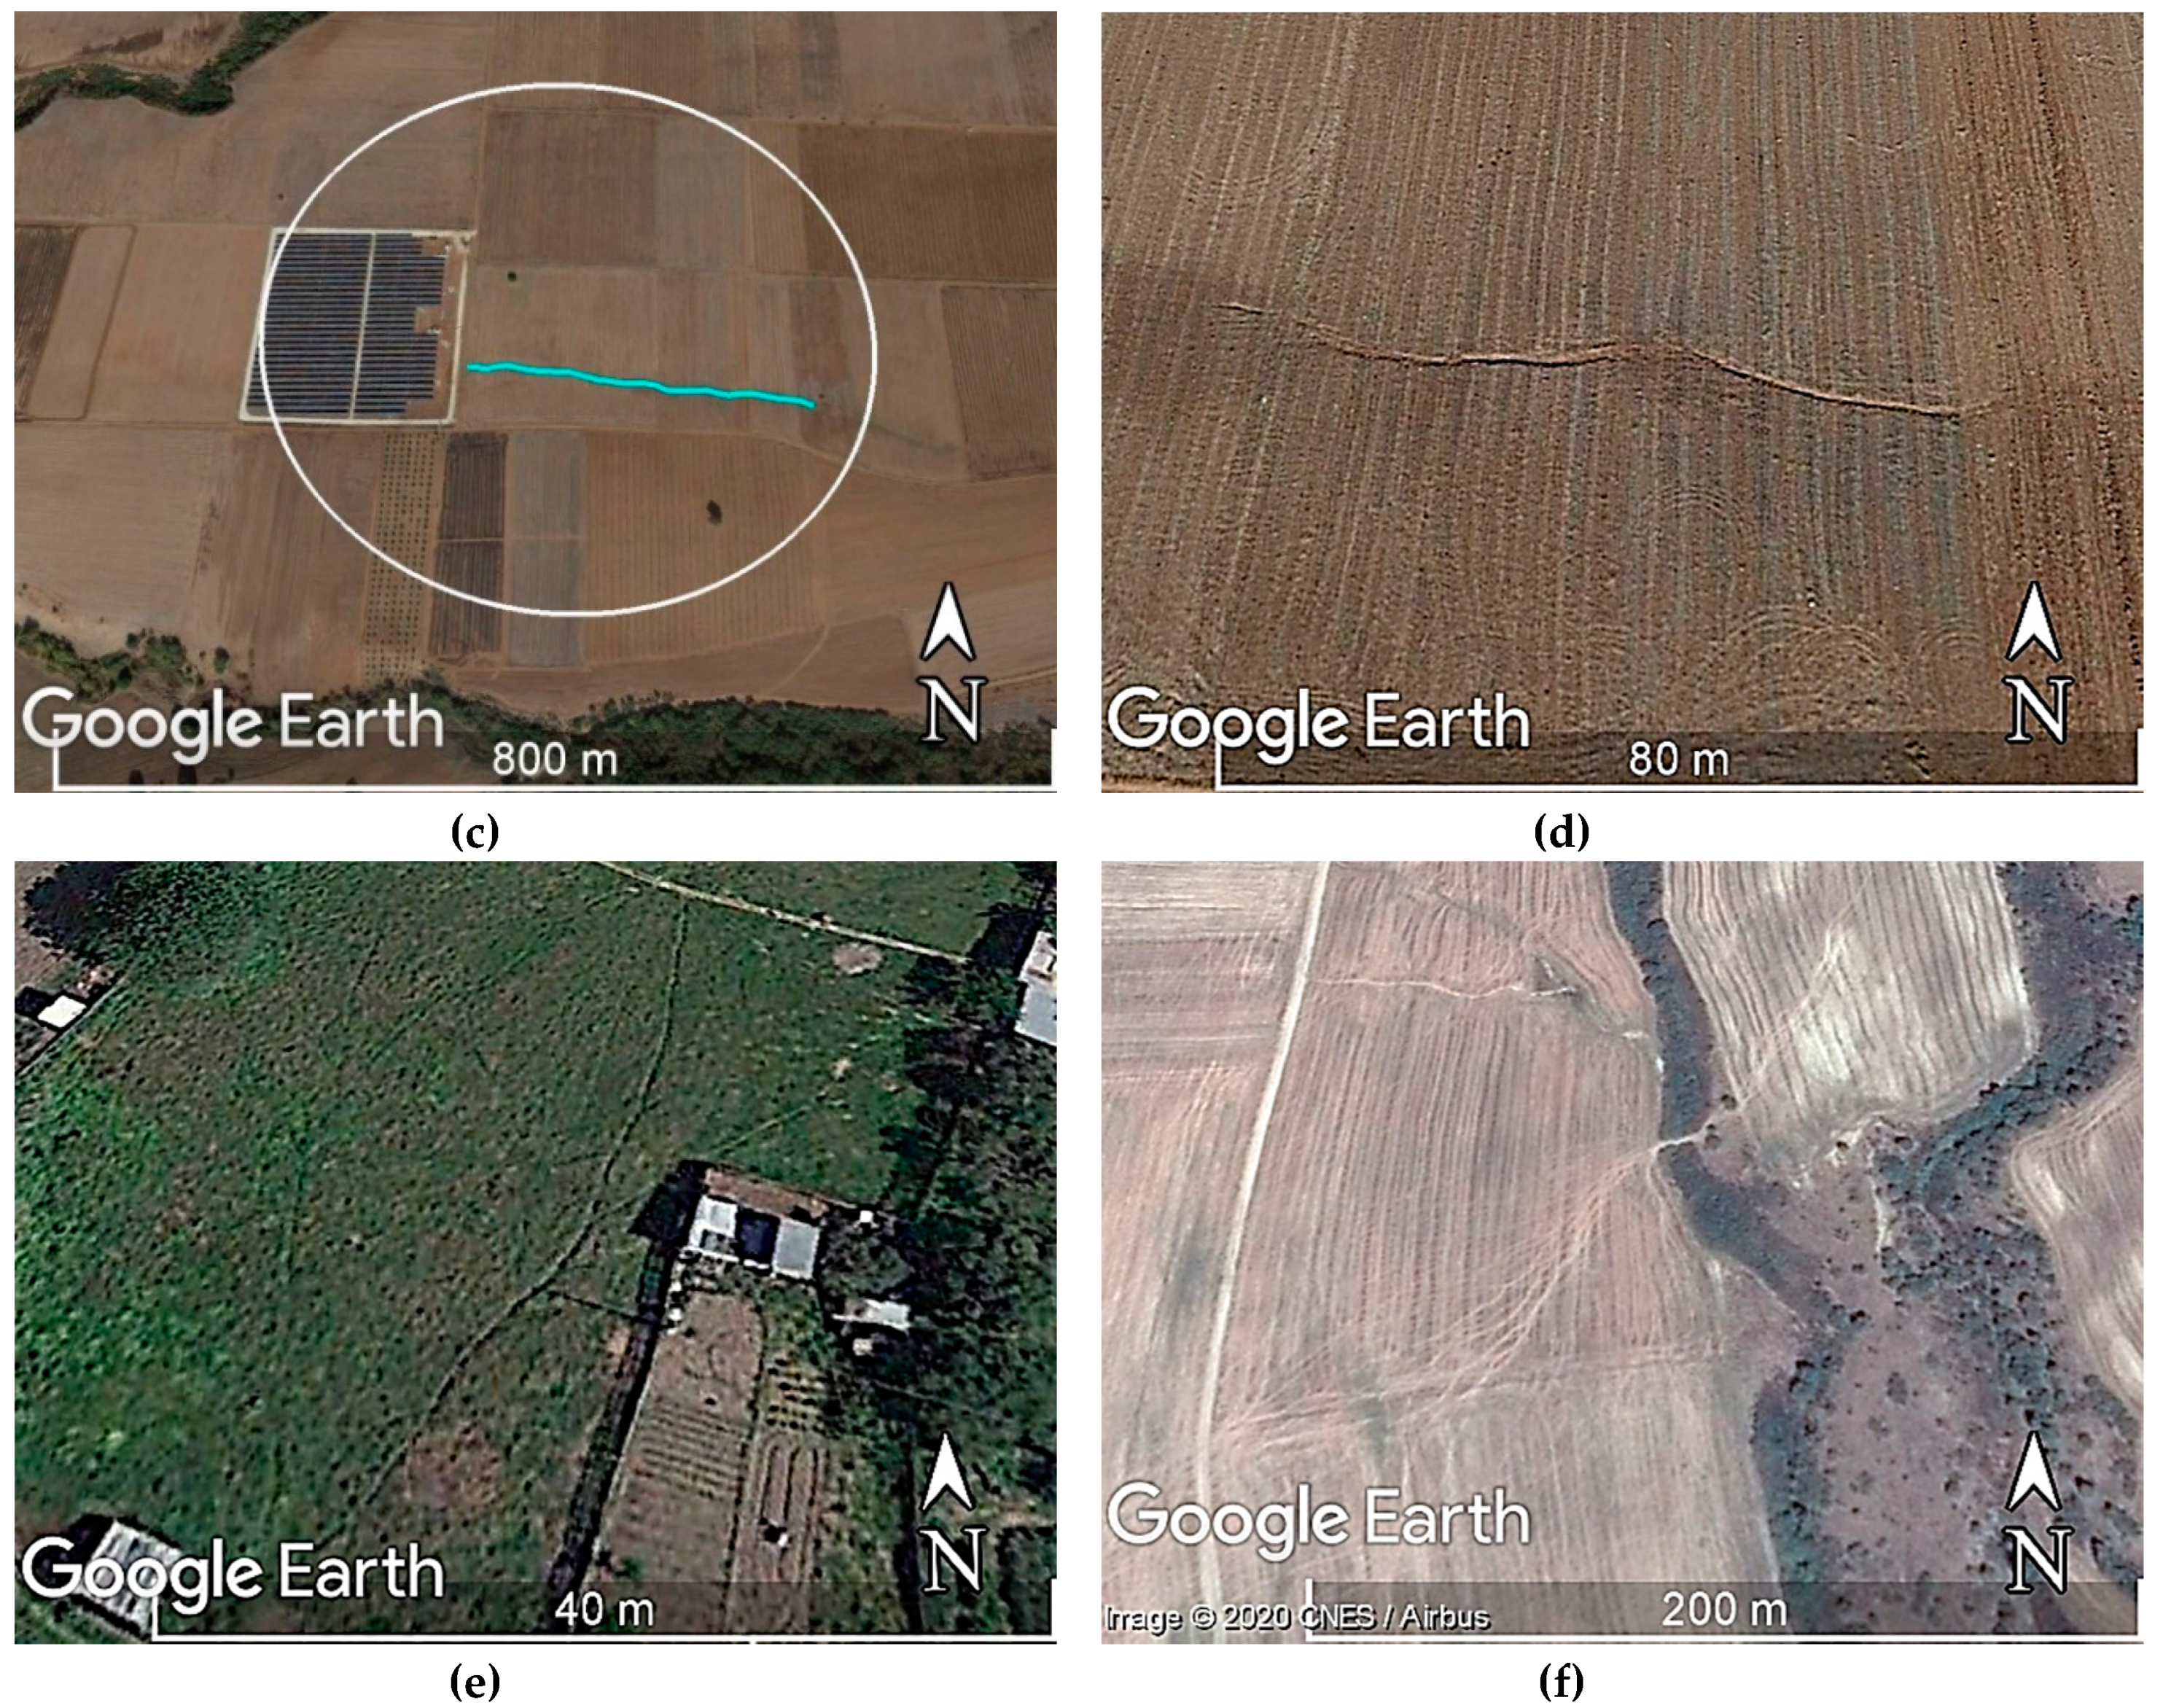
  • Curved or straight linear segments inside agricultural fields, darker or lighter from their surroundings.
  • Presence of natural vegetation along with linear features, either meeting or not the drainage network.
Every identified ephemeral gully was digitized as a continuous linear feature in a GIS. Ephemeral gullies along the same flow path but interrupted even for a few meters, were digitized as separate features. In order to avoid misinterpretation, we paid attention to traces in the fields created by agricultural machinery, which are usually straight and parallel. On the contrary, gullies are usually curved and at random directions.
Together with the gullies, signs of rill and sheet erosion were also examined and recorded qualitatively, in four distinct grades: no sign, slight, moderate, and strong signs. Bodoque et al. (2011) [34] recognized the necessity of studying gully and sheet erosion types within the same context, due to their linkage in geomorphological terms. Finally, we also recorded other important features of interest, such as terraces and hedges, with erosion control characteristics.
In 20 cases, the original sampling surfaces were found to be out of agricultural land uses according to Google Earth (which is ideal for the recognition and identification of most land uses), although they were selected inside agricultural land use polygons according to the CORINE Land Cover. In all these cases, the sampling surfaces were shifted towards the closest agricultural area.
Using visual interpretation of the GE image time-series, we recorded and computed the following parameters per sampled surface (Figure 2):
  • Number of ephemeral gullies
  • Exact flow path of ephemeral gullies
  • Length of every ephemeral gully (in meters)
  • Averaged elevation (in meters)
  • Averaged slope degree (in %)
  • Signs and grade of rills
  • Signs and grade of sheet erosion
  • All land use categories (with visual interpretation on Google Earth)
  • The number of the GE images covering the sampled surface

3. Results

The results start with a section with descriptive statistics of the gully inventory (no. of signs, length, elevation, slope, etc.) followed by the geographical distribution. The third section uses advanced indexes (I Moran’s, Getis-Ord Gi, and Anselin Local Moran’s) to verify the possible biases in sampling and the representativeness of the inventory. The fourth section provides an analysis in relation to land use, topography, and conservation practices followed by possible gully erosion correlations to drainage network.

3.1. Descriptive Statistics

Twenty-two samples out of the 100 examined throughout the country, were detected with clearly formulated ephemeral gullies. The number of gullies identified within every sample varied from 1 to 35, with an average of 6.9 gullies per sample location, or 0.25 gullies per hectare. In total, we identified and mapped 153 distinct ephemeral gullies. The longest gully was found to be 379 m and the shortest 3.5 m, with an average gully length of 55. 6 m. The total length of gullies within every sample varied from 30.6 to 1174 m, while the average total length per sample was 386 m, or 13.6 m per hectare.
The elevation at which the gullies were found ranged from 14 to 568 m, with an average of 201.3 m; while the elevation of the entire sampled agricultural surfaces ranged from 5 to 962 m, with an average of 205.7 m. The slope degree of the sampled surfaces with gullies ranged from 1.8% to 28.7%, with an average of 9.7%; while the slope degree of all the sampled agricultural surfaces ranged from 0.2% to 35.7%, with an average of 9.4%.
Rill signs were identified in 130 cases in total. In most of them (108 samples), rills were classified as slight, in 20 samples as moderate, and in 2 samples as strong. In five samples out of 22 with gullies, there were no signs of rills. Inversely, in 27 cases, rills were found in samples without gullies. Sheet erosion signs were identified in 81 cases in total. In most of them (61 samples), sheet erosion was classified as strong, in 13 samples as moderate, and in 7 samples as slight. In eight samples out of 22 with gullies, there were no signs of sheet erosion. Inversely, in 23 cases, sheet erosion was identified in samples without gullies (Table 1).

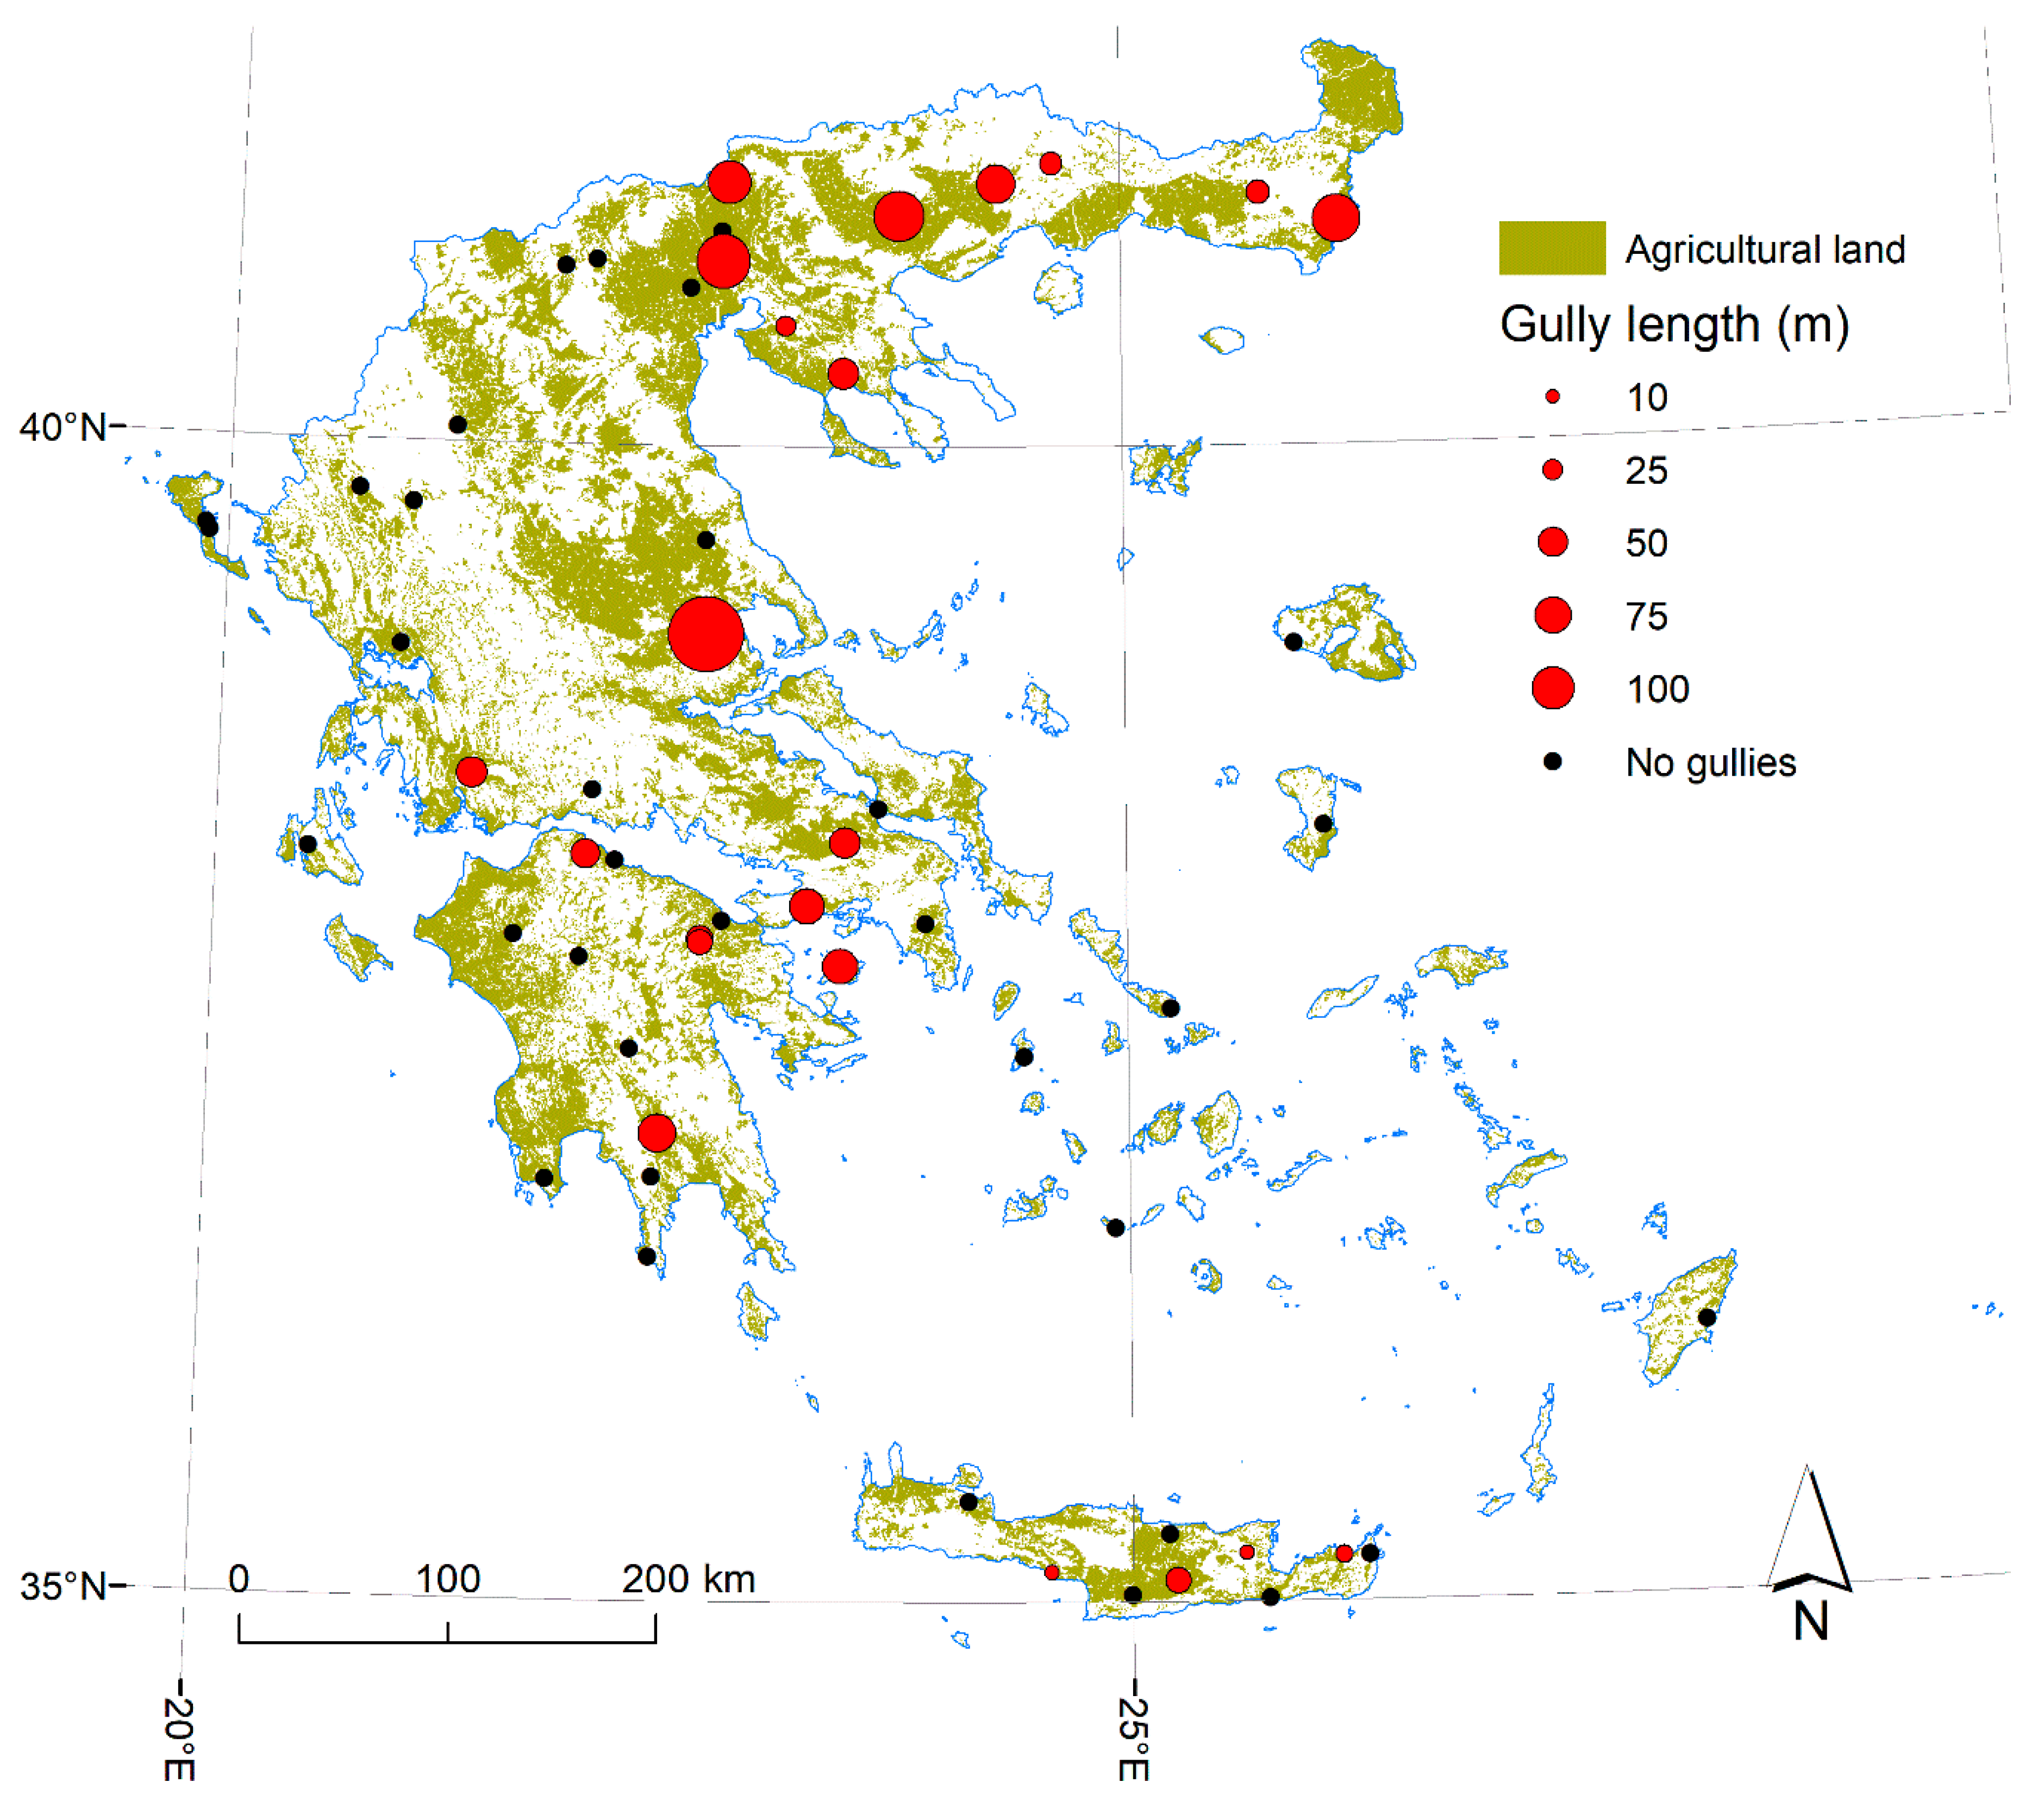
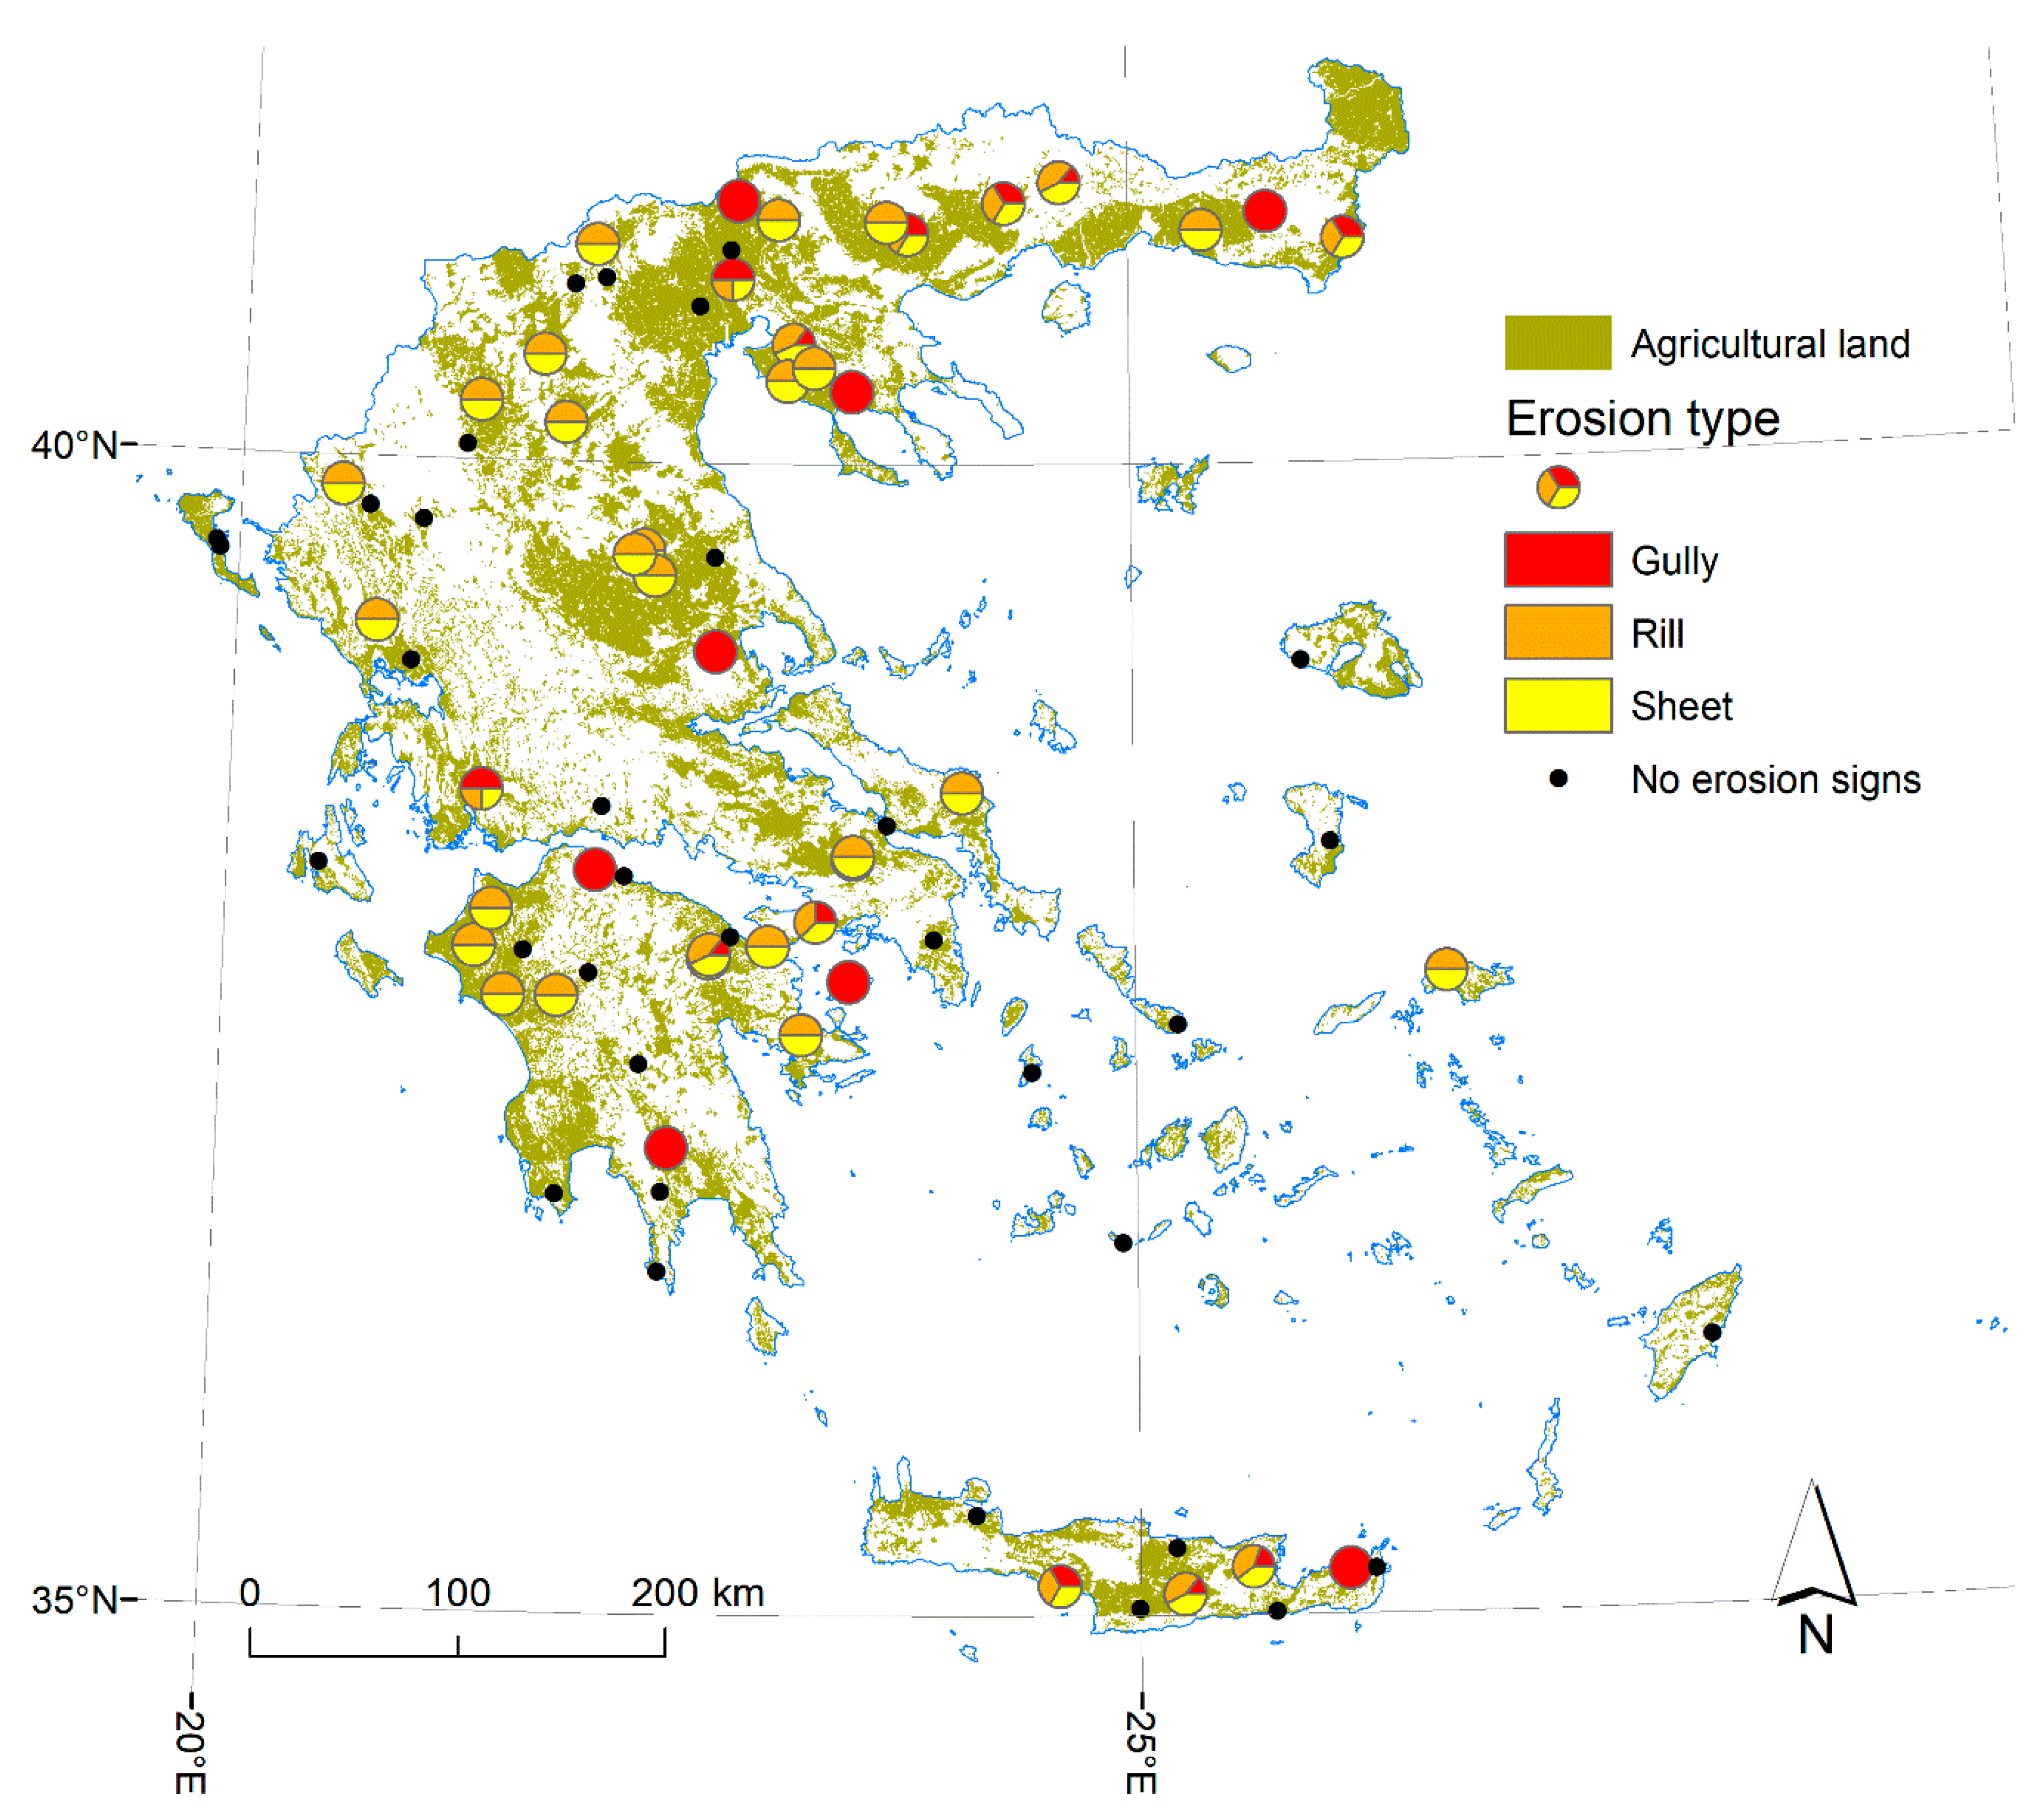
3.2. Geographic Distribution

In geographic terms, most of the random samples where gullies were found, were situated in the north part of the country (Central Macedonia, East Macedonia, and Thrace) and the east part of the country (Thessaly, Attica, Viotia, East Peloponnese, and East Crete), except the small islands of the Aegean. Moderate gully lengths (<100 m) were recorded in south Greece, whereas higher values in north Greece. We recorded the extreme gully length value (335 m long) close to Almyros town in Thessaly, central part of Greece (Figure 3).
In 66 samples, erosion was present either as gullies, rills, or sheet erosion sings. In 7 samples, gullies were found together with rills and no sheet erosion, in 4 samples gullies were found together with sheet erosion and no rills, and in 10 samples the three forms of erosion were present altogether. The latter category can be found in different sides of the country (Figure 4).

3.3. Geostatistical Analysis

The sampling scheme was verified to be unbiased by computing the spatial autocorrelation of the gully length variable. The I Moran’s index was used, resulting into −0.0114962, which indicates a random distribution of the samples [35]. This means that the observations were enough far apart, so as not to affect representativeness of the sampling scheme. The independence of the sampling dataset was visualized by two kinds of maps: (a) one identifying statistically significant hot and cold spots at the global level, using the Getis-Ord Gi* statistic; and (b) one identifying the statistically significant hot spots, cold spots, and spatial outliers at the local level, using the Anselin Local Moran’s I statistic. As it is shown, at the global level all the samples indicate non-significant differentiations, while at the local level only one high-low spatial outlier was detected (Figure 5).

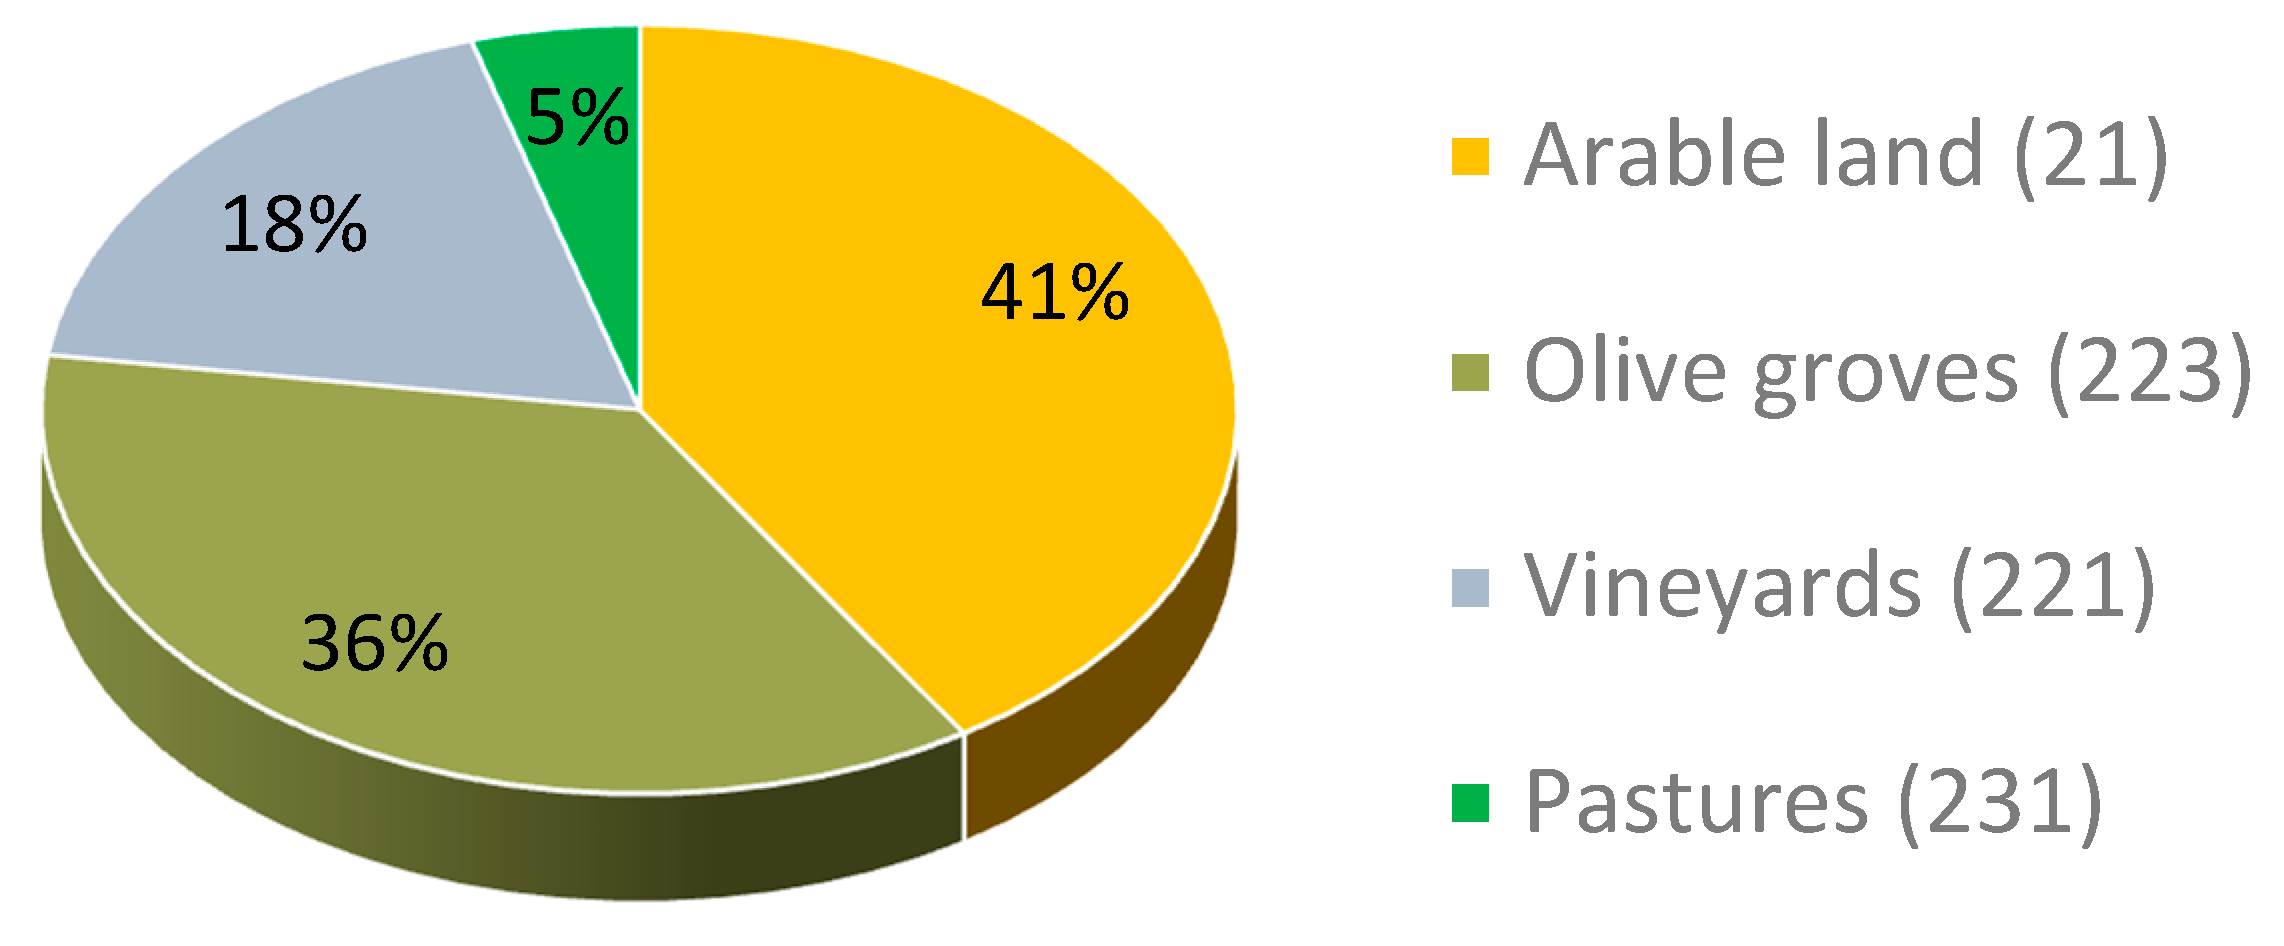
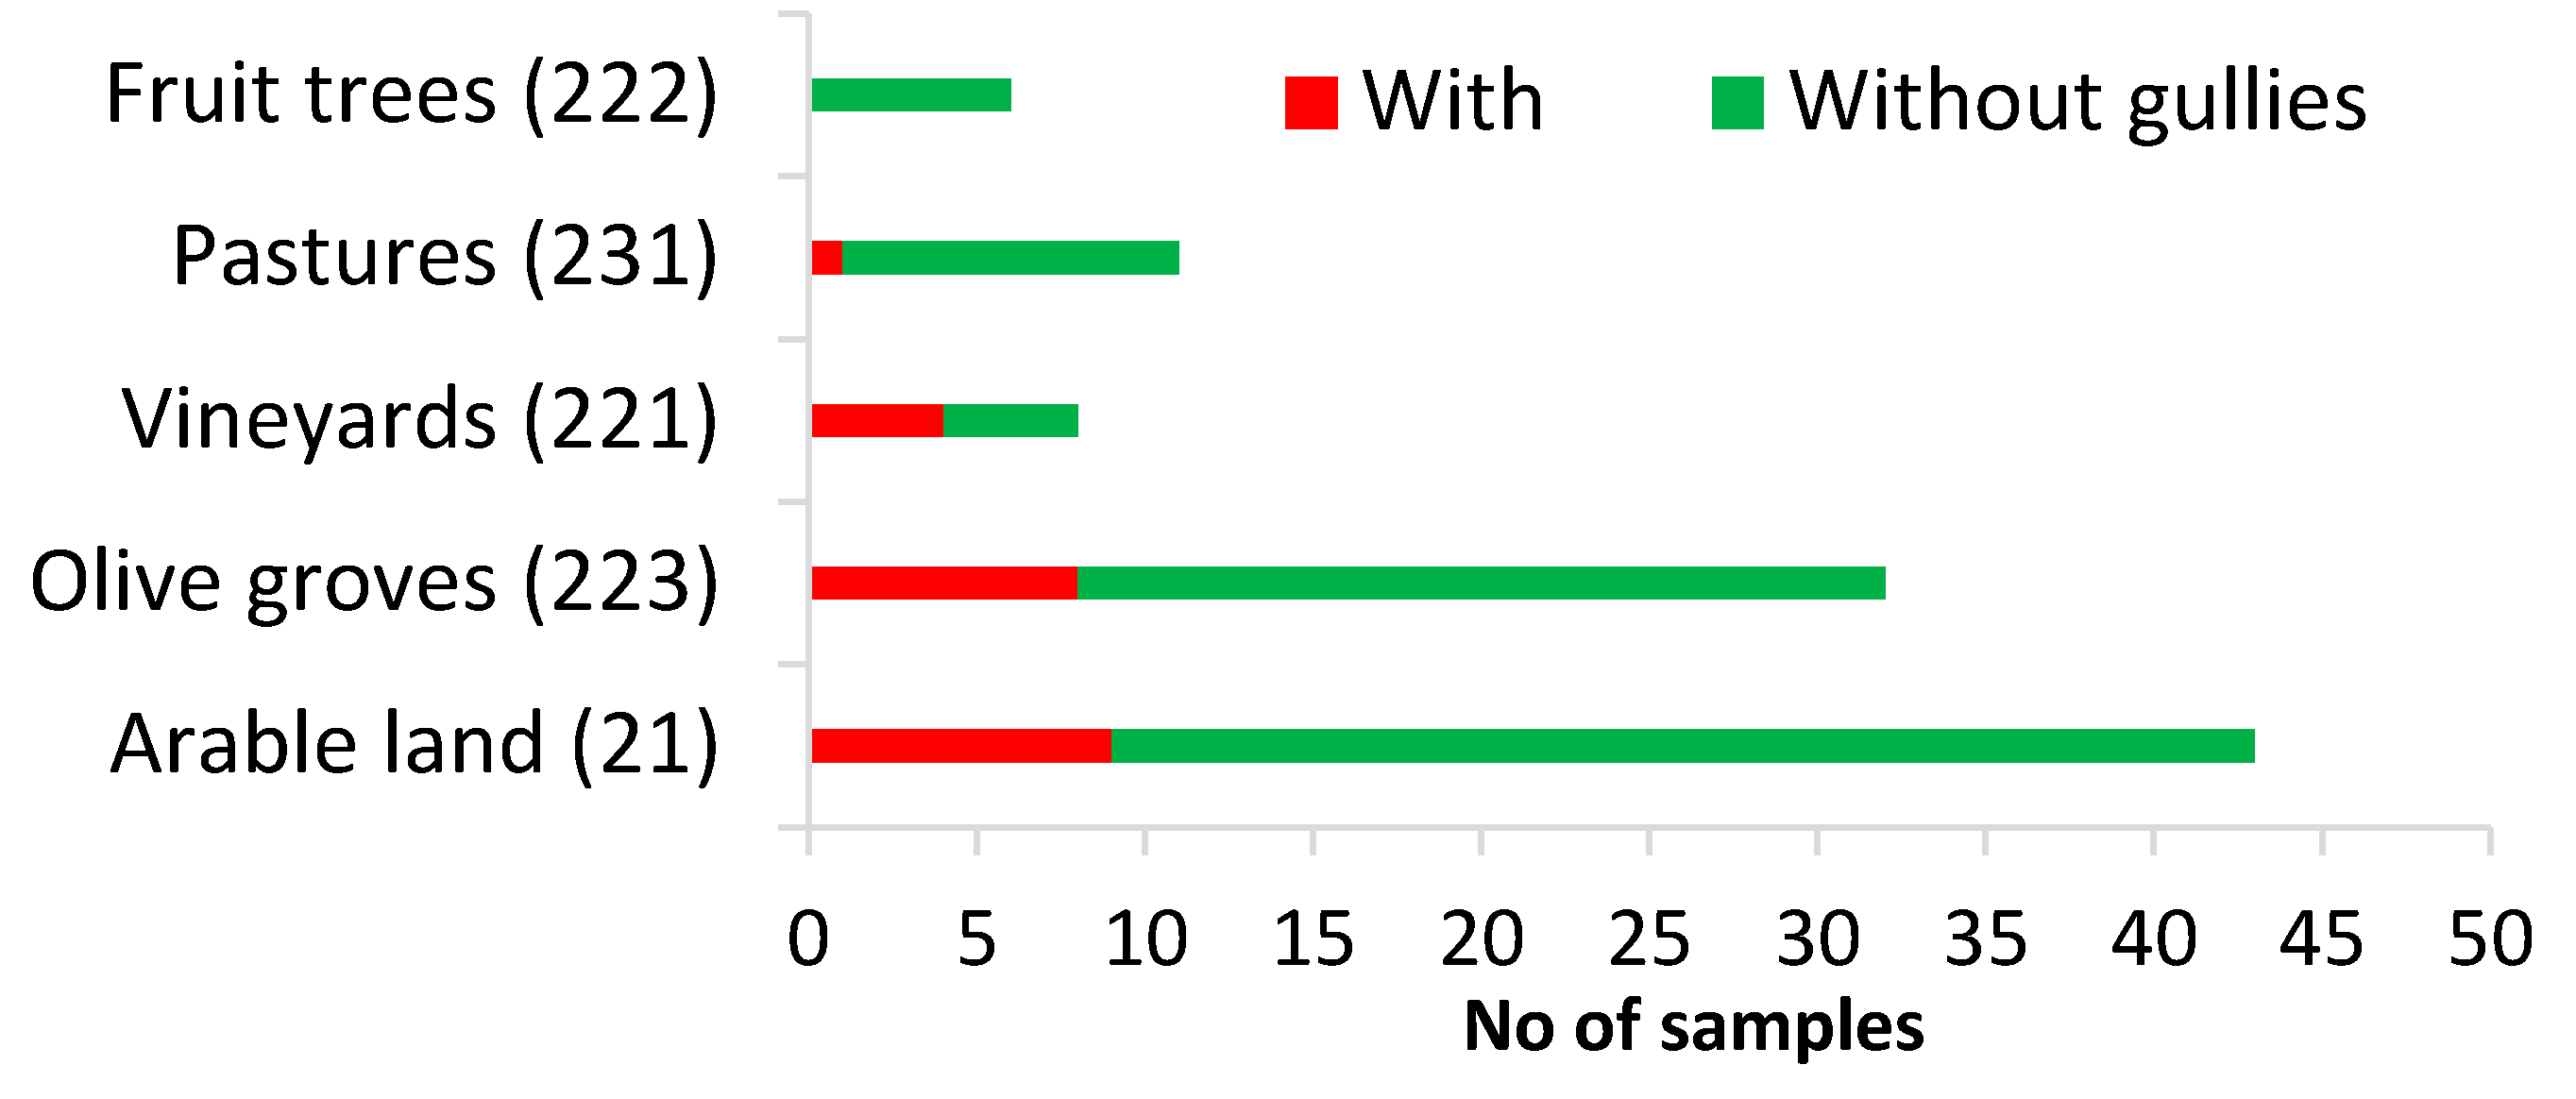
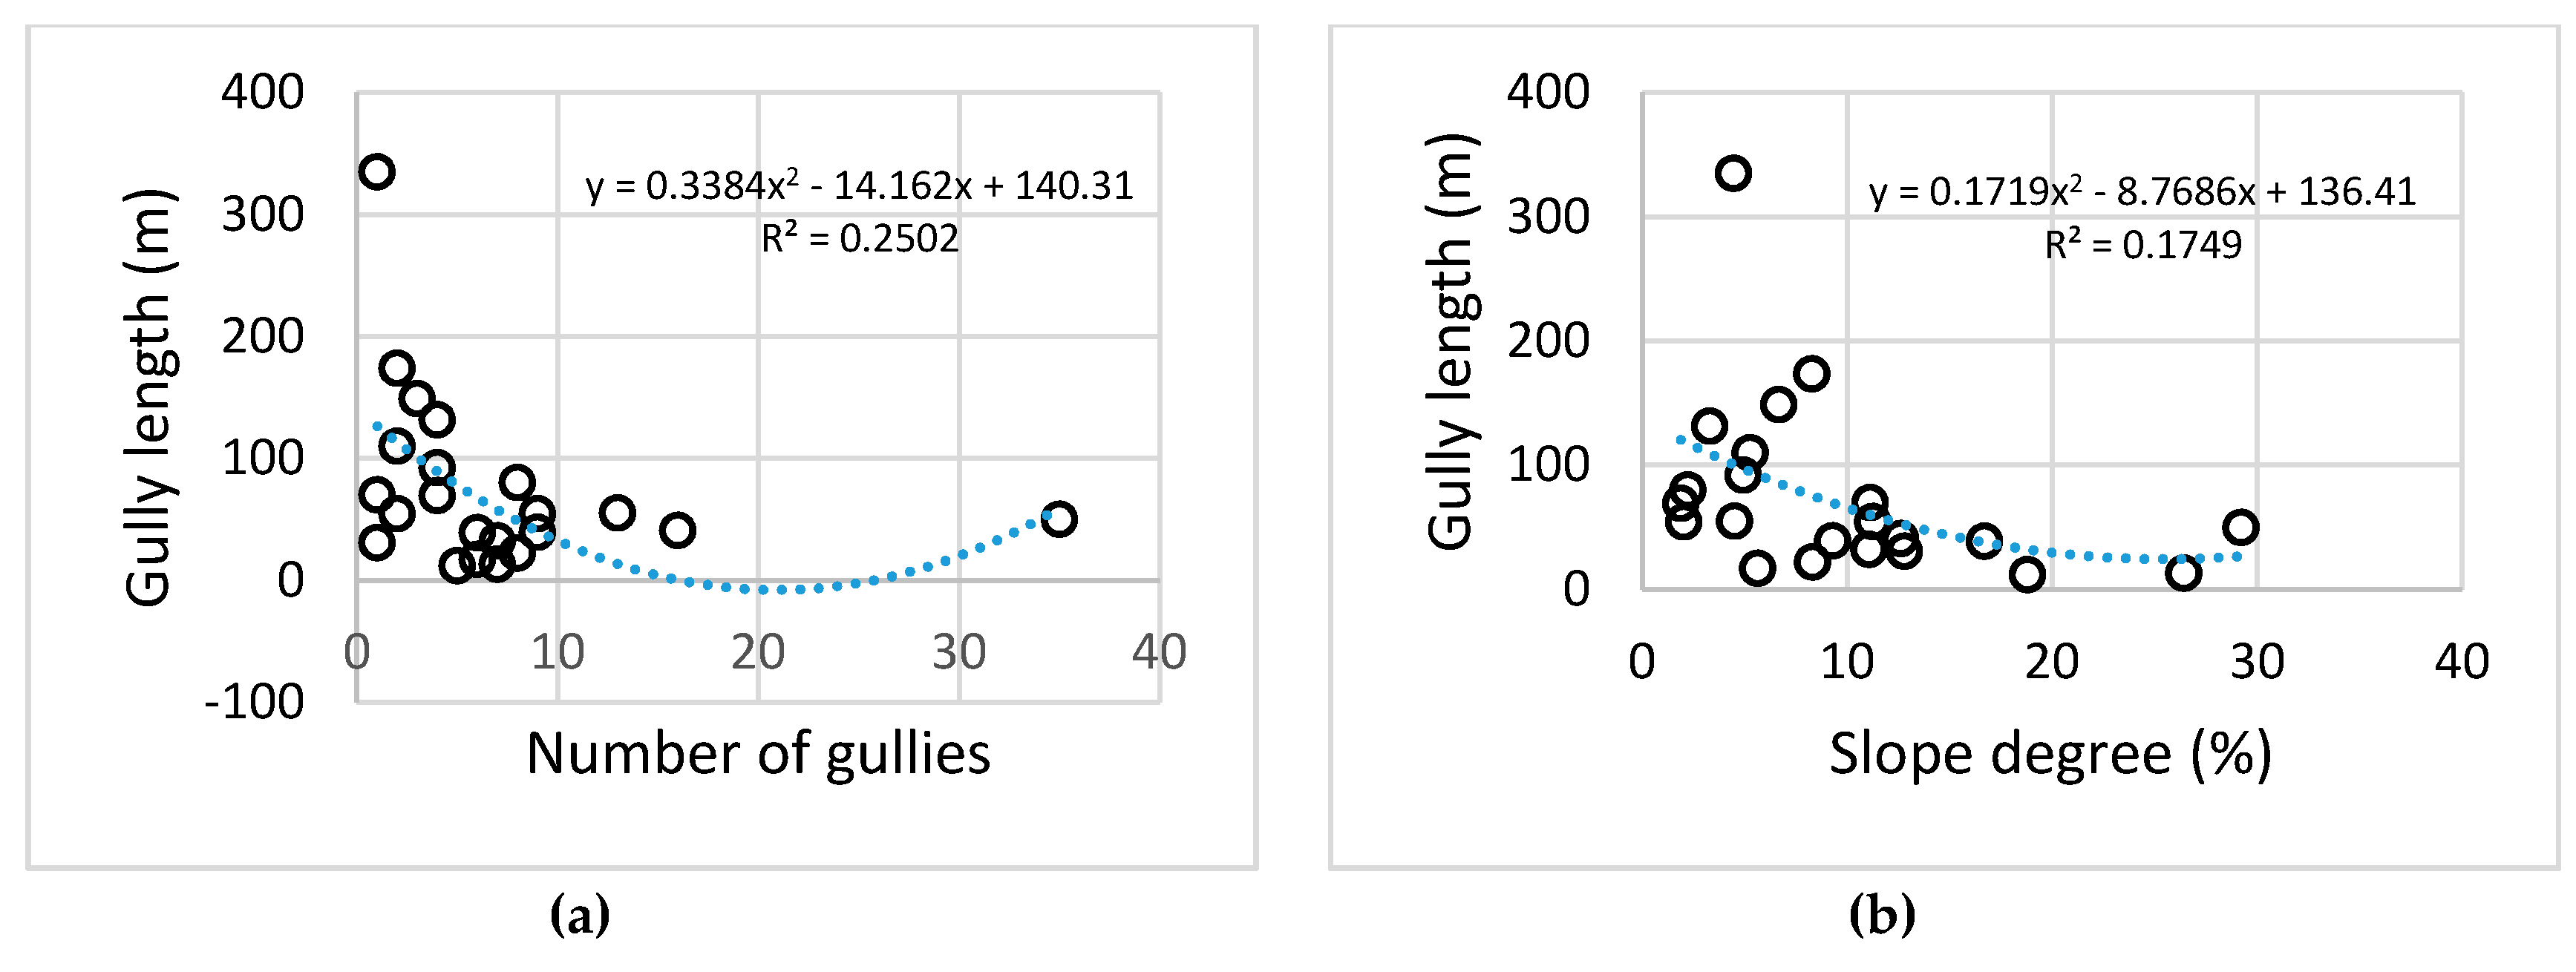
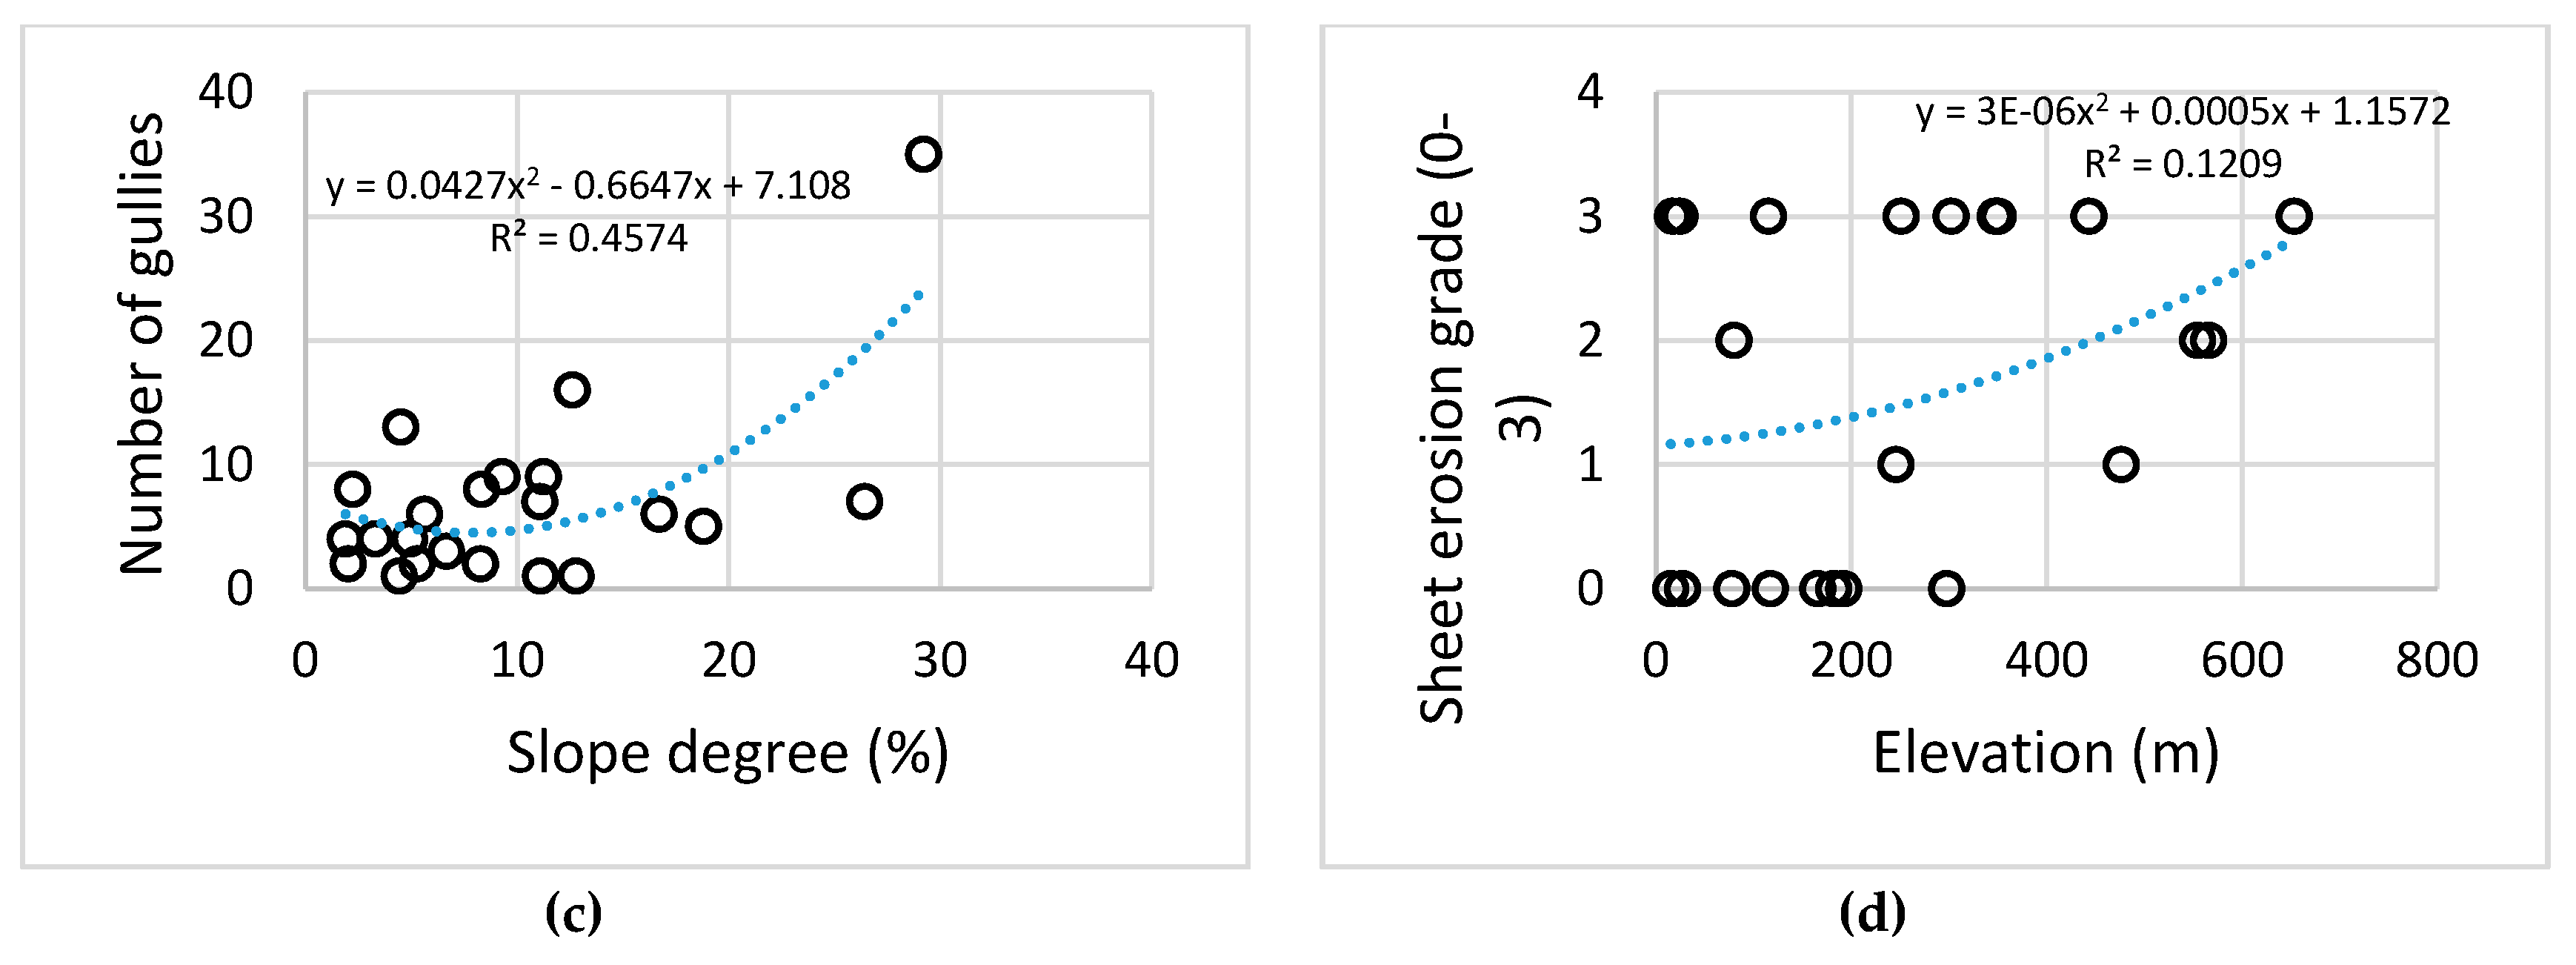
3.4. Gully Erosion Trends in Relation to Land Use and Topography

From the examination of the ephemeral gullies with the concurrent land use identified in Google Earth, it was found that ephemeral gullies were found mainly in arable lands (9 cases), vineyards (4 cases), olive groves (8 cases), and pastures (one case) (Figure 6). Proportionally to each sampled land use class, it was found that 21% of the arable land, 25% of the olive groves, 50% of the vineyards, and 9% of the pastures were found with ephemeral gullies (Figure 7). Inside the arable land, the mean length of gullies was significantly larger than the overall average (90.7 m compared to 55.6 m). In olive groves, the mean gully length was significantly smaller than the overall average (35.8 m compared to 55.6 m). For the vineyards, the mean gully length was close to the average (55.5 m), whereas for the pastures, it was far larger (146 m).
Terraces are among the most significant conservation practices to mitigate soil erosion especially in hot spots [36]. We checked the presence of terraces between or inside the agricultural fields. In this qualitative assessment, 26 samples out of 100 contained terraces. Gullies were present only in 5 locations with terraces presence, thus in 19% of the cases. The field samples with presence of terraces but without gullies have a slope degree ranging from 1% to 34%, with an average of 14.2%. These findings verify in a degree the substantial role of terraces as measures of erosion prevention. However, in most of the samples with gullies, terraces were absent, although having a slope degree ranging from 2% to 26%, with an average of 8.7%. The cases of terraced land with gullies only indicates the possibility that gully formation could be even worse if terraces were absent (Table 2).
We also investigated possible trends of the main numerical parameters, such as the length of the mapped gullies, the number of the gullies, slope degree, and elevation, within the subset of the samples with gullies. Averaged elevation and slope values for each of the samples were derived from a 30-m resolution ASTER GDEM (digital elevation model) [37]. Low to moderate non-linear trends (in terms of coefficient of determination, R2) appear in the following pairs of variables (Figure 8):
  • Length vs. number of gullies (mostly negative)
  • Number of gullies vs. slope (mostly positive)
  • Total length of gullies vs. slope (mostly negative)
  • Severity of sheet erosion sings vs. elevation (positive)
The number or length of the detected gullies were not correlated with signs of rills or sheet erosion by any means.

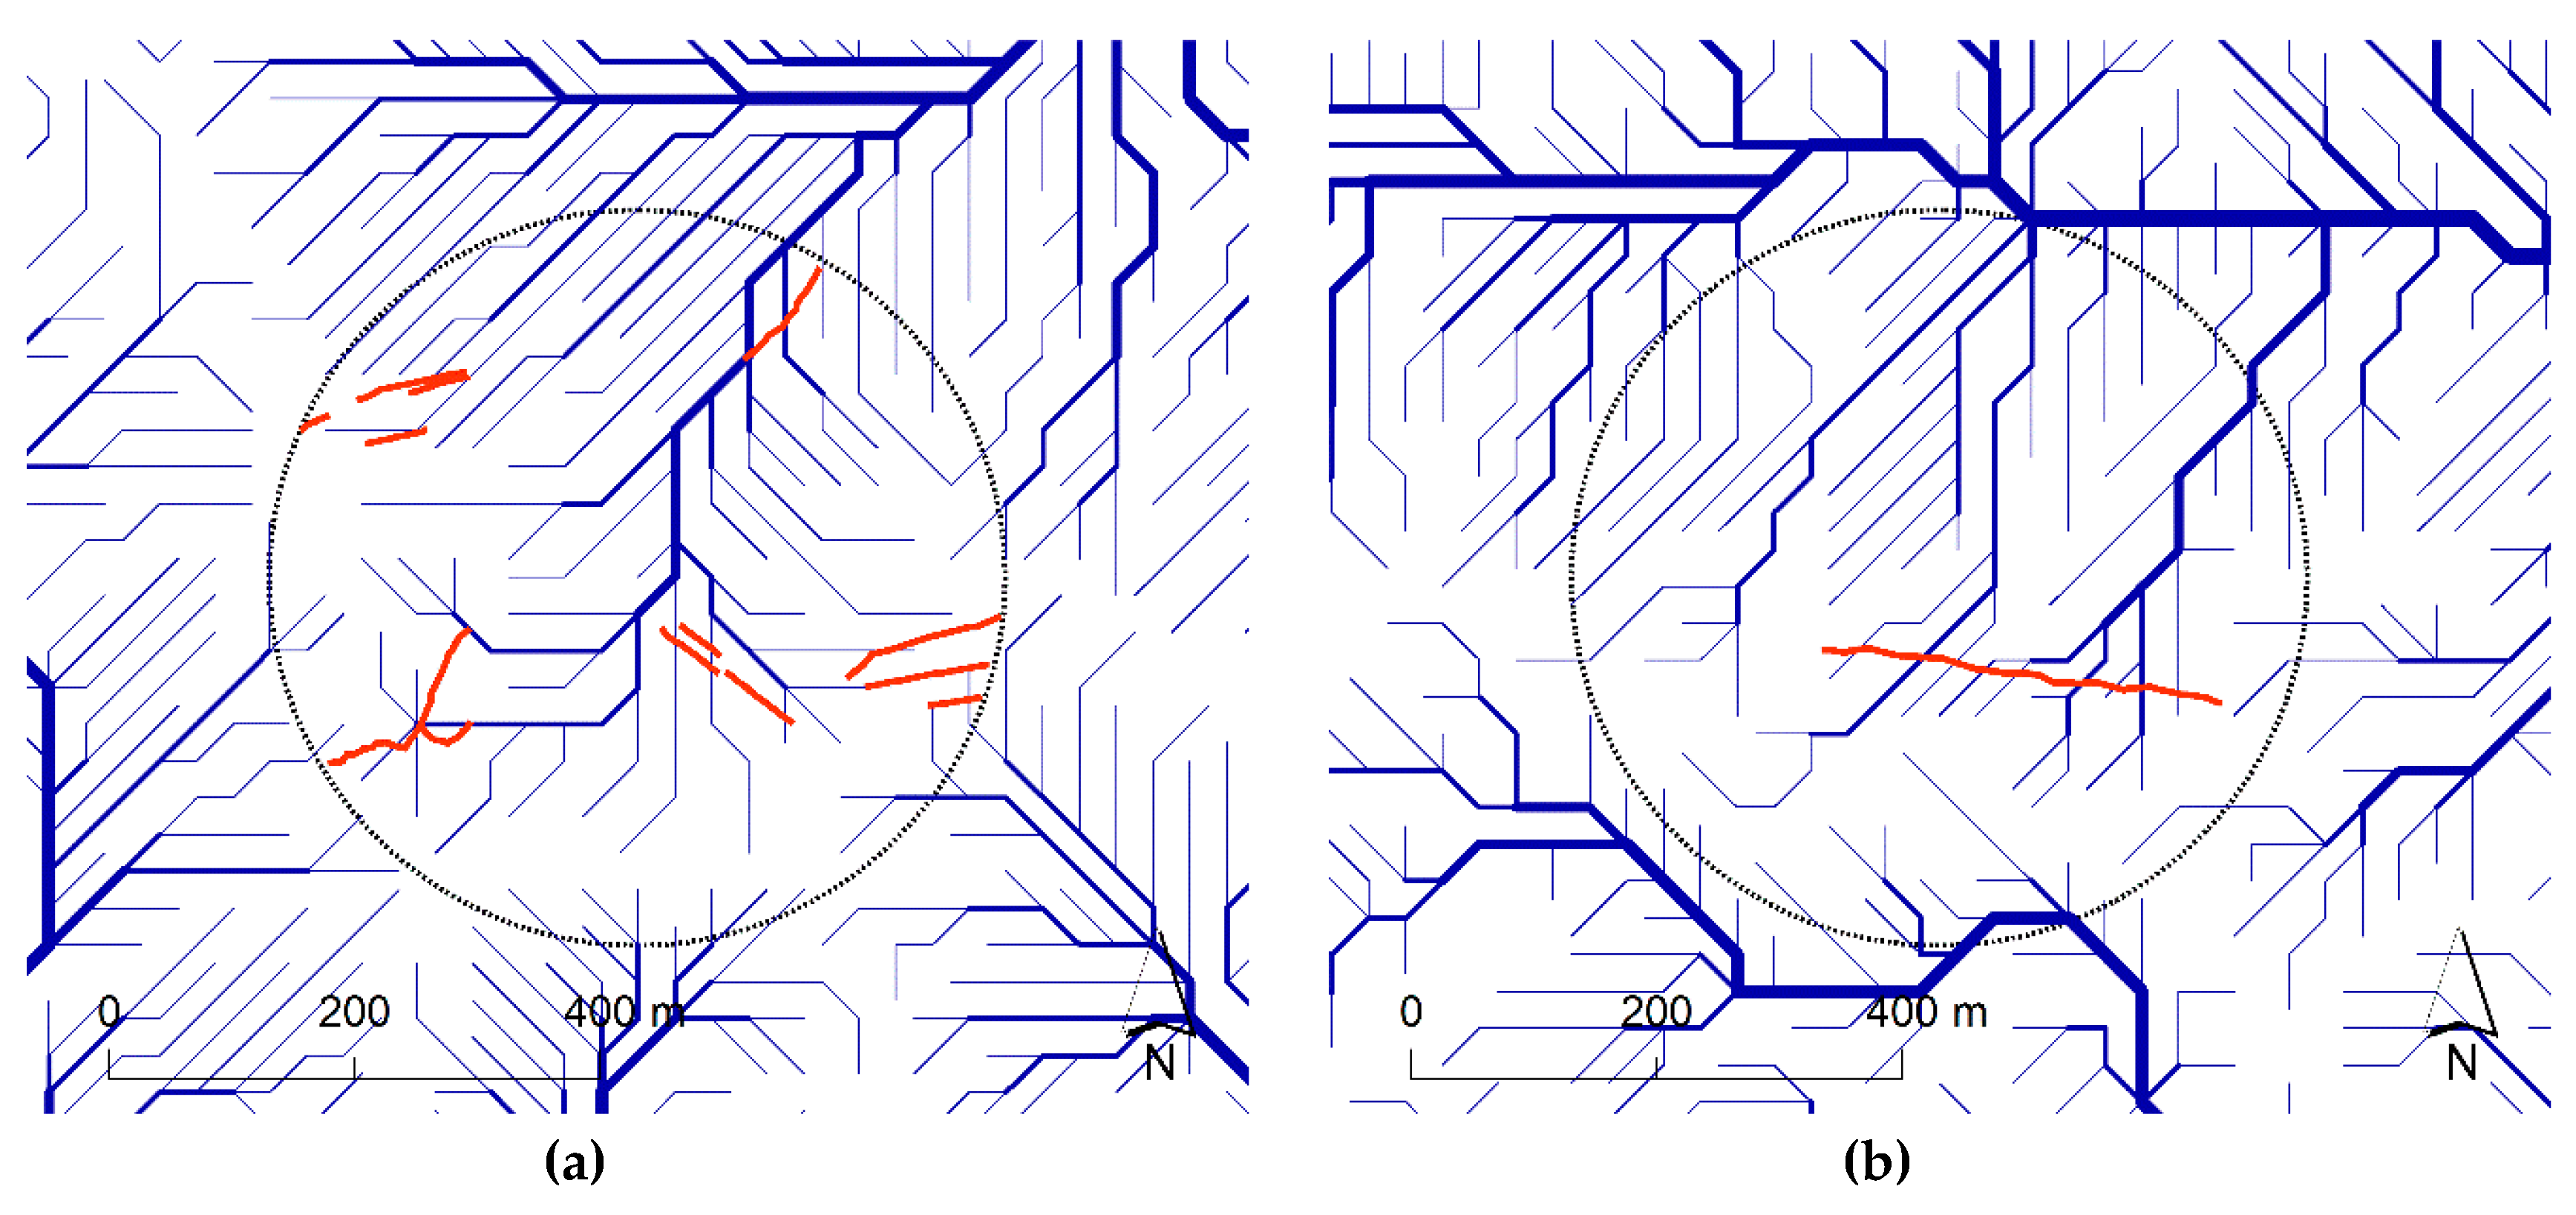
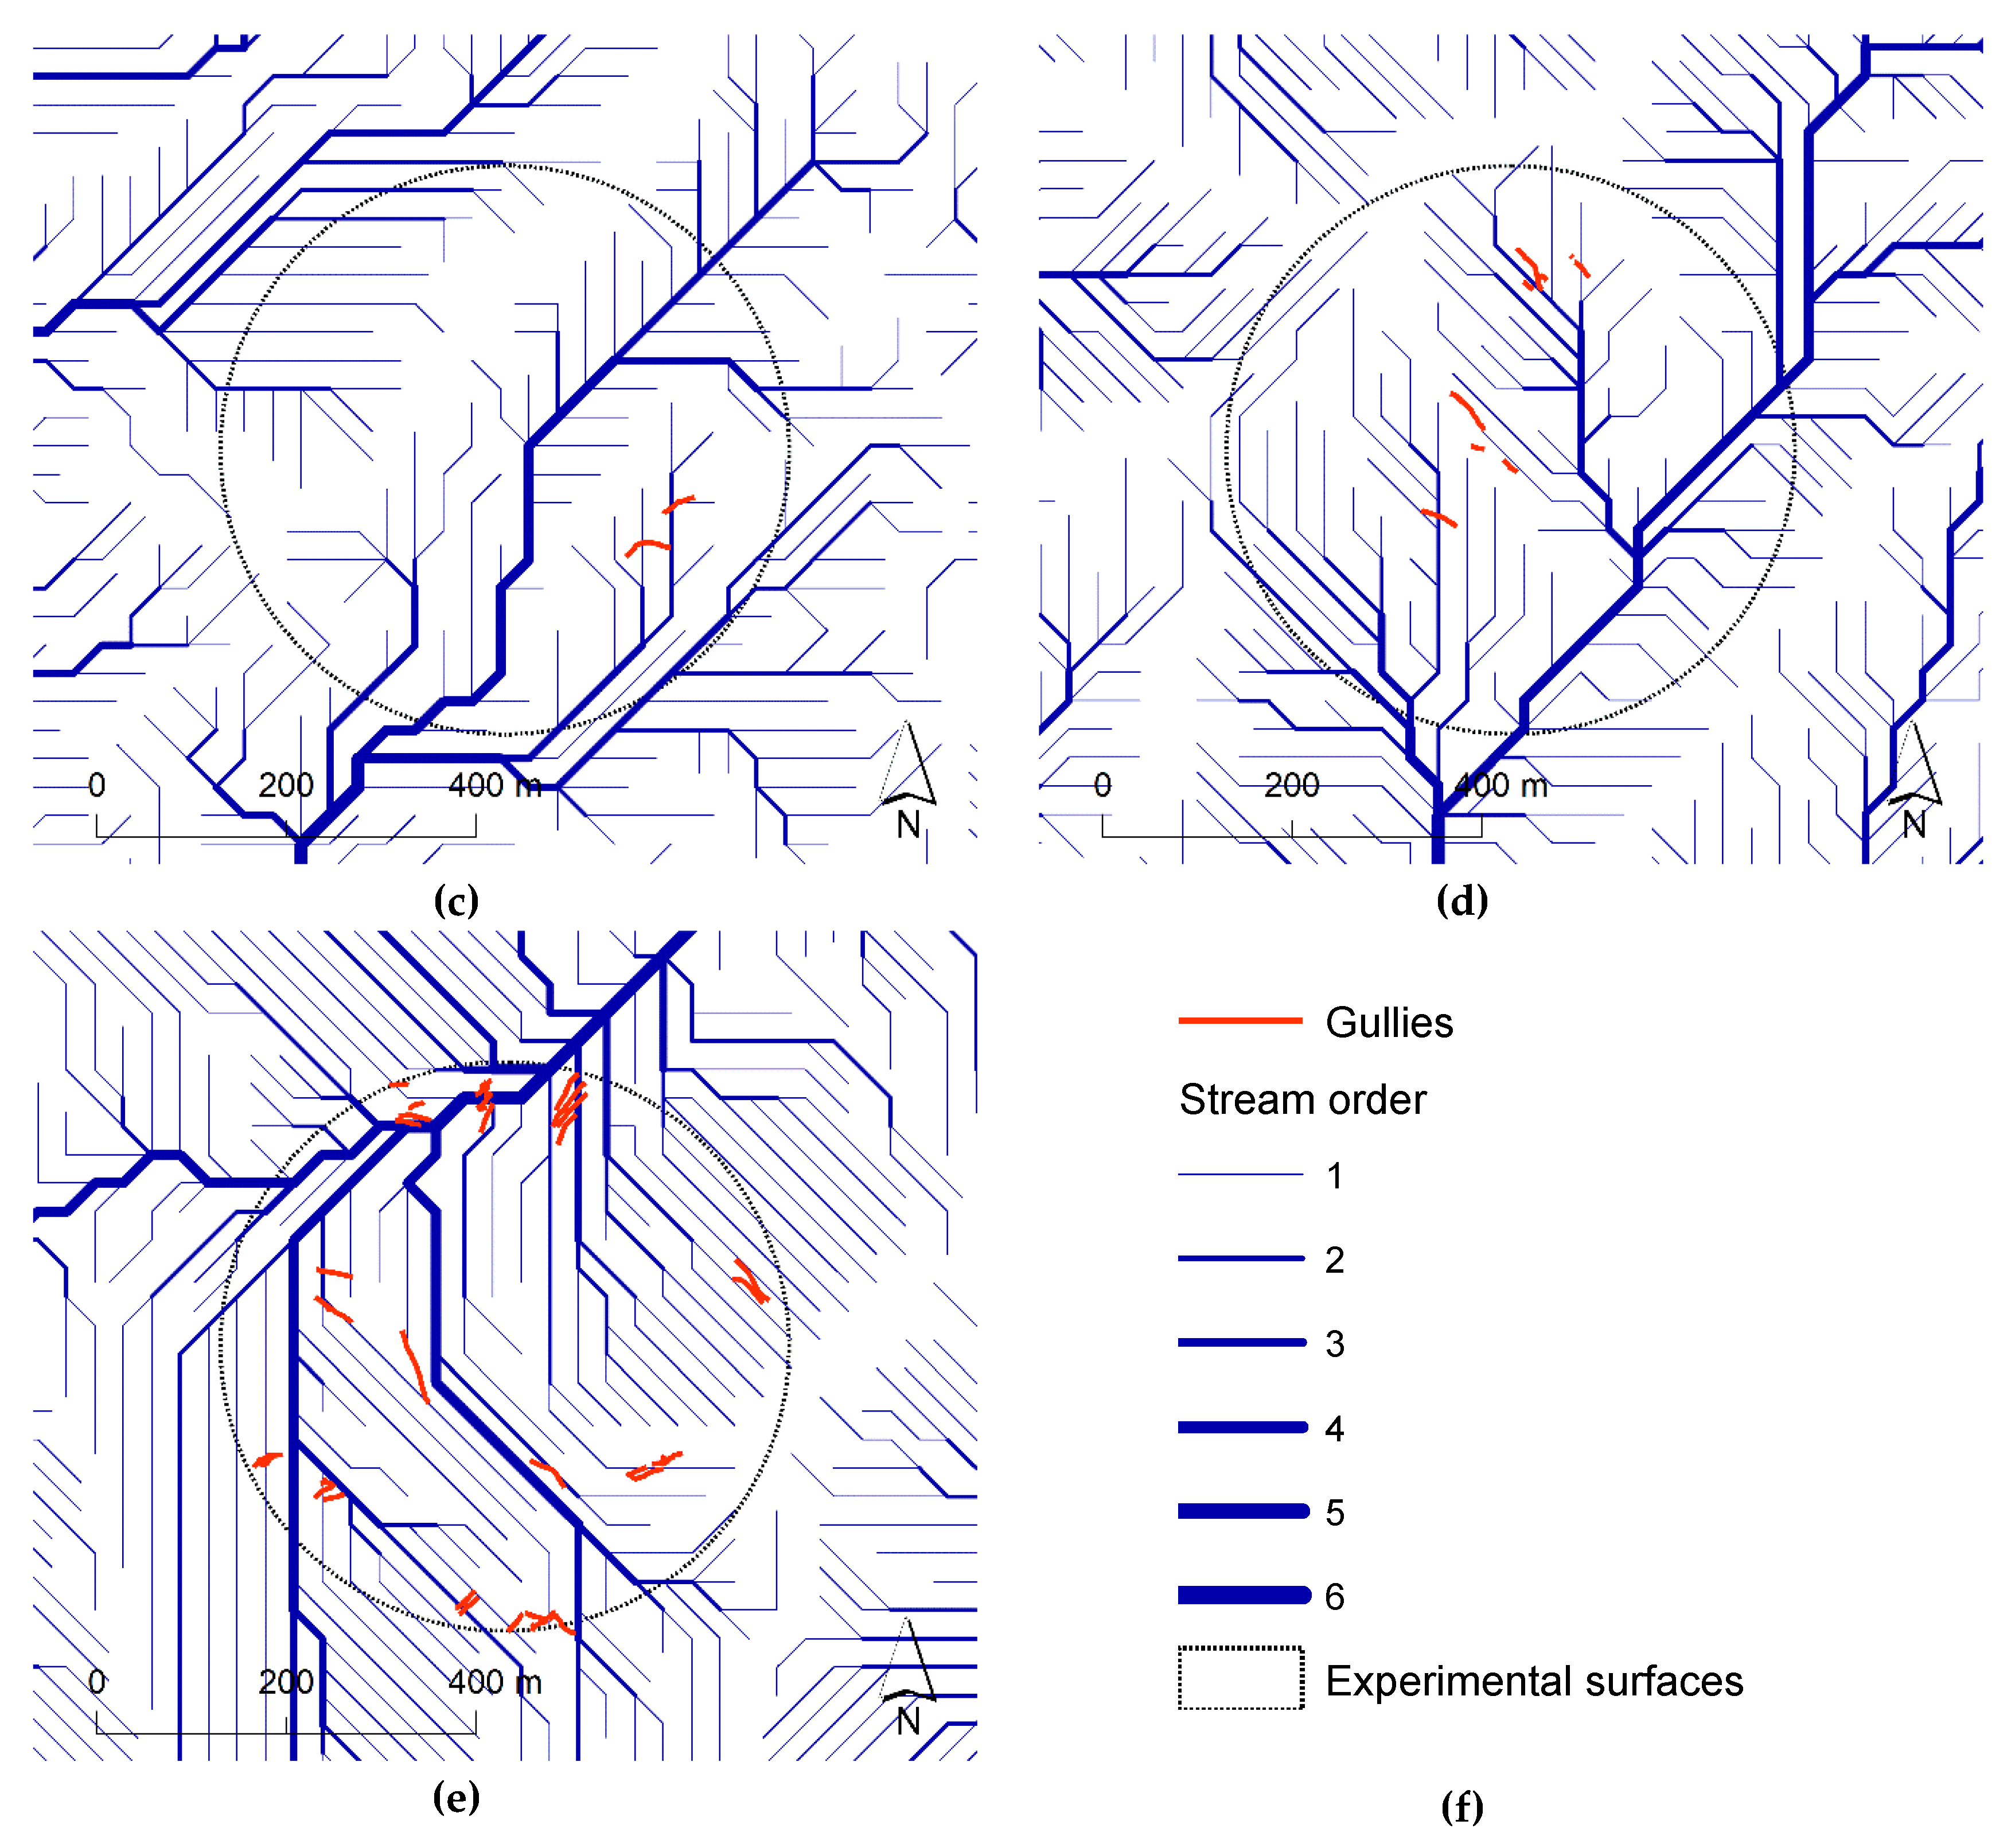
3.5. Gully Erosion Correlation with Drainage Network

Finally, we examined possible correlation of the ephemeral gullies with drainage network on the most detailed scale, in the study sites. Drainage network was extracted using the D8 method [38], with the available ASTER GDEM. Τhe path-lines of the mapped ephemeral gullies were overlaid on the drainage network and the portion of the path lines within every stream order of the network was recorded (Figure 9).
The results indicate that the detected ephemeral gullies joint or intersected drainage network segments of 1st up to the 5th order in a 6-order drainage network after Shtrahler (1957) [39]. According to the Strahler method, all segments without any tributaries are assigned an order of 1, whereas stream order increases only when segments of the same order intersect. The average order of all drainage network segments which the detected gullies joint or intersected was 1.53. The latter shows that in general, gullies were found mainly close to low-order segments of the drainage network, with very limited exceptions; in seven cases, the gullies were found to join or intersect 5-order segments. Visual inspection showed that in most cases, the detected gullies did not comply absolutely with the direction of the mapped drainage network segments, even in sloping sites.

4. Discussion

The statistical analysis of ephemeral gullies has focused on land cover, land use, topographic features (elevation and slope), drainage, and conservation practices (terraces). Although soil type is an important driver for gully erosion formation [4], we have not investigated this correlation in this study due to the absence of a high spatial resolution soil map.
Considering that the sampling scheme was random and unbiased (no autocorrelation was found), the representativeness of the sample was statistically reliable. The numerical figures indicate a rather densified network of gullies wherever detected. In several cases, the gullies were found in more than one image, or were identified as rills in earlier years, which were evolved into gullies in later years; this notification agrees with the known persistence of gully formation in the same sites over time [40].
Furthermore, the detected gullies were found in any possible location and direction within fields of different crops; in several cases they were parallel between them, while in others they were attributing to the gullies of higher order in a structured drainage network. In few cases, the farmers purposely converted ephemeral channels crossing their fields into permanent drainage channels, thus facilitating water removal. This kind of development was understood by the evolution of naturally curved channels into artificially widened straight ones.
Gully initiation was found to be associated with specific agricultural land uses, mainly vineyards, olive groves, and arable land in sloping sites (8.7% on average). This confirms the hypothesis that soil erosion rates in vineyards are among the highest ones (especially in the Mediterranean basin) due to a combination of bare soil conditions, low vegetation protection, slope areas and anthropogenic factors (tillage, compaction, use of herbicides) [41,42]. Finally, 11% of the entire sampled surfaces were found to contain ephemeral gullies at an average slope degree larger than 5%, but without any terraces. However, the detected ephemeral gullies did not show correlation to specific elevation, nor to specific slope ranges.
Not surprisingly, gullies coexist with rill or sheet erosion in most of the cases. Rills, though, were observed in 85% of the samples, while sheet erosion in 53% of the samples; thus, in many cases rill and sheet erosion forms were present irrespective of ephemeral gullies.
The findings of this study indicate a moderate to high risk for gully erosion in Greece (22% on average), non-uniformly distributed in the country. The Land Use and Land Cover Survey (LUCAS) of 2018 verifies a medium to high gully erosion risk in Greece. According to the LUCAS soil survey 2018, 33 gully points were recorded in a sample of 500 visited sites in Greece (6.6%), thus rendering Greece second in gully density among all European Union (EU) countries after Spain [43]. In 20,000 surveyed points in the entire EU in all land uses, the surveyors noticed gully erosion in 211 points. However, LUCAS followed an a priori systematic point-sampling scheme updated regularly every three years, which can be further improved in order to capture a very localized and temporary phenomenon like gully formulation.
Considering that gully erosion research is very limited and outdated in Greece, a fast-track study was found to be necessary in order to get a rough assessment of the situation, especially regarding ephemeral gullies, which are associated with intensive agricultural land uses. It was showed that wherever gullies have initiated, the density and length of the channels, thus the severity of gully erosion seems to be significant.
The remote sensing method employed in this study (i.e.,; visual interpretation) was able to respond to the second scientific question set by Poesen et al. (2003) [4] in their review on gullies research needs: “What are appropriate measuring techniques for monitoring and experimental studies of the initiation and development of various gully types at various temporal and spatial scales?” Visual interpretation with Google Earth proved to be efficient in detecting and identifying ephemeral gullies and—moreover—be used as an image background for their detailed mapping; in many cases, an estimation of their width could also be provided.
Future work in Greece should combine the current, large scale detection with application of the geomorphic method introduced by Vandaele et al. (1996) [44], to detect potential initiation of gullies in a GIS environment; the empirical constants of the power-law equation could be indicated by pilot studies in different land uses located in preselected indicative sites. In this direction, visual interpretation with Google Earth can be used for verification. Different correlations examined (e.g.,; the negative correlation between number of gullies and slope) could also contribute to modelling approaches in a geospatial context, together with other remote sensing or field variables. Also, some qualitative correlations, such as coexistence of gullies with sheet erosion signs, which are of permanent nature, could be seen as a possibility factor towards gullies’ detection modelling.

5. Concluding Remarks

The presence of gullies at a regional scale can be assessed by using field surveys, visual interpretation, and remote sensing. The increased availability of high-resolution remote sensing images combined with computing capacity and the growing disposal of photographs and data collection will further facilitate the compilation of gully erosion datasets at a regional scale.
The visual interpretation of Google Earth images has proved to be a fruitful technique for gully erosion evolution and inventory. In addition, in terms of costs, the evaluation of 100 points requested about 50 working hours of a remote sensing engineer, including preparatory work sampling design and collection in a geographic information system. Potentially, the evaluation of one or two orders of magnitude (10,000 points) will contribute to a national representative gully erosion dataset. This can be combined with existing field surveys (e.g.,; LUCAS) and other advanced techniques, such as machine learning or semi-automated procedures for gully identification.
The gully inventory can be useful for advising farmers to apply appropriate management practices. Tillage practices and period of plow are key factors influencing gully erosion in hot-dry environments [45], such as Greece. Contour ridge tillage can be an appropriate conservation practice in agricultural lands with ephemeral gully signs.

Author Contributions

Conceptualization, P.P. and C.K.; methodology, C.K.; software, C.K.; validation, C.K. and P.P.; formal analysis, C.K.; investigation, P.P and C.K.; resources, C.K and P.P.; data curation, C.K.; writing—original draft preparation, C.K.; writing—review and editing, P.P.; visualization, C.K.; supervision, P.P.; project administration, P.P.; funding acquisition, P.P. All authors have read and agreed to the published version of the manuscript.

Funding

This research received no external funding. The APC was funded by European Commission, Joint Research Centre (JRC).

Acknowledgments

Many thanks to Google Earth online.

Conflicts of Interest

The authors declare no conflict of interest. The funders had no role in the design of the study; in the collection, analyses, or interpretation of data; in the writing of the manuscript, or in the decision to publish the results.

References

  1. Vanmaercke, M.; Poesen, J.; Verstraeten, G.; de Vente, J.; Ocakoglu, F. Sediment yield in Europe: Spatial patterns and scale dependency. Geomorphology 2011, 130, 142–161. [Google Scholar] [CrossRef] [Green Version]
  2. Soil Science Society of America, Glossary of Soil Science Terms; Soil Science Society of America: Madison, WI, USA, 2001; Available online: http://www.soils.org/sssagloss/ (accessed on 8 February 2020).
  3. Castillo, C.; Gómez, J.A. A century of gully erosion research: Urgency, complexity and study approaches. Earth-Sci. Rev. 2016, 160, 300–319. [Google Scholar] [CrossRef]
  4. Poesen, J.; Nachtergaele, J.; Verstraeten, G.; Valentin, C. Gully erosion and environmental change: Importance and research needs. Catena 2003, 50, 91–133. [Google Scholar] [CrossRef]
  5. Verstraeten, G.; Poesen, J. The nature of small-scale flooding, muddy floods and retention pond sedimentation in central Belgium. Geomorphology 1999, 29, 275–292. [Google Scholar] [CrossRef]
  6. Ionita, I.; Fullen, M.A.; Zgłobicki, W.; Poesen, J. Gully erosion as a natural and human-induced hazard. Nat. Hazards 2015, 79, S1–S5. [Google Scholar] [CrossRef] [Green Version]
  7. Foster, G.R. Understanding ephemeral gully erosion. In Soil Conservation: Assessing the National Resources Inventory; National Academy Press: Washington, DC, USA, 1986; Volume 2, pp. 90–118. [Google Scholar]
  8. Casali, J.; Bennett, S.J.; Robinson, K.M. Processes of ephemeral gully erosion. Int. J. Sediment Res. 2000, 15, 31–41. [Google Scholar]
  9. Bennett, S.J.; Wells, R.R. Gully erosion processes, disciplinary fragmentation, and technological innovation. Earth Surf. Process. Landf. 2019, 44, 46–53. [Google Scholar] [CrossRef] [Green Version]
  10. Valentin, C.; Poesen, J.; Li, Y. Gully erosion: Impacts, factors and control. Catena 2005, 63, 132–153. [Google Scholar] [CrossRef]
  11. Frank, A.; Nyssen, J.; De Dapper, M.; Haile, M.; Billi, P.; Munro, R.N.; Deckers, J.; Poesen, J. Linking long-term gully and river channel dynamics to environmental change using repeat photography (Northern Ethiopia). Geomorphology 2011, 129, 238–251. [Google Scholar] [CrossRef]
  12. Gordon, L.M.; Bennett, S.J.; Alonso, C.V.; Bingner, R.L. Modeling long-term soil losses on agricultural fields due to ephemeral gully erosion. J. Soil Water Conserv. 2008, 63, 173–181. [Google Scholar] [CrossRef]
  13. Bingner, R.L.; Wells, R.R.; Momm, H.G.; Rigby, J.R.; Theurer, F.D. Ephemeral gully channel width and erosion simulation technology. Nat. Hazards 2016, 80, 1949–1966. [Google Scholar] [CrossRef]
  14. Vanmaercke, M.; Poesen, J.; Van Mele, B.; Demuzere, M.; Bruynseels, A.; Golosov, V.; Bezerra, J.F.R.; Bolysov, S.; Dvinskih, A.; Frankl, A.; et al. How fast do gully headcuts retreat? Earth-Sci. Rev. 2016, 154, 336–355. [Google Scholar] [CrossRef]
  15. Capra, A.; Mazzara, L.M.; Scicolone, B. Application of the EGEM model to predict ephemeral gully erosion in Sicily, Italy. Catena 2005, 59, 133–146. [Google Scholar] [CrossRef]
  16. Rundquist, B.C. The influence of canopy green vegetation fraction on spectral measurements over native tallgrass prairie. Remote Sens. Environ. 2002, 81, 129–135. [Google Scholar] [CrossRef]
  17. Hessel, R.; Van Asch, T.W.J. Modelling gully erosion for a small catchment on the Chinese Loess Plateau. Catena 2003, 54, 131–146. [Google Scholar] [CrossRef]
  18. de Roo, A.; Jetten, V.; Wesseling, C.; Ritsema, C. LISEM: A physically-based hydrologic and soil erosion catchment model. In Modelling Soil Erosion by Water; Springer: Berlin/Heidelberg, Germany, 1998; pp. 429–440. Available online: https://link.springer.com/chapter/10.1007/978-3-642-58913-3_32 (accessed on 10 February 2020).
  19. Nwakwasi, N.L. Modelling of Gully Erosion Site Data in Southeastern Nigeria, Using Poisson and Negative Binomial Regression Models. J. Civ. Constr. Environ. Eng. 2018, 3, 111–117. [Google Scholar] [CrossRef] [Green Version]
  20. Zabihi, M.; Mirchooli, F.; Motevalli, A.; Darvishan, A.K.; Pourghasemi, H.R.; Zakeri, M.A.; Sadighi, F. Spatial modelling of gully erosion in Mazandaran Province, northern Iran. Catena 2018, 161, 1–13. [Google Scholar] [CrossRef]
  21. Domazetović, F.; Šiljeg, A.; Lončar, N.; Marić, I. GIS automated multicriteria analysis (GAMA) method for susceptibility modelling. MethodsX 2019, 6, 2553–2561. [Google Scholar] [CrossRef]
  22. Panagos, P.; Borrelli, P.; Poesen, J.; Ballabio, C.; Lugato, E.; Meusburger, K.; Montanarella, L.; Alewell, C. The new assessment of soil loss by water erosion in Europe. Environ. Sci. Policy 2015, 54, 438–447. [Google Scholar] [CrossRef]
  23. Panagos, P.; Karydas, C.G.; Gitas, I.Z.; Montanarella, L. Monthly soil erosion monitoring based on remotely sensed biophysical parameters: A case study in Strymonas river basin towards a functional pan-European service. Int. J. Digit. Earth 2012, 5, 461–487. [Google Scholar] [CrossRef]
  24. Panagos, P.; Karydas, C.; Ballabio, C.; Gitas, I. Seasonal monitoring of soil erosion at regional scale: An application of the G2 model in Crete focusing on agricultural land uses. Int. J. Appl. Earth Obs. Geoinf. 2014, 27, 147–155. [Google Scholar] [CrossRef]
  25. Kazamias, A.P.; Sapountzis, M. Spatial and temporal assessment of potential soil erosion over Greece. Water 2017, 59, 315–321. [Google Scholar]
  26. Evelpidou, N.; Vassilopoulos, A.; Leonidopoulou, D.; Poulos, S. An investigation of the coastal erosion causes in Samos Island, Eastern Aegean Sea. J. Landsc. Ecol. 2008, 6, 295–310. [Google Scholar]
  27. Andredaki, M.; Georgoulas, A.; Hrissanthou, V.; Kotsovinos, N. Assessment of reservoir sedimentation effect on coastal erosion in the case of Nestos River, Greece. Int. J. Sediment Res. 2014, 29, 34–48. [Google Scholar] [CrossRef] [Green Version]
  28. Borrelli, P.; Panagos, P.; Ballabio, C.; Lugato, E.; Weynants, M.; Montanarella, L. Towards a pan-European assessment of land susceptibility to wind erosion. Land Degrad. Dev. 2016, 27, 1093–1105. [Google Scholar] [CrossRef]
  29. Nemes, I.; Constantinescu, L. The Gully Erosion Effect on the Environment. In Proceedings of the International Conference on Information and Communication Technologies for Sustainable Agri-Production and Environment (HAICTA 2011), Skiathos, Greece, 8–11 September 2011. [Google Scholar]
  30. Vandekerckhove, L.; Poesen, J.; Oostwoudwijdenes, D.; Nachtergaele, J.; Kosmas, C.; Roxo, M.J.; De Figueiredo, T. Thresholds for gully initiation and sedimentation in Mediterranean Europe. Earth Surf. Process. Landf. 2000, 25, 1201–1220. [Google Scholar] [CrossRef]
  31. Gilad, U.; Denham, R.; Tindall, D. Gullies, Google Earth and the Great Barrier Reef: A remote sensing methodology for mapping gullies over extensive areas. International Archives of the Photogrammetry. In Proceedings of the International Archives of the Photogrammetry, Remote Sensing and Spatial Information Science, XXII ISPRS Congress, Melbourne, Australia, 25 August–1 September 2012; Available online: https://www.int-arch-photogramm-remote-sens-spatial-inf-sci.net/XXXIX-B8/469/2012/ (accessed on 10 February 2020).
  32. Boardman, J. The value of Google Earth ™ for erosion mapping. Catena 2016, 143, 123–127. [Google Scholar] [CrossRef]
  33. Marzolff, I.; Ries, J.B.; Poesen, J. Short-term versus medium-term monitoring for detecting gully-erosion variability in a Mediterranean environment. Earth Surf. Process. Landf. 2011, 36, 1604–1623. [Google Scholar] [CrossRef]
  34. Bodoque, J.M.; Lucia, A.; Ballesteros, J.A.; Martin-Duque, J.F.; Rubiales, J.M.; Genova, M. Measuring medium-term sheet erosion in gullies from trees: A case study using dendrogeomorphological analysis of exposed pine roots in central Iberia. Geomorphology 2011, 134, 417–425. [Google Scholar] [CrossRef] [Green Version]
  35. Getis, A.; Ord, J.K. The analysis of Spatial Association by use of Distance Statistics. Geogr. Anal. 1992, 24, 189–206. [Google Scholar] [CrossRef]
  36. Panagos, P.; Borrelli, P.; Meusburger, K.; van der Zanden, E.H.; Poesen, J.; Alewell, C. Modelling the effect of support practices (P-factor) on the reduction of soil erosion by water at European scale. Environ. Sci. Policy 2015, 51, 23–34. [Google Scholar] [CrossRef]
  37. NASA. Jet Propulsion Laboratory ASTER. 2012. Available online: https://asterweb.jpl.nasa.gov/gdem.asp (accessed on 8 February 2020).
  38. Jenson, S.K.; Domingue, J.O. Extracting Topographic Structure from Digital Elevation Data for Geographic Information System Analysis. Photogramm. Eng. Remote Sens. 1988, 54, 1593–1600. [Google Scholar]
  39. Strahler, A.N. Quantitative analysis of watershed geomorphology. Trans. Am. Geophys. Union 1957, 38, 913–920. [Google Scholar] [CrossRef] [Green Version]
  40. Di Stefano, C.; Ferro, V.; Pampalone, V.; Sanzone, F. Field investigation of rill and ephemeral gully erosion in the Sparacia experimental area, South Italy. Catena 2013, 101, 226–234. [Google Scholar] [CrossRef]
  41. Rodrigo-Comino, J. Five decades of soil erosion research in “terroir”. The State-of-the-Art. Earth-Sci. Rev. 2018, 179, 436–447. [Google Scholar] [CrossRef]
  42. Rodrigo-Comino, J.; Senciales, J.M.; Sillero-Medina, J.A.; Gyasi-Agyei, Y.; Ruiz-Sinoga, J.D.; Ries, J.B. Analysis of Weather-Type-Induced Soil Erosion in Cultivated and Poorly Managed Abandoned Sloping Vineyards in the Axarquía Region (Málaga, Spain). Air Soil Water Res. 2019, 12, 1178622119839403. [Google Scholar] [CrossRef]
  43. Orgiazzi, A.; Ballabio, C.; Panagos, P.; Jones, A.; Fernández-Ugalde, O. LUCAS Soil, the largest expandable soil dataset for Europe: A review. Eur. J. Soil Sci. 2018, 69, 140–153. [Google Scholar] [CrossRef] [Green Version]
  44. Vandaele, K.; Poesen, J.; Govers, G.; van Wesemael, B. Geomorphic threshold conditions for ephemeral gully incision. Geomorphology 1996, 16, 161–173. [Google Scholar] [CrossRef]
  45. Rong, L.; Duan, X.; Zhang, G.; Gu, Z.; Feng, D. Impacts of tillage practices on ephemeral gully erosion in a dry-hot valley region in southwestern China. Soil Tillage Res. 2019, 187, 72–84. [Google Scholar] [CrossRef]
Figure 1. The random sampling scheme within the agricultural land of Greece.
Water 12 00603 g001
Figure 2. Examples of ephemeral gully detection. The sampled surfaces are denoted by white circles and gullies by cyan lines in the far views (geographic coordinates and image date in brackets) (a) sparse gullies formed towards a torrent in sloping olive plantation near Gerakini (40°18′56.41″ N/23°25′45.34″ E, 3 November 2016); (b) close view to case (a); (c) the longest identified gully near Almyros (39°10′55.07″ N/22°40′36.56″ E, 28 October 2013); (d) a close view to 0.6-m wide sections of the gully of case (c); (e) long parallel gullies in an arable field out of Sitia (35°11′42.82″ N/26°6′41.08″ E, 12 April 2013); (f) intensive rill and sheet erosion signs close to lake Doirani (41°8′26.07″ N/22°46′18.52″ E, 4 September 2013).
Water 12 00603 g002aWater 12 00603 g002b
Figure 3. Geographic distribution of the total gully length per randomly sampled site (graduated symbol in five categories of magnitude).
Water 12 00603 g003
Figure 4. Relative proportion of gullies, rills, and sheet erosion in the randomly sampled surfaces; five categories of severity were considered for gullies, and three for rills and sheet erosion.
Water 12 00603 g004
Figure 5. Spatial independence of gully length visualized: (a) at the global scale using the Getis-Ord Gi* statistic (percentages indicate level of confidence); and (b) at the local scale using Anselin Local Moran’s I statistic.
Water 12 00603 g005
Figure 6. Share of the main agricultural land uses in Greece found to contain ephemeral gullies (CORINE coding in brackets).
Water 12 00603 g006
Figure 7. Number of samples found with and without ephemeral gullies (CORINE coding in brackets).
Water 12 00603 g007
Figure 8. Trend plots: negative trend between total gully length and number of gullies (a) and between gully length and slope degree (b); positive trend between number of gullies and slope degree (c) and sheet erosion grade and elevation (d).
Water 12 00603 g008aWater 12 00603 g008b
Figure 9. Indicative cases of detected gullies overlaid on the drainage network (a) variety of gullies in a 4.5% slope vines - arable land complex, close to Thiva (38°17′8.45″ N/23°27′1.68″ E, 20 February 2014); (b) the longest detected gully in a 4.4% slope naked arable soil, close to Almyros (39°10′55.07″ N/22°40′36.56″ E, 28 October 2013); (c) short gullies in a 2% slope arable land, close to Agrinio (38°33′59.95″ N/21°23′35.14″ E, 9 September 2009); (d) moderate gullies in 11.4% slope olive groves, close to Gerakini (40°18′56.41″ N/23°25′45.34″ E, 3 November 2016); (e) highly dense gully pattern in a 29.2% slope olive-vines complex, close to Egio (38°33′59.95″ N/21°23′35.14″ E, 9 July 2009); (f) legend.
Water 12 00603 g009aWater 12 00603 g009b
Table 1. A summary of the findings.
ParameterArithmetic Figures
Samples with gullies22/100
Number of gullies153
Length of gulliesMean = 55.6 m
Min = 3.5 m
Max = 379 m
Elevation of:
Sampled surfaces
Samples surfaces with gullies
205.7 m (5 m–962 m)
201.3 m (14 m–568 m)
Slope of:
Sampled surfaces
Samples surfaces with gullies
9.4% (0.2%–35.7%)
9.7% (1.8%–28.7%)
Signs of rills (total)
Slight (1)
Moderate (2)
Strong (3)
130/153 (85%)
108/153 (70%)
20/153 (13%)
2/153 (1.3%)
Signs of sheet erosion (total)
Slight (1)
Moderate (2)
Strong (3)
81/153 (53%)
7/153 (4.5%)
13/153 (8.5%)
61/153 (39%)
Table 2. A summary of the relation of gullies with terraces per land use in Greece.
Land UseG+T Samples *Average Slope (%)G-T Samples *Average Slope (%)
Arable land0-96.5
Olive groves413.9412.3
Vineyards112.6310.8
Pastures0-18.3
Fruit trees0-0-
Overall513.6178.7
* G+T: with gullies and with terraces; G-T: with gullies and without terraces.

