Article

Performance, Energy and Cost of Produced Water Treatment by Chemical and Electrochemical Coagulation

1
Department of Civil & Environmental Engineering, University of California, Los Angeles (UCLA), Los Angeles, CA 90095, USA
2
PolyCera Membranes, 721 S. Glasgow Ave., Unit D, Inglewood, CA 90301, USA
3
Stepan Company, 22500 Stepan Rd, Elwood, IL 60421, USA
4
UCLA Department of Chemical & Biomolecular Engineering, University of California, Los Angeles (UCLA), Los Angeles, CA 90095, USA
5
ASICO Groupo, Av. El Golf 695, Distrito de Víctor Larco Herrera 13009, Peru
6
UCLA California NanoSystems Institute, University of California, Los Angeles (UCLA), Los Angeles, CA 90095, USA
7
UCLA Department of Chemistry & Biochemistry and Materials Science & Engineering, University of California, Los Angeles (UCLA), Los Angeles, CA 90095, USA
8
UCLA Institute of the Environment & Sustainability, University of California, Los Angeles (UCLA), Los Angeles, CA 90095, USA
*
Author to whom correspondence should be addressed.
Water 2020, 12(12), 3426; https://doi.org/10.3390/w12123426
Submission received: 29 October 2020 / Revised: 2 December 2020 / Accepted: 4 December 2020 / Published: 6 December 2020

Abstract

:
The separation performance, energy demand, and operating costs of electro-coagulation (EC) are compared to conventional chemical coagulation for oil–water separation using a simulated oil- and gas-produced water matrix. An iron-based chemical coagulant and sacrificial iron electrodes are evaluated. Effluent turbidity, chemical oxygen demand (COD), total organic carbon (TOC), and oil and grease (O&G) removal were determined for various coagulant concentrations and reaction times and current densities. Chemical coagulation produced superior turbidity removal when scaled by the total iron dose. At lower iron doses (<500 mg/L), chemical coagulation yielded better COD, turbidity, and O&G removal. However, chemical coagulation was unable to effectively remove contaminants to meet the offshore discharge limit of 29 ppm O&G. At higher iron doses, EC was more effective at removing COD and O&G. The energy consumption of EC was found to be much higher even when factoring in the energy of production, transporting, and mixing of chemical coagulants, but the overall cost of EC was approximately half the cost of chemical coagulation, and more effective at O&G removal.

1. Introduction

Produced water can come from naturally occurring water sources associated with underground oil and gas formations (connate water), or from production fluids injected into underground formations to enhance hydrocarbon recovery [1]. Produced water volumes tend to be much larger than the volumes of produced hydrocarbons; in the U.S., the average is about seven to eight barrels of water for every barrel of oil produced [2]. Produced waters can contain high concentrations of sand and sediment, free and emulsified hydrocarbons, suspended and colloidal solids, dissolved salts, minerals and metals, soluble hydrocarbons (e.g., toxic compounds such as benzene, toluene, ethylbenzene and xylenes (BTEX), polycyclic aromatic hydrocarbons and naphthenic acids), and naturally occurring radioactive materials (NORM) [3]. Historically, produced water is managed differently depending on the production method. Typical approaches include: (1) direct onsite deep well injection after oil and suspended solids removal (e.g., most conventional U.S. onshore fields), (2) hauling offsite for deep well injection (e.g., most U.S. shale oil/gas fields), (3) treatment to achieve 29 ppm marine discharge standard (e.g., offshore Gulf of Mexico), and (4) treatment to enable direct reuse in enhanced oil production (e.g., steam flooding in California and Alberta heavy oil fields) [4]. With the more recent ramping up of hydraulic fracturing in the U.S., the cost of hauling for offsite deep well injection has risen dramatically. This, combined with the lack of available fresh water in many oil and gas producing areas (e.g., the Permian basin [5]), have led industries to consider on-site treatment for permitted discharge, direct reuse, or other beneficial reuse [2]. A typical produced water treatment train is composed of the following steps: (1) primary treatment to remove suspended solids and free oil, (2) secondary treatment to remove free oil and macroemulsion (i.e., emulsified oil droplets > 1 μm), (3) tertiary treatment to remove microemulsion (i.e., emulsified oil droplets < 1 μm) and some soluble hydrocarbons (HC’s), and (4) advanced treatment, which could involve softening, desilication and/or desalination to reduce hardness, silica, and dissolved substances (salts, metals, soluble HCs, NORM, etc.) [4].
A critical step in any produced water treatment approach is the removal of free and emulsified hydrocarbons, which typically requires chemical destabilization of emulsified oil droplets stabilized by surface charges and/or steric forces imparted by the sorption of surfactants at the oil/water interface. Mechanisms of particle destabilization include: (1) electrical double layer compression, (2) counter-ion adsorption and charge neutralization, (3) polymer adsorption and inter-particle bridging, and (4) precipitate entrapment and “sweep flocculation” [6]. As such, both chemical coagulation (CC) and electro-chemical coagulation or “electro-coagulation” (EC) processes have been widely studied for treating wastewaters with high oil and grease (O&G) content, turbidity (or suspended solids), chemical oxygen demand (COD), and total organic carbon (TOC), such as industrial oil-in-water emulsions [7,8,9], olive oil mill wastewater [10,11], textile wastewater [11,12,13], green table olive packaging industry wastewater [14], and restaurant wastewater [15]. More recently, EC was used to remove antibiotics [16], heavy metals [17], perfluorooctanoic acid [18], and refractory wastewater [19].
Conventional CC involves rapid mixing of metal salts and/or polymeric coagulants into the water to destabilize charged colloidal materials, slow mixing to enhance aggregation of destabilized particles and/or coalescence of emulsified oil droplets, and separation of particles by sedimentation, flotation, or filtration [20,21]. Similarly, EC uses sacrificial metal electrodes (typ., iron or aluminum) to supply coagulants in situ as water passes through a direct current (DC) electrochemical reactor. In EC, metal ions generated from the anode rapidly hydrolyze to form metal hydroxide precipitates, which ultimately destabilize particles through a combination of charge neutralization and sweep flocculation [22,23]. The DC electric field also migrates negatively charged species towards the positively charged sacrificial anode, enhancing interactions with metal ions and metal hydroxides [24,25,26]. Finally, H2(g) gas bubbles generated at the cathode induce some flocculation and flotation [23,27]. An additional benefit of EC is that it does not increase the chloride or sulfate content of the treated water because the anion associated with sacrificial iron or aluminum at the anode is hydroxide, produced at the cathode.
The effectiveness, efficiency, and economics of CC and EC have also been reported for various wastewaters. EC is reportedly more economical than CC for palm oil mill effluent treatment [28,29], textile wastewater and [30], in general, when coagulant demand is small [27,31]. These cost analyses mainly focused on the cost of purchasing electricity versus chemicals. However, energy demand and the cost of coagulant chemical production and transportation should also be considered. In addition, the direct comparison of EC and CC is not straight forward. Coagulants are dosed in one discrete event for CC with a fixed settling time, while there is continuous dosing for EC throughout the reactor. As such, other than electricity and chemical costs, retention time plays an important role in the capital cost of the two coagulation methods in terms of storage area and treatment tank size. Particularly when required coagulant dose is high (as for many challenging oily wastewaters), the lack of Cl or SO42− anions in EC can minimize undesirable water quality impairment by coagulant salts.
In this study, we evaluate the effectiveness, efficiency and economics of CC and EC to treat produced water, comprising surfactant-stabilized oil emulsions dispersed in a mineral rich simulated produced water matrix. Influent and effluent turbidity, COD, O&G, and TOC were determined from bench tests. Removals were scaled against the total amount of iron introduced by varying both the chemical coagulant dose and the applied current density and reaction time. Energy consumption and operating costs were calculated based on North American market data and experimentally determined operating conditions.

2. Materials and Methods

2.1. Lab Synthesized Produced Water

Synthetic produced water samples were generated in the laboratory based on previously reported produced water quality data [32]. Hexadecane and sodium dodecyl sulfate (SDS) (Sigma-Aldrich, St. Louis, Missouri, USA) were combined in a ratio of 9:1 oil-to-surfactant (w/w) [33] in the aqueous electrolyte recipe in Table 1 based on the water quality analysis in Table 2 (NaCl, CaCl2, NaHCO3, Na2SiO3, tannic acid obtained from Sigma-Aldrich, St. Louis, Missouri, USA). The SDS concentration was below its critical micelle concentration [34]. This could have led to less stable oil/water emulsions. However, such oil to surfactant ratio was enough to cause fouling on PSF membranes [33]. The mixture was stirred using an industrial blender (7011G, Waring, Torrington, CT, USA) at 22,000 rpm for 5 min. The simulated produced water samples were prepared immediately before coagulation experiments.

2.2. Chemical Coagulation Experiments

CC experiments were carried out at room temperature (20 ± 2 °C) using a bench-scale jar testing apparatus (PB-700TM Jar Tester, Phipps and Bird, Richmond, VA, USA). The CC process includes three consecutive stages: (1) rapid mixing (200 rpm, 2 min) of coagulant (FeCl3) and produced water, (2) slow mixing (25 rpm, 30 min) to promote flocculation, and (3) quiescent gravity separation (60 min). Effluent samples were withdrawn and measured immediately after gravity separation from the center of the reactor.

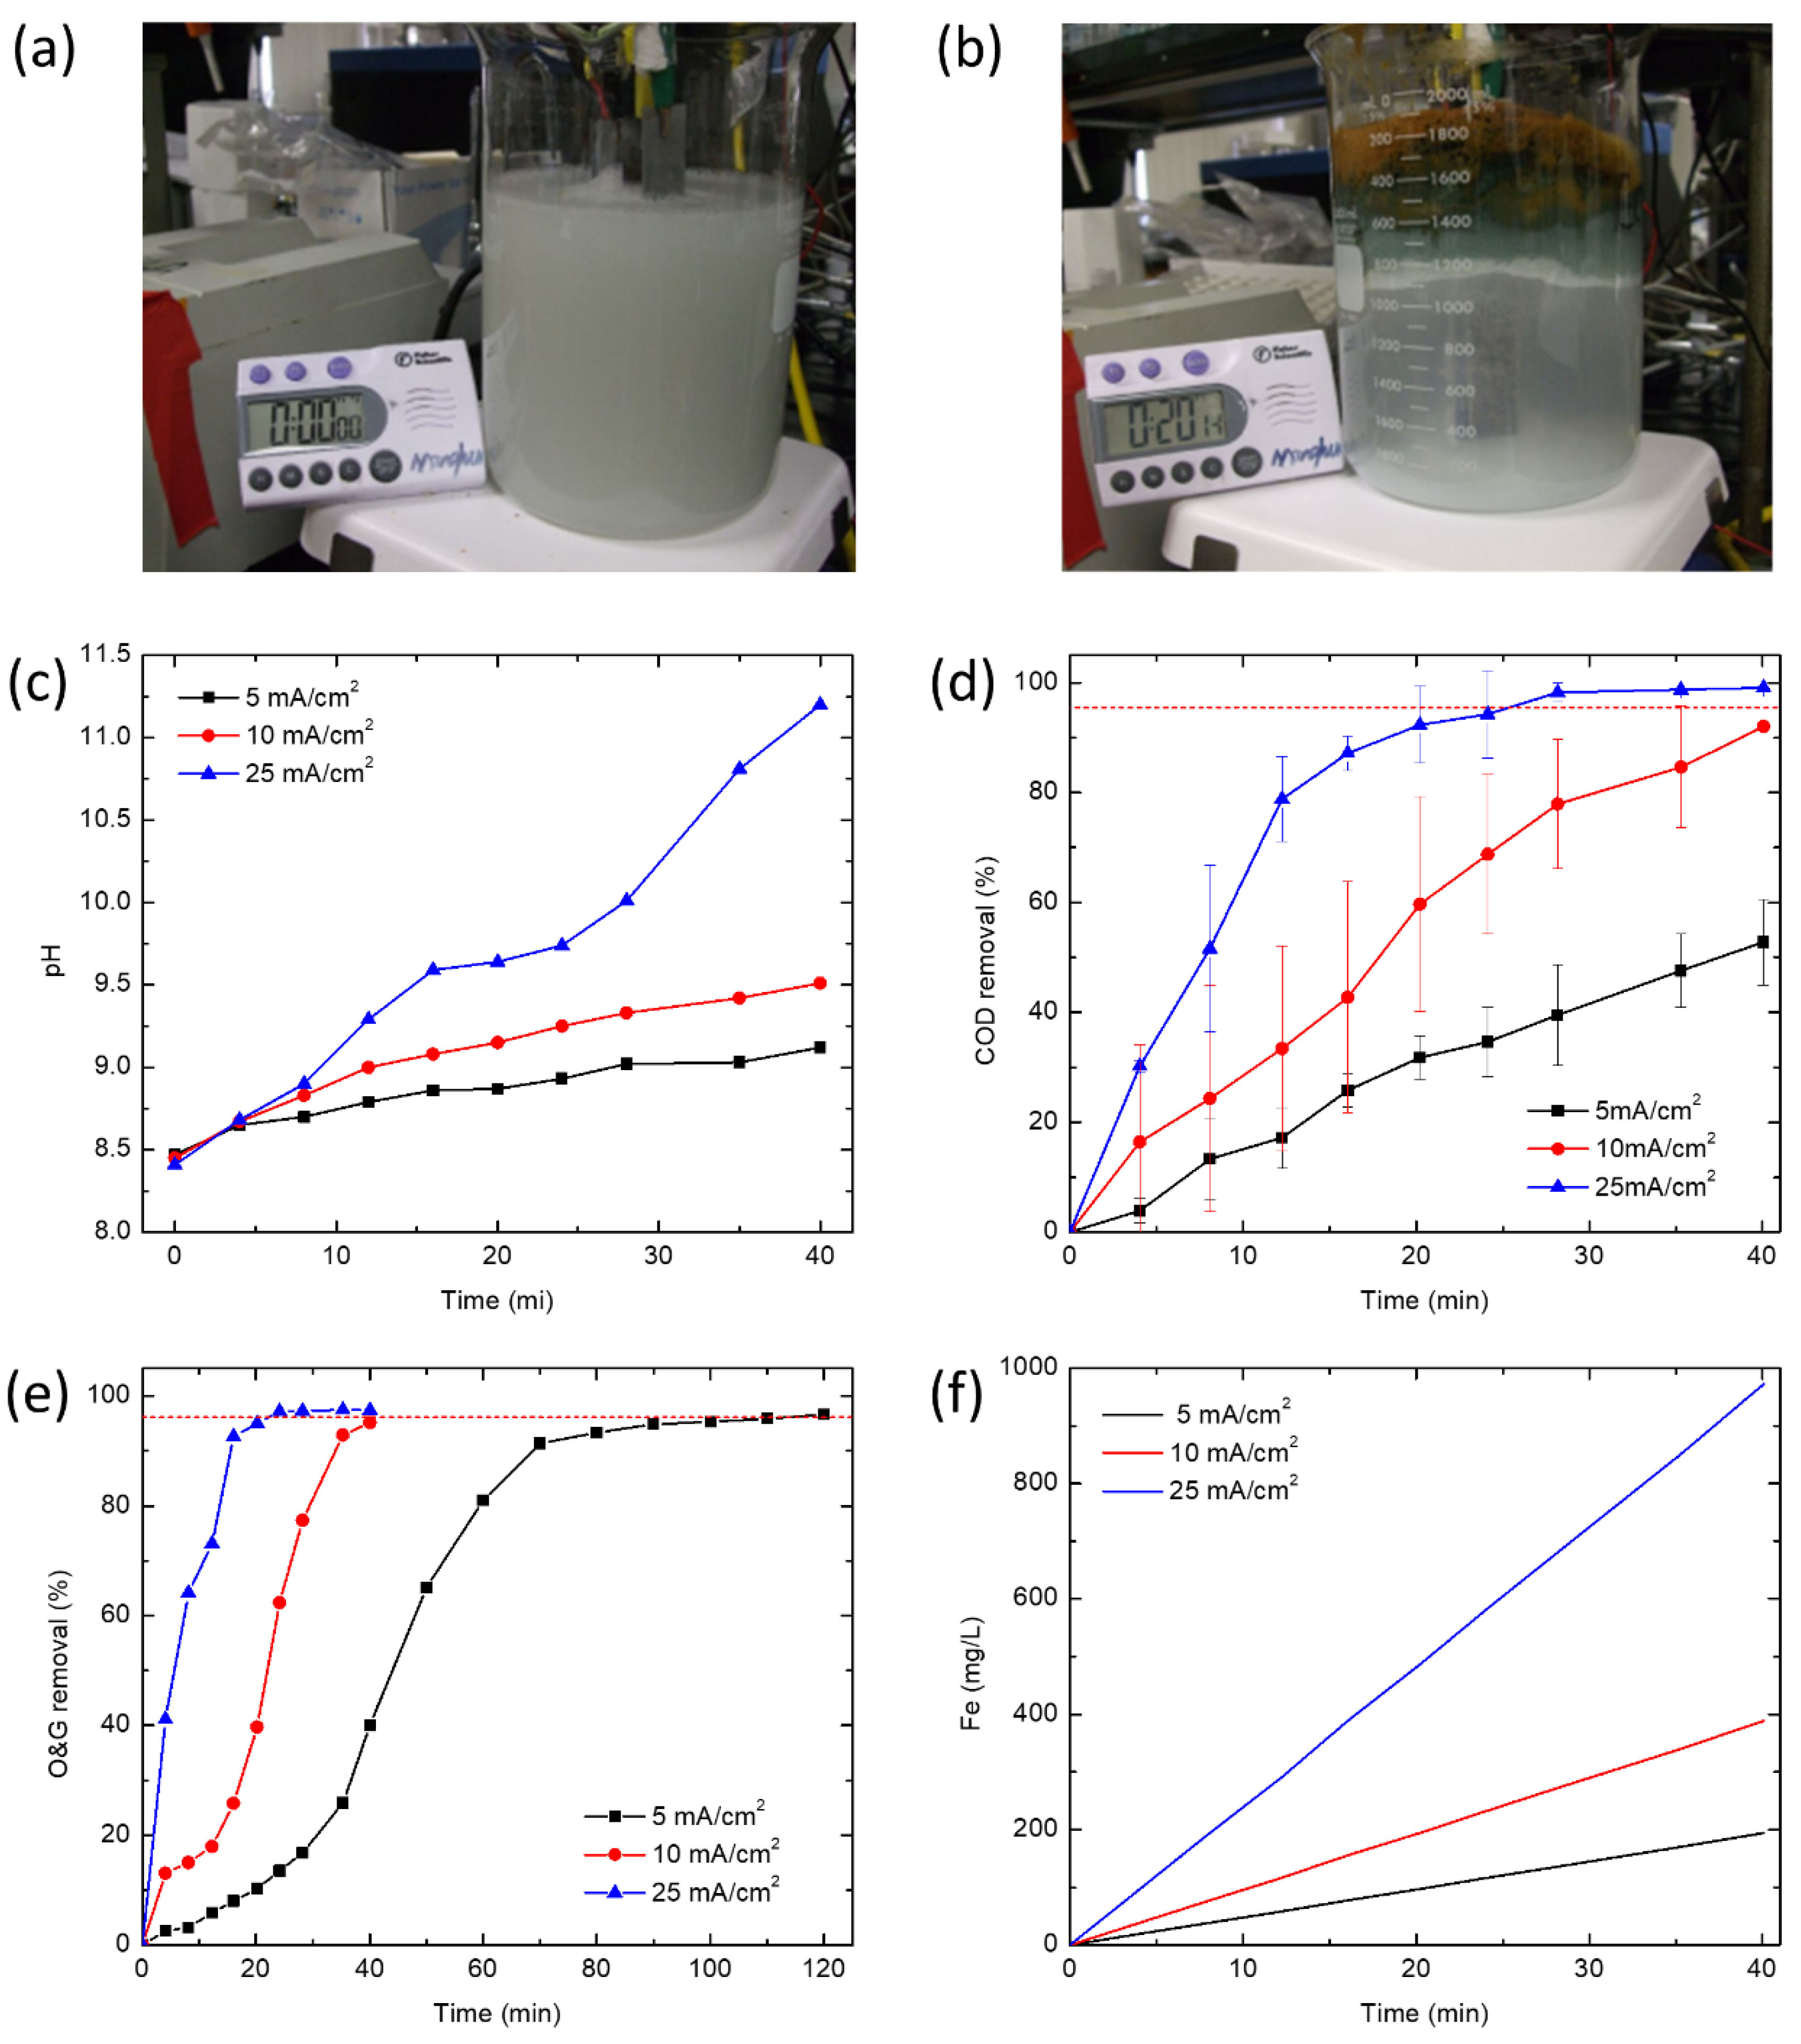
2.3. Electro-Coagulation Experiments

EC experiments were performed in a 1500 mL batch electrolytic cell under galvanostatic conditions at current densities of 5, 10 and 25 mA/cm2. Iron (Fe) plates were used as both the cathode and the sacrificial anode. The total effective electrode area for 4 electrodes was 168 cm2. Four electrodes were connected vertically with a gap of 2 cm and connected to the direct current power supply in monopolar parallel mode. Before each test, the iron electrodes were dipped in 10% HCl solution for 10 min and rinsed by deionized water to remove any residual oxides from prior experiments. Water quality indicators were characterized from samples pipetted at different time intervals from the middle layer of the reactor to account for oil removed by flotation as well as sedimentation. The reactor was stirred before samples were taken to determine the iron concentration.

2.4. Analytical Methods

Turbidity was measured using a turbidimeter (2100AN, Hach Instruments, Loveland, CO, USA). TOC was determined by a TOC analyzer (Apollo 9000, Tekmar Dohrmann, Mason, OH, USA). A calibration curve between O&G (per EPA Method 1664) and TOC was obtained from hexadecane emulsions prepared at different concentrations. O&G values reported for experiments were converted from measured TOC values using the calibration curve. COD analyses were conducted by adding the appropriate volume of sample in COD reagent vial and digesting for 2 h at 150 °C in a COD digestor (DRB200, Hach Instruments, Loveland, CO, USA). The COD was measured by a UV-vis spectrophotometer (LAMBDA 45, PerkinElmer, MA, USA) at 620 nm.

2.5. Iron Concentration Calculation

Theoretical iron concentration values were calculated using Faraday’s law, which relates current and time to the total amount of iron ions generated. It was assumed there was no loss of efficiency due to water splitting, heating, or other side reactions, and that all dissolved iron was initially produced as Fe2+ ions,
[Fe] = ItMw/FZQ,
where [Fe] is the molar iron concentration, I is the current (A), t is time (s), MW is the molecular weight of iron (55.845 g/mol), F is Faraday’s constant (96,486 C/mol), Q is the effluent volume (L), and Z is the charge of Fe2+.

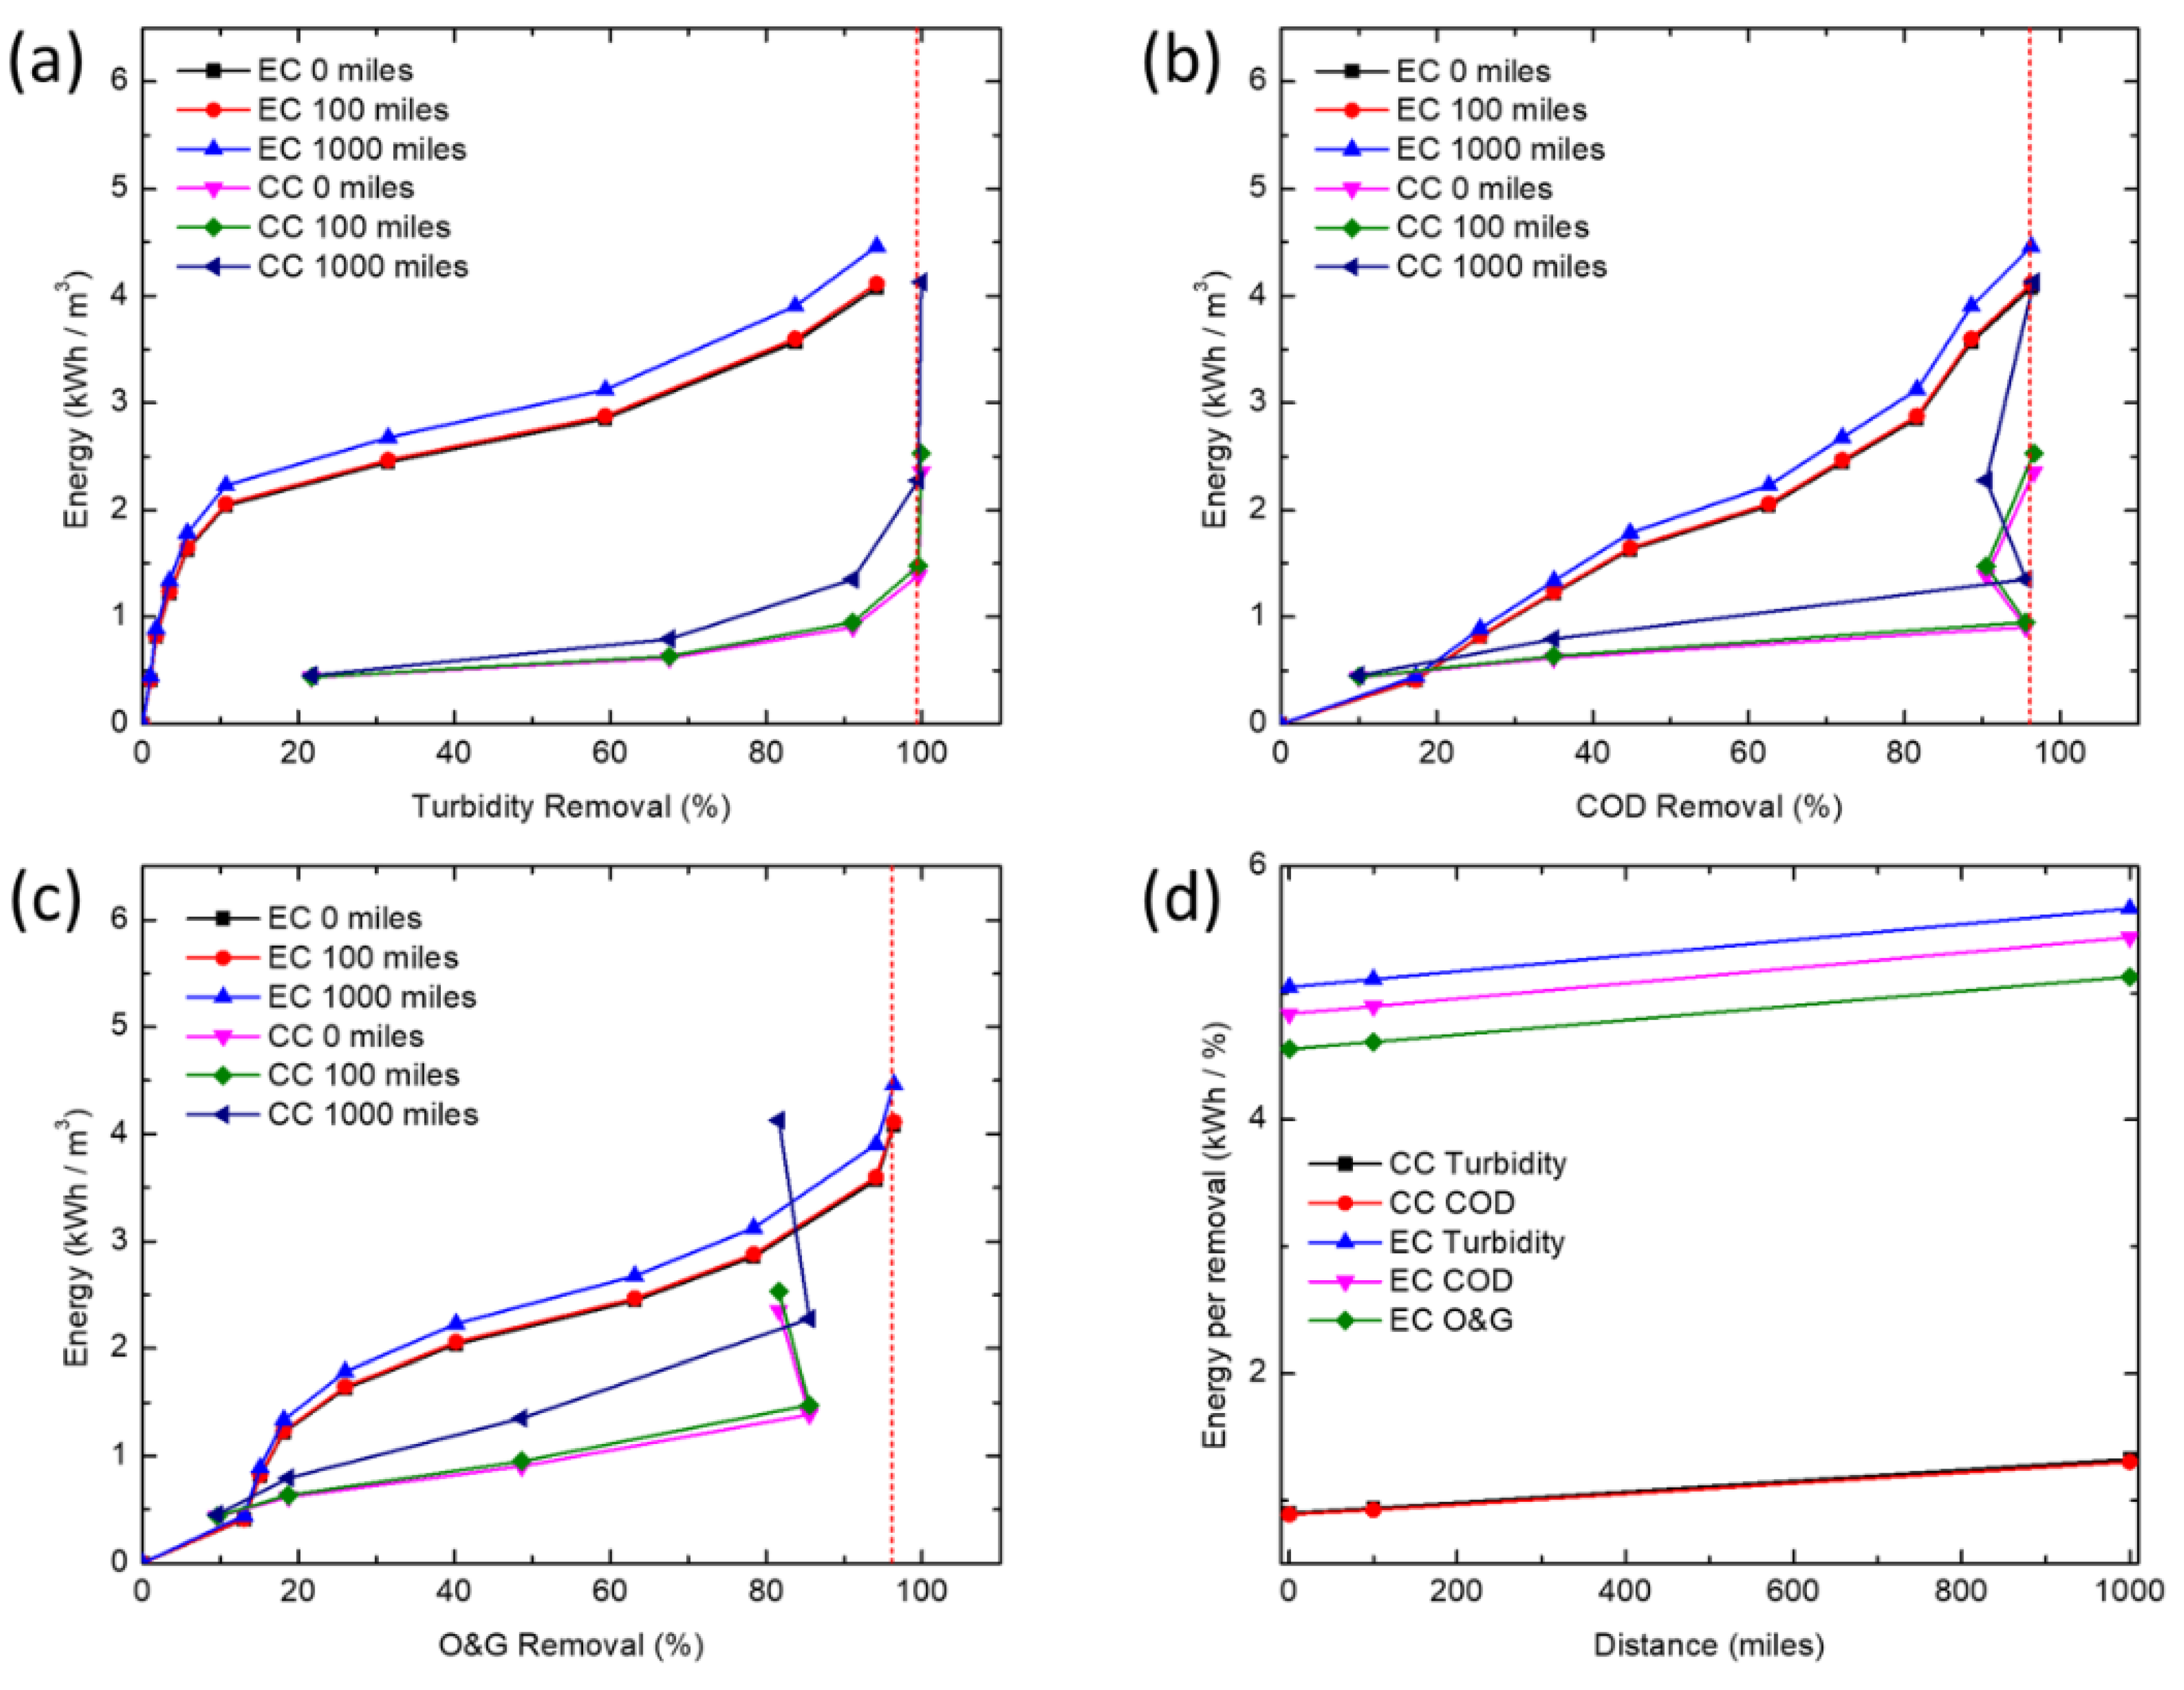
2.6. Energy Demand Calculations

The power needed for rapid mixing and flocculation in conventional CC, the power of mixing P (W) is determined from,
P = NpρN3D5,
where Np is a dimensionless power number (Np = 4, when the Reynolds number is larger than 10,000), ρ is the fluid density (kg/m3); N is the rotation speed (rpm), and D is the diameter of the impeller (m). For the energy consumption associated with transportation (e.g., moving chemicals), several assumptions were made in this study: (1) the chemical coagulant during transportation was FeCl3 in solid form; and (2) the transportation distance varied from 0 to 1000 miles. Values of the energy consumption in each process of CC were calculated based on experimental and literature data in Table 3. Energy demand by CC was calculated as follows:
E(CC) = CCpEnergy + CCTEnergy + CCMEnergy
where CCpEnergy represents the energy demandfor FeCl3 production, CCTEnergy represents the energy demand for FeCl3 transportation, and CCMEnergy represents the energy demand for mixing FeCl3.
The energy consumption per unit volume of water treated by EC includes direct electrical energy input plus the energy cost associated with the production and transportation of sacrificial iron electrode plates. The electric energy input in the EC process is calculated by the following equation:
E = UIt/Q
where U is the applied voltage (V), I is the current (A), t is reaction time (h), and Q is the volume of produced water (m3). To calculate the energy consumption associated with the transportation of iron plates, the transportation distance was varied from 0 to 1000 miles, and values of the energy consumption were calculated based on experimental and literature data (Table 4). The energy demand of EC was calculated using the following equation:
E(EC) = ECPEnergy + ECTEnergy + ECDEnergy
where ECPEnergy represents the energy demand for iron sheet production, ECTEnergy represents the energy demand for iron sheet transportation, and ECDEnergy represents the energy demand for iron dissolution.

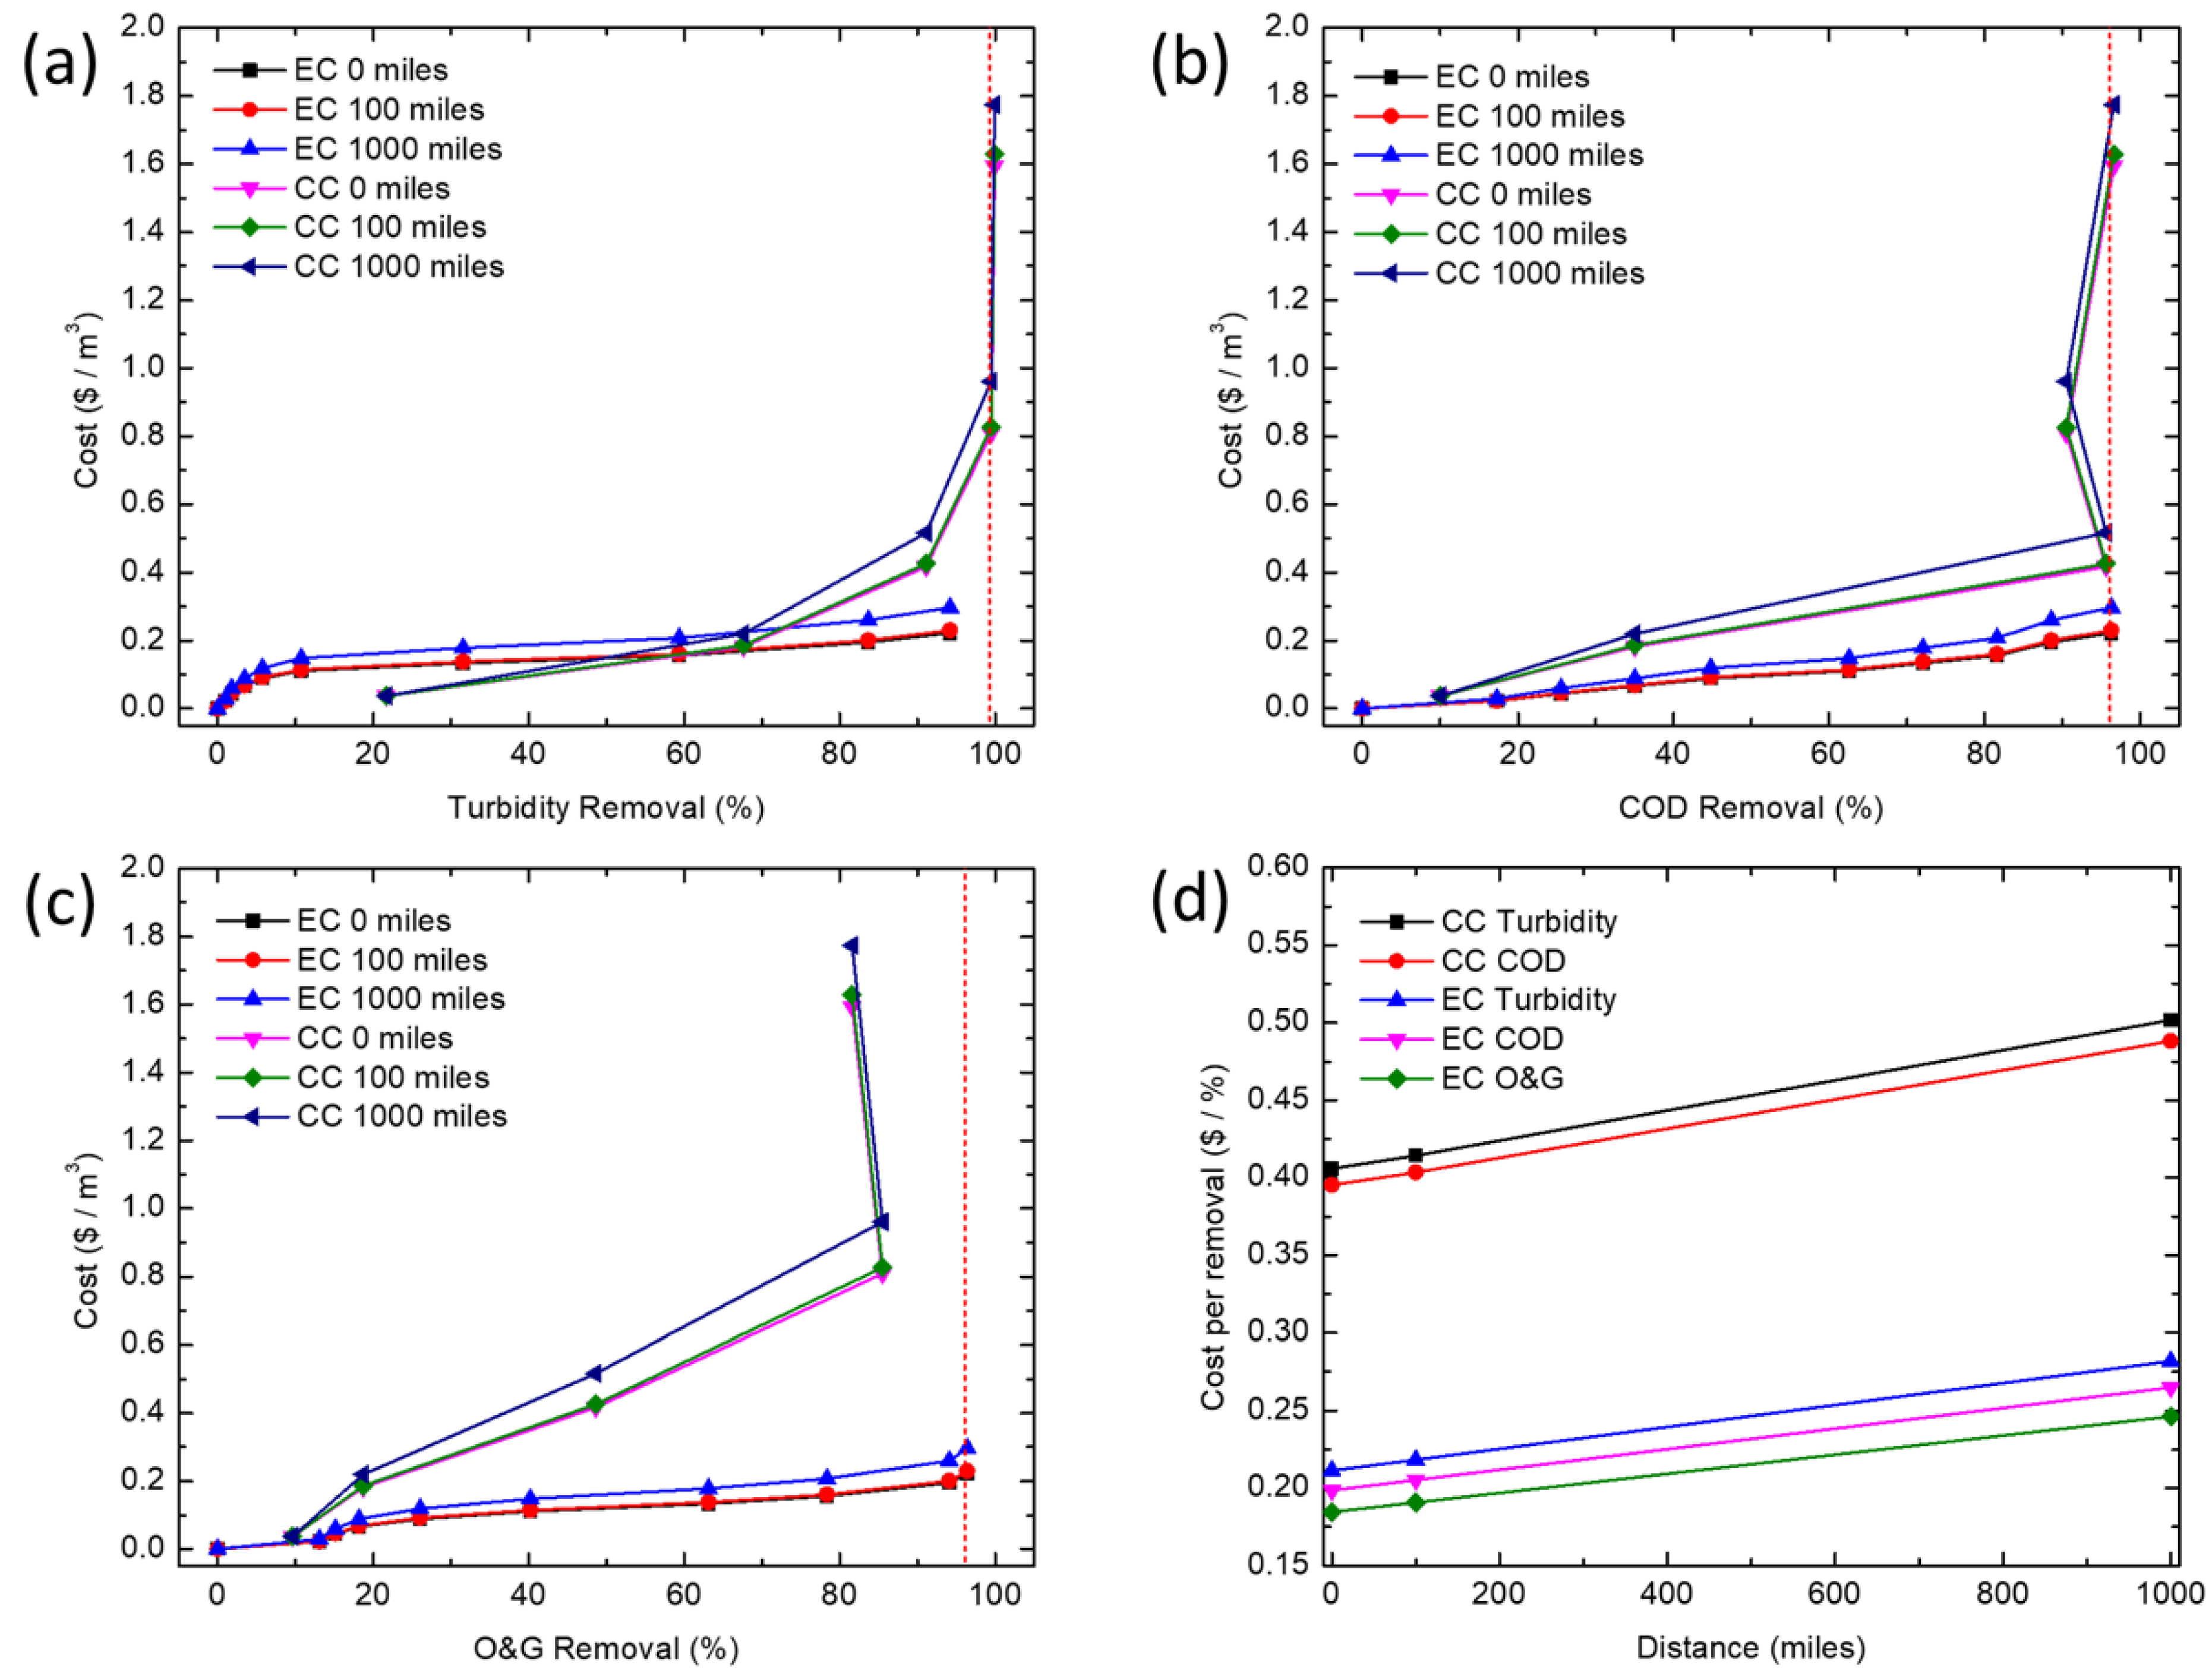
2.7. Operating Cost Calculations

The operating cost per unit volume of produced water treated by CC includes the cost of electricity used for mixing (rapid and slow mixing), and the cost of purchasing and moving the chemical coagulant. The cost of electricity in mixing is calculated based on the mixing energy consumption and the electricity cost. The price of purchasing and moving a chemical coagulant is estimated based on market prices (Table 5). The operating cost per unit volume of produced water sample treated by EC includes the cost of electricity used to power (i.e., dissolve the iron) the process, and the cost of purchasing and transporting the iron electrodes. The cost of electricity was calculated based on the electrical energy consumption and the electricity cost. The price of purchasing and transporting the iron electrodes was estimated based on market prices (Table 5). The costs of chemicals and EC were calculated using Equations (6) and (7), respectively:
C(CC) = CCTCost + CCPCost + CCECost
where CCTCost represents the cost for FeCl3 transportation, CCPCost represents the price of FeCl3, and CCECost represents the electricity cost for FeCl3 mixing.
C(EC) = ECTCost + ECPPCost + ECSPCost + ECECost
where ECTCost represents the cost for sheet iron transportation, ECPPCost represents the cost for pig iron, ECSPCost represents the price of electricity for sheet iron production, and ECECost represents the electricity price for iron dissolution. Additional equations of each component are given in Table 6.

3. Results and Discussion

3.1. Electro-Coagulation

Figure 1a,b show the physical appearance of the effluent before treatment and after EC for 20 min. Before treatment, the effluent is a homogeneous white milky solution. After 20 min of EC at 32 mA/cm2 (data not reported), three distinct layers can be distinguished as the floating floc, middle “clean” layer and sedimented precipitate layer. The floating floc was mostly formed from precipitate adsorption onto H2(g) gas bubbles produced by the reduction of H+(aq) ions at the cathode. Green and brown colors characteristic of Fe2+ and Fe3+ ions, respectively, indicate the presence of both oxidation states of iron in the floating floc and the sedimented precipitates.
The solution pH increased with time, particularly when high (25 mA/cm2) current densities were applied, with the pH increasing from 8.4 to 11.2 over the experiment (Figure 1c). For the lower current densities (5 and 10 mA/cm2), the pH only increased slightly from pH 8.5 to pH 9.5, and from pH 8.5 to pH 9.1, respectively. The pH increase results from the reduction of H3O+ ions into H2(g) and OH ions at the cathode, which is not stoichiometrically balanced by Fe2+/3+ ions produced at the anode; the charge is balanced, but some iron reacts with oil emulsions and other anionic species, so there is continuous production of excess OH that drives up the pH. Empirically, the evolution of H2(g) gas bubbles at the cathode was visibly much higher at 25 than 10 and 5 mA/cm2. This could explain the exceptional O&G removal performance at 25 mA/cm2 compared to 5 and 10 mA/cm2, due to H2(g) gas bubbles-derived flotation.
Figure 1d,e show COD and O&G removal, respectively, as a function of time. The red dashed line represents the removal needed to meet the offshore discharge limit of 29 ppm O&G and 125 ppm COD (in the U.S. Gulf of Mexico). EC achieves these discharge limits within 28 min at 25 mA/cm2, but took longer to reach the O&G discharge limit at 5 and 10 mA/cm2. Figure 1f presents the theoretical dissolved iron concentration as a function of time, estimated using Faraday’s law. Comparing Figure 1d,e with Figure 1f, the rate of iron dissolution at different current densities correlates with the removal rates of COD and O&G. Operating EC at 25 mA/cm2 allowed the fastest iron dissolution rate, which in turn led to the fastest COD and O&G removal, followed by 10 mA/cm2 and then 5 mA/cm2. Longer reaction times are required for lower current densities to release the same amount of iron coagulant into the water. For example, at 40 min, O&G removal achieved using a current density of 25 mA/cm2 was the same as that achieved at 120 min using a current density of 5 mA/cm2.

3.2. Effectiveness of Chemical Coagulation and Electro-Coagulation

Figure 2 illustrates the removal and concentrations of turbidity, COD, and O&G as a function of iron concentration, for CC and EC at different current densities. Table 7 presents the discharge limit that needs to be reached in order to meet offshore discharge regulations. CC performs better than EC in terms of turbidity removal, while 345 mg/L of iron is required to reach the discharge limit (25 NTU turbidity) using CC [43]. For EC, a slightly higher concentration of 389 mg/L of iron is required at a current density of 10 mA/cm2. Turbidity removal by EC was not able to meet the discharge limit (highest 98.1%). However, CC was unable to remove sufficient O&G to reach the discharge limit (29 mg/L O&G) [44], achieving, at a maximum, only 85.5% removal. In contrast, EC achieved 97.4% O&G removal. Importantly, overdosing the chemical coagulant did not improve O&G removal, but instead restabilized the flocs, resulting in lower O&G removal rates (Figure 2c). The highest removals achieved by CC were 99.9% (turbidity), 96.6% (COD) and 85.5% (O&G). The highest removals achieved by EC were 98.1% (turbidity), 99.1% (COD) and 97.4% (O&G). Overall, EC could adequately remove COD and O&G to meet the discharge limit, and while CC was unable to reach the discharge limit for O&G, it was able to reach sufficient turbidity removal to meet discharge limits. COD and O&G removal by both coagulation methods were above 90%, which is consistent with previous research [7,27].
It is known that CC lowers effluent pH, while EC does the opposite [6,45]. Low removal rates at lower iron concentrations for EC compared to CC could be due to the anionic surfactant stabilizing effects at higher pH. These changes in pH affect the zeta potential of suspended particles, causing them to either destabilize or stabilize [7]. In previous studies, hexadecane and silica have been shown to have increasingly negative zeta potentials beyond the isoelectric point (at around pH 2) as the pH increases from 2 to 9 [46,47]. While changes in the zeta potential of silica and hexadecane do not work in favor of EC at high pH, the dissolution of sufficient iron coagulant is able to destabilize the suspension, resulting in continuous removal of COD, turbidity and O&G with increased iron concentration (Figure 2). This may explain the high concentration of iron needed during EC before COD and O&G removal reached the discharge limit. The exceptional removal of O&G by EC compared to CC could be caused by floc flotation. The production of H2(g) gas bubbles that evolve from the cathode during EC serve as a surface for the coalescence of oil droplets before floating towards the water surface. This is consistent with a study that has shown improvement in O&G removal when microbubbles were coupled with a chemical coagulant [48].

3.3. Energy Consumption of Chemical Coagulation and Electro-Coagulation

The energy demand for CC includes direct energy input for mixing (rapid mixing and flocculation), as well as energy associated with the production and transportation of the chemical coagulant. For EC, the energy demand is associated with the production and transportation of iron electrodes, along with the electric energy consumed onsite. Input values for energy demand calculations are provided in Table 3 and Table 4. For EC, 10 mA/cm2 was chosen for energy demand analysis because of its fast Fe dissolution and, at the same time, minimal side reactions.
The energy demand of CC and EC are shown in Figure 3 as functions of transportation distances (for coagulant chemicals and iron electrodes) and removal of turbidity in Figure 3a, COD in Figure 3b and O&G in Figure 3c. The red dashed lines represent the removal required to meet offshore discharge limits. EC is a highly energy intensive process. The energy demands of EC is consistently higher than CC at all removal rates and transport distances. In Figure 3d, the energy demand per order of removal (90% removal) of turbidity and COD for EC was around 4.3 times that of CC when no transportation was required (at 0 miles). Energy per order removal of O&G using CC could not be calculated since the highest removal achieved was only 85.5%. At 1000 miles of transportation distance, the total energy consumption (compared to 0 miles transportation distance) using EC increased by 8.6%, while the total energy consumption using CC increased by 32%. Transporting FeCl3 is much more energy-intensive than transporting Fe plates. In iron salts, iron is a much smaller mass fraction (e.g., 21% w/w for Fe/FeCl3•6H2O) of the chemical than for solid iron plates. Thus, the energy demand of FeCl3 transportation is largely governed by the inactive fraction of metal salt coagulants. For EC, on the other hand, with efficient usage, the mass of raw materials used in EC could account for almost all of the coagulant produced. As distances increased, energy consumption increased proportionally. Transportation of electrode iron was a significant, but small, fraction of EC energy demand. As iron is a commonly used material, there is a good possibility that the local availability of iron is higher than FeCl3. In other words, it is likely that produced water treatment facilities will need to purchase chemical coagulant from vendors in other places, which introduces more transportation energy consumption.

3.4. Comparison of Operating Costs

Input values used to determine operating costs of CC and EC are shown in Table 6. In Figure 4, operating costs for CC and EC (10 mA/cm2) are compared for a range of removals and transportation distances for turbidity in Figure 4a, COD in Figure 4b and O&G in Figure 4c. Although the energy demand of EC is much higher than that required for CC, operating costs are higher for CC than EC, particularly for removal above 90%. Comparing the cost of iron coagulant at which both methods achieve an order of removal (Figure 4d), the cost of using CC is around 1.8 to 2 times the cost of using EC within 0 to 1000 miles transportation distance for turbidity and COD removal. CC did not meet the discharge limit for O&G at any concentration tested. The unit price of the chemical coagulant was four times higher than iron metal, and price per unit of Fe from the chemical coagulant is 11.5 times higher than pure iron. Since transportation costs are governed by the weight of inactive components of the chemical coagulant, if a cheaper coagulant, FeSO4, is used and assuming the same amount of iron is required to reach equivalent rejection, the cost of using CC would still be higher because the unit price of iron from FeSO4 is four times higher than iron metal (because of the high water content). On the other hand, both the costs of iron electrodes and electricity used for in situ production of the iron-based coagulant were smaller for EC. However, electricity costs vary by location and the price of electricity used in this cost analysis is based on industrial pricing in the U.S. Where electricity is much cheaper (e.g., the Middle East), EC could have an even greater advantage, whereas in places with more expensive electricity, EC may lose its cost advantage.
Another advantage of using EC found in this study is that the time required to achieve equivalent removals were much longer for CC (92 min) than for EC (up to 40 min). Therefore, the size of equipment needed for CC would be proportionately larger; hence, the capital cost and footprint of CC reactors and clarifiers may be higher. Further, as FeCl3 is corrosive and attacks metals rapidly, it should be stored in either fiberglass-reinforced polyester or rubber-lined steel tanks and not in containers made with aluminum, brass or stainless steel; hence, chemical coagulants (FeCl3) may require special onsite storage and handling, which further increase capital and EH&S costs [49].

4. Conclusions

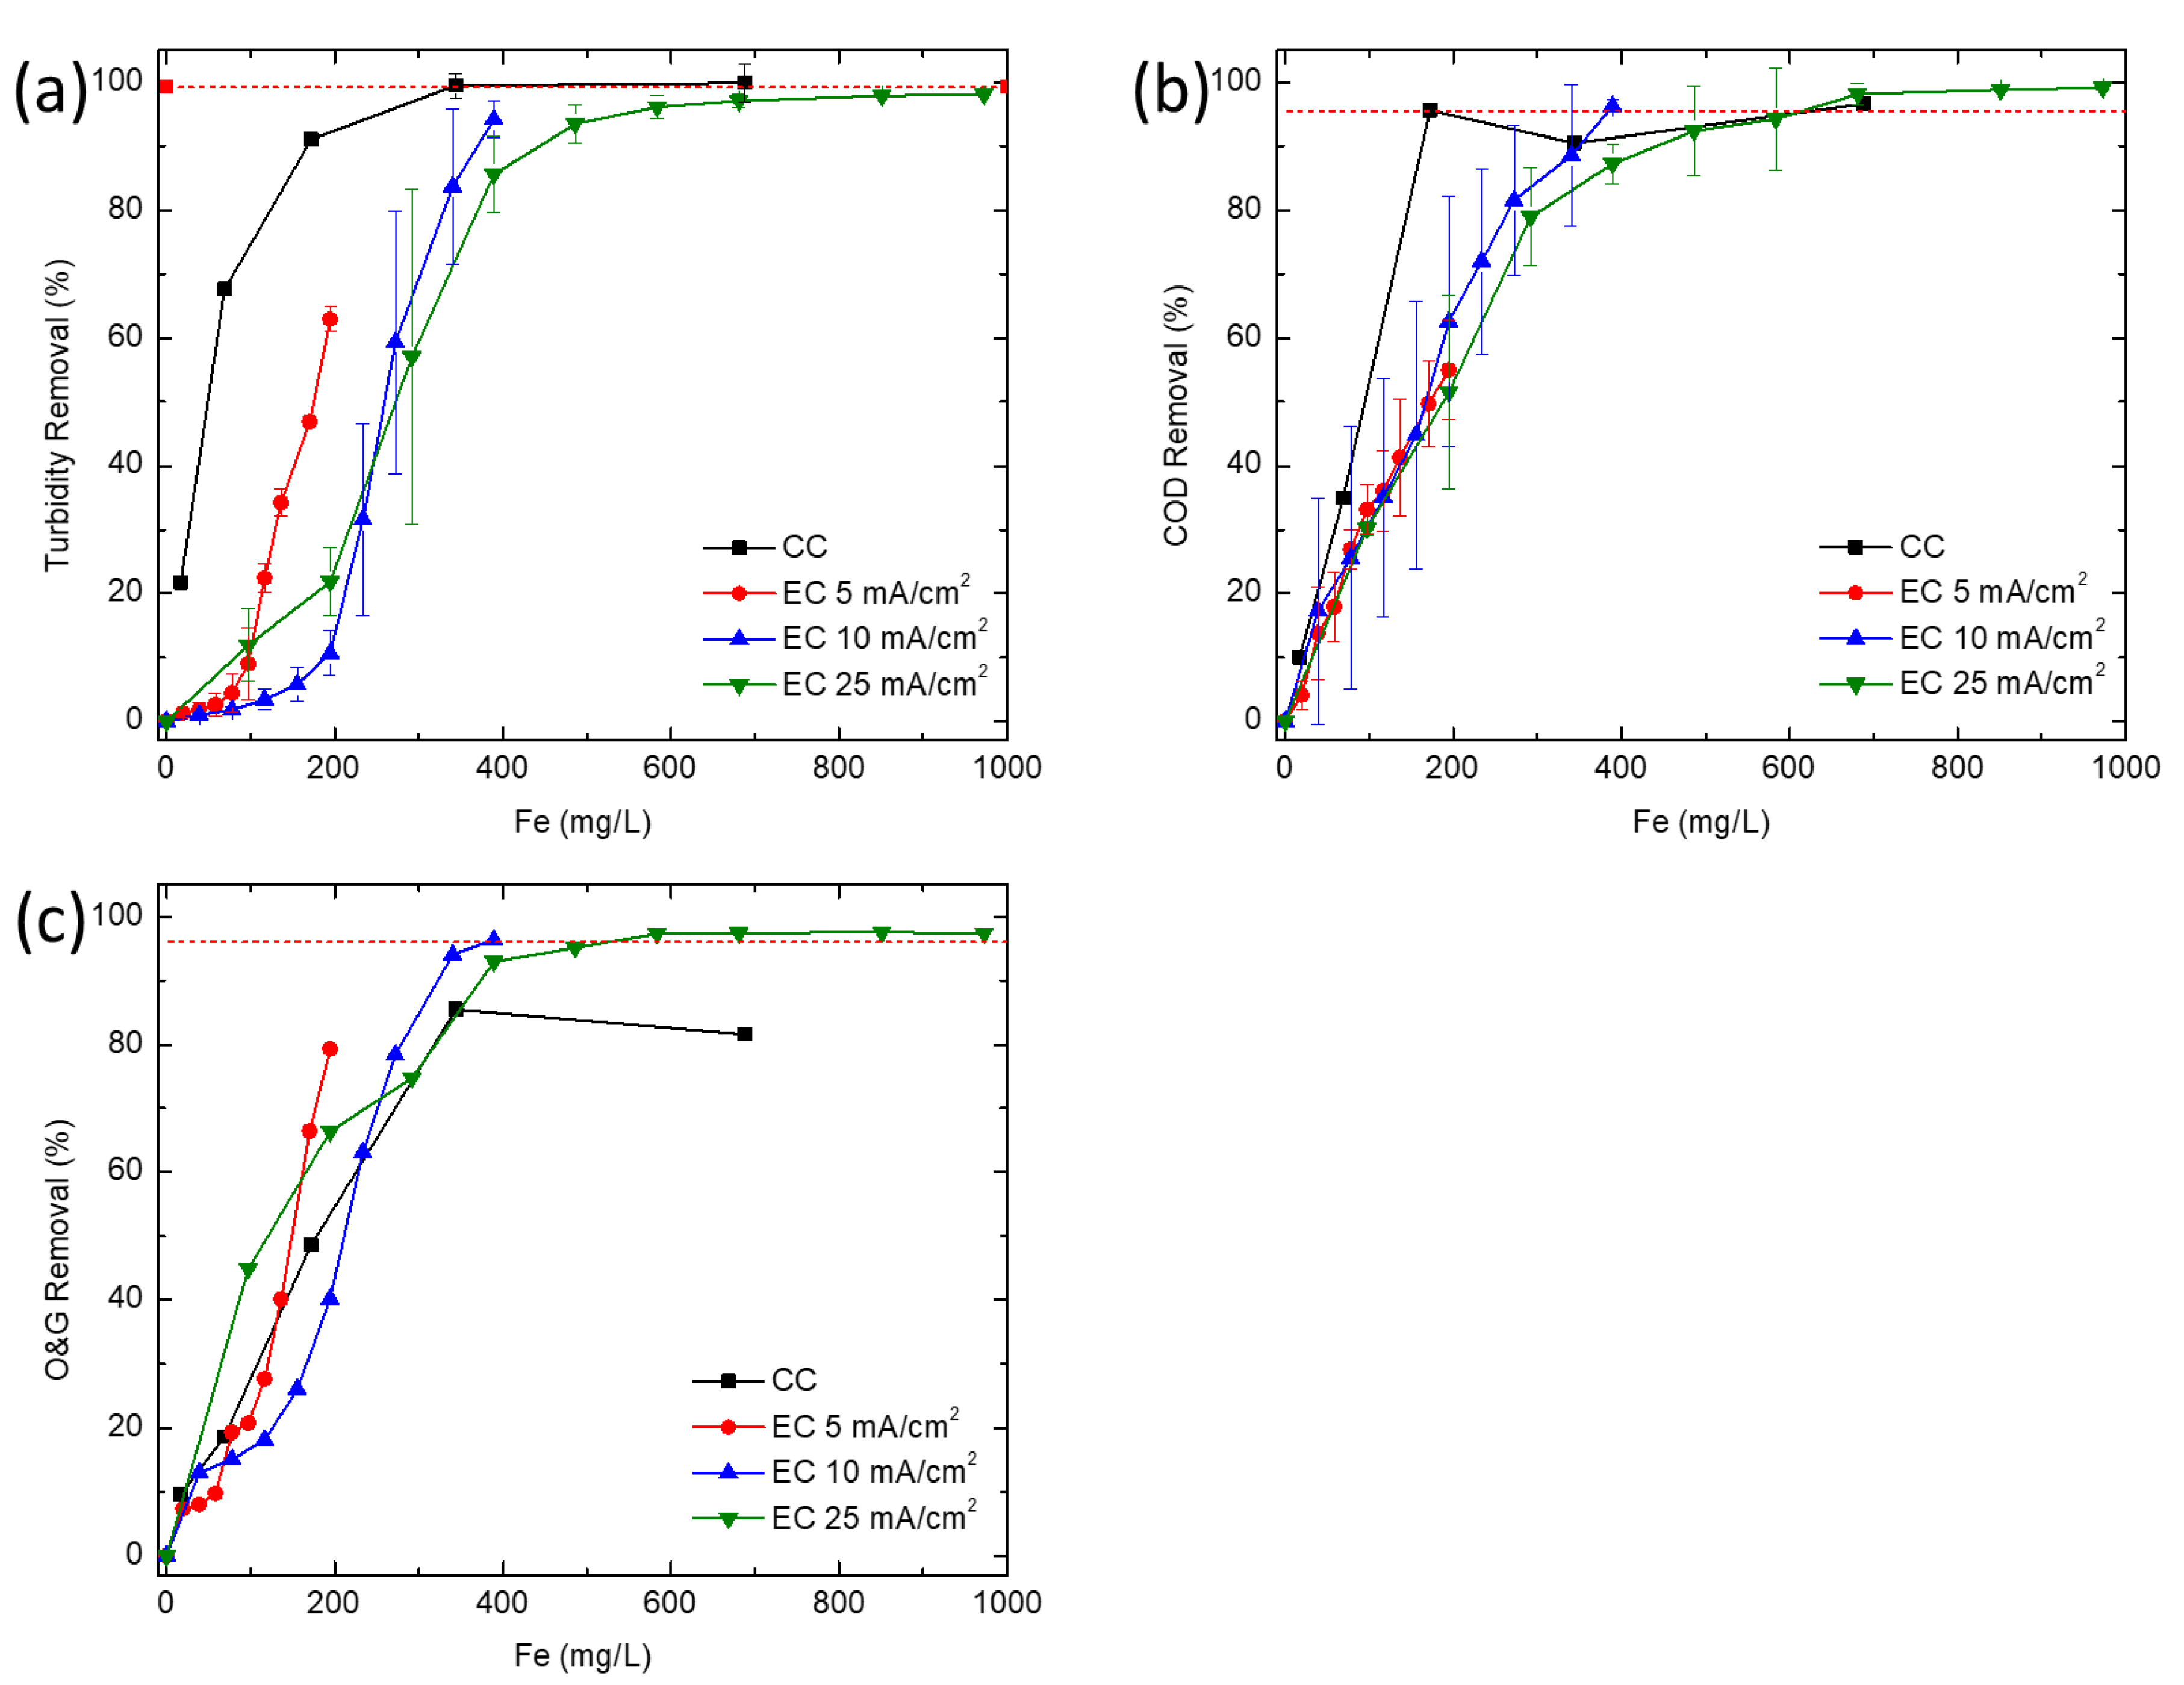
In this study, CC and EC were compared for the removal of turbidity, COD and O&G from a simulated synthetic produced water. CC was able to achieve high COD and turbidity removals at much lower concentrations of iron than EC, but is unable to effectively remove enough O&G to meet offshore discharge limits, even at very high coagulant doses (>345 mg/L). At higher iron concentrations, EC removed COD and O&G adequately to meet typical discharge standards, whereas CC would require additional treatment (e.g., flotation or filtration) to meet most O&G discharge limits. Coagulant overdose leading to poorer coagulation performance seems to only affect CC. This points to the need for extensive testing before an optimum dosage of chemical coagulant can be established, thus further increasing operational costs. While CC is a more established and proven technology, EC offers certain advantages for resource extraction industries such as oil and gas. In particular, oil production is increasingly being explored in remote locations (e.g., offshore, Gulf of Mexico, Athabasca oil sands, Alaskan North Slope, Central Australia, etc.) far from major chemical production centers, so supplying water treatment chemicals could pose significant logistics challenges, energy demand, and high cost for produced water treatment. Additionally, EC offers the opportunity for more compact systems while minimizing onsite chemical storage. Processes such as EC, where water treatment chemistry is generated in situ and onsite, may reduce the energy demand and operating costs associated with meeting existing and future produced water treatment requirements.

Author Contributions

Conceptualization, M.L. and E.M.V.H.; data curation, C.M.K. and J.W.; formal analysis, C.M.K., J.W., M.L. and B.A.O.; funding acquisition, E.M.V.H., R.B.K., D.J.; investigation, J.W., M.L. and B.A.O.; methodology, J.W., M.L., E.M.V.H.; project administration, E.M.V.H.; resources, E.M.V.H.; supervision, D.J. and E.M.V.H.; visualization, J.W. and E.M.V.H.; writing—original draft, J.W.; writing—review and editing, C.M.K., D.J., R.B.K., E.M.V.H. All authors have read and agreed to the published version of the manuscript.

Funding

This research was supported in part by funding provided by Abraxis Bioscience, the UCLA Samueli Engineering School, the UCLA Department of Civil & Environmental Engineering, the Sustainable L.A. Grand Challenge, the California Energy Commission (CERC-WET), Ocean Therapy Solutions, and the National Science Foundation (Award No. 1553756). JW was funded in part by a scholarship from the Chinese Scholarship Council.

Acknowledgments

The original research was performed when J.W., M.L. and B.A.O were enrolled at UCLA. Final analysis and writing was performed by C.M.K.

Conflicts of Interest

The authors declare no conflict of interest. The funders had no role in the design of the study; in the collection, analyses, or interpretation of data; in the writing of the manuscript, or in the decision to publish the results.

References

  1. Neff, J.; Lee, K.; DeBlois, E.M. Produced water: Overview of composition, fates, and effects. In Produced Water; Springer: Berlin/Heidelberg, Germany, 2011; pp. 3–54. [Google Scholar] [CrossRef]
  2. Veil, J.A.; Puder, M.G.; Elcock, D.; Redweik, R.J., Jr. A White Paper Describing Produced Water from Production of Crude Oil, Natural Gas, and Coal Bed Methane; Argonne National Lab: Lemont, IL, USA, 2004. [Google Scholar]
  3. Duraisamy, R.T.; Beni, A.H.; Henni, A. Chapter 9: State of the art treatment of produced water. Water Treat. 2013, 199–222. [Google Scholar] [CrossRef] [Green Version]
  4. Wang, A.D.H.J.; Bhattacharjee, S.; Edalat, A. Produced Water Management in Upstream Oil and Gas Production; Morgan & Claypool Publishers: San Rafael, CA, USA, 2020. [Google Scholar]
  5. Scanlon, B.R.; Reedy, R.C.; Male, F.; Walsh, M. Water Issues Related to Transitioning from Conventional to Unconventional Oil Production in the Permian Basin. Environ. Sci. Technol. 2017, 51, 10903–10912. [Google Scholar] [CrossRef] [PubMed]
  6. Crittenden, J.C.; Trussell, R.R.; Hand, D.W.; Howe, K.J.; Tchobanoglous, G. Water Treatment: Principles and Design, 2nd ed.; John Wiley & Sons, Inc.: Hoboken, NJ, USA, 2005. [Google Scholar]
  7. Canizares, P.; Martinez, F.; Jimenez, C.; Saez, C.; Rodrigo, M.A. Coagulation and electrocoagulation of oil-in-water emulsions. J. Hazard. Mater. 2008, 151, 44–51. [Google Scholar] [CrossRef] [PubMed]
  8. Canizares, P.; Martinez, F.; Lobato, J.; Rodrigo, M. Break-up of oil-in-water emulsions by electrochemical techniques. J. Hazard. Mater. 2007, 145, 233–240. [Google Scholar] [CrossRef] [PubMed]
  9. Changmai, M.; Pasawan, M.; Purkait, M.K. Treatment of oily wastewater from drilling site using electrocoagulation followed by microfiltration. Sep. Purif. Technol. 2019, 210, 463–472. [Google Scholar] [CrossRef]
  10. Adhoum, N. Decolourization and removal of phenolic compounds from olive mill wastewater by electrocoagulation. Chem. Eng. Process. 2004, 43, 1281–1287. [Google Scholar] [CrossRef]
  11. Flores, N.; Brillas, E.; Centellas, F.; Rodríguez, R.M.; Cabot, P.L.; Garrido, J.A.; Sirés, I. Treatment of olive oil mill wastewater by single electrocoagulation with different electrodes and sequential electrocoagulation/electrochemical Fenton-based processes. J. Hazard. Mater. 2018, 347, 58–66. [Google Scholar] [CrossRef]
  12. Kobya, M.; Bayramoglu, M.; Eyvaz, M. Techno-economical evaluation of electrocoagulation for the textile wastewater using different electrode connections. J. Hazard. Mater. 2007, 148, 311–318. [Google Scholar] [CrossRef]
  13. Papadopoulos, K.P.; Argyriou, R.; Economou, C.N.; Charalampous, N.; Dailianis, S.; Tatoulis, T.I.; Tekerlekopoulou, A.G.; Vayenas, D.V. Treatment of printing ink wastewater using electrocoagulation. J. Environ. Manag. 2019, 237, 442–448. [Google Scholar] [CrossRef]
  14. García-García, P.; López-López, A.; Moreno-Baquero, J.M.; Garrido-Fernández, A. Treatment of wastewaters from the green table olive packaging industry using electro-coagulation. Chem. Eng. J. 2011, 170, 59–66. [Google Scholar] [CrossRef]
  15. Chen, G.H.; Chen, X.M.; Yue, P.L. Electrocoagulation and electroflotation of restaurant wastewater. J. Environ. Eng. ASCE 2000, 126, 858–863. [Google Scholar] [CrossRef]
  16. Baran, W.; Adamek, E.; Jajko, M.; Sobczak, A. Removal of veterinary antibiotics from wastewater by electrocoagulation. Chemosphere 2018, 194, 381–389. [Google Scholar] [CrossRef] [PubMed]
  17. Al-Qodah, Z.; Al-Shannag, M. Heavy metal ions removal from wastewater using electrocoagulation processes: A comprehensive review. Sep. Sci. Technol. 2017, 52, 2649–2676. [Google Scholar] [CrossRef]
  18. Kim, M.-K.; Kim, T.; Kim, T.-K.; Joo, S.-W.; Zoh, K.-D. Degradation mechanism of perfluorooctanoic acid (PFOA) during electrocoagulation using Fe electrode. Sep. Purif. Technol. 2020, 247, 116911. [Google Scholar] [CrossRef]
  19. Xu, X.; Zhu, X. Treatment of refectory oily wastewater by electro-coagulation process. Chemosphere 2004, 56, 889–894. [Google Scholar] [CrossRef]
  20. Rossini, M.; Garrido, J.G.; Galluzzo, M. Optimization of the coagulation-flocculation treatment: Influence of rapid mix parameters. Water Res. 1999, 33, 1817–1826. [Google Scholar] [CrossRef]
  21. Chawaloesphonsiya, N.; Guiraud, P.; Painmanakul, P. Analysis of cutting-oil emulsion destabilization by aluminum sulfate. Environ. Technol. 2018, 39, 1450–1460. [Google Scholar] [CrossRef]
  22. Mollah, M.Y.A.; Schennach, R.; Parga, J.R.; Cocke, D.L. Electrocoagulation (EC)—Science and applications. J. Hazard. Mater. 2001, 84, 29–41. [Google Scholar] [CrossRef]
  23. Garcia-Segura, S.; Eiband, M.M.S.G.; de Melo, J.V.; Martínez-Huitle, C.A. Electrocoagulation and advanced electrocoagulation processes: A general review about the fundamentals, emerging applications and its association with other technologies. J. Electroanal. Chem. 2017, 801, 267–299. [Google Scholar] [CrossRef] [Green Version]
  24. Mollah, M.; Morkovsky, P.; Gomes, J.; Kesmez, M.; Parga, J.; Cocke, D. Fundamentals, present and future perspectives of electrocoagulation. J. Hazard. Mater. 2004, 114, 199–210. [Google Scholar] [CrossRef]
  25. Moussa, D.T.; El-Naas, M.H.; Nasser, M.; Al-Marri, M.J. A comprehensive review of electrocoagulation for water treatment: Potentials and challenges. J. Environ. Manag. 2017, 186, 24–41. [Google Scholar] [CrossRef] [PubMed]
  26. Elazzouzi, M.; Haboubi, K.; Elyoubi, M.S. Electrocoagulation flocculation as a low-cost process for pollutants removal from urban wastewater. Chem. Eng. Res. Des. 2017, 117, 614–626. [Google Scholar] [CrossRef]
  27. Cañizares, P.; Martínez, F.; Jiménez, C.; Sáez, C.; Rodrigo, M.A. Technical and economic comparison of conventional and electrochemical coagulation processes. J. Chem. Technol. Biotechnol. 2009, 84, 702–710. [Google Scholar] [CrossRef]
  28. Phalakornkule, C.; Mangmeemak, J.; Intrachod, K.; Nuntakumjorn, B. Pretreatment of palm oil mill effluent by electrocoagulation and coagulation. Scienceasia 2010, 36, 142–149. [Google Scholar] [CrossRef]
  29. An, C.; Huang, G.; Yao, Y.; Zhao, S. Emerging usage of electrocoagulation technology for oil removal from wastewater: A review. Sci. Total Environ. 2017, 579, 537–556. [Google Scholar] [CrossRef]
  30. Bayramoglu, M.; Eyvaz, M.; Kobya, M. Treatment of the textile wastewater by electrocoagulation: Economical evaluation. Chem. Eng. J. 2007, 128, 155–161. [Google Scholar] [CrossRef]
  31. Syam Babu, D.; Anantha Singh, T.S.; Nidheesh, P.V.; Suresh Kumar, M. Industrial wastewater treatment by electrocoagulation process. Sep. Sci. Technol. 2020, 55, 3195–3227. [Google Scholar] [CrossRef]
  32. Subramani, A.; Schlicher, R.; Long, J.; Yu, J.; Lehman, S.; Jacangelo, J.G. Recovery optimization of membrane processes for treatment of produced water with high silica content. Desalin. Water Treat. 2011, 36, 297–309. [Google Scholar] [CrossRef]
  33. Ju, H.; McCloskey, B.D.; Sagle, A.C.; Wu, Y.-H.; Kusuma, V.A.; Freeman, B.D. Crosslinked poly (ethylene oxide) fouling resistant coating materials for oil/water separation. J. Membr. Sci. 2008, 307, 260–267. [Google Scholar] [CrossRef]
  34. Beyaz, A.; Oh, W.S.; Reddy, V.P. Ionic liquids as modulators of the critical micelle concentration of sodium dodecyl sulfate. Colloids Surf. B Biointerfaces 2004, 35, 119–124. [Google Scholar] [CrossRef]
  35. European Commission, J.R.C. Institute for Prospective Technological Studies. In Additional Information Submitted during the Information Exchange on Large Volume Inorganic Chemicals—Solid and Others Industry; European Commission: Seville, Spain, 2005. [Google Scholar]
  36. Kristensen, H.O. Cargo Transport by Sea and Road—Technical and Economical Environmental Factors. Nav. Eng. J. 2006, 118, 115–129. [Google Scholar] [CrossRef]
  37. Martelaro, N. Energy Use in US Steel Manufacturing. Available online: http://large.stanford.edu/courses/2016/ph240/martelaro1/ (accessed on 5 December 2020).
  38. Alibaba. 96% Ferric Chloride Industrial Grade, Ferric Chloride FeCL3 Price. Available online: https://www.alibaba.com/product-detail/96-Ferric-Chloride-Industrial-grade-Ferric_62326896646.html?spm=a2700.7724857.normalList.33.bb3044a6KnK7Ue (accessed on 5 December 2020).
  39. Alibaba. Poly Ferric Sulfate High Quality Low Price Water Treatment Chemical. Available online: https://www.alibaba.com/product-detail/Poly-Ferric-Sulfate-High-Quality-Low_62336601744.html?spm=a2700.7724857.normalList.56.64142b95R16a6S&bypass=true (accessed on 5 December 2020).
  40. Alibaba. High Quality Foundry Steel Grade Pig Iron. Available online: https://www.alibaba.com/product-detail/High-Quality-Foundry-Grade-Pig-Iron_62024633665.html?spm=a2700.galleryofferlist.normal_offer.d_image.67852237iVlmTA (accessed on 5 December 2020).
  41. Choice, E. Find the Best Electric Rate in Your Area for Your Home or Business. Available online: https://www.electricchoice.com/electricity-prices-by-state/ (accessed on 5 December 2020).
  42. Austin, D. Pricing freight transport to account for external costs. In Congressional Budget; Congressional Budget Office: Washington, DC, USA, 2015. [Google Scholar]
  43. Alaska Department of Environmental Conservation Division of Water. Listing Methodology for Determining Water Quality Impairments from Turbidity; Alaska Department of Environmental Conservation Division of Water: Juneau, AK, USA, 2016.
  44. The NPDES General Permit for New and Existing Sources and New Dischargers in the Offshore Subcategory of the Oil and Gas Extraction Point Source Category for the Western Portion of the Outer Continental Shelf of the Gulf of Mexico (GMG290000); United States Environmental Protection Agency: Washington, DC, USA, 2017.
  45. Holt, P.K.; Barton, G.W.; Wark, M.; Mitchell, C.A. A quantitative comparison between chemical dosing and electrocoagulation. Colloids Surf. A Physicochem. Eng. Asp. 2002, 211, 233–248. [Google Scholar] [CrossRef]
  46. Busscher, H.J.; van de Belt-Gritter, B.; van der Mei, H.C. Implications of microbial adhesion to hydrocarbons for evaluating cell surface hydrophobicity 1. Zeta potentials of hydrocarbon droplets. Colloids Surf. B Biointerfaces 1995, 5, 111–116. [Google Scholar] [CrossRef]
  47. Júnior, J.A.A.; Baldo, J.B. The behavior of zeta potential of silica suspensions. New J. Glass Ceram. 2014, 4, 29. [Google Scholar] [CrossRef] [Green Version]
  48. Poh, P.E.; Ong, W.Y.J.; Lau, E.; Chong, M.N. Investigation on micro-bubble flotation and coagulation for the treatment of anaerobically treated palm oil mill effluent (POME). J. Environ. Chem. Eng. 2014, 2, 1174–1181. [Google Scholar] [CrossRef]
  49. Niquette, P.; Monette, F.; Azzouz, A.; Hausler, R. Impacts of substituting aluminum-based coagulants in drinking water treatment. Water Qual. Res. J. 2004, 39, 303–310. [Google Scholar] [CrossRef]
Figure 1. (a) Freshly prepared simulated effluent before EC, (b) effluent after 20 min of EC at 32 mA/cm2. (c) pH changes with time during EC at different current densities. (d) Chemical oxygen demand (COD) removal and (e) oil and grease (O&G) removal vs. time during EC at different current densities. (f) Theoretical iron concentration as a function of time at different current densities.
Water 12 03426 g001
Figure 2. Influence of iron concentration on effluent concentration and removal of CC and EC: (a) turbidity removal; (b) COD removal; (c) O&G removal.
Water 12 03426 g002
Figure 3. Influence of transportation distance on energy consumption of EC and CC with (a) turbidity removal; (b) COD removal; (c) O&G removal. (d) Influence of transportation distance on energy consumption of EC and CC at different distances at 90% removal coagulant dosage.
Water 12 03426 g003
Figure 4. Influence of transportation distance on the cost of EC and CC with (a) turbidity removal; (b) COD removal; (c) O&G removal. (d) Influence of transportation distance on the cost of EC and CC at different distances at 90% removal coagulant dosage.
Water 12 03426 g004
Table 1. Recipe for model produced water.
ComponentsConcentration, mg/L
Hexadecane (C16H34)1104
SDS (C12H25OSO3Na)123
NaCl5850
CaCl21110
NaHCO384
Silica (as Na2SiO3)122
Tannic acid (C76H52O46)5
Table 2. Characteristics of model produced water.
CharacteristicsUnitValue
pH 8.24
ConductivitymS/cm15.9
Ionic strengthmol/L0.1617
Hardnessas CaCO31000
Alkalinity(as CaCO3)50
TDSmg/L7166
Zeta potentialmV−65.1
Oil droplet sizenm1058
TurbidityNTU3445
Total Solidmg/L8427
TOCmg/L1000
O&Gmg/L749
CODmg/L2800
UV254AU8.495
ColorCU112
Table 3. Energy consumption of chemical coagulation (CC).
ProcessEnergyUnitsReference
Production0.97kWh/kg FeCl3[35]
Transportation8.9 × 10−4kWh/kg Fe/mile[36]
Fast Mixing4.2 × 10−1kWh/m3Equation (2)
Slow Mixing8.4 × 10−4kWh/m3Equation (2)
Table 4. Energy Consumption for electro-coagulation (EC).
ProcessEnergyUnitReference
Production3.75kWh/kg Fe[37]
Transportation8.9 × 10−4kWh/kg Fe/mile[36]
Electric Power2.6, 5.2, 13W5, 10, 25 mA/cm2
Table 5. Operating cost factors.
ItemCostUnitReference
FeCl32.29$/kg Fe[38]
Fe2SO40.79$/kg Fe[39]
Iron0.2$/kg Fe[40]
Electricity0.1136$/kWh[41]
Transportation1.7 × 10−4$/kg/mile[42]
Table 6. Additional equations.
ComponentEquation
C C P E n e r g y .= 0.97 × Weight
C C T E n e r g y = 8.9 × 10⁻⁴ × Distance × Weight of CC
C C M E n e r g y = NpρN3D5 × t
E C P E n e r g y = (9.75 + 0.333) × Weight of iron
E C T E n e r g y = 8.9 × 10⁻⁴ × Distance × Weight of iron
E C E E n e r g y = UIt/Q
C C T C o s t = 1.7×10⁻⁴ × Distance
C C P C o s t = 2.29 × Weight of CC
C C E C o s t = NpρN3D5 × t × 0.1136
E C T C o s t = 1.7×10⁻⁴ × Distance
E C P P C o s t t= 0.2 × Weight of pig iron
E C S P C o s t = 3.75 × Weight of iron × 0.1136
E C E C o s t = UIt/Q × t × 0.1136
Table 7. Discharge limit and target removal for offshore effluent disposal.
ProcessRawDischarge LimitTarget Removal, %
Turbidity, NTU34452599.3
COD, mg/L280012595.5
O&G, mg/L7492996.1
Publisher’s Note: MDPI stays neutral with regard to jurisdictional claims in published maps and institutional affiliations.

