Review

Interplay of the Factors Affecting Water Flux and Salt Rejection in Membrane Distillation: A State-of-the-Art Critical Review

Department of Civil Engineering, New Mexico State University, Las Cruces, NM 88003, USA
*
Author to whom correspondence should be addressed.
Water 2020, 12(10), 2841; https://doi.org/10.3390/w12102841
Submission received: 16 August 2020 / Revised: 24 September 2020 / Accepted: 10 October 2020 / Published: 13 October 2020

Abstract

:
High water flux and elevated rejection of salts and contaminants are two primary goals for membrane distillation (MD). It is imperative to study the factors affecting water flux and solute transport in MD, the fundamental mechanisms, and practical applications to improve system performance. In this review, we analyzed in-depth the effects of membrane characteristics (e.g., membrane pore size and distribution, porosity, tortuosity, membrane thickness, hydrophobicity, and liquid entry pressure), feed solution composition (e.g., salts, non-volatile and volatile organics, surfactants such as non-ionic and ionic types, trace organic compounds, natural organic matter, and viscosity), and operating conditions (e.g., temperature, flow velocity, and membrane degradation during long-term operation). Intrinsic interactions between the feed solution and the membrane due to hydrophobic interaction and/or electro-interaction (electro-repulsion and adsorption on membrane surface) were also discussed. The interplay among the factors was developed to qualitatively predict water flux and salt rejection considering feed solution, membrane properties, and operating conditions. This review provides a structured understanding of the intrinsic mechanisms of the factors affecting mass transport, heat transfer, and salt rejection in MD and the intra-relationship between these factors from a systematic perspective.

1. Introduction

Freshwater scarcity is a grand challenge that threatens water security and economic development. Desalination and water reuse provides a viable solution to improving water security and alleviating water stress by expanding alternative water supplies, such as seawater, brackish water, wastewater, and other impaired water sources [1,2,3]. Current desalination technologies are energy intensive. For example, reverse osmosis (RO) is the most extensively implemented membrane technology for desalination. Although the specific energy consumption (SEC) of RO has been reduced significantly from 5–10 kWh/m3 to 3–4 kWh/m3 [4,5,6], energy consumption generally amounts to 50%–60% of the total water costs [7,8]. Worldwide fossil fuels such as crude oil, coal, and gas are non-renewable and have been diminishing rapidly. In addition, environmental issues associated with brine disposal pose a challenge to conventional desalination technologies. Developing transformational technologies using alternative energy sources is vital to reduce treatment costs, improve energy efficiency, enhance water supply resilience, and increase access to affordable, safe, and clean water.
Membrane distillation (MD) is a non-isothermal integrated process by combining thermal evaporation and membrane separation, which was first patented by Bodell in 1963 [9]. MD is driven by the transmembrane temperature difference between the hot/warm feed side and the cold permeate side with a barrier of hydrophobic microporous membranes. Water vapor can pass through the hydrophobic pores inside the membranes and condense at the cold permeate side. MD can take advantage of solar energy, geothermal energy, and waste heat of industries to sustain the driving force. MD process covers a myriad of applications such as desalination [10,11,12,13,14,15,16,17,18,19,20,21,22,23,24,25,26,27], wastewater treatment [28,29,30,31], heavy metal removal [32], separation of organic solutes [33,34], treatment of water contaminated by arsenic [35] and boron [36], brine treatment or crystallization [37,38,39,40], and concentration of juice [41].
Studies on MD have advanced rapidly with a substantial increase in publications since 2010 (Figure 1). Recently, research on MD has focused on novel hydrophobic membranes with anti-wetting and anti-fouling properties for various MD applications [42,43,44,45,46,47,48,49,50,51,52], Janus membranes with significantly reduced specific energy consumption for MD [53,54], and hybrid MD systems [55,56,57]. In addition, since Lawson and Lloyd [58] published the extensively cited comprehensive review paper in 1997, numerous review papers covering various aspects of MD have been published. Recent reviews on MD have mainly focused on theoretical modeling [59,60,61,62], membrane fouling [63,64,65], energy efficiency analysis [66,67,68,69,70,71,72], MD performance criteria [73], design and fabrication of membranes for MD application [74,75,76], wettability of membranes [77,78,79], the influence of membrane properties on MD performance [80], hybrid MD systems [66,67], some specific fields of MD such as direct contact membrane distillation (DCMD) [81], vacuum membrane distillation (VMD) [82], air gap membrane distillation (AGMD) [83], ceramic membranes applied for MD [84], and perspective on sustainable and renewable desalination using MD [68,85]. These review papers have covered broad research areas including energy efficiency analysis, membrane development, effects of membrane properties and MD module configurations on MD performance, fouling and scaling control in MD, modeling heat transfer, and mass transfer in MD.
However, there is a lack of systematic overview of factors affecting the water flux, salt rejection, and interactive correlations of both in terms of membrane properties, feedwater chemistry, long-term operation, and their physicochemical interactions for MD applications, especially in desalination. For example, a research paper by Schofield et al. [86] studied the factors affecting flux using sensitivity analysis. They concluded that vapor pressure reduction was the dominant factor for the flux decline of sodium chloride solution, while the viscosity for sucrose solution was the primary factor reducing the flux. Nevertheless, they did not analyze the effect of other factors such as membrane properties, the chemistry of the feed solution, and module parameters on water flux.
Based on Raoult’s law, water vapor pressure decreases due to increasing salt concentration, thereby causing permeate flux reduction. However, Ozbey-Unal et al. [36] reported that water flux increased 1.1 to 1.3 folds when the salinity of the geothermal feedwater increased from 1.5 wt.% to 3.0 wt.% using polypropylene (PP) and polytetrafluoroethylene (PTFE) membranes in MD systems. Meanwhile, permeate flux was not affected by salinity increase from 1.5 wt.% to 3.0 wt.% of the feed stream using polyvinylidene fluoride (PVDF) membrane. Although it is easy to understand that physical sieving and anti-wettability due to hydrophobicity of the membranes can together be considered to be the primary mechanism of salt rejection (SR) and water flux permeation, SR and permeation of water flux are complicated and have not been thoroughly explored and understood. In addition, aquatic chemistry of the feed solution, viscosity, and membrane properties such as thermal conductivity, thickness, pore size, pore size distribution (PSD), and porosity may significantly affect SR and water flux.
This review proposes a holistic system approach to understand and identify the factors affecting SR and permeate flux (solute transport) in MD for desalination and wastewater treatment. This review focuses on analysis and deliberations of membranes (e.g., wettability, pore size and PSD, porosity, thickness, tortuosity, thermal conductivity), feedwater chemistry (e.g., inorganic salts, colloidal particles, natural organic matters, volatile solutes), operating conditions (e.g., temperature, flow rate, operating mode, degasification, long-term operation) and their interactions on MD performance in terms of their impacts on flux and SR. Because energy analysis, membrane fabrication, MD configuration design, modeling, and membrane fouling have been discussed in other review papers, these are not the focus of this review. Based on the critical review and system analysis, a decision diagram was proposed to illustrate the effects of the primary factors involving membrane properties, feed solution compositions, operating conditions on SR, flux, and their intrinsic correlations. To the best of our knowledge, this review paper is the first that has proposed a decision framework to determine the factors and their interplay on MD performance.

2. Fundamentals of MD

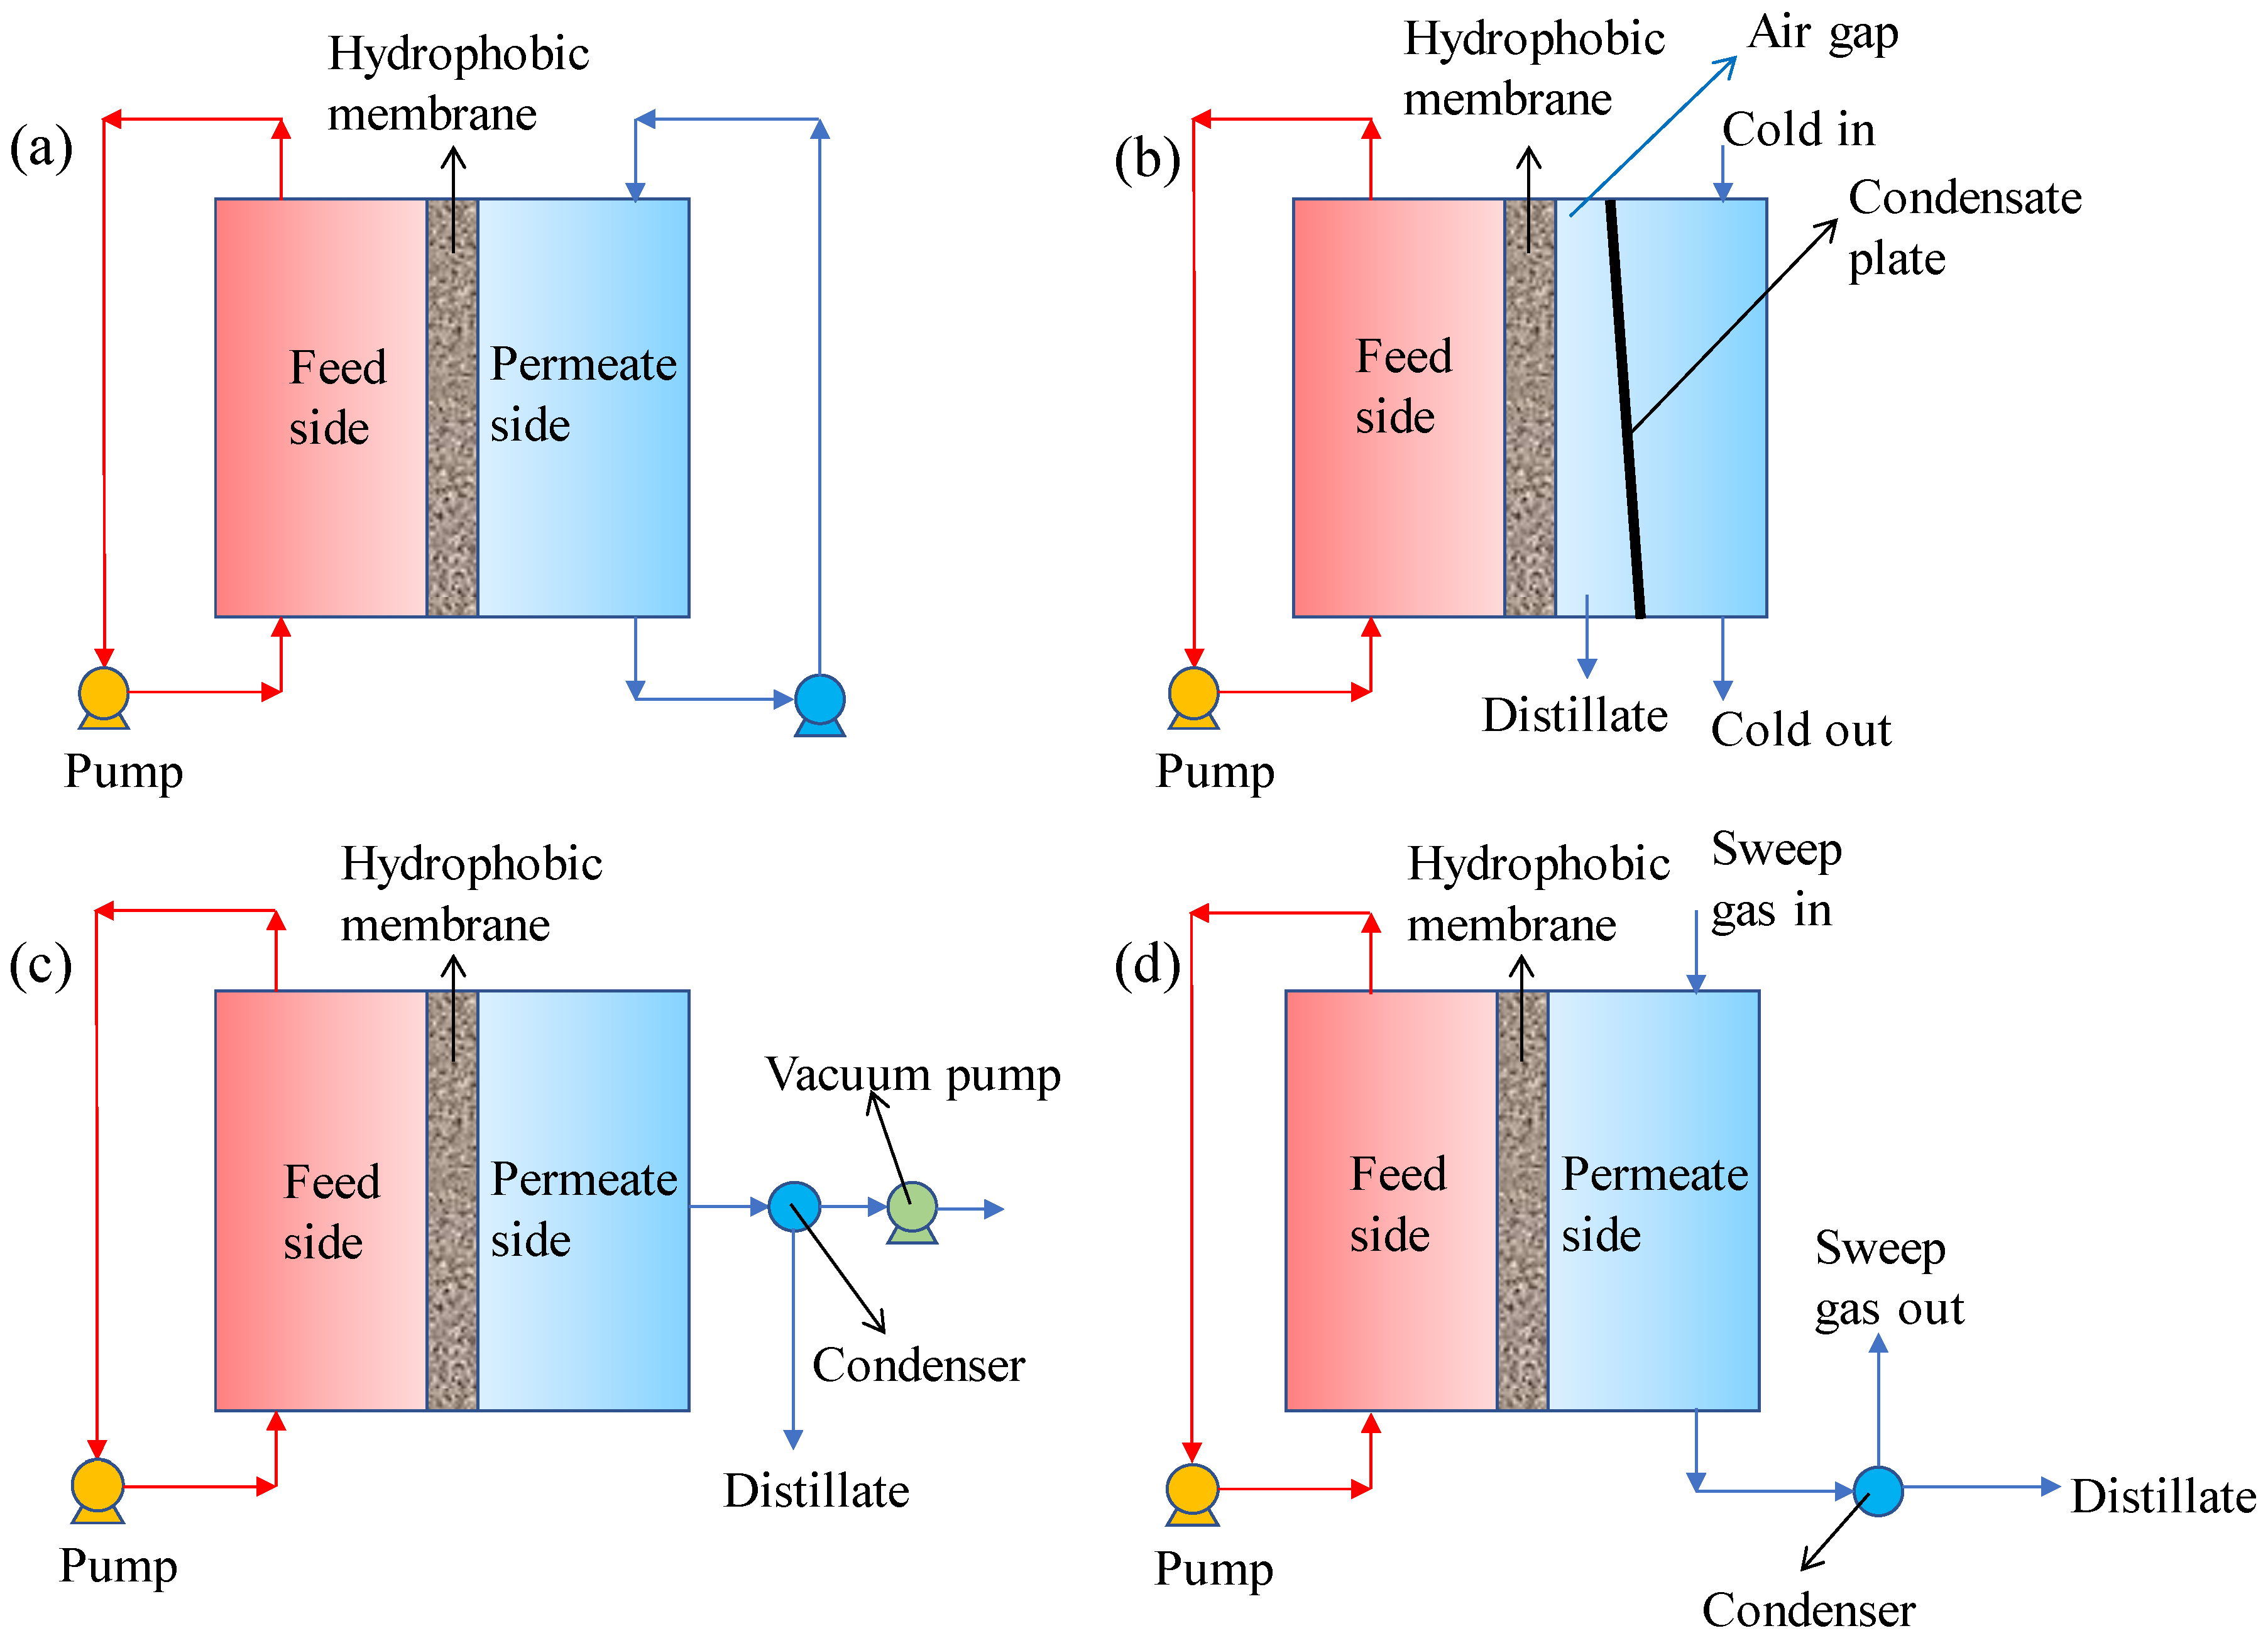
2.1. Typical MD Configurations

Figure 2 illustrates the schematic diagram of four typical MD configurations, including direct contact membrane distillation (DCMD), air gap membrane distillation (AGMD), vacuum membrane distillation (VMD), and sweeping gas membrane distillation (SGMD) [87,88]. The feed stream is in direct contact with the hydrophobic membrane in all these MD configurations. The membrane contacts directly with the cold permeate stream in DCMD, which is the most used design for research because of its simplicity. In AGMD, there is a stagnant air gap between the membrane and the cooling plate over which the vapor condenses. In VMD, a vacuum pump is applied to provide a driving force to induce the vapor to penetrate the membrane pores and condense outside the VMD chamber. In SGMD, an inert gas is used to sweep the vapor at the permeate side and condense at the outside of the MD module [89].

2.2. Membranes in MD
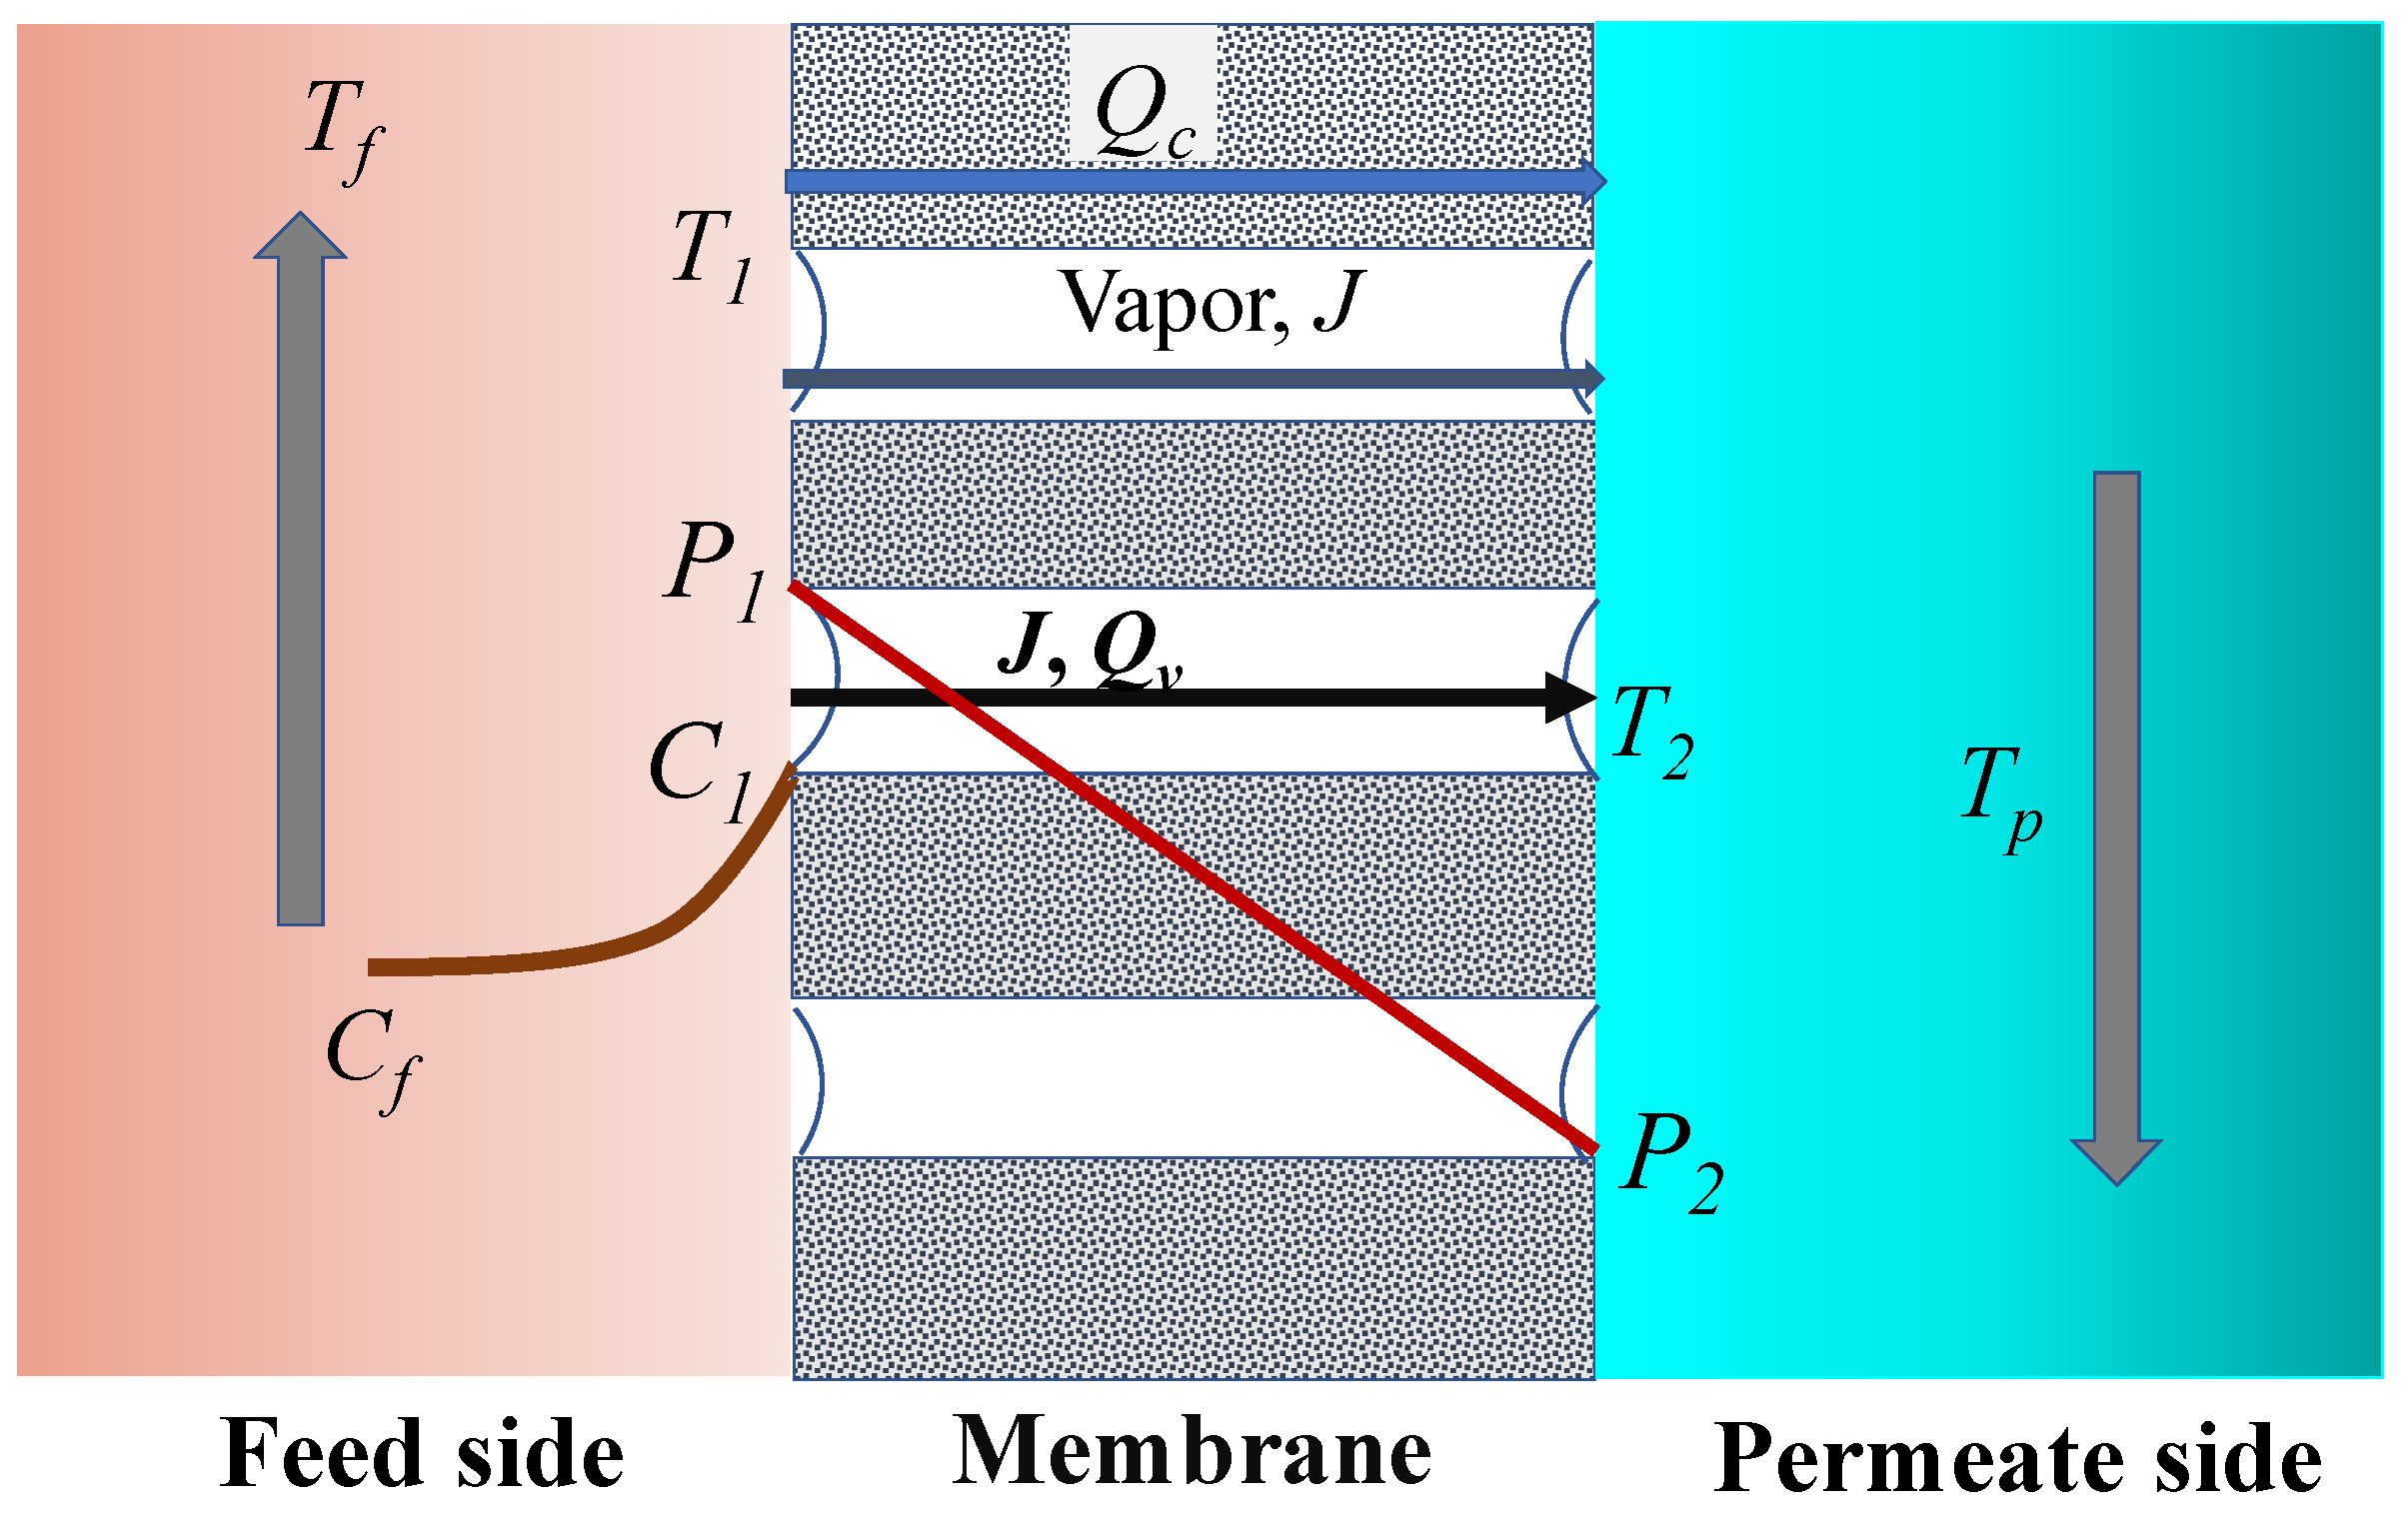
In an MD process, the membrane is of vital importance to system performance. Because the fundamental requirement for the selected membrane is the hydrophobicity, which can be determined by the water contact angle (CA) of the membrane surface. MD cannot work if the membrane is hydrophilic, which means the CA of the membrane is less than 90° [90,91]. To maintain the hydrophobicity, the hydrostatic pressure induced by a flowing fluid should be below the liquid entry pressure (LEP) of the membrane to avoid pore wetting [92,93]. LEP can be calculated by the Laplace equation [58,94]:
L E P = 2 B γ l cos θ r m a x = Δ P e n t r y > Δ P i n t e r f a c e = P f P p
where B is a geometry coefficient for pore structure, being unity for cylindrical pores, γ l is the liquid surface tension (for water and common inorganic solution mixture, γ l is equal to 72 mN/m at 25 °C), θ is the CA, r m a x is the maximum allowable pore size of the membrane, Pf and Pp are the hydraulic pressure at feed and permeate sides. However, this equation does not consider the effects of operating temperature and feed solution composition on liquid surface tension.
In addition, surface energy and surface roughness (or morphology) govern the characteristics of wettability of a solid surface [95,96] (i.e., the membrane surface in MD). Surface energy is the intrinsic property of a material including a membrane material. The maximum CA on a flat surface obtained was 119° using low surface energy material only (the recorded lowest surface energy value was 6.7 mJ/m2 of a surface with regularly arrayed hexagonal-packed CF3 groups) [97]. Other properties of the membrane such as thickness, pore size, PSD, porosity, thermal conductivity, mechanical strength, and chemical-resistance are generally considered to be factors affecting the performance of MD systems [73,87].
Anti-wetting or non-wetting surface of a membrane is what researchers expect in MD systems. The mechanism of wetting is very complex. Gostoli et al. [98] suggested that a high liquid surface tension facilitates a convex meniscus, which prevents the liquid from penetrating the membrane pores and forming a non-wetted liquid/vapor/membrane interface—a three-phase interface which maintains a stable hydrophobicity [96,99]. They considered the pressure difference arose from surface tension as the capillary pressure. The wetting will happen if the capillary pressure becomes greater than the partial vapor pressure across the membrane pores [79]. The capillary pressure mentioned here actually is the previously introduced term of LEP. To maintain a long-term stable hydrophobicity, a higher LEP is needed for a specific membrane. Therefore, smaller maximum pore size and higher surface tension result in a higher LEP based on Equation (1). Nevertheless, the maximum pore size should not be so small that the vapor molecules cannot pass through the membrane pores. There should be a “critical” value of the allowable maximum pore size. Because of the importance of pore size of the hydrophobic membrane and mean free path of water molecules on mass transfer mechanisms (Knudsen and molecular diffusion), these two factors are discussed in detail later.

2.3. Heat Transfer

Heat transfer and mass transfer occur simultaneously in MD systems. Figure 3 shows the schematic diagram of heat transfer and mass transfer in a DCMD.
Generally, heat transfer can be divided into three steps [62]: (i) heat transfer from the bulk hot side to the hot liquid/membrane boundary layer (Qf); (ii) heat transfer through the membrane (Qm = Qv + Qc); (iii) heat transfer through the cold side liquid/membrane boundary layer (Qp). At steady state, Q f = Q m = Q p = Q , thus, the heat transferred from the hot side to the cold side can be described as follows [62]:
h f ( T f T 1 ) = k m δ ( T 1 T 2 ) + J Δ H v , w = h p ( T 2 T p ) = H ( T f T p )
The total heat flux Q is written as:
Q = [ 1 h f + 1 k m δ + J Δ H v , w Δ T m + 1 h p ] 1 Δ T = H ( Δ T )
where H is the overall heat transfer coefficient, hf and hp are the heat transfer coefficients at the bulk feed side and the bulk permeate side, Tf and Tp are the absolute temperature of the bulk solution at the feed side and permeate side respectively, T1 and T2 are the interfacial temperature of the membrane surface at feed and permeate side, respectively, ∆T (∆T = Tf Tp ) is the global temperature difference between feed and permeate side, ∆Tm (∆Tm = T1 T2) is the transmembrane temperature difference, km is the overall thermal conductivity of the membrane, δ is the thickness of the membrane, ∆Hv,w is the latent heat of vaporization of water and can be estimated by equation [58]: ∆Hv,w = 1.7535T + 2024.3, where T is the absolute temperature in K. In addition, hf and hp are expressed using Equations (4) and (5) based on Nusselt number (Nu).
h f = N u f k f d h
h p = N u p k p d h
where the substitutes f and p refer to feed stream and permeate side, respectively, k is the fluid thermal conductivity, dh is the hydraulic diameter. Nu number can be calculated using Equation (6):
N u = 1.86 ( R e P r d h L ) 0.33
where L is the length of channels on both sides. Reynolds number (Re) and Prandtl number (Pr) can be evaluated using Equations (7) and (8):
R e = d h u ρ μ
P r = c p μ k
where u, μ, ρ, k and cp are the average velocity, viscosity, density, thermal conductivity, and the specific heat of the fluids, respectively. Additionally, the heat transferred for vaporization of liquid (Qv), heat flux of Qc due to sensible heat loss through the membrane, and thermal efficiency of MD system (η) are written as [62]:
Q c = k m d T d l = k m δ ( T 1 T 2 )
Qv = J × ∆Hv,w
η = Q v Q m × 100 % = Q v Q v + Q c × 100 %
where l is the distance from the membrane surface (facing the hot feed side), δ the membrane thickness, T 1   and   T 2 refer to the temperatures at the membrane surface of the feed and permeate side, respectively, k m is the overall thermal conductivity of the membranes and can be calculated using a parallel model (Iso-strain equation) [100,101,102,103,104,105,106]:
k m = ε k g + ( 1 ε ) k s
where ks is the thermal conductivity of membrane material, and kg is the thermal conductivity of the gas (air and water vapor mixture) within the pores.
Moreover, a temperature polarization phenomenon (TPP), which means the temperature at the membrane surface differs from the measurable bulk liquid temperatures, exists in the MD process [58,107]. The temperature polarization coefficient (TPC) characterizes the variation of TPP. Equation (13) shows the definition of TPC.
TPC = Δ T m Δ T = T 1 T 2 T f T p
If TPC < 0.2, the DCMD is limited by heat transfer, and if TPC > 0.6, the DCMD is controlled by mass transfer with a low membrane permeability [62]. Normally, TPC value varies from 0.2 to 0.9 [108]. Equation (8) can be rewritten as Equation (14) based on Equations (2)–(5) and (9).
TPC = 1 1 + k m δ ( 1 h f + 1 h p )
where km, δ, hf and hp stand as the same previously.

2.4. Mass Transfer

Mass transfer models are established under the assumptions of steady state and negligible effect on equilibrium at the pore entrance by the curvature of the liquid-vapor interface. The permeate flux (J) is related to the transmembrane pressure difference, the membrane materials, and the composition of hot/warm feed solutions. Flux (J) can be expressed as [58,107]:
J = Bw × ∆Pm = Bw(P1P2)
where Bw is the mass transfer coefficient, P1 and P2 are the partial water vapor pressure at liquid-vapor interfaces at each side. In addition, correlated partial vapor pressure Pi (the subscript i stands for 1 or 2) can be written as:
P i = p w 0 ( T ) × ( 1 x ) × ( 1 0.5 x 10 x 2 )
where, p w 0 ( T ) is the vapor pressure of pure water, and x is the mole fraction of non-volatile solute (i.e., NaCl). Antoine equation can be used to calculate the vapor pressure of pure water [58]:
p w 0 ( T ) = e x p ( 23.238 3841 T 45 )
Mass transport (water vapor transfer in desalination) mechanism is governed by four basic models−Knudsen diffusion, molecular diffusion, Poiseuille flow and surface diffusion, and a combination of them. Knudsen number (Kn) is used to determine which model dominates the mass transfer [109]. Kn is calculated using Equation (18):
K = λ d p = λ 2 r
where dp is the membrane pore size, r is the average pore radius, λ is the mean free path of water molecules in water vapor phase that can be written as [58]:
λ = k B T 2 π P m ( 2.641 × 10 10 ) 2
where kB is the Boltzmann constant, Pm is the mean pressure within the membrane pores, T is the absolute temperature, and 2.641 × 10⁻¹⁰ is the collision diameter of water molecules (2.641 × 10⁻¹⁰ m = 2.641Å).
If Kn > 1, the flow type is Knudsen, and if Kn < 0.01, the flow then belongs to molecular diffusion, and it is a combination of Knudsen and molecular diffusion (K-M diffusion) when 0.01 < Kn < 1 [109]. Typically, the flow types in MD systems except VMD are the same as the K-M diffusion [110]. For the K-M diffusion, mass transfer coefficient Bw can be calculated as follows:
B w = 1 ( 1 B w M + 1 B w K )
where, B w M and B w K are mass transfer coefficients for molecular diffusion and Knudsen diffusion, respectively. These two parameters can be determined using Equations (21) and (22):
B w M = ε τ δ P D P a M R T
B w K = 2 3 ε r ¯ τ δ ( 8 M π R T ) 1 2
where ε , τ , and δ are the membrane porosity, pore tortuosity of the membrane, and membrane thickness, respectively, D is the water molecule diffusion coefficient, M refers to the molecule weight of water vapor, R is the gas constant, r ¯ is the mean pore radius, P and Pa are the total pressure and the air pressure inside the membrane pores, respectively.
Generally, the combined K-M diffusion is much closer to actual situations. It was reported that the combined model predictive results were close to the experimental data with a Knudsen number below 0.7, whereas the simulated data of Knudsen diffusion model alone were almost twice greater than the experimental results [109].
Moreover, the solutes concentration in the bulk solution differs from that at the liquid/membrane interface due to mass transfer. This is called the concentration polarization phenomenon. Concentration polarization coefficient, which is used to characterize the concentration polarization phenomenon, can be defined as [111,112]:
Concentration   polarization   coefficient = C 1 C f
where C 1 and C f are the non-volatile solutes concentration at liquid/membrane interface and bulk feed solution, respectively.

3. Effect of Membrane Properties, Feed Solution, and Operating Conditions

3.1. Membrane Properties

3.1.1. LEP and Anti-Wettability

The LEP defines the critical pressure value of hydrostatic pressure at the feed side. This pressure represents the minimum membrane-wetting pressure value. The LEP value of a commercial or a lab-made membrane is explicit once the membrane is produced. Based on Equation (1) (the Laplace equation), pore geometry structure, pore size, CA, and surface tension all determine the value of LEP. Therefore, the materials and fabrication process conditions are useful for selecting and controlling the desired membrane properties for MD applications. Low surface energy materials and small pore size are good options for manufacturing MD membranes. Because surface tension, pore size, and pore geometry are all fixed once the materials and manufacturing process conditions are determined, it is essential to select lower surface energy materials prior to production, thereby generating a higher CA (hydrophobic of more than 90°, or superhydrophobic of ultra-higher than 150°) and a higher value of cos θ as well [113]. In addition, smaller maximum pore size and higher CA can together ensure a higher minimum LEP for fluctuating operating pressures. Therefore, lower surface energy materials and smaller maximum pore size can result in a higher minimum LEP, which is beneficial for flexible and adaptive operation. It is worth noting that conventionally LEP is measured with the other side of the membrane exposed to atmospheric pressure, which is not valid for the measurement of LEP in VMD. The vacuum level should be considered when calculating the pressure difference. Moreover, flow pressure drops occur when a flat membrane is applied in a cell, and pressure fluctuations occur near the LEP value [114].
According to the Laplace equation (Equation (1)) that provides the relationship between the membrane pore size and the operating conditions, the operating pressure should be less than the minimum LEP to ensure non-wetting. The LEP of hydrophobic membranes varies depending on the mean membrane pore sizes. Typically, a smaller mean pore size renders a higher LEP. The reported LEP of 0.75–5 bar over the mean pore size range of 0.034–0.516 µm is summarized in Figure 4. High SR and stable permeate flux can be obtained only if the operating pressure is below LEP. Even under this premise, it is still difficult and almost impossible to explicitly demonstrate how the LEP variations alone influence the SR and the permeate flux fluctuation. Because the mass transfer and heat transfer are complicated and can be affected by a myriad of factors that will be systematically discussed in this review. Intrinsically, the effect of LEP on heat and mass transfer can be qualitatively estimated based on the correlation of operating pressure induced by feed flow rate or feed velocity, which will significantly affect the flow regime (laminar or turbulent or transitional flow) and thereby influence the heat and mass transfer. The essential relationship among them will be elucidated later in detail.
The composition of the feed solution can influence the surface tension of the liquid on a hydrophobic membrane surface. Franken et al. [94] recommended that liquid surface tension would not be significantly affected when the feed solution was in the absence of organic matters. However, the surface tension of the mixture solution reduces when organics present in the liquid. If the organic concentration exceeds a “critical” value, then the liquid surface tension decreases rapidly, which causes an instant decrease of LEP. Simultaneously, the complete wetting occurs, indicating the liquid mixture fully penetrates the pores, and therefore the MD system is broken down immediately.
Recently, superhydrophobic membranes used with enhanced anti-wettability in MD were studied [15,124,125,126,127,128,129,130,131,132]. Superhydrophobic membranes have a higher CA of more than 150°, which renders stronger wetting resistance [79,132,133]. Li et al. [131] reported that superhydrophobic, self-cleaning nanofiber membranes were fabricated using polysulfone-poly-dimethylsiloxane (PS-PDMS) via electrospun methods. The membranes achieved a competitive and stable water flux of 21.5 kg/m2/h as well as a lower electrical conductivity of distillate ranging from 4.2 to 4.5 μS/cm with a 30 g/L NaCl solution as feed and a bulk temperature difference of 50 °C. Moreover, no wetting of the pores was observed over 12 h operation in their DCMD experiments. Another example of a superhydrophobic membrane was reported by Razmjou et al. [124]. They fabricated a superhydrophobic PVDF membrane via TiO2 nanoparticles coating by a low temperature hydrothermal process and subsequent grafting using a low surface energy material H, 1H, 2H, 2H-perfluorododecyltrichlorosilane. They then found that the LEP and CA of the modified membrane increased from 120 kPa and 125° before modification to 190 kPa and 166°, respectively. The fabricated superhydrophobic membrane demonstrated a stronger anti-wetting property confirmed by two different experiments: a sharp flux reduction just after 2 h operation was observed before modification when 15 wt.% ethanol was added into the feed, whereas after modification, the drastic reduction time for flux was more than 6 h. On the other hand, the permeate conductivity before modification increased to more than 500 μS/cm merely after 4 h operation in DCMD using 3.5 wt.% NaCl as the feed. In contrast, the permeate conductivity of the superhydrophobic coated membrane remained stable and less than 50 μS/cm throughout the entire experiments. This phenomenon was also confirmed by other researchers [134,135]. Additionally, they observed that the superhydrophobic membrane performed a higher recovery ability (94%) of flux than the unmodified membrane (~54%) after cleaning membrane fouling using a 0.2 wt.% NaOH solution when compared to the flux of the pristine membrane.
An example of hydrophobic PP hollow fiber membranes for desalination in pilot-scale DCMD studies was reported in Ref. [136]. PP hollow fiber membrane with 330 µm ID, 150 µm wall thickness, and maximum pore size of 0.60 µm used in this study [136] was deposited a thin layer of plasma polymerized silicone-fluoropolymer coating on the fiber outside surface. Water CA measurements showed that the advancing contact angles of the fresh fiber samples were between 138.34° and 142.18° with receding contact angles of 22.01°–22.17°. The pilot plant operated in crossflow DCMD with the coated PP hollow fiber membranes achieved the highest water vapor flux of 55 LMH over 3 months of operation with feed and distillate temperatures of 64–93 °C and 20–54 °C, respectively. Moreover, the plant achieved a minimal flux reduction using seawater as feed with a salinity up to 19.5%, mainly due to the application of the coated PP hollow fiber membranes.
In general, polymeric membranes are the most extensively used in MD, and ceramic membranes are growingly applied in MD application. The hydrophobic property of the membranes is of the first importance as it is the key property for successful operation for all types of MD modules. Due to the hydrophobic nature of frequently studied polymeric materials, some popular polymers were used extensively to manufacture hydrophobic porous membranes such as PTFE, PVDF, polystyrene nylon-6, and PP. Ceramic membranes must be modified to be hydrophobic prior to MD application because of their hydrophilic nature. Table 1 summarizes the membranes and their performances in MD studies.

3.1.2. Pore Size and Pore Size Distribution

Pore size is another important membrane property that significantly affects MD performance. Typically, an increase of the average pore size r indicates the increase of the allowable maximum pore size rmax. Therefore, pore size directly determines the Knudsen number that influences the mass transfer mechanism based on the definition of Knudsen number (Equation (8)). Suppose the membrane pore size is smaller than the mean free path of vapor molecules (λ), it would be suitable for maintaining a relative higher LEP based on the Laplace equation (Equation (1)). The Knudsen number Kn will be greater than the unit, indicating that the molecular pore walls collisions dominate the mass transport process, and the Knudsen diffusion (K diffusion) is the primary mechanism for mass transfer of vapor. On the other hand, Kn will be less than 0.01 if the membrane has greater pore sizes. In this case, the dominant mass transfer mechanism will be an ordinary molecular diffusion. Typically, membrane pore size ranges from 0.2 to 1 μm [144]. However, this range can be extended to some larger pore sizes due to the fabrication process for the membranes. For example, the pore size range of 0.2 to 20 μm was reported [137,145,146] using a stretching technique for preparing PP and PTFE membranes and using phase inversion to fabricate PVDF membranes. Alkhudhiri and Hidal [25] studied the effects of high concentration of four salts and three different pore size PTFE membranes on the permeate flux and SR using an AGMD. Their study indicated that the flux increased significantly by 39.6% and 56.9% for a maximum NaCl feed concentration of 180,000 mg/L when the pore sizes increased from 0.2 μm to 0.45 μm and from 0.2 μm to 1 μm, respectively. A similar lower flux enhancement for the other three different feed saline solutions was also observed. The Knudsen-ordinary molecular diffusion (K-M diffusion) in the increased membrane pore size was considered the cause of the enhanced mass transfer of permeate flux [87]. Additionally, they revealed that the SR decreased because of LEP reduction induced by increased membrane pore sizes, which was already confirmed by other studies [147,148]. Gryta et al. [149] revealed that the occurrence of scaling and deposition of salts prefers more in larger pores that are more easily wetted.
PSD exists because a uniform pore size is almost impossible in specific membranes. Generally, MD membranes have a PSD ranging from 0.2 μm to 1 μm [87,108]. Phattaranawik et al. [150] indicated that the effects of PSD on water flux in DCMD could be ignored. Their results indicated that water flux fluctuation was only 4% using commercial PVDF membranes—GVHP (PSD is wider) and HVHP (PSD is narrower) membranes provided by Millipore. Moreover, they observed that water flux discrepancies using HVHP and GVHP membranes were 2.9% and 7.1% for laminar flow and 1.4% and 8.1% for turbulent flow. The discrepancy of the narrower PSD membrane was better than that of the larger PSD membrane. Typically, a narrower PSD is preferable in MD. However, they did not mention the effect of PSD on SR.

3.1.3. Porosity, Thickness, and Tortuosity

Porosity is an important parameter of membrane characteristics because it can directly determine the ratio of pores within a membrane [151,152,153]. For polymeric membranes, porosity (ε) can be calculated by Equation (24) [144].
ε = 1 m ρ p × A × δ
where m and A are the mass and surface area of the membrane, ρ p is the density of the membrane materials, and δ is the membrane thickness.
Higher porosity means more passages or space for water vapor to pass through. On the other hand, higher porosity reduces heat loss due to sensible heat conduction through the membrane material, thereby enhancing thermal efficiency. Theoretically, based on Equations (5) and (10)–(12), the increase of porosity (ε) enhances the mass transfer coefficient B w M and B w K , and then increases permeate flux J. In addition, porosity also affects the thermal conductivity of a membrane. Equations (3) and (4) reveal that the formulas for calculation of heat flux through the membrane conduction (Qc) and the thermal conductivity of the membranes. Typical values of kg and ks of conventional commercial polymeric membrane materials are 0.027 W/m/K and 0.1 to 0.5 W/m/K, respectively [76]. Therefore, Qc and km will decline with the increasing porosity, which affects both mass transfer and heat transfer. Generally, a higher porosity without sacrificing mechanical strength is beneficial for MD applications. Nevertheless, it is difficult to predict how it influence the SR in desalination. Again, it is meaningless to discuss the decisive effect merely focusing on an individual parameter since the MD involves a complex process and its performance is governed by different synergistic effects and a combination of various related factors. Other factors other than porosity, such as mean pore size, membrane thickness, and thermal conductivity can affect flux and permeability, and SR. For instance, the membrane with high porosity of up to 90% showed less permeate flux than the case of lower porosity [92]. The study reported that this outcome resulted from a much higher thermal conductivity and a small pore size of about 20 nm of the membrane.
Membrane thickness (δ) is a parameter of significant importance. Typical membrane thickness ranges from 20 to 200 μm for polymeric membranes [62,93,154] and from ~500 to 2000 μm for inorganic membranes such as ceramic membranes [92]. Membrane thickness significantly affects mass transfer and heat transfer, along with thermal efficiency. According to Equations (7) and (12)–(14), an increase of membrane thickness reduces the mass transfer coefficients because a thicker membrane renders longer passage for water vapor to pass through. On the other hand, the increase of membrane thickness reduces the heat transfer coefficient of thermal conduction via membrane material because the heat transfer coefficient of conduction is inversely proportional to the membrane thickness based on Equations (2)–(4). Also, the increase of membrane thickness decreases the effective heat amount for feed stream vaporization. It thereby results in decreased thermal efficiency of the MD system, as indicated by Equation (5). Therefore, a higher mass transfer, namely a higher permeate flux, results in a smaller thermal efficiency, which is the typical drawback in AGMD.
An optimum or a critical membrane thickness based on the trade-off for higher mass transfer and lower heat conduction loss exists. L. Martínez et al. [155] studied the effects of membrane thickness reduction on DCMD performance. They investigated the flux as a function of membrane thickness via a resistances-in-series model using the TF200 (PTFE layer supported on PP base) and Durapore GVHP (unsupported homogeneous PVDF). They concluded that: (i) for a pure feedwater, the flux increase for unsupported membrane was mainly caused by a membrane resistance decay induced by membrane thickness reduction; and the water flux increased in a greater proportions than in unsupported membranes since the top layer (the active hydrophobic layer) thickness declined; (ii) using a NaCl and sucrose aqueous solution as feed, the water flux decreased with membrane thickness reduction for both types of membranes when the membrane thickness was below a specific thickness value, which was considered as a “critical” membrane thickness. Critical membrane thickness of ~10 μm was suggested for the two types of polymeric membranes. However, they did not study the effect of membrane thickness reduction on SR.
Additionally, there are different opinions on the range of optimum membranes thickness. For example, Eykens et al. [156] observed a very similar result using a commercial PVDF, PP membranes, and a lab-scale made e-PVDF membrane. They suggested broader optimum membrane thickness ranges of 2–30 μm for 3 wt.% NaCl feed solution, 7–112 μm for 13 wt.% NaCl feed solution, and 16–793 μm for 24 wt.% NaCl feed solution. Their results revealed that a higher hydrophobic layer thickness was more suitable for MD application when fed with a high salinity solution. They observed an SR greater than 99.98% using the commercial PVDF and PP membranes and SR above 98% using the lab-made membrane in their studies. However, Laganà et al. [41] reported a different optimum thickness range of 30–60 μm of polypropylene hollow fibers for producing highly concentrated apple juice using a hollow fiber DCMD module.
Tortuosity is another important membrane characteristic that, along with porosity and thickness, can greatly control transmembrane water vapor mass transport [157]. Permeate flux is conversely proportional to tortuosity based on Equations (7) and (12)–(14). A small tortuosity is beneficial to minimize mass transfer resistance due to the shorter pore pathway for water vapor [81,158]. Tortuosity is a geometrical parameter for the characterization of pores, which is equal to a ratio of the actual length of the membrane pores divided by the membrane thickness [108]. A tortuosity value of unity indicates the pores are straight, or the actual length of the pores is identical with the overall membrane thickness. Tortuosity can be calculated using Equation (25) [80,159].
τ = 1 ε
Iversen et al. [160] calculated the tortuosity value of commercial PTFE membranes using a porosity of 0.78 provided by the manufacturer; the calculated value of tortuosity was 1.3 based on Equation (25) and this value of 1.3 was close to the provided value range of 1.1 to 1.2. With regard to the assumption of tortuosity values, Calabrò [161] assumed a tortuosity of 1.2 for the prediction of water flux that was approximate to 99.6% of the experimental outcome. However, the effect of tortuosity on SR in desalination using MD was not reported. A possible phenomenon that membrane thickness can decrease while tortuosity may increase due to the compaction of the membrane exists may not be noticed for its negative effect on the low-pressure membrane related applications (i.e., application in MD). However, this effect needs to be further studied. Lawson et al. [162] reported that thickness reduction caused by membrane compaction did not necessarily lead to flux increase in theory. Flux increases are affected by the product of tortuosity and thickness, namely τδ, which is defined as the actual length of the path for vapor or gas. On the other hand, tortuosity increases under compaction, and the overall transmembrane pass length increases if the increased degree of tortuosity exceeds the degree of thickness decay. Therefore, it is recognized that predicting the degree of influence on the permeate flux and/or SR should consider the combined contributions of all related membrane characteristics rather than the individual property alone. Because these characteristic membrane parameters not only affect each other but also can be, to some extent, influenced by operating conditions.
In summary, membrane properties are essential to MD performance because they affect mass transfer and heat transfer. They also influence each other, which gives rise to the complexity of determining the effects of their characteristics. For example, porosity depends on membrane thickness (Equation (24)). Furthermore, a combination of these four properties affects the mass transfer coefficient (Bw), as shown in Equation (26) [58]:
B w ε r ω τ δ
where ω is a diffusion coefficient, ω = 1 and 2 for Knudsen diffusion and viscous flow. It is worth noting that τ δ , in Equation (26), stands for mass transport path length, which should be as small as possible. Predicting flux or discussing the effects of these four membrane parameters should always be based on their synergistic interaction of each other according to Equation (26).

3.1.4. Membrane Thermal Conductivity

Membrane thermal conductivity differs from the thermal conductivity of the membrane materials. Because a membrane is composed of membrane materials and a mixture of air, water vapor, and other volatile compositions inside the pores, porosity influences the membrane thermal conductivity (km), thereby affecting the heat loss via membrane materials. Based on Equations (3)–(6), the heat flux through the membrane material conduction (Qc) is positively proportional to the overall membrane thermal conductivity (km), and is inversely proportional to the membrane thickness (δ). In this case, the water flux increases with lower membrane thermal conductivity when other conditions are the same. In other words, a higher thermal conductivity can lead to flux reduction and thermal efficiency decline. For instance, Alobaidani et al. [163] reported an increase of thermal conductivity from 0.1 to 0.5 W/m/K resulted in a 26% flux reduction and a 50% decrease in thermal efficiency. Moreover, the thermal conductivity of the membrane materials (ks) is more important because ks is typically one magnitude higher than that of the mixture of gas (air/vapor) [102,158,164]. For example, the typical reported thermal conductivities of PVDF, PP, and PTFE polymer materials are approximately 0.18 W/m/K (296 K) and 0.21 W/m/K (348 K), 0.11–0.16 W/m/K (296 K) and 0.2 W/m/K (348 K), and ~0.26 W/m/K (296 K) and 0.29 W/m/K (348 K) [165,166,167]. In contrast, the reported thermal conductivities of water vapor were 0.02 W/m/K and 0.022 W/m/K for 298 K and 348 K, respectively [168]. However, the reported thermal conductivities of inorganic membranes such as ceramic membranes used in MD are greater than 1 W/m/K [14,169,170]. The membrane thermal conductivity is related to the membrane porosity because a higher porosity indicates a lower membrane thermal conductivity, which is beneficial for obtaining high flux. Deka et al. [52] reported a high flux of 33.1 ± 1.7 LMH along with a high CA of ~170° in DCMD using electrospun nanofiber membranes (silica aerogel/PDMS/PVDF membranes) due to the extremely low thermal conductivity of the silica aerogel of 0.009–0.012 W/m/K and high porosity of 85.8 ± 0.28%.

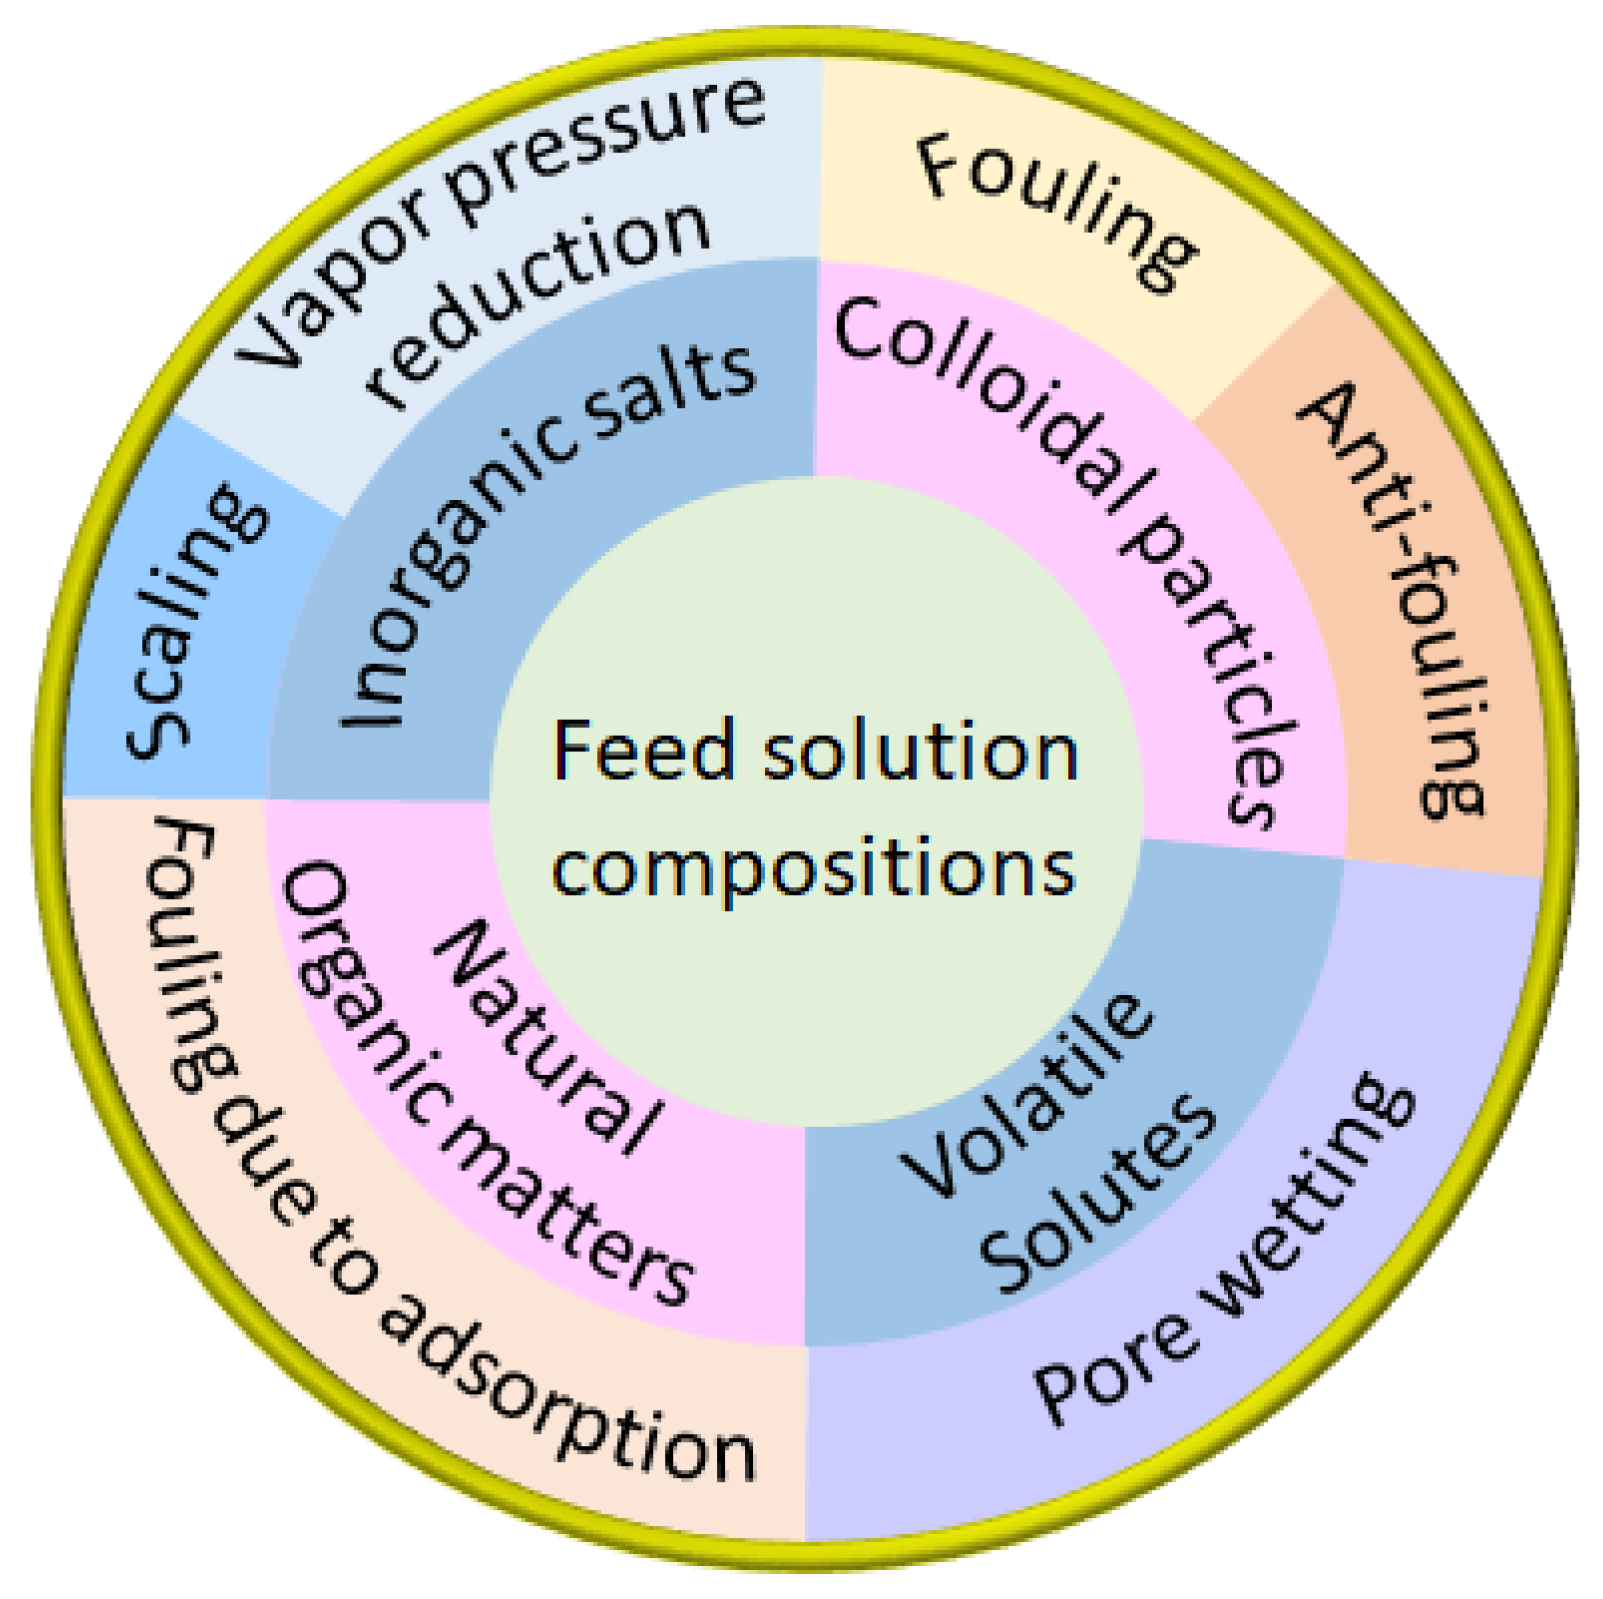
3.2. Effect of Feed Solution Composition on Flux and SR

3.2.1. Effects of Inorganic Salts

Typically, feed solution applied in MD for desalination is an aqueous solution containing salts and other organic and inorganic constituents. A higher concentration of salts results in vapor pressure reduction, as indicated by the Raoult’s law [171,172,173,174]. Li et al. [175] reported a significant decrease of water flux was observed when the concentration of NaCl, KCl, and MgCl2 exceeded 2 M. And the water flux reduced by 44.4%, 59.6% and 86.8% for KCl, NaCl, and MgCl2 when their concentration increased from 2 to 4 M. Guan et al. [176] stated that this was caused by the discrepancy of the water activity and viscosity of the solution due to increase of the salt concentrations. Besides, the sharp reduction of water flux for MgCl2 was mainly caused by the dramatic decline of water activity with MgCl2 concentration greater than 2 M. Both Li et al. [175] and Guan et al. [176] suggested the order of the water activity of aqueous mixture with the three salts was KCl > NaCl > MgCl2 at concentrations higher than 2 M. Guan et al. and Li et al. [175,176] stated that water activity of aqueous solution was related to the non-volatile solutes in the solution. David et al. [177] and Tansel et al. [178] confirmed that Mg2+ ion has the smallest ionic radius and entropy of hydration compared to Na+ and K+, whereas the hydration free energy and hydrated radius are the greatest among them. In addition, the smaller crystal radius of Mg2+ ions enables a more compacted hydration shell and thereby associates with more highly structured water molecules along with the interaction of charged ions. Therefore, the water activity of the MgCl2 solution was the lowest among the three salty aqueous solutions.
Another example was reported by Alkhudhiri and Hidal [25]. They investigated the effects of various high salinity solutions on flux and SR by AGMD using four inorganic salts of NaCl, MgCl2, Na2CO3, and Na2SO4. Their research showed that water flux decreased because of water activity reduction and a higher boiling point due to increased salts concentration [173]. Water activity reduced significantly with increasing salts concentration due to mole fraction reduction of water molecules in the solution. Furthermore, more salts deposited and accumulated on the membrane surface at the feed side and induced the concentration polarization. The combination of water activity reduction, concentration polarization and temperature polarization resulted in a significant reduction of the driving force − transmembrane vapor pressure decline. In addition, deposition and accumulation of salts may induce partially wetting of the membrane, which could in turn conversely influence permeate flux and SR [58,101,179]. On the other hand, this research and other studies [147,148] all confirmed that SR decreased with increasing salt concentrations for the membrane pore size of 1000 nm, and all of them stated that the SR reduction was mainly due to LEP reduction caused by the high pore size. Another important observation in their experiments indicated that the Na2CO3 concentration greater than 42,000 mg/L was a critical value for a sharp decrease of SR, decreasing from above 95% at a concentration of ~10,000 mg/L to ~85% at concentration of ~42,000 mg/L, with the membrane pore size of 0.45 µm, which was in the optimum pore size range. They concluded that this was mainly caused by significant membrane wetting. However, this was not observed on other three salts. Further studies on the intrinsic mechanisms should be conducted.
The effect of inorganic salts on the performance of MD involves membrane scaling such as CaSO4 and CaCO3 due to precipitation on the membrane surface. The scaling layer reduces both permeate flux and SR. Yu et al. [180] investigated the effects of NaHCO3, Na2SO4, CaCl2, and Na2SiO3∙9H2O on the concentrated cooling tower blowdown water (CTBW) using synthetic CTBW in DCMD. They reported: (i) the flux and SR declined due to the formation of scaling; (ii) a flux as high as 30 LMH at ∆T = 40 °C was relatively constant when TDS was below 2.6 wt.%; (iii) CaCO3 was the main scalant for silica-free CTBW which was confirmed by pH reduction due to dissociation of bicarbonate groups as shown in the following reactions (Equations (27)–(29)); (iv) scaling of silica-free CTBW was alkaline and hardness scale indicated by the Langelier Saturation Index (LSI) higher than unity (LSI > 1), presenting CaCO3 scale formation potential. LSI can be calculated using Equation (30) [64,65]:
HCO3 ⇌ H++ CO32−
2HCO3 → H2O↑+ CO2↑+ CO32−
Ca2+ + CO32− ⇌ CaCO3
LSI = pH − pHs
pH is the actual pH value of the feed solution, and pHs refers to the pH value of a saturated solution of calcite or CaCO3. LSI higher than zero indicates a greater potential of precipitation while below zero shows less potential of scaling.
Viscosity was reported as an important factor affecting the boundary layer and TPP, which can be evaluated through Equations (2) to (8). The viscosity and density of the feed solution increase with increasing salts concentration, and Re and Pr number will be dramatically affected. Heat transfer coefficients hf and hp will change directly because of the changed Nu number that is proportional to (RePr)0.33. Therefore, viscosity definitely influences heat transfer in MD. Guan et al. [176] studied the effects of a high concentration of four salts NaCl, KCl, MgSO4, and MgCl2 on the permeate flux in a DCMD. Their results showed that the increased viscosity of MgSO4 and MgCl2 feed solutions at higher salts concentrations had a remarkably negative impact on water flux. This can be explained by a more significant effect of multivalent ions on increased viscosity adjacent to the membrane surface (at the boundary layer) [178]. Alkhudhiri and Hidal [25] also stated that viscosity caused by higher salt concentration might deteriorate the TPP and reduce TPC value, and thereby resulting in a decrease in water flux. Also, the effects of viscosity due to the presence of sucrose was reported. Schofield et al. [86] demonstrated that viscosity of the feed solution with a concentration of sucrose up to 30 wt.% led to a 33% reduction of Nu number and deteriorated the TPP. The increase of viscosity eventually caused an 11% flux reduction and was considered the second most important factor for flux decline. Martínez et al. [155] stated that a high sucrose concentration of up to 40 wt.% resulted in a sharp decrease in heat transfer coefficients due to the exponential increase of solution viscosity.

3.2.2. Effects of Colloidal Particles

Colloids such as surfactants and oil can adsorb onto the surface of the hydrophobic membranes with complex mechanisms. Typically, electrostatic interactions and hydrophobic-hydrophobic interactions are used to explain these phenomena. The mechanisms are mainly based on the DLVO theory (established by Derjaguin, Landau, Verwey, and Overbeek) [181,182,183] and the extended DLVO (x-DLVO) theory. The DLVO mechanism states that the electrical double layer interaction and van der Waals force determine the affinity between colloidal particles and a surface of a medium. The x-DLVO theory combines the Lewis acid-base interaction and the short-range van der Waals interaction, such as hydration force, to explain the membrane wetting. The surface charge plays a vital role in the analysis of attachment and detachment of particles to a membrane surface, which can also explain the fouling formation and its alleviation due to colloidal interaction. It is suggested that the polar interaction at the surface were affected by the electrostatic interaction rather than by the electrical double layer interaction based on the x-DLVO theory [184]. Fouling due to hydrophobic or oleophilic interaction in MD can be mitigated using an underwater oleophobic surface, which means oil-resistant when submerged in water. Wang et al. [123] reported that a water flux as high as 24.3 LMH and remained stable over more than 12 h operation because of the anti-fouling effect attributable to the electrostatic interaction (here refers to the polar-polar interaction) which was induced by the interaction between the negatively charged crude oil emulsion feed solution and the negatively charged PVDF membrane surface modified using polydopamine and silica nanoparticles. In contrast, the water flux of the non-modified PVDF membrane declined drastically and was almost equal to zero within merely two hours of operation, although the initial flux was as high as 31.0 LMH. In addition, the SR rates for these two membranes in DCMD experiments were both above 99.9% with a feed salinity of 1000 mg/L.
Surfactants are amphiphilic compounds composed of the hydrophobic non-polar tail and hydrophilic polar head [185]. The hydrophobic membrane becomes less hydrophobic in the presence of surfactants because of the lower hydrophilic-lipophilic balance (HLB) value and surface tension of the surfactant solution, which can lead to pore wetting. Typical surfactants include two types: non-ionic surfactants such as Span 20 and Tween 20, and the other is ionic surfactants such as sodium dodecyl sulfate (SDS). Their solution behavior, such as adsorption on the membrane surface, differs from each other. Chew et al. [186] studied the effects of surfactants of Span 20, Tween 20, and SDS on the performance of a DCMD using a hydrophobic PVDF membrane. Their experiments were conducted using a synthetic produced water composed of these three surfactants and petroleum and vacuum pump oil. Their research showed that wetting occurred earlier when non-ionic surfactants were present, and the severity of pore wetting followed the order of Tween 20 > Span 20 > SDS. The ultimate conductivities in each permeate were 8.51, 3.56, and 0.15 mS/cm for Tween 20, Span 20, and SDS solution, respectively, when all other parameters were constant. This observation resulted from a discrepancy in wetting and adsorption behavior on the membrane surface. It was reported that the HLB values and electrostatic interaction of the surfactants considerably influence the adsorption behavior [187,188]. For non-ionic surfactants, pore wetting and adsorption are mainly governed by hydrophobic interaction. Tween 20 has a higher HLB value of 16.7, which indicates a lower hydrophobic interaction effect [189]. Thus, Tween 20 has a higher potential to draw more water molecules towards membrane pores than Span 20 because a larger HLB value indicates higher hydrophilicity [188]. In addition, non-ionic surfactants unimers formed, not micelles but a monolayer, due to lipophilic adsorption onto the membrane surface. Therefore, earlier wetting occurred, and water flux sharply decreased. Both hydrophobic interaction and electrostatic interaction play an important role in the adsorption behavior of ionic surfactants such as SDS, which has the highest HLB of 40, indicating SDS is the most hydrophilic among the three surfactants. On the other hand, the repulsion between SDS and negatively charged PVDF membrane occurred, demonstrating that very few unimers of SDS adsorbed stably onto the membrane surface.
Boo et al. [190] also investigated the effects of surfactants in the presence of salts (1.0 M NaCl) on the water flux and SR using PVDF membranes. They observed a slight increase in water flux and SR reduction occurred when 0.05 mM SDS was added into the feed solution. Moreover, the flux increased sharply while SR declined dramatically when 0.1 mM SDS was added. These results demonstrated that the pore wetting occurred when SDS with a concentration higher than 0.05 mM was added in the feed solution. Intrinsically, the presence of SDS reduced the surface tension of the liquid, especially in the presence of salts such as NaCl. For surfactants, the diffusion of surfactants at the liquid-vapor interface is governed by the hydrophobic non-polar tail. In this case, the electrostatic interactions between surfactants and the membrane surface can be inhibited, and the hydrophilic polar head is screened by the adjacent counterions, and thereby resulting in a denser surfactant layer at the interface, which in turn dramatically reduces the liquid surface tension and caused pore wetting [191]. In general, micelles formed when surfactant concentration exceeds its critical micelle concentration. Micelles can grow from spherical aggregate to elongated ones with increasing surfactant concentrations [188]. The formation of micelles and the possible growth of micelles accelerate the onset of pore wetting and thereby lead to flux decline [186].

3.2.3. Effects of Natural Organic Matter

The presence of natural organic matter (NOM) such as proteins [192] and humic acids leads to flux reduction and decreasing non-volatile solutes rejection due to membrane fouling [193,194]. Gryta et al. [195] investigated the flux variation and fouling phenomenon in DCMD using a solution composed of sodium chloride (~50 g/L) and organic matters such as proteins from animal intestines processing as the feed solution and polypropylene (PP) capillary membranes. They reported rapid flux reduction due to the precipitation of organic matter (proteins) on the membrane surface, which was confirmed using Fourier Transform Infrared with diffuse reflectance spectroscopy. The maximum permeate flux declined two-folds during their experiments. However, the electrical conductivity of the permeate was stable at 3–5 μS/cm, although the flux reduced significantly after the formation of fouling layer.
Khayet [196] studied the rejection performance of humic acids in DCMD using PVDF and PTFE membranes together. The initial concentration of humic acid was 30 mg/L in the experiments. The permeate flux decreased for both membranes, whereas a higher rejection rate greater than 96% was observed for both membranes. Fouling due to the deposition of humic acids caused the flux reduction, and this phenomenon can be worse for hydrophobic membrane than for hydrophilic one [197]. They also investigated the effects of solution pH on the fouling and deposition behavior of humic acids. Results showed that humic substances were more soluble under high pH and fouling became worse under low pH (pH < 4). In other words, low pH condition makes humic substances more insoluble or difficult to dissolve. Electrostatic interaction between humic acid macromolecules and charged membrane surface was also affected by pH. At low pH, e.g., pH 4.0, the electrostatic repulsion between humic acids and membrane surface can be reduced and facilitated the fouling of the hydrophobic membrane surface because of the increased humic acid adsorption. Schäfer et al. [198] stated that membrane surface charge was reduced with the decreasing pH, and this can, in turn, accelerate the NOM adsorption, which was also reported by other researchers [199].

3.2.4. Effects of Volatile Solutes

Hydrophobicity of the hydrophobic membranes in MD is easy to get reduced and even damaged in the presence of high concentration of organics such as ethanol. However, the MD system still works if the feed is a mixture of water and low concentration organics. The penetration pressure of the mixture was observed when fed with water-ethanol in the low concentration range. Intrinsically, the liquid-vapor equilibrium of the liquid mixture and mole fraction of the components determine the results. If the mole fraction of ethanol is less than the equilibrium mole fraction of ethanol of the liquid-vapor mixture (namely x e < x e * , the symbol * stands for equilibrium), ethanol is the dominant component in the vapor phase. Besides, they suggested a separation factor α (the selectivity), which is expressed in Equation (31):
α = x 2 1 x 2 1 x 1 x 1
where x1 and x2 refer to the ethanol mole fraction at the feed solution and the permeate, respectively. The selectivity greater than unity indicates the preferred transportation of ethanol vapor through the membrane pores due to its higher volatility.
Gostoli and Sarti [200] reported that the water vapor pressure decreased linearly with the increasing ethanol concentration and disappeared at the ethanol concentration of 75 wt.% when they investigated the separation performance of the mixture using PTFE membrane (TF200, pore size 0.2 μm, thickness 60 μm, and porosity 60%) in AGMD. The ethanol selectivity was between 2.0 and 2.5 when the transmembrane temperature difference ranged from 30–50 °C. Moreover, the ethanol separation factor depended on the feed composition and can be as low as close to unity when the ethanol concentration was 23.8 wt.%. Using the Maxwell-Stefan model [201], which is an ideal model for predicting solute diffusion of multi-components in feed solutions, the predicted binary diffusivity of ethanol-water was ~0.196 cm2/s, consistent with the experimental data.
Another study on the separation of volatile organic compounds was reported by Banat [202]. The ethanol selectivity (ethanol concentration in feed was from 0.83 to 10.2 wt.%) was 3.1–3.4, and 3.05–3.48, at the feed temperatures of 60 and 70 °C, respectively. The relative constant selectivity and the increase of flux with the increasing temperature revealed that the flux increase was mainly due to the mass transfer of ethanol. Meanwhile, the acetone selectivity was observed higher than ethanol at the same conditions, and a lower cooling temperature was preferred to obtain a higher acetone selectivity. The direct wetting concentration of ethanol for the hydrophobic membrane was 34 wt.% ethanol in the ethanol-water mixture while it was 23 wt.% for the acetone-water mixture.
Kujawski et al. [203] investigated the selectivity of micro- and macro-porous ceramic membranes (TiO2) grafted using fluoroalkylsilane on the separation of water-organic solvents mixture using VMD. They found that the selectivity of organic solvents was dependent on the pore size of the modified TiO2 ceramic membranes. The microporous (2–4 nm) titania ceramic membrane had less selectivity of ethyl-acetate (the separation factor was 1.3–30) compared with the higher selectivity of ethyl-acetate (the separation factor was 32–60) using the macroporous membrane (~200 nm).
Wijekoon et al. [204] studied the rejection performance of 29 trace organic compounds (TrOCs) using hydrophobic PTFE membranes in DCMD. They reported that mass transfer of the 29 TrOCs from the feed side to the permeate side mainly depended on their volatility measured by pKH value as defined in Equation (32):
pKH = −log10KH
where KH is the Henry’s law constant (atm∙m3/mol). The pKH greater than 9 (pKH > 9) indicates low volatility (or can be classified as non-volatile) while a pKH value less than 9 (pKH < 9) indicates high volatility. Therefore, some TrOCs with pKH values > 9 are not readily transferred to distillate and hence reached a higher rejection. The authors further stated that 4-tert-octylphenol, 4-tert-butylphenol, and benzophenone with pKH < 9 exhibited rejection of 54%, 73% and 66%, the lowest among all the 29 TrOCs except oxybenzone. Oxybenzone had a pKH values ranging from 8.39–9.23 when the pH of feed solution decreased from 9 to 8. The research suggested that the hydrophobic adsorption could explain this exception because the pKH of oxybenzone and other TrOCs was less than 9. This phenomenon was also reported by Zuo and Wang [205].
The general mechanisms of feed solution compositions affecting permeate flux and SR in MD are summarized in Figure 5.

3.3. Effects of Operating Conditions

3.3.1. Temperature

Temperature is an important operating parameter. As mentioned in Section 2, temperature difference at both sides determines the vapor pressure difference (or partial vapor pressure difference or gradient), which is the driving force for mass transfer through the membrane pores [58,86,206,207]. Typically, the temperature at the cold side is fixed and the feed temperature is adjustable to study how temperature affects the flux in DCMD, AGMD, and SGMD. However, the vacuum pressure level determines the driving force for mass transfer in VMD. Theoretically, an increase of feed temperature not only enhances driving force to obtain more flux but also improves thermal efficiency due to improved TPC value when the permeate temperatures in DCMD, AGMD, and SGMD (or vacuum pressure level in VMD) were kept constant. In other words, feed temperature can influence not only mass transfer coefficients for transition flow regime but also the heat transfer coefficients, and these can be denoted directly based on Equations (2), (3), (9)–(11), and (13)–(17).
Researches [10,62,104,105,106,112,206,208,209,210] showed that increasing feed temperature could increase the interfacial temperature adjacent to the membrane surface at the feed side and alleviate temperature polarization. Many studies [19,119,132,211,212,213] demonstrated that water flux increased exponentially with the increase of feed temperatures according to the Antoine equation. In addition, the profile of temperature from liquid/membrane interface (T1) to membrane/liquid interface (T2) shows that it declines exponentially across the membrane [214]. The majority of heat flux through the membrane is the diffusive heat flux conducted via the membrane materials, defined as heat loss due to thermal conduction of membrane materials. Kim [214] reported that the linear approximation of transmembrane temperature decrease could be valid. It was suggested that a higher feed temperature with a fixed cooling temperature generates more water flux than a lower permeate cooling temperature with a fixed feed temperature. In other words, increased feed temperature can produce more water vapor molecules at the liquid/vapor interface when the temperature at the cold side is fixed.
Other research using higher feed inlet temperature showed the feed inlet temperature of 180 °C achieved much higher DCMD performance than the conventional maximal value of 80 °C [119]. The modeling results showed that the permeate flux increased by 9.4 folds, the thermal efficiency increased by 2.1 folds, and the SEC reduced by 2.9 folds.
On the other hand, increased feed solution temperature has an adverse impact on pore wetting. Nayar et al. [215] reported that increasing temperature resulted in surface tension reduction, making membrane pores wetting easier due to lowered LEP in higher temperature cases.

3.3.2. Flow Rate

The flow rate or flow velocity is of vital importance for MD. An increase in flow rate or velocity can increase the Re number. Therefore, a high flow rate or velocity is beneficial to obtain a turbulent flow regime, which renders the better mixing of the feed solution and reduces the thermal boundary layer along with the temperature polarization. Thus, increasing flow rate or flow velocity can enhance the TPC value and the vapor pressure difference and hence facilitate both mass transfer and heat transfer. Manawi et al. [209] reported that the flux increased from 18.1 LMH at both sides flow rates of 0.5 L/min to 29.1 LMH at both sides flow rate of 1.5 L/min with all other conditions the same. However, the flow rate cannot be increased infinitely because of the increasing pressure drop due to the increased flow rate or velocity. Pressure drop occurs due to the resistance of the fluid channel and cell walls in the modules. A certain flow rate is necessary to pump fluid into the MD cell and flow through the channel. Nevertheless, an excessive increase in flow rate or flow velocity will result in a great pressure drop. Typically, the pressure drop is positively proportional to the square of flow velocity. Their relationship is expressed in Equation (33) [216]:
Δ P = f L d u 2 2 ρ
where ∆P is the pressure drop, L the length of channels, f the friction factor, d the hydraulic diameter of the flow channel, ρ the liquid density, and u the flow velocity.
The effects of flow rates on scaling in DCMD were reported in Ref. [136,217,218]. The researchers investigated the effects of feed flow rates (e.g., 84, 688, and 1438 mL/min) on flux and scaling behaviors in cross-flow DCMD using silicone-fluoropolymer coated PP hollow fiber membranes. The water vapor flux increased with increasing feed flow rates due to an increase in Reynolds number (Re), which increased the heat transfer coefficient in the boundary layer. However, they observed that permeate flux dropped to ~5.5 mL/min at the end of both the cases of feed flow rates of 688 mL/min and 1438 mL/min, and the authors attributed this to the reduction of the brine inlet flow rate because the filter holder was clogged by gypsum precipitations.
Moreover, the effects of flow pressure drop can be significant if the hot brine flows through the bore of the hollow fibers, which differs from the case of hot brine flowing over the hollow fibers [136,217,218]. Singh and Sirkar reported [219] that a higher flow rate of hot brine through the bore of the porous PP hollow fibers resulted in a significant pressure drop. Considerable salt leakage (salt concentration in the permeate of >50 mg/L) was observed at the highest brine flow rate of 150 mL/min due to the negative effect of flow pressure drop.
Cath et al. [10] revealed that there was a maximum allowable flow rate or flow velocity, and the mixing of the liquid in the channel, to some extent, was limited. They also emphasized the importance of pressure drop in the design of an MD system.
To achieve a turbulent flow regime while maintaining a flow rate below the maximum allowable flow rate, researchers have used spacers to enhance Re number to improve the flow regime, reduce the TPP, and increase the TPC value [220,221,222]. Phattaranawik et al. [222] reported that TPC values ranged from 0.9 to 0.97, which was close to unity for spacers-filled channels, whereas the TPC ranged merely from 0.57 to 0.76 without spacers. Manawi et al. [223] confirmed the same effect that the highest TPC value in their experiments increased from 0.66 at a feed flow rate of 1.5 L/min to 0.82 at a feed flow rate of 3.0 L/min, and that TPC values were 0.66 with spacers and 0.47 without spacers. Their results showed that increased feed flow rate and use of spacers in channels could reduce TPP and enhance TPC values. Nevertheless, flow rate or flow velocity should not be increased excessively because too high flow velocity leads to higher hydraulic pressure, which may be greater than LEP and result in pore wetting.

3.3.3. Operating Mode

The operating mode here refers to co-current, counter-current flow mode, and other modes. The co-current refers to the flow directions at both sides are the same, while the counter-current flow means both sides have an opposite flow direction. Figure 1. shows the counter-current flow mode. Manawi et al. [209] reported that the counter-current flow gave rise to a higher distillate flux when other conditions kept constant. They observed a permeate flux of 37 LMH using counter-current flow while the flux was 34.8 LMH using co-current flow with all other parameters the same (flow rates of both sides were 1.5 L/min, temperatures at feed and cold side were 70 and 30 °C, respectively). This enhancement of flux is due to a higher driving force induced by greater tangential force of counter-current flow. They concluded that the counter-current flow could increase temperature difference, thereby improving mass transfer. The enhancement of flux should be mainly attributed to increased TPC rather than temperature difference. Manawi et al. [223] also found that the counter-current flow generated a higher TPC value (0.66) than the co-current flow mode (0.59). Their observation reflected the counter-current flow caused a less TPP and a higher temperature difference.
Crossflow is another operation mode in which the membrane surfaces are continuously scoured and therefore enhancing resistance to water vapor flux decline in the presence of salt precipitations. For example, He et al. [217,218] and Song et al. [136] conducted a series of studies to investigate scaling behavior on lab-scale as well as pilot-scale DCMD performances for desalination using silicone-fluoropolymer coated PP hollow fiber membranes in crossflow DCMD mode. The authors demonstrated that no significant flux and no salt rejection reduction was observed at increasing temperatures or high concentrations, indicating no effect of CaCO3 scaling on permeate flux. The authors [136,217,218] also concluded that the crossflow pattern and hydrophobic porous coating were beneficial for scaling resistance.
In addition to the conventional operating modes, another method for enhancing flux in MD was reported by Cath et al. [10]. They operated their MD by changing the positions of the solution pump and investigated the effects of different negative pressure (vacuum) values on flux. In the conventional DCMD configuration, the pump was installed between the MD cells and solution tanks, and the direction of fluid was from the tanks via pumps to MD cells. However, in their design and experiments, Cath et al. put pumps after the MD cells to suck the fluid from MD channels into outer fluid tanks. Results showed that flux increased by 15% while the fluid pressure at the permeate side reduced from positive 108 kPa to slightly negative 94 kPa. Moreover, the flux increased by 84% when the pressure dropped from 108 to 55 kPa compared to the flux of the conventional MD system. Water flux increased because of enhanced mass transport, which resulted from the alleviation of temperature polarization and partial mitigation of mass transfer resistance due to the stagnant air trapped inside the pores. Therefore, elimination of the gas or air from the solution and pores is beneficial for the higher performance of MD as discussed in Section 3.3.4.

3.3.4. Degasification

Non-condensable gas such as air [224] can dissolve in feed solution and then can be entrapped inside the membrane pores, which in turn increases the additional molecule diffusion resistance for mass transport [87,206,225]. Degasification of the feed stream and/or permeate stream reduces the diffusion resistance for mass transfer because of the reduced stagnant air layer. Schneider and van Gassel [226] introduced degassed fluid into MD to reduce the partial air pressure. They reported the flux increased greater than two folds when the permeate side operated under vacuum. In addition, Schofield et al. [227] investigated the effect of degassing on flux using pure water, and they reported that permeate flux increased by 50% due to the deaeration of the feed stream. They also found that deaeration of feeds increased heat transfer coefficients by seven-fold and reduced the heat loss via conduction to less than 10%. However, they stated that MD performance was more dependent on membrane modules rather than membranes themselves.

3.3.5. Long-Term Operation

The long-term operation generates potential risks of fouling and scaling on the membrane surface, leading to wetting or partial wetting of membrane pores, reducing flux, and increasing distillate conductivity. An example of long-term operation using PP hollow fiber membranes in a small pilot plant for desalination of seawater in three single-pair cross-flow DCMD was reported by Song et al. [136]. They investigated the desalination performance using actual trucked-in seawater (TDS 28,050 mg/L) as feed for 3 months in this study [136]. No salt leakage was observed for 5 days with the concentrated salty brine of ~19% prior to salts precipitation. The hydrophobic, silicone-fluoropolymer thin coating layer polymerized via plasma generated a high advancing CA of 142.18° for fresh coated PP hollow fiber membranes and contributed to the excellent performance of MD. Besides, cross-flow also played an important role in mitigating scaling.
Flat sheet membranes were employed in long-term MD. McGaughey et al. [228] reported a significant decrease in hydrophobicity and surface roughness of the membrane during desalting a 35 g/L NaCl solution with flat sheet expanded polytetrafluoroethylene (PTFE) for 100 days. CA of the membrane decreased by 56% for the used membrane compared with the pristine one (decreased from 140 ± 4.0° to 61 ± 9.1°) along with a decrease of LEP from 450 to 0 kPa, and corresponding surface roughness at the feed side decreased from 31.0 ± 5.40 nm to 3.0 ± 0.88 nm showing a reduction percentage of 92%. However, they observed a stable SR of 99.8% and permeate conductivity of less than 8 μS/cm throughout the 100-days experiments, although the distillate flux decreased from 30 to ~25 LMH. The low distillate conductivity and high SR demonstrated that most of the membrane was dry (not wetted), which was confirmed by the fact that the node area between fibers was composed of merely membrane materials via higher magnification energy-dispersive X-ray spectroscopy. The authors [228] concluded that the internal pore wall and permeate-side hydrophobicity played an important role in anti-wetting during long-term operation. Other studies also observed the reduction of distillate electrical conductivity [135,229,230]. For instance, Guillen-Burrieza et al. [229] studied the long-term operation (intermittent from the year 2010 to 2013) effect on the desalination performance of salty marine solution (3.5 wt.% NaCl solution) using AGMD system in a solar MD pilot plant. They reported a significant increase in the minimum electrical conductivity of the permeate from 20 μS/cm in 2010 to 10 mS/cm in 2013. However, they stated that this decline of electrical conductivity was due to pore wetting because of severe and extensive damage of the membrane rather than the conventionally reported scaling and operating wetting. In other words, the long-term operation may exert a complex effect on flux and distillate quality, which can be influenced by membranes, operating spans, feed solution compositions, and other conditions.

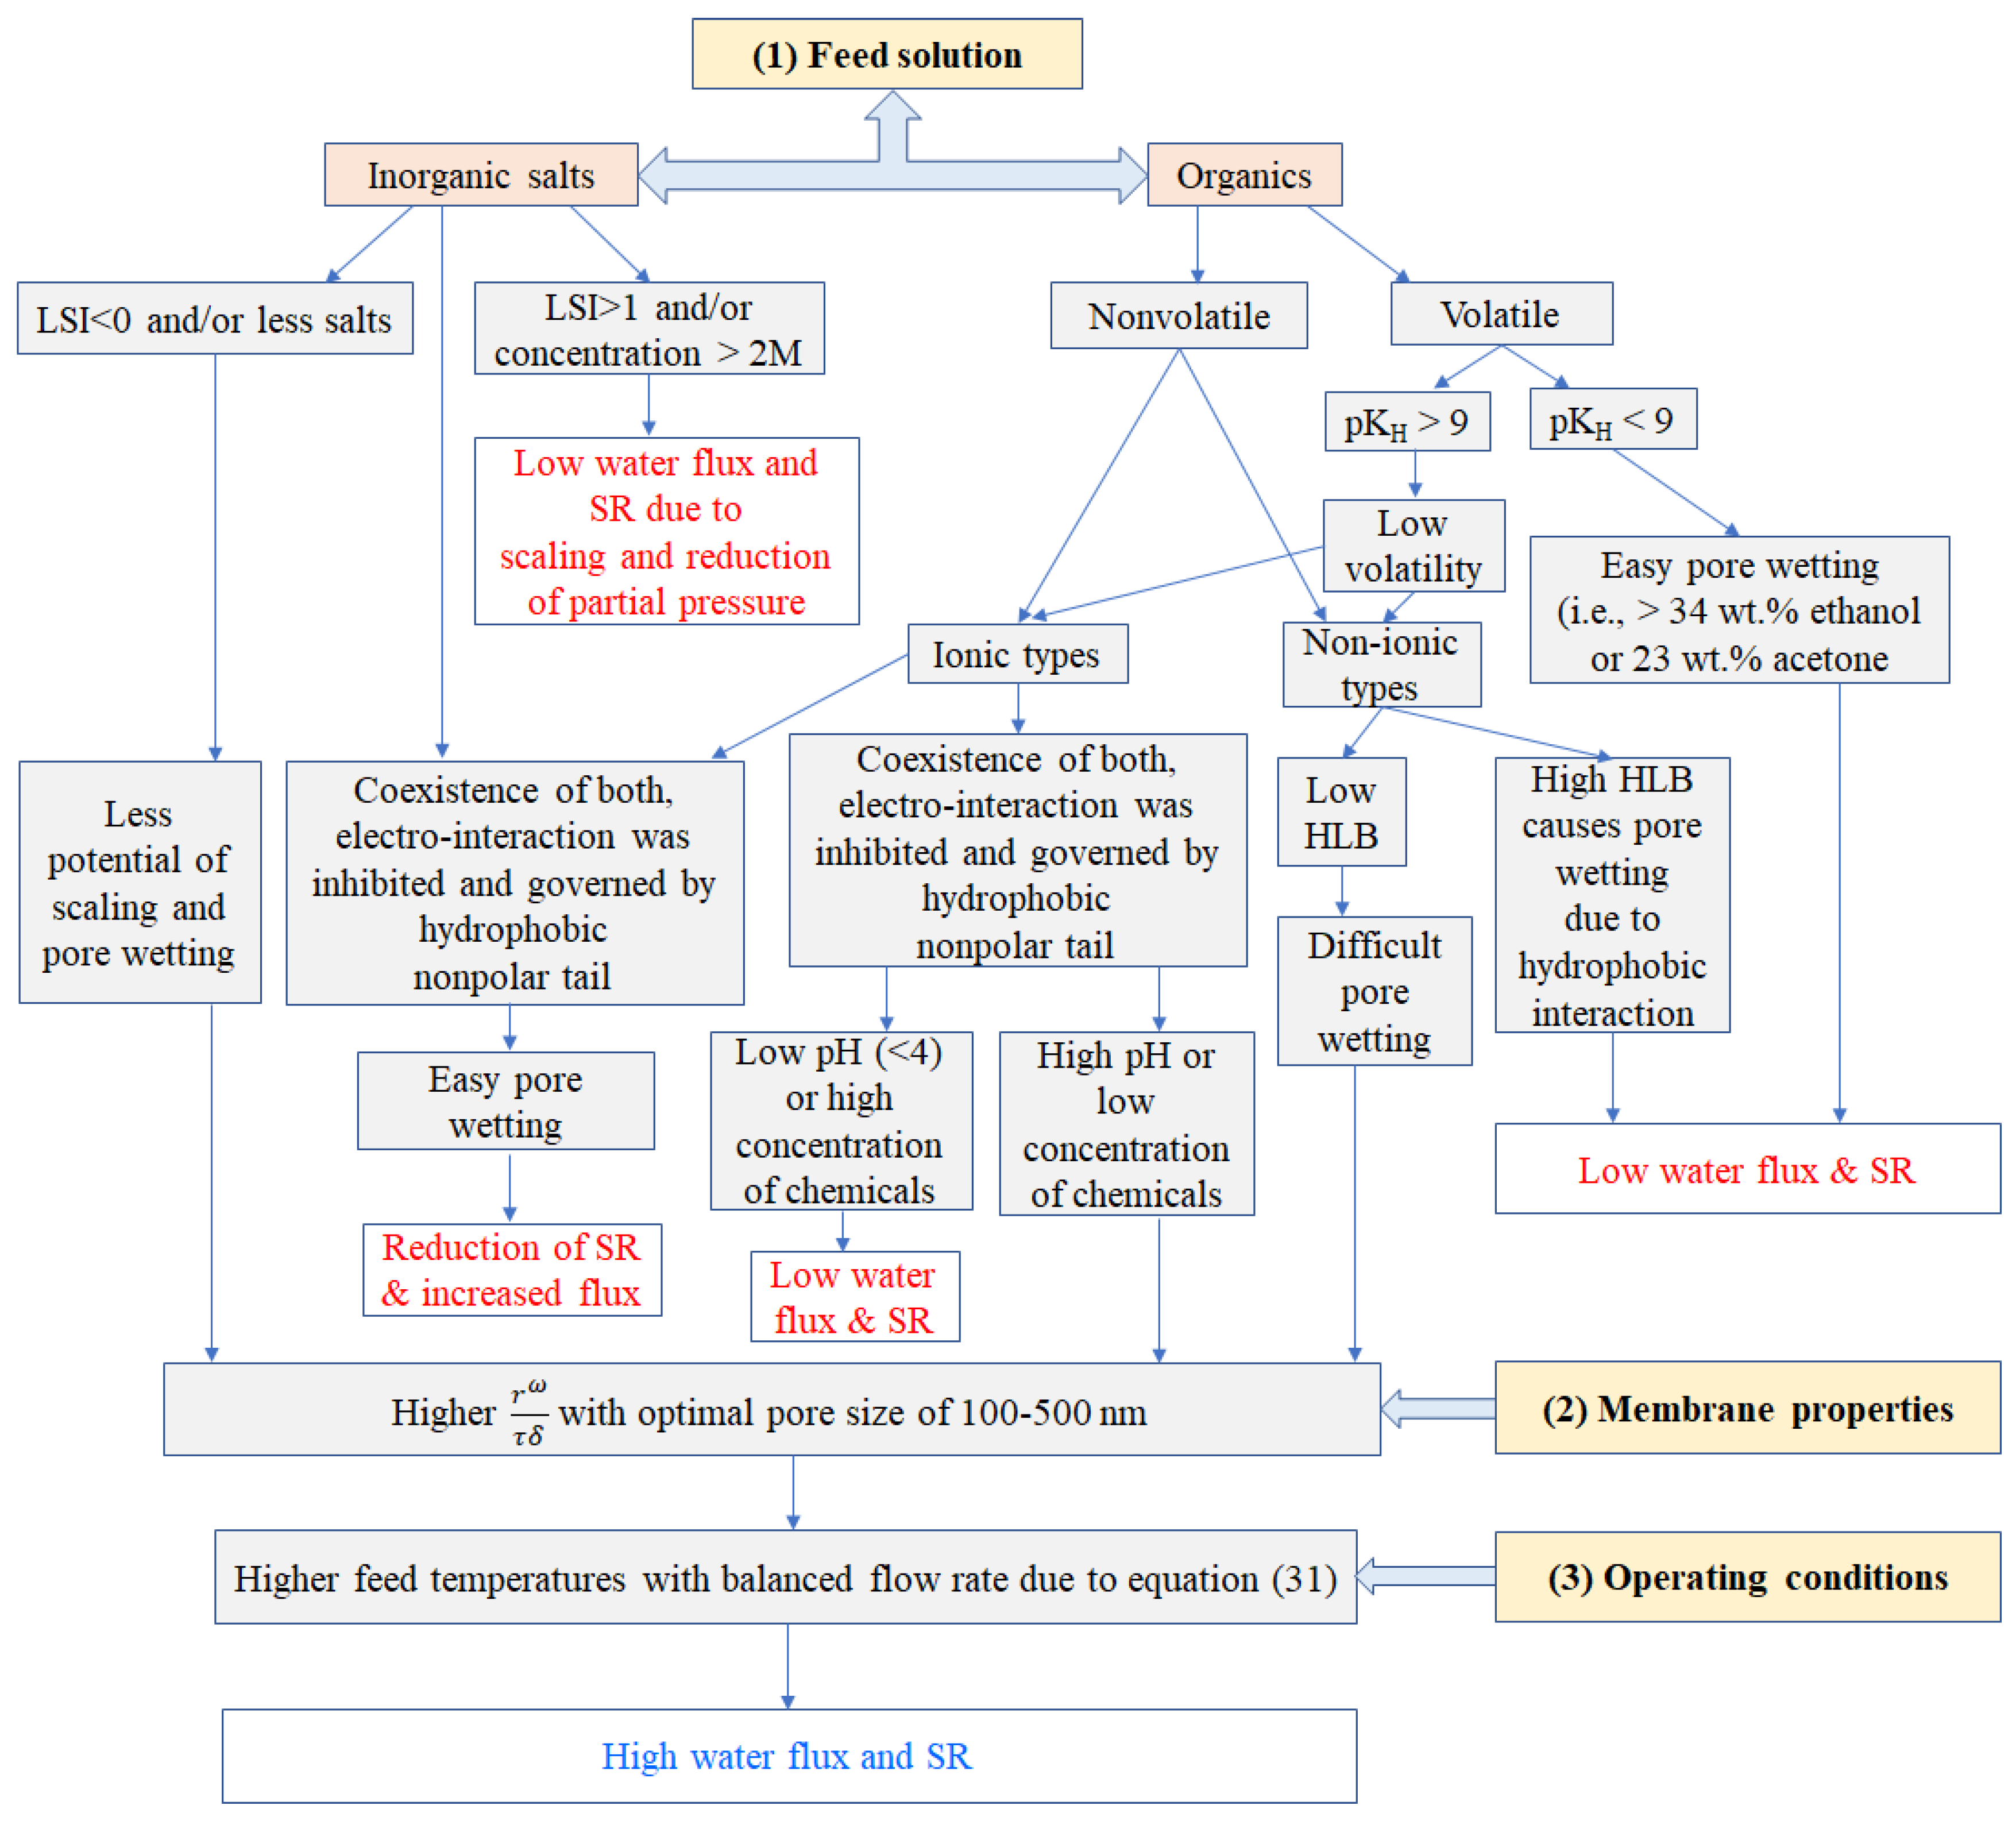
4. Interplay of Affecting Factors

The interlaced relevance effects of each factor on the MD mass transfer are summarized in Figure 6, including membrane properties, feed solution chemistry, and operating conditions. The interplay between various factors that affect flux and SR in MD is illustrated based on the feed solution grouped into inorganic salts and organics, and then sub-grouped organics into non-volatile and volatile organics. Non-volatiles are further divided into non-ionic and ionic types attributed to their dominant governing mechanisms of either hydrophobic interaction or electro-interaction (typically the electro-repulsion due to the same charges between the chemicals and membrane surface). Adverse variation of even one factor can result in unfavorable effects on others because of the “bottleneck principle”. The negative effect of only one factor without the optimal value or slight change may reduce flux and/or SR although all other parameters are optimal.

5. Conclusions

Estimating mass transfer and SR in MD is complicated and needs a systematic approach because many factors need to be considered, including membrane properties, feed solution, and operating conditions. A comprehensive understanding of interactions of these factors and their effects on heat transfer, mass transfer, and SR can provide a complete and valuable foundation for modeling mass and heat transfer, selecting membranes, optimizing operation, enhancing flux, and reducing membrane scaling and fouling. Although there were studies that examined some aspects of factors that may affect water vapor transport via analysis of operating conditions or membranes properties and the physico-chemical attributes of feed solutions, a systematic discussion and analysis of the importance of each factor is still of vital importance for the evaluation of MD performance in terms of predicting mass flux and SR. The interplay of the factors affecting the MD mass transfer showed the adverse variation of even one of the factors could cause negative effect because of the “bottleneck principle”, although all other parameters are optimal.
It is noteworthy that this review aims to qualitatively determine the interaction of each factor and the effect of all the factors on mass transfer and rejection of salts in the application of MD. Further research, such as mathematical and empirical modeling on the significance of parameters on the performance of MD system, should be conducted and validated by experimental results.

Author Contributions

L.C., P.X. and H.W. wrote the original draft and edited the manuscript. H.W. and P.X. acquired funding and managed the research project. All authors have read and agreed to the published version of the manuscript.

Funding

This research was funded by the United States Bureau of Reclamation Desalination and Water Purification Research and Development Program (Agreement No. R19AC00109) and ExxonMobil Upstream Research Company for financial support.

Acknowledgments

The authors thank Deepak Musale, Carlos Galdeano, and Ganesh L. Ghurye with ExxonMobil for technical discussions. Lin Chen thanks New Mexico Water Resource Research Institute (WRRI) Student Research Grant for financial, conference communication, and administrative assistance in funding and managing the project.

Conflicts of Interest

The authors declare no conflict of interest. The funders had no role in the design of the study; in the collection, analyses, or interpretation of data; in the writing of the manuscript, or in the decision to publish the results.

Nomenclature

ASurface area of membrane (m2)
AGMDAir gap membrane distillation
BGeometry coefficient for pore structure
B w K Mass transfer coefficients for Knudsen diffusion (m/s)
B w M Mass transfer coefficients for molecular diffusion (m/s)
BwMass transfer coefficient (m/s)
C 1 non-volatile solutes Concentration at liquid/membrane interface (mg/L)
C f Concentration of non-volatile solutes at bulk feed side (mg/L)
cpSpecific heat of fluid (J/kg/K)
CAContact angle (°)
CTBWCooling tower blowdown water
DWater molecule diffusion coefficient (m2/s)
dHydraulic diameter of the flow channel (m)
dhHydraulic diameter (m)
dpMembrane pore size (nm)
DCMDDirect contact membrane distillation
DLVODerjaguin, Landau, Verwey, and Overbeek
fFriction factor (dimensionless)
HOverall heat transfer coefficient (W/m2/K)
hfHeat transfer coefficients at the bulk feed side
hpHeat transfer coefficients at the bulk permeate side
HLBHydrophilic-lipophilic balance value (dimensionless)
Hv,wLatent heat of vaporization of water (KJ/kg)
JWater flux (kg/m2/h)
kFluid thermal conductivity (W/m/K)
kBBoltzmann constant
kgThermal conductivity of gas inside pores (W/m/K)
KHHenry’s law constant (atm∙m3/mol)
kmOverall thermal conductivity of the membrane (W/m/K)
KnKnudsen number (dimensionless)
ksThermal conductivity of membrane material (W/m/K)
LLength of channels (m)
lDistance from the membrane surface (m)
LEPLiquid entry pressure (kPa)
LMHLiters per meter square per hour (L/m2/h)
LSILangelier Saturation Index (dimensionless)
mMass of membrane (kg)
MDMembrane distillation
NOMNatural organic matter
PTotal pressure (Pa)
∆PPressure drop (Pa)
P1Partial pressure of vapor at liquid-vapor interface at feed side (Pa)
P2Partial pressure of vapor at liquid-vapor interface at permeate side (Pa)
PaAir pressure inside the membrane pores (Pa)
PfPressure at feed side(Pa)
PiPartial pressure of liquid-vapor interface (Pa)
PmMean pressure within pores (Pa)
PpPressure at permeate side (Pa)
PDMSPoly-dimethylsiloxane
PPPolypropylene
PSDPore size distribution
PS-PDMSPolysulfone-poly-dimethylsiloxane
PTFEPolytetrafluoroethylene
PVDFPolyvinylidene fluoride
QHeat flux (W)
RGas constant (J/mol/K)
rmaxMaximum pore size (nm)
ROReverse osmosis
SDSSodium dodecyl sulfate
SECSpecific energy consumption
SGMDSweeping gas membrane distillation
SRSalt rejection
T1Absolute temperature of membrane surface at feed side (K)
T2Absolute temperature of membrane surface at permeate side (K)
TpAbsolute temperature of the bulk permeate side (K)
TfAbsolute temperature of the bulk feed side (K)
TPCTemperature polarization coefficient
TPPTemperature polarization phenomenon
TrOCsTrace organic compounds
VMDVacuum membrane distillation
uAverage velocity (m/s)
αSelectivity of volatile chemical (dimensionless)
μViscosity of fluid (Pa∙s)
ρDensity of fluid (kg/m3)
εPorosity of membrane (dimensionless)
ρpDensity of membrane material (kg/m3)
τTortuosity of membrane (dimensionless)
ωA diffusion coefficient for pore radius (dimensionless)
θ Water contact angle (°)
λ Mean free path of water molecules (m)
δMembrane thickness (μm)

References

  1. Xu, X.; He, Q.; Ma, G.; Wang, H.; Nirmalakhandan, N.; Xu, P. Selective separation of mono- and di-valent cations in electrodialysis during brackish water desalination: Bench and pilot-scale studies. Desalination 2018, 428, 146–160. [Google Scholar] [CrossRef]
  2. Scanlon, B.R.; Reedy, R.C.; Xu, P.; Engle, M.; Nicot, J.; Yoxtheimer, D.; Yang, Q.; Ikonnikova, S. Can we beneficially reuse produced water from oil and gas extraction in the U.S.? Sci. Total Environ. 2020, 717, 137085. [Google Scholar] [CrossRef] [PubMed]
  3. Hancock, N.T.; Xu, P.; Roby, M.J.; Gomez, J.D.; Cath, T.Y. Towards direct potable reuse with forward osmosis: Technical assessment of long-term process performance at the pilot scale. J. Membr. Sci. 2013, 445, 34–46. [Google Scholar] [CrossRef]
  4. Amy, G.; Ghaffour, N.; Li, Z.; Francis, L.; Linares, R.V.; Missimer, T.; Lattemann, S. Membrane-based seawater desalination: Present and future prospects. Desalination 2017, 401, 16–21. [Google Scholar] [CrossRef]
  5. Rao, P.; Aghajanzadeh, A.; Sheaffer, P.; Morrow, W.R.; Brueske, S.; Dollinger, C.; Price, K.; Sarker, P.; Ward, N.; Cresko, J. Volume 1: Survey of Available Information in Support of the Energy-Water Bandwidth Study of Desalination Systems; Report Prepared by Lawrence Berkeley National Laboratory (LBNL) and Energetics Incorporated for the U.S. Department of Energy’s Advanced Manufacturing Office (AMO): Washington, DC, USA, 2016.
  6. USDOE. Bandwidth Study on Energy Use and Potential Energy Savings Opportunities in U.S. Seawater Desalination Systems; Report Published by Advanced Manufacturing Office (AMO) of the U.S. Department of Energy (USDOE) under Contract No. DE-AC02-05CH11231: Washington, DC, USA, 2017.
  7. Kaminski, W.; Marszalek, J.; Tomczak, E. Water desalination by pervaporation—Comparison of energy consumption. Desalination 2018, 433, 89–93. [Google Scholar] [CrossRef]
  8. Zarzo, D.; Prats, D. Desalination and energy consumption. What can we expect in the near future? Desalination 2018, 427, 1–9. [Google Scholar] [CrossRef]
  9. Bodell, B.R. Silicone Rubber Vapor Diffusion in Saline Water Distillation. Patent Serial No. 285,032, 3 June 1963. [Google Scholar]
  10. Cath, T.Y.; Adams, V.D.; Childress, A.E. Experimental study of desalination using direct contact membrane distillation: A new approach to flux enhancement. J. Membr. Sci. 2004, 228, 5–16. [Google Scholar] [CrossRef]
  11. Larbot, A.; Gazagnes, L.; Krajewski, S.; Bukowska, M.; Kujawski, W. Water desalination using ceramic membrane distillation. Desalination 2004, 168, 367–372. [Google Scholar] [CrossRef]
  12. Li, B.; Sirkar, K.K. Novel membrane and device for vacuum membrane distillation-based desalination process. J. Membr. Sci. 2005, 257, 60–75. [Google Scholar] [CrossRef]
  13. Xu, Y.; Zhu, B.-K.; Xu, Y.-Y. Pilot test of vacuum membrane distillation for seawater desalination on a ship. Desalination 2006, 189, 165–169. [Google Scholar] [CrossRef]
  14. Cerneaux, S.; Strużyńska, I.; Kujawski, W.; Persin, M.; Larbot, A. Comparison of various membrane distillation methods for desalination using hydrophobic ceramic membranes. J. Membr. Sci. 2009, 337, 55–60. [Google Scholar] [CrossRef]
  15. Ma, Z.; Hong, Y.; Ma, L.; Su, M. Superhydrophobic Membranes with Ordered Arrays of Nanospiked Microchannels for Water Desalination. Langmuir 2009, 25, 5446–5450. [Google Scholar] [CrossRef] [PubMed]
  16. Safavi, M.; Mohammadi, T. High-salinity water desalination using VMD. Chem. Eng. J. 2009, 149, 191–195. [Google Scholar] [CrossRef]
  17. Cipollina, A.; Di Sparti, M.; Tamburini, A.; Micale, G. Development of a Membrane Distillation module for solar energy seawater desalination. Chem. Eng. Res. Des. 2012, 90, 2101–2121. [Google Scholar] [CrossRef]
  18. Fang, H.; Gao, J.; Wang, H.; Chen, C. Hydrophobic porous alumina hollow fiber for water desalination via membrane distillation process. J. Membr. Sci. 2012, 403, 41–46. [Google Scholar] [CrossRef]
  19. Singh, D.; Sirkar, K.K. Desalination of brine and produced water by direct contact membrane distillation at high temperatures and pressures. J. Membr. Sci. 2012, 389, 380–388. [Google Scholar] [CrossRef]
  20. Geng, H.; Wu, H.; Li, P.; He, Q. Study on a new air-gap membrane distillation module for desalination. Desalination 2014, 334, 29–38. [Google Scholar] [CrossRef]
  21. Wang, Y.; Xu, Z.; Lior, N.; Zeng, H. An experimental study of solar thermal vacuum membrane distillation desalination. Desalin. Water Treat. 2014, 53, 887–897. [Google Scholar] [CrossRef]
  22. Khalifa, A.E.; Lawal, D.U. Performance and Optimization of Air Gap Membrane Distillation System for Water Desalination. Arab. J. Sci. Eng. 2015, 40, 3627–3639. [Google Scholar] [CrossRef]
  23. Ren, C.; Fang, H.; Gu, J.; Winnubst, L.; Chen, C. Preparation and characterization of hydrophobic alumina planar membranes for water desalination. J. Eur. Ceram. Soc. 2015, 35, 723–730. [Google Scholar] [CrossRef]
  24. Woo, Y.C.; Tijing, L.D.; Shim, W.-G.; Choi, J.-S.; Kim, S.-H.; He, T.; Drioli, E.; Shon, H.K. Water desalination using graphene-enhanced electrospun nanofiber membrane via air gap membrane distillation. J. Membr. Sci. 2016, 520, 99–110. [Google Scholar] [CrossRef]
  25. Alkhudhiri, A.; Hilal, N. Air gap membrane distillation: A detailed study of high saline solution. Desalination 2017, 403, 179–186. [Google Scholar] [CrossRef] [Green Version]
  26. Hubadillah, S.K.; Othman, M.H.D.; Matsuura, T.; Rahman, M.A.; Jaafar, J.; Ismail, A.; Amin, S.Z.M. Green silica-based ceramic hollow fiber membrane for seawater desalination via direct contact membrane distillation. Sep. Purif. Technol. 2018, 205, 22–31. [Google Scholar] [CrossRef]
  27. Nthunya, L.N.; Gutierrez, L.; Lapeire, L.; Verbeken, K.; Zaouri, N.; Nxumalo, E.N.; Mamba, B.B.; Verliefde, A.R.; Mhlanga, S.D. Fouling-resistant PVDF nanofibre membranes for the desalination of brackish water in membrane distillation. Sep. Purif. Technol. 2019, 228, 115793. [Google Scholar] [CrossRef]
  28. Macedonio, F.; Ali, A.; Poerio, T.; El-Sayed, E.; Drioli, E.; Abdel-Jawad, M. Direct contact membrane distillation for treatment of oilfield produced water. Sep. Purif. Technol. 2014, 126, 69–81. [Google Scholar] [CrossRef]
  29. Lokare, O.R.; Tavakkoli, S.; Wadekar, S.; Khanna, V.; Vidic, R.D. Fouling in direct contact membrane distillation of produced water from unconventional gas extraction. J. Membr. Sci. 2017, 524, 493–501. [Google Scholar] [CrossRef] [Green Version]
  30. Li, F.; Huang, J.; Xia, Q.; Lou, M.; Yang, B.; Tian, Q.; Liu, Y. Direct contact membrane distillation for the treatment of industrial dyeing wastewater and characteristic pollutants. Sep. Purif. Technol. 2018, 195, 83–91. [Google Scholar] [CrossRef]
  31. Xu, J.; Srivatsa Bettahalli, N.M.; Chisca, S.; Khalid, M.K.; Ghaffour, N.; Vilagines, R.; Nunes, S.P. Polyoxadiazole hollow fibers for produced water treatment by direct contact membrane distillation. Desalination 2018, 432, 32–39. [Google Scholar] [CrossRef]
  32. Attia, H.; Osman, M.S.; Johnson, D.J.; Wright, C.; Hilal, N. Modelling of air gap membrane distillation and its application in heavy metals removal. Desalination 2017, 424, 27–36. [Google Scholar] [CrossRef] [Green Version]
  33. Fujii, Y.; Kigoshi, S.; Iwatani, H.; Aoyama, M. Selectivity and characteristics of direct contact membrane distillation type experiment. I. Permeability and selectivity through dried hydrophobic fine porous membranes. J. Membr. Sci. 1992, 72, 53–72. [Google Scholar] [CrossRef]
  34. Fujii, Y.; Kigoshi, S.; Iwatani, H.; Aoyama, M.; Fusaoka, Y. Selectivity and characteristics of direct contact membrane distillation type experiment. II. Membrane treatment and selectivity increase. J. Membr. Sci. 1992, 72, 73–89. [Google Scholar] [CrossRef]
  35. Criscuoli, A.; Bafaro, P.; Drioli, E. Vacuum membrane distillation for purifying waters containing arsenic. Desalination 2013, 323, 17–21. [Google Scholar] [CrossRef]
  36. Ozbey-Unal, B.; Koseoglu-Imer, D.Y.; Keskinler, B.; Koyuncu, I. Boron removal from geothermal water by air gap membrane distillation. Desalination 2018, 433, 141–150. [Google Scholar] [CrossRef]
  37. Bush, J.A.; Vanneste, J.; Cath, T.Y. Comparison of membrane distillation and high-temperature nanofiltration processes for treatment of silica-saturated water. J. Membr. Sci. 2019, 570–571, 258–269. [Google Scholar] [CrossRef]
  38. Choi, Y.; Naidu, G.; Lee, S.; Vigneswaran, S. Recovery of sodium sulfate from seawater brine using fractional submerged membrane distillation crystallizer. Chemosphere 2020, 238, 124641. [Google Scholar] [CrossRef] [PubMed]
  39. Li, Q.; Omar, A.; Cha-Umpong, W.; Liu, Q.; Li, X.; Wen, J.; Wang, Y.; Razmjou, A.; Guan, J.; Izadgoshasb, I. The potential of hollow fiber vacuum multi-effect membrane distillation for brine treatment. Appl. Energy 2020, 276, 115437. [Google Scholar] [CrossRef]
  40. AlRehaili, O.; Perreault, F.; Sinha, S.; Westerhoff, P. Increasing net water recovery of reverse osmosis with membrane distillation using natural thermal differentials between brine and co-located water sources: Impacts at large reclamation facilities. Water Res. 2020, 184, 116134. [Google Scholar] [CrossRef] [PubMed]
  41. Laganà, F.; Barbieri, G.; Drioli, E. Direct contact membrane distillation: Modelling and concentration experiments. J. Membr. Sci. 2000, 166, 1–11. [Google Scholar] [CrossRef]
  42. Pagliero, M.; Bottino, A.; Comite, A.; Costa, C. Novel hydrophobic PVDF membranes prepared by nonsolvent induced phase separation for membrane distillation. J. Membr. Sci. 2020, 596. [Google Scholar] [CrossRef]
  43. Grasso, G.; Galiano, F.; Yoo, M.J.; Mancuso, R.; Park, H.B.; Gabriele, B.; Figoli, A.; Drioli, E. Development of graphene-PVDF composite membranes for membrane distillation. J. Membr. Sci. 2020, 604. [Google Scholar] [CrossRef]
  44. Rana, D.; Rana, D.; Matsuura, T.; Yang, F.; Cong, Y.; Lan, C.Q. Triple-Layered Nanofibrous Metal–Organic Framework-Based Membranes for Desalination by Direct Contact Membrane Distillation. ACS Sustain. Chem. Eng. 2020, 8, 6601–6610. [Google Scholar] [CrossRef]
  45. Ahmed, F.E.; Lalia, B.S.; Hashaikeh, R.; Hilal, N. Enhanced performance of direct contact membrane distillation via selected electrothermal heating of membrane surface. J. Membr. Sci. 2020, 610, 118224. [Google Scholar] [CrossRef]
  46. Xu, K.; Cai, Y.; Hassankiadeh, N.T.; Cheng, Y.; Li, X.; Wang, X.; Wang, Z.; Drioli, E.; Cui, Z. ECTFE membrane fabrication via TIPS method using ATBC diluent for vacuum membrane distillation. Desalination 2019, 456, 13–22. [Google Scholar] [CrossRef]
  47. Wang, W.; Du, X.; Vahabi, H.; Zhao, S.; Yin, Y.; Kota, A.K.; Tong, T. Trade-off in membrane distillation with monolithic omniphobic membranes. Nat. Commun. 2019, 10, 3220. [Google Scholar] [CrossRef] [Green Version]
  48. Shaulsky, E.; Karanikola, V.; Straub, A.P.; Deshmukh, A.; Zucker, I.; Elimelech, M. Asymmetric membranes for membrane distillation and thermo-osmotic energy conversion. Desalination 2019, 452, 141–148. [Google Scholar] [CrossRef]
  49. Khayet, M.; García-Payo, C.; Matsuura, T. Superhydrophobic nanofibers electrospun by surface segregating fluorinated amphiphilic additive for membrane distillation. J. Membr. Sci. 2019, 588, 117215. [Google Scholar] [CrossRef]
  50. Khayet, M.; Essalhi, M.; Qtaishat, M.R.; Matsuura, T. Robust surface modified polyetherimide hollow fiber membrane for long-term desalination by membrane distillation. Desalination 2019, 466, 107–117. [Google Scholar] [CrossRef]
  51. Gustafson, R.D.; McGaughey, A.L.; Ding, W.; McVety, S.C.; Childress, A.E. Morphological changes and creep recovery behavior of expanded polytetrafluoroethylene (ePTFE) membranes used for membrane distillation. J. Membr. Sci. 2019, 584, 236–245. [Google Scholar] [CrossRef]
  52. Deka, B.J.; Lee, E.-J.; Guo, J.; Kharraz, J.; An, A.K. Electrospun Nanofiber Membranes Incorporating PDMS-Aerogel Superhydrophobic Coating with Enhanced Flux and Improved Antiwettability in Membrane Distillation. Environ. Sci. Technol. 2019, 53, 4948–4958. [Google Scholar] [CrossRef] [PubMed]
  53. Li, M.; Lu, K.J.; Wang, L.; Zhang, X.; Chung, T.-S. Janus membranes with asymmetric wettability via a layer-by-layer coating strategy for robust membrane distillation. J. Membr. Sci. 2020, 603, 118031. [Google Scholar] [CrossRef]
  54. Chew, N.G.P.; Zhang, Y.; Goh, K.; Ho, J.S.; Xu, R.; Wang, R. Hierarchically Structured Janus Membrane Surfaces for Enhanced Membrane Distillation Performance. ACS Appl. Mater. Interfaces 2019, 11, 25524–25534. [Google Scholar] [CrossRef] [PubMed]
  55. Nguyen, N.C.; Duong, H.C.; Nguyen, H.T.; Chen, S.-S.; Le, H.Q.; Ngo, H.H.; Guo, W.; Duong, C.C.; Le, N.C.; Bui, X.T. Forward osmosis–membrane distillation hybrid system for desalination using mixed trivalent draw solution. J. Membr. Sci. 2020, 603, 118029. [Google Scholar] [CrossRef]
  56. Wang, W.; Shi, Y.; Zhang, C.; Hong, S.; Shi, L.; Chang, J.; Li, R.; Jin, Y.; Ong, C.S.; Zhuo, S.; et al. Simultaneous production of fresh water and electricity via multistage solar photovoltaic membrane distillation. Nat. Commun. 2019, 10, 3012. [Google Scholar] [CrossRef] [PubMed]
  57. Tufa, R.A.; Noviello, Y.; Di Profio, G.; Macedonio, F.; Ali, A.; Drioli, E.; Fontananova, E.; Bouzek, K.; Curcio, E. Integrated membrane distillation-reverse electrodialysis system for energy-efficient seawater desalination. Appl. Energy 2019, 253, 113551. [Google Scholar] [CrossRef]
  58. Lawson, K.W.; Lloyd, D.R. Membrane distillation. J. Membr. Sci. 1997, 124, 1–25. [Google Scholar] [CrossRef]
  59. Olatunji, S.O.; Camacho, L.M. Heat and Mass Transport in Modeling Membrane Distillation Configurations: A Review. Front. Energy Res. 2018, 6, 130. [Google Scholar] [CrossRef]
  60. Hitsov, I.; Maere, T.; De Sitter, K.; Dotremont, C.; Nopens, I. Modelling approaches in membrane distillation: A critical review. Sep. Purif. Technol. 2015, 142, 48–64. [Google Scholar] [CrossRef]
  61. He, Q.; Li, P.; Geng, H.; Zhang, C.; Wang, J.; Chang, H. Modeling and optimization of air gap membrane distillation system for desalination. Desalination 2014, 354, 68–75. [Google Scholar] [CrossRef]
  62. Khayet, M. Membranes and theoretical modeling of membrane distillation: A review. Adv. Colloid Interface Sci. 2011, 164, 56–88. [Google Scholar] [CrossRef]
  63. Choudhury, M.R.; Anwar, N.; Jassby, D.; Rahaman, S. Fouling and wetting in the membrane distillation driven wastewater reclamation process—A review. Adv. Colloid Interface Sci. 2019, 269, 370–399. [Google Scholar] [CrossRef]
  64. Warsinger, D.M.; Swaminathan, J.; Guillen-Burrieza, E.; Arafat, H.A.; Lienhard, V.J.H. Scaling and fouling in membrane distillation for desalination applications: A review. Desalination 2015, 356, 294–313. [Google Scholar] [CrossRef]
  65. Tijing, L.D.; Woo, Y.C.; Choi, J.-S.; Lee, S.; Kim, S.-H.; Shon, H.K. Fouling and its control in membrane distillation—A review. J. Membr. Sci. 2015, 475, 215–244. [Google Scholar] [CrossRef]
  66. Naidu, G.; Tijing, L.; Johir, M.; Shon, H.K.; Vigneswaran, S. Hybrid membrane distillation: Resource, nutrient and energy recovery. J. Membr. Sci. 2020, 599, 117832. [Google Scholar] [CrossRef]
  67. Ghaffour, N.; Soukane, S.; Lee, J.-G.; Kim, Y.; Alpatova, A. Membrane distillation hybrids for water production and energy efficiency enhancement: A critical review. Appl. Energy 2019, 254, 113698. [Google Scholar] [CrossRef]
  68. Gopi, G.; Arthanareeswaran, G.; Ismail, A.F. Perspective of renewable desalination by using membrane distillation. Chem. Eng. Res. Des. 2019, 144, 520–537. [Google Scholar] [CrossRef]
  69. Ullah, R.; Khraisheh, M.; Esteves, R.J.; McLeskey, J.T.; AlGhouti, M.; Gad-El-Hak, M.; Tafreshi, H.V. Energy efficiency of direct contact membrane distillation. Desalination 2018, 433, 56–67. [Google Scholar] [CrossRef]
  70. Deshmukh, A.; Boo, C.; Karanikola, V.; Lin, S.; Straub, A.P.; Tong, T.; Warsinger, D.M.; Elimelech, M. Membrane distillation at the water-energy nexus: Limits, opportunities, and challenges. Energy Environ. Sci. 2018, 11, 1177–1196. [Google Scholar] [CrossRef]
  71. Zhang, Y.; Peng, Y.; Ji, S.; Li, Z.; Chen, P. Review of thermal efficiency and heat recycling in membrane distillation processes. Desalination 2015, 367, 223–239. [Google Scholar] [CrossRef]
  72. Khayet, M. Solar desalination by membrane distillation: Dispersion in energy consumption analysis and water production costs (a review). Desalination 2013, 308, 89–101. [Google Scholar] [CrossRef]
  73. Luo, A.; Lior, N. Critical review of membrane distillation performance criteria. Desalination Water Treat. 2016, 57, 20093–20140. [Google Scholar] [CrossRef]
  74. Yalcinkaya, F. A review on advanced nanofiber technology for membrane distillation. J. Eng. Fibers Fabr. 2019, 14, 1558925018824901. [Google Scholar] [CrossRef]
  75. Shaulsky, E.; Nejati, S.; Boo, C.; Perreault, F.; Osuji, C.O.; Elimelech, M. Post-fabrication modification of electrospun nanofiber mats with polymer coating for membrane distillation applications. J. Membr. Sci. 2017, 530, 158–165. [Google Scholar] [CrossRef] [Green Version]
  76. Eykens, L.; De Sitter, K.; Dotremont, C.; Pinoy, L.; Van Der Bruggen, B. How to Optimize the Membrane Properties for Membrane Distillation: A Review. Ind. Eng. Chem. Res. 2016, 55, 9333–9343. [Google Scholar] [CrossRef]
  77. Yao, M.; Tijing, L.D.; Naidu, G.; Kim, S.-H.; Matsuyama, H.; Fane, A.G.; Shon, H.K. A review of membrane wettability for the treatment of saline water deploying membrane distillation. Desalination 2020, 479, 114312. [Google Scholar] [CrossRef]
  78. Ray, S.S.S.; Lee, H.K.; Kwon, Y.-N. Review on Blueprint of Designing Anti-Wetting Polymeric Membrane Surfaces for Enhanced Membrane Distillation Performance. Polymers 2019, 12, 23. [Google Scholar] [CrossRef] [Green Version]
  79. Rezaei, M.; Warsinger, D.M.; Lienhard, J.H.; Duke, M.C.; Matsuura, T.; Samhaber, W.M. Wetting phenomena in membrane distillation: Mechanisms, reversal, and prevention. Water Res. 2018, 139, 329–352. [Google Scholar] [CrossRef]
  80. Li, L.; Sirkar, K.K. Influence of microporous membrane properties on the desalination performance in direct contact membrane distillation. J. Membr. Sci. 2016, 513, 280–293. [Google Scholar] [CrossRef]
  81. Ashoor, B.B.; Mansour, S.; Giwa, A.; Dufour, V.; Hasan, S.W. Principles and applications of direct contact membrane distillation (DCMD): A comprehensive review. Desalination 2016, 398, 222–246. [Google Scholar] [CrossRef]
  82. Abu-Zeid, M.A.E.-R.; Zhang, Y.; Dong, H.; Zhang, L.; Chen, H.-L.; Hou, L.-A. A comprehensive review of vacuum membrane distillation technique. Desalination 2015, 356, 1–14. [Google Scholar] [CrossRef]
  83. Shahu, V.; Thombre, S.B. Air gap membrane distillation: A review. J. Renew. Sustain. Energy 2019, 11, 045901. [Google Scholar] [CrossRef]
  84. Ramlow, H.; Ferreira, R.K.M.; Marangoni, C.; Machado, R.A.F. Ceramic membranes applied to membrane distillation: A comprehensive review. Int. J. Appl. Ceram. Technol. 2019, 16, 2161–2172. [Google Scholar] [CrossRef]
  85. González, D.; Amigo, J.; Suárez, F. Membrane distillation: Perspectives for sustainable and improved desalination. Renew. Sustain. Energy Rev. 2017, 80, 238–259. [Google Scholar] [CrossRef]
  86. Schofield, R.W.; Fane, A.G.; Fell, C.J.D.; Macoun, R. Factors affecting flux in membrane distillation. Desalination 1990, 77, 279–294. [Google Scholar] [CrossRef]
  87. El-Bourawi, M.; Ding, Z.; Ma, R.; Khayet, M. A framework for better understanding membrane distillation separation process. J. Membr. Sci. 2006, 285, 4–29. [Google Scholar] [CrossRef]
  88. Alkhudhiri, A.; Darwish, N.; Hilal, N. Membrane distillation: A comprehensive review. Desalination 2012, 287, 2–18. [Google Scholar] [CrossRef]
  89. Criscuoli, A. Membrane Distillation: Principles, Applications and Perspectives. J. Membr. Sci. Technol. 2017, 7, e123. [Google Scholar] [CrossRef]
  90. Bhushan, B.; Jung, Y.C. Wetting, adhesion and friction of superhydrophobic and hydrophilic leaves and fabricated micro/nanopatterned surfaces. J. Phys. Condens. Matter 2008, 20, 225010. [Google Scholar] [CrossRef] [Green Version]
  91. Yoshimitsu, Z.; Nakajima, A.; Watanabe, T.; Hashimoto, K. Effects of Surface Structure on the Hydrophobicity and Sliding Behavior of Water Droplets. Langmuir 2002, 18, 5818–5822. [Google Scholar] [CrossRef]
  92. Camacho, L.M.; Dumée, L.F.; Zhang, J.; Li, J.-D.; Duke, M.C.; Gomez, J.; Gray, S.R. Advances in Membrane Distillation for Water Desalination and Purification Applications. Water 2013, 5, 94–196. [Google Scholar] [CrossRef] [Green Version]
  93. Drioli, E.; Ali, A.; Macedonio, F. Membrane distillation: Recent developments and perspectives. Desalination 2015, 356, 56–84. [Google Scholar] [CrossRef]
  94. Franken, A.; Nolten, J.; Mulder, M.; Bargeman, D.; Smolders, C. Wetting criteria for the applicability of membrane distillation. J. Membr. Sci. 1987, 33, 315–328. [Google Scholar] [CrossRef] [Green Version]
  95. Miwa, M.; Nakajima, A.; Fujishima, A.; Hashimoto, K.; Watanabe, T. Effects of the Surface Roughness on Sliding Angles of Water Droplets on Superhydrophobic Surfaces. Langmuir 2000, 16, 5754–5760. [Google Scholar] [CrossRef]
  96. Nakajima, A.; Hashimoto, K.; Watanabe, T. Recent studies on super-hydrophobic films. In Molecular Materials and Functional Polymers; Springer: Vienna, Austria, 2001; pp. 31–41. [Google Scholar]
  97. Nishino, T.; Meguro, M.; Nakamae, K.; Matsushita, A.M.; Ueda, Y. The Lowest Surface Free Energy Based on −CF3 Alignment. Langmuir 1999, 15, 4321–4323. [Google Scholar] [CrossRef]
  98. Gostoli, C.; Sarti, G.C.; Matulli, S. Low Temperature Distillation through Hydrophobic Membranes. Sep. Sci. Technol. 1987, 22, 855–872. [Google Scholar] [CrossRef]
  99. Marmur, A. Wetting on Hydrophobic Rough Surfaces: To Be Heterogeneous or Not to Be? Langmuir 2003, 19, 8343–8348. [Google Scholar] [CrossRef]
  100. Gryta, M.; Tomaszewska, M. Heat transport in the membrane distillation process. J. Membr. Sci. 1998, 144, 211–222. [Google Scholar] [CrossRef]
  101. Lawson, K.W.; Lloyd, D.R. Membrane distillation. II. Direct contact MD. J. Membr. Sci. 1996, 120, 123–133. [Google Scholar] [CrossRef]
  102. Tomaszewska, M. Preparation and properties of flat-sheet membranes from poly (vinylidene fluoride) for membrane distillation. Desalination 1996, 104, 1–11. [Google Scholar] [CrossRef]
  103. Khayet, M.; Velazquez, A.; Mengual, J.I. Modelling mass transport through a porous partition: Effect of pore size distribution. J. Non-Equilibrium Thermodyn. 2004, 29, 279–299. [Google Scholar] [CrossRef] [Green Version]
  104. Qtaishat, M.; Matsuura, T.; Kruczek, B.; Khayet, M. Heat and mass transfer analysis in direct contact membrane distillation. Desalination 2008, 219, 272–292. [Google Scholar] [CrossRef]
  105. Khayet, M.; Imdakm, A.; Matsuura, T. Monte Carlo simulation and experimental heat and mass transfer in direct contact membrane distillation. Int. J. Heat Mass Transf. 2010, 53, 1249–1259. [Google Scholar] [CrossRef]
  106. Zhang, J.; Gray, S.R.; Li, J.-D. Modelling heat and mass transfers in DCMD using compressible membranes. J. Membr. Sci. 2012, 387, 7–16. [Google Scholar] [CrossRef] [Green Version]
  107. Schofield, R.; Fane, A.; Fell, C. Heat and mass transfer in membrane distillation. J. Membr. Sci. 1987, 33, 299–313. [Google Scholar] [CrossRef]
  108. Burgoyne, A.; Vahdati, M.M. Direct Contact Membrane Distillation. Sep. Sci. Technol. 2000, 35, 1257–1284. [Google Scholar] [CrossRef]
  109. Khayet, M.; Godino, M.P.; Mengual, J.I. Modelling Transport Mechanism through a Porous Partition. J. Non-Equilibrium Thermodyn. 2001, 26, 1–14. [Google Scholar] [CrossRef]
  110. Ding, Z.; Ma, R.; Fane, A.G. A new model for mass transfer in direct contact membrane distillation. Desalination 2003, 151, 217–227. [Google Scholar] [CrossRef]
  111. Martínez, L.; Rodríguez-Maroto, J.M. Characterization of membrane distillation modules and analysis of mass flux enhancement by channel spacers. J. Membr. Sci. 2006, 274, 123–137. [Google Scholar] [CrossRef]
  112. Martínez, L.; Rodríguez-Maroto, J.M. On transport resistances in direct contact membrane distillation. J. Membr. Sci. 2007, 295, 28–39. [Google Scholar] [CrossRef]
  113. Lu, J.; Yu, Y.; Zhou, J.; Song, L.; Hu, X.; Larbot, A. FAS grafted superhydrophobic ceramic membrane. Appl. Surf. Sci. 2009, 255, 9092–9099. [Google Scholar] [CrossRef]
  114. Li, L.; Sirkar, K.K. Studies in vacuum membrane distillation with flat membranes. J. Membr. Sci. 2017, 523, 225–234. [Google Scholar] [CrossRef]
  115. Laqbaqbi, M.; García-Payo, M.C.; Khayet, M.; El Kharraz, J.; Chaouch, M. Application of direct contact membrane distillation for textile wastewater treatment and fouling study. Sep. Purif. Technol. 2019, 209, 815–825. [Google Scholar] [CrossRef]
  116. Kebria, M.R.S.; Rahimpour, A.; Bakeri, G.; Abedini, R. Experimental and theoretical investigation of thin ZIF-8/chitosan coated layer on air gap membrane distillation performance of PVDF membrane. Desalination 2019, 450, 21–32. [Google Scholar] [CrossRef]
  117. Ali, A.; Criscuoli, A.; Macedonio, F.; Drioli, E. A comparative analysis of flat sheet and capillary membranes for membrane distillation applications. Desalination 2019, 456, 1–12. [Google Scholar] [CrossRef]
  118. Zhao, D.; Zuo, J.; Lu, K.-J.; Chung, T.-S. Fluorographite modified PVDF membranes for seawater desalination via direct contact membrane distillation. Desalination 2017, 413, 119–126. [Google Scholar] [CrossRef]
  119. Luo, A.; Lior, N. Study of advancement to higher temperature membrane distillation. Desalination 2017, 419, 88–100. [Google Scholar] [CrossRef]
  120. Fan, Y.; Chen, S.; Zhao, H.; Liu, Y. Distillation membrane constructed by TiO2 nanofiber followed by fluorination for excellent water desalination performance. Desalination 2017, 405, 51–58. [Google Scholar] [CrossRef]
  121. Eykens, L.; Hitsov, I.; De Sitter, K.; Dotremont, C.; Pinoy, L.; Van der Bruggen, B. Direct contact and air gap membrane distillation: Differences and similarities between lab and pilot scale. Desalination 2017, 422, 91–100. [Google Scholar] [CrossRef]
  122. Xu, J.; Singh, Y.B.; Amy, G.L.; Ghaffour, N. Effect of operating parameters and membrane characteristics on air gap membrane distillation performance for the treatment of highly saline water. J. Membr. Sci. 2016, 512, 73–82. [Google Scholar] [CrossRef] [Green Version]
  123. Wang, Z.; Jin, J.; Hou, D.; Lin, S. Tailoring surface charge and wetting property for robust oil-fouling mitigation in membrane distillation. J. Membr. Sci. 2016, 516, 113–122. [Google Scholar] [CrossRef]
  124. Razmjou, A.; Arifin, E.; Dong, G.; Mansouri, J.; Chen, V. Superhydrophobic modification of TiO2 nanocomposite PVDF membranes for applications in membrane distillation. J. Membr. Sci. 2012, 415–416, 850–863. [Google Scholar] [CrossRef]
  125. Dong, Z.-Q.; Ma, X.-h.; Xu, Z.-L.; You, W.-T.; Li, F.-b. Superhydrophobic PVDF–PTFE electrospun nanofibrous membranes for desalination by vacuum membrane distillation. Desalination 2014, 347, 175–183. [Google Scholar] [CrossRef]
  126. Meng, S.; Ye, Y.; Mansouri, J.; Chen, V. Fouling and crystallisation behaviour of superhydrophobic nano-composite PVDF membranes in direct contact membrane distillation. J. Membr. Sci. 2014, 463, 102–112. [Google Scholar] [CrossRef]
  127. Fan, X.; Liu, Y.; Quan, X.; Zhao, H.; Chen, S.; Yi, G.; Du, L. High desalination permeability, wetting and fouling resistance on superhydrophobic carbon nanotube hollow fiber membrane under self-powered electrochemical assistance. J. Membr. Sci. 2016, 514, 501–509. [Google Scholar] [CrossRef]
  128. Tijing, L.D.; Woo, Y.C.; Shim, W.-G.; He, T.; Choi, J.-S.; Kim, S.-H.; Shon, H.K. Superhydrophobic nanofiber membrane containing carbon nanotubes for high-performance direct contact membrane distillation. J. Membr. Sci. 2016, 502, 158–170. [Google Scholar] [CrossRef]
  129. An, A.K.; Guo, J.; Lee, E.-J.; Jeong, S.; Zhao, Y.; Wang, Z.; Leiknes, T. PDMS/PVDF hybrid electrospun membrane with superhydrophobic property and drop impact dynamics for dyeing wastewater treatment using membrane distillation. J. Membr. Sci. 2017, 525, 57–67. [Google Scholar] [CrossRef] [Green Version]
  130. Attia, H.; Alexander, S.; Wright, C.J.; Hilal, N. Superhydrophobic electrospun membrane for heavy metals removal by air gap membrane distillation (AGMD). Desalination 2017, 420, 318–329. [Google Scholar] [CrossRef] [Green Version]
  131. Li, X.; García-Payo, M.C.; Khayet, M.; Wang, M.; Wang, X. Superhydrophobic polysulfone/polydimethylsiloxane electrospun nanofibrous membranes for water desalination by direct contact membrane distillation. J. Membr. Sci. 2017, 542, 308–319. [Google Scholar] [CrossRef]
  132. Yang, Y.; Liu, Q.; Wang, H.; Ding, F.; Jin, G.; Li, C.; Meng, H. Superhydrophobic modification of ceramic membranes for vacuum membrane distillation. Chin. J. Chem. Eng. 2017, 25, 1395–1401. [Google Scholar] [CrossRef]
  133. Bhushan, B.; Jung, Y.C.; Koch, K. Micro-, nano- and hierarchical structures for superhydrophobicity, self-cleaning and low adhesion. Philos. Trans. R. Soc. A Math. Phys. Eng. Sci. 2009, 367, 1631–1672. [Google Scholar] [CrossRef]
  134. Banat, F.A.; Simandl, J. Theoretical and experimental study in membrane distillation. Desalination 1994, 95, 39–52. [Google Scholar] [CrossRef]
  135. Gryta, M. Long-term performance of membrane distillation process. J. Membr. Sci. 2005, 265, 153–159. [Google Scholar] [CrossRef]
  136. Song, L.; Ma, Z.; Liao, X.; Kosaraju, P.B.; Irish, J.R.; Sirkar, K.K. Pilot plant studies of novel membranes and devices for direct contact membrane distillation-based desalination. J. Membr. Sci. 2008, 323, 257–270. [Google Scholar] [CrossRef]
  137. Teoh, M.M.; Chung, T.-S. Membrane distillation with hydrophobic macrovoid-free PVDF–PTFE hollow fiber membranes. Sep. Purif. Technol. 2009, 66, 229–236. [Google Scholar] [CrossRef]
  138. Essalhi, M.; Khayet, M. Self-sustained webs of polyvinylidene fluoride electrospun nanofibers at different electrospinning times: 1. Desalination by direct contact membrane distillation. J. Membr. Sci. 2013, 433, 167–179. [Google Scholar] [CrossRef]
  139. Ke, H.; Feldman, E.; Guzman, P.; Cole, J.; Wei, Q.; Chu, B.; Alkhudhiri, A.; Alrasheed, R.; Hsiao, B.S. Electrospun polystyrene nanofibrous membranes for direct contact membrane distillation. J. Membr. Sci. 2016, 515, 86–97. [Google Scholar] [CrossRef]
  140. Chen, L.-H.; Chen, Y.-R.; Huang, A.; Chen, C.-H.; Su, D.-Y.; Hsu, C.-C.; Tsai, F.-Y.; Tung, K.-L. Nanostructure depositions on alumina hollow fiber membranes for enhanced wetting resistance during membrane distillation. J. Membr. Sci. 2018, 564, 227–236. [Google Scholar] [CrossRef]
  141. Woo, Y.C.; Tijing, L.D.; Park, M.J.; Yao, M.; Choi, J.-S.; Lee, S.; Kim, S.-H.; An, K.-J.; Shon, H.K. Electrospun dual-layer nonwoven membrane for desalination by air gap membrane distillation. Desalination 2017, 403, 187–198. [Google Scholar] [CrossRef]
  142. Zhang, W.; Li, Y.; Liu, J.; Li, B.; Wang, S. Fabrication of hierarchical poly (vinylidene fluoride) micro/nano-composite membrane with anti-fouling property for membrane distillation. J. Membr. Sci. 2017, 535, 258–267. [Google Scholar] [CrossRef]
  143. Chen, X.; Gao, X.; Fu, K.; Qiu, M.; Xiong, F.; Ding, D.; Cui, Z.; Wang, Z.; Fan, Y.; Drioli, E. Tubular hydrophobic ceramic membrane with asymmetric structure for water desalination via vacuum membrane distillation process. Desalination 2018, 443, 212–220. [Google Scholar] [CrossRef]
  144. Zhang, J.; Dow, N.; Duke, M.C.; Ostarcevic, E.; Li, J.-D.; Gray, S.R. Identification of material and physical features of membrane distillation membranes for high performance desalination. J. Membr. Sci. 2010, 349, 295–303. [Google Scholar] [CrossRef] [Green Version]
  145. Huang, J.; Zhang, J.; Hao, X.; Guo, Y. Study of a new novel process for preparing and co-stretching PTFE membrane and its properties. Eur. Polym. J. 2004, 40, 667–671. [Google Scholar] [CrossRef]
  146. Jiao, B.; Cassano, A.; Drioli, E. Recent advances on membrane processes for the concentration of fruit juices: A review. J. Food Eng. 2004, 63, 303–324. [Google Scholar] [CrossRef]
  147. Calabro, V.; Pantano, G.; Kang, M.; Molinari, R.; Drioli, E. Experimental study on integrated membrane processes in the treatment of solutions simulating textile effluents. Energy and exergy analysis. Desalination 1990, 78, 257–277. [Google Scholar] [CrossRef]
  148. He, K.; Hwang, H.J.; Moon, I.S. Air gap membrane distillation on the different types of membrane. Korean J. Chem. Eng. 2011, 28, 770–777. [Google Scholar] [CrossRef]
  149. Gryta, M.; Tomaszewska, M.; Karakulski, K. Wastewater treatment by membrane distillation. Desalination 2006, 198, 67–73. [Google Scholar] [CrossRef]
  150. Phattaranawik, J. Effect of pore size distribution and air flux on mass transport in direct contact membrane distillation. J. Membr. Sci. 2003, 215, 75–85. [Google Scholar] [CrossRef]
  151. Abu Al-Rub, F.A.; Banat, F.; Beni-Melhim, K. Parametric Sensitivity Analysis of Direct Contact Membrane Distillation. Sep. Sci. Technol. 2002, 37, 3245–3271. [Google Scholar] [CrossRef]
  152. Adnan, S.; Hoang, M.; Wang, H.; Xie, Z. Commercial PTFE membranes for membrane distillation application: Effect of microstructure and support material. Desalination 2012, 284, 297–308. [Google Scholar] [CrossRef]
  153. Schneider, K.; Hölz, W.; Wollbeck, R. Membranes and modules for transmembrane distillation. J. Membr. Sci. 1988, 39, 25–42. [Google Scholar] [CrossRef]
  154. Eykens, L.; De Sitter, K.; Dotremont, C.; Pinoy, L.; Van der Bruggen, B. Characterization and performance evaluation of commercially available hydrophobic membranes for direct contact membrane distillation. Desalination 2016, 392, 63–73. [Google Scholar] [CrossRef]
  155. Martínez, L.; Rodríguez-Maroto, J.M. Membrane thickness reduction effects on direct contact membrane distillation performance. J. Membr. Sci. 2008, 312, 143–156. [Google Scholar] [CrossRef]
  156. Eykens, L.; Hitsov, I.; De Sitter, K.; Dotremont, C.; Pinoy, L.; Nopens, I.; Van der Bruggen, B. Influence of membrane thickness and process conditions on direct contact membrane distillation at different salinities. J. Membr. Sci. 2016, 498, 353–364. [Google Scholar] [CrossRef]
  157. Hendren, Z.D.; Brant, J.; Wiesner, M.R. Surface modification of nanostructured ceramic membranes for direct contact membrane distillation. J. Membr. Sci. 2009, 331, 1–10. [Google Scholar] [CrossRef]
  158. Wang, P.; Chung, T.-S. Recent advances in membrane distillation processes: Membrane development, configuration design and application exploring. J. Membr. Sci. 2015, 474, 39–56. [Google Scholar] [CrossRef]
  159. Elias-Kohav, T.; Moshe, S.; Avnir, D. Steady-state diffusion and reactions in catalytic fractal porous media. Chem. Eng. Sci. 1991, 46, 2787–2798. [Google Scholar] [CrossRef]
  160. Iversen, S.B.; Bhatia, V.K.; Dam-Johansen, K.; Jonsson, G. Characterization of microporous membranes for use in membrane contactors. J. Membr. Sci. 1997, 130, 205–217. [Google Scholar] [CrossRef]
  161. Calabrò, V.; Jiao, B.L.; Drioli, E. Theoretical and Experimental Study on Membrane Distillation in the Concentration of Orange Juice. Ind. Eng. Chem. Res. 1994, 33, 1803–1808. [Google Scholar] [CrossRef]
  162. Lawson, K.W.; Hall, M.S.; Lloyd, D.R. Compaction of microporous membranes used in membrane distillation. I. Effect on gas permeability. J. Membr. Sci. 1995, 101, 99–108. [Google Scholar] [CrossRef]
  163. Alobaidani, S.; Curcio, E.; Macedonio, F.; Diprofio, G.; Alhinai, H.; Drioli, E. Potential of membrane distillation in seawater desalination: Thermal efficiency, sensitivity study and cost estimation. J. Membr. Sci. 2008, 323, 85–98. [Google Scholar] [CrossRef]
  164. Curcio, E.; Drioli, E. Membrane Distillation and Related Operations—A Review. Sep. Purif. Rev. 2005, 34, 35–86. [Google Scholar] [CrossRef]
  165. Brandrup, J.; Immergut, E.H.; Grulke, E.A. Polymer Handbook; Wiley: New York, NY, USA, 1989. [Google Scholar]
  166. Kreveleh, D.W.V. Properties of Polymers; Elsevier: Amsterdam, The Netherlands, 1990. [Google Scholar]
  167. Harper, C.A. Handbook of Plastics, Elastomers and Composites; McGraw-Hill: New York, NY, USA, 1996. [Google Scholar]
  168. Yaws, C.L. Handbook of Transport Property Data: Viscosity, Thermal Conductivity, and Diffusion Coefficients of Liquids and Gases; Gulf Publishing: Houston, TX, USA, 1995. [Google Scholar]
  169. Gazagnes, L.; Cerneaux, S.; Persin, M.; Prouzet, E.; Larbot, A. Desalination of sodium chloride solutions and seawater with hydrophobic ceramic membranes. Desalination 2007, 217, 260–266. [Google Scholar] [CrossRef]
  170. Wang, J.-W.; Li, L.; Zhang, J.-W.; Xu, X.; Chen, C.-S. β-Sialon ceramic hollow fiber membranes with high strength and low thermal conductivity for membrane distillation. J. Eur. Ceram. Soc. 2016, 36, 59–65. [Google Scholar] [CrossRef]
  171. Martínez, L. Comparison of membrane distillation performance using different feeds. Desalination 2004, 168, 359–365. [Google Scholar] [CrossRef]
  172. Yun, Y.; Ma, R.; Zhang, W.; Fane, A.G.; Li, J. Direct contact membrane distillation mechanism for high concentration NaCl solutions. Desalination 2006, 188, 251–262. [Google Scholar] [CrossRef]
  173. Sharqawy, M.H.; Lienhard, J.H.; Zubair, S.M. Thermophysical properties of seawater: A review of existing correlations and data. Desalin. Water Treat. 2012, 16, 354–380. [Google Scholar] [CrossRef]
  174. Alkhudhiri, A.; Darwish, N.; Hilal, N. Produced water treatment: Application of Air Gap Membrane Distillation. Desalination 2013, 309, 46–51. [Google Scholar] [CrossRef]
  175. Li, J.; Guan, Y.; Cheng, F.; Liu, Y. Treatment of high salinity brines by direct contact membrane distillation: Effect of membrane characteristics and salinity. Chemosphere 2015, 140, 143–149. [Google Scholar] [CrossRef]
  176. Guan, Y.; Li, J.; Cheng, F.; Zhao, J.; Wang, X. Influence of salt concentration on DCMD performance for treatment of highly concentrated NaCl, KCl, MgCl2 and MgSO4 solutions. Desalination 2015, 355, 110–117. [Google Scholar] [CrossRef]
  177. David, F.; Vokhmin, V.; Ionova, G. Water characteristics depend on the ionic environment. Thermodynamics and modelisation of the aquo ions. J. Mol. Liq. 2001, 90, 45–62. [Google Scholar] [CrossRef]
  178. Tansel, B. Significance of thermodynamic and physical characteristics on permeation of ions during membrane separation: Hydrated radius, hydration free energy and viscous effects. Sep. Purif. Technol. 2012, 86, 119–126. [Google Scholar] [CrossRef]
  179. Alkhudhiri, A.; Darwish, N.; Hilal, N. Treatment of saline solutions using Air Gap Membrane Distillation: Experimental study. Desalination 2013, 323, 2–7. [Google Scholar] [CrossRef]
  180. Yu, X.; Yang, H.; Lei, H.; Shapiro, A. Experimental evaluation on concentrating cooling tower blowdown water by direct contact membrane distillation. Desalination 2013, 323, 134–141. [Google Scholar] [CrossRef]
  181. Brant, J.A.; Childress, A.E. Colloidal adhesion to hydrophilic membrane surfaces. J. Membr. Sci. 2004, 241, 235–248. [Google Scholar] [CrossRef]
  182. Subramani, A.; Hoek, E.M.V. Direct observation of initial microbial deposition onto reverse osmosis and nanofiltration membranes. J. Membr. Sci. 2008, 319, 111–125. [Google Scholar] [CrossRef]
  183. Elimelech, M.; Gregory, J.; Jia, X. Particle Deposition and Aggregation Measurement, Modelling and Simulation; Elsevier, Butterworth-Heinemann: Oxford, UK, 1998. [Google Scholar] [CrossRef]
  184. Brant, J.A.; Childress, A.E. Assessing short-range membrane–colloid interactions using surface energetics. J. Membr. Sci. 2002, 203, 257–273. [Google Scholar] [CrossRef]
  185. Domínguez, A.; Fernández, A.; González, N.; Iglesias, E.; Montenegro, L. Determination of critical micelle concentration of some surfactants by three techniques. J. Chem. Educ. 1997, 74, 1227–1231. [Google Scholar] [CrossRef]
  186. Chew, N.G.P.; Zhao, S.; Loh, C.H.; Permogorov, N.; Wang, R. Surfactant effects on water recovery from produced water via direct-contact membrane distillation. J. Membr. Sci. 2017, 528, 126–134. [Google Scholar] [CrossRef]
  187. Hansen, C.; Sorensen, C.; Velarde, M.; Gates, B.; Yin, Y.; Sun, Y. Handbook of Surface and Colloid Chemistry; Birdi, K., Ed.; CRC Press: Boca Raton, FL, USA, 2003. [Google Scholar]
  188. Kronberg, B.; Holmberg, K.; Lindman, B. Surface Chemistry of Surfactants and Polymers; Wiley: Hoboken, NJ, USA, 2014. [Google Scholar]
  189. Walstra, P. Physical Chemistry of Foods; CRC Press: Boca Raton, FL, USA, 2001. [Google Scholar]
  190. Boo, C.; Lee, J.; Elimelech, M. Omniphobic Polyvinylidene Fluoride (PVDF) Membrane for Desalination of Shale Gas Produced Water by Membrane Distillation. Environ. Sci. Technol. 2016, 50, 12275–12282. [Google Scholar] [CrossRef]
  191. Lu, J.R.; Marrocco, A.; Su, T.J.; Thomas, R.K.; Penfold, J. Adsorption of Dodecyl Sulfate Surfactants with Monovalent Metal Counterions at the Air-Water Interface Studied by Neutron Reflection and Surface Tension. J. Colloid Interface Sci. 1993, 158, 303–316. [Google Scholar] [CrossRef]
  192. Schroën, C.G.P.H.; Stuart, C.; Padt, A.; Riet, K. Minimum breakthrough pressure as a measure for wettability changes caused by protein adsorption at hydrophobic membranes. Bioseparation 1994, 4, 151–163. [Google Scholar]
  193. Cho, J.; Amy, G.; Pellegrino, J.; Yoon, Y. Characterization of clean and natural organic matter (NOM) fouled NF and UF membranes, and foulants characterization. Desalination 1998, 118, 101–108. [Google Scholar] [CrossRef]
  194. Schäfer, A.I.; Fane, A.G.; Waite, T.D. Nanofiltration of natural organic matter: Removal, fouling and the influence of multivalent ions. Desalination 1998, 118, 109–122. [Google Scholar] [CrossRef] [Green Version]
  195. Gryta, M.; Tomaszewska, M.; Grzechulska, J.; Morawski, A.W. Membrane distillation of NaCl solution containing natural organic matter. J. Membr. Sci. 2001, 181, 279–287. [Google Scholar] [CrossRef]
  196. Khayet, M. Direct contact membrane distillation of humic acid solutions. J. Membr. Sci. 2004, 240, 123–128. [Google Scholar] [CrossRef]
  197. Hong, S.; Elimelech, M. Chemical and physical aspects of natural organic matter (NOM) fouling of nanofiltration membranes. J. Membr. Sci. 1997, 132, 159–181. [Google Scholar] [CrossRef]
  198. Schäfer, A.I.; Schwicker, U.; Fischer, M.M.; Fane, A.G.; Waite, T.D. Microfiltration of colloids and natural organic matter. J. Membr. Sci. 2000, 171, 151–172. [Google Scholar] [CrossRef] [Green Version]
  199. Jucker, C.; Clark, M.M. Adsorption of aquatic humic substances on hydrophobic ultrafiltration membranes. J. Membr. Sci. 1994, 97, 37–52. [Google Scholar] [CrossRef]
  200. Gostoli, C.; Sarti, G.C. Separation of liquid mixtures by membrane distillation. J. Membr. Sci. 1989, 41, 211–224. [Google Scholar] [CrossRef]
  201. Taylor, R.; Webb, D.R. Film models for multicomponent mass transfer; computational methods: The exact solution of the maxwell-stefan equations. Comput. Chem. Eng. 1981, 5, 61–73. [Google Scholar] [CrossRef]
  202. Banat, F.A. Membrane Distillation For Desalination And RemovalOf Volatile Organic Compounds From Water. Ph.D. Thesis, Mcgill University, Montreal, QC, Canada, 1994. [Google Scholar]
  203. Kujawski, W.; Kujawa, J.; Wierzbowska, E.; Cerneaux, S.; Bryjak, M.; Kujawski, J. Influence of hydrophobization conditions and ceramic membranes pore size on their properties in vacuum membrane distillation of water–organic solvent mixtures. J. Membr. Sci. 2016, 499, 442–451. [Google Scholar] [CrossRef]
  204. Wijekoon, K.C.; Hai, F.I.; Kang, J.; Price, W.E.; Cath, T.Y.; Nghiem, L.D. Rejection and fate of trace organic compounds (TrOCs) during membrane distillation. J. Membr. Sci. 2014, 453, 636–642. [Google Scholar] [CrossRef] [Green Version]
  205. Zuo, G.; Wang, R. Novel membrane surface modification to enhance anti-oil fouling property for membrane distillation application. J. Membr. Sci. 2013, 447, 26–35. [Google Scholar] [CrossRef]
  206. Alklaibi, A.M.; Lior, N. Membrane-distillation desalination: Status and potential. Desalination 2005, 171, 111–131. [Google Scholar] [CrossRef]
  207. Kimura, S.; Nakao, S.I.; Shimatani, S.I. Transport phenomena in membrane distillation. J. Membr. Sci. 1987, 33, 285–298. [Google Scholar] [CrossRef]
  208. Srisurichan, S.; Jiraratananon, R.; Fane, A. Mass transfer mechanisms and transport resistances in direct contact membrane distillation process. J. Membr. Sci. 2006, 277, 186–194. [Google Scholar] [CrossRef]
  209. Manawi, Y.M.; Khraisheh, M.; Fard, A.K.; Benyahia, F.; Adham, S. Effect of operational parameters on distillate flux in direct contact membrane distillation (DCMD): Comparison between experimental and model predicted performance. Desalination 2014, 336, 110–120. [Google Scholar] [CrossRef]
  210. Long, R.; Lai, X.; Liu, Z.; Liu, W. Direct contact membrane distillation system for waste heat recovery: Modelling and multi-objective optimization. Energy 2018, 148, 1060–1068. [Google Scholar] [CrossRef]
  211. Zhang, J.; Gray, S.; Li, J.-D. Predicting the influence of operating conditions on DCMD flux and thermal efficiency for incompressible and compressible membrane systems. Desalination 2013, 323, 142–149. [Google Scholar] [CrossRef] [Green Version]
  212. Geng, H.; Lin, L.; Li, P.; Zhang, C.; Chang, H. Study on the heat and mass transfer in AGMD module with latent heat recovery. Desalination Water Treat. 2015, 57, 1–9. [Google Scholar] [CrossRef]
  213. Khalifa, A.; Ahmad, H.; Antar, M.; Laoui, T.; Khayet, M. Experimental and theoretical investigations on water desalination using direct contact membrane distillation. Desalination 2017, 404, 22–34. [Google Scholar] [CrossRef]
  214. Kim, A.S. A two-interface transport model with pore-size distribution for predicting the performance of direct contact membrane distillation (DCMD). J. Membr. Sci. 2013, 428, 410–424. [Google Scholar] [CrossRef]
  215. Nayar, K.G.; Panchanathan, D.; McKinley, G.H.; Lienhard, J.H. Surface Tension of Seawater. J. Phys. Chem. Ref. Data 2014, 43, 043103. [Google Scholar] [CrossRef] [Green Version]
  216. Holman, J.P.J.P. Heat Transfer, 10th ed.; McGraw Hill Higher Education: Boston, PA, USA, 2010. [Google Scholar]
  217. He, F.; Gilron, J.; Lee, H.; Song, L.; Sirkar, K.K. Potential for scaling by sparingly soluble salts in crossflow DCMD. J. Membr. Sci. 2008, 311, 68–80. [Google Scholar] [CrossRef]
  218. He, F.; Sirkar, K.K.; Gilron, J. Studies on scaling of membranes in desalination by direct contact membrane distillation: CaCO3 and mixed CaCO3/CaSO4 systems. Chem. Eng. Sci. 2009, 64, 1844–1859. [Google Scholar] [CrossRef]
  219. Singh, D.; Sirkar, K.K. Desalination by air gap membrane distillation using a two hollow-fiber-set membrane module. J. Membr. Sci. 2012, 421, 172–179. [Google Scholar] [CrossRef]
  220. Martínez-Díez, L.; Vázquez-González, M.I.; Florido-Díaz, F.J. Study of membrane distillation using channel spacers. J. Membr. Sci. 1998, 144, 45–56. [Google Scholar] [CrossRef]
  221. Phattaranawik, J.; Jiraratananon, R.; Fane, A.G. Effects of net-type spacers on heat and mass transfer in direct contact membrane distillation and comparison with ultrafiltration studies. J. Membr. Sci. 2003, 217, 193–206. [Google Scholar] [CrossRef]
  222. Phattaranawik, J.; Jiraratananon, R.; Fane, A.G.; Halim, C. Mass flux enhancement using spacer filled channels in direct contact membrane distillation. J. Membr. Sci. 2001, 187, 193–201. [Google Scholar] [CrossRef]
  223. Manawi, Y.M.; Khraisheh, M.A.; Fard, A.K.; Benyahia, F.; Adham, S. A predictive model for the assessment of the temperature polarization effect in direct contact membrane distillation desalination of high salinity feed. Desalination 2014, 341, 38–49. [Google Scholar] [CrossRef]
  224. Banat, F.A.; Abu Al-Rub, F.; Jumah, R.; Shannag, M. On the effect of inert gases in breaking the formic acid–water azeotrope by gas-gap membrane distillation. Chem. Eng. J. 1999, 73, 37–42. [Google Scholar] [CrossRef]
  225. Andrjesdóttir, Ó.; Ong, C.L.; Nabavi, M.; Paredes, S.; Khalil, A.S.G.; Michel, B.; Poulikakos, D. An experimentally optimized model for heat and mass transfer in direct contact membrane distillation. Int. J. Heat Mass Transf. 2013, 66, 855–867. [Google Scholar] [CrossRef]
  226. Schneider, K.; van Gassel, T.J. Membran destillation. Chem. Ing. Tech. 1984, 56, 514–521. [Google Scholar] [CrossRef]
  227. Schofield, R.W.; Fane, A.G.; Fell, C.J.D. Gas and vapour transport through microporous membranes. II. Membrane distillation. J. Membr. Sci. 1990, 53, 173–185. [Google Scholar] [CrossRef]
  228. McGaughey, A.L.; Gustafson, R.D.; Childress, A.E. Effect of long-term operation on membrane surface characteristics and performance in membrane distillation. J. Membr. Sci. 2017, 543, 143–150. [Google Scholar] [CrossRef]
  229. Guillen-Burrieza, E.; Ruiz-Aguirre, A.; Zaragoza, G.; Arafat, H.A. Membrane fouling and cleaning in long term plant-scale membrane distillation operations. J. Membr. Sci. 2014, 468, 360–372. [Google Scholar] [CrossRef]
  230. Duong, H.C.; Gray, S.; Duke, M.; Cath, T.Y.; Nghiem, L.D. Scaling control during membrane distillation of coal seam gas reverse osmosis brine. J. Membr. Sci. 2015, 493, 673–682. [Google Scholar] [CrossRef] [Green Version]
Figure 1. Number of publications on MD research papers and review papers from 2010 to August 2020 (obtained from Google Scholar).
Water 12 02841 g001
Figure 2. Schematic diagram of four typical MD configurations: (a) DCMD, (b) AGMD, (c) VMD, and (d) SGMD.
Water 12 02841 g002
Figure 3. Schematic diagram of heat transfer and mass transfer in DCMD.
Water 12 02841 g003
Figure 4. Summary of LEP over mean pore sizes (data obtained from references [43,45,48,52,115,116,117,118,119,120,121,122,123]).
Water 12 02841 g004
Figure 5. General mechanisms of feed solution compositions affecting permeate flux and salt rejection in MD.
Water 12 02841 g005
Figure 6. A diagram showing the interplay of factors affecting water flux and salt rejection in MD.
Water 12 02841 g006
Table 1. Summary of extensively studied hydrophobic membranes in MD.
MembranesHydrophobic Modification MethodsPore Size
(µm)
CA
(°)
LEP
(kPa)
MD TypesSR
(%)
Ref.
PTFE-PVDF hollow fibers/0.116–0.308103 ± 4/DCMD~99.8[137]
PVDF nanofibers/1–1.3137.4–141.160DCMD99.8[138]
Polystyrene nanofibers/0.19114130DCMD99.99[139]
Alumina hollow fibershydrophobic modification using 1H, 1H, 2H, 2H-Perfluorodecyltriethoxysilane after ZnO deposition on alumina substrates0.179138.1/DCMD>99.9[140]
Dual-layer PVDF-co-hexafluoropropylene-nylon-6 nonwoven nanofibers/0.18126.3185AGMD>99[141]
Fluorographite modified PVDF hollow fibers/0.476 ± 0.134121≥130DCMD99.99[118]
Hierarchical PVDF micro/nano-composite flat sheet membranesSiO2 nanoparticles coating followed by fluoroalkylsilane grafting0.20 ± 0.01161.5 ± 1.0/DCMD>99.99[142]
Asymmetric flat sheet ultrafiltration mixed cellulose ester membranesVapor deposition treatment using hepta-decafluoro-1,1,2,2-tetrahydrodecyltrichlorosilane0.05120.9–123.4~2410DCMD>99.9[48]
0.025116.3–126.5>2760DCMD
Hydrophobic tubular asymmetric Al2O3 membraneDip-coating using Hexadecyltrimethoxysilane dissolved in ethanol0.15>150/VMD~99.9[143]

