Article

Developing Pseudo Continuous Pedotransfer Functions for International Soils Measured with the Evaporation Method and the HYPROP System: I. The Soil Water Retention Curve

1
Environmental Sciences Department, University of California Riverside, Riverside, CA 92521, USA
2
Department of Soil Science and Plant Nutrition, Faculty of Agriculture, Ankara University, Ankara 06110, Turkey
3
Institute of Geoecology, Technical University of Braunschweig, Langer Kamp 19c, 38106 Braunschweig, Germany
*
Author to whom correspondence should be addressed.
Water 2020, 12(12), 3425; https://doi.org/10.3390/w12123425
Submission received: 24 October 2020 / Revised: 2 December 2020 / Accepted: 2 December 2020 / Published: 6 December 2020
(This article belongs to the Special Issue Soft Computing for Water and Aquatic Resource Management)

Abstract

:
Direct measurements of soil hydraulic properties are time-consuming, challenging, and often expensive. Therefore, their indirect estimation via pedotransfer functions (PTFs) based on easily collected properties like soil texture, bulk density, and organic matter content is desirable. This study was carried out to assess the accuracy of the pseudo continuous neural network PTF (PCNN-PTF) approach for estimating the soil water retention curve of 153 international soils (a total of 12,654 measured water retention pairs) measured via the evaporation method. In addition, an independent data set from Turkey (79 soil samples with 7729 measured data pairs) was used to evaluate the reliability of the PCNN-PTF. The best PCNN-PTF showed high accuracy (root mean square error (RMSE) = 0.043 cm3 cm−3) and reliability (RMSE = 0.061 cm3 cm−3). When Turkish soil samples were incorporated into the training data set, the performance of the PCNN-PTF was enhanced by 33%. Therefore, to further improve the performance of the PCNN-PTF for new regions, we recommend the incorporation of local soils, when available, into the international data sets and developing new sets of PCNN-PTFs.

1. Introduction

Pedotransfer functions (PTFs) are statistical tools used in soil science to estimate soil hydraulic properties, mainly the soil water retention curve (SWRC), based on the easily collected basic soil properties, available from most regional and national databases [1]. The field-scale applications of the water flow and solute transport models, and calculations of soil available water content, a widely used parameter in agronomic models, is greatly facilitated by the development of PTFs. The SWRC provides critical information about the soil moisture dynamics (“movement”, “flow” and “transport”) in unsaturated soils and has a wide range of applications including estimation of field capacity and soil available water [2], hydraulic conductivity [3], horizontal and vertical infiltration [4], and modeling-related problems in porous media [5,6].
Point PTFs [7,8,9,10] estimate soil moisture at specific points of the SWRC, such as field capacity or wilting point. Parametric PTFs [11,12,13,14] estimate the parameters of a soil hydraulic function that describes the water retention across a wide range of pressure heads. Parametric PTFs are more prevalent because of their continuous representation of SWRC and their ability to provide soil hydraulic parameter estimates for use in hydrological models. Developing parametric PTFs involves fitting a soil hydraulic model to individual water-retention points and subsequently estimating the parameters of that model using basic soil properties. The widely used parametric PTFs such as Rosetta [15,16] and Neuro-m [17] use artificial neural networks (NNs) to estimate the parameters of the van Genuchten water retention model [3], which are then used to estimate the entire SWRC.
The pseudo-continuous NN PTF (PCNN-PTF) [8] was introduced as an alternative approach for continuous estimation of the SWRC at any desired water retention. PCNN-PTF utilizes statistical data mining techniques to estimate the shape of the SWRC based on actual measured data points, unlike parametric PTFs, where the curvature is dictated by the selected soil hydraulic equation. Haghverdi et al. [18,19,20] and Nguyen et al. [21] reported high accuracy for the pseudo-continuous pedotransfer function (PC-PTF) approach and showed that it could provide similar and in some cases better performance than parametric PTFs mainly as it generates continuous water retention estimations without the use of any soil hydraulic equations.
In a recent study, Haghverdi et al. [20] used HYPROP (Hydraulic Property Analyzer, Meter Group Inc., Pullman, WA, USA) automated evaporation-based benchtop laboratory system to generate a high-resolution water retention data set and subsequently developed water retention PCNN-PTFs. They reported promising results and concluded that more attention should be given to the development of PCNN-PTFs using HYPROP data for SWRC estimations. The HYPROP system works based on the extended evaporation method [22,23] and is becoming the standard approach of measuring soil hydraulic properties in the laboratory since it has several advantages over the traditional equilibrium methods (i.e., pressure plate extractors and sandbox apparatus). First, it generates high-resolution water retention data (approximately 100 water retention data points in the 0–100 kPa range), which is of particular importance when developing data-driven PTFs such as PCNN-PTFs. In addition, depending on the soil type, it can generate WRC in wet and intermediate ranges in a few days versus months using traditional equilibrium based methods [24]. In this study, only the drying path data were used since HYPROP measurements are taken during natural evaporation-based drying of undisturbed soil samples.
Haghverdi et al. [20] utilized a Turkish data set to develop their PCNN-PTFs, and no study has been done to evaluate the performance of PCNN-PTFs using a more comprehensive international data set from evaporation experiments. Recently, Schindler and Müller [25] published a high-resolution soil hydraulic international data set using the evaporation method and HYPROP system, making it possible to evaluate the efficacy of PCNN-PTFs for estimations of the SWRC with a large data set—the main objective of this study. The empirical nature of PTFs typically restricts their use to a specific region and any extrapolation must be preceded by validation of the PTFs [26]. In practice, however, PTFs are applied to soils different than their development data sets since sufficient data to derive new PTFs are lacking in many regions around the world. Therefore, when developing new international PTFs, it is crucial to evaluate both the accuracy (testing) and reliability (validation) of the models [1,8,26,27]. The accuracy, typically, shows the performance of PTF for a randomly selected subset of the development data set that was not used to derive the PTF. The reliability, however, indicates the performance of PTF beyond their statistical training limits and their geographical training area for data sets independent from the ones used to develop the PTF. Consequently, the specific objectives of this paper are to (I) develop water retention PCNN-PTFs by utilizing the international data set from evaporation experiments, (II) evaluate the accuracy and reliability of the PCNN-PTFs using the international data set from evaporation experiments and an independent Turkish data set and (III) determine whether incorporating the Turkish soils into the development data set improves the reliability of the PTFs.

2. Materials and Methods
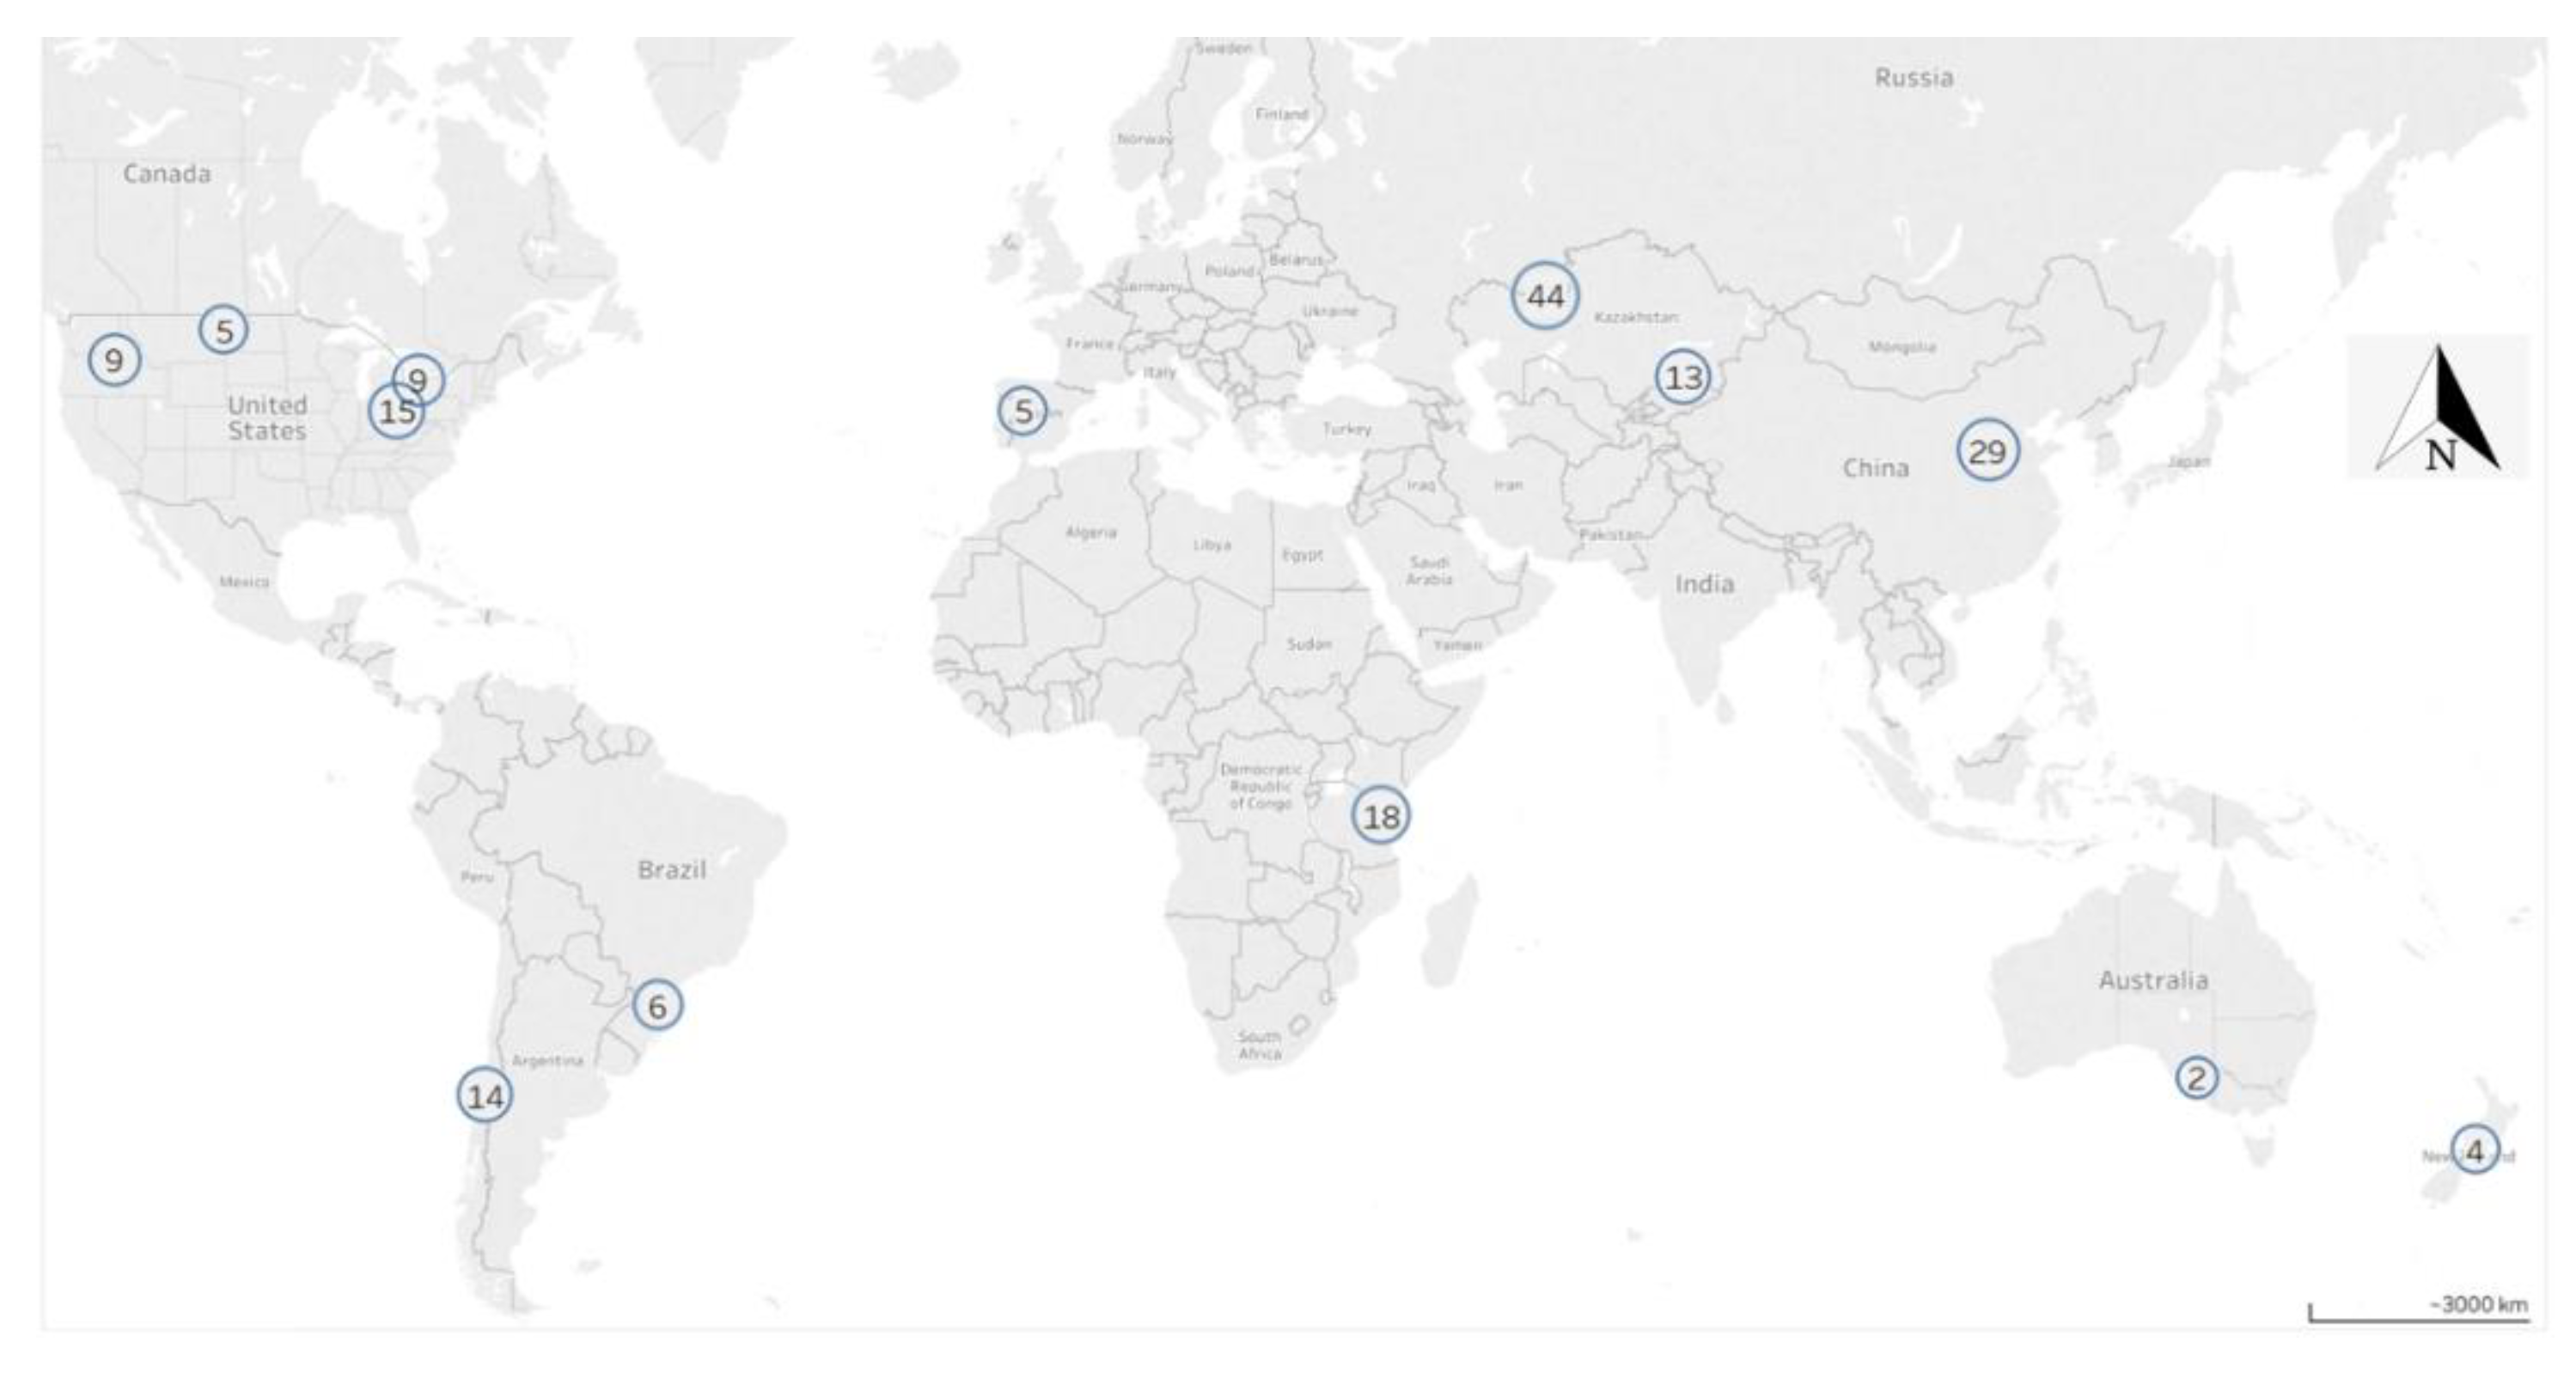
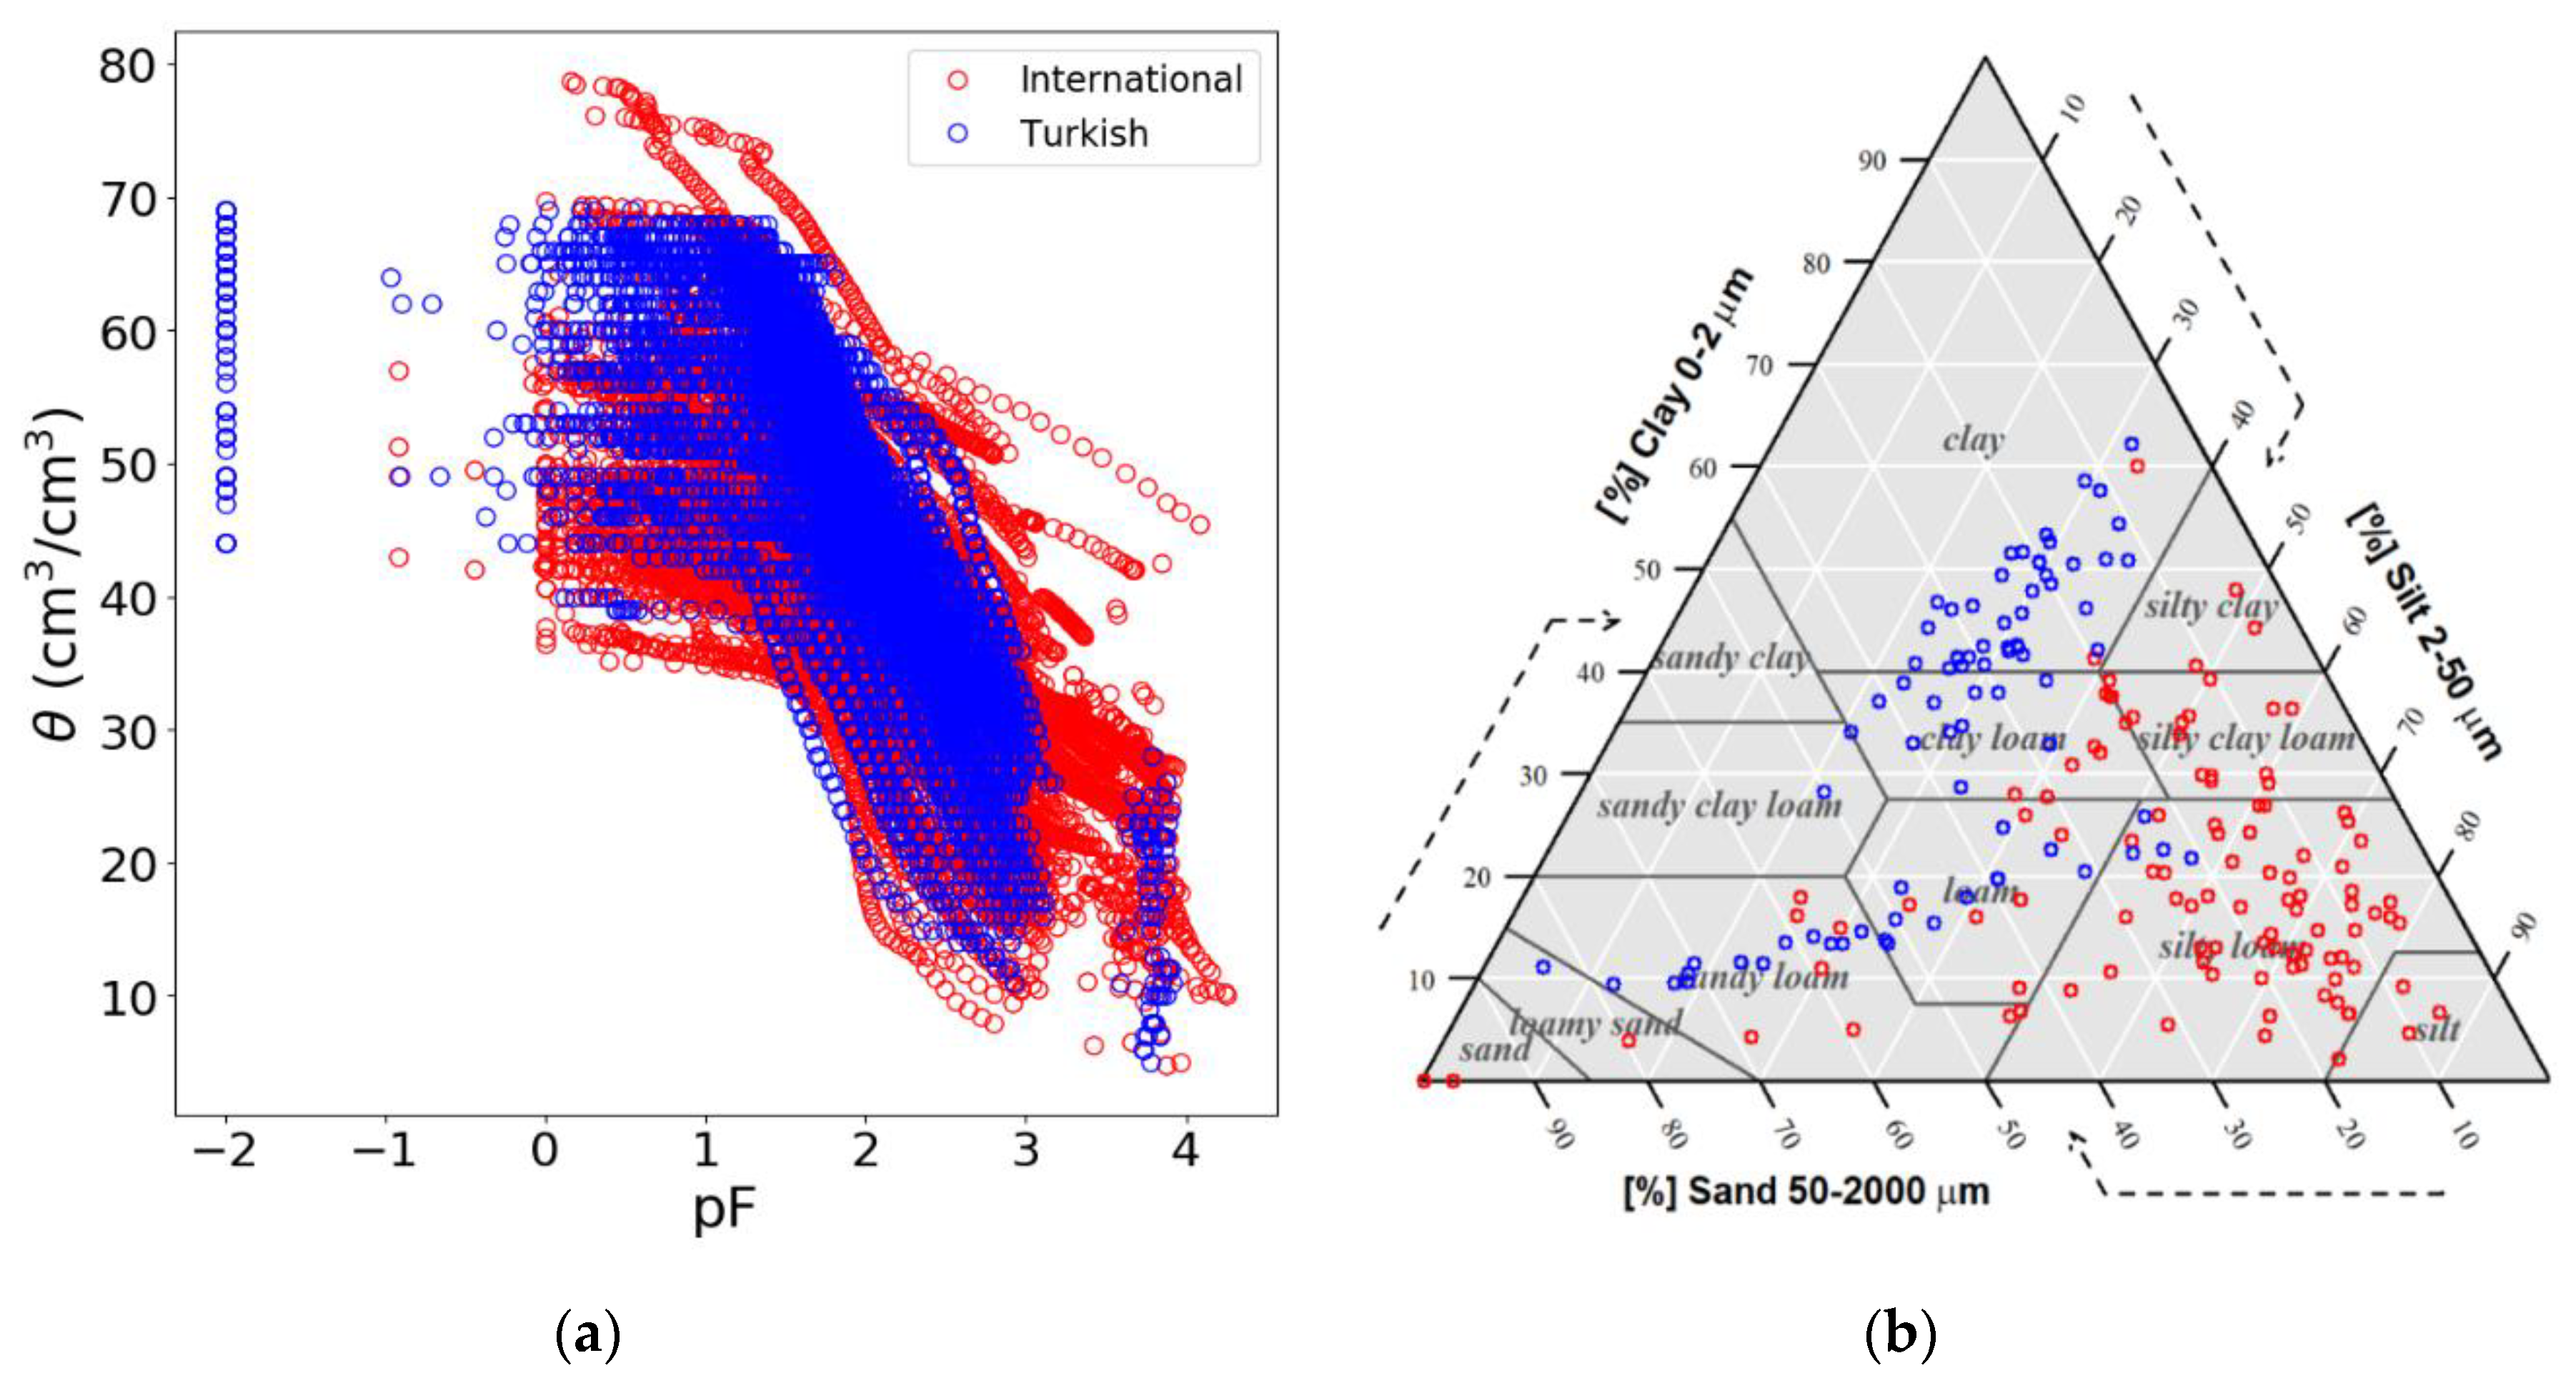
2.1. Soil Data Sets

Two data sets were used in this study to develop PCNN-PTFs and evaluate their accuracy and reliability. The primary data set was published by Schindler and Müller [25], hereafter referred to as the international data set, consisting of 173 soils from 71 sites collected from over the world (Figure 1). The international data set contains measurements of water retention, unsaturated hydraulic conductivity, and several basic soil properties, including textural data, organic matter content (SOM), and dry bulk density (BD) [25]. The hydraulic properties for the samples collected before 2007 (n = 40) had been measured using the evaporation method [28]. A short, saturated soil column was placed on a balance and was exposed to evaporation while the water loss per volume and tension (measured with tensiometers placed at two depths) were monitored. For the samples collected after 2008 (n = 133), the water retention data were determined with the extended evaporation method (EEM) using the HYPROP system. Schindler et al. [22,23] extended the measurement range of the evaporation method up close to the wilting point by utilizing improved tensiometers, maximal degassing of the tensiometers, and by considering the air-entry pressure of the tensiometer’s porous ceramic cup as an additional tension measurement. For more information about the HYPROP system, readers are referred to Schindler et al. [29]. The second data set (referred to as the Turkish data set) consisted of 79 repacked samples with 7729 hydraulic measured water retention data pairs using the HYPROP system. The samples were collected from areas surrounding Ankara and Anamur, Turkey. The SOM was estimated from measured soil organic carbon content using the modified method of Walkley and Black [30]. Soil texture (percentages of soil separates, including sand, silt, and clay) was measured using the hydrometer method [31]. For more details about the soil data set and the laboratory procedures, readers are referred to Haghverdi et al. [32].
The characteristics of the soils are shown in Table 1. The water retention data and the soil textural classification of the samples from the data sets used in this study are shown in Figure 2. After screening the international data set, a subset of samples with water retention information (i.e., 153 soils with 12,654 total water retention data pairs) was selected for this study. The majority of the soil samples in the data set were from arable lands. However, samples were also collected from other land use types such as urban land, grassland, forests, fallow lands and riverbanks. These samples were collected from multiple soil horizons at depths ranging from surface to 310 cm [25]. The soil textural data were log-linear transformed to convert 63 µm silt-sand particle size limit used in the original data set to 50 µm silt-sand limit to match the USDA soil textural classification system. The most dominant texture in the international data set was silt loam constituting 79 soil samples (51.6% of the data set) followed by loam consisting of 19 samples (12.4% of the data set). The measured volumetric water content (VWC) ranged from 0.05 to 0.79 cm3 cm−3 with an average of 0.38 cm3 cm−3. The logarithmic transformation of soil tension in cm of water (pF values) ranged from −0.9 to 4.3, with an average value of 2.0. The most dominant texture in the Turkish data set was clay constituting 38 soil samples (48.1% of the data set) followed by sandy loam consisting of 13 soil samples (16.5% of the data set). The measured water retention points of the Turkish data set ranged from full saturation (set to pF -2) to pF 3.9, with an average pF value of 1.8. The measured VWC varied between 0.05 and 0.69, with an average VWC value of 0.47 cm3 cm−3.

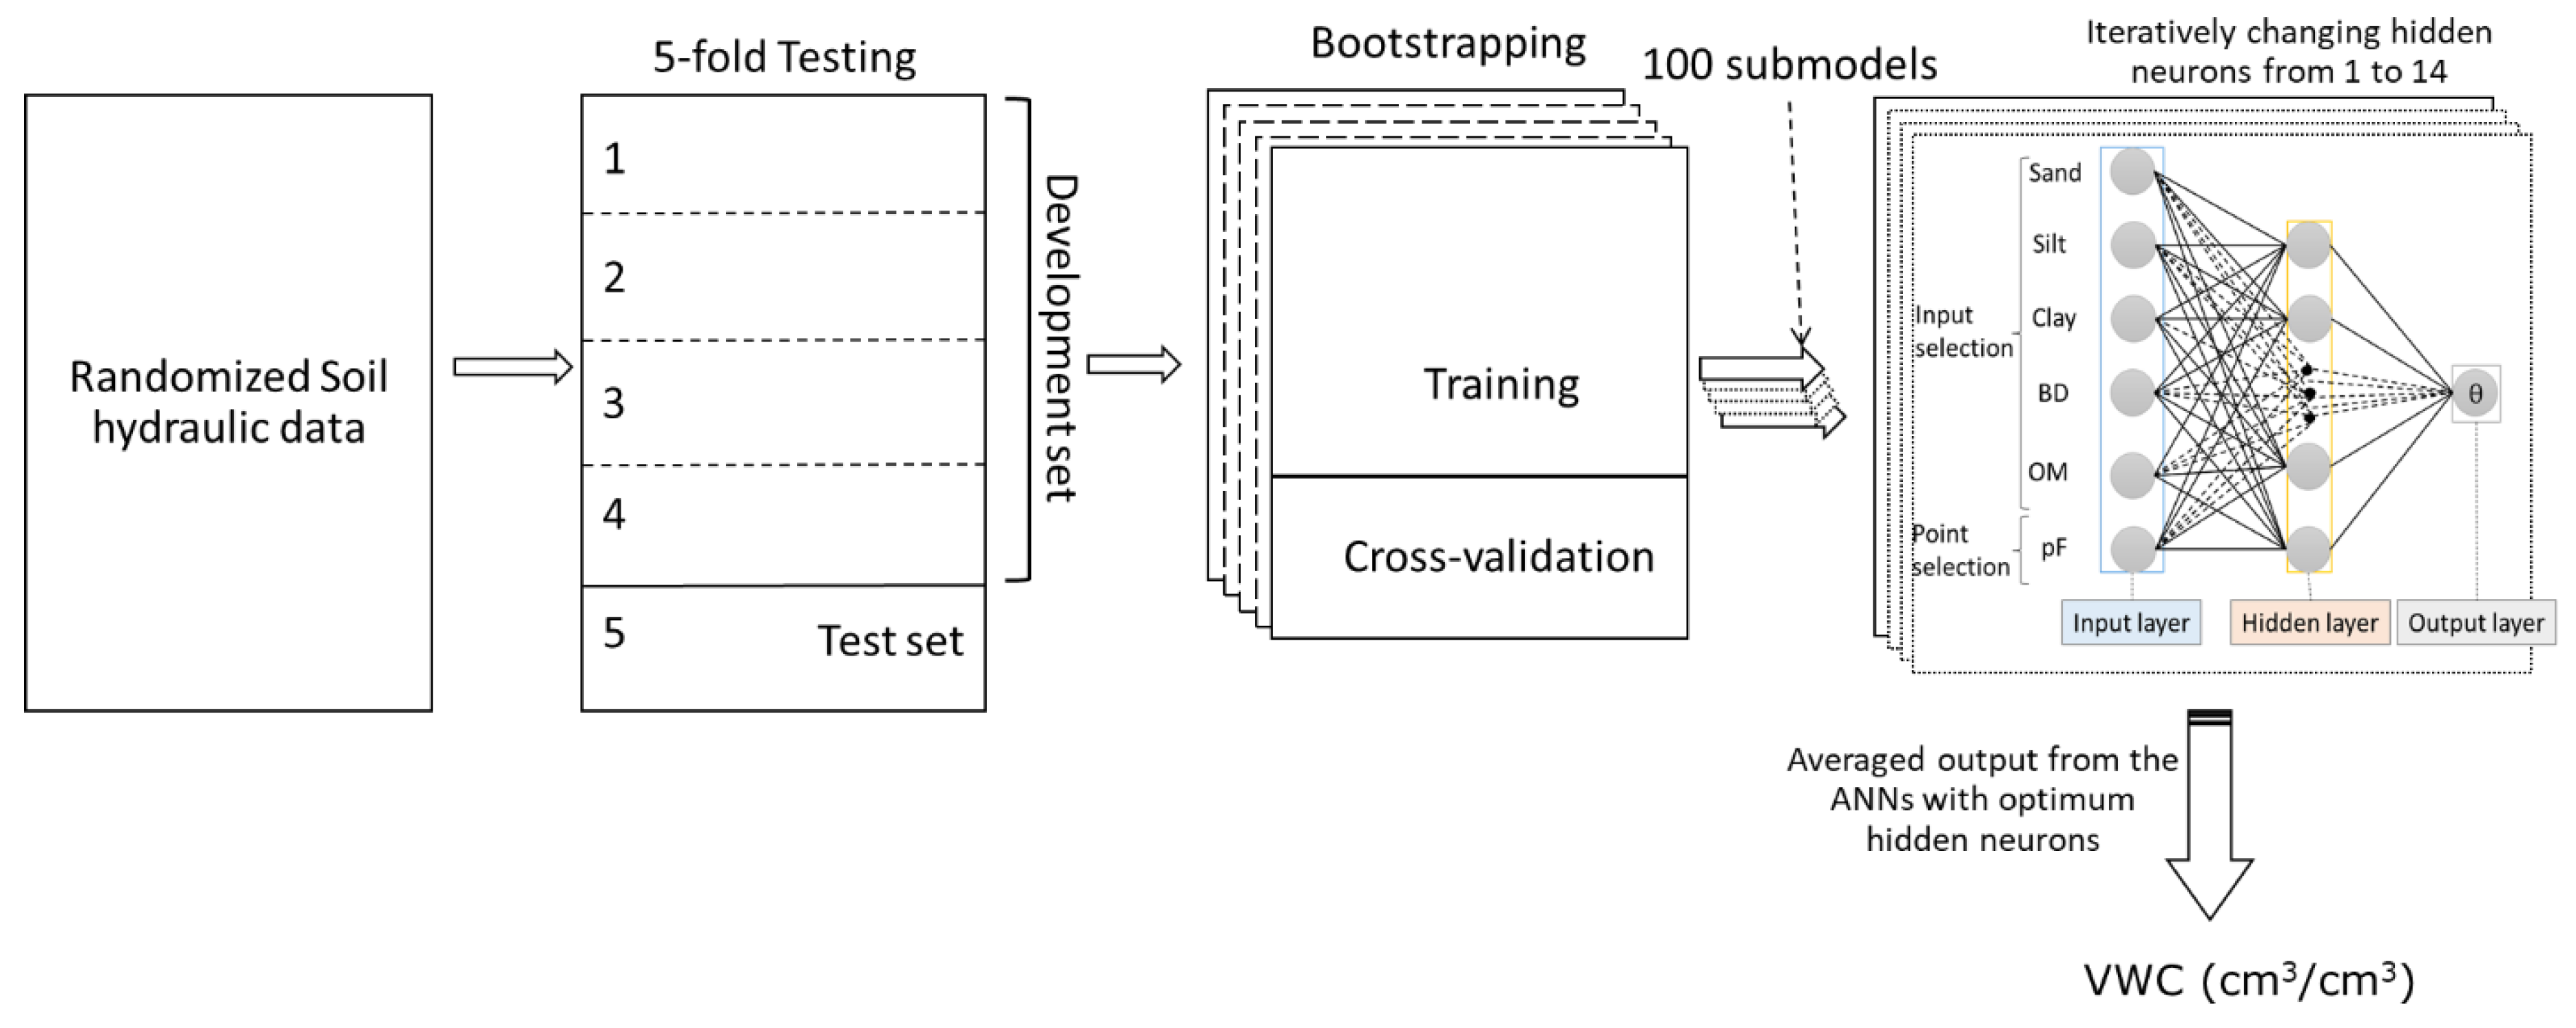
2.2. ANN PC-PTFs Development

We developed a three-layer feed-forward perceptron NN model using MATLAB R2017a (Mathworks, 2017). The transfer functions were the “hyperbolic tangent sigmoid” and “linear” for the hidden and the output layers, respectively. The Levenberg–Marquardt algorithm [33] was used for training the network. The maximum epoch (one cycle of a complete presentation of the training data set through the learning process) was set to 1000. The best weights were loaded automatically for testing.
Figure 3 illustrates the modeling workflow. Soil samples were randomly partitioned into five folds such that 80% of the data were used for the development of the PCNN-PTFs and 20% as the test set. The development data set was further divided into 100 training and cross-validation subsets using a bootstrapping technique (random sampling with replacement). Each training subset was expected to have roughly 63% of the development soils [34]. The remaining development soils were used as a cross-validation subset. To eliminate the possibility of over-training, training was terminated when the root mean square error (RMSE) of the cross-validation subset either began to increase or showed no improvement. This process was repeated five times leaving aside a different fold as test such that all samples in the data set were used as a test set. The number of neurons of the hidden layer was iteratively changed from 1 to 14 to find the optimum topology of the models.
The outputs of the 100 PCNN-PTFs with optimum topology were averaged to obtain the water retention estimations. We then post-processed the raw outputs to make sure they are physically meaningful and water content does not increase as moving from the wet to the dry part of the SWRC. The computational cost of developing data-driven models becomes important when big data sets with a wide range of attributes are used. The data sets used for the development of PTFs (including the high-resolution evaporation-based data sets used in this study) are of relatively small size. Therefore, the computational cost of training PCNN-PTFs is negligible and not discussed in this paper.

2.3. Modeling Scenarios

We evaluated the accuracy of the PCNN-PTFs (developed using the international data set) with four combinations of the input attributes, including soil texture (i.e., percentages of sand, silt, and clay; SSC), BD, and SOM (Table 2). Using the logarithmic transformation of soil tension (pF) as an extra input predictor enables PCNN-PTFs to estimate VWC at any desired soil tension. The VWC is the output parameter corresponding to the input pF value. We estimated the water retention of Turkish soil samples to assess the reliability of the PCNN-PTFs derived using the international data set. In addition, we developed new sets of PTFs after incorporating the Turkish soils into the training data set to determine whether including regional data into the international data set improves the reliability of the PTFs for that particular region.

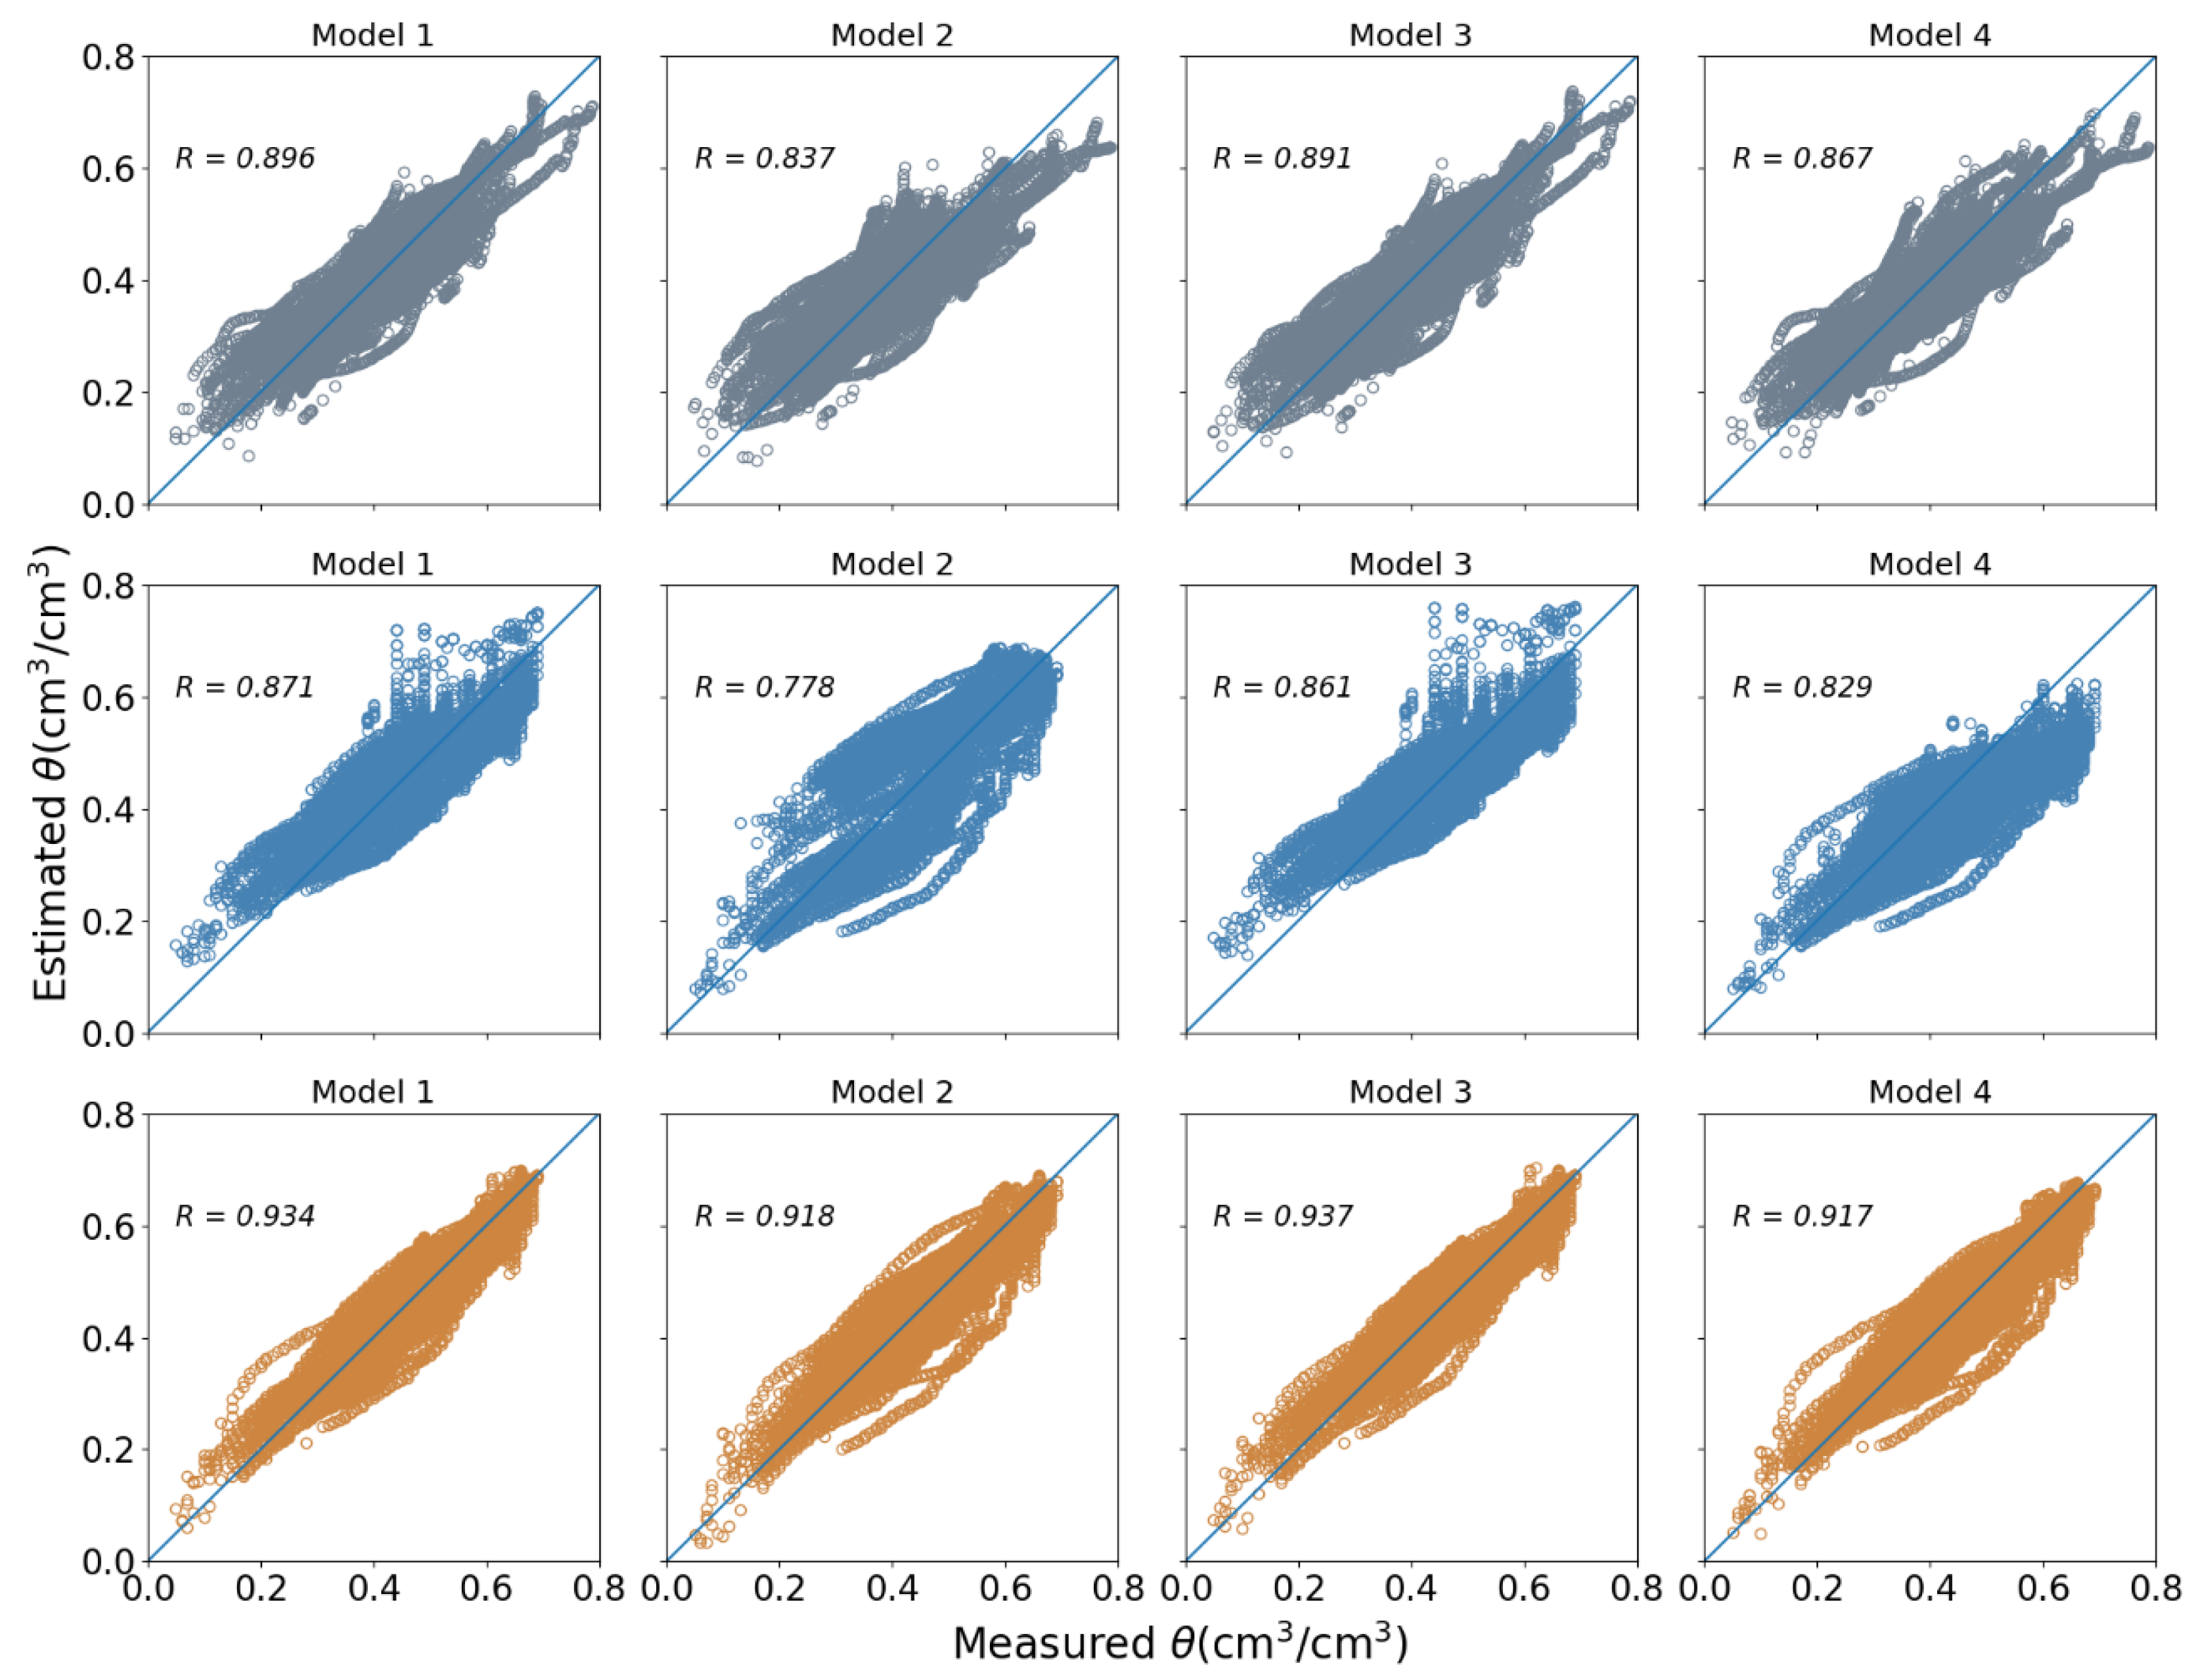
2.4. Model Evaluation

The root mean square error (RMSE, Equation (1)), mean absolute error (MAE, Equation (2)), mean bias error (MBE, Equation (3)), and correlation coefficient (R, Equation (4)) were calculated to evaluate the performance of PCNN-PTFs:
R M S E = 1 n i = 1 n ( E i M i ) 2
M A E = 1 n i = 1 n | E i M i |
M B E = 1 n i = 1 n ( E i M i )
R = i = 1 n ( E i E ¯ ) ( M i M ¯ ) i = 1 n ( E i E ¯ ) 2 i = 1 n ( M i M ¯ ) 2
where, E and M are the estimated and measured VWC (cm3 cm−3), respectively, E ¯ and M ¯ are the mean estimated and measured VWC (cm3 cm−3) and n is the total number of measured water retention points for each modeling scenario. In addition, the statistics were calculated separately for dominant soil textures and at the wet (pF ≤ 2), intermediate (2 < pF ≤ 3), and dry ranges (pF > 3) of the SWRC. These pF ranges were considered since a pF value of 2 (water potential of −9.8 kPa) is close to field capacity, the upper limit of available water content [35], and pF values greater than 3 are considered as dry ranges [1].

2.5. Domain of the Pedotransfer Functions

In most studies, the independent data set for validation of PTFs is typically described geographically or using the summary statistics of the data sets. We used the following approach to quantify the independence of the validation data set from the training set. We used Mahalanobis distance (d, Equation (5)) to evaluate which samples of the training and validation data sets belonged to the domain of applicability of the PCNN-PTF (Model 1 with SSC, BD, and SOM as inputs) [36].
d = ( x y ) T A ( x y )
where A is the inverse of the training (international) data variance–covariance matrix, x is the individual data points in the validation data matrix, and y is the mean of the training (international) data set.
The means and covariance matrix of the predictor variables of the international data set (SSC, BD, SOM) were computed in order to calculate the Mahalanobis distance of all training points to the centroid of the training data set. Then, we computed the cut-off distance delineating the domain of the PTF as the 97.5% percentile of the cumulative χ2 distribution of the squared Mahalanobis distances [36,37]. The Mahalanobis distance to the centroid of the training data set for all the samples of the Turkish (validation) data was computed to check if these points were within the domain of the training data set.

3. Results

3.1. Importance of the Input Predictors

Figure 4 illustrates the scatterplots of measured versus estimated VWC values and Table 3 summarizes the performance statistics for the PCNN-PTFs developed and tested using different combinations of input predictors. Overall, all models showed acceptable performance, which is also demonstrated by the well-scattered data clouds (around 1:1 reference line) for all the models.
When the international data set was used for training and testing, Model 1 (inputs: SSC, BD, organic matter (SOM), pF) showed the best performance with an RMSE of 0.046 cm3 cm−3 (MAE of 0.035 cm3 cm−3) followed by Model 3 (inputs: SSC, BD, pF) with an RMSE of 0.047 cm3 cm−3 (MAE of 0.036 cm3 cm−3). Model 2, with only the soil textural components as input predictors, showed the lowest accuracy with an RMSE of 0.056 cm3 cm−3 (MAE of 0.045 cm3 cm−3). The low MBE values varying between 0.000 and 0.002 cm3 cm−3 indicated no substantial over or underestimation. The R values were high for all the models ranging from 0.837 to 0.896, illustrating a good correlation between the measured and estimated VWC values.
When the Turkish data set was used as a validation set, Model 1 (inputs: SSC, BD, OM, pF) showed the best performance with an RMSE of 0.061 cm3 cm−3 (MAE of 0.051 cm3 cm−3) followed by Model 3 (inputs: SSC, BD) with an RMSE of 0.064 cm3 cm−3 (MAE of 0.053 cm3 cm−3). Model 4 (inputs: SSC, OM), showed the lowest performance with RMSE of 0.092 cm3 cm−3 (MAE of 0.078 cm3 cm−3). Model 4, with an MBE of −0.060 cm3 cm−3, showed a tendency to underestimate the VWC, which is also depicted in Figure 4. The R values ranged from 0.778 to 0.871 with the lowest R observed for Model 2 and comparable values for the other models.
When the Turkish data set was incorporated into training and used as a test, Model 3 (inputs: SSC, BD) showed the best performance with an RMSE of 0.043 cm3 cm−3 (MAE of 0.035 cm3 cm−3) followed by Model 1 (inputs: SSC, BD, OM) with an RMSE of 0.044 cm3 cm−3 (MAE of 0.035 cm3 cm−3). Model 4 (inputs: SSC, OM), showed the lowest accuracy with an RMSE of 0.050 cm3 cm−3 (MAE of 0.040 cm3 cm−3). The low MBE values ranging from −0.012 to −0.002 cm3 cm−3 indicated no sign of systematic bias in any of the models. The R values were high for all the models ranging from 0.917 to 0.937, showing a good correlation between the measured and estimated VWC values.

3.2. Performance across Soil Textures

Table 4 summarizes the performance of the best performing model (i.e., Model 1 with SSC, BD, and OM as inputs) across dominant textures (textures constituting more than 10% percent of the data set) developed and tested using the international data set. The smallest error (RMSE: 0.04 cm3 cm−3; MAE: 0.028 cm3 cm−3) values belonged to silt clay loam and the greatest error belonged to clay loam (RMSE 0.052 cm3 cm−3; MAE 0.038 cm3 cm−3). The other textures (i.e., silt loam, loam, and sandy loam) showed similar performance with MAE varying from 0.033 to 0.034 cm3 cm−3. The MBE values of 0.016 and −0.016 cm3 cm−3 suggested a slight tendency for over and underestimation for silty clay loam and clay loam textures, respectively. MBE values were negligible (close to zero) for other soil textures. The correlation coefficient values ranged from 0.824 to 0.935 among the textures with the greatest value observed for loam and lowest for sandy loam.
Table 5 shows the performance of the best performing model (i.e., Model 1 with SSC, BD, and OM as inputs) for the most dominant soil textures of the Turkish data set constituting roughly 92 percent of the data set.
When the Turkish data set was only used as a validation set, the lowest RMSE (0.052 cm3 cm−3) and MAE (0.042 cm3 cm−3) values belonged to clay loam, whereas sandy loam showed the highest values (RMSE = 0.069; MAE = 0.055). MBE values of −0.019 and 0.032 indicated slight underestimation and moderate overestimation for clay loam and sandy loam soil textures, respectively. The correlation coefficient varied from 0.813 for sandy loam to 0.905 for clay loam soil textures. When the Turkish soils were incorporated into the training phase, lowest RMSE (0.039 cm3 cm−3) and MAE (0.032 cm3 cm−3) belonged to clay, whereas the highest values were observed for sandy loam with RMSE and MAE of 0.047 and 0.037 cm3 cm−3, respectively. MBE values were close to zero (from −0.001 to 0.001), indicating no systematic bias for any of the models. The lowest and highest R values ranging from 0.895 to 0.938 were observed for sandy loam and clay textures, respectively.

3.3. Performance at the Wet, Intermediate and Dry Parts of the SWRC

Table 6 shows the performance of the best performing PCNN-PTF (i.e., model 1 with SSC, BD, and OM as inputs) in wet (pF ≤ 2), intermediate (2 < pF ≤ 3) and dry (pF > 3) parts of the SWRC. When the international data set was used for training and testing, the lowest RMSE (0.041 cm3 cm−3) and MAE (0.031 cm3 cm−3) values were observed in the wet range of the SWRC. The intermediate range of the SWRC showed a relatively higher error with RMSE and MAE values of 0.05 and 0.039 cm3 cm−3, respectively. The relatively higher and lower performances at the wet and intermediate parts were also evident by the R values of 0.868 and 0.733, respectively. MBE range of −0.008 to 0.007 suggested no bias for any of the models.
When the Turkish data set is used as a validation set, the lowest RMSE (0.061 cm3 cm−3) and MAE (0.05 cm3 cm−3) belonged to the wet range while the highest RMSE and MAE of 0.066 and 0.059 cm3 cm−3, respectively, belonged to the dry range of the SWRC. Underestimation of the VWC was observed in the wet range as indicated by the negative MBE (−0.018 cm3 cm−3) while overestimation was evident in intermediate (MBE: 0.021 cm3 cm−3) and dry parts (MBE: 0.058 cm3 cm−3) of the SWRC. The R values varied from 0.661 to 0.902, with the lowest and highest values belonging to the intermediate and dry ranges, respectively.
When the Turkish soils were incorporated into the training phase, lowest RMSE (0.037 cm3 cm−3) and MAE (0.028 cm3 cm−3) values were observed in the dry range and highest values of 0.049 and 0.039 cm3 cm−3, respectively, belonged to the intermediate range. MBE value of 0.015 cm3 cm−3 suggested a tendency to overestimate VWC in the dry range. R values ranged from 0.778 to 0.883 and were higher and comparable in the wet and dry ranges, whereas the intermediate range showed the lowest correlation.

4. Discussion

4.1. Accuracy and Reliability of the Developed PTFs

Table 7 summarizes the performance of already published PC-PTFs and PTFs developed in this study. The accuracy of previous PC-PTFs developed to estimate water retention range from RMSE of 0.027 to 0.159 cm3 cm−3, while the reliability ranges from RMSE of 0.036 to 0.088 cm3 cm−3 (Table 7). As shown in Table 3, the high accuracy of PCNN-PTF developed in this study (RMSE = 0.046 cm3 cm−3) puts it in a good performance rank among already published PC-PTFs. Therefore, PCNN-PTF is a reliable approach for developing accurate water retention models using international data from evaporation experiments. The PCNN-PTF developed by Haghverdi et al. [20] was the only other PTF that was based on a data set with soil water retention points measured with the extended evaporation method, using the Turkish data set. Other studies used data sets where the soil water retention pairs were collected using equilibrium-based methods (i.e., pressure plate/sandbox). Not all the studies used a totally independent data set for validation except Haghverdi et al. [8], whereas the validation data set in our study was independent of the international PTF-development data set.
The analysis of the Mahalanobis distances revealed that only eight soil samples from the validation data were below the cut-off limit (Figure 5), indicating that the two data sets used in this study were independent with a slight overlap. Despite the difference between the data sets, the PCNN-PTF showed high reliability with an RMSE equal to 0.061 cm3 cm−3 (Table 3). An RMSE of 0.043 cm3 cm−3 was further achieved when Turkish data was included in the training of the PCNN-PTF. Therefore, incorporation of local HYPROP data sets, if available, and retraining the PCNN-PTF is recommended to further enhance the performance of the model for new regions. The ability of NNs to mimic the inputs–outputs relationship of the complex soil water system [38] can explain the adequate performance of PCNN-PTFs in both training and validation phases.
Several studies have recommended the use of local data set to develop PTFs instead of using larger data sets [40,41]. Inconsistencies in the measurement techniques used in large data sets can introduce unexplained variance and negatively impact the performance of PTFs [1]. The international data set used in our study contains soil samples collected on the continental scale, yet PTFs performed satisfactorily across modeling scenarios. This is in part because all measurements for both development and test data sets were done using the evaporation or extended evaporation methods. We recommend using the HYPROP system as a benchmark laboratory approach to maintain consistency in measurement techniques when adding local samples to the international data set used in this study to develop new PCNN-PTFs in the future.

4.2. Importance of Input Variables

Various studies have found that the addition of more input variables to the models did not necessarily result in better performance of the PTFs [42,43]. The best performance in our study was observed for Model 1 using all the input predictors (SSC, BD, SOM) with RMSE of 0.046 cm3 cm−3 for the test and RMSE of 0.061 cm3 cm−3 for the validation sets. However, Model 3 also resulted in a comparable performance when using SSC and BD as inputs. Moreover, Model 3 was the best performing with RMSE of 0.043 cm3 cm−3 when the Turkish data set was incorporated in the training set, which agrees with the results reported by Patil et al. [44]. Minasny and McBratney [17] also found that adding BD improved the performance of the neuro-m model compared to using just the textural constituents. Moreover, the inclusion of BD as the input variable along with the soil texture resulted in better performance in both Neuro-m and Rosetta 3 PTFs to estimate water retention [16,17].
Including SOM as an input predictor did not improve the performance of the PCNN-PTF in our study. Zacharias and Wessolek [45] and Børgesen et al. [46] also reported that SOM does not contribute to the model performance. Minasny and McBratney [47] conducted a meta-analysis to conclude that an increase in the SOM only resulted in a small increase in the soil water content. Haghverdi et al. [20] mentioned that the insignificant impact of SOM in their study could be due to its low concentration and narrow range in most of the Turkish soil samples, which concur with the findings of our study despite having a larger range of SOM in the international data set.
While comparing to other PC-PTFs in literature, RMSE of 0.088 cm3 cm−3 was observed by PCNN-PTF of Moreira De Melo and Pedrollo [39] using additional inputs such as particle density and porosity along with soil texture and bulk density. An accuracy with RMSE of 0.033 cm3 cm−3 was observed by Haghverdi et al. [20] when information about stable aggregates and initial water content was included in the training along with other inputs including SSC, BD, and SOM. Although adding more input predictors, if available, could enhance the performance of PTFs, our results indicate soil texture (SSC) and bulk density (BD) as the essential inputs required to develop accurate PCNN-PTFs using evaporation data. These properties are also easily collected and are available in most data sets; thus, we recommended them to be included in future SWRC measurement campaigns using the HYPROP system.

4.3. Performance across Textural Classes and Tension Ranges

Generally, we observed that having more data points (due to having more soil samples) per textural classes in the training set improved the performance for that class (Figure 6). Khlosi et al. [48] provided error statistics for 11 textural classes and found that the PTFs performed well in the relatively coarse-textured soils compared to heavy-textured soils. They observed better PTF performance for textural classes with somewhat larger sample size. Schaap et al. [49] reported a relatively lower RMSE for the sandy loam and clay loam soil, which contributed 34% of their data set.
For the international data set, silt loam was the dominant textural class followed by silty clay loam, and both showed a high agreement with the fitted curves. For the Turkish data set, clay as the dominant class shows a high agreement with the fitted curves compared to textural classes with lower data percentage share. Similar results were reported by Schaap and Leij [50] and Cornelis et al. [51]. Thus, it is possible to predict the SWRC accurately if enough data points are available for the soil texture in the training set [1,18].
The best performance of the PCNN-PTF was observed in the wet region of the SWRC for the test and validation sets, while the lowest accuracy was observed in the dry region for the validation data set, which concurs with the performance of parametric PTFs of Khlosi et al. [48] and Børgesen and Schaap [11]. However, when Turkish data was included in the training of the models, the dry region had the best performance while the intermediate part showed a lower accuracy. Nonetheless, an improvement of 61%, 73%, and 49% in RMSE was observed in the wet, intermediate, and dry regions, respectively, after incorporating Turkish data into training. Schaap et al. [15] and Twarakavi et al. [52] reported overestimation of soil water retention close to saturation (pF < 0.5) and between pF of 0.5 to 1, and underestimation beyond pF of 1.5, which is in contrast to what we observed in our study. This is, in part, attributed to the fact that the training data set used by Schaap et al. [15] and Twarakavi et al. [52] consisted of samples collected from several studies with a wide range of approaches used to measure water retention. Moreover, these studies developed parametric PTFs which means the shape of the curve was governed by the van Genuchten water retention model [3]. However, the PCNN-PTF developed in our study learns the SWRC’s shape from the measured water retention data without using any soil hydraulic model.

5. Conclusions

Literature suggests that PTFs developed from small local data sets perform better as compared to larger general sets of data [40]. However, in many parts of the world, there is a lack of soil hydraulic data to derive PTFs for accurate SWRC estimations. Most of the large data sets (e.g., UNSODA [53], and HYPRES [54]) used in the past to develop international PTFs typically consist of smaller data sets with a wide range of measurement techniques applied to measure soil hydraulic properties. Having a PTF trained on an international data set with soil hydraulic properties measured with the same technique minimizes the inconsistency in the data set caused by variabilities in measurement techniques. We used an international data set from evaporation experiments [25] to evaluate the accuracy and reliability of the PCNN-PTF approach to estimate the SWRC. Evaporation based measurement of water retention offers the advantage of producing a quasi-continuous description of the retention function in the tensiometric moisture range, i.e., up to pF 3. In practice, HYPROP measurements lead to roughly ten times more data points compared to the traditional method via sandbox/pressure plate instruments. We found that a neural network-based PC-PTF can provide accurate and reliable estimation of the SWRC. Moreover, the reliability was further improved by including the local data into the training of PCNN-PTF. Therefore, we recommend retraining the models after incorporating local HYPROP data sets (if available) to enhance the performance of the PCNN-PTFs developed in this study in different regions around the world.

Author Contributions

Conceptualization, A.S., A.H.; methodology, A.S., A.H.; software, A.S., A.H.; validation, A.S., A.H.; formal analysis, A.S., A.H.; investigation, A.S., A.H.; resources, A.H., H.S.Ö., W.D.; data curation, A.H., H.S.Ö., W.D.; writing—original draft preparation, A.S., A.H.; writing—review and editing, A.H., H.S.Ö., W.D.; visualization, A.S., A.H.; supervision, A.H., H.S.Ö., W.D.; project administration, A.H., H.S.Ö., W.D.; funding acquisition, A.H., H.S.Ö., W.D. All authors have read and agreed to the published version of the manuscript.

Funding

This research was funded in part by the USDA National Institute of Food and Agriculture Hatch/Multistate W3188 project CA-R-ENS-5170-RR.

Conflicts of Interest

The authors declare no conflict of interest.

References

  1. Vereecken, H.; Weynants, M.; Javaux, M.; Pachepsky, Y.; Schaap, M.G.; van Genuchten, M.T. Using Pedotransfer Functions to Estimate the van Genuchten–Mualem Soil Hydraulic Properties: A Review. Vadose Zone J. 2010, 9, 795. [Google Scholar] [CrossRef]
  2. Githinji, L.J.M.; Dane, J.H.; Walker, R.H. Water-use patterns of tall fescue and hybrid bluegrass cultivars subjected to ET-based irrigation scheduling. Irrig. Sci. 2009, 27, 377–391. [Google Scholar] [CrossRef]
  3. van Genuchten, M.T. A Closed-form Equation for Predicting the Hydraulic Conductivity of Unsaturated Soils1. Soil Sci. Soc. Am. J. 1980, 44, 892. [Google Scholar] [CrossRef] [Green Version]
  4. Prevedello, C.L.; Armindo, R.A. Generalization of the Green-Ampt Theory for Horizontal Infiltration into Homogeneous Soils. Vadose Zone J. 2016, 15. [Google Scholar] [CrossRef]
  5. Gallipoli, D.; Gens, A.; Sharma, R.; Vaunat, J. An elasto-plastic model for unsaturated soil incorporating the effects of suction and degree of saturation on mechanical behaviour. Geotechnique 2003, 53, 123–135. [Google Scholar] [CrossRef]
  6. Ghaffaripour, O.; Esgandani, G.A.; Khoshghalb, A.; Shahbodaghkhan, B. Fully coupled elastoplastic hydro-mechanical analysis of unsaturated porous media using a meshfree method. Int. J. Numer. Anal. Methods Geomech. 2019, 43, 1919–1955. [Google Scholar] [CrossRef]
  7. Gupta, S.C.; Larson, W.E. Estimating Soil Water Retention Characteristics From Particle Size Distribution, Organic Matter Percent, and Bulk Density. Water Resour. Res. 1979, 15, 1633–1635. [Google Scholar] [CrossRef]
  8. Haghverdi, A.; Cornelis, W.M.; Ghahraman, B. A pseudo-continuous neural network approach for developing water retention pedotransfer functions with limited data. J. Hydrol. 2012, 442–443, 46–54. [Google Scholar] [CrossRef]
  9. Pachepsky, Y.A.; Timlin, D.; Varallyay, G. Artificial Neural Networks to Estimate Soil Water Retention from Easily Measurable Data. Soil Sci. Soc. Am. J. 1996, 60, 727–733. [Google Scholar] [CrossRef]
  10. Rawls, W.J.; Brakensiek, D.L.; Saxtonn, K.E. Estimation of Soil Water Properties. Trans. ASAE 1982, 25, 1316–1320. [Google Scholar] [CrossRef]
  11. Børgesen, C.D.; Schaap, M.G. Point and parameter pedotransfer functions for water retention predictions for Danish soils. Geoderma 2005, 127, 154–167. [Google Scholar] [CrossRef]
  12. Haghverdi, A.; Öztürk, H.S.; Durner, W. Studying Unimodal, Bimodal, PDI and Bimodal-PDI Variants of Multiple Soil Water Retention Models: II. Evaluation of Parametric Pedotransfer Functions against Direct Fits. Water 2020, 12, 896. [Google Scholar] [CrossRef] [Green Version]
  13. Minasny, B.; McBratney, A.B.; Bristow, K.L. Comparison of different approaches to the development of pedotransfer functions for water-retention curves. Geoderma 1999, 93, 225–253. [Google Scholar] [CrossRef]
  14. Wösten, J.H.M.; van Genuchten, M.T. Using Texture and Other Soil Properties to Predict the Unsaturated Soil Hydraulic Functions. Soil Sci. Soc. Am. J. 1988, 52, 1762–1770. [Google Scholar] [CrossRef]
  15. Schaap, M.G.; Leij, F.J.; van Genuchten, M.T. Rosetta: A computer program for estimating soil hydraulic parameters with hierarchical pedotransfer functions. J. Hydrol. 2001, 251, 163–176. [Google Scholar] [CrossRef]
  16. Zhang, Y.; Schaap, M.G. Weighted recalibration of the Rosetta pedotransfer model with improved estimates of hydraulic parameter distributions and summary statistics (Rosetta3). J. Hydrol. 2017, 547, 39–53. [Google Scholar] [CrossRef] [Green Version]
  17. Minasny, B.; McBratney, A.B. The Neuro-m Method for Fitting Neural Network Parametric Pedotransfer Functions. Soil Sci. Soc. Am. J. 2002, 66, 352–361. [Google Scholar] [CrossRef] [Green Version]
  18. Haghverdi, A.; Öztürk, H.S.; Cornelis, W.M. Revisiting the pseudo continuous pedotransfer function concept: Impact of data quality and data mining method. Geoderma 2014, 226–227, 31–38. [Google Scholar] [CrossRef]
  19. Haghverdi, A.; Leib, B.G.; Washington-Allen, R.A.; Ayers, P.D.; Buschermohle, M.J. High-resolution prediction of soil available water content within the crop root zone. J. Hydrol. 2015, 530, 167–179. [Google Scholar] [CrossRef]
  20. Haghverdi, A.; Öztürk, H.S.; Durner, W. Measurement and estimation of the soil water retention curve using the evaporation method and the pseudo continuous pedotransfer function. J. Hydrol. 2018, 563, 251–259. [Google Scholar] [CrossRef]
  21. Nguyen, P.M.; Haghverdi, A.; de Pue, J.; Botula, Y.D.; Le, K.V.; Waegeman, W.; Cornelis, W.M. Comparison of statistical regression and data-mining techniques in estimating soil water retention of tropical delta soils. Biosyst. Eng. 2017, 153, 12–27. [Google Scholar] [CrossRef]
  22. Schindler, U.; Durner, W.; von Unold, G.; Mueller, L.; Wieland, R. The evaporation method: Extending the measurement range of soil hydraulic properties using the air-entry pressure of the ceramic cup. J. Plant Nutr. Soil Sci. 2010, 173, 563–572. [Google Scholar] [CrossRef]
  23. Schindler, U.; Durner, W.; von Unold, G.; Müller, L. Evaporation Method for Measuring Unsaturated Hydraulic Properties of Soils: Extending the Measurement Range. Soil Sci. Soc. Am. J. 2010, 74, 1071. [Google Scholar] [CrossRef]
  24. Schelle, H.; Heise, L.; Jänicke, K.; Durner, W. Water retention characteristics of soils over the whole moisture range: A comparison of laboratory methods. Eur. J. Soil Sci. 2013, 64, 814–821. [Google Scholar] [CrossRef]
  25. Schindler, U.; Müller, L. Soil hydraulic functions of international soils measured with the Extended Evaporation Method (EEM) and the HYPROP device. Open Data J. Agric. Res. 2017, 3, 10–16. [Google Scholar] [CrossRef] [Green Version]
  26. Patil, N.G.; Singh, S.K. Pedotransfer Functions for Estimating Soil Hydraulic Properties: A Review. Pedosphere 2016, 26, 417–430. [Google Scholar] [CrossRef]
  27. Wösten, J.H.M.; Pachepsky, A.; Rawls, J. Pedotransfer functions: Bridging the gap between available basic soil data and missing soil hydraulic characteristics. J. Hydrol. 2001, 251, 123–150. [Google Scholar] [CrossRef]
  28. Schindler, U. Ein Schnellverfahren zur Messung der Wasserleitfähigkeit im teilgesättigten Boden an Stechzylinderproben. Arch. Acker Pflanzenbau Bodenkd. 1980, 24, 1–7. [Google Scholar]
  29. Schindler, U.; Mueller, L.; von Unold, G.; Durner, W.; Fank, J. Emerging Measurement Methods for Soil Hydrological Studies. In Novel Methods for Monitoring and Managing Land and Water Resources in Siberia; Springer: Berlin/Heidelberg, Germany, 2016; pp. 345–363. ISBN 978-3-319-24407-5. [Google Scholar]
  30. Jackson, M.L. Soil Chemical Analysis: Advanced Course; UW-Madison Libraries Parallel Press: Madison, WI, USA, 2005; ISBN 1893311473. [Google Scholar]
  31. Gee, G.W.; Bauder, J.W. Particle-size analysis. In Methods of Soil Analysis. Part 1, 2nd ed.; Agron. Monogr. 9; Klute, A., Ed.; ASA and SSSA: Madison, WI, USA, 1986; pp. 383–411. [Google Scholar] [CrossRef]
  32. Haghverdi, A.; Najarchi, M.; Öztürk, H.S.; Durner, W. Studying Unimodal, Bimodal, PDI and Bimodal-PDI Variants of Multiple Soil Water Retention Models: I. Direct Model Fit Using the Extended Evaporation and Dewpoint Methods. Water 2020, 12, 900. [Google Scholar] [CrossRef] [Green Version]
  33. Marquardt, D.W. An Algorithm for Least-Squares Estimation of Nonlinear Parameters. J. Soc. Indust. Appl. Math. 1963, 11, 431–441. [Google Scholar] [CrossRef]
  34. Hastie, T.; Tibshirani, R.; Friedman, J. The Elements of Statistical Learning: Data Mining, Inference, and Prediction; Springer Science & Business Media: Berlin/Heidelberg, Germany, 2009; ISBN 0387848584. [Google Scholar]
  35. Al Majou, H.; Bruand, A.; Duval, O.; Le Bas, C.; Vautier, A. Prediction of soil water retention properties after stratification by combining texture, bulk density and the type of horizon. Soil Use Manag. 2008, 24, 383–391. [Google Scholar] [CrossRef] [Green Version]
  36. Tranter, G.; McBratney, A.B.; Minasny, B. Using distance metrics to determine the appropriate domain of pedotransfer function predictions. Geoderma 2009, 149, 421–425. [Google Scholar] [CrossRef]
  37. Rousseeuw, P.J.; van Zomeren, B.C. Unmasking multivariate outliers and leverage points. J. Am. Stat. Assoc. 1990, 85, 633–639. [Google Scholar] [CrossRef]
  38. Pachepsky, Y.; Schaap, M.G. Data mining and exploration techniques. In Development of Pedotransfer Functions in Soil Hydrology; Elsevier: Amsterdam, The Netherlands, 2004; Volume 30, ISBN 0166-2481. [Google Scholar]
  39. Moreira De Melo, T.; Pedrollo, O.C. Artificial neural networks for estimating soil water retention curve using fitted and measured data. Appl. Environ. Soil Sci. 2015, 2015. [Google Scholar] [CrossRef] [Green Version]
  40. Nemes, A.; Schaap, M.G.; Wösten, J.H.M. Functional Evaluation of Pedotransfer Functions Derived from Different Scales of Data Collection. Soil Sci. Soc. Am. J. 2003, 67, 1093. [Google Scholar] [CrossRef]
  41. McBratney, A.B.; Minasny, B.; Cattle, S.R.; Vervoort, R.W. From pedotransfer functions to soil inference systems. Geoderma 2002, 109, 41–73. [Google Scholar] [CrossRef]
  42. Nemes, A.; Rawls, W.J.; Pachepsky, Y.A. Use of the Nonparametric Nearest Neighbor Approach to Estimate Soil Hydraulic Properties. Soil Sci. Soc. Am. J. 2006, 70, 327. [Google Scholar] [CrossRef]
  43. Schaap, M.G.; Nemes, A.; van Genuchten, M.T. Comparison of Models for Indirect Estimation of Water Retention and Available Water in Surface Soils. Vadose Zone J. 2004, 3, 1455–1463. [Google Scholar] [CrossRef]
  44. Patil, N.G.; Tiwary, P.; Pal, D.K.; Bhattacharyya, T.; Sarkar, D.; Mandal, C.; Mandal, D.K.; Chandran, P.; Ray, S.K.; Prasad, J.; et al. Soil water retention characteristics of black soils of india and pedotransfer functions using different approaches. J. Irrig. Drain. Eng. 2013, 139, 313–324. [Google Scholar] [CrossRef]
  45. Zacharias, S.; Wessolek, G. Excluding Organic Matter Content from Pedotransfer Predictors of Soil Water Retention. Soil Sci. Soc. Am. J. 2007, 71, 43–50. [Google Scholar] [CrossRef]
  46. Børgesen, C.D.; Iversen, B.V.; Jacobsen, O.H.; Schaap, M.G. Pedotransfer functions estimating soil hydraulic properties using different soil parameters. Hydrol. Process. 2008, 22, 1630–1639. [Google Scholar] [CrossRef]
  47. Minasny, B.; McBratney, A.B. Limited effect of organic matter on soil available water capacity. Eur. J. Soil Sci. 2018, 69, 39–47. [Google Scholar] [CrossRef] [Green Version]
  48. Khlosi, M.; Cornelis, W.M.; Douaik, A.; van Genuchten, M.T.; Gabriels, D. Performance Evaluation of Models That Describe the Soil Water Retention Curve between Saturation and Oven Dryness. Vadose Zone J. 2008, 7, 87. [Google Scholar] [CrossRef]
  49. Schaap, M.G.; Leij, F.J.; van Genuchten, M.T. Neural Network Analysis for Hierarchical Prediction of Soil Hydraulic Properties. Soil Sci. Soc. Am. J. 1998, 62, 847. [Google Scholar] [CrossRef]
  50. Schaap, M.G.; Leij, F.J. Using neural networks to predict soil water retention and soil hydraulic conductivity. Soil Tillage Res. 1998, 47, 37–42. [Google Scholar] [CrossRef]
  51. Cornelis, W.M.; Ronsyn, J.; Van Meirvenne, M.; Hartmann, R. Evaluation of Pedotransfer Functions for Predicting the Soil Moisture Retention Curve. Soil Sci. Soc. Am. J. 2001, 65, 638–648. [Google Scholar] [CrossRef]
  52. Twarakavi, N.K.C.; Šimůnek, J.; Schaap, M.G. Development of Pedotransfer Functions for Estimation of Soil Hydraulic Parameters using Support Vector Machines. Soil Sci. Soc. Am. J. 2009, 73, 1443–1452. [Google Scholar] [CrossRef] [Green Version]
  53. Nemes, A.; Schaap, M.; Leij, F..; Wösten, J.H. Description of the unsaturated soil hydraulic database UNSODA version 2.0. J. Hydrol. 2001, 251, 151–162. [Google Scholar] [CrossRef]
  54. Wösten, J.H.M.; Lilly, A.; Nemes, A.; Le Bas, C. Development and use of a database of hydraulic properties of European soils. Geoderma 1999, 90, 169–185. [Google Scholar] [CrossRef]
Figure 1. Number and origin of the undisturbed soil core samples for the international data set used in this study to develop pedotransfer functions.
Water 12 03425 g001
Figure 2. Soil water retention data pairs (a), and soil textural distribution for the data sets used in this study (b). Red points depict the international data set from evaporation experiments [25] and blue points represent the Turkish data set [18,20,32].
Water 12 03425 g002
Figure 3. Development workflow of the pseudo continuous neural network pedotransfer functions (PCNN-PTFs) for the soil water retention curve (SWRC) estimations.
Water 12 03425 g003
Figure 4. Scatterplots of the measured versus estimated volumetric water content (VWC) via PCNN-PTFs when the international data set was used to train and test the models (top), and for the Turkish soil samples when Turkish data set was not used for training (middle) and when Turkish data set was incorporated into the training data set (bottom).
Water 12 03425 g004
Figure 5. The domain of the developed PCNN-PTFs using Mahalanobis distance, indicating that the two data sets were independent with a slight overlap since only 8 Turkish soil samples (highlighted in red) fell below the cut-off limit (y-axis for Turkish data set is on an exponential scale).
Water 12 03425 g005
Figure 6. Relationship between the number of data points for each textural class and the accuracy of the best performing PCNN-PTF (Model 3 with SSC, BD, and pF as inputs) when both international and Turkish data sets were used to develop the models.
Water 12 03425 g006
Table 1. Characteristics of soils from both international and Turkish data sets used in this study to develop and test pseudo continuous neural network pedotransfer functions (PCNN-PTFs).
AttributeInternational Data SetTurkish Dataset
MeanRangeSDMeanRangeSD
Clay (%)19.90.0–60.012.434.19.4–62.215.0
Silt (%)56.70.2–86.817.230.75.2–57.68.7
Sand (%)23.53.9–99.8 17.435.36.0–84.017.4
Bulk density (g cm−3)1.330.55–1.690.230.980.69–1.330.14
Organic matter content (%)3.00.00–12.02.51.20.0–3.10.6
Table 2. Combinations of input attributes (scenarios) that were used in this study to develop the pseudo continuous neural network pedotransfer functions (PCNN-PTFs).
ModelInput Attributes
1SSC, BD, SOM, pF
2SSC, pF
3SSC, BD, pF
4SSC, SOM, pF
SSC: sand, silt, and clay percentages (%), BD: bulk density (cm3 cm−3), SOM: soil organic matter content (%), pF: the logarithmic transformation of soil tension in cm of water.
Table 3. Comparison between the performance of the PCNN-PTFs trained using different data sets to estimate the volumetric water content (cm3 cm−3) of the international and Turkish soil samples.
Training & Test: ITraining: I; Validation: TTraining: I + T; Test: T
MRMSEMAEMBERRMSEMAEMBERRMSEMAEMBER
10.0460.0350.0020.8960.0610.051−0.0030.8710.0440.035−0.0020.934
20.0560.0450.0010.8370.0810.0660.0100.7780.0490.039−0.0060.918
30.0470.0360.0010.8910.0640.0530.0010.8610.0430.035−0.0020.937
40.0510.0400.0000.8670.0920.078−0.0600.8290.0500.040−0.0120.917
M: Model, RMSE: Root mean square error (cm3 cm−3), MAE: mean absolute error (cm3 cm−3), MBE: mean biased error (cm3 cm−3), R: correlation coefficient. I: international data set, T: Turkish data set.
Table 4. Soil texture-based performance of the PCNN-PTFs (inputs: SSC, BD, OM, pF) developed and tested using the international data set to estimate the volumetric water content (cm3 cm−3).
Silt LoamLoamSilty Clay LoamClay LoamSandy Loam
RMSE0.0430.0420.040.0520.043
MAE0.0340.0330.0280.0380.033
MBE0.0020.0040.016−0.0160.009
R0.8880.9350.8240.9260.882
RMSE: Root mean square error (cm3 cm−3), MAE: mean absolute error (cm3 cm−3), MBE: mean biased error (cm3 cm−3), R: correlation coefficient.
Table 5. Soil texture based performance of the PCNN-PTFs (Model 1 with SSC, BD, SOM, and pF as inputs) developed using the international data set and the international plus Turkish data sets to estimate the volumetric water content (cm3 cm−3) of the Turkish soil samples.
Training: InternationalTraining: International + Turkish
CSLCLLCSLCLL
RMSE0.0600.0690.0520.0600.0390.0470.0440.042
MAE0.0520.0550.0420.0480.0320.0370.0350.034
MBE−0.0060.032−0.019−0.009−0.0010.001−0.001−0.004
R0.8790.8130.9050.8200.9380.8950.9100.907
RMSE: Root mean square error (cm3 cm−3), MAE: mean absolute error (cm3 cm−3), MBE: mean biased error (cm3 cm−3), R: correlation coefficient. C: Clay, SL: Sandy Loam, CL: Clay loam, L: Loam.
Table 6. Performance of the PCNN-PTFs (inputs: SSC, BD, OM, and pF as) developed using the international data set and the international plus Turkish data sets to estimate the volumetric water content (cm3 cm−3) at wet (pF ≤ 2) intermediate (2 < pF ≤ 3) and dry (pF >3) parts of the SWRC.
Training and Test: ITraining: I; Validation: TTraining: I + T; Test: T
WetMidDryWetMidDryWetMidDry
RMSE0.0410.0500.0430.0610.0620.0660.0410.0490.037
MAE0.0310.0390.0340.0500.0520.0590.0320.0390.028
MBE−0.0010.007−0.008−0.0180.0210.058−0.0030.0000.015
R0.8680.7330.7900.7130.6610.9020.8660.7780.883
RMSE: Root mean square error (cm3 cm−3), MAE: mean absolute error (cm3 cm−3), MBE: mean biased error (cm3 cm−3), R: correlation coefficient. I: International data set, T: Turkish data set.
Table 7. Comparison of the pseudo-continuous pedotransfer functions (PC-PTFs) developed in the literature to the PCNN-PTF developed in this study.
StudyMethodModeling
Approach
InputsOrigin, no.
Samples/Datapoints
RMSE (cm3 cm−3)
TestValidation
Haghverdi et al. (2012) [8]Iranian data from pressure plate and Australian data set using various equilibrium-based methodsNNSSC(Traing and Test- 122 soil samples from Iran)
(772 soil samples for training from Australia, Validation- Iran)
0.0290.037
SSC, BD-0.0280.037
SSC, OC-0.0280.036
SSC, BD, OC-0.0270.036
Haghverdi et al. (2014) [18]sandbox/pressure plateNNSSC, BD, SOMTurkey, 135 soil samples x 8 SWR points0.047-
Belgium, (69 soil samples x 8 to 10 SWR points)0.040-
SVMSSC, BD, SOMTurkey0.054
Belgium0.069
de Melo and Pedrollo (2015) [39]different equilibrium-based methods (Pressure based, hanging water, tensiometer, and sand-box)NNSSC, particle density, total porosity, BDUNSODA, (137 soil samples for training and 51 for validation) 0.088
Nguyen et al. (2017) [21]sand-boxes and pressure chambersNNSSC, BD, OCVietnamese Mekong Delta, (1280 data points for training, 232 validation)0.0440.052
MLR -0.0560.066
SVM -0.0360.068
k-NN -0.0560.050
Haghverdi et al. (2018) [20]evaporationNNSSCTurkey, (81 soil samples) 0.129
SSC, BD-0.080
SSC, SOM-0.159
SSC, SA-0.107
SSC, SA, BD, SOM-0.061
SSC, BD, OM, SA, IWC-0.033
SVM: support vector machine, MLR: multiple linear regression, NN: artificial neural network, k-NN: k-nearest neighbor, SSC: sand, silt, and clay percentages (%), BD: bulk density (cm3 cm-3), SOM: soil organic matter content (%), OC: organic carbon content (%), SA: percentage of stable aggregates, IWC: initial water content (cm3 cm-3).
Publisher’s Note: MDPI stays neutral with regard to jurisdictional claims in published maps and institutional affiliations.

