Article

Distribution of Toxic Cyanobacteria in Volcanic Lakes of the Azores Islands

1
CIBIO, Centro de Investigação em Biodiversidade e Recursos Genéticos, InBIO Laboratório Associado, Pólo dos Açores, Universidade dos Açores, 9500-321 Ponta Delgada, Portugal
2
Faculdade de Ciências e Tecnologia, Universidade dos Açores, 9500-321 Ponta Delgada, Portugal
3
Interdisciplinary Centre of Marine and Environmental Research—CIIMAR/CIMAR, University of Porto, Terminal de Cruzeiros do Porto de Leixões, Av. General Norton de Matos s/n, 4450-208 Matosinhos, Portugal
4
Department of Biology, Faculty of Sciences, University of Porto, 4069-007 Porto, Portugal
*
Author to whom correspondence should be addressed.
Water 2020, 12(12), 3385; https://doi.org/10.3390/w12123385
Submission received: 29 September 2020 / Revised: 23 November 2020 / Accepted: 30 November 2020 / Published: 2 December 2020
(This article belongs to the Section Water Quality and Contamination)

Abstract

:
Eutrophication and global climate change gather advantageous conditions for cyanobacteria proliferation leading to bloom formation and cyanotoxin production. In the Azores, eutrophication is a major concern, mainly in lakes where fertilizers and organic matter discharges have increased nutrient concentration. In this study, we focused on understanding the influence of environmental factors and lake characteristics on (i) cyanobacteria diversity and biomass and (ii) the presence of toxic strains and microcystin, saxitoxin, anatoxin-a, and cylindrospermopsin cyanotoxin-producing genes. Fifteen lakes from the Azores Archipelago were sampled seasonally, environmental variables were recorded in situ, cyanobacteria were analyzed with microscopic techniques, and cyanotoxin-producing genes were targeted through conventional PCR. Statistical analysis (DistLM) showed that lake typology-associated variables (lake’s depth, area, and altitude) were the most explanatory variables of cyanobacteria biomass and cyanotoxin-producing genes presence, although trophic variables (chlorophyll a and total phosphorus) influence species distribution in each lake type. Our main results revealed higher cyanobacteria biomass/diversity, and higher toxicity risk in lakes located at lower altitudes, associated with deep anthropogenic pressures and eutrophication scenarios. These results emphasize the need for cyanobacteria blooms control measures, mainly by decreasing anthropogenic pressures surrounding these lakes, thus decreasing eutrophication. We also highlight the potential for microcystin, saxitoxin, and anatoxin-a production in these lakes, hence the necessity to implement continuous mitigation protocols to avoid environmental and public health toxicity events.

1. Introduction

Eutrophication is a major factor leading to the development of blooms and the appearance of surface accumulations of cyanobacteria in inland waters [1,2]. The combination of eutrophication with global climate change is leading to the rapid increase in cyanobacteria dominance and toxic blooms (cyanoHABs) [3,4,5,6,7]. The rise of temperature, nutrients, and atmospheric CO2 are all advantageous scenarios for cyanobacteria rapid proliferation, bloom formation, and toxin production [3,8,9]. Some cyanobacteria develop better at higher temperatures (≥25 °C) than most phytoplankton algae [5,10,11]. They can move vertically in stratified waters (due to gas vesicles), allowing them to have direct access to sunlight and shade epilimnion and hypolimnion [1,3,8]. Moreover, they can fix atmospheric nitrogen (due to heterocytes), enabling them to resist nitrogen-limited conditions [5,12]. All these characteristics give cyanobacteria an ecological advantage and ultimately drive the development of cyanobacteria communities [8].
Cyanobacteria can produce a wide range of toxins, such as Microcystin (MC), Saxitoxin (STX), Anatoxin-a (ATX-a), and Cylindrospermopsin (CYN) [13,14]. These cyanotoxins are a threat not only to environmental health but also to public health, affecting the well-being of many organisms [13,14,15,16,17]. Several studies deal with cyanotoxin production, regulation, and function [18,19,20], but still gaps in the knowledge remain [21,22]. Higher nutrients (e.g., nitrogen and phosphorus) concentrations and their synergy with other environmental factors (e.g., temperature and light) are key to toxic strain growth, rather than non-toxic, and higher cyanotoxin production [2,7,23]. Besides the not well-defined reasons for toxin production, cyanobacterial blooms may be comprised of various species including toxin and non-toxin producers within the same species [24,25].
In recent years, molecular methods have been applied to identify toxigenic cyanobacteria strains, prior to toxin production [16,24,26,27,28]. Mitigation actions that reduce the favorable conditions for cyanoHABs development and allow the identification of cyanotoxin production potential in water bodies are essential to avoid risks to public health [16,29].
In the Azores, eutrophication has become a major concern in lakes conservation due to discharges of fertilizers and organic matter from human activities in the catchments [30,31]. As it is observed worldwide [32,33,34,35], eutrophication in the Azorean lakes has led to the increase of cyanobacteria abundance and the formation of cyanoHABs [30,35,36]. References to the presence of cyanobacteria in the Azores date back to the late Nineteenth century [37,38,39], but the current knowledge on their distribution and ecology is still limited [35,36], and even less is known about the presence of toxigenic strains in the Azorean lakes [7,30,40,41]. Considering that several species known from the literature as producers of MC, STX, ATX-a, and CYN, such as Aphanizomenon gracile [42], Microcystis aeruginosa [43], and Raphidiopsis curvata [44], were found in the Azores lakes [45], the presence of toxigenic strains and/or cyanotoxins should be further investigated, in order to determine the present risk in these waters.
In this context, we aimed to determine the occurrence of toxic cyanobacteria in the Azorean lakes through the detection of cyanotoxins biosynthesis genes to identify lakes in the Azores Archipelago with a potential risk of cyanotoxin production and to understand which physical and chemical factors (e.g., temperature, O2, pH and nutrients) and lake characteristics (e.g., depth, location, and catchment land use) drive toxic strains distribution.

2. Materials and Methods
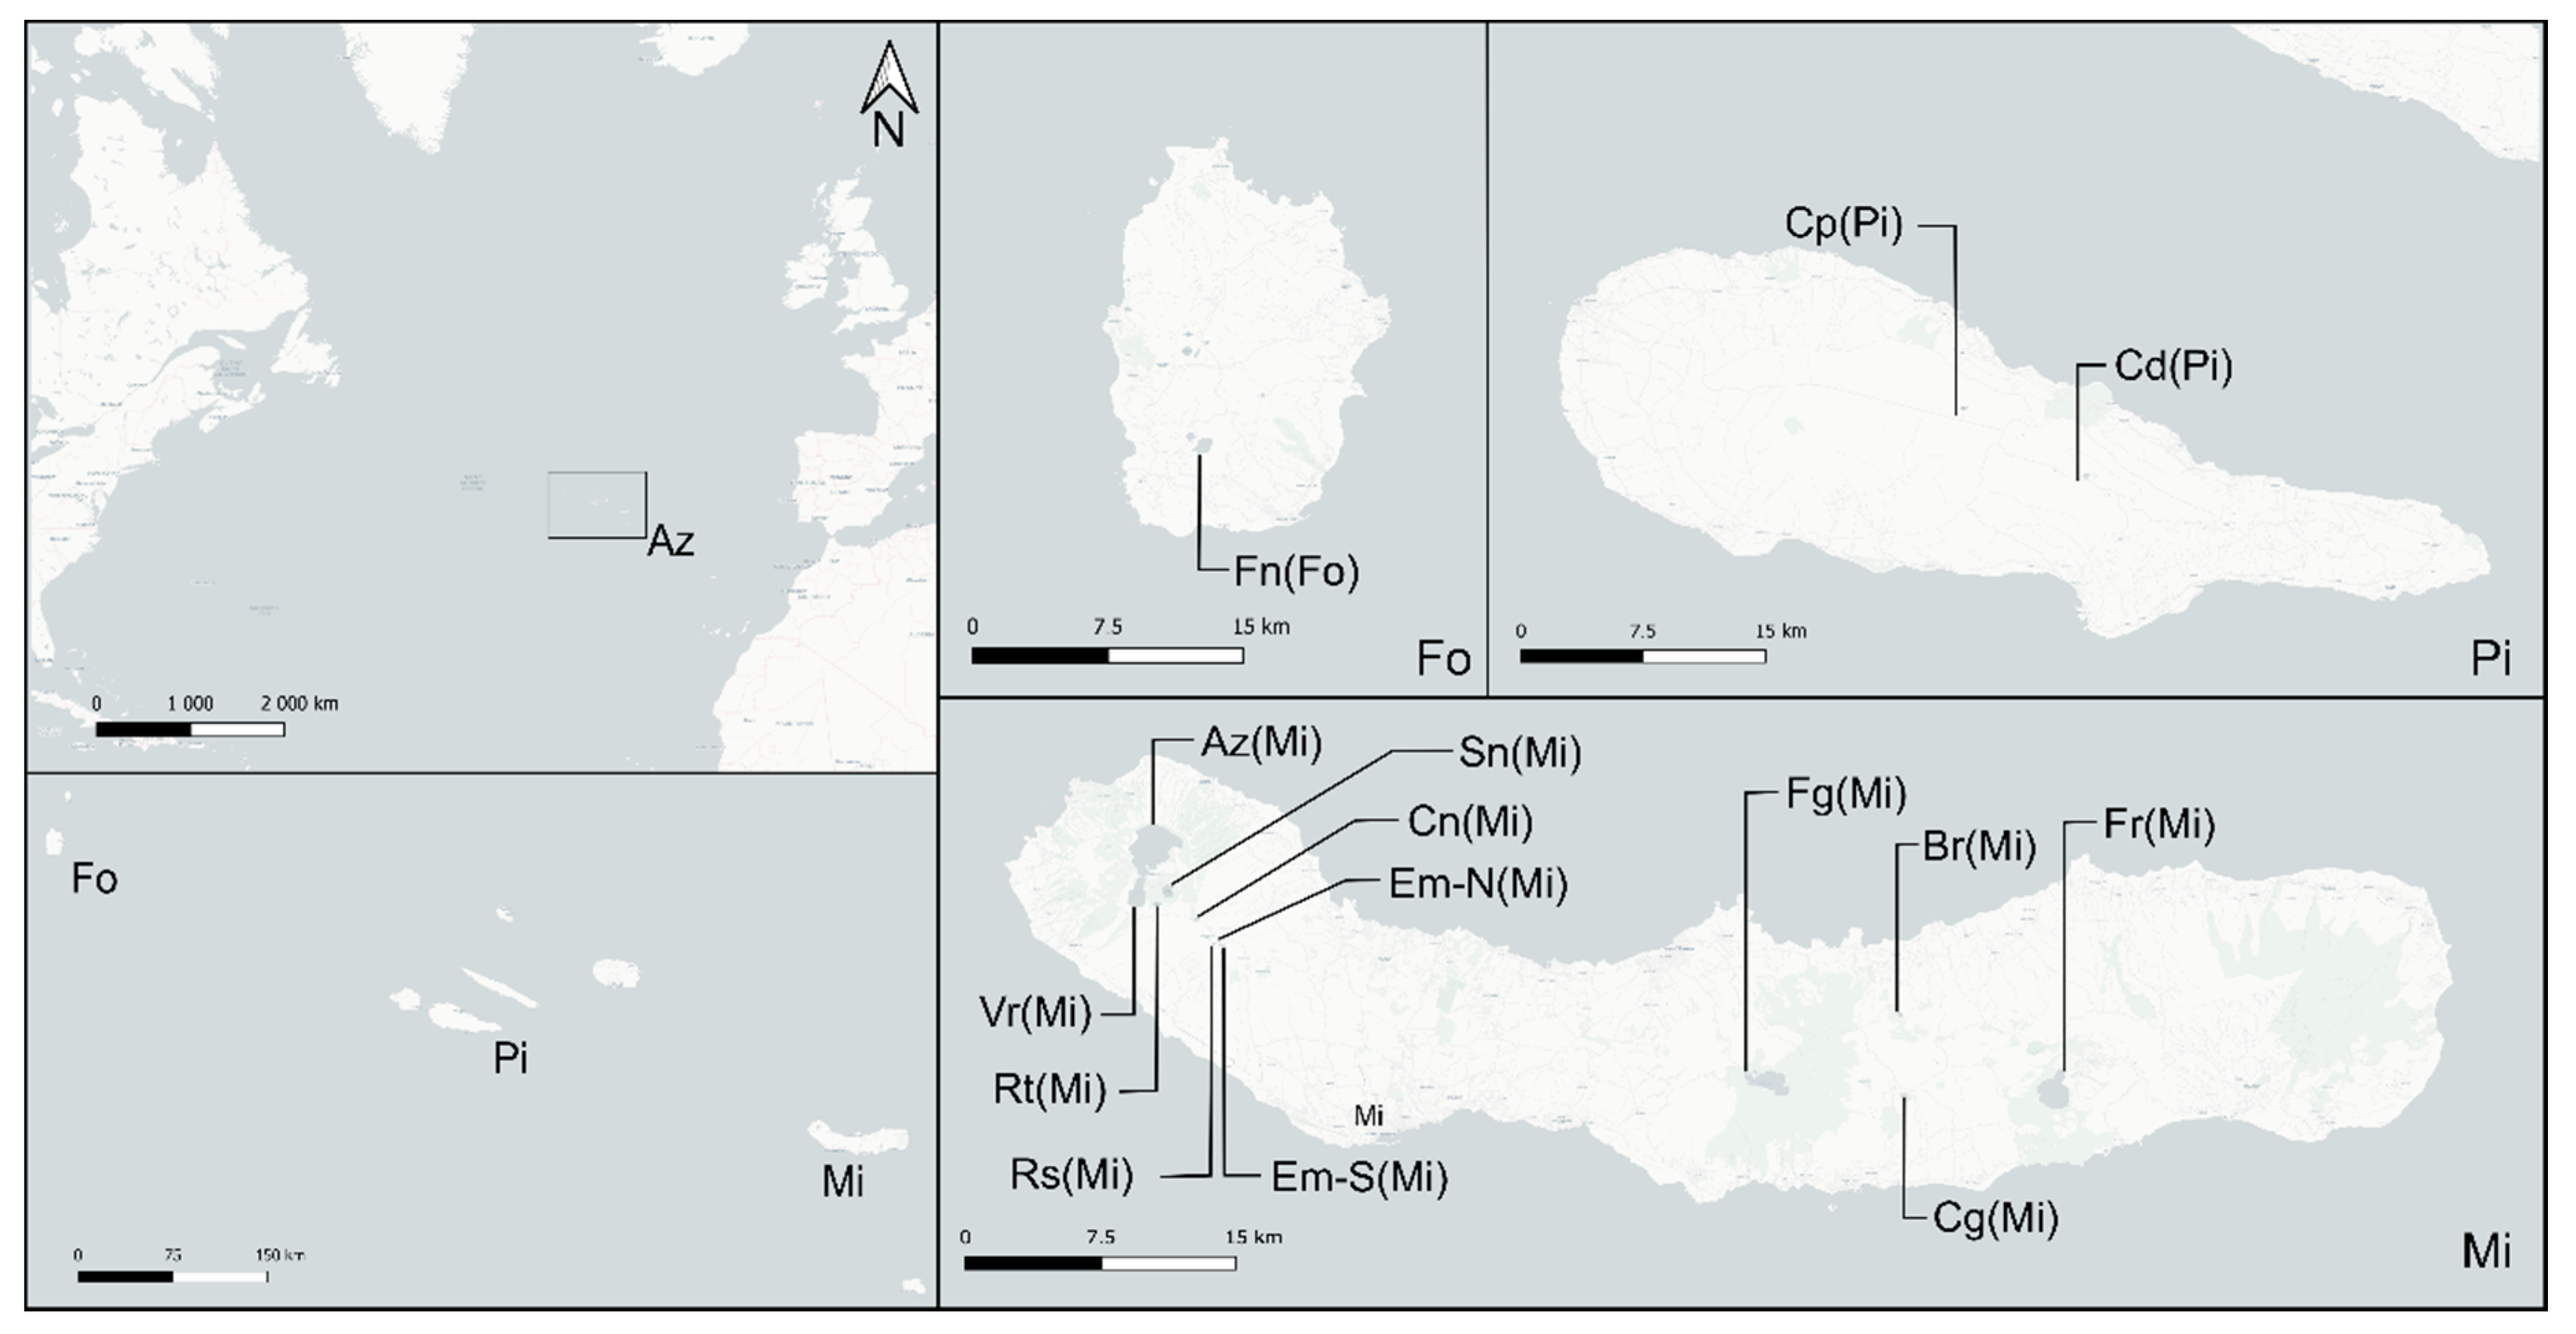
2.1. Study Site

The Azores Archipelago is located in the Northeast Atlantic Ocean, about 1300 km from Europe and 1600 km from North America. Due to its geographical dispersion, the nine volcanic islands that comprise the archipelago are divided into three groups: Eastern (Santa Maria and São Miguel), Central (Terceira, Graciosa, São Jorge, Pico, and Faial), and Western (Corvo and Flores). Influenced by their oceanic basin location, the prevalent climate in these islands is classified as oceanic temperate, with regular and abundant rainfalls and winds, low thermal amplitude, and high air humidity [46].
Despite their small size, the Azores are rich in lentic habitats, with 88 lakes mainly located in the islands of São Miguel, Pico, and Flores [47]. An increase in anthropogenic activities in the lake catchment (e.g., deforestation, agriculture, and urbanization) has resulted in the eutrophication of several lakes [30,31,48,49].
For this study, fifteen volcanic lakes from the Azores archipelago were sampled: 12 in São Miguel Island, two in Pico Island, and one in Flores Island (Figure 1). The main geographical, morphological, physical, chemical and biological properties of the studied lakes are presented in Table 1. Physical, chemical, and biological properties are presented as mean values, with standard deviation, of all campaigns. Latitude, longitude, altitude, and lake surface area data were retrieved from Pereira et al. [50].

2.2. Sample Collection and Environmental Variables

For molecular analysis plankton samples were collected from surface waters with a 10 µm net. At the same time, water samples from the photic zone were collected for phytoplankton, chlorophyll a (Chla), and chemical analysis. Sampling was carried out in October 2015, February 2016, April 2016, August 2016, and November 2016, except in lake Santiago, where the sampling was done three times (October 2015, August 2016, and November 2016).
Chla (µg L−1) was analyzed using spectrophotometric methods following the Portuguese standard 4237 [51], and the concentrations were determined according to Lorenzen [52].
At each sampling, conductivity (C, µS cm−1), dissolved oxygen (O2, mg L−1), temperature (T, °C), and pH profiles of each lake were recorded in situ using the multiparameter probe Horiba U-52 (Horiba, Pasadena, TX, USA). Water transparency (ZSD, m) was taken with a 20 cm diameter Secchi disk and maximum depth (Zmax, m) was measured with the echo sounder HUMMINBIRD 385 CI GPS (Humminbird®, Eufaula, AL, USA).
Total nitrogen and total phosphorus were determined in the laboratory at the Instituto de Inovação Tecnológica dos Açores (INOVA), according to international standard protocols [53].

2.3. Phytoplankton Analysis

For phytoplankton analyses, combined samples from the photic zone were obtained by mixing 1 L of discrete samples collected at 1 m intervals from the surface to the bottom of the euphotic zone and preserved with a 1% Lugol solution. Cyanobacteria and remaining phytoplankton biomass was based on cell or colony volume, which was estimated for individual species by assigning a geometric shape similar to that of each phytoplankton species [54]. Cell or colony dimensions were determined by measuring at least 30 cells/colonies of each species. Total species biomass was then calculated by multiplying cell/colony counts with the respective average volume. Cell and colony counts were determined with the Utermöhl method following international recommendations [54,55].
General and more specialized cyanobacteria floras were used for taxonomic identification [56,57,58]. Cyanobacteria nomenclature was updated according to Komárek et al. [59] and AlgaeBase [60].

2.4. DNA Extraction and PCR Amplification

DNA extraction was performed directly in environmental samples, after centrifugation of 6–10 mL, using the PureLinkTM Genomic DNA Mini Kit (Invitrogen, Carlsbad, CA, USA), according to the gram-negative bacteria protocol, supplied by the manufacturer. DNA samples were stored at −20 °C.
Cyanotoxin production potential was assessed by PCR, targeting genes mcyA, mcyB, mcyC, mcyD, mcyE, and mcyG for MC, sxtA for STX, anaC for ATX-a, and cyrB and cyrC for CYN. All the primer pairs used to target cyanotoxin-producing genes are listed in Table S1. PCR reactions were carried out in Biometra Tone (Analytik Jena AG, Jena, Germany), according to the literature [42,61,62,63,64,65]. All PCR amplification products were visualized by electrophoresis on 1.5% agarose gels stained with SYBR™ SAFE (0.2 g mL−1) and visualized using the transilluminator Molecular Imager® Gel Doc™ XR+ (BioRad, Hercules, CA, USA).

2.5. Statistical Analysis

Lake environmental variables (morphological, physical, and chemical characteristics), cyanobacteria biomass, and the presence of toxic strains were analyzed using PRIMER-E Software V.6 [66]. The data set was first divided into three data matrices: (i) environmental data (temperature, pH, conductivity, dissolved oxygen, total nitrogen, total phosphorus, chlorophyll a, Secchi depth, maximum depth, area, and altitude), (ii) cyanobacteria species biomass, and (iii) presence or absence of cyanotoxin-producing genes. Environmental data was normalized and cyanobacteria biomass was transformed (square root) to reduce differences in scale [67].
Distance based linear modeling (DistLM) was performed to identify if cyanobacteria biomass and diversity were associated with lakes environmental factors, testing distribution patterns between environmental variables and cyanobacteria. Analyses were run in PERMANOVA+ for PRIMER software V.6 [66,68].

3. Results

3.1. Environmental Variables

The studied Azorean lakes have a wide range of characteristics, located at mid (260–420 m) to high altitude (740–810 m), with different surface areas (0.005–3.6 km2) and depths (0.4–33.8 m). These lakes are slightly alkaline (pH 8.2 in lake Congro) to slightly acidic (pH 6.0 in lake Capitão) and have low mineralization (C from 30 ± 3 to 148 ± 13 µS cm−1), that generally decreases with altitude (Table 1). Water temperature (14.2 ± 3.0–19 ± 3.7 °C), Secchi depth (0.5 ± 0.4–3.8 ± 0.3 m), phosphorus (17.0 ± 4.4–109.4 ± 47.3 µg L−1), and chlorophyll a (1.6 ± 0.7–25.0 ± 14.6 µg L−1) also varied substantially between the sampled lakes (Table 1 and Table S2).
According to the international criteria of lake trophic status classification [69], lakes Caiado, Rasa da Serra Devassa and Rasa das Sete Cidades are oligotrophic, lakes Azul, Empadadas-N, Empadadas-S and Fogo are mesotrophic, and lakes Canário, Capitão, Congro, São Brás, Funda, Furnas, Santiago, and Verde are eutrophic.

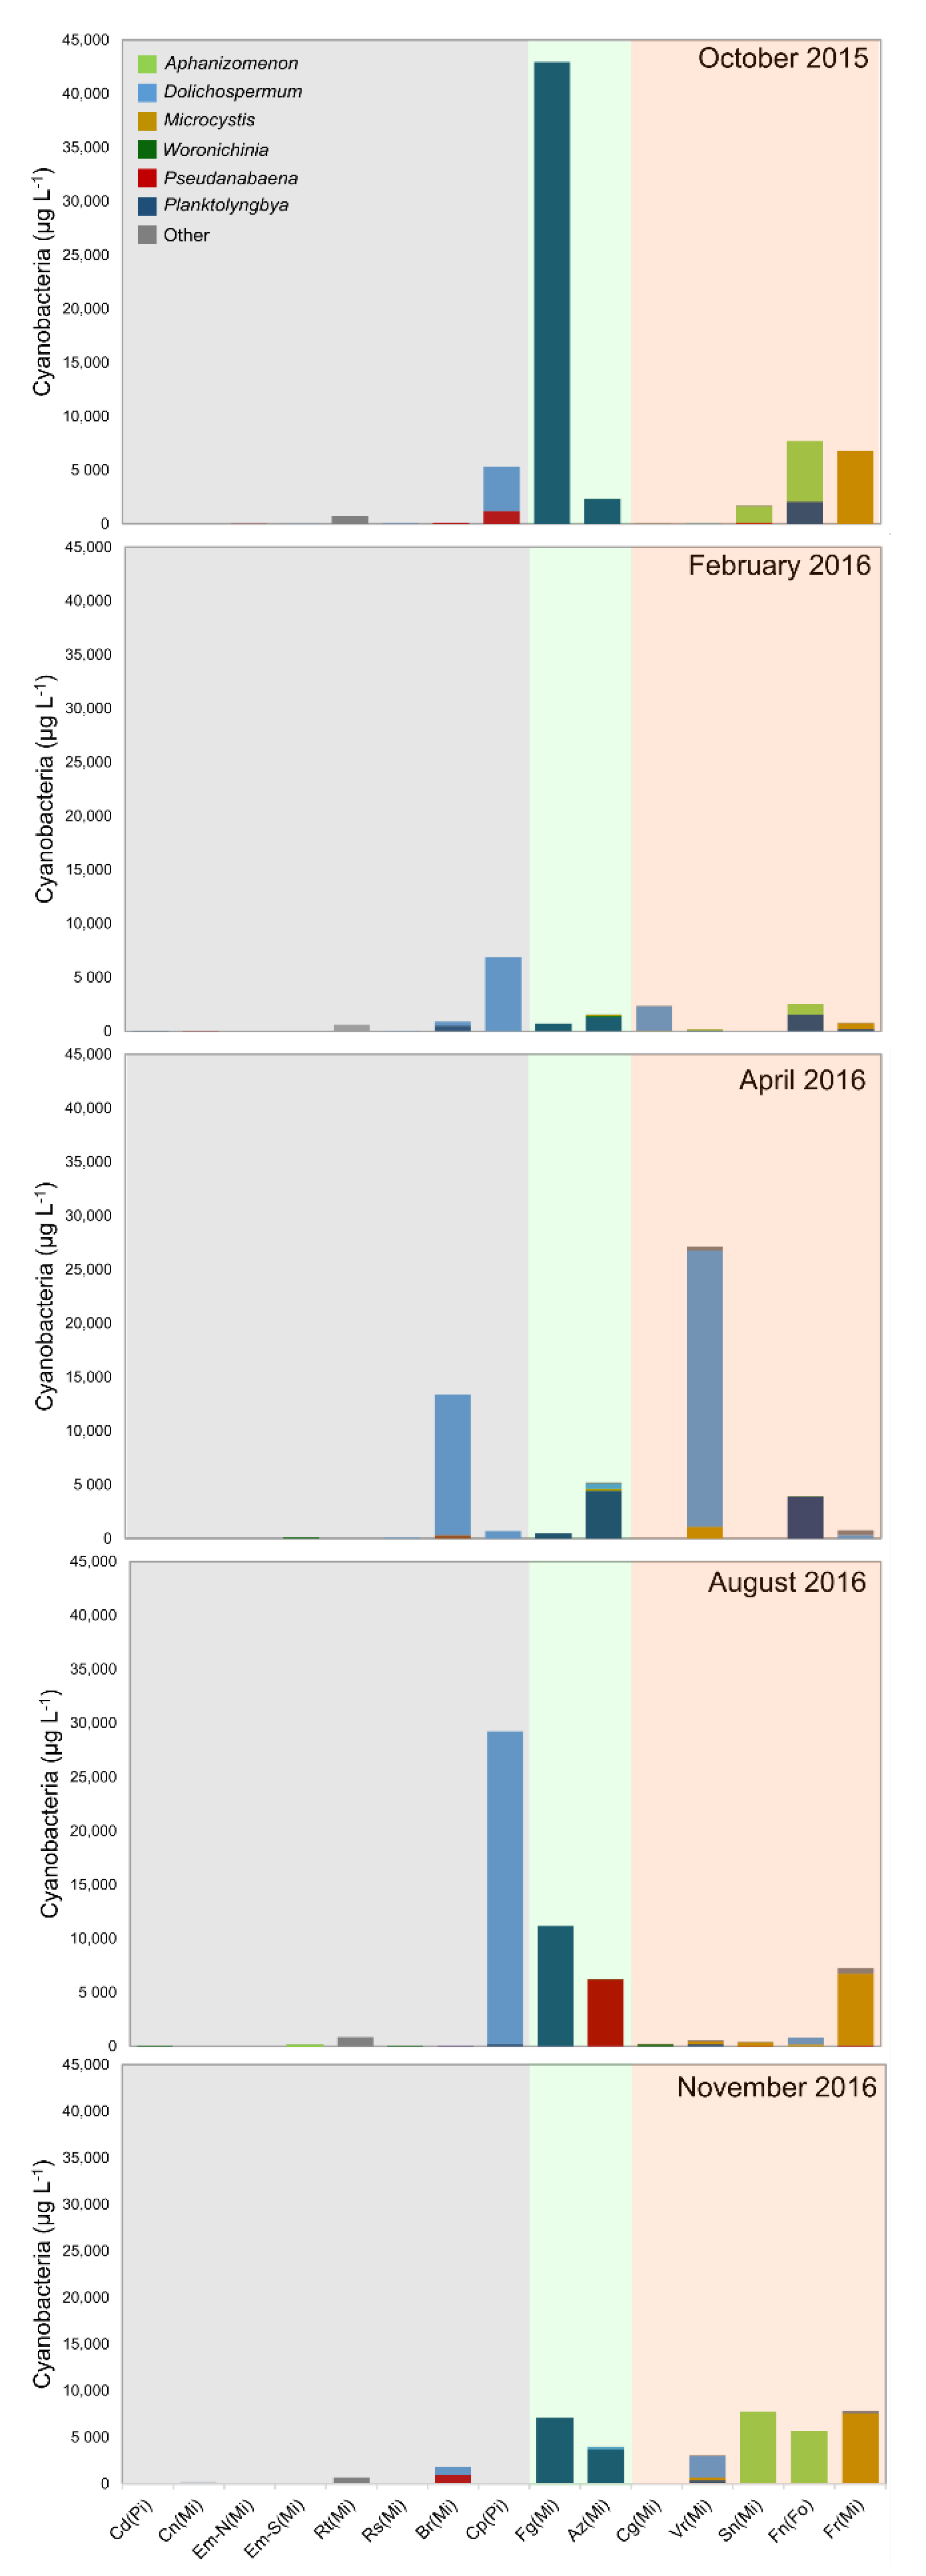
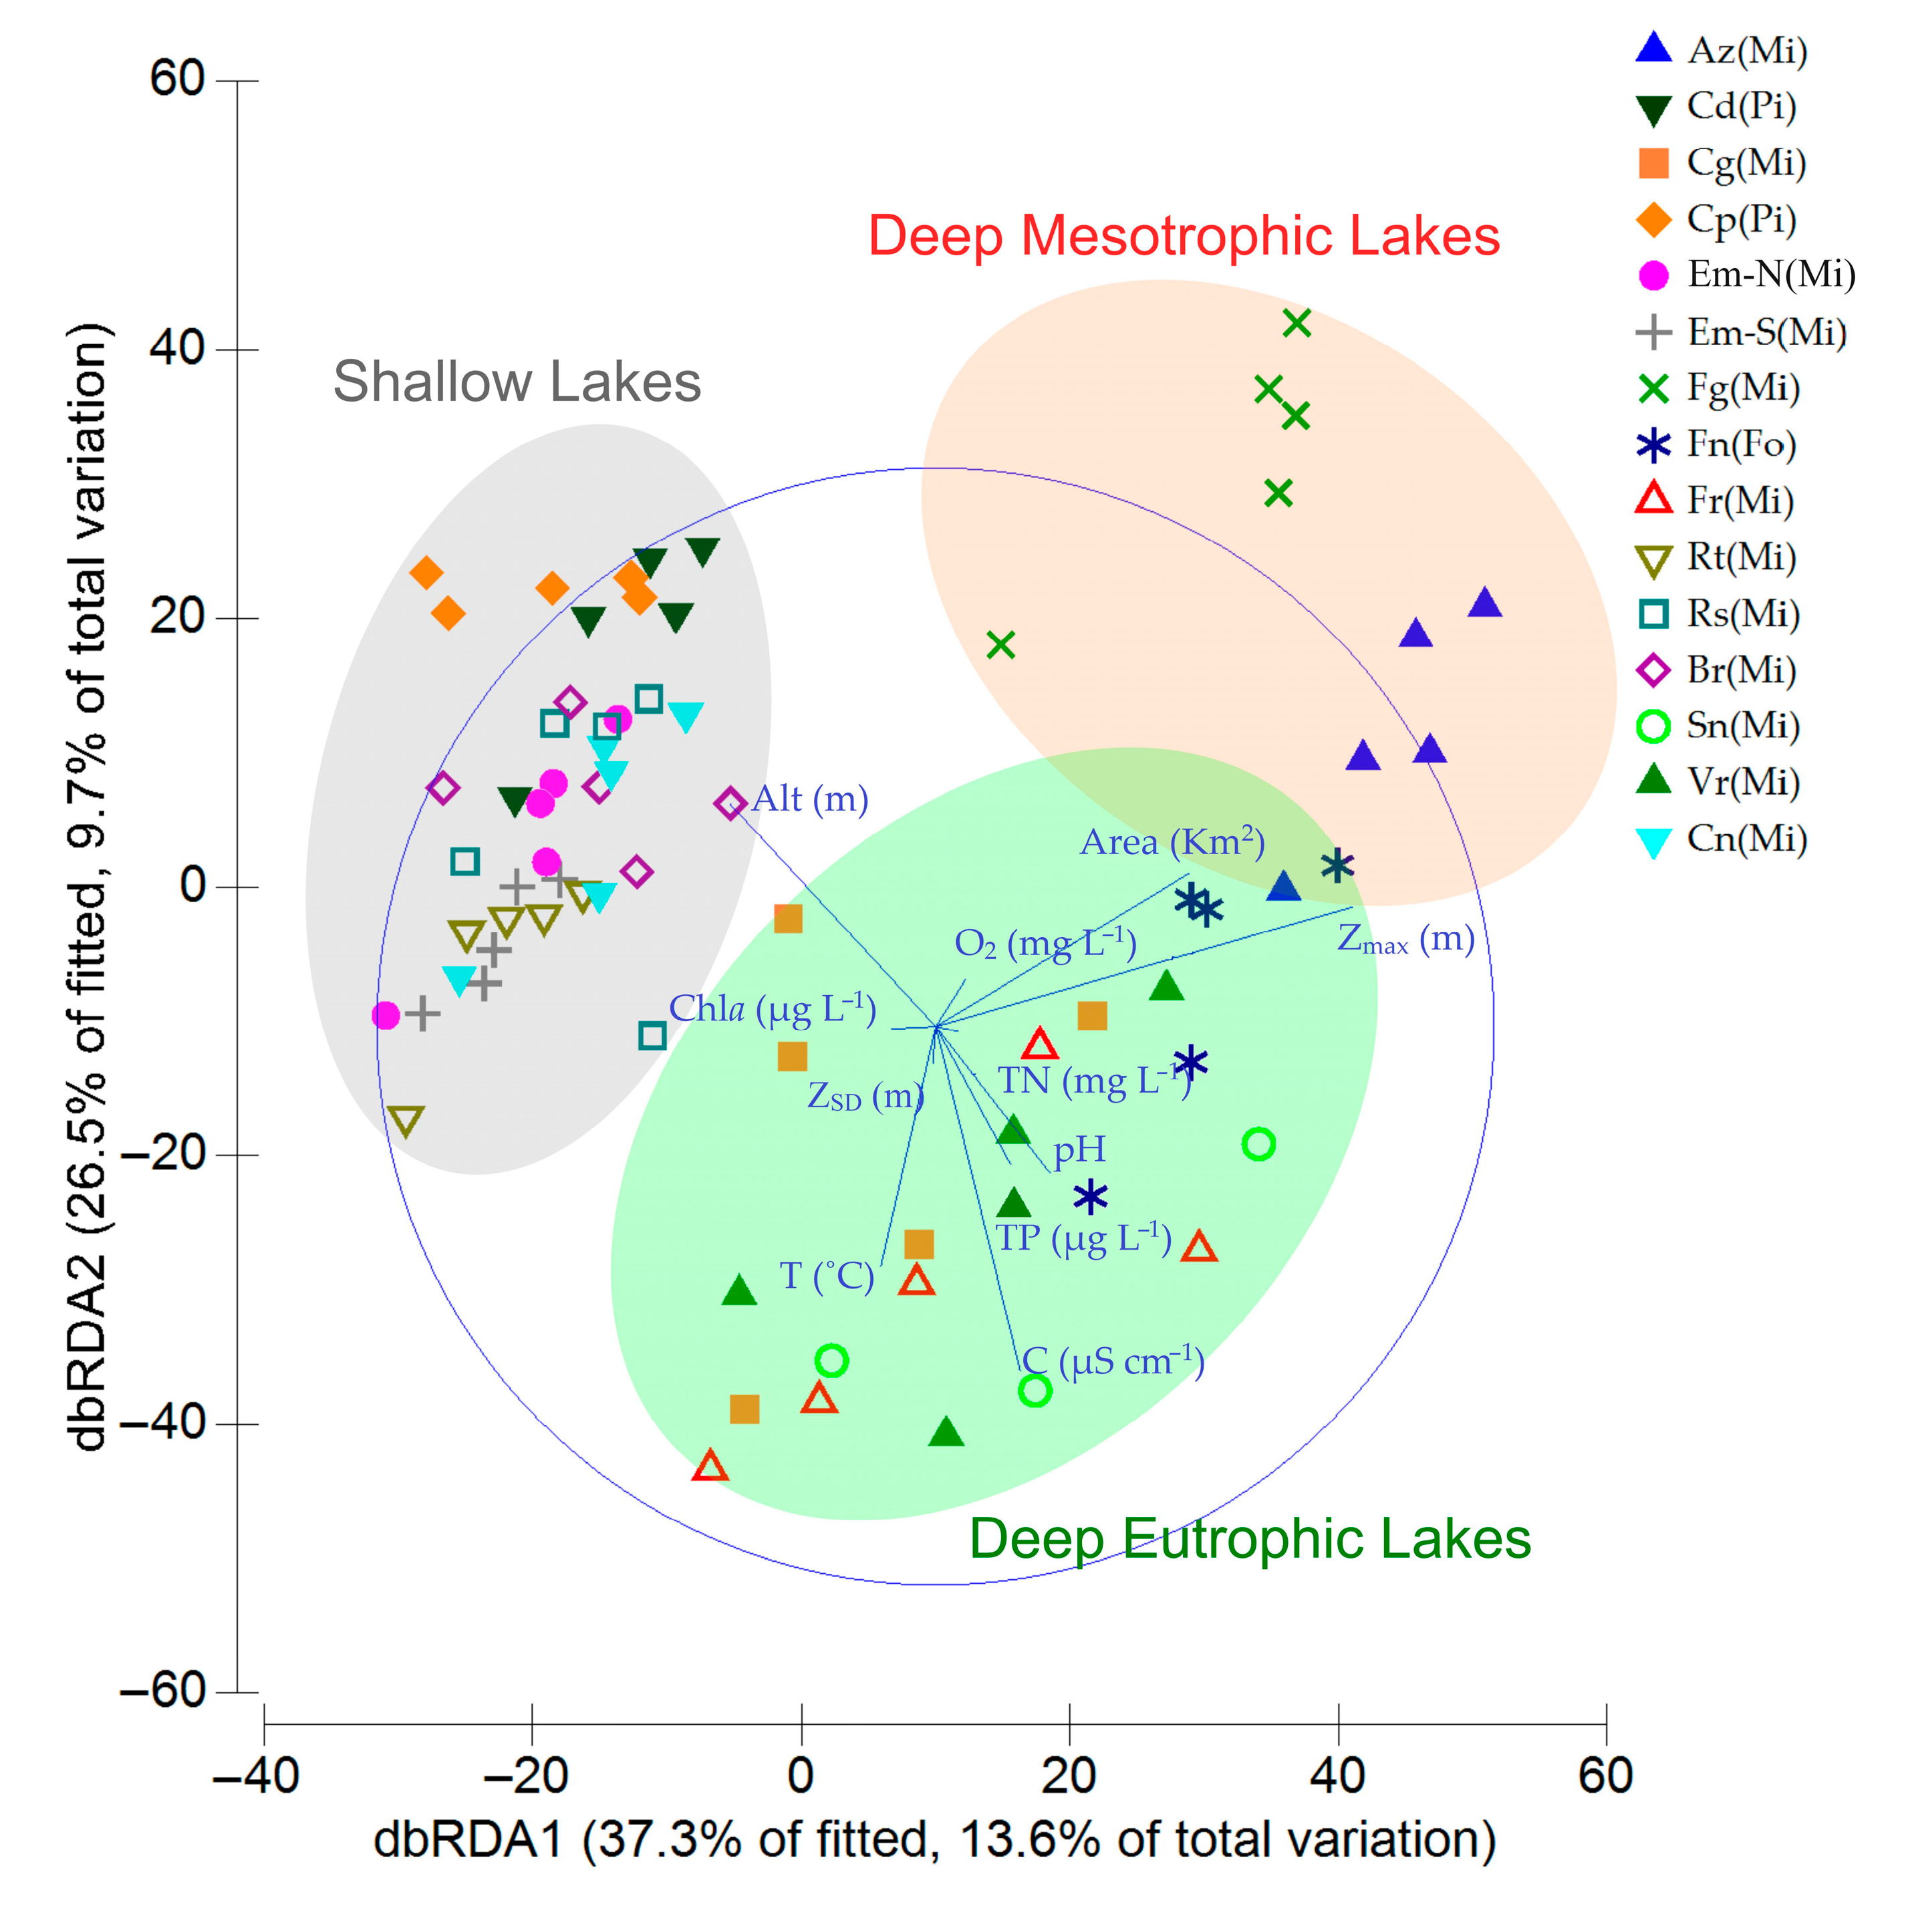
3.2. Cyanobacteria and Environmental Drivers

Fifteen cyanobacteria taxa from the orders Synechococcales, Chroococcales, Oscillatoriales, and Nostocales were observed (Tables S3 and S4). Cyanobacteria were the dominant phytoplankton group in several lakes, representing more than 50% of total phytoplankton abundance and biomass in one-third of the lakes (Tables S3 and S4). Lakes Azul, Capitão, Fogo, Furnas, Funda, Santiago, São Brás, and Verde had the highest cyanobacteria biomass, although with seasonal fluctuation (Figure 2). The dominant cyanobacteria species in these lakes were Aphanizomenon gracile, Dolichospermum planctonicum, Microcystis flos-aquae, Planktolyngbya limnetica, and Pseudanabaena limnetica (Figure 2; Tables S3 and S4).
DistLM analysis shows that maximum depth (Pseudo-F = 9.48; p = 0.001), altitude (Pseudo-F = 8.62; p = 0.001), conductivity (Pseudo-F = 8.07; p = 0.001), area (Pseudo-F = 5.59; p = 0.001), pH (Pseudo-F = 4.37; p = 0.001), total phosphorus (Pseudo-F = 2.71; p = 0.006), temperature (Pseudo-F = 2.40; p = 0.016), and chlorophyll a (Pseudo-F = 2.35; p = 0.019) are the environmental variables that better explain cyanobacteria biomass variability among lakes (Table 2). The first two axes of the model (dbRDA1 and dbRDA2) indicate that the selected environmental variables explain 23% of total variation (Figure 3). Shallow lakes located at higher elevations have negative scores on dbRDA1 (Figure 3). These lakes have lower values of conductivity and pH but contrasting values of chlorophyll a and phosphorus (Table 1). In this group (shallow lakes), lakes Capitão and São Brás have the highest’s concentration of phosphorus and chlorophyll a (Table 1) and are also the only ones with high cyanobacteria biomass, mainly Ps. limnetica and Dolichospermum (Figure 2). Contrarily, deep and larger lakes (higher values of maximum depth and surface area) are plotted on the positive side of dbRDA1, thus, dbRDA axis 1 is interpreted as a gradient of lake’s depth, which is in accordance with the typology of the Azorean lakes [70]. Deep lakes are separated into two groups along dbRDA2, separating Lakes Azul and Fogo on the positive side from the remaining deep lakes that have negative scores on this dbRDA axis 2. The main difference between these two groups is the productivity (chlorophyll a) and cyanobacteria species composition. Deep Mesotrophic lakes (Lakes Azul and Fogo) have lower chlorophyll a concentration (Table 1) and cyanobacteria are dominated by Pl. limnetica and Ps. limnetica (Figure 2). Deep eutrophic lakes (Lakes Congro, Verde, Santiago, Funda, and Furnas) have high chlorophyll a concentration (Table 1) and high biomass of cyanobacteria dominated by Aphanizomenon, Dolichospermum, and Microcystis (Figure 2).

3.3. Distribution of Cyanotoxin-Producing Genes

Microcystin, saxitoxin, and/or anatoxin-a genes were detected in most of the studied lakes. At least one group of cyanotoxin-producing genes was found in lakes Azul, Verde, São Brás, Congro, Capitão, Fogo, Funda, Furnas, Rasa das Sete Cidades, Rasa da Serra Devassa, and Santiago (Table 3). Contrarily, toxin-producing strains were absent in lakes Caiado, Canário, Empadadas-N, and Empadadas-S, as neither cyanotoxin-producing genes were detected in these lakes (Table 3).
According to the DistLM analysis, several environmental variables can explain cyanotoxins producing genes distribution among lakes (Table 2), such as conductivity (Pseudo-F = 30.43; p = 0.001), altitude (Pseudo-F = 30.40; p = 0.001), maximum depth (Pseudo-F = 13.89; p = 0.001), pH (Pseudo-F = 13.18; p = 0.001), area (Pseudo-F = 5.39; p = 0.003), chlorophyll a (Pseudo-F = 4.44; p = 0.007), and total phosphorus (Pseudo-F = 3.23; p = 0.025). The first two axes of this model (dbRDA1 and dbRDA2) show that the selected environmental variables explain 42.5% of total variation (Figure 4) and that most of the variation is along the dbRDA1 (34.5%) that represents an altitudinal gradient along which conductivity, pH, and lake area decreases with altitude (Figure 4).
Lakes located at higher altitude (545–810 m), plotted on the negative side of the dbRDA1, have low frequency of toxic cyanobacteria (0–2 samples with cyanotoxins genes). In four of those lakes (Caiado, Canário, Empadadas Norte, and Empadadas Sul), cyanotoxin genes were never detected. In the remaining five lakes of this group, only in one (Capitão, Rasa da Serra Devassa and Rasa das Sete Cidades) or two (Fogo and São Brás) samples was a single cyanotoxin gene detected (Table 3). This group of lakes was considered to have a lower toxicity risk (Figure 4). Cyanobacteria species found in these lakes were mainly Ps. limnetica, Dolicospermum sp., and Pl. limnetica.
Larger and deeper lakes that are located at lower altitude (260–420 m), associated with higher conductivity, pH, phosphorus, and/or chlorophyll a, have positive scores on dbRDA1 (Figure 4). Whereas in Lakes Furnas and Verde multiple cyanotoxin genes (MC, STX, ATX-a) were detected in all sampling campaigns and thus were considered to have higher toxicity risk, Lakes Azul, Congro, Funda, and Santiago have lower frequency (2–5 samples with cyanotoxins genes) and diversity of toxic cyanobacteria and were considered to have medium toxicity risk (Figure 4). In these two groups of lakes, the dominant cyanobacteria were Aphanizomenon gracile, Dolichospermum spp., Microcystis flos-aquae, and/or Pl. limnetica (Table 3).

4. Discussion

4.1. Toxigenic Cyanobacteria

Microcystis aeruginosa is the most studied cyanobacteria when it comes to cyanoHABs and cyanotoxins, mainly MCs [17,71]. However, MCs are known to be produced by a wider variety of cyanobacteria, as species from genera Anabaena, Aphanizomenon, Dolichospermum, Nostoc, Oscillatoria, and Tolypothrix [71]. Our results showed that MC-producing genes amplification was mainly related to M. aeruginosa and M. flos-aquae presence. In Lake Azul, the genus Microcystis is present in almost all the sampling campaigns (Tables S3 and S4); however, the amplification of MC-producing genes was not necessarily related to this genus. Other species might also be contributing, such as Dolichospermum spp., Planktolyngbya limnetica, and Woronichinia naegeliana, since samples without Microcystis had positive results for MC biosynthesis genes. Other studies have reported these species as MC producers [43,72,73,74]. In the Azores, MC has been previously reported in Lakes Azul, Congro, Furnas, São Brás, and Verde, by molecular methods [40] and by analytical methods (high-performance liquid chromatography—HPLC) [30,36]. In Portuguese freshwaters, the presence of MC has been reported since the 1990s [75], and according to Menezes et al. [76], a high diversity of toxic cyanobacteria species has also been reported, being the most prevalent genera Aphanizomenon, Dolichospermum, and Microcystis, just as observed in this work.
For ATX-a, amplification of gene anaC seems to be mainly related to the presence of A. gracile, D. planctonicum, and M. aeruginosa, known ATX-a producers [43,77] (Tables S4 and S5). ATX-a was never reported in the Azores; however, on Portugal’s mainland, some studies already suggested the presence of this toxin. Osswald et al. [77], although without toxin identification in environmental samples, reported isolated strains from genus Anabaena, Aphanizomenon, Microcystis, and Oscillatoria as ATX-a producers. Moreira et al. [28] identified ATX-a (ELISA: Enzyme-Linked Immunosorbent Assay) and the anaC gene in some environmental samples (freshwater).
Contrary to the previous study performed in 2008 to detect STX production potential in the Azorean lakes, where no positive results were found [40], we detected STX genes in most of the studied lakes (Lakes Azul, São Brás, Congro, Fogo, Funda, Furnas, Rasa das Sete Cidades, Santiago, and Verde). In our study, sxtA gene amplification was mostly related to the presence of A. gracile, a known STX producer [42,78,79]. However, A. gracile may not be the only species with the sxtA gene in this set of lakes, as seen by the positives results in lakes where this species was not observed (Table S5). On the other hand, in Lake Santiago, where this species is present in high abundance throughout the year, the sxtA gene was not amplified in August 2016 (Table S5). These results suggest that the relative abundance of toxigenic and non-toxigenic strains from the same species may depend on a synergy between environmental conditions (e.g., temperature [18,80], phosphorus, light intensity, CO2), as reported by several authors [7,18,80,81,82,83].
As reported in the literature, by several authors, toxic strains are not morphologically different from non-toxic strains [18,84]; however, through molecular methods, it is possible to identify which strains have the genes responsible for cyanotoxin production [16,29,84]. The presence of the sxtA gene in Lakes São Brás, Capitão, and Furnas may be related to species that might have the gene and be potential STX producers, not described in the literature. For instance, several cyanobacteria species have been reported, more recently, as saxitoxin producers, such as Anagnostidinema amphibium, Anagnostidinema lemmermannii, Cylindrospermum stagnale, and Phormidium uncinatum [85]. In Lake Rasa da Serra Devassa, the presence of sxtA in the sample from February 2016 (Table S5) might be due to unknown STX producing strains of Dolichospermum (Table S4). In Portugal’s mainland, STX has been reported, similarly to ATX-a, with an identification of a producing strain of Aphanizomenon flos-aquae [86] and identification of SXT through ELISA and identification of biosynthesis genes (sxtG and sxtI) in some environmental samples [28].
CYN production potential was not found in our samples; however, in a previous study, the cyrB and cyrC genes were amplified in lake São Brás and lake Azul, respectively [40]. Furthermore, no other records of CYN detection (identification or quantification) or producing gene amplification in these lakes have been published. CYN has been reported to be produced by several species, including A. gracile [87], Crysosporum ovalisporum [88,89], Raphidiopsis raciborskii [65,90], D. planctonicum [43], and Raphidiopsis curvata [44]. In this work from the observed species, only D. planctonicum and A. gracile are potential CYN producers. Previous reports of R. curvata [91] and unidentified Aphanizomenon species [36] might also indicate CYN potential production in the Azores. In contrast, in Portugal’s mainland, Moreira et al. [92] reported the first identification of CYN (by HPLC, ELISA, and cyrC amplification) in lake Vela (Figueira da Foz, Portugal), likely associated with the regular presence of R. raciborskii in high abundance. Lakes with “High Toxicity Risk”, where cyanotoxin production potential was identified in all or most of the samples (Figure 4; Table 3), are related to the observation of known toxic cyanobacteria (e.g., Aphanizomenon gracile, Dolichospermum spp., Microcystis flos-aquae, and Pl. limnetica) and associated mainly to the lake’s morphometrics (depth, area, and altitude), as well as temperature, pH, conductivity and/or chlorophyll a. These synergies are supported by the DistLM analysis (Figure 4; Table 2) and reinforced by the literature [7,41,93,94]. Some studies also confirm that toxic strain blooms and toxin release are enhanced by temperature, in interaction with other factors such as nutrients and light absorption [2,7,10,18,20,93].

4.2. Environmental Drivers of Cyanobacteria Occurrence and Cyanotoxins Production Potential

Most of the studied lakes are surrounded by agricultural/cattle fields and forested/recreational activities areas that promote eutrophication [30,31,33,36]. Anthropogenic effects in the Azorean lakes have impacted the lake’s trophic state. In fact, according to Cruz et al. [31], eutrophication is a serious issue in the Azores archipelago since the ’80s, besides the many efforts and mitigations measures applied. However, eutrophication in the Azorean lakes is not equally distributed among lake types. Lake types were defined in the Azores based on common European typology schemes, according to the Water Framework Directive (WFD) [95], and two lake types were designated: Type B-L-M/MI-MP/S/P includes deep lakes, warm monomictic, small to median surface area, located at median altitude inside volcanic calderas or maars; Type B-L-M/MI/S/PP comprehends shallow lakes, without summer stratification, very small and located at high altitude inside scoria cone craters, tectonic or topographic depressions [70]. Due to their location at lower altitudes, deep lakes are more exposed to human activities and most of them have become eutrophic [31,36]. Moreover, lower altitude lakes have larger catchments where the increase in water-rock interaction results in higher values of conductivity and nutrients [96].
The distribution of cyanobacteria and toxigenic species in the studied lakes follows, generally, the typology of the Azorean lakes, and, thus, geographical (altitude) and hydromorphological (deep and area) characteristics seem to be more important drivers of cyanobacteria in these lakes than other environmental variables, such as pH or nutrients (Table 2). Altitude, lake’s area, and depth have already been shown to be important drivers of cyanobacteria distribution, e.g., [96,97]. The importance of these variables could be explained by differences in water retention time, mixing regime [97], and temperature [98,99], among other factors. Nevertheless, eutrophication still is an important driver of cyanobacteria species composition, biomass, and toxicity inside each type of the Azorean lakes.
Although the mesotrophic lakes Fogo and Azul, included in the deep type, have high cyanobacteria biomass, the dominant species are the Oscillatoriales Pl. limnetica, and Ps. limnetica and these lakes only occasionally have toxigenic potential. These species have been found to occur in several lake types and trophy [100] but were found to be dominant in some deep mesotrophic lakes [98,99]. Contrarily, the deep eutrophic lakes (Congro, Funda, Furnas, Santiago, and Verde) present higher cyanobacteria diversity, mostly dominated by Microcystis spp., Dolichospemum spp., and A. gracile. All these cyanobacteria are well known to dominate in deep stratified eutrophic lakes [98,101,102] where their buoyancy, low light toleration, and ability to fix atmospheric nitrogen gives them competitive advantages over other cyanobacteria and microalgae [1,3,8]. In the deep, larger, and eutrophic lakes Congro, Funda, Furnas, Santiago, and Verde, MC, STX, and/or ATX-a production potential were identified simultaneously and in almost all sampling campaigns, despite season fluctuations in environmental conditions (e.g., temperature, pH, nutrients), reinforcing the importance of geographical and hydromorphological variables in the distribution of toxic cyanobacteria. In these lakes, nutrients and temperature conditions are probably suitable for the maintenance of cyanobacteria toxigenic strains throughout the year. The climate in the Azores is characterized as oceanic temperate, constant throughout the year with low thermal amplitude [46], hence the absence of strong seasonal impacts on cyanobacteria dynamics (diversity and biomass), despite some effects on lakes dynamics (e.g., stratification, nutrients run-off). Furthermore, the lower altitude location of lakes Azul, Congro, Funda, Furnas, Santiago, and Verde is related to higher temperatures and longer water column stratification [31], characteristics that could lead to the exponential growth of cyanobacteria [33]. As stated before, toxigenic cyanobacteria species such as A. gracile, M. aeruginosa, M. flos-aquae, and/or D. planctonicum persist in these lakes throughout the year.
Shallow lakes located at higher altitudes, with lower temperature, pH, and conductivity, have low cyanobacteria biomass, except for the eutrophic lakes Capitão and São Brás (Figure 2; Table 1). The low abundance and biomass of cyanobacteria are common in shallow oligotrophic and mesotrophic lakes worldwide [89,103]. Contrarily, the shallow eutrophic lakes Capitão and São Brás have high cyanobacteria biomass (Figure 2, Table 3), dominated mainly by Ps. limnetica and Dolichospermum sp. (Table 3). These two lakes, despite their higher altitude location, are surrounded by cattle fields and forested areas with anthropogenic influences, contributing to nutrients discharges leading to eutrophication and cyanobacteria extreme proliferation [3,104]. Phosphorus high concentration in Lakes Capitão and São Brás may be related to their elevated cyanobacteria biomass (Tables S2 and S4). As shown by the literature, the proliferation of cyanobacteria in eutrophic lakes is often associated with the rise of phosphorus concentration, mainly on account of anthropogenic effects [33,104,105].

5. Conclusions

Toxin-producing cyanobacteria were detected in most lakes through the detection of cyanotoxin-producing genes mcyA, mcyB, mcyC, mcyD, mcyE, mcyG, sxtA, and anaC. Lakes Azul, Verde, Furnas, Santiago, Congro (São Miguel Island), and Lake Funda (Flores Island), are the ones with higher cyanobacterial biomass and species diversity, and with high toxicity risk, where cyanotoxins production potential was frequently identified. Aphanizomenon gracile, D. planctonicum, M. aeruginosa, M. flos-aquae, and Ps. limnetica are the most prevalent species and might be the potential producers for MC, STX, and/or ATX-a. Isolation and cultivation of cyanobacteria strains from these lakes should be done to determine which strains are MC, STX, and/or ATX-a producers.
Cyanobacteria distribution seemed to be mainly related to lake typology (lake’s depth, size, and altitude), although species composition and biomass vary in each lake type according to the trophic status. Altitude was found to be the main driver of toxic cyanobacteria distribution, with lakes located at high altitudes presenting low toxicity risk and lakes located at low altitude having high toxicity risk.
With the present study, we report for the first time the presence of genes anaC and sxtA and therefore the production potential of ATX-a and STX in lakes of the Azores islands.

Supplementary Materials

The following are available online at https://www.mdpi.com/2073-4441/12/12/3385/s1. Table S1: Primers used to detect cyanotoxin-producing genes. Table S2: Environmental variables of sampled lakes by sampling campaign. Table S3: Cyanobacteria species abundance (cells mL−1) of sampled lakes by sampling campaign. Table S4: Cyanobacteria biomass (µg L−1) of sampled lakes by sampling campaign. Table S5: PCR results for the detection of microcystin, saxitoxin, anatoxin-a, and cylindrospermopsin, of sampled lakes by sampling campaign.

Author Contributions

Conceptualization, R.C., V.V., A.F. and V.G.; methodology, R.C., V.G. and A.F.; investigation, R.C., R.L. and J.V.; writing—original draft preparation, R.C.; writing—review and editing, R.C., R.L. and V.G.; supervision, V.V., A.F. and V.G.; project administration, V.G.; funding acquisition, V.V., A.F. and V.G. All authors have read and agreed to the published version of the manuscript.

Funding

R.C. was supported by a Ph.D. grant (M3.1.a/F/017/2015) from the Fundo Regional da Ciência e Tecnologia (FRCT). This work was funded by the GESTAQUA project (Nº 46/DRA/2014) and FEDER funds through the Interreg-MAC 2014–2020 program under the REBECA project—Red de excelencia en biotecnología azul (algas) de la región macaronesia (MAC/1.1a/060). This work was also funded by Portuguese National Funds, through FCT—Fundação para a Ciência e a Tecnologia, the European Union, QREN, FEDER, COMPETE, by funding from the CIBIO/InBIO (project UID/BIA/50027/2013 and POCI-01-0145-FEDER-006821). V.V. is funded by FCT under UIDB/04423/2020 and UIDP/04423/2020.

Acknowledgments

We thank the Freshwater Ecology Research Group from the CIBIO-Azores for all the help in the fieldwork.

Conflicts of Interest

The authors declare no conflict of interest. The funders had no role in the design of the study; in the collection, analyses, or interpretation of data; in the writing of the manuscript, or in the decision to publish the results.

References

  1. Paerl, H.W.; Otten, T.G. Harmful cyanobacterial blooms: Causes, consequences, and controls. Microb. Ecol. 2013, 65, 995–1010. [Google Scholar] [CrossRef] [PubMed]
  2. Glibert, P.M. Harmful algae at the complex nexus of eutrophication and climate change. Harmful Algae 2020, 91, 101583. [Google Scholar] [CrossRef]
  3. O’Neil, J.M.; Davis, T.W.; Burford, M.A.; Gobler, C.J. The rise of harmful cyanobacteria blooms: The potential roles of eutrophication and climate change. Harmful Algae 2012, 14, 313–334. [Google Scholar] [CrossRef]
  4. Townhill, B.L.; Tinker, J.; Jones, M.; Pitois, S.; Creach, V.; Simpson, S.D.; Dye, S.; Bear, E.; Pinnegar, J.K. Harmful algal blooms and climate change: Exploring future distribution changes. ICES J. Mar. Sci. 2018, 75, 1882–1893. [Google Scholar] [CrossRef] [Green Version]
  5. Paerl, H. Mitigating toxic planktonic cyanobacterial blooms in aquatic ecosystems facing increasing anthropogenic and climatic pressures. Toxins 2018, 10, 76. [Google Scholar] [CrossRef] [Green Version]
  6. Vasconcelos, V. Global changes and the new challenges in the research on cyanotoxin risk evaluation. Limnetica 2015, 34, 149–158. [Google Scholar] [CrossRef]
  7. Mantzouki, E.; Lürling, M.; Fastner, J.; Domis, L.D.S.; Wilk-Woźniak, E.; Koreivienė, J.; Seelen, L.; Teurlincx, S.; Verstijnen, Y.; Krztoń, W.; et al. Temperature Effects Explain Continental Scale Distribution of Cyanobacterial Toxins. Toxins 2018, 10, 156. [Google Scholar] [CrossRef] [Green Version]
  8. Huisman, J.; Codd, G.A.; Paerl, H.W.; Ibelings, B.W.; Verspagen, J.M.H.; Visser, P.M. Cyanobacterial blooms. Nat. Rev. Microbiol. 2018, 16, 471–483. [Google Scholar] [CrossRef]
  9. Mantzouki, E.; Visser, P.M.; Bormans, M.; Ibelings, B.W. Understanding the key ecological traits of cyanobacteria as a basis for their management and control in changing lakes. Aquat. Ecol. 2016, 50, 333–350. [Google Scholar] [CrossRef]
  10. Paerl, H.W.; Huisman, J. Climate change: A catalyst for global expansion of harmful cyanobacterial blooms. Environ. Microbiol. Rep. 2009, 1, 27–37. [Google Scholar] [CrossRef]
  11. Paerl, H.W.; Huisman, J. Blooms Like It Hot. Climate 2008, 320, 57–58. [Google Scholar] [CrossRef] [Green Version]
  12. Lürling, M.; Eshetu, F.; Faassen, E.J.; Kosten, S.; Huszar, V.L.M. Comparison of cyanobacterial and green algal growth rates at different temperatures. Freshw. Biol. 2013, 58, 552–559. [Google Scholar] [CrossRef]
  13. Du, X.; Liu, H.; Yuan, L.; Wang, Y.; Ma, Y.; Wang, R.; Chen, X.; Losiewicz, M.D.; Guo, H.; Zhang, H. The diversity of cyanobacterial toxins on structural characterization, distribution and identification: A systematic review. Toxins 2019, 11, 530. [Google Scholar] [CrossRef] [Green Version]
  14. He, X.; Liu, Y.-L.; Conklin, A.; Westrick, J.; Weavers, L.K.; Dionysiou, D.D.; Lenhart, J.J.; Mouser, P.J.; Szlag, D.; Walker, H.W. Toxic cyanobacteria and drinking water: Impacts, detection, and treatment. Harmful Algae 2016, 54, 174–193. [Google Scholar] [CrossRef]
  15. Sivonen, K.; Jones, G. Cyanobacterial Toxins. In Toxic Cyanobacteria in Water: A Guide to Their Public Health Consequences, Monitoring, and Management; Chorus, I., Bartram, J., Eds.; F & FN Spon, WHO: London, UK, 1999; pp. 41–111. [Google Scholar]
  16. Ramos, V.; Moreira, C.; Mankiewicz-Boczek, J.; Vasconcelos, V. Application of molecular tools in monitoring cyanobacteria and their potential toxin production. In Molecular Tools for the Detection and Quantification of Toxigenic Cyanobacteria; Kurmayer, R., Sivonen, K., Wilmotte, A., Salmaso, N., Eds.; John Wiley and Sons Ltd.: West Sussex, UK, 2017. [Google Scholar]
  17. Codd, G.A.; Meriluoto, J.; Metcalf, J.S. Introduction: Cyanobacteria, Cyanotoxins, Their Human Impact, and Risk Management. In Handbook of Cyanobacterial Monitoring and Cyanotoxin Analysis; Codd, G.A., Meriluoto, J., Metcalf, J.S., Eds.; John Wiley & Sons, Ltd.: Chichester, UK, 2017; pp. 1–8. [Google Scholar]
  18. Davis, T.W.; Berry, D.L.; Boyer, G.L.; Gobler, C.J. The effects of temperature and nutrients on the growth and dynamics of toxic and non-toxic strains of Microcystis during cyanobacteria blooms. Harmful Algae 2009, 8, 715–725. [Google Scholar] [CrossRef]
  19. Cirés, S.; Casero, M.C.; Quesada, A. Toxicity at the edge of life: A review on cyanobacterial toxins from extreme environments. Mar. Drugs 2017, 15, 233. [Google Scholar] [CrossRef]
  20. Walls, J.T.; Wyatt, K.H.; Doll, J.C.; Rubenstein, E.M.; Rober, A.R. Hot and toxic: Temperature regulates microcystin release from cyanobacteria. Sci. Total Environ. 2018, 610–611, 786–795. [Google Scholar] [CrossRef]
  21. Omidi, A.; Esterhuizen-Londt, M.; Pflugmacher, S. Still challenging: The ecological function of the cyanobacterial toxin microcystin—What we know so far. Toxin Rev. 2018, 37, 87–105. [Google Scholar] [CrossRef] [Green Version]
  22. Osswald, J.; Rellán, S.; Gago, A.; Vasconcelos, V. Toxicology and detection methods of the alkaloid neurotoxin produced by cyanobacteria, anatoxin-a. Environ. Int. 2007, 33, 1070–1089. [Google Scholar] [CrossRef]
  23. Renaud, S.L.; Pick, F.R.; Fortin, N. Effect of Light Intensity on the Relative Dominance of Toxigenic and Nontoxigenic Strains of Microcystis aeruginosa. Appl. Environ. Microbiol. 2011, 77, 7016–7022. [Google Scholar] [CrossRef] [Green Version]
  24. Wood, S.A.; Smith, F.M.J.; Heath, M.W.; Palfroy, T.; Gaw, S.; Young, R.G.; Ryan, K.G. Within-mat variability in anatoxin-a and homoanatoxin-a production among benthic Phormidium (cyanobacteria) strains. Toxins 2012, 4, 900–912. [Google Scholar] [CrossRef] [Green Version]
  25. Christiansen, G.; Molitor, C.; Philmus, B.; Kurmayer, R. Nontoxic Strains of Cyanobacteria are the Result of Major Gene Deletion Events Induced by a Transposable Element. Mol. Biol. Evol. 2008, 25, 1695–1704. [Google Scholar] [CrossRef]
  26. Fathalli, A.; Jenhani, A.B.R.; Moreira, C.; Welker, M.; Romdhane, M.; Antunes, A.; Vasconcelos, V. Molecular and phylogenetic characterization of potentially toxic cyanobacteria in Tunisian freshwaters. Syst. Appl. Microbiol. 2011, 34, 303–310. [Google Scholar] [CrossRef]
  27. Feio, M.J.; Filipe, A.F.; Garcia-Raventós, A.; Ardura, A.; Calapez, A.R.; Pujante, A.M.; Mortágua, A.; Múrria, C.; Diaz-de-Quijano, D.; Martins, F.M.; et al. Advances in the use of molecular tools in ecological and biodiversity assessment of aquatic ecosystems. Limnetica 2020, 39, 419–440. [Google Scholar] [CrossRef]
  28. Moreira, C.; Gomes, C.; Vasconcelos, V.; Antunes, A. Cyanotoxins occurrence in Portugal: A new report on their recent multiplication. Toxins 2020, 12, 154. [Google Scholar] [CrossRef] [Green Version]
  29. Moreira, C.; Ramos, V.; Azevedo, J.; Vasconcelos, V. Methods to detect cyanobacteria and their toxins in the environment. Appl. Microbiol. Biotechnol. 2014, 98, 8073–8082. [Google Scholar] [CrossRef]
  30. Santos, M.C.R.; Muelle, H.; Pacheco, D.M.D. Cyanobacteria and microcystins in lake Furnas (S. Miguel island-Azores). Limnetica 2012, 31, 107–118. [Google Scholar] [CrossRef]
  31. Cruz, J.V.; Pacheco, D.; Porteiro, J.; Cymbron, R.; Mendes, S.; Malcata, A.; Andrade, C. Sete Cidades and Furnas lake eutrophication (São Miguel, Azores): Analysis of long-term monitoring data and remediation measures. Sci. Total Environ. 2015, 520, 168–186. [Google Scholar] [CrossRef]
  32. Vasconcelos, V.M. Eutrophication, toxic cyanobacteria and cyanotoxins: When ecosystems cry for help. Limnetica 2006, 25, 425–432. [Google Scholar] [CrossRef]
  33. Watson, S.B.; Miller, C.; Arhonditsis, G.; Boyer, G.L.; Carmichael, W.; Charlton, M.N.; Confesor, R.; Depew, D.C.; Höök, T.O.; Ludsin, S.A.; et al. The re-eutrophication of Lake Erie: Harmful algal blooms and hypoxia. Harmful Algae 2016, 56, 44–66. [Google Scholar] [CrossRef]
  34. Beversdorf, L.J.; Weirich, C.A.; Bartlett, S.L.; Miller, T.R. Variable cyanobacterial toxin and metabolite profiles across six eutrophic lakes of differing physiochemical characteristics. Toxins 2017, 9, 62. [Google Scholar] [CrossRef] [Green Version]
  35. Cordeiro, R.; Luz, R.; Vasconcelos, V.; Fonseca, A.; Gonçalves, V. A Critical Review of Cyanobacteria Distribution and Cyanotoxins Occurrence in Atlantic Ocean Islands. Cryptogam. Algol. 2020, 41, 73–89. [Google Scholar] [CrossRef]
  36. Santos, M.C.R.; Pacheco, D.M.M.; Santana, F.; Muelle, H. Cyanobacteria blooms in Sete-Cidades lake—(S. Miguel Island-Azores). Arch. Hydrobiol. Suppl. Algol. Stud. 2005, 117, 393–406. [Google Scholar] [CrossRef]
  37. Archer, W. Notes on some collections made from Furnas Lake, Azores, containing algae and a few other organisms. Bot. J. Linn. Soc. 1874, 14, 328–340. [Google Scholar] [CrossRef]
  38. Moseley, H.N. Notes on Fresh-water Algae obtained at the Boiling Springs at Furnas, St. Michael’s, Azores, and their neighbourhood. Bot. J. Linn. Soc. 1874, 14, 321–325. [Google Scholar] [CrossRef]
  39. Bohlin, K. Étude sur la flore algologique d’eau douce des Açores. K. Sven. Vetensk. Akad. Handl. 1901, 27, 1–85. [Google Scholar]
  40. Moreira, C.; Martins, A.; Moreira, C.; Vasconcelos, V. Toxigenic cyanobacteria in volcanic lakes and hot springs of a North Atlantic island (S. Miguel, Azores, Portugal). Fresenius Environ. Bull. 2011, 20, 420–426. [Google Scholar]
  41. Mantzouki, E.; Campbell, J.; van Loon, E.; Visser, P.; Konstantinou, I.; Antoniou, M.; Giuliani, G.; Machado-Vieira, D.; Gurjão de Oliveira, A.; Maronić, D.Š.; et al. A European Multi Lake Survey dataset of environmental variables, phytoplankton pigments and cyanotoxins. Sci. Data 2018, 5, 180226. [Google Scholar] [CrossRef] [Green Version]
  42. Ledreux, A.; Thomazeau, S.; Catherine, A.; Duval, C.; Yéprémian, C.; Marie, A.; Bernard, C. Evidence for saxitoxins production by the cyanobacterium Aphanizomenon gracile in a French recreational water body. Harmful Algae 2010, 10, 88–97. [Google Scholar] [CrossRef]
  43. Park, H.-D.; Watanabe, M.F.; Harada, K.-I.; Nagai, H.; Suzuki, M.; Watanabe, M.; Hayashi, H. Hepatotoxin (microcystin) and neurotoxin (anatoxin-a) contained in natural blooms and strains of cyanobacteria from Japanese freshwaters. Nat. Toxins 1993, 1, 353–360. [Google Scholar] [CrossRef]
  44. Li, R.; Carmichael, W.W.; Brittain, S.; Eaglesham, G.K.; Shaw, G.R.; Liu, Y.; Watanabe, M.M. First Report of the Cyanotoxins Cylindrospermopsin and Deoxycylindrospermopsin from Raphidiopsis curvata (Cyanobacteria). J. Phycol. 2001, 37, 1121–1126. [Google Scholar] [CrossRef]
  45. Luz, R.; Cordeiro, R.; Vilaverde, J.; Raposeiro, P.; Fonseca, A.; Gonçalves, V. Cyanobacteria from freshwater lakes in the Azores archipelago, Portugal: Data from long term phytoplankton monitoring. Biodivers. Data J. 2020, 8, e51928. [Google Scholar] [CrossRef]
  46. Hernández, A.; Kutiel, H.; Trigo, R.M.; Valente, M.A.; Sigró, J.; Cropper, T.; Santo, F.E. New Azores archipelago daily precipitation dataset and its links with large-scale modes of climate variability. Int. J. Climatol. 2016, 36, 4439–4454. [Google Scholar] [CrossRef]
  47. Porteiro, J.M.M. Lagoas dos Açores. Elementos de Suporte ao Planeamento Integrado. Ph.D. Thesis, University of the Azores, Ponta Delgada, Portugal, 2000. [Google Scholar]
  48. Vázquez-Loureiro, D.; Gonçalves, V.; Sáez, A.; Hernández, A.; Raposeiro, P.M.; Giralt, S.; Rubio-Inglés, M.J.; Rull, V.; Bao, R. Diatom-inferred ecological responses of an oceanic lake system to volcanism and anthropogenic perturbations since 1290 CE. Palaeogeogr. Palaeoclimatol. Palaeoecol. 2019, 534, 109285. [Google Scholar] [CrossRef]
  49. Raposeiro, P.M.; Rubio, M.J.; González, A.; Hernández, A.; Sánchez-López, G.; Vázquez-Loureiro, D.; Rull, V.; Bao, R.; Costa, A.C.; Gonçalves, V.; et al. Impact of the historical introduction of exotic fishes on the chironomid community of Lake Azul (Azores Islands). Palaeogeogr. Palaeoclimatol. Palaeoecol. 2017, 466, 77–88. [Google Scholar] [CrossRef] [Green Version]
  50. Pereira, C.L.; Raposeiro, P.M.; Costa, A.C.; Bao, R.; Giralt, S.; Gonçalves, V. Biogeography and lake morphometry drive diatom and chironomid assemblages’ composition in lacustrine surface sediments of oceanic islands. Hydrobiologia 2014, 730, 93–112. [Google Scholar] [CrossRef] [Green Version]
  51. IPQ. Qualidade da Água. Doseamento da Clorofila a e dos Feopigmentos por Espectrofotometria de Absorção Molecular. Método de Extracção com Acetona. NP 4327/1996; Instituto Português da Qualidade (IPQ): Monte da Caparica, Portugal, 1997. [Google Scholar]
  52. Lorenzen, C. Determination of chlorophyll and pheopigments: Spectrophotometric equations. Limnol. Oceanogr. 1967, 12, 343–346. [Google Scholar] [CrossRef]
  53. APHA. Standard Methods for the Examination of Water and Wastewater; American Public Health Association: Washington, DC, USA, 1998. [Google Scholar]
  54. Hillebrand, H.; Dürselen, C.-D.; Kirschtel, D.; Pollingher, U.; Zohary, T. Biovolume Calculation for Pelagic and Benthic Microalgae. J. Phycol. 1999, 35, 403–424. [Google Scholar] [CrossRef]
  55. Lund, J.W.G.; Kipling, C.; Le Cren, E.D. The inverted microscope method of estimating algal numbers and the statistical basis of estimations by counting. Hydrobiologia 1958, 11, 143–170. [Google Scholar] [CrossRef]
  56. Komárek, J.; Anagnostidis, K. Cyanoprokaryota, Teil 1/Part 1: Chroococcales; Spektrum Akademischer Verlag: Berlin, Germany, 2008; ISBN 978-3-8274-2111-1. [Google Scholar]
  57. Komárek, J.; Anagnostidis, K. Cyanoprokaryota 2. Teil/Part 2: Oscillatoriales; Spektrum Akademischer Verlag: Münche, Germany, 2005; ISBN 978-3-8274-1914-9. [Google Scholar]
  58. Komárek, J. Cyanoprokaryota 3. Teil/Part 3: Heterocytous Genera; Spektrum Akademischer Verlag: Berlin, Germany, 2013; ISBN 978-3-8274-0932-4. [Google Scholar]
  59. Komárek, J.; Kastovsky, J.; Mares, J.; Johansen, J.R. Taxonomic classification of cyanoprokaryotes (cyanobacterial genera) 2014, using a polyphasic approach. Preslia 2014, 86, 295–335. [Google Scholar]
  60. Guiry, M.D.; Guiry, G.M.; AlgaeBase. World-Wide Electronic Publication, National University of Ireland, Galway. Available online: http://www.algaebase.org (accessed on 23 July 2019).
  61. Hisbergues, M.; Christiansen, G.; Rouhiainen, L.; Sivonen, K.; Borner, T. PCR-based identification of microcystin-producing genotypes of different cyanobacterial genera. Arch. Microbiol. 2003, 180, 402–410. [Google Scholar] [CrossRef]
  62. Ouahid, Y.; Pérez-Silva, G.; Del Campo, F.F. Identification of potentially toxic environmental Microcystis by individual and multiple PCR amplification of specific microcystin synthetase gene regions. Environ. Toxicol. 2005, 20, 235–242. [Google Scholar] [CrossRef]
  63. Neilan, B.A.; Jacobs, D.; Del Dot, T.; Blackall, L.L.; Hawkins, P.R.; Cox, P.T.; Goodman, A.E. rRNA sequences and evolutionary relationships among toxic and nontoxic cyanobacteria of the genus Microcystis. Int. J. Syst. Bacteriol. 1997, 47, 693–697. [Google Scholar] [CrossRef]
  64. Rantala-Ylinen, A.; Känä, S.; Wang, H.; Rouhiainen, L.; Wahlsten, M.; Rizzi, E.; Berg, K.; Gugger, M.; Sivonen, K. Anatoxin-a synthetase gene cluster of the cyanobacterium Anabaena sp. strain 37 and molecular methods to detect potential producers. Appl. Environ. Microbiol. 2011, 77, 7271–7278. [Google Scholar] [CrossRef] [Green Version]
  65. Schembri, M.A.; Neilan, B.A.; Saint, C.P. Identification of genes implicated in toxin production in the cyanobacterium Cylindrospermopsis raciborskii. Environ. Toxicol. 2001, 16, 413–421. [Google Scholar] [CrossRef]
  66. Clarke, K.R.; Gorley, R.N. PRIMER v6: User Manual/Tutorial; PRIMER-E; Plymouth Marine Laboratory: Plymouth, UK, 2006. [Google Scholar]
  67. Clarke, K.R.; Green, R.H. Statistical design and analysis for a ‘biological effects’ study. Mar. Ecol. Prog. Ser. 1988, 46, 213–226. [Google Scholar] [CrossRef]
  68. Anderson, M.J.; Gorley, R.N.; Clarke, K.R. PERMANOVA+ for PRIMER: Guide to Software and Statistical Methods; PRIMER-E; Plymouth Marine Laboratory: Plymouth, UK, 2008. [Google Scholar]
  69. OECD. Eutrophication of Waters. Monitoring, Assessment and Control; Organisation for Economic Co-Operation and Development: Paris, France, 1982. [Google Scholar]
  70. AHA-DRA. Plano de Gestão da Região Hidrográfica dos Açores–RH9. Versão para Consulta Pública (Azores River Basin Management Plan). Ponta Delgada, Azores, Portugal. 2015. Available online: https://siaia.apambiente.pt/AAEstrategica/DA_AAE676.pdf (accessed on 1 December 2020).
  71. Bernard, C.; Ballot, A.; Thomazeau, S.; Maloufi, S.; Furey, A.; Mankiewicz-Boczek, J.; Pawlik-Skowrońska, B.; Capelli, C.; Salmaso, N. Appendix 2: Cyanobacteria associated with the production of cyanotoxins. In Handbook of Cyanobacterial Monitoring and Cyanotoxin Analysis; Meriluoto, J., Spoof, L., Codd, G.A., Eds.; John Wiley & Sons, Ltd.: Chichester, UK, 2017; pp. 501–525. [Google Scholar]
  72. Bober, B.; Bialczyk, J. Determination of the toxicity of the freshwater cyanobacterium Woronichinia naegeliana (Unger) Elenkin. J. Appl. Phycol. 2017, 29, 1355–1362. [Google Scholar] [CrossRef] [Green Version]
  73. Christophoridis, C.; Zervou, S.-K.; Manolidi, K.; Katsiapi, M.; Moustaka-Gouni, M.; Kaloudis, T.; Triantis, T.M.; Hiskia, A. Occurrence and diversity of cyanotoxins in Greek lakes. Sci. Rep. 2018, 8, 17877. [Google Scholar] [CrossRef] [Green Version]
  74. Sivonen, K.; Himberg, K.; Luukkainen, R.; Niemelä, S.I.; Poon, G.K.; Codd, G.A. Preliminary characterization of neurotoxic cyanobacteria blooms and strains from Finland. Toxic. Assess. 1989, 4, 339–352. [Google Scholar] [CrossRef]
  75. Vasconcelos, V.M.; Sivonen, K.; Evans, W.R.; Carmichael, W.W.; Namikoshi, M. Hepatotoxic microcystin diversity in cyanobacterial blooms collected in portuguese freshwaters. Water Res. 1996, 30, 2377–2384. [Google Scholar] [CrossRef]
  76. Menezes, C.; Churro, C.; Dias, E. Risk Levels of Toxic Cyanobacteria in Portuguese Recreational Freshwaters. Toxins 2017, 9, 327. [Google Scholar] [CrossRef] [Green Version]
  77. Osswald, J.; Rellán, S.; Gago-Martinez, A.; Vasconcelos, V. Production of anatoxin-a by cyanobacterial strains isolated from Portuguese fresh water systems. Ecotoxicology 2009, 18, 1110–1115. [Google Scholar] [CrossRef] [PubMed]
  78. Ballot, A.; Fastner, J.; Wiedner, C. Paralytic shellfish poisoning toxin-producing cyanobacterium Aphanizomenon gracile in Northeast Germany. Appl. Environ. Microbiol. 2010, 76, 1173–1180. [Google Scholar] [CrossRef] [Green Version]
  79. Casero, M.C.; Ballot, A.; Agha, R.; Quesada, A.; Cirés, S. Characterization of saxitoxin production and release and phylogeny of sxt genes in paralytic shellfish poisoning toxin-producing Aphanizomenon gracile. Harmful Algae 2014, 37, 28–37. [Google Scholar] [CrossRef]
  80. Joung, S.-H.; Oh, H.-M.; Ko, S.-R.; Ahn, C.-Y. Correlations between environmental factors and toxic and non-toxic Microcystis dynamics during bloom in Daechung Reservoir, Korea. Harmful Algae 2011, 10, 188–193. [Google Scholar] [CrossRef]
  81. Gobler, C.J.; Burkholder, J.M.; Davis, T.W.; Harke, M.J.; Johengen, T.; Stow, C.A.; Van de Waal, D.B. The dual role of nitrogen supply in controlling the growth and toxicity of cyanobacterial blooms. Harmful Algae 2016, 54, 87–97. [Google Scholar] [CrossRef]
  82. Geada, P.; Pereira, R.N.; Vasconcelos, V.; Vicente, A.A.; Fernandes, B.D. Assessment of synergistic interactions between environmental factors on Microcystis aeruginosa growth and microcystin production. Algal Res. 2017, 27, 235–243. [Google Scholar] [CrossRef] [Green Version]
  83. Beversdorf, L.J.; Miller, T.R.; McMahon, K.D. The Role of Nitrogen Fixation in Cyanobacterial Bloom Toxicity in a Temperate, Eutrophic Lake. PLoS ONE 2013, 8, e56103. [Google Scholar] [CrossRef] [Green Version]
  84. Pearson, L.; Neilan, B. The molecular genetics of cyanobacterial toxicity as a basis for monitoring water quality and public health risk. Curr. Opin. Biotechnol. 2008, 19, 281–288. [Google Scholar] [CrossRef]
  85. Borges, H.L.F.; Branco, L.H.Z.; Martins, M.D.; Lima, C.S.; Barbosa, P.T.; Lira, G.A.S.; Bittencourt-Oliveira, M.C.; Molica, R.J.R. Cyanotoxin production and phylogeny of benthic cyanobacterial strains isolated from the northeast of Brazil. Harmful Algae 2015, 43, 46–57. [Google Scholar] [CrossRef]
  86. Pereira, P.; Onodera, H.; Andrinolo, D.; Franca, S.; Araújo, F.; Lagos, N.; Oshima, Y. Paralytic shellfish toxins in the freshwater cyanobacterium Aphanizomenon flos-aquae, isolated from Montargil reservoir, Portugal. Toxicon 2000, 38, 1689–1702. [Google Scholar] [CrossRef]
  87. Rücker, J.; Stüken, A.; Nixdorf, B.; Fastner, J.; Chorus, I.; Wiedner, C. Concentrations of particulate and dissolved cylindrospermopsin in 21 Aphanizomenon-dominated temperate lakes. Toxicon 2007, 50, 800–809. [Google Scholar] [CrossRef]
  88. Banker, R.; Carmeli, S.; Hadas, O.; Teltsch, B.; Porat, R.; Sukenik, A. Identification of cylindrospermopsin in Aphanizomenon ovalisporum (Cyanophyceae) isolated from lake Kinneret, Israel. J. Phycol. 1997, 33, 613–616. [Google Scholar] [CrossRef]
  89. Quesada, A.; Moreno, E.; Carrasco, D.; Paniagua, T.; Wormer, L.; De Hoyos, C.; Sukenik, A. Toxicity of Aphanizomenon ovalisporum (Cyanobacteria) in a Spanish water reservoir. Eur. J. Phycol. 2006, 41, 39–45. [Google Scholar] [CrossRef]
  90. Ohtani, I.; Moore, R.E.; Runnegar, M.T.C. Cylindrospermopsin: A potent hepatotoxin from the blue-green alga Cylindrospermopsis raciborskii. J. Am. Chem. Soc. 1992, 114, 7941–7942. [Google Scholar] [CrossRef]
  91. INOVA. Análise das Águas das Lagoas da Região Autónoma dos Açores; INOVA: Ponta Delgada, Portugal, 1996. [Google Scholar]
  92. Moreira, C.; Mendes, R.; Azevedo, J.; Vasconcelos, V.; Antunes, A. First occurrence of cylindrospermopsin in Portugal: A contribution to its continuous global dispersal. Toxicon 2017, 130, 87–90. [Google Scholar] [CrossRef]
  93. Kosten, S.; Huszar, V.L.M.; Bécares, E.; Costa, L.S.; Van Donk, E.; Hansson, L.-A.; Jeppesenk, E.; Kruk, C.; Lacerot, G.; Mazzeo, N.; et al. Warmer climates boost cyanobacterial dominance in shallow lakes. Glob. Chang. Biol. 2012, 18, 118–126. [Google Scholar] [CrossRef]
  94. Robarts, R.D.; Zohary, T. Temperature effects on photosynthetic capacity, respiration, and growth rates of bloom-forming cyanobacteria. N. Zeal. J. Mar. Freshw. Res. 1987, 21, 391–399. [Google Scholar] [CrossRef] [Green Version]
  95. European Commission. Directive 2000/60/EC of the European Parliament and of the Council of 23 October 2000 Establishing a Framework for Community Action in the Field of Water Policy; Official Journal 22 December 2000 L 327/1; European Commission: Brussels, Belgium, 2000. [Google Scholar]
  96. Cruz, J.V.; Antunes, P.; Amaral, C.; França, Z.; Nunes, J.C. Volcanic lakes of the Azores archipelago (Portugal): Geological setting and geochemical characterization. J. Volcanol. Geotherm. Res. 2006, 135–157. [Google Scholar] [CrossRef]
  97. Richardson, J.; Miller, C.; Maberly, S.C.; Taylor, P.; Globevnik, L.; Hunter, P.; Jeppesen, E.; Mischke, U.; Moe, S.J.; Pasztaleniec, A.; et al. Effects of multiple stressors on cyanobacteria abundance vary with lake type. Glob. Chang. Biol. 2018, 24. [Google Scholar] [CrossRef] [Green Version]
  98. Wood, S.A.; Maier, M.Y.; Puddick, J.; Pochon, X.; Zaiko, A.; Dietrich, D.R.; Hamilton, D.P. Trophic state and geographic gradients influence planktonic cyanobacterial diversity and distribution in New Zealand lakes. FEMS Microbiol. Ecol. 2017, 93, fiw234. [Google Scholar] [CrossRef]
  99. Gallina, N.; Salmaso, N.; Morabito, G.; Beniston, M. Phytoplankton configuration in six deep lakes in the peri-Alpine region: Are the key drivers related to eutrophication and climate? Aquat. Ecol. 2013, 47, 177–193. [Google Scholar] [CrossRef] [Green Version]
  100. Bukowska, A.; Kaliński, T.; Koper, M.; Kostrzewska-Szlakowska, I.; Kwiatowski, J.; Mazur-Marzec, H.; Jasser, I. Predicting blooms of toxic cyanobacteria in eutrophic lakes with diverse cyanobacterial communities. Sci. Rep. 2017, 7, 8342. [Google Scholar] [CrossRef] [Green Version]
  101. Padisák, J.; Crossetti, L.O.; Naselli-Flores, L. Use and misuse in the application of the phytoplankton functional classification: A critical review with updates. Hydrobiologia 2009, 621, 1–19. [Google Scholar] [CrossRef]
  102. Reynolds, C.S.; Huszar, V.; Kruk, C.; Naselli-Flores, L.; Melo, S. Towards a functional classification of the freshwater phytoplankton. J. Plankton Res. 2002, 24, 417–428. [Google Scholar] [CrossRef]
  103. Reynolds, C.S.; Petersen, A.C. The distribution of planktonic Cyanobacteria in Irish lakes in relation to their trophic states. Hydrobiologia 2000, 91–99. [Google Scholar] [CrossRef]
  104. Whitton, B.; Potts, M. Introduction to the Cyanobacteria. In The Ecology of Cyanobacteria II—Their Diversity in Time and Space; Whitton, B.A., Ed.; Springer: Dordrecht, The Netherlands, 2012; pp. 1–13. ISBN 978-94-007-3854-6. [Google Scholar]
  105. Hamilton, D.P.; Salmaso, N.; Paerl, H.W. Mitigating harmful cyanobacterial blooms: Strategies for control of nitrogen and phosphorus loads. Aquat. Ecol. 2016, 50, 351–366. [Google Scholar] [CrossRef]
Figure 1. Location of the studied lakes in the Azores Archipelago (See Table 1 for lake code). Az: Azores Archipelago; Mi: São Miguel Island; Pi: Pico Island; Fo: Flores Island.
Water 12 03385 g001
Figure 2. Cyanobacteria biomass (µg L−1) in the photic zone of the 15 sampled lakes, by sampling campaign. Aphanizomenon: A. gracile; Dolichospermum: Dolichospermum sp., D. planctonicum, and D. spiroides; Planktolyngbya: Pl. limnetica; Woronichinia: W. naegeliana; Pseudanabaena: Ps. limnetica; Microcystis: M. aeruginosa and M. flos-aquae; Other: Coelosphaerium kuetzingianum; Chroococcus minutus; C. turgidus; Oscillatoria tenuis; Snowella lacustris and Synechocystis sp. Grey shadow: Shallow Lakes; Green shadow: Deep Mesotrophic lakes; Orange shadow: Deep Eutrophic Lakes.
Water 12 03385 g002
Figure 3. Distance-based redundancy analysis (dbRDA) plot of Distance-based linear modeling (DistLM) results in 2-dimensional space for environmental variables and cyanobacteria biomass across the studied lakes. The length and direction of the vectors represent the strength and direction of the relationship (see Table 1 for environmental variables and lake codes).
Water 12 03385 g003
Figure 4. Distance-based redundancy analysis (dbRDA) plot of Distance-based linear modeling (DistLM) results in 2-dimensional space for environmental variables and cyanotoxin genes amplification across the studied lakes. The length and direction of the vectors represent the strength and direction of the relationship (see Table 1 for environmental variables and lake codes). MC+ = amplification of MC producing gene(s), STX+ = amplification of STX producing gene(s), ATX-a+ = amplification of ATX-a producing gene(s).
Water 12 03385 g004
Table 1. Hydromorphological and physicochemical characterization of sampled lakes.
Lake NameLakeHydromorphological CharacteristicsPhysicochemical Variables
Lat (UTM)Lon (UTM)Alt (m)Area (km2)Zmax (m)ZSD (m)T (°C)pHO2 (mg L−1)C (µS cm−1)TN (mg L−1)TP (µg L−1)Chla (µg L−1)
AzulAz(Mi) 4,192,417.68608,243.522603.58725.43.2 ± 0.719.0 ± 3.77.5 ± 0.29.3 ± 0.8102 ± 51.1 ± 0.120.6 ± 7.42.8 ± 1.3
São BrásBr(Mi)4,184,056.94640,013.626100.0582.00.5 ± 0.416.2 ± 3.56.7 ± 0.49.7 ± 0.638 ± 40.9 ± 0.3109.4 ± 47.324.4 ± 14.5
CaiadoCd(Pi)4,257,155.56390,879.198100.0554.72.7 ± 0.414.2 ± 3.06.6 ± 0.39.9 ± 0.930 ± 30.5 ± 0.317.8 ± 7.02.0 ± 0.9
CongroCg(Mi)4,179,982.69640,241.904200.03717.62.4 ± 0.718.0 ± 4.18.2 ± 1.09.4 ± 1.698 ± 31.0 ± 0.217.6 ± 9.212.5 ± 7.4
CanárioCn(Mi) 4,188,336.28609,147.637500.0182.71.0 ± 0.216.6 ± 4.87.0 ± 0.88.9 ± 0.938 ± 40.4 ± 0.137.4 ± 12.68.1 ± 3.7
CapitãoCp(Pi)4,260,771.00384,929.007900.0274.30.9 ± 0.114.4 ± 2.86.0 ± 0.910.5 ± 1.235 ± 70.6 ± 0.345.0 ± 15.623.3 ± 15.3
Empadadas-NEm-N(Mi) 4,187,226.07610,176.107400.0182.71.8 ± 0.416.8 ± 5.07.2 ± 0.59.1 ± 0.739 ± 40.5 ± 0.319.4 ± 6.25.8 ± 3.4
Empadadas-SEm-S(Mi)4,187,091.70610,274.947500.0052.72.0 ± 0.515.6 ± 3.47.6 ± 0.49.0 ± 0.751 ± 61.1 ± 0.513.8 ± 1.84.5 ± 2.7
FogoFg(Mi)4,180,740.35633,514.965741.43726.63.1 ± 0.415.8 ± 3.07.5 ± 0.49.1 ± 1.248 ± 20.7 ± 0.217.6 ± 2.64.0 ± 2.1
FundaFn(Fo)4,363,277.32653,537.563600.35533.81.8 ± 1.117.0 ± 2.87.9 ± 0.710.2 ± 1.5120 ± 00.5 ± 0.225.1 ± 5.319.6 ± 14.8
FurnasFr(Mi) 4,180,143.86647,150.832801.92612.00.8 ± 0.318.2 ± 3.78.0 ± 0.510.1 ± 1.3148 ± 131.2 ± 1.059.4 ± 25.125.0 ± 14.6
Rasa das Sete CidadesRt(Mi)4,189,125.49607,359.615450.0393.93.8 ± 0.316.6 ± 4.26.1 ± 0.69.3 ± 0.648 ± 30.5 ± 0.321.0 ± 19.01.6 ± 0.7
Rasa da Serra DevassaRs(Mi)4,187,131.44609,876.377650.0330.40.6 ± 0.415.2 ± 4.07.0 ± 0.69.1 ± 0.640 ± 50.4 ± 0.220.0 ± 12.22.3 ± 1.2
SantiagoSn(Mi)4,189,551.18607,989.453600.25426.02.6 ± 0.818.7 ± 4.07.5 ± 0.58.5 ± 0.1123 ± 60.4 ± 0.017.0 ± 4.49.9 ± 6.0
VerdeVr(Mi) 4,189,071.90606,553.942600.85622.43.3 ± 3.218.0 ± 3.78.2 ± 1.09.6 ± 1.4126 ± 50.5 ± 0.226.8 ± 17.817.7 ± 14.9
Mi: São Miguel Island; Pi: Pico Island; Fo: Flores Island, Lat = Latitude, Lon = Longitude, Alt = Altitude, Area = Lake Surface Area, Zmax = Maximum Depth, ZSD = Secchi Depth, T = Temperature, pH (20 °C), O2 = Dissolved Oxygen, C = Conductivity (epilimnion), TN = Total Nitrogen, TP = Total Phosphorus, Chla = Chlorophyll a.
Table 2. Summary of Distance-based linear modeling (DistLM) procedure for environmental variables for cyanobacteria diversity and cyanotoxin producing genes amplification.
VariableCyanobacteria SpeciesCyanotoxin-Producing Genes
SS (Trace)Pseudo-FpPropSS (Trace)Pseudo-FpProp
Zmax (m)34,170.09.480.0010.1185.9713.890.0010.0164
Alt (m)31,393.08.620.0010.10810.9630.400.0010.300
C (µS cm−1) 29,600.08.070.0010.10210.9730.430.0010.300
Area (Km2)21,175.05.590.0010.0732.585.390.0030.071
pH16,805.04.370.0010.0585.7213.180.0010.157
TP (µg L−1)10,648.02.710.0060.0371.593.230.0250.044
T (°C) 9490.42.40.0160.0331.22.420.0730.033
Chla (µg L−1)9279.22.350.0190.0322.154.440.0070.059
ZSD (m)6824.91.710.0850.0240.440.880.4300.022
O2 (mg L−1)3259.70.810.6030.0110.641.260.2820.017
TN (mg L−1)1844.80.450.8750.0060.541.060.3710.015
C = Conductivity, TP = Total Phosphorus, T = Temperature, ZSD = Secchi Depth, Chla = Chlorophyll a, TN = Total Nitrogen, O2 = Dissolved Oxygen, Zmax = Maximum Depth, Area = Lake Surface Area, Alt = Altitude.
Table 3. Cyanotoxin-producing genes, cyanobacteria abundance, biomass, and dominant species (>2% of total cyanobacteria biomass) in the 15 sampled lakes, by sampling campaign.
October 2015February 2016April 2016August 2016November 2016
Az(Mi)Cyanotoxins genes * MC, STXSTXMC, STX
Abundance (cells mL−1)15,94412,77252,286230,56826,482
Biomass (µg L−1)2334.871571.975223.306231.133961.86
Dominant SpeciesPlli, MaerPlli, Wnae, Maer, Mflo, DplaPlli, Syne, Mflo, DplaPsliCkue, Plli, Dpla
Br(Mi)Cyanotoxins genes *MC STX
Abundance (cells mL−1)46358611200,67081248,477
Biomass (µg L−1)125.15867.4013,351.6059.431819.47
Dominant SpeciesPsliPlli, DoliPsli, DoliPsli, DoliPsli, Doli
Cyanotoxins genes *
Cd(Pi)Abundance (cells mL−1)9452382353
Biomass (µg L−1)0.626.5910.9010.920.21
Dominant SpeciesDoliPlli, DoliWnae, DoliWnaeDoli
Cg(Mi)Cyanotoxins genes *MCMCMC, STXMCMC, STX
Abundance (cells mL−1)29213,6895776360474
Biomass (µg L−1)8.532332.3240.79205.8738.61
Dominant SpeciesMflo, Oten, DplaMaer, Mflos, DplaPsli, Mflo, DplaWnae, MfloWnae, Dpla
Cn(Mi)Cyanotoxins genes *
Abundance (cells mL−1)022600914
Biomass (µg L−1)0.006.100.000.00138.93
Dominant Species Psli Plli
Cp(Pi)Cyanotoxins genes * STX
Abundance (cells mL−1)104,020100,16910,125258,1021130
Biomass (µg L−1)5329.636910.65691.4429,215.4583.93
Dominant SpeciesPsli, DoliDoli.DoliDoliPsli, Oten
Em-N(Mi)Cyanotoxins genes *
Abundance (cells mL−1)32902680456
Biomass (µg L−1)8.880.0027.930.0016.45
Dominant SpeciesPsli Doli, Dpla Psli, Wnae
Em-S(Mi)Cyanotoxins genes *
Abundance (cells mL−1)972427681811230
Biomass (µg L−1)9.361.56124.9790.1310.35
Dominant SpeciesDoli, DplaCminWnaePsli, Wnae, AgraWnae
Fg(Mi)Cyanotoxins genes *STXSTX
Abundance (cells mL−1)282,6564572318273,51446,632
Biomass (µg L−1)42,963.71694.94477.6111,174.137088.06
Dominant SpeciesPlliPlliPlliPlliPlli
Fn(Fo)Cyanotoxins genes *STX, ATX-aSTXATX-aSTX, ATX-aSTX
Abundance (cells mL−1)89,47123,41525,83514,33176,323
Biomass (µg L−1)7713.892512.883902.39803.955722.07
Dominant SpeciesPlli, AgraPlli, AgraPlliMflo, DspiAgra
Fr(Mi)Cyanotoxins genes *MC, ATX-aMCMC, ATX-aMC, ATX-aMC, STX, ATX-a
Abundance (cells mL−1)451,52040,02732,841483,184486,886
Biomass (µg L−1)6796.31821.51775.227261.647841.75
Dominant SpeciesMfloCkue, Plli, Maer, MfloSyne, DspiCkue, MfloCkue, Maer, Mflo
Rs(Mi)Cyanotoxins genes * STX
Abundance (cells mL−1)11591289714610
Biomass (µg L−1)32.118.8347.6620.750.00
Dominant SpeciesPsliDoliWnae, DoliWnae
Rt(Mi)Cyanotoxins genes * MC
Abundance (cells mL−1)11,259914324513,02711,113
Biomass (µg L−1)724.86594.3015.93846.76720.95
Dominant SpeciesPsli, CminCminCminCminCmin
Sn(Mi)Cyanotoxins genes *STX, ATX-a**** STX
Abundance (cells mL−1)25,099****13,011107,668
Biomass (µg L −1)1657.79****368.507742.28
Dominant SpeciesPsli, Mflo, Agra****Ckue, Maer, MfloMflo, Agra
Vr(Mi)Cyanotoxins genes *MC, STXMC, STXMC, STXMC, STXMC, STX
Abundance (cells mL−1)21481901239,90523,87853,100
Biomass (µg L−1)57.21139.5827,168.49536.993057.41
Dominant SpeciesMflo, DplaCkue, Plli, Snow, Wnae, Mflos, AgraSyne, Mflo, DplaCkue, Plli, Syne, MfloCkue, Plli, Maer, Mflo, Doli
* Positive PCR results for cyanotoxin-producing genes (see Table S5 for each gene amplification), MC = Microcystin, STX = Saxitoxin, ATX-a = Anatoxin-a, CYN = Cylindrospermopsin; ** Without sampling. CKue = Coelosphaerium kuetzingianum, Plli = Planktolyngbya limnetica, Psli = Pseudanabaena limnetica, Snow = Snowella lacustris, Syne = Synechocystis sp., Wnae = Woronichinia naegeliana, Cmin = Chroococcus minutus, Maer = Microcystis aeruginosa, Mflo = Microcystis flos-aquae, Oten = Oscillatoria tenuis, Agra = Aphanizomenon gracile, Dpla = Dolichospermum planctonicum, Dspi = Dolichospermum spiroides, Doli = Dolichospermum sp.
Publisher’s Note: MDPI stays neutral with regard to jurisdictional claims in published maps and institutional affiliations.

