Article

Drinking Water Quality Mapping Using Water Quality Index and Geospatial Analysis in Primary Schools of Pakistan

1
Centre for Epidemiology and Evidence-Based Practice, Department of Social and Preventive Medicine, Faculty of Medicine, University of Malaya, Kuala Lumpur 50603, Malaysia
2
US-Pakistan Center for Advanced Studies in Water, Mehran University of Engineering & Technology, Jamhsoro 76062, Pakistan
3
Faculty of Education, University of Malaya, Kuala Lumpur 50603, Malaysia
*
Authors to whom correspondence should be addressed.
Water 2020, 12(12), 3382; https://doi.org/10.3390/w12123382
Submission received: 23 September 2020 / Revised: 3 November 2020 / Accepted: 28 November 2020 / Published: 2 December 2020
(This article belongs to the Special Issue Present and Future of Drinking Water Supplies in Low-Income Regions)

Abstract

:
Primary school children in the developing world often lack potable water, which may result in a high burden of water-related diseases and poor school performance. The present study aimed to characterize the drinking water quality in primary schools of Pakistan. We used a multistage random-sampling method to select 425 primary schools from selected districts of Sindh province. Standard methods were used to characterize water quality. The results were compared with maximum acceptable values recommended by the Pakistani National Environmental Quality Standards (Pak NEQS) and the World Health Organization (WHO) drinking water quality standards. Groundwater (62%) and surface water (38%) were identified as two major drinking water sources in the selected schools with varying levels of water quality. Among all parameters, dissolved oxygen (DO), pH, and nitrate remained within WHO and Pak NEQS water quality standard limit, while total dissolved solids (TDS) (33%), electrical conductivity (EC) (46%), chloride (34%), turbidity (27%), and hardness (11%) samples exceeded standard limits. All dissolved salts had moderate to strong positive correlations with TDS and EC values. Based on a water quality index (WQI), 74% of primary schools had access to excellent or good quality drinking water compared to 26% of schools that had access to either poor, very poor or unsuitable drinking water. Among all three regions, more schools from South Sindh had either poor, very poor or unsuitable drinking water (33%) compared to the Central (25%) and North zones (15%). Hence, water from these locations is unfit for human consumption and these schools need better water quality management plans to stop the spread of water-related diseases in primary school children.

Graphical Abstract

1. Introduction

Drinking water quality is a major concern for human health and wellbeing. The water quality is affected by water contaminants which ultimately affect human health. Physiochemical and microbiological parameters are important determinants for assessing industrial, irrigation, and domestic water quality. Among the physicochemical properties of drinking water, the common parameters used to present drinking water quality are pH, TDS, turbidity, hardness, nitrate, EC, chloride, phosphate, etc. The drinking water quality is compromised if their values exceed concentrations above the standard limits set by Pakistan Enviromental Protection agency (EPA) and World Health Organization (WHO) [1,2,3].
The deterioration in the drinking water quality results from the entry of chemicals into the fresh waterbodies and water supply system through natural and anthropogenic activities. The natural geogenic contamination of water is governed by the presence and concentration of various chemical constituents which are mostly derived from the geological formation of the particular region, while the anthropogenic contamination mainly occurs by the use of pesticides and herbicides in agriculture, leaching of poisonous toxins, septic tank, waste disposal, coal mining and petroleum refining, etc. [4,5,6].
The lack of improved access to safe water destabilizes families in various ways such as young children dying of preventable diseases. Other serious impacts include poorer cognitive functioning and a lower level of academic success [3,4,5]. Because of the history of poor health in childhood and the burden of recurring sicknesses later in life, these children ultimately have fewer chances for success later in life [3,4,5].
A household survey in Pakistan revealed that only 20% of the population had access to clean water [6]. The major sources of water contamination are primarily poor sewage systems, industrial wastes, pesticides, and fertilizers [6,7]. In Pakistan, old sewage infrastructure and the failure of local governments to separate sewage lines from drinking water supplies leads to the high risk for the transmission of water-related pollutants to the community [8]. Contaminants can be introduced into the water distribution network during times of low pressure or when service is cut off completely [9]. In addition, community centers such as schools, shops, and office building sites often lack on-site water storage and must rely on alternate water sources such as springs, stored rainwater, and private water vendors. Local water suppliers are mostly unregistered, with no water quality monitoring. Due to unhygienic handling, the drinking water is vulnerable to secondary- and cross-contamination [10,11,12]. Water from unprotected springs and wells is often unfit for human consumption [8].
Inadequate sewage treatment and sanitation contribute to water contamination and pose a direct risk of fecal–oral disease transmission [12]. Almost half of the Pakistani population lack improved sanitation systems, and this is significant between urban and rural areas [6,7]. A school-based study in Pakistani schools showed that the improved sanitation system was accessible to 52% of schools; however, only 32% of the toilets were functional and routinely maintained [7]. Overall, the impact of inadequate sanitation is sizable; a recent study reported that the unimproved water and sanitation service cost the Pakistani economy around USD 5.7 billion, equivalent to almost 4% of its GDP [8].
In school settings, learning would be optimal when both the students’ learning needs and health outcomes are accomplished. The recent Demographic and Health Survey (PDHs 2017–2018) in Pakistan showed poor school performance indicators (enrollment, illness, dropout, absenteeism, etc.) and a high prevalence of waterborne diseases that mainly included diarrhea [13].
Schools are an important setting to study as children spend a significant amount of time in school settings and thus consume much of their daily intake of water from school water sources. However, there is a lack of information regarding drinking water quality in schools. Thus, the goal of this study is to systematically assess drinking water quality in the schools of Sindh providence, Pakistan. We focused on Sindh province as other studies have found poor water quality in community water sources, and poorer school performance as compared to the rest of the country [6,13].
The WQI has been widely used to characterize both groundwater and surface water in terms of suitability for irrigation and drinking [10,14,15,16,17]. There are several different methods used to calculate a WQI, based on the intended use [15,18,19]. Some studies have incorporated geographical information system (GIS) methods to effectively present the WQI data [18,20,21].

2. Materials and Methods

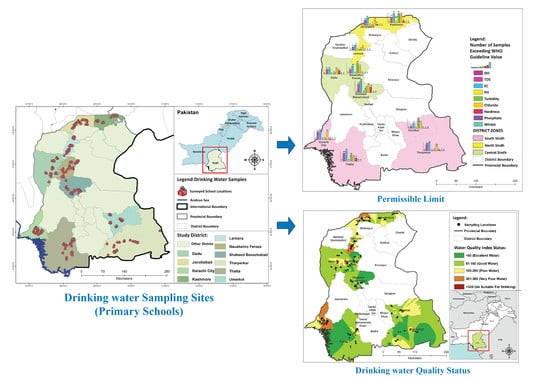
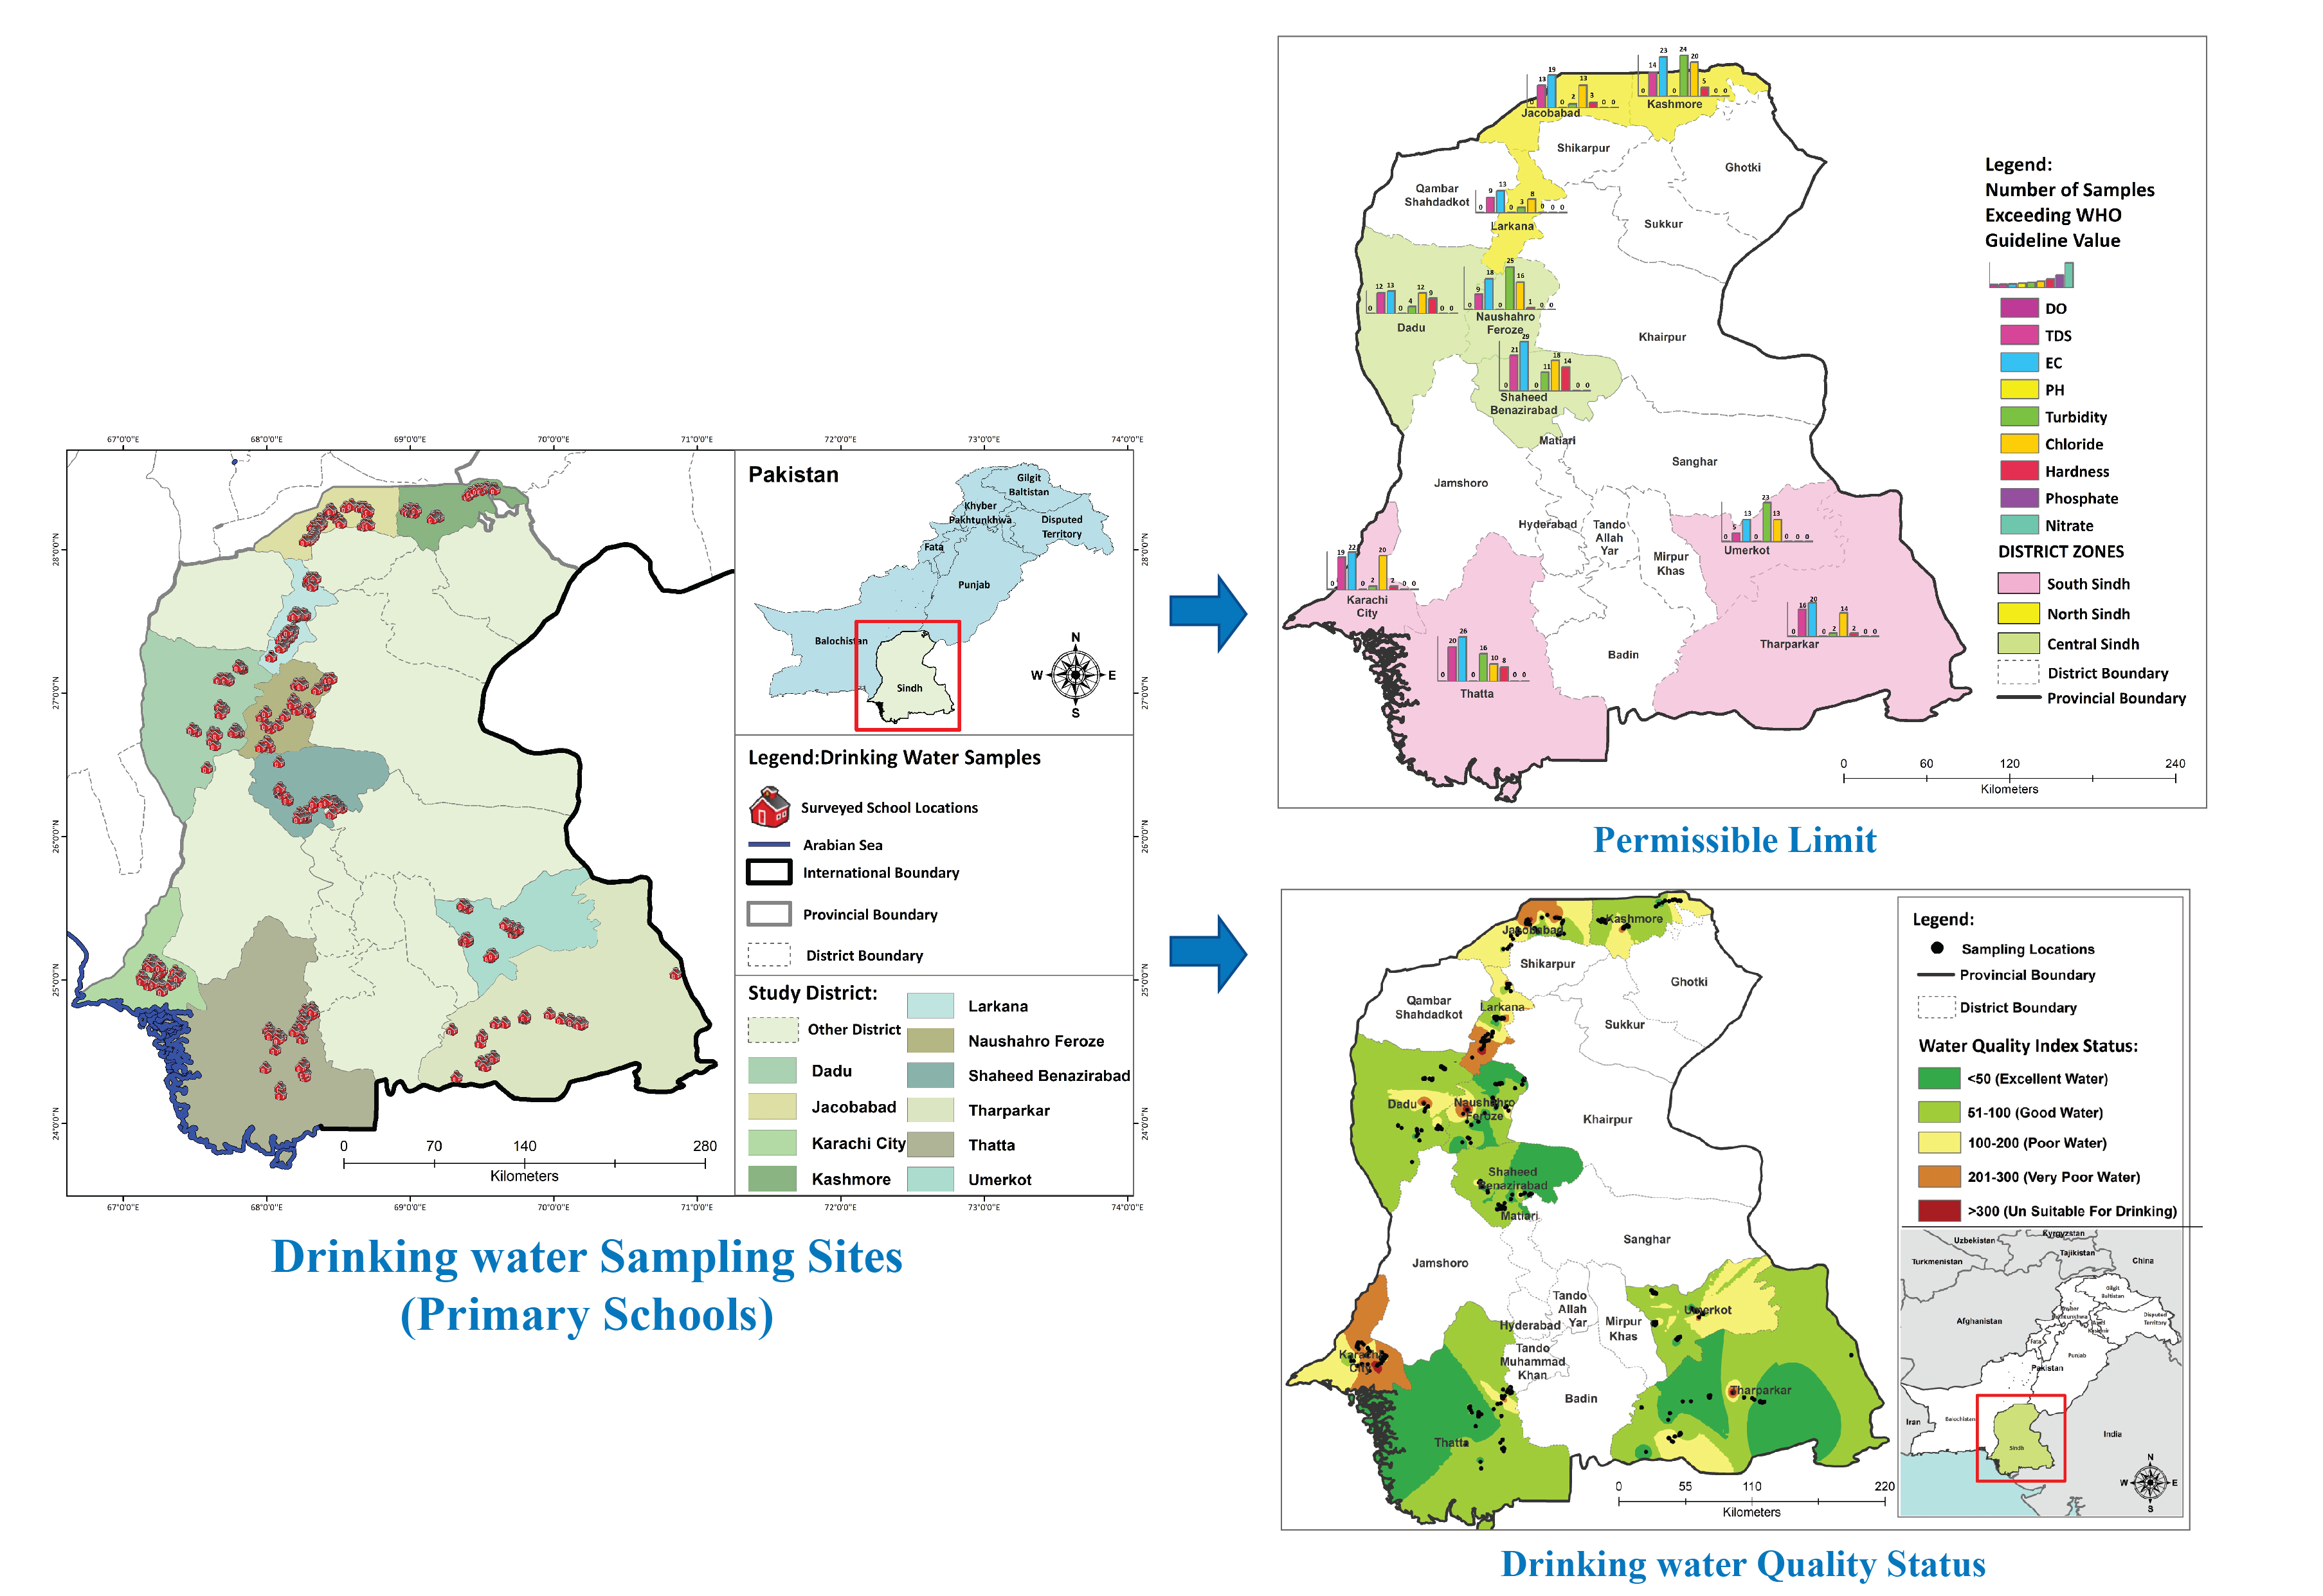
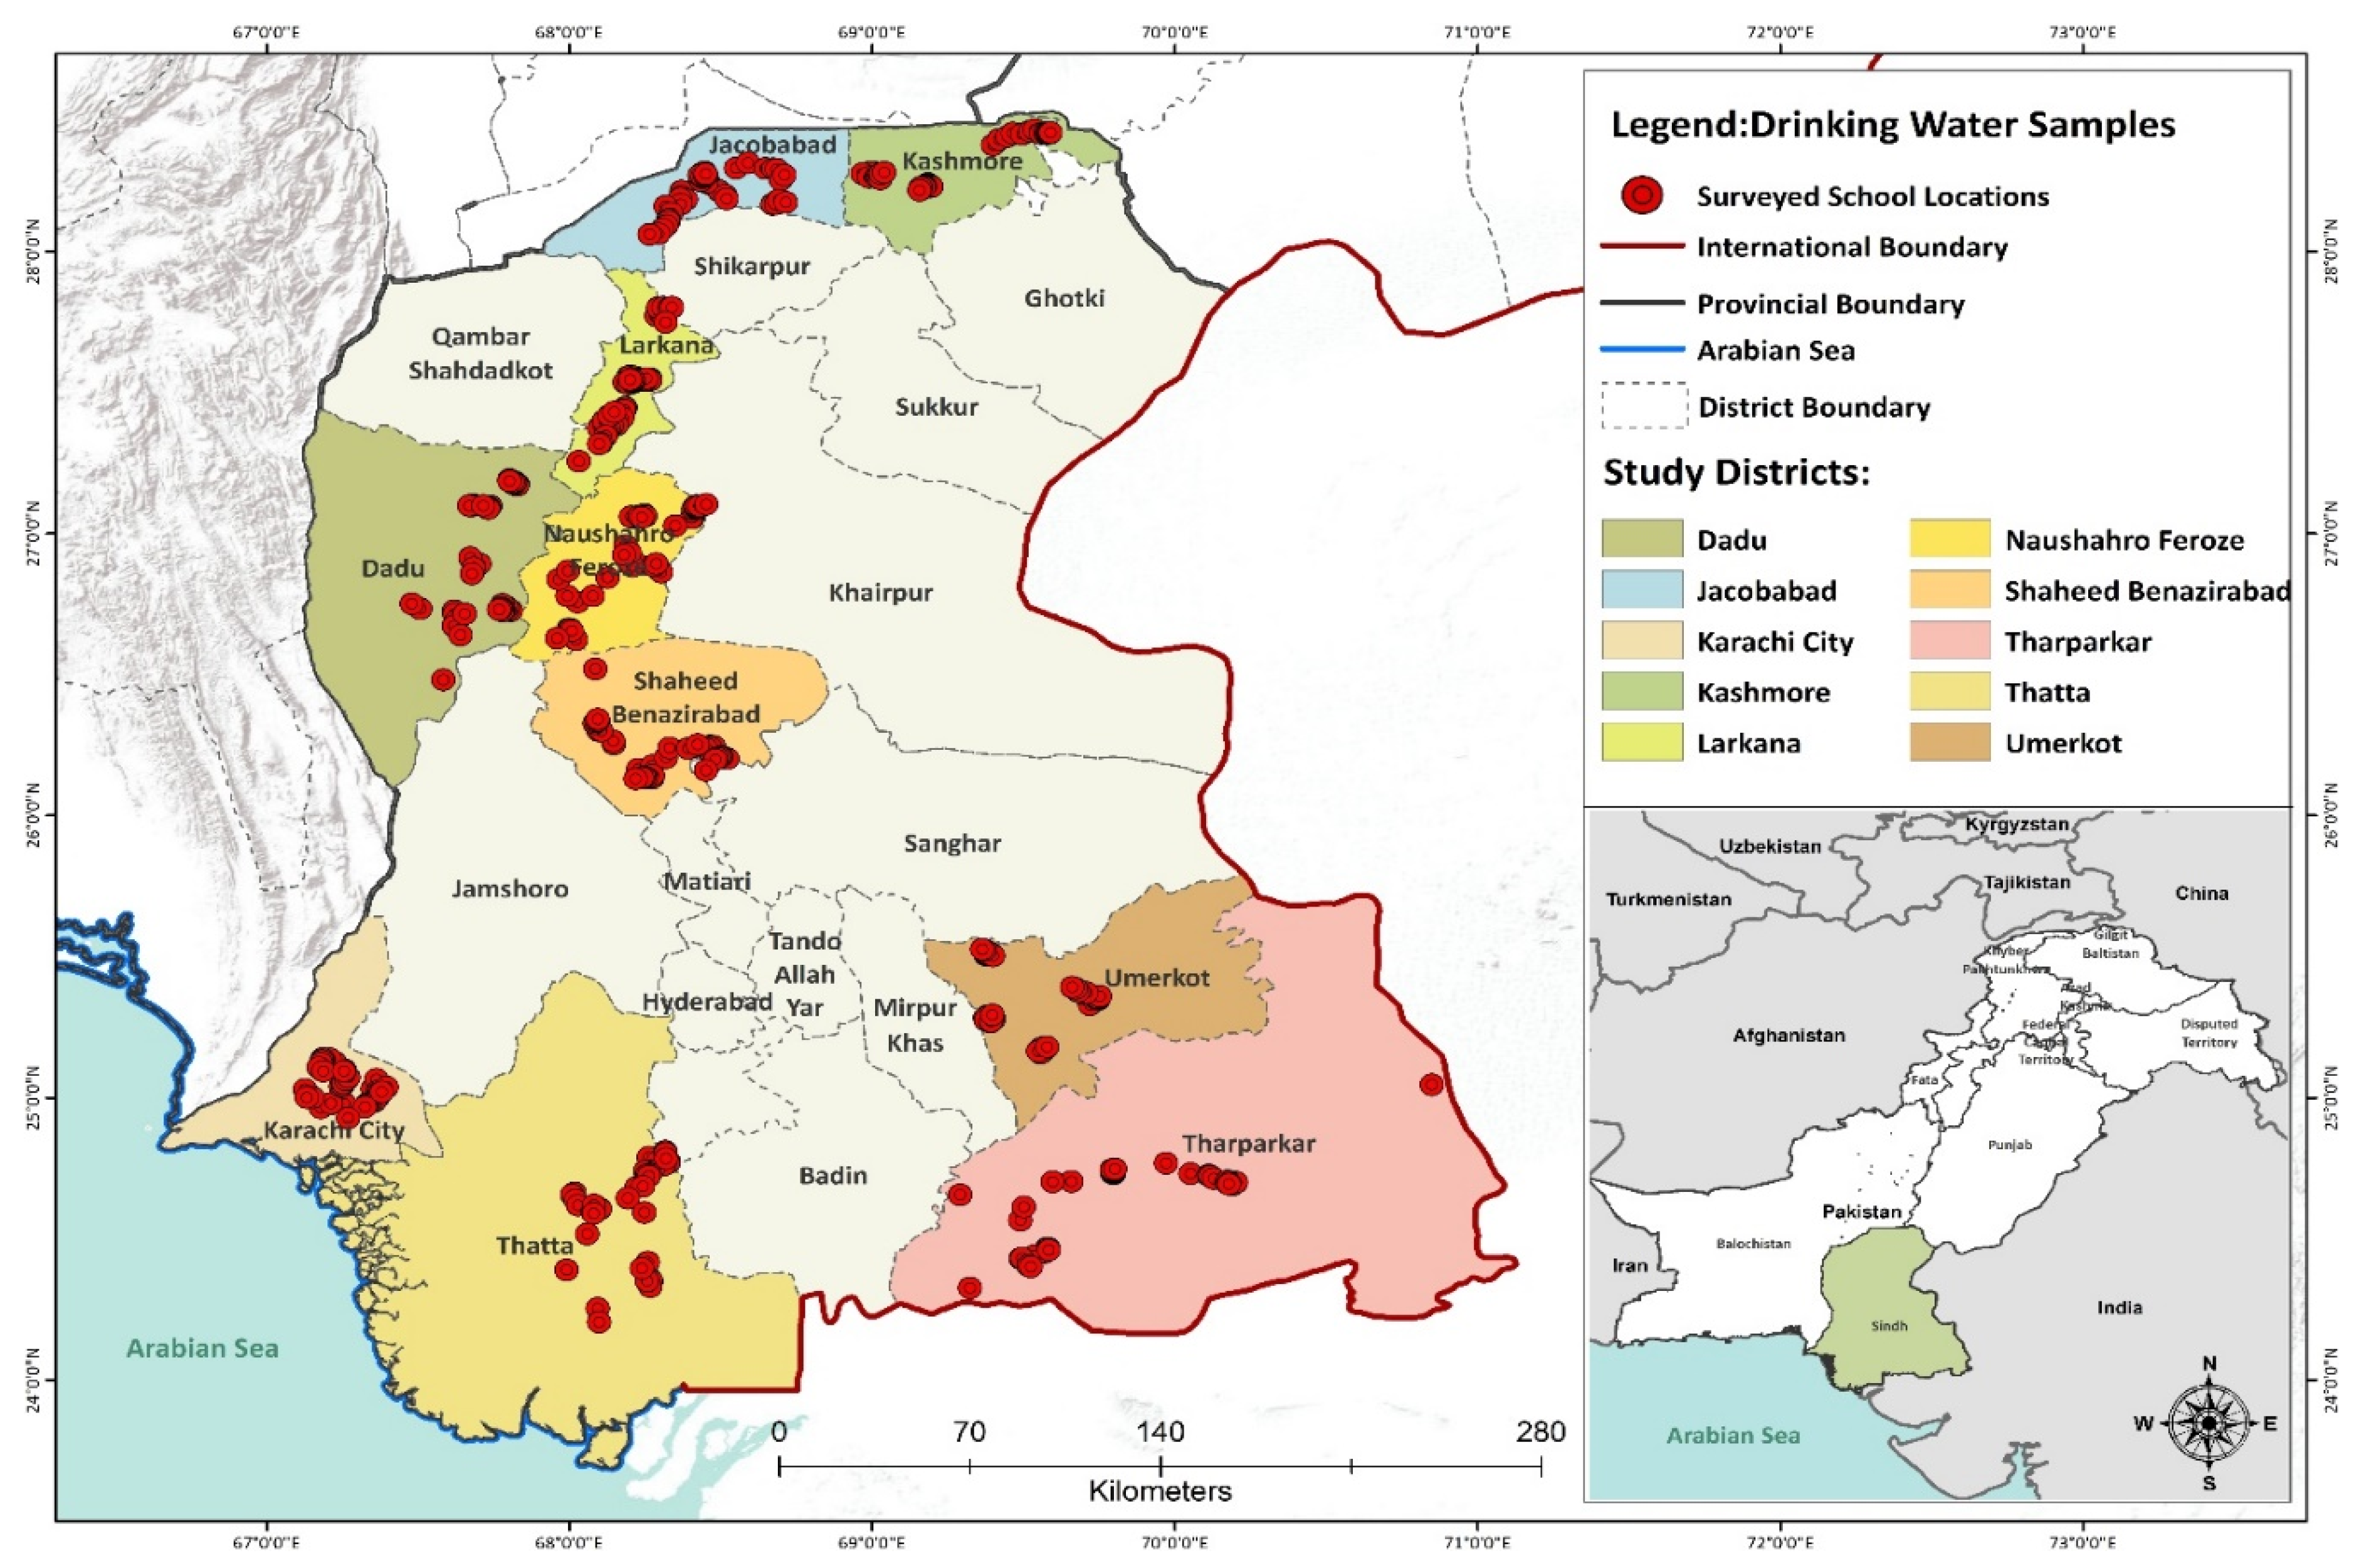
2.1. Study Setting and Sampling

Sindh province is located in the southeastern part of the country and is the second largest province with a population of around 4.8 million [13]. The Sindh province is divided into three climatic regions, i.e., South, North, and Central. Furthermore, it is subdivided into 29 districts [13]. The province is in the subtropical regions. It remains cold in winter (9–30 °C). However, in summer, the day is usually dry and hot with cool nights. In the summer, North Sindh temperatures are higher, around 45–50 °C when compared to Central Sindh, with a temperature of 43–44 °C. On the other hand, South Sindh has comparatively lower temperatures around 35–38 °C. Groundwater is the major source of drinking water in the central Sindh, and the surface and the groundwater are the main sources (Figure 1) in the North. South Sindh is located near the Arabian sea, and, in particular, Thatta and Karachi are the two districts in the south region where groundwater is highly salty and cannot be used for drinking without treatment [22,23,24]. Therefore, surface water is the chief source of drinking water in the given districts [25,26,27].
Schools were selected for inclusion using a multistage random sampling approach. All of the primary schools registered with the Education Department of the Province of Sindh (42,900) were considered the target population. In the first phase, we considered 10 districts representative of the Sindh province (Appendix A Table A1). In the second phase, primary schools from each district were randomly chosen with the number of schools chosen to be proportional to the population of the district for a total sample of 425 schools (Figure 2) [25].

2.2. Water Sample Collection

Water samples were collected from drinking sources in each school. Overall, nine physicochemical parameters were selected for assessing water quality. DO, pH, EC, TDS, and turbidity parameters were analyzed onsite using a multimeter (Table 1) [28,29]. For the parameters that were analyzed in the laboratory, 1000 mL of drinking water was collected in sterile polythene bottles and transported to the lab in a carrier at a standard temperature.

2.3. Water Sample Analysis

For chloride and total hardness, a titration-based standard method was adopted [17,30]. For the determination of phosphate and nitrate, a UV-visible spectrophotometer-based standard method was used [31].

2.4. Water Quality Index (WQI) Calculations

The importance of various parameters depends on the intended use of water. The WQI was evaluated considering these important points: (1) importance of the parameter; (2) statistical relationship between parameters concentration and corresponding index; (3) associated water quality parameters; and (4) classification of water quality (excellent, good, poor, very poor, water unsuitable for drinking). Here, the water quality parameters are studied from the point of view of suitability for human consumption. The ‘standards’ (standard values of various parameters) for the drinking water used in this study are those recommended by the World Health Organization (WHO) and Government of Pakistan Environmental Protection Agency (EPA) standards recommended for drinking water quality were employed [22,23]. A WQI was calculated using previously used methods [16,18,19]. The WQI calculations include three successive steps. First, each parameter was assigned a weight (wi) according to its relative importance in the overall quality of drinking water as shown in Table 2, and the weight for each parameter was assigned based on previous studies [16,18]. The weights were then transformed to relative weights, so they added up to one using the equation:
W i = w i / i = 1 n wi
A “quality rating” (qi) was calculated as:
qi = (Ci/Si) × 100
where Ci is the concentration of parameter i and Si is the WHO standard value for parameter i [23].
A sub-index is calculated as the product of the quality rating and the relative weight:
SIi = wi × qi
The overall WQI is the sum of these sub-indices overall parameters used [15,16,18]. Classifications are assigned based on the value of the WQI (Table 3).

3. Results and Discussion

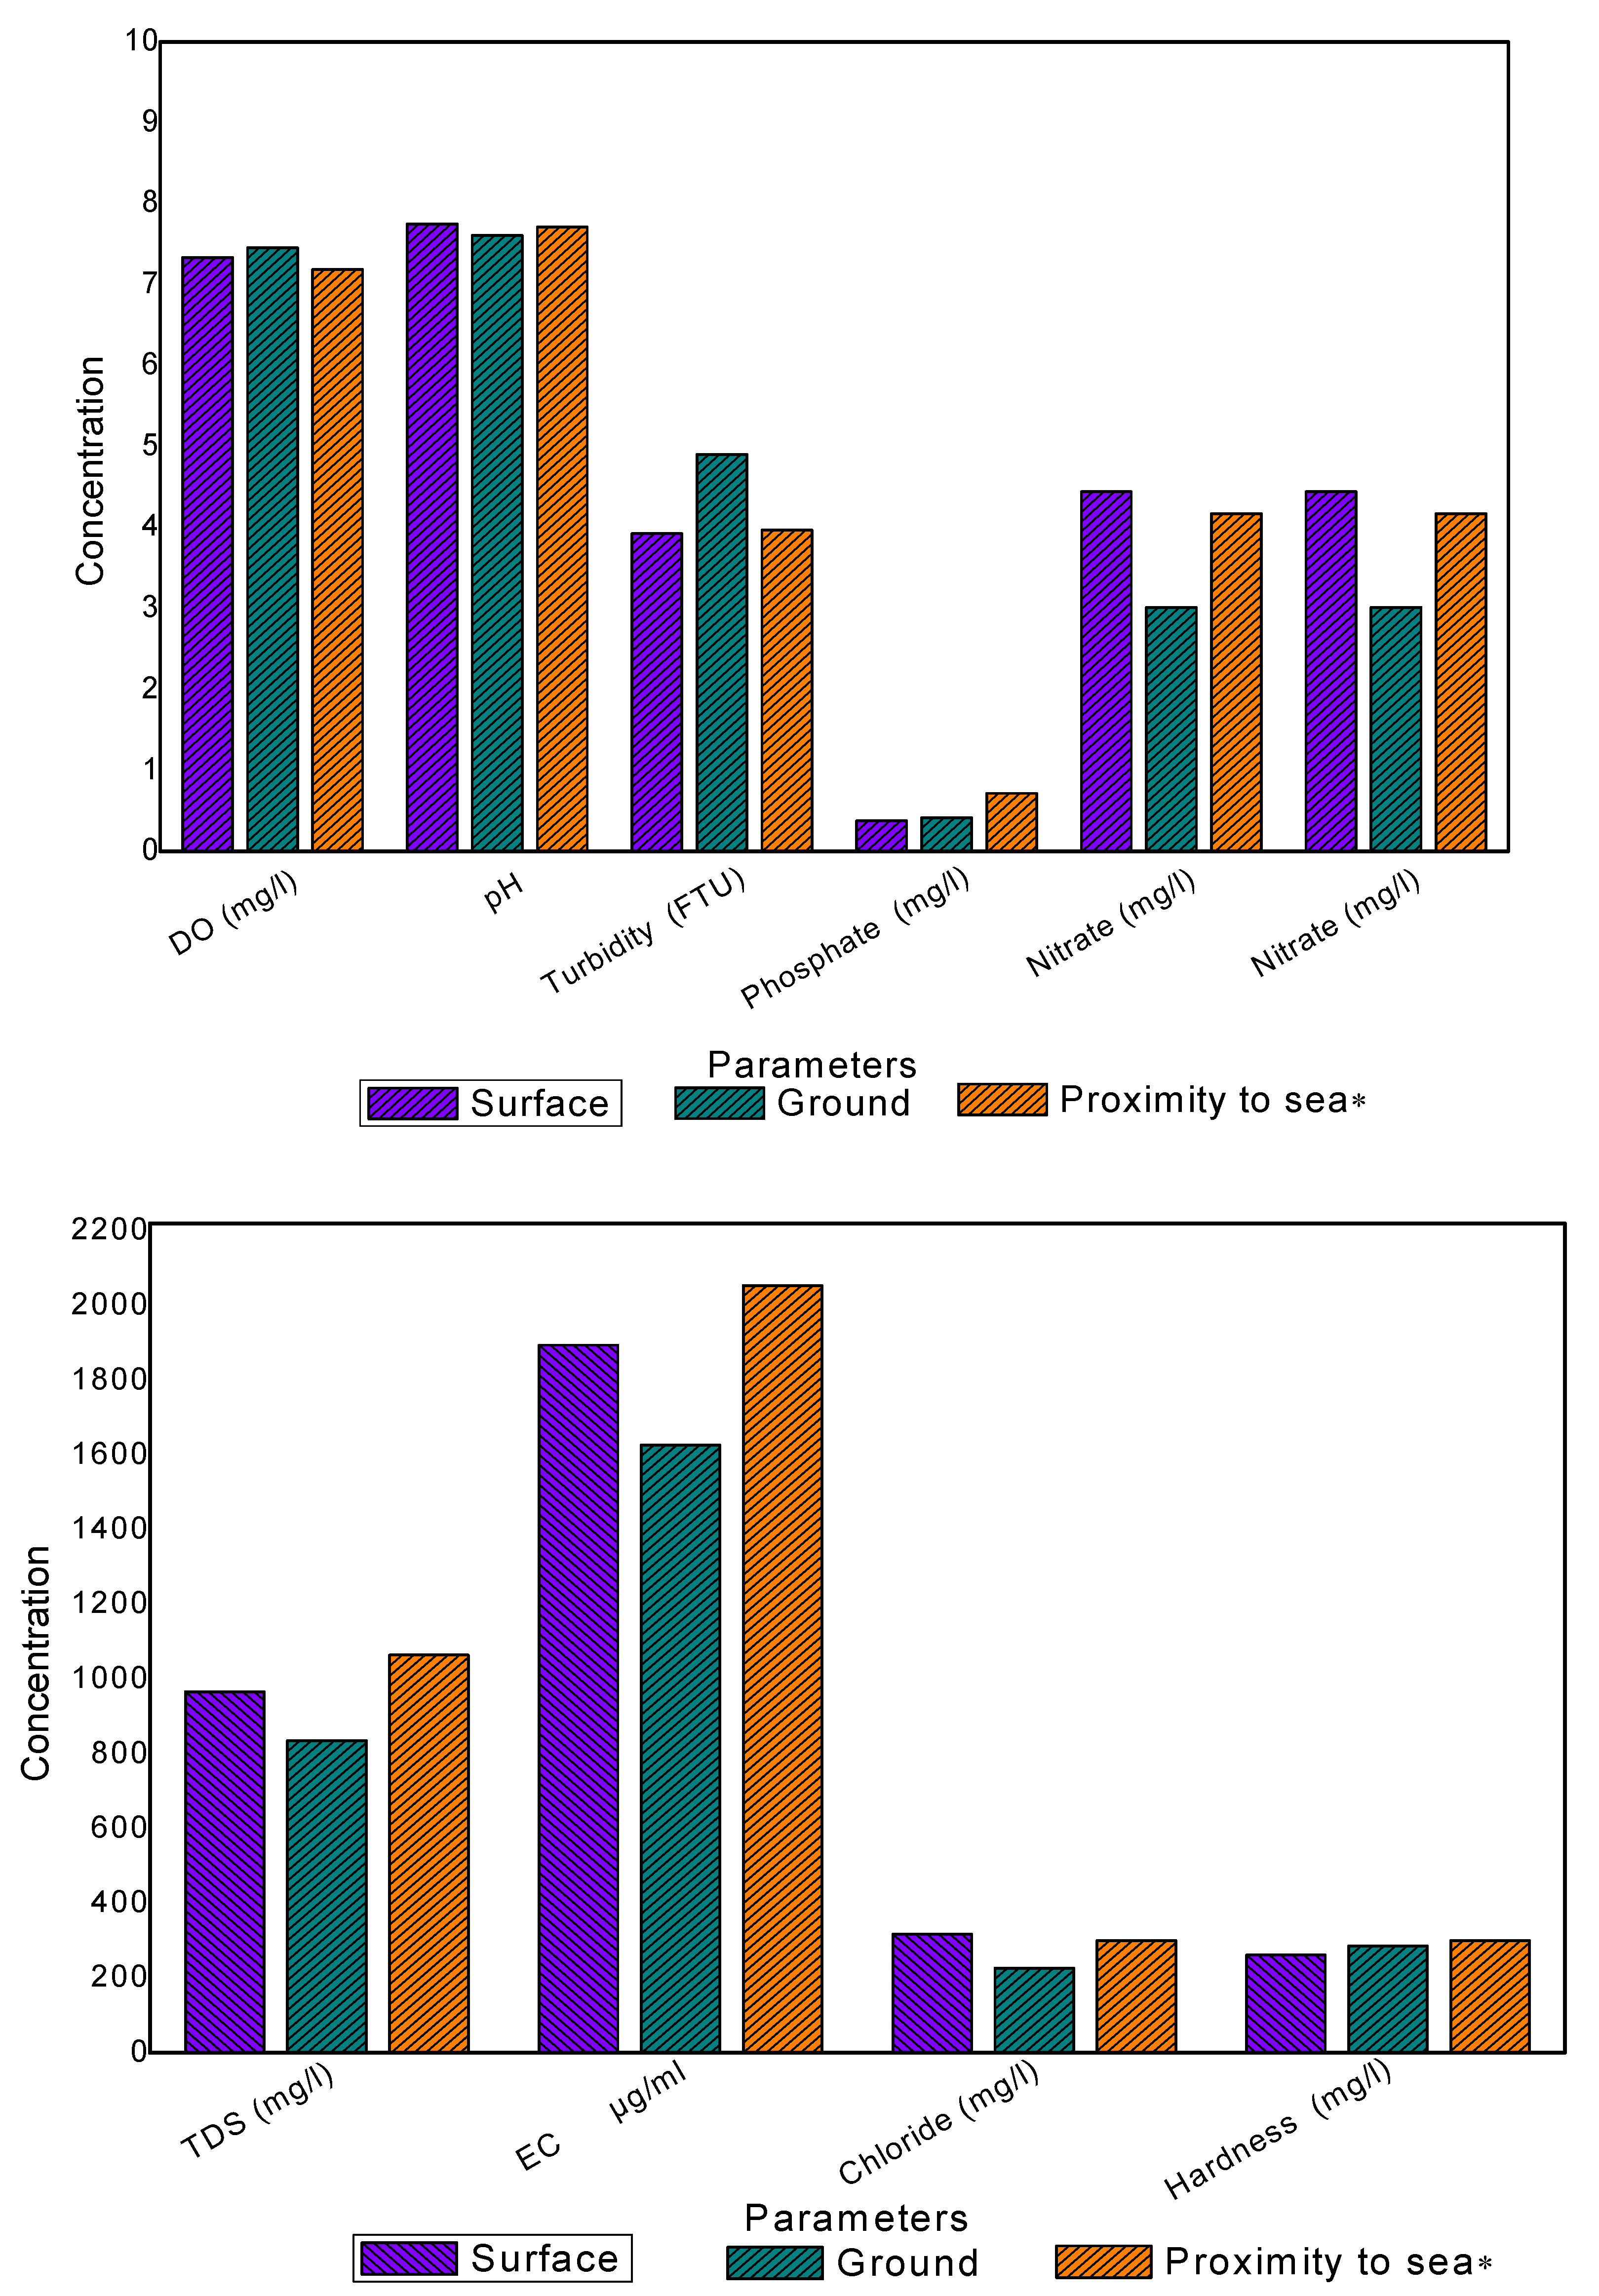
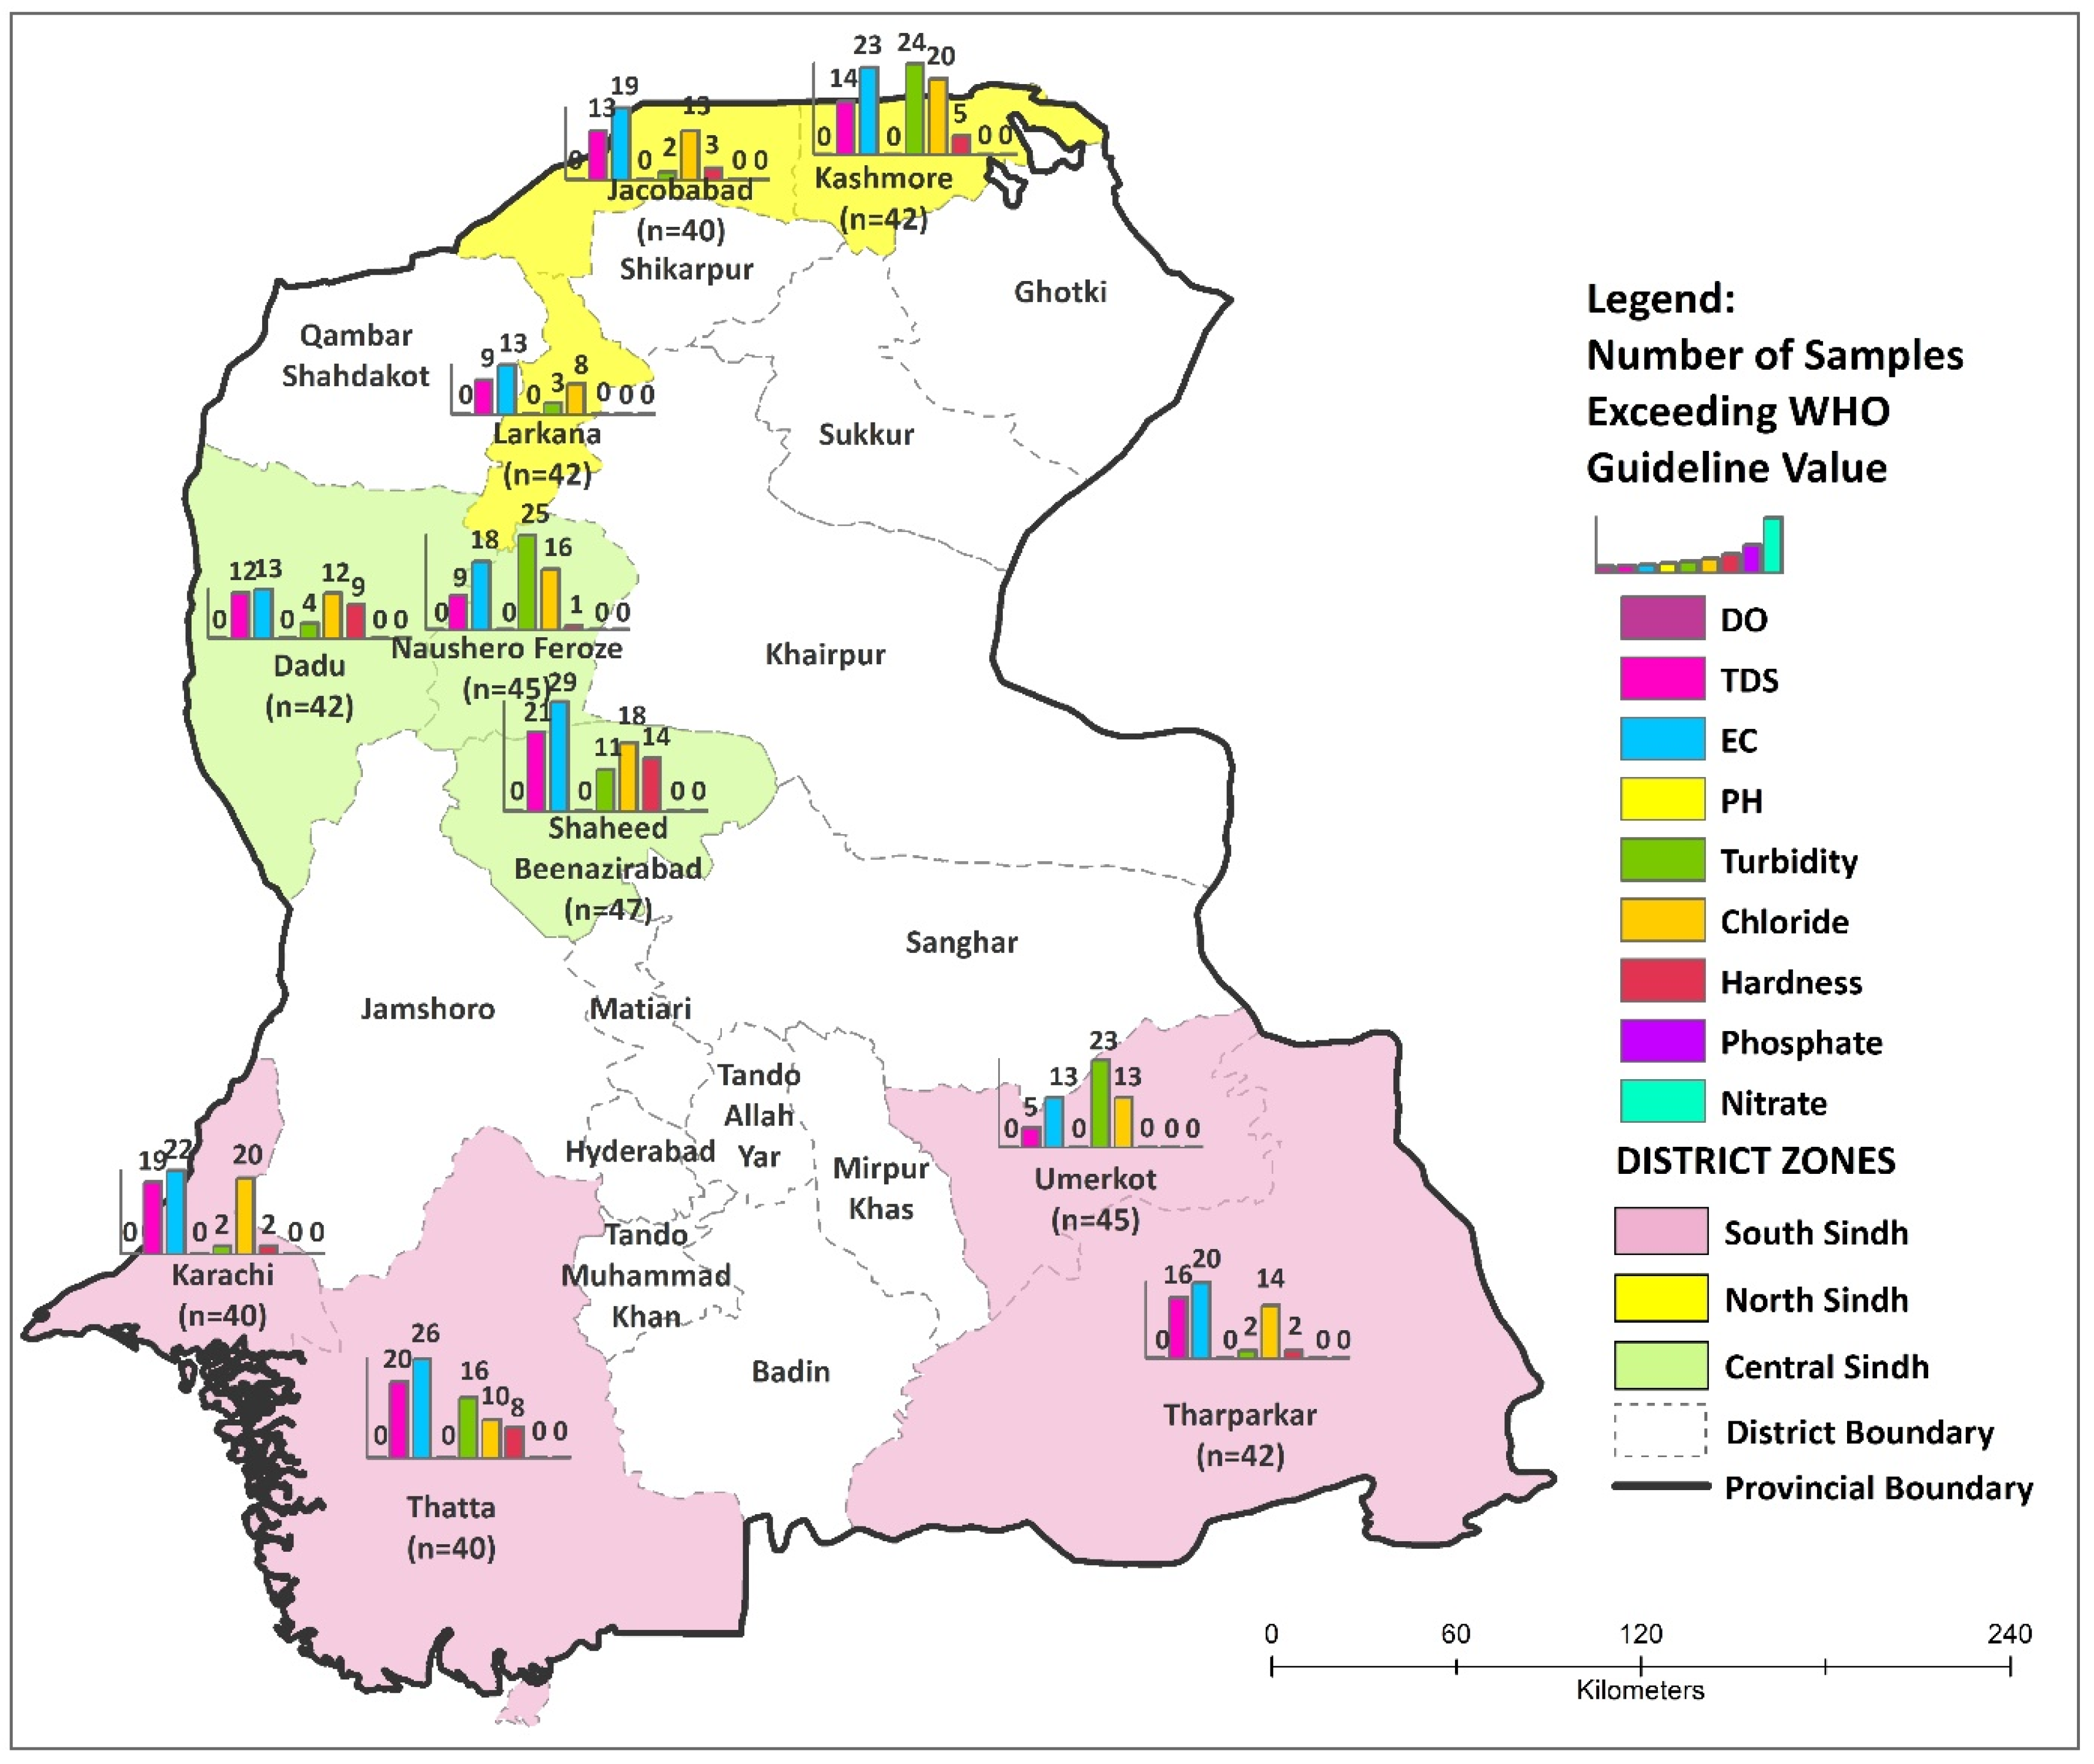
3.1. Characteristics of Drinking Water

Drinking water samples of 425 primary schools from the point of use were collected, and approximately one-third of schools reported that the water is available throughout the year from the main source. Onsite water treatment systems were available at 6% of the schools. However, none of these schools had tested the drinking water’s quality during the past two years.
The average concentrations for drinking water quality parameters (DO, TDS, EC, pH, Turbidity, Chloride, Hardness, Phosphate, and Nitrate) were generated for each school by zone as shown in Table 4, Table 5 and Table 6. Among zones, the schools in the South zone had the poorest water quality. The average TDS, turbidity, and chloride concentrations in south zone districts (Sujawla, Umerkot, and Tharparkar) exceeded the WHO and Pakistan Environmental Protection Agency (EPA) guideline values [22,23]. The Pearson correlation results showed that all the dissolved salts indicated a strong positive correlation with TDS and EC values.

3.1.1. Electric Conductivity

In our study, we measured conductivity values that ranged from 240 uS/cm to 7190 uS/cm and their average highest values were 2150 mg/L exceeded standard recommended limits in South Sindh (1881 uS/cm) and Central Sindh (1713 uS/cm), as shown in Table 4. Zones with the highest average EC also have the highest levels of TDS [32]. This may be due to the inorganic pollutants that enter through agricultural runoff and sewage leakage from large drains present in both zones such as Right Bank Outfall Drain (RBOD) being a drainage canal located on the right bank of the Indus river and the Left Bank Outfall Drain (RBOD) being a drainage canal located on the left bank of Indus river in Pakistan. Both canals collect saline water, industrial effluents, and Indus river basin floodwater from more than two million hectares of land into the Arabian Sea. These drains also reported contaminating Mancher Lake (a major drinking water reservoir in south Sindh) [35,36,37]. Similar to the previous study [17], surface water contamination is higher in urban areas as compared to rural areas [38]. The major urban cities were located in South and Central Sindh. Additionally, the Arabian sea bordering the southern part of the Sindh and also contributing to the intrusion of saline water into the freshwater zone as a result of over-pumping for agriculture use may also contribute to the higher levels of EC in the zone [39], whereas, in central Sindh, high EC may also contribute through the extensive evaporation of the water from a large surface area of the river and lakes at high atmospheric temperature and the dry season during the period of sampling (March–August) [40]. Similar results are reported in the drinking water of India with almost similar landscapes and potential sources of contamination [16].

3.1.2. Total Dissolved Solids (TDS)

In our study, TDS was found within the range of 130 mg/L to 3730 mg/L. The high average TDS level was between 1000–1250 mg/L, which exceeded WHO recommended limits in South Sindh [23], and, overall, TDS exceeded the limits in 33% of the samples. Regionally, TDS was elevated in 36% of the samples from South Sindh when compared North Sindh (29%) and Central Sindh (33%), as shown in previous studies [7,40,41], which took samples from community water sources rather than schools, showed variation in TDS results by location and water source (ground and surface) which is consistent with our findings, and we can expect larger TDS with surface water [7,40,41]. A few studies in the same study population (community settings) found different results, which could be due to water treatment, the difference in study methods (small sample size, sampling technique, non-representative sample, etc.), or a focus on only the primary source of water, whereas we considered both primary and secondary sources of water [42,43].
The climate of the study province (Sindh) remains predominately arid with very low rainfall averaging <200 mm annually, resulting in minimum variation in water quality parameters. In this region, the natural process such as ion exchange processes in aquifer and solubility of rocks has contributed considerably to increasing EC and TDS values [43], which were noticed in our study samples (Table 4 and Table 5). Comparatively, the increase in TDS and EC concentration in surface water source rather than groundwater indicates industrial and residential wastewater contamination which possibly mixes into surface water [7,35]. The excessive TDS effect on drinking water taste may lead to unwanted gastrointestinal irritation and physiological reaction. Previous studies in this area have also confirmed high EC and TDS [44,45,46], which raises serious concerns regarding the health of children in primary schools of Sindh province.

3.1.3. pH

Previous studies on water quality in community settings have shown pH levels in drinking water to be within the WHO standards [7,41]. The average pH values in our study were between 7 and 8 and were within the recommended limit according to WHO (Figure 3) and Pakistani EPA drinking water quality guidelines [22,23]. The pH range was from 6.77 to 8.7 with Central Sindh at 6.8 and South Sindh at 8.7 with an average pH value of 7.6 (Table 4, Table 5 and Table 6). Nevertheless, the pH often has no direct effect on water users (children), but indirectly it may affect health. Our drinking water samples showed neutral to alkaline pH that is possibly due to dissociation and weathering of HCO3- and carbonate rocks existing in the study area [40,46], and the elevated level (concentration) of HCO3- can occur due to the weathering process of carbonaceous-rock [18,30]. The high pH water may cause irritation of the skin, eyes, and mucous membrane. Additionally, it may influence the efficiency of disinfection and the degree of corrosion of metals [30,44]. In our study, the alkaline pH may not be likely to cause excessive corrosion of water supply pipes.

3.1.4. Turbidity

In our study, the average highest concentration of turbidity was observed between 7.5 and 9.5 NTU (Table 4, Table 5 and Table 6). The drinking water in schools of South Sindh had higher turbidity (Table 4) when compared to the other two zones. The average turbidity in this region (27 NTU) exceeded WHO and Pakistani EPA drinking water quality guidelines [22,23]. The turbidity was also elevated in Central Sindh (31%) compared to South (26%) and North Sindh (23%), as shown in Figure 1. Previous studies in community settings showed little variation in the results which may be due to the smaller sample size and non-representative sample (rural specific or urban specific) in those studies apart from the difference in study settings (community instead of school settings) [11,40,45,46]. In our study, the schools in South Sindh with high turbid water are also more vulnerable to microbiological contamination since the pathogens attached themselves to the suspended particles in turbid drinking water. These suspended particles then shield pathogens from disinfectants and interfere with the disinfection process [45,47].

3.1.5. Chloride

In our study, chloride ranged from 12.5 mg/L to 1130 mg/L, whereas the highest average concentration of chloride was between 250–351 mg/L (Table 4). The South Sindh zone had the highest number of schools with drinking water that exceeded standard limits (250 mg/L) [22,23]. Overall, chloride exceeded the recommended limit (Figure 3) in 36% of the samples in Central Sindh compared to 34% of the samples in South and 33% of the samples in North Sindh, as shown in Table 5. In the present study, the schools with a high level of chloride in drinking water can put children at risk for developing heart, kidney, and liver problems on long-term exposure [30,44]. The high chloride level can also bring corrosivity, especially when chloride combines with sodium to form sodium chloride, which may damage plumbing, water heaters, and other appliances causing toxic metals to leach into the drinking water [30]. However, chloride contamination can easily be removed using reverse osmosis (RO) in drinking water treatment systems [23,32].
The possible source of chloride in groundwater contamination in South Sindh could be due to the saltwater intrusion (Figure 4). In addition, the studies reported that the coastal aquifers (southern Sindh) are overexploited; this may possibly lead to the saline intrusion, which increases Na and Cl concentrations in the coastal aquifers [46,47]. Elevated chloride in surface water contamination may be due to wastewater from industries (specifically sugar mills in South Sindh) and effluent from large drains in both zones (e.g., right bank outfall drainage and left bank outfall drainage) [46,47,48]. We were unable to find similar studies, but studies in similar geographic locations showed little variation in the chloride concentration in drinking water [40,49]. In addition, deviation of Cl- in surface water from the standard is a result of anthropogenic activities such as fertilizers and coal containing sulfide along with minerals with sulfate derivatives from air pollutants [40]. Moreover, the elevated Cl- concentration might be due to surface water infiltration contaminated with salts and also results from geologic matter through dissolution of alkaline earth metal salts [31].

3.1.6. Hardness

The average concentration (Table 4, Table 5 and Table 6) of hardness (291 mg/L) remained within the standard limits; however, some samples in all three zones (Central Sindh 24, South 12, and North 8 samples) exceeded the recommended limit [22,23]. More samples were found exceeding hardness limits in Central Sindh (19%) compared to South (7%) and North (6%) Sindh (Figure 3). Sources of elevated hardness are generally the same as for chloride. The hardness in water mainly indicates availability of magnesium and calcium ions which exist mainly in sandy rocks specifically found in limestone [31].
Our results are consistent with a local study [49] and studies done in Iran and India [16,17]. While the concentration of hardness is different from studies performed in other provinces, this may be due to the difference in landscape, main drinking water source, or potential sources of contamination [14,44].

3.1.7. Dissolved Oxygen (DO) Nitrate and Phosphate

Among all the parameters, the average concentration of DO (7.3 mg/L), nitrate (3.2 mg/L), and phosphate (1.3 mg/L), as shown in Table 4, Table 5 and Table 6, were within standard limits [22,23]. These findings were similar to the available studies [11,40,41]. However, few samples exceed the standard limit for phosphate and nitrogen. The potential sources of phosphate and nitrate contamination are sewage and runoff from animal farms and fertilizers. In our study, the drinking water in rural areas with agricultural land and unimproved sewage system were most vulnerable to these contaminants. The nitrogen in fertilizers not absorbed by the plants may leach into groundwater through surface runoff in the form of nitrate, which increases the nitrate concentration in groundwater sources. In addition, the schools with the septic systems remove half of the nitrate in the wastewater; and the other half percolates into the groundwater. The schools with an increase in nitrate concentration in ground water may also indicate the possible presence of other harmful agricultural pesticides and residential contaminants [11,40], as shown in Figure 4. In our study, the presence of nitrate in both ground and surface water was largely due to untreated sewage discharge, agricultural activities, decaying of animals, plants, and excreta [31,32]. In present study settings, the agriculture activities mainly rely on pesticides and fertilizer use, such as urea, diammonium phosphate, etc. that ultimately pollute the water resources.

3.2. Correlation Analysis

In the Pearson correlation analysis, the TDS and EC showed a positive correlation with all the parameters except pH. Chloride levels had a positive but weak correlation with the other parameters. The hardness had a negative correlation with phosphate and nitrate, while phosphate demonstrated a weak positive correlation with nitrate. Overall, the Pearson correlation results showed that all the dissolved salts indicated good positive correlations with TDS and EC values, which suggests that TDS and EC values significantly correlate with pollutant parameters such as chloride, turbidity, and hardness (Appendix A Table A2). This indicates that chloride, turbidity, and hardness have high values as a result of anthropogenic contamination in the study settings.
The WQI values demonstrated a positive relationship (p < 0.01) with EC, TDS, chloride, and turbidity. Based on these correlations, it is evident that EC, TDS, chloride, and turbidity were the most influential factors for the computed WQI values of drinking water sources in the study settings. During the last two decades, drinking water quality status in the study area has deteriorated possibly due to the rapid expansion in human population, resulting in an increase in anthropogenic activities, as evidenced in previous studies [30,44]. Therefore, it can be inferred that the precautionary measures taken by the concerned authorities in the country to protect water quality have been inadequate. Furthermore, the industrial, domestic, and agricultural waste along with the climatic changes are also major threats to the drinking water quality in Pakistan [50,51].

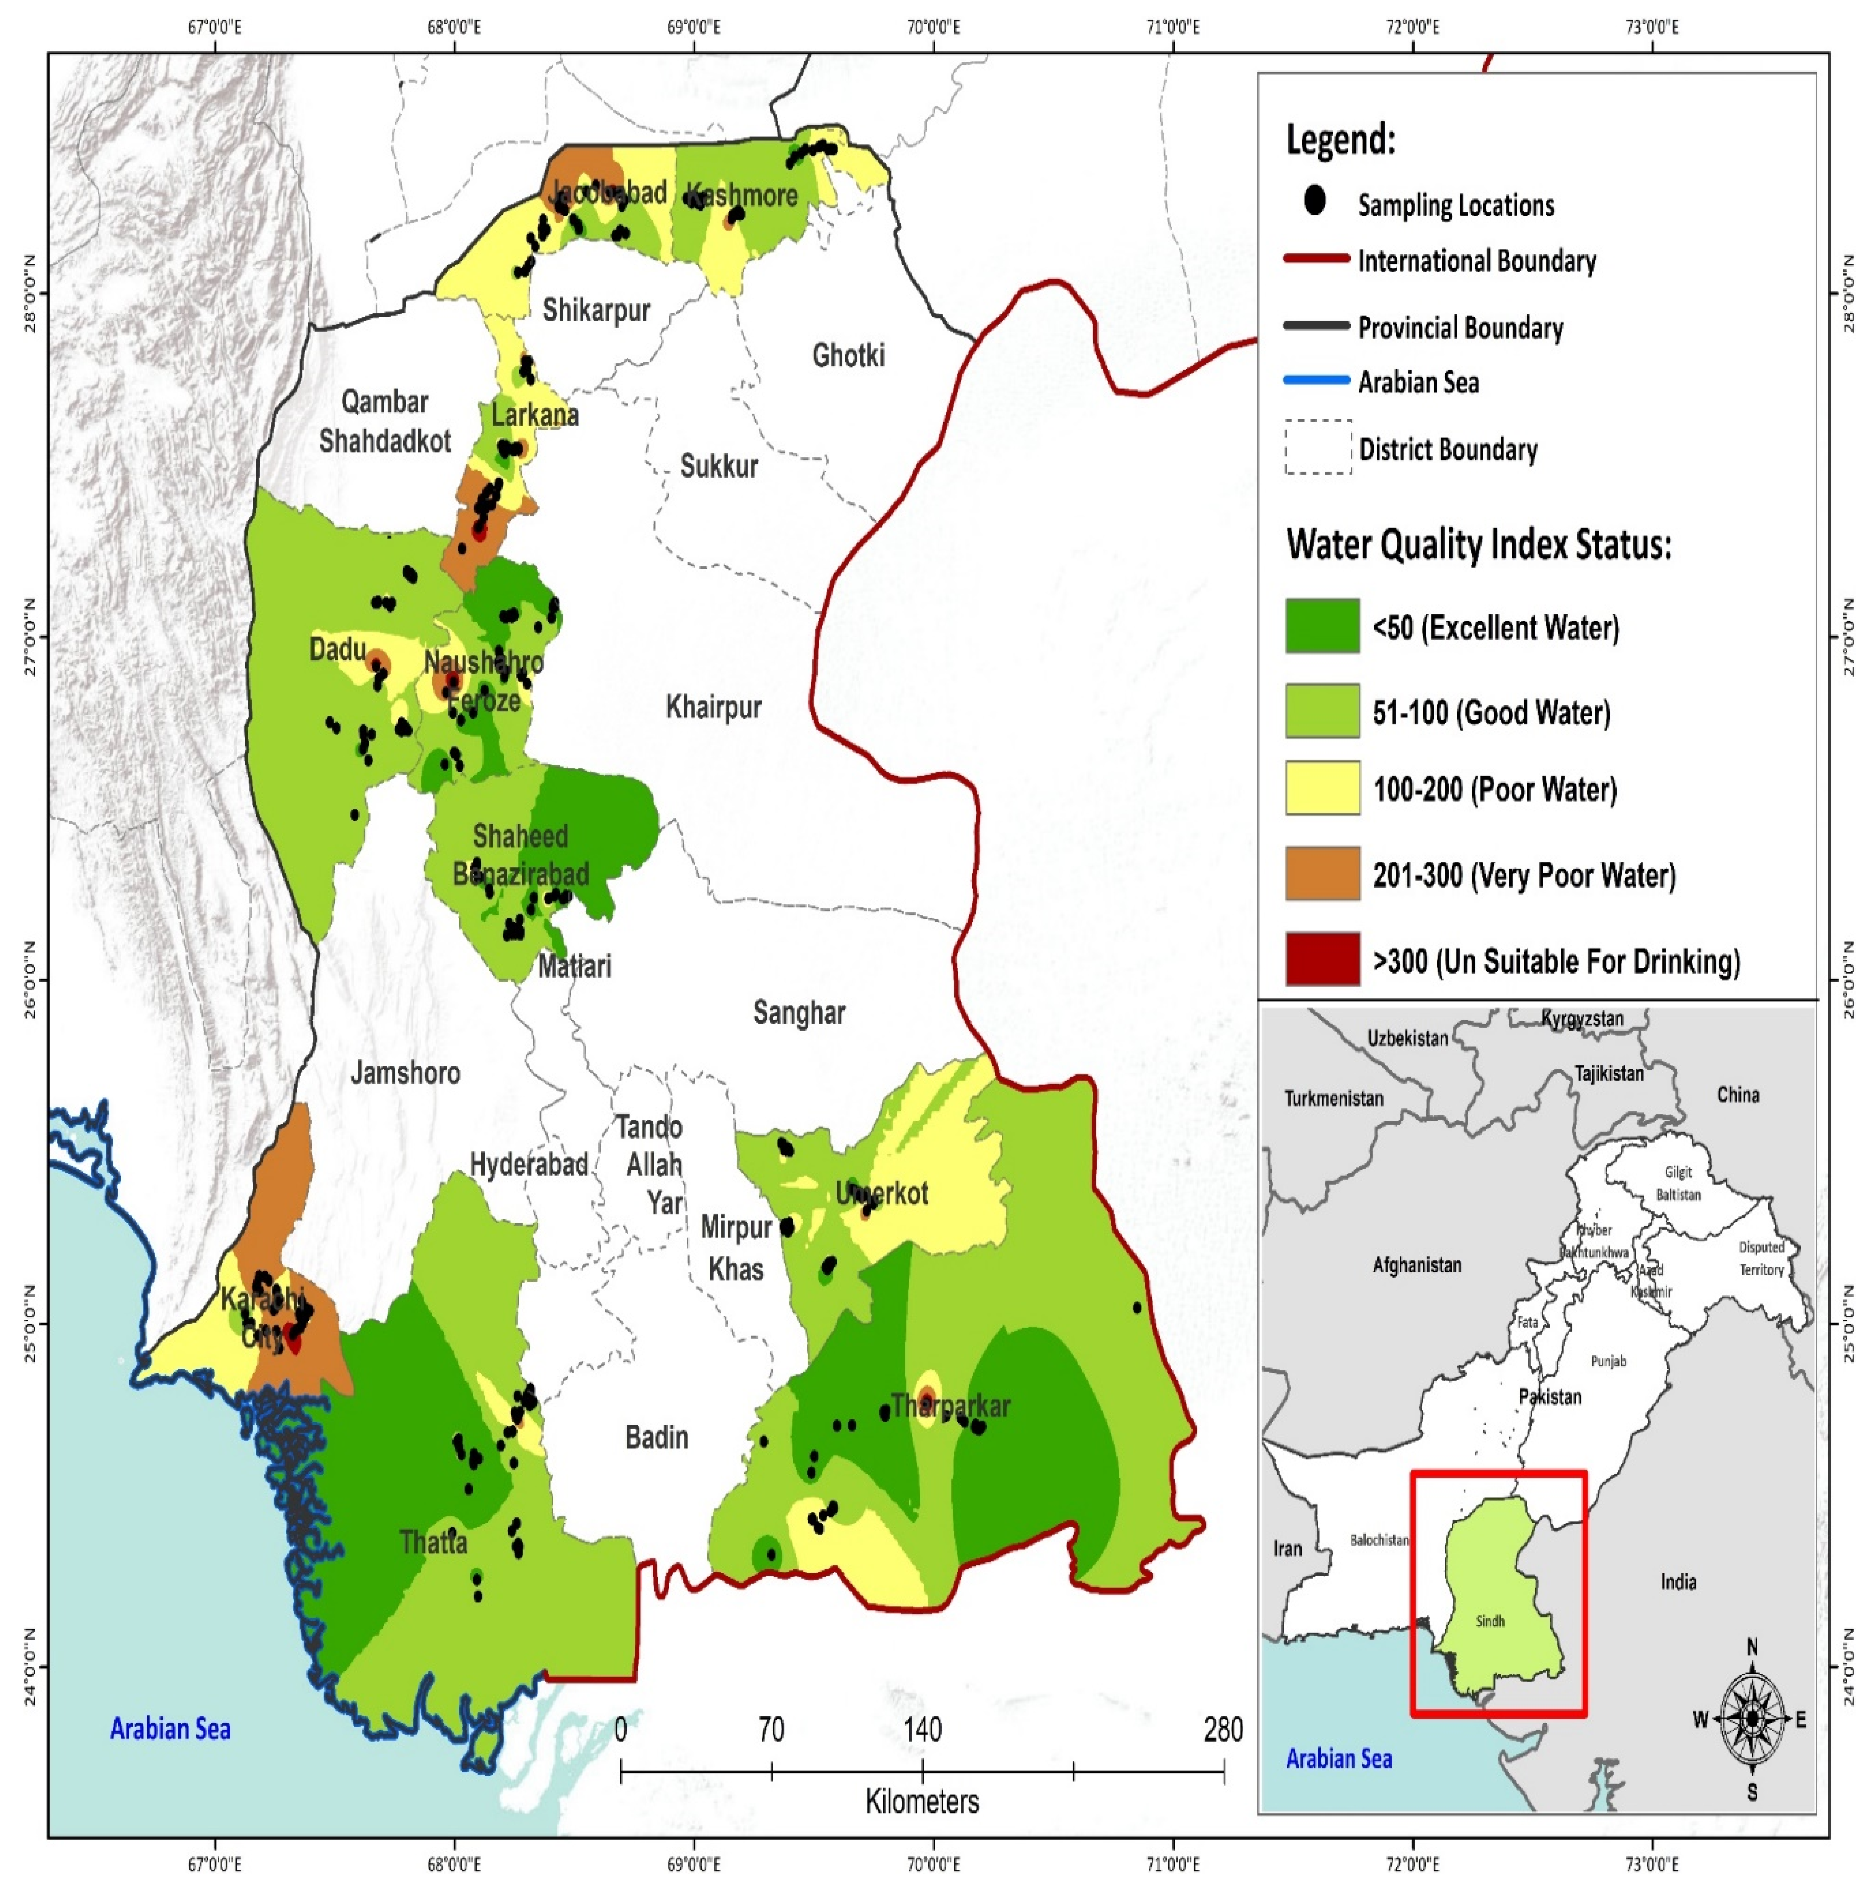
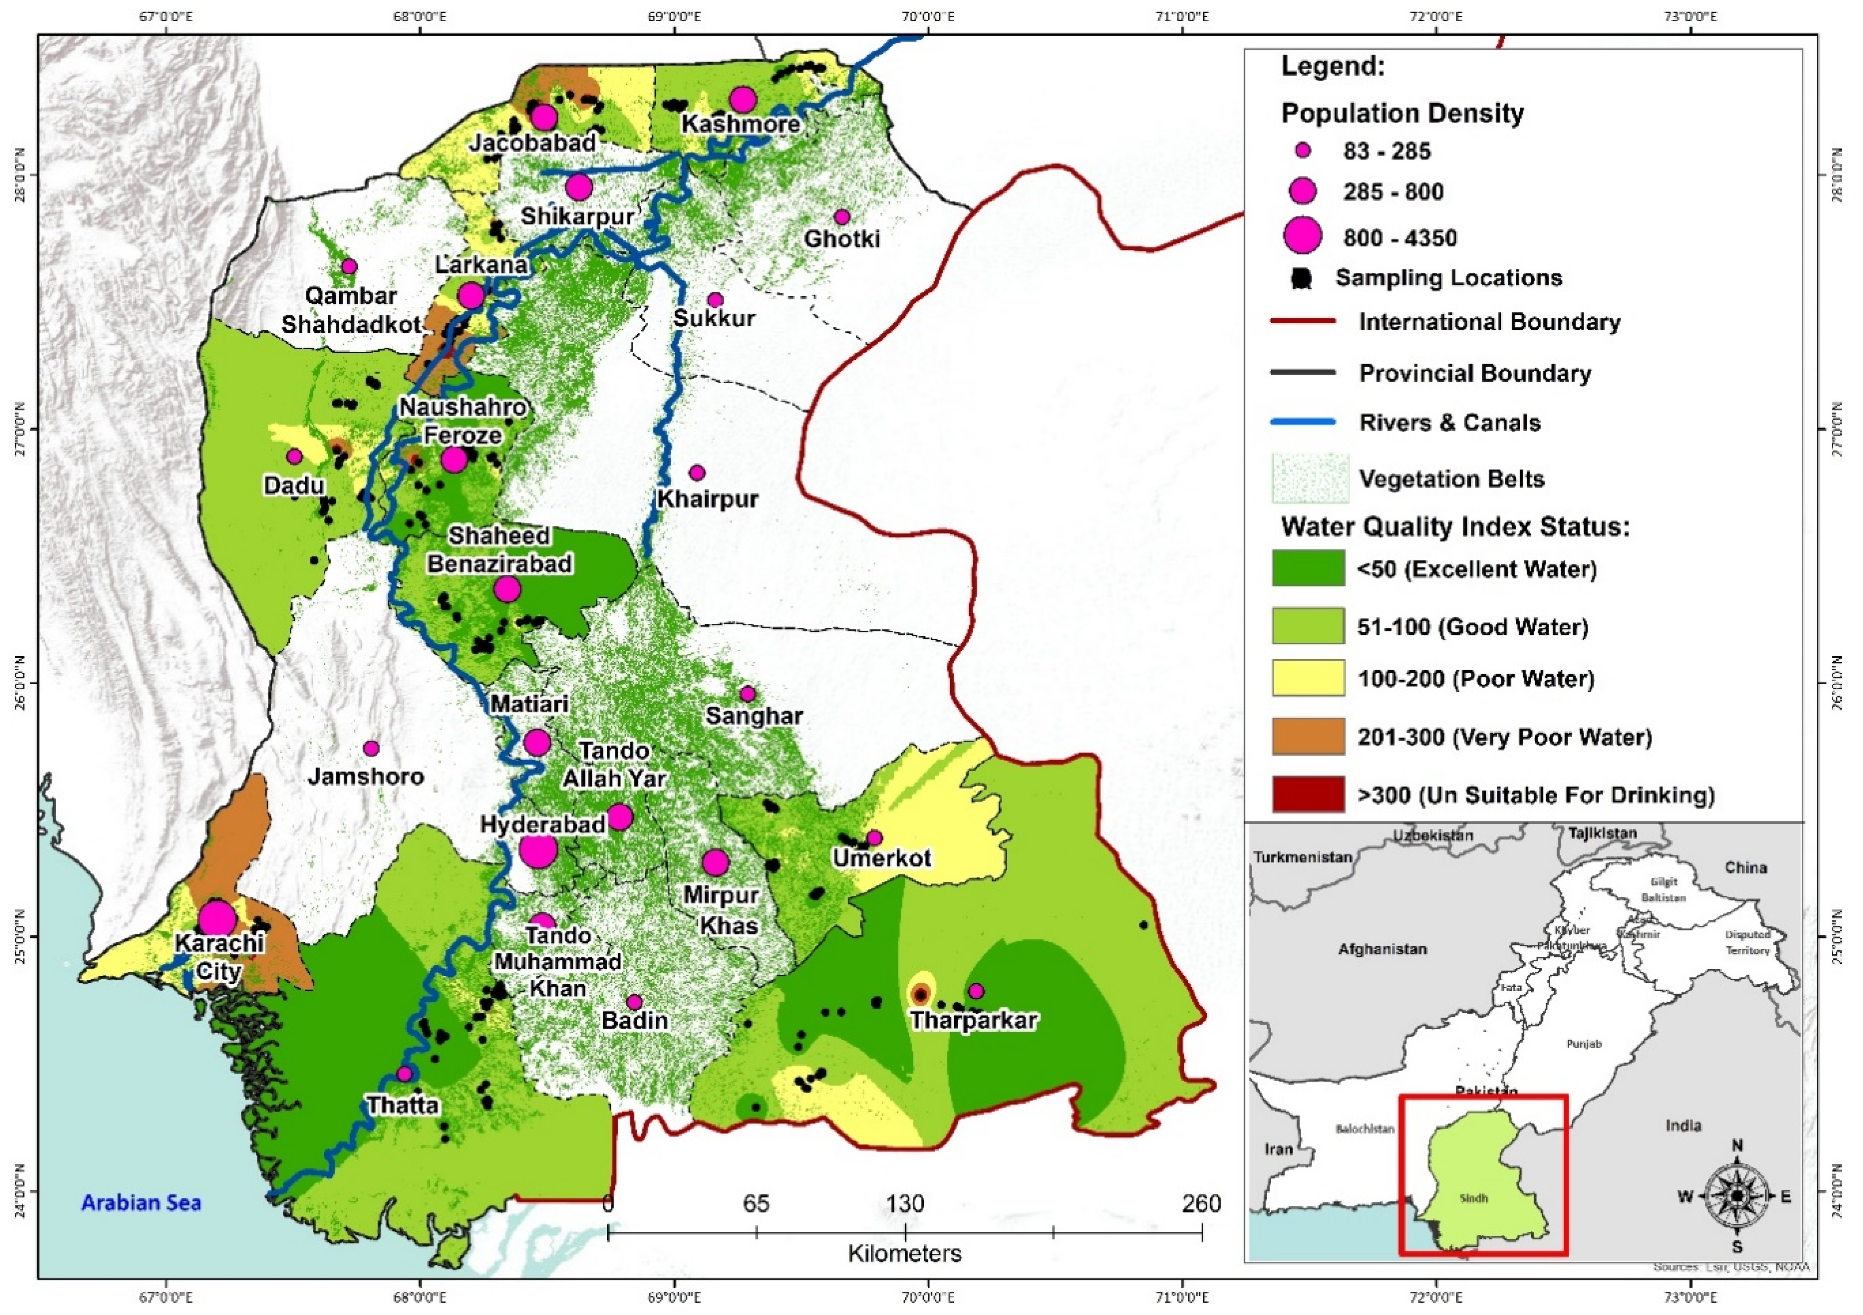
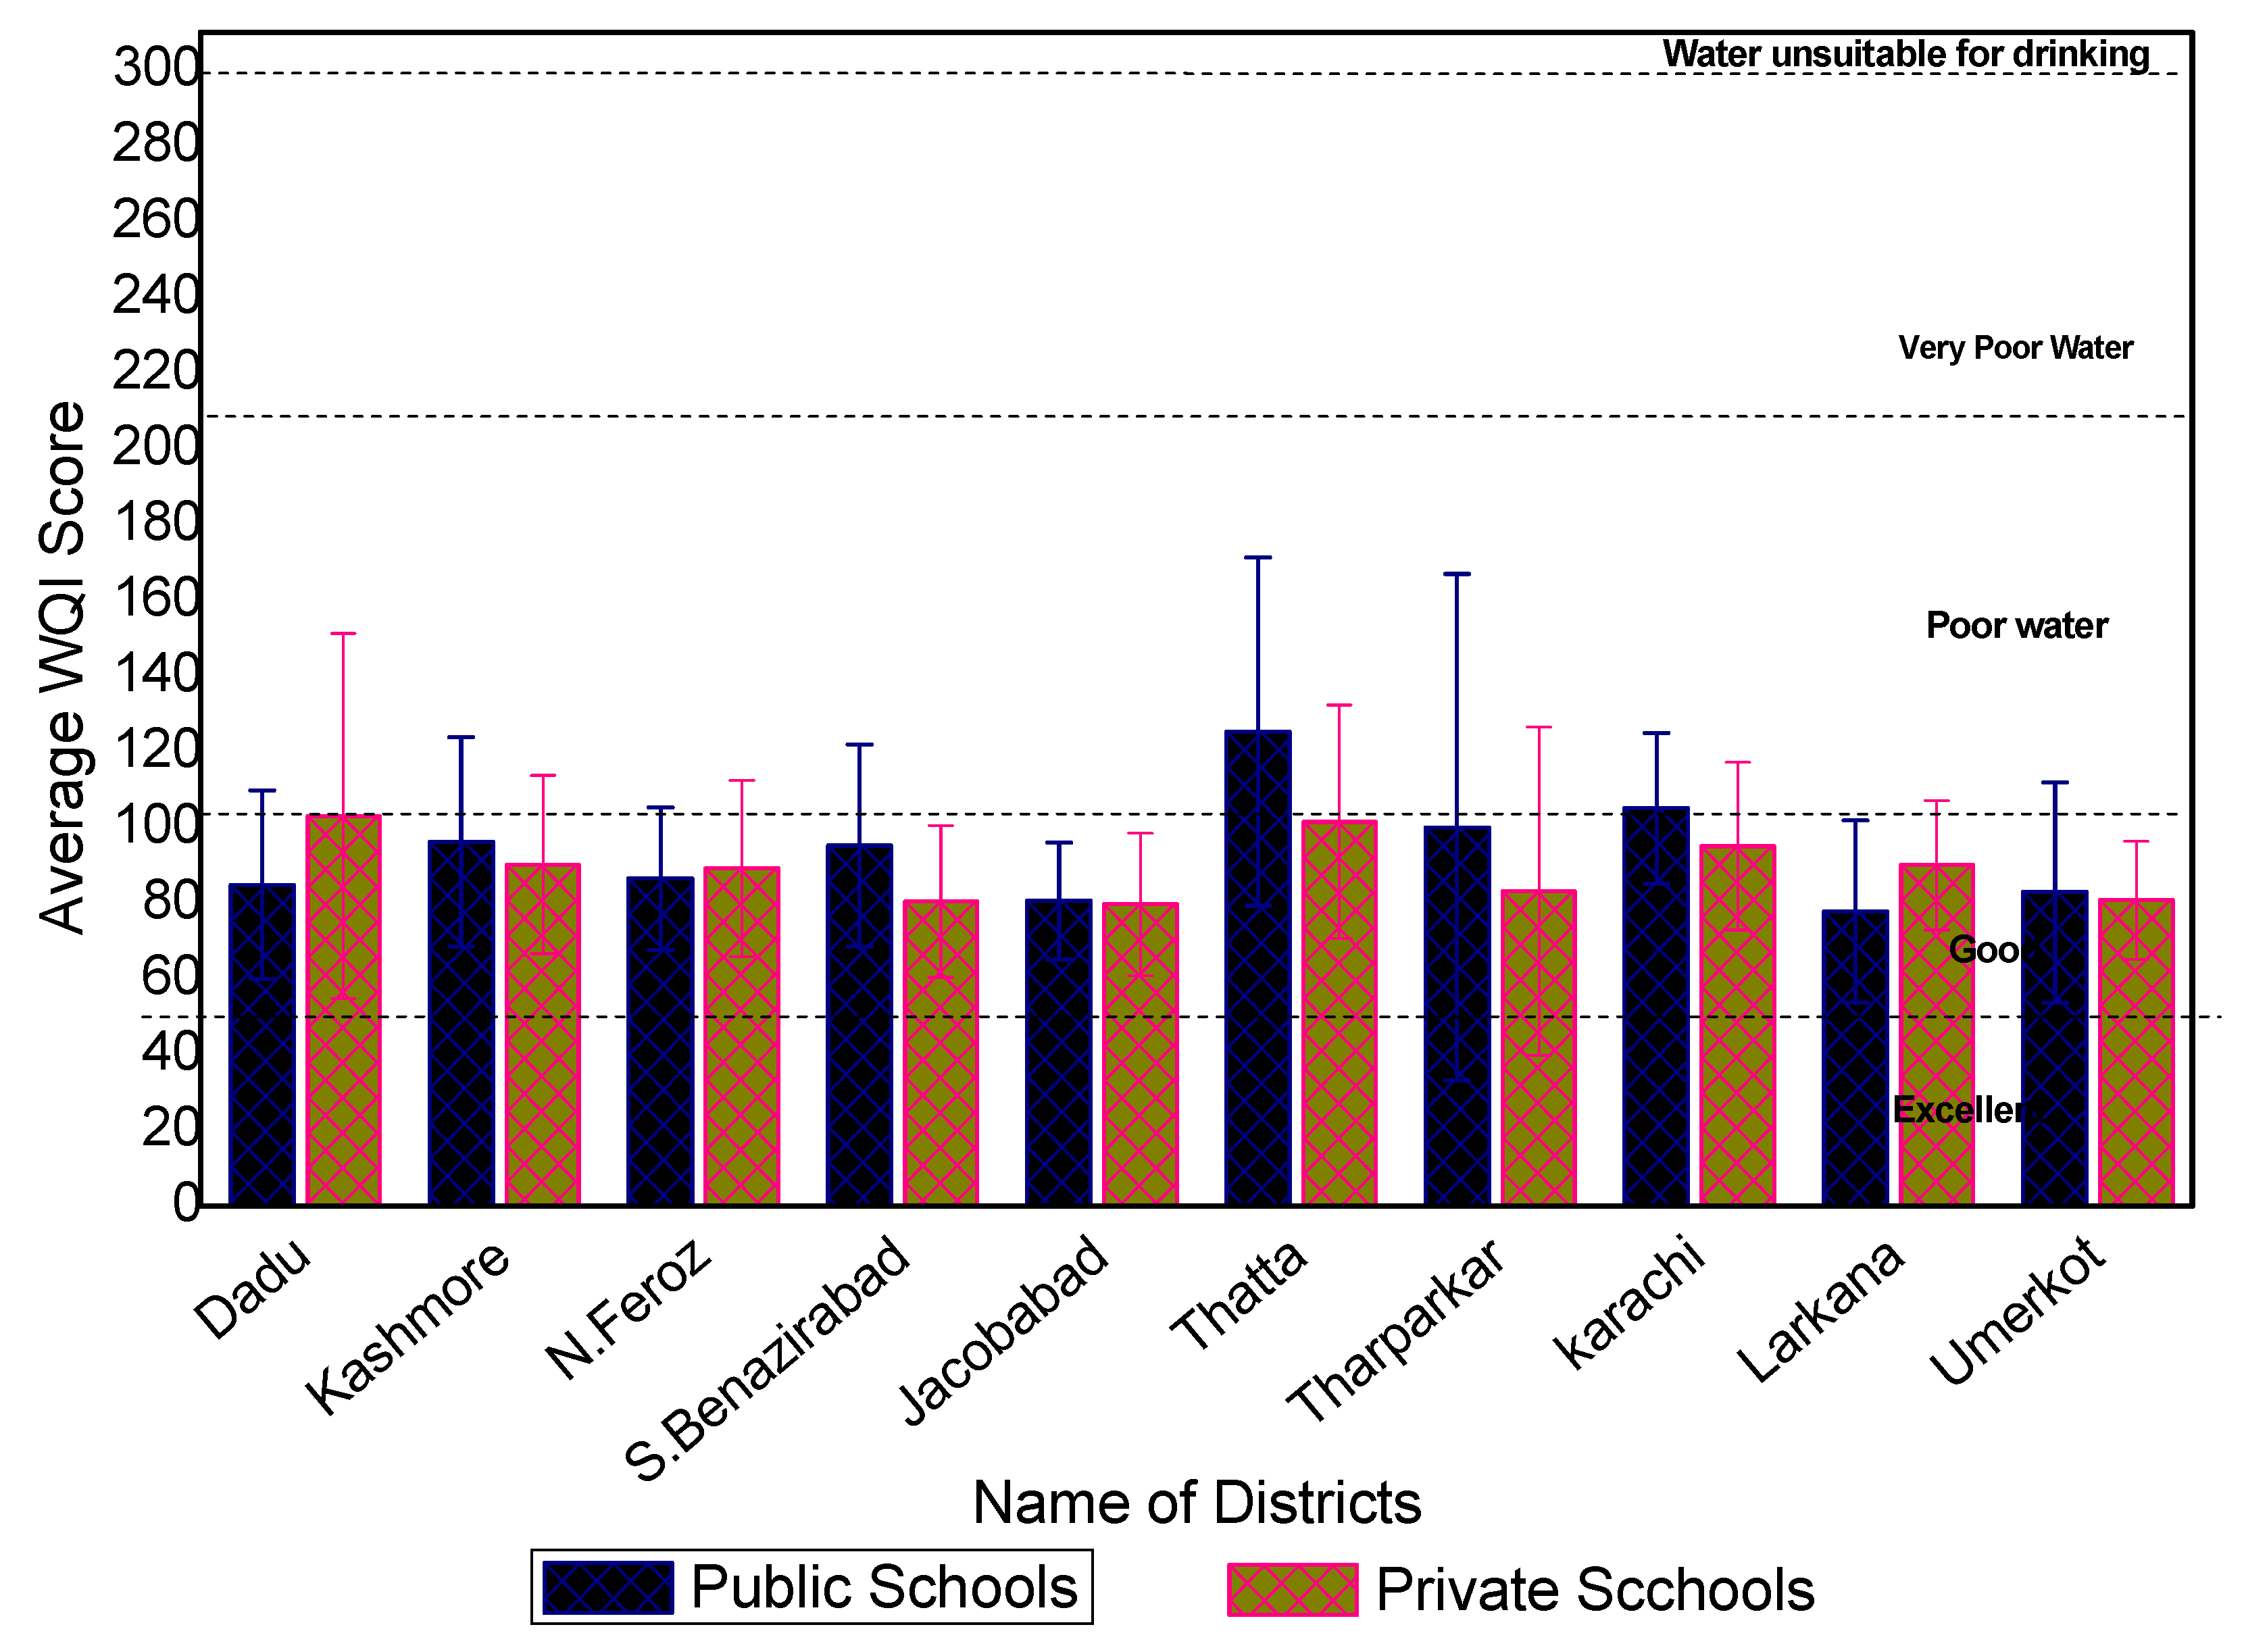
3.3. Water Quality Index

3.3.1. Water Quality Results

The WQI values for each sampling location were determined using weight values assigned according to their relative importance for drinking purposes to each water quality parameter (Table 2). The drinking water quality was categorized into five categories based on WQI values [33,34], as shown in Table 3. This method is considered the simplest method aimed to give a single value in grading water quality by using a list of parameters and their concentration in a single value. This single value provides a wide understanding of the water quality and its consumption (suitability) for different purposes such as irrigation, industrial, and drinking [41,46,49]. ArcGIS version 10.2 software was employed to present the spatial distribution of schools in the Sindh province and their WQI status was graded into five colors, as shown in Figure 4.
The WQI of schools (Figure 4) in central Sindh that primarily used groundwater indicated an overall good quality drinking water; over half (53%) of the schools have excellent drinking water, 21% possess good quality drinking water, followed by 18% with poor water, 6% with very poor water, and 1% with water that is unsuitable for drinking. The WQI in North Sindh, where both groundwater and surface water are used for drinking, indicated god quality water, with just under half the samples rated good (49%), followed by excellent quality (36%), poor (13%), and very poor (1%). In the southern part of Sindh province, which depends mainly on surface water, almost a third of schools in each group have access to either excellent water (33%), good water (34%), or poor water (29%), while few school children consumed water which was of very poor or unsuitable to drink quality (3%). Among all three regions, schools in central Sindh have greater access to drinking water with excellent quality (54%), while schools of the southern districts of Sindh were more vulnerable with 33% of school children consuming poor or very poor to unsuitable drinking water. The southern part of Sindh adjoins the seacoast where drinking water quality deteriorates (Figure 5) due to the dumping of urban and industrial waste. This area also has limited freshwater resources [50,51].

3.3.2. Discussion on Water Quality Index

Overall, 74% of primary schools have access to excellent or good quality drinking water compared to 26% of schools with access to either poor, very poor, or unsuitable drinking water. However, there was no significant difference observed between private and public schools (Figure 6). Previous local studies revealed that the drinking water at some locations in Sindh Province is not fit for drinking [7,40,50]. Other studies have found variable results. A study of groundwater in Iran found that 52% of consumers had excellent or good quality of drinking water, while 48% of the population consume poor to unsuitable drinking water [17]. A study in south India found that water quality varied from Excellent to Poor, with significant seasonal variation due to weather (temperature and rainy season) and pilgrims, who brought enormous pressure on the basic requirement fulfillments like shelter, food, and waste disposal [19]. A similar study of surface water sources used for drinking showed that the majority of the samples at upstream locations were of excellent quality for drinking compared to poor quality at downstream locations, demonstrating the significant impact of diffuse and point sources of pollutants in these regions [38]. The results of these three studies vary compared to our study, mainly due to their focus on single water source (surface or groundwater), difference in WQI methodology, climatic conditions and variation in the source of pollutants, i.e., agriculture pesticide vs. industrial effluent.
The quality of drinking water is determined by the quality of water source (Appendix A Figure A1), the level and treatment efficiency, and condition of water supply lines. In Pakistan, most schools do not have a fresh water source available and ground water is saline; pupils have no choice but to use this type of water for drinking. The schools with drinking water quality do not meet the WHO standards [2]. In the urban schools, the main reason for water contamination is due to the intermixing of sewage lines with drinking water supply lines—while in rural areas, where surface water is used no pre-treatment, facilities are available for filtration of water. In addition, the hand pumps and wells are not safe from surface runoff and flooding [24,46,49]. Industrialization and rapid urbanization have placed immense stress on water resources and discharge of wastewater into natural water resources that decreases ground and surface water quality [7,11,51]. The schools with improved water quality might have safe natural ground water source or schools with better management systems, additional support (related to WASH) from government, community, or other organizations have relatively better water quality [6,9,52].
In our study, the quality of drinking water is further worsened in the distribution lines, possibly due to the leakage of water pipes at a point where the drainage water enters into the main drainage system [50,51]. At the school level, drainage water may be contaminated due to uncovered overhead storage tanks, underground storage tanks, and unhygienic handling of water by consumers [46,47].
During the last decade, the overall drinking water quality of the studied area has been subject to a rapid decline for various reasons. First, as a result of climate change, water resources (quantity and quality) in Pakistan have deteriorated; water temperature has increased and, as a result, a marked change has been witnessed in rainfall patterns, the behavior of glaciers, and the occurrence of extreme events such as floods, droughts, and greenhouse gas emissions [52,53,54]. Secondly, increases in the population have increased the stress on water resources with more human activities (Figure 6) compromising water quality [55]. Finally, the expansion of industries due to the transition of the country from an agricultural to a semi-industrial state contributes to the contamination of freshwater bodies, due to the lack of vigilant monitoring of industrial waste management systems [7,11,56]. The WQI tools have widely been used by investigators around the world for water quality monitoring in ground- or surface-water sources, but not purely on drinking water in school settings in a large study setting, or by considering both ground and surface water sources serving these schools.
There were a few limitations to our study. We presume variation in water quality by each season, since we considered a single water sample from each primary school; therefore, some of the WQI values might be strongly affected by variations along the year and suggest that this work must be improved by collecting data during a more extended period to identify these processes and its repercussions. Additionally, we assessed water quality using the WQI tool based on physicochemical parameters only. Future studies should consider metals and microbial parameters for better understanding of drinking water quality in school settings.

4. Conclusions

We used physicochemical parameters to characterize the drinking water quality using a WQI and analyzed the spatial patterns of WQI among primary schools of Sindh province in Pakistan. The WQI is considered a simple method to evaluate overall water quality and has been widely used. This is the first study conducted in school settings that used the WQI method to determine drinking-water quality. The study findings revealed that almost a third of schools do not have access to suitable drinking water for children. The main parameters found to contribute to poor water quality were EC, TDS, turbidity, hardness, and chloride indicating contamination of surface and groundwater sources through discharges from industrial, domestic sewage, residential, and agricultural runoff. Improved access to safe water and sanitation in schools is crucial to stop the transmission of water-related diseases. In order to ensure safe drinking water in schools, we recommend the regular monitoring of drinking water sources and, where needed, the use of low cost, simple and sustainable drinking water purification approaches, for example, chlorination, solar disinfection, and boiling. Furthermore, longitudinal studies may be considered in the future, which include metals, microbials, and physicochemical parameters to gain a better insight into the drinking water quality in present settings.

Author Contributions

Conceptualization, J.A. and L.P.W.; methodology, J.A., N.C., and L.P.W.; software, J.A., L.P.W., Y.P.C., and N.C.; formal analysis, J.A., L.P.W., Y.P.C., and N.C.; investigation, J.A. and N.C.; data curation, Y.P.C., L.P.W., and N.C.; writing—original draft preparation, J.A., L.P.W., Y.P.C., and N.C.; writing—review and editing, J.A., L.P.W., and N.C.; Writing—review and editing, Y.P.C., L.P.W., and J.A.; supervision, Y.P.C. and L.P.W.; project administration L.P.W. and J.A.; funding acquisition, J.A. All authors have read and agreed to the published version of the manuscript.

Funding

This study was financially supported by the USAID (Seed Grant No: P-II/07).

Acknowledgments

The researchers wanted to acknowledge USAID for providing monetary support; US-Pakistan Center for Advance Studies in Water, Mehran University of Engineering and Technology for providing the platform to accomplish this research project. Division of Public Health at the University of Utah and School of Community Health Sciences at the University of Nevada, Reno for providing technical support.

Conflicts of Interest

The authors declare no conflict of interest.

Appendix A

Table A1. Demographic characteristics of study population.
District NameDistrict Population Number of Primary Schools Children Enrollment
Dadu1,555,2661935234,346
Thatta781,967163975,632
Karachi14,910,3522917458,846
Jacobabad1,006,2971443145,931
Larkana1,524,3911166222,226
Kashmore1,089,1691497123,940
Tharparkar1,649,6614010154,679
Umerkot1,073,1462234112,957
Naushero Feroze1,612,3732334246,403
Shaheed Benazirabad2,012,8472532236,341
Table A2. Pearson’s linear Correlation Correlations matrix.
DOTDSECpHTurbidityChlorideHardnessPhosphateNitrate
DO1
TDS−0.2551
EC−0.2360.997 **1
pH−0.458−0.117−0.0881
Turbidity0.1560.3610.3790.0281
Chloride−0.1440.915 **0.934 **0.0990.3991
hardness0.651 *0.3980.413−0.5820.2280.3451
Phosphate−0.4040.2910.2810.2410.1660.307−0.0831
Nitrate−0.3270.0060.0450.568−0.1960.193−0.1840.1171
* Correlation is significant at the 0.05 level (2-tailed); ** Correlation is significant at the 0.01 level (2-tailed).
Figure A1. Water source distribution by zones and provincial boundaries.
Water 12 03382 g0a1

References

  1. UNICEF. Child Survival Fact Sheet: Water and Sanitation; UNICEF: New York, NY, USA, 2018. [Google Scholar]
  2. WHO/UNICEF. Progress on Drinking Water, Sanitation and Hygiene: Update and SDG Baselines; WHO: Geneva, Switzerland; UNICEF: New York, NY, USA, 2017. [Google Scholar]
  3. Trinies, V.; Chang, H.H.; Garn, J.V.; Freeman, M.C. The Impact of a School-Based Water, Sanitation, and Hygiene Program on Absenteeism, Diarrhea, and Respiratory Infection: A Matched–Control Trial in Mali. Am. J. Trop. Med. Hyg. 2016, 94, 1418–1425. [Google Scholar] [CrossRef] [Green Version]
  4. Garn, J.V.; Brumback, B.A.; Drews-Botsch, C.D.; Lash, T.L.; Kramer, M.R.; Freeman, M.C. Estimating the Effect of School Water, Sanitation, and Hygiene Improvements on Pupil Health Outcomes. Epidemiology 2016, 27, 752–760. [Google Scholar] [CrossRef] [Green Version]
  5. Garn, J.V.; Trinies, V.; Toubkiss, J.; Freeman, M.C. The Role of Adherence on the Impact of a School-Based Water, Sanitation, and Hygiene Intervention in Mali. Am. J. Trop. Med. Hyg. 2017, 96, 984–993. [Google Scholar] [CrossRef] [Green Version]
  6. Nabi, G.; Ali, M.; Khan, S.; Kumar, S. The crisis of water shortage and pollution in Pakistan: Risk to public health, biodiversity, and ecosystem. Environ. Sci. Pollut. Res. 2019, 26, 10443–10445. [Google Scholar] [CrossRef] [Green Version]
  7. Daud, M.K.; Nafees, M.; Ali, S.; Rizwan, M.; Bajwa, R.A.; Shakoor, M.B.; Arshad, M.U.; Chatha, S.A.S.; Deeba, F.; Murad, W.; et al. Drinking Water Quality Status and Contamination in Pakistan. BioMed. Res. Int. 2017, 2017, 7908183. [Google Scholar] [CrossRef]
  8. Amin, R.; Zaidi, M.B.; Bashir, S.; Khanani, R.; Nawaz, R.; Ali, S.; Khan, S. Microbial contamination levels in the drinking water and associated health risks in Karachi, Pakistan. J. Water Sanit. Hyg. Dev. 2019, 9, 319–328. [Google Scholar] [CrossRef]
  9. Nawaz, S.; Ali, Y. Factors Affecting the Performance of Water Treatment Plants in Pakistan. Water Conserv. Sci. Eng. 2018, 3, 191–203. [Google Scholar] [CrossRef]
  10. Adimalla, N.; Li, P.; Venkatayogi, S. Hydrogeochemical Evaluation of Groundwater Quality for Drinking and Irrigation Purposes and Integrated Interpretation with Water Quality Index Studies. Environ. Process. 2018, 5, 363–383. [Google Scholar] [CrossRef]
  11. Soomro, M.; Khokhar, M.; Hussain, W.; Hussain, M. Drinking Water Quality Challenges in Pakistan; Pakistan Council of Research in Water Resources: Lahore, Pakistan, 2011; pp. 17–28. [Google Scholar]
  12. Zahid, J. Impact of Clean Drinking Water and Sanitation on Water Borne Diseases in Pakistan; Sustainable Development Policy Institute: Islamabad, Pakistan, 2018; pp. 1–23. [Google Scholar]
  13. NIPS. Pakistan Demographic and Health Survey, 2017–2018; National Institute of Population Studies (NIPS) Pakistan: Islamabad, Pakistan; ICF: Rockville, MD, USA, 2019; p. 573. [Google Scholar]
  14. Ali, W.; Nafees, M.; Turab, S.A.; Khan, M.Y.; Rehman, K. Drinking water quality assessment using water quality index and geostatistical techniques, Mardan District, Khyber Pakhtunkhwa, Pakistan. J. Him. Earth Sci. 2019, 52, 56–85. [Google Scholar]
  15. Hamlat, A.; Guidoum, A. Assessment of groundwater quality in a semiarid region of Northwestern Algeria using water quality index (WQI). Appl. Water Sci. 2018, 8, 220. [Google Scholar] [CrossRef] [Green Version]
  16. Ponsadailakshmi, S.; Sankari, S.G.; Prasanna, S.M.; Madhurambal, G. Evaluation of water quality suitability for drinking using drinking water quality index in Nagapattinam district, Tamil Nadu in Southern India. Groundw. Sustain. Dev. 2018, 6, 43–49. [Google Scholar] [CrossRef]
  17. Soleimani, H.; Nasri, O.; Ojaghi, B.; Pasalari, H.; Hosseini, M.; Hashemzadeh, B.; Kavosi, A.; Masoumi, S.; Radfard, M.; Adibzadeh, A.; et al. Data on drinking water quality using water quality index (WQI) and assessment of groundwater quality for irrigation purposes in Qorveh & Dehgolan, Kurdistan, Iran. Data Brief 2018, 20, 375–386. [Google Scholar] [CrossRef]
  18. Şener, Ş.; Şener, E.; Davraz, A. Evaluation of water quality using water quality index (WQI) method and GIS in Aksu River (SW-Turkey). Sci. Total Environ. 2017, 584, 131–144. [Google Scholar] [CrossRef]
  19. Suvarna, B.; Reddy, Y.S.; Sunitha, V.; Reddy, B.M.; Prasad, M.; Reddy, M.R. Data on application of water quality index method for appraisal of water quality in around cement industrial corridor, Yerraguntla Mandal, Y.S.R. District, A.P South India. Data Brief 2020, 28, 104872. [Google Scholar] [CrossRef]
  20. Ketata, M.; Gueddari, M.; Bouhlila, R. Use of geographical information system and water quality index to assess groundwater quality in El Khairat deep aquifer (Enfidha, Central East Tunisia). Arab. J. Geosci. 2011, 5, 1379–1390. [Google Scholar] [CrossRef]
  21. Sadat-Noori, M.; Ebrahimi, K.; Liaghat, A. Groundwater quality assessment using the Water Quality Index and GIS in Saveh-Nobaran aquifer, Iran. Environ. Earth Sci. 2013, 71, 3827–3843. [Google Scholar] [CrossRef]
  22. Environmental protection agency, Government of Pakistan. National standard for drinking water quality. Gaz. Pak. 2010, 1062, 3207–3208. [Google Scholar]
  23. Sayato, Y. WHO guidelines for drinking-water quality. Eisei Kagaku 1989, 35, 307–312. [Google Scholar] [CrossRef] [Green Version]
  24. School Education Department. G.o.S. Water, Sanitation & Hygiene (WASH) in Public Sector Schools Strategic Plan for Sindh. Available online: http://www.sindheducation.gov.pk/Contents/Menu/WASH%20in%20Public%20Sector.pdf (accessed on 12 May 2020).
  25. School Education and Literacy Department, Government of Sindh. 2019. Available online: http://www.sindheducation.gov.pk/ (accessed on 12 May 2020).
  26. Malik, S.M.; Awan, H.; Khan, N. Mapping vulnerability to climate change and its repercussions on human health in Pakistan. Glob. Health 2012, 8, 31. [Google Scholar] [CrossRef] [Green Version]
  27. Pakistan Demographics Profile. Mundi Index. 2019. Available online: https://www.indexmundi.com/pakistan/demographics_profile.html (accessed on 12 May 2020).
  28. Maskooni, E.K.; Naseri-Rad, M.; Berndtsson, R.; Nakagawa, K. Use of Heavy Metal Content and Modified Water Quality Index to Assess Groundwater Quality in a Semiarid Area. Water 2020, 12, 1115. [Google Scholar] [CrossRef] [Green Version]
  29. Iticescu, C.; Georgescu, L.P.; Murariu, G.; Topa, C.; Timofti, M.; Pintilie, V.; Arseni, M. Lower Danube Water Quality Quantified through WQI and Multivariate Analysis. Water 2019, 11, 1305. [Google Scholar] [CrossRef] [Green Version]
  30. Shrestha, A.; Basnet, N. An evaluation of physicochemical analysis and water quality index of Ratuwa River of Damak, Jhapa, Nepal. Int. J. Rec. Res. Rev. 2018, 11, 1–9. [Google Scholar]
  31. Reyes-Toscano, C.A.; Alfaro-Cuevas-Villanueva, R.; Cortés-Martínez, R.; Morton-Bermea, O.; Hernández-Álvarez, E.; Buenrostro-Delgado, O.; Ávila-Olivera, J.A. Hydrogeochemical Characteristics and Assessment of Drinking Water Quality in the Urban Area of Zamora, Mexico. Water 2020, 12, 556. [Google Scholar] [CrossRef] [Green Version]
  32. WHO. World Report on Disability 2011; World Health Organization: Geneva, Switzerland, 2011. [Google Scholar]
  33. Kachroud, M.; Trolard, F.; Kefi, M.; Jebari, S.; Bourrié, G. Water Quality Indices: Challenges and Application Limits in the Literature. Water 2019, 11, 361. [Google Scholar] [CrossRef] [Green Version]
  34. Sharma, P.; Meher, P.K.; Kumar, A.; Gautam, Y.P.; Mishra, K.P. Changes in water quality index of Ganges river at different locations in Allahabad. Sustain. Water Qual. Ecol. 2014, 3, 67–76. [Google Scholar] [CrossRef]
  35. Waseem, A.; Arshad, J.; Iqbal, F.; Sajjad, A.; Mehmood, Z.; Murtaza, G. Pollution Status of Pakistan: A Retrospective Review on Heavy Metal Contamination of Water, Soil, and Vegetables. BioMed Res. Int. 2014, 2014, 813206. [Google Scholar] [CrossRef]
  36. Abbas, M.; Parveen, Z.; Iqbal, M.; Riazuddin, M.; Iqbal, S.; Ahmed, M.; Bhutto, R. Monitoring of toxic metals (cadmium, lead, arsenic and mercury) in vegetables of Sindh, Pakistan. Kathmandu Univ. J. Sci. Eng. Technol. 2010, 6, 60–65. [Google Scholar] [CrossRef] [Green Version]
  37. Shakir, S.K.; Azizullah, A.; Murad, W.; Daud, M.K.; Nabeela, F.; Rahman, H.; Rehman, S.U.; Häder, D.-P. Toxic Metal Pollution in Pakistan and Its Possible Risks to Public Health. Rev. Environ. Contam. Toxicol. 2016, 1–60. [Google Scholar] [CrossRef]
  38. Brindha, K.; Vaman, K.V.N.; Srinivasan, K.; Babu, M.S.; Elango, L. Identification of surface water-groundwater interaction by hydrogeochemical indicators and assessing its suitability for drinking and irrigational purposes in Chennai, Southern India. Appl. Water Sci. 2013, 4, 159–174. [Google Scholar] [CrossRef] [Green Version]
  39. Ganeshkumar, B.; Jaideep, C. Groundwater quality assessment using Water Quality Index (WQI) approach–Case study in a coastal region of Tamil Nadu, India. Int. J. Environ. Sci. Res. 2011, 1, 50–55. [Google Scholar]
  40. Bhatti, N.; Siyal, A.; Qureshi, A. Groundwater quality assessment using water quality index: A Case study of Nagarparkar, Sindh, Pakistan. Sindh Univ. Res. J. 2018, 50, 227–234. [Google Scholar]
  41. Solangi, G.S.; Siyal, A.A.; Babar, M.M.; Siyal, P. Evaluation of drinking water quality using the water quality index (WQI), the synthetic pollution index (SPI) and geospatial tools in Thatta district, Pakistan. Desalin. Water Treat. 2019, 160, 202–213. [Google Scholar] [CrossRef] [Green Version]
  42. Panjwani, S.K. Drinking Water Quality and Environmental Monitoring in Rural Areas of District Malir, Karachi. Master’s Thesis, University of Oulu Faculty of Technology, Oulu, Finland, March 2018. [Google Scholar]
  43. Shahab, A.; Shihua, Q.; Rashid, A.; Hasan, F.; Sohail, M. Evaluation of Water Quality for Drinking and Agricultural Suitability in the Lower Indus Plain in Sindh Province, Pakistan. Pol. J. Environ. Stud. 2016, 25, 2563–2574. [Google Scholar] [CrossRef]
  44. Arain, M.B.; Ullah, I.; Niaz, A.; Shah, N.; Shah, A.; Hussain, Z.; Tariq, M.; Afridi, H.I.; Baig, J.A.; Kazi, T.G. Evaluation of water quality parameters in drinking water of district Bannu, Pakistan: Multivariate study. Sustain. Water Qual. Ecol. 2014, 3, 114–123. [Google Scholar] [CrossRef]
  45. Rahmanian, N.; Ali, S.H.B.; Homayoonfard, M.; Ali, N.J.; Rehan, M.; Sadef, Y.; Nizami, A.-S. Analysis of Physiochemical Parameters to Evaluate the Drinking Water Quality in the State of Perak, Malaysia. J. Chem. 2015, 2015, 716125. [Google Scholar] [CrossRef] [Green Version]
  46. Solangi, G.S.; Siyal, A.A.; Babar, M.M.; Siyal, P. Groundwater quality mapping using geographic information system: A case study of District Thatta, Sindh. Mehran Univ. Res. J. Eng. Tech. 2017, 36, 14. [Google Scholar] [CrossRef] [Green Version]
  47. Khan, S.; Aziz, T.; Noor-Ul-Ain, A.K.; Ahmed, I. Drinking Water Quality in 13 Different Districts of Sindh, Pakistan. Health Care Curr. Rev. 2018, 6, 2. [Google Scholar]
  48. Qureshi, A.L.; Mahessar, A.A.; Leghari, M.E.-U.-H.; Lashari, B.K.; Mari, F.M. Impact of Releasing Wastewater of Sugar Industries into Drainage System of LBOD, Sindh, Pakistan. Int. J. Environ. Sci. Dev. 2015, 6, 381–386. [Google Scholar] [CrossRef] [Green Version]
  49. Khan, A.; Qureshi, F.R. Groundwater Quality Assessment through Water Quality Index (WQI) in New Karachi Town, Karachi, Pakistan. Asian J. Water Environ. Pollut. 2018, 15, 41–46. [Google Scholar] [CrossRef]
  50. Ahmed, J.; Wong, L.P.; Piaw, C.Y.; Channa, N.; Mahar, R.B.; Yasmin, A.; Vanderslice, J.; Garn, J. Quantitative Microbial Risk Assessment of Drinking Water Quality to Predict the Risk of Waterborne Diseases in Primary-School Children. Int. J. Environ. Res. Public Health 2020, 17, 2774. [Google Scholar] [CrossRef] [Green Version]
  51. Ahmed, J.; Wong, L.P.; Chua, Y.P.; Yasmin, A.; Channa, N.; Van Derslice, J.A. Estimation of Hepatitis A Virus Infection Prevalence Through Drinking Water Supply of Primary Schools of Sindh, Pakistan. Zahedan J. Res. Med Sci. 2020, 20, 98412. [Google Scholar] [CrossRef]
  52. Hussain, M.; Butt, A.R.; Uzma, F.; Ahmed, R.; Irshad, S.; Rehman, A.; Yousaf, B. A comprehensive review of climate change impacts, adaptation, and mitigation on environmental and natural calamities in Pakistan. Environ. Monit. Assess. 2019, 192, 48. [Google Scholar] [CrossRef]
  53. Hussain, M.; Mumtaz, S. Climate change and managing water crisis: Pakistan’s perspective. Rev. Environ. Health 2014, 29, 71–77. [Google Scholar] [CrossRef]
  54. Khan, A.J.; Koch, M.; Tahir, A.A. Impacts of Climate Change on the Water Availability, Seasonality and Extremes in the Upper Indus Basin (UIB). Sustainablity 2020, 12, 1283. [Google Scholar] [CrossRef] [Green Version]
  55. Dawadi, S.; Ahmad, S. Evaluating the impact of demand-side management on water resources under changing climatic conditions and increasing population. J. Environ. Manag. 2013, 114, 261–275. [Google Scholar] [CrossRef]
  56. Safdar, M.T. Sugarcane and Punjab, Pakistan: Production, Processing and Challenges. Available online: https://ethicalsugar.files.wordpress.com/2014/02/ethical-sugar-sugarcane-in-punjab-pakistan.pdf (accessed on 30 November 2020).
Figure 1. Variation in water quality parameters concentrations by type of drinking water source in schools. * The school located near the coast of the Arabian Sea.
Water 12 03382 g001
Figure 2. Surveyed schools in the Sindh province of Pakistan.
Water 12 03382 g002
Figure 3. Water quality parameters according to WHO guidelines.
Water 12 03382 g003
Figure 4. Water Quality Index of the primary schools of Sindh.
Water 12 03382 g004
Figure 5. Water Quality Index showing population density, agriculture density, and proximity to the sea.
Water 12 03382 g005
Figure 6. Water Quality Index (WQI) score comparison between private and public schools.
Water 12 03382 g006
Table 1. Instruments used for onsite field measurement and laboratory analysis.
ParameterInstrumentModel/Method
DODO meterHanna Model H19146-04
pHpH MeterHanna H18424
EC/TDSEC/TDS MeterHanna Hi99301
TurbidityTurbidity MeterHanna 9844
ChlorideTitration Method4500-Cl-B
Total HardnessTitration Method2340 C
NitrateSpectrophotometer4500-NO3
PhosphateSpectrophotometer4500-P
Table 2. Raw and relative weights for each water quality parameters [14,18,20,32].
ParameterWHO Standard [23]Pakistan EPA Standard [15]Weight (wi)Relative Weights (Wi)
DO mg/L5*50.16
TDS (mg/L)1000100050.16
EC (uS/cm)1500*40.12
pH 6.5–8.56.5–8.540.12
Turbidity (NTU)5520.06
Chloride (mg/L)25025030.09
Hardness (mg/L)50050020.06
Phosphate (mg/L)5*10.03
Nitrate (mg/L)505050.16
Σ wi = 31Σ Wi = 1.00
wi: Weight assigned; Wi: Relative weight; Σ Wi = sum of all relative weights; * = Pakistan Environmental Protection Agency (EPA) guidelines not available.
Table 3. Characterization of water quality based on water quality index (WQI) value [33,34].
ClassWQI ValueWater Quality Status
A<50Excellent
B51–100Good
C101–200Poor water
D201–300 Very Poor Water
E>300 Water unsuitable for drinking
Table 4. Water quality parameters of South Sindh.
DistrictTharparkarThattaKarachiUmerkot
n = 42n = 40n = 40n = 45
StatisticsAverageMaxMinAverageMaxMinAverageMaxMinAverageMaxMin
DO mg/L7.18.06.07.38.06.27.0 8.0 6.4 7.68.47.0
TDS (mg/L)1083.13440.0130.01192.73730.0390.0930.0 2360.0 260.0 667.22220.0240.0
EC (uS/cm)2098.56600.0250.02292.17190.0760.01805.6 4550.0 510.0 1330.64380.0470.0
PH7.88.46.97.68.36.87.9 8.7 7.2 7.98.67.0
Turbidity (NTU)2.38.20.315.844.70.42.1 8.4 0.0 7.846.00.3
Chloride (mg/L)350.92161.825.0349.5937.287.5249.2 487.3 37.5 202.3371.367.0
Hardness (mg/L)199.9650.031.0346.9775.0103.0258.3 600.0 58.0 217.7400.070.0
Phosphate (mg/L)0.52.10.00.82.00.00.7 1.2 0.0 0.31.20.0
Nitrate (mg/L)5.727.00.01.320.90.07.0 20.7 0.0 2.39.80.0
Table 5. Water quality parameters of North Sindh.
District.LarkanaJacobabadKashmore
n = 42n = 40n = 42
StatisticsAverageMaxMinAverageMaxMinAverageMaxMin
DO mg/L7.28.16.37.38.06.37.58.26.8
TDS (mg/L)741.22510.0240.0835.21910.0180.0931.72500.0130.0
EC (uS/cm)1395.74860.0480.01628.23670.0360.01818.24830.0250.0
PH7.58.27.07.58.37.07.88.47.1
Turbidity (NTU)2.59.40.31.48.30.08.746.00.9
Chloride (mg/L)166.5937.225.0206.2649.012.5250.6691.029.0
Hardness (mg/L)154.7425.030.0261.5775.025.0309.4622.020.0
Phosphate (mg/L)0.51.00.00.51.00.00.20.80.0
Nitrate (mg/L)1.55.90.00.42.50.02.58.10.0
Table 6. Water quality parameters of Central Sindh.
DistrictS.BenazirabadDaduN.Feroz
n = 47n = 42n = 45
StatisticsAverageMaxMinAverageMaxMinAverageMaxMin
DO mg/L7.78.27.07.728.107.307.48.37
TDS (mg/L)937.72090.0310.0893.192730.0280757.61450.0389.0
EC (uS/cm)1822.44070.0620.01738.295260.05501520.22990.0778.0
PH7.48.456.777.458.306.927.78.47.0
Turbidity (NTU)3.938.603.3829.260.107.232.00.5
Chloride (mg/L)253.8104020252.061130.024.9232.5691.071
Hardness (mg/L)421.685078399.481200.072255.2510.088.0
Phosphate (mg/L)0.00.7300.582.020.020.62.70.0
Nitrate (mg/L)3.51902.4111.4307.522.40.3
Publisher’s Note: MDPI stays neutral with regard to jurisdictional claims in published maps and institutional affiliations.

