Spatial Heterogeneity Analysis of Short-Duration Extreme Rainfall Events in Megacities in China


Abstract
:1. Introduction
2. Study Areas and Data
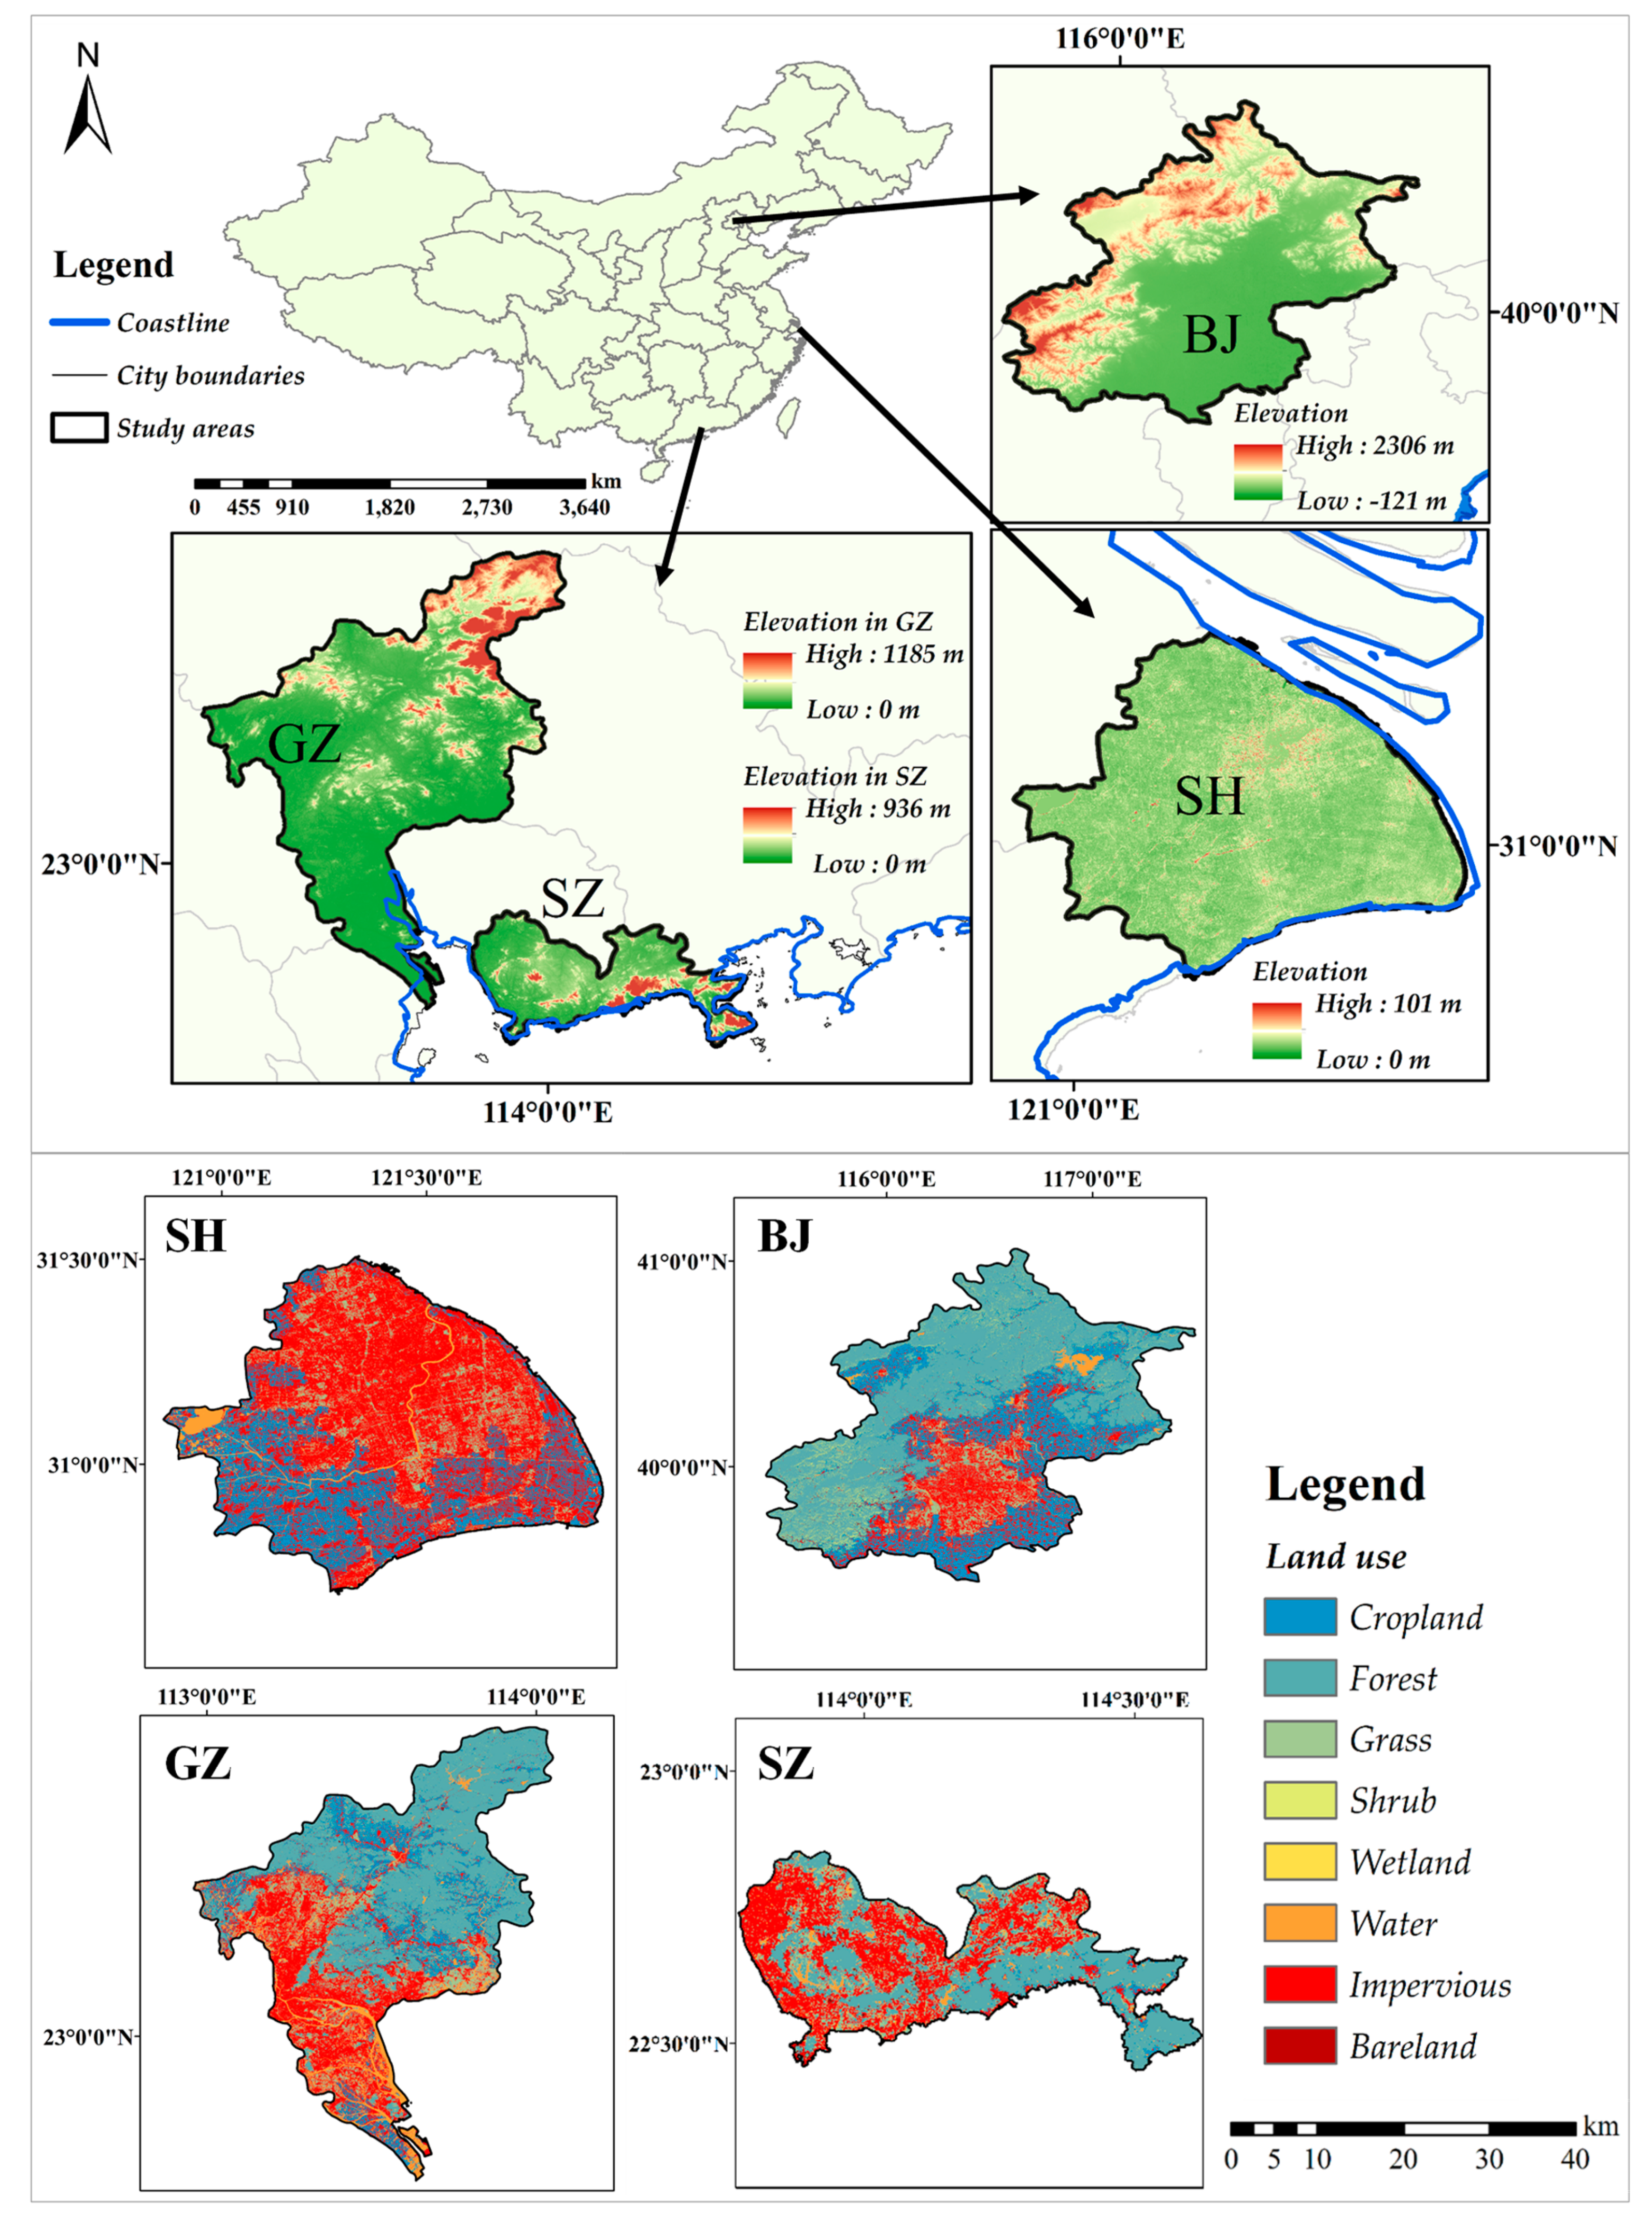
2.1. Study Areas
2.2. Data
3. Methodology
3.1. Trend Analysis
3.2. Spatial Heterogeneity Analysis
3.2.1. CV in Space
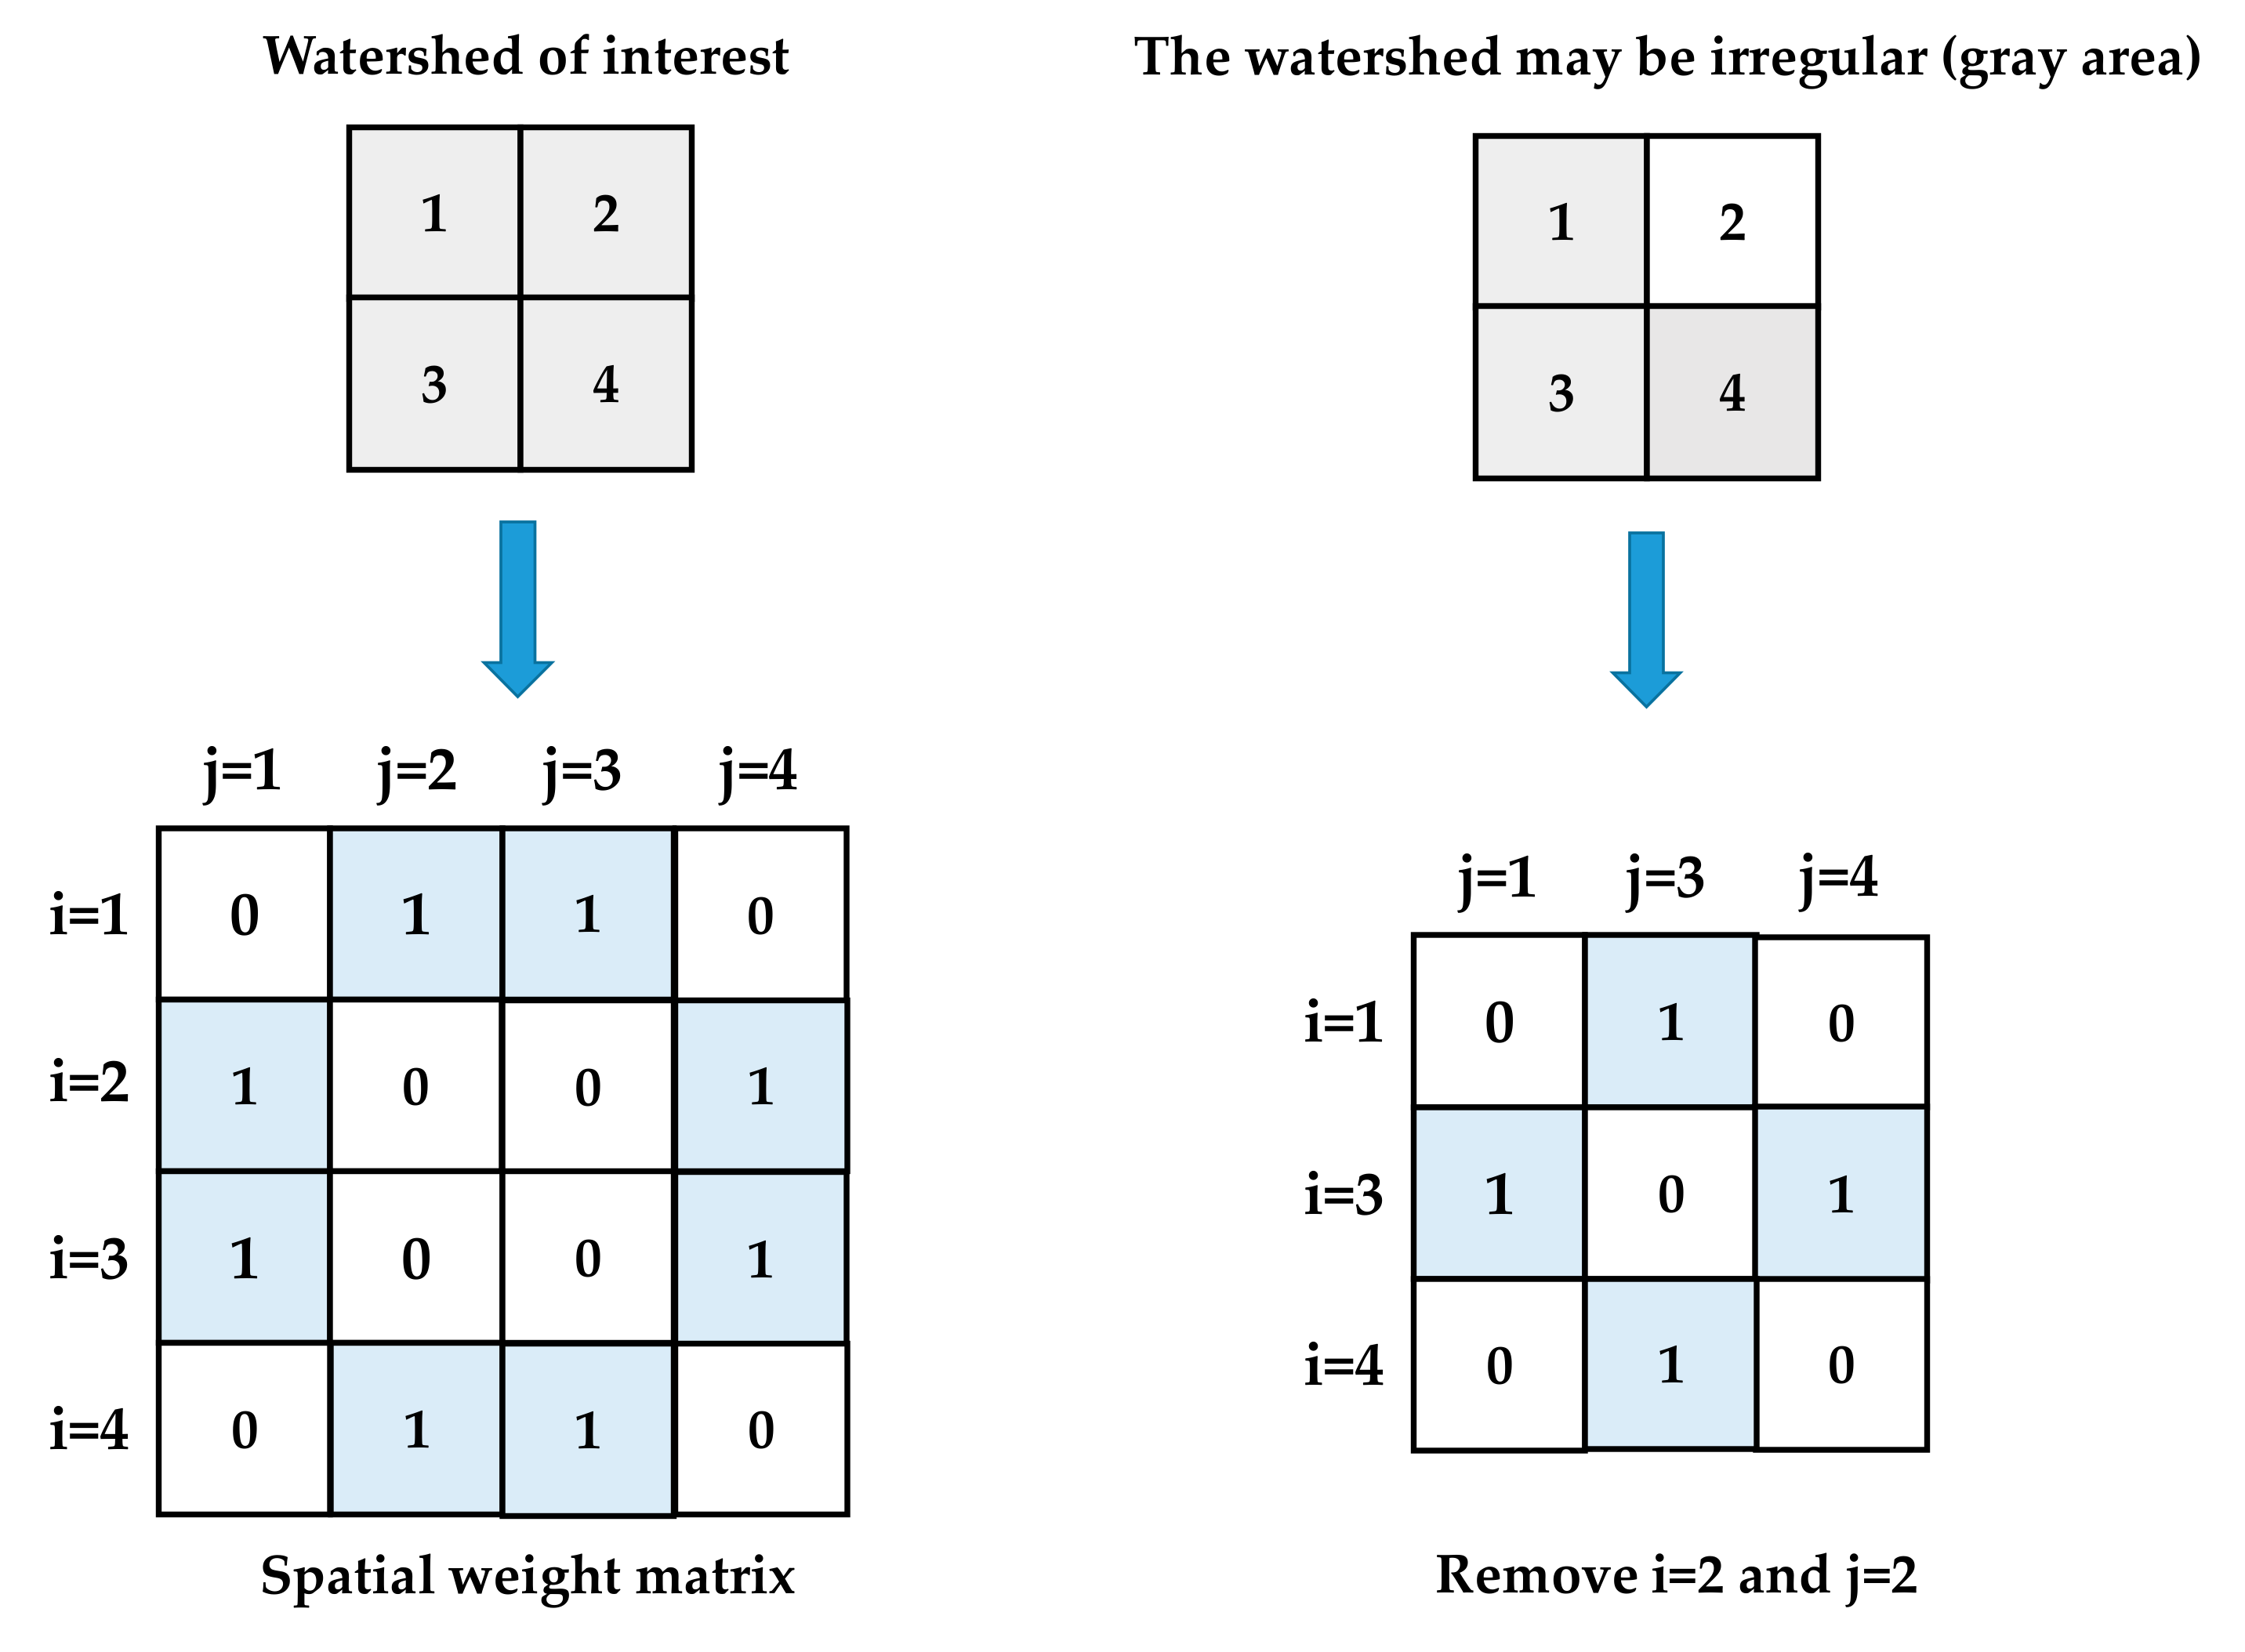
3.2.2. Global Moran’s I and Local Moran’s I
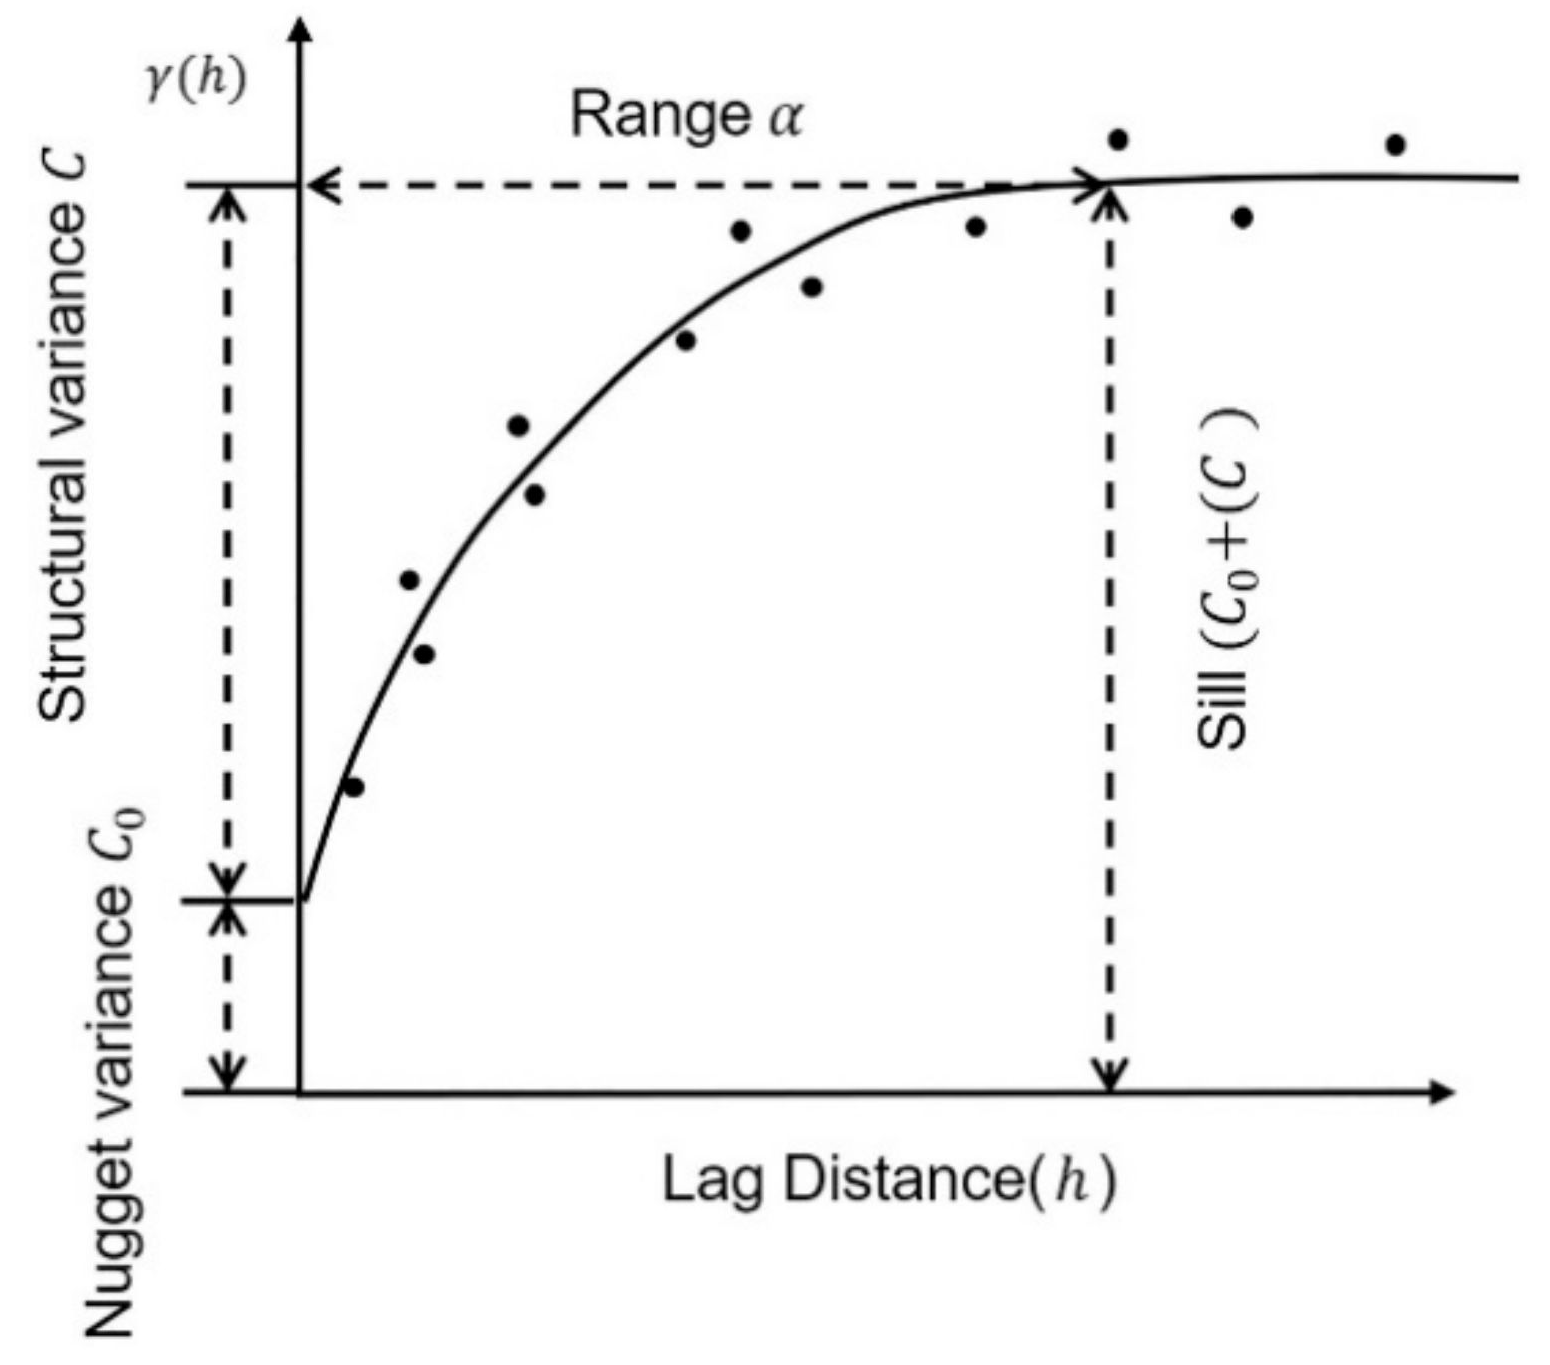
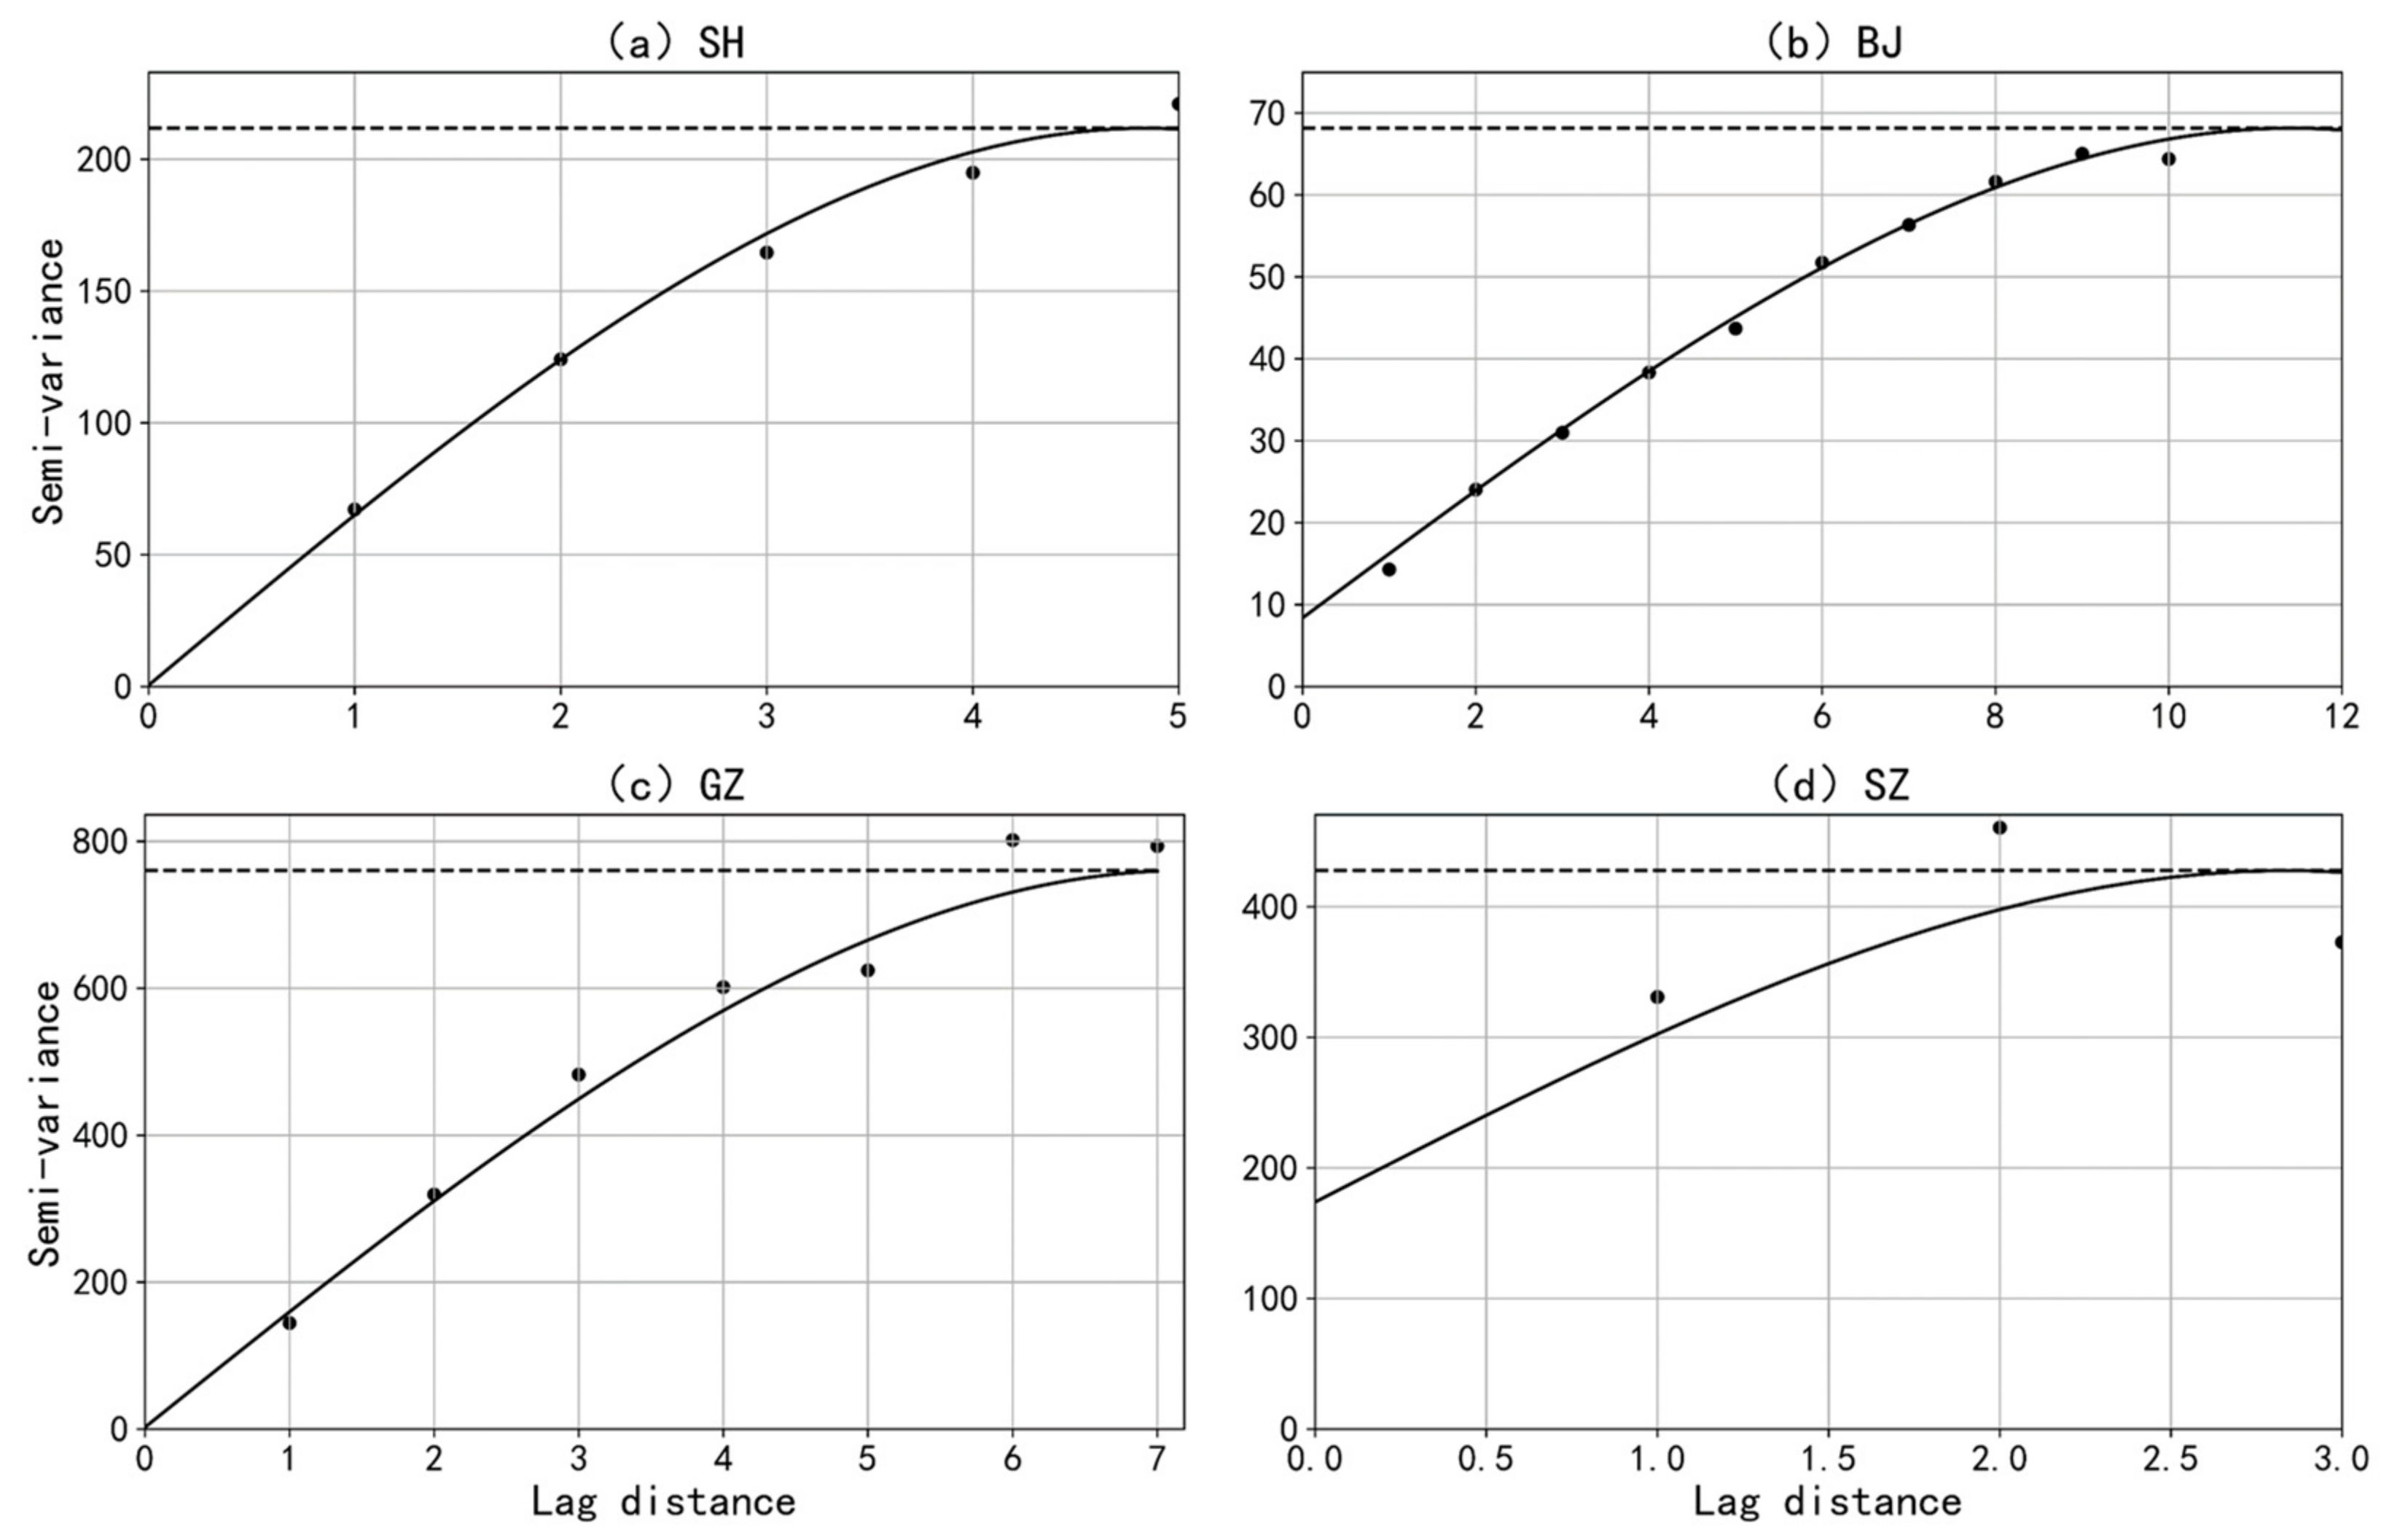
3.2.3. Semi-Variance Analysis
4. Results and Discussion
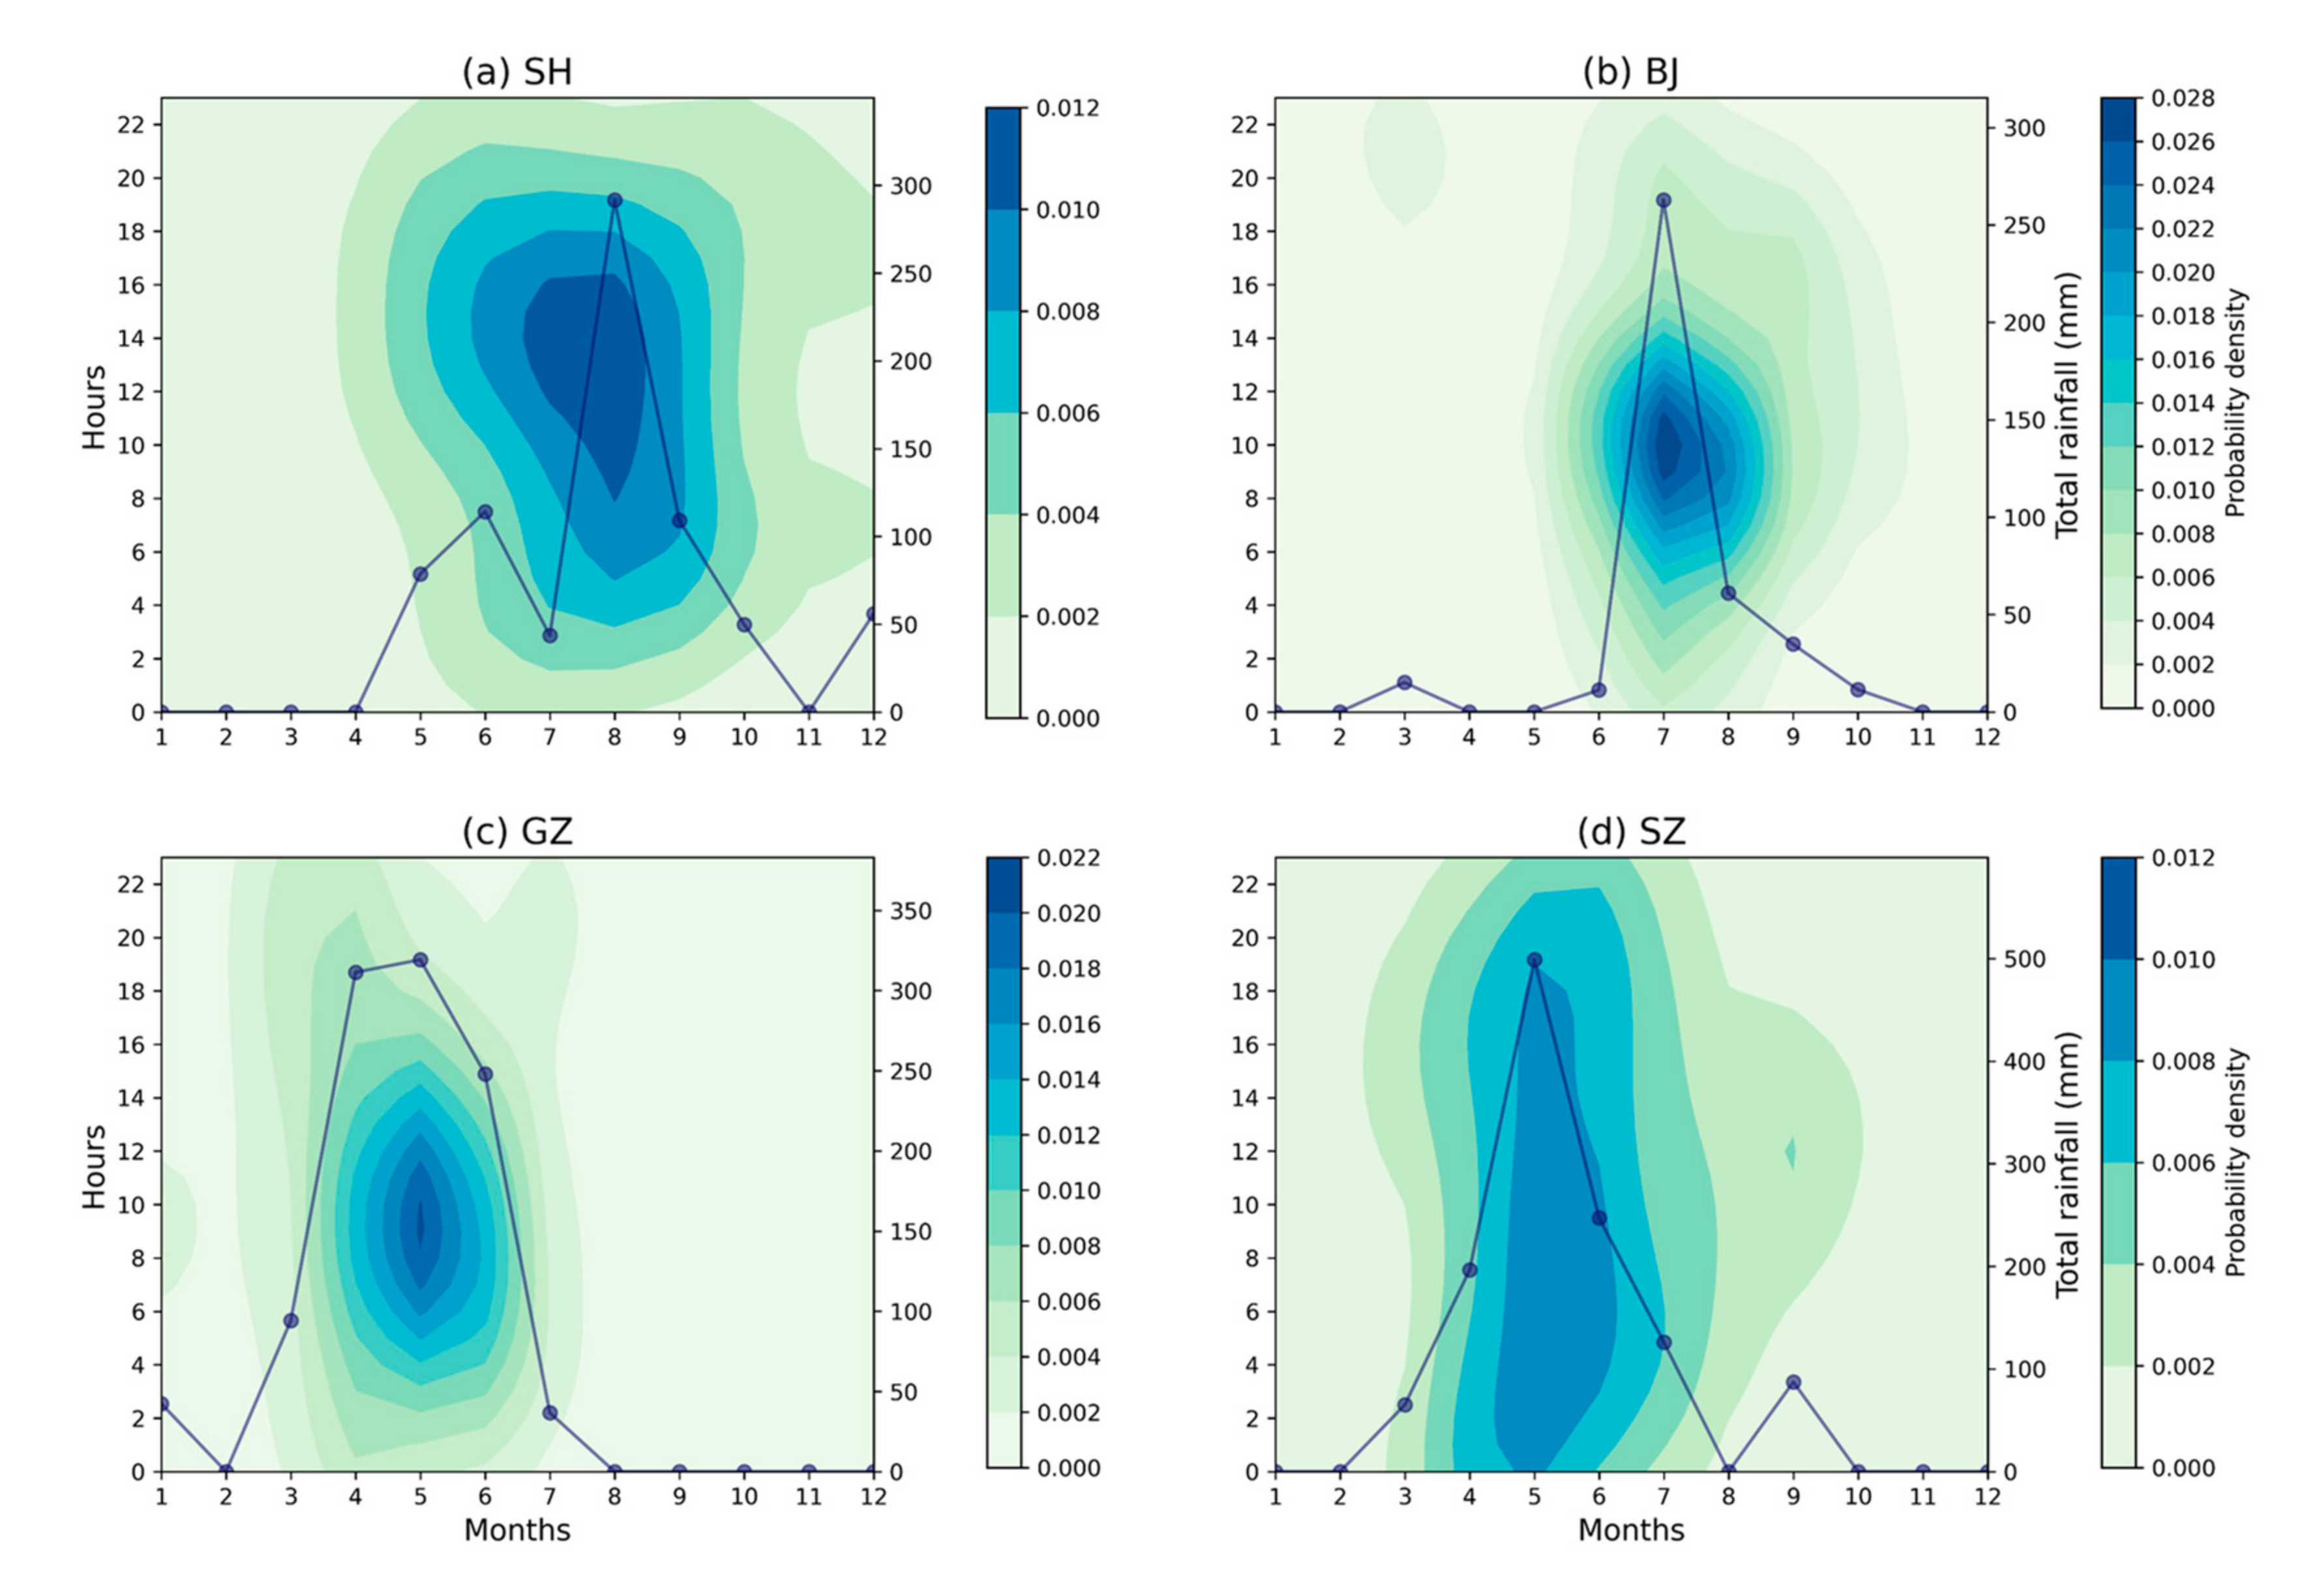
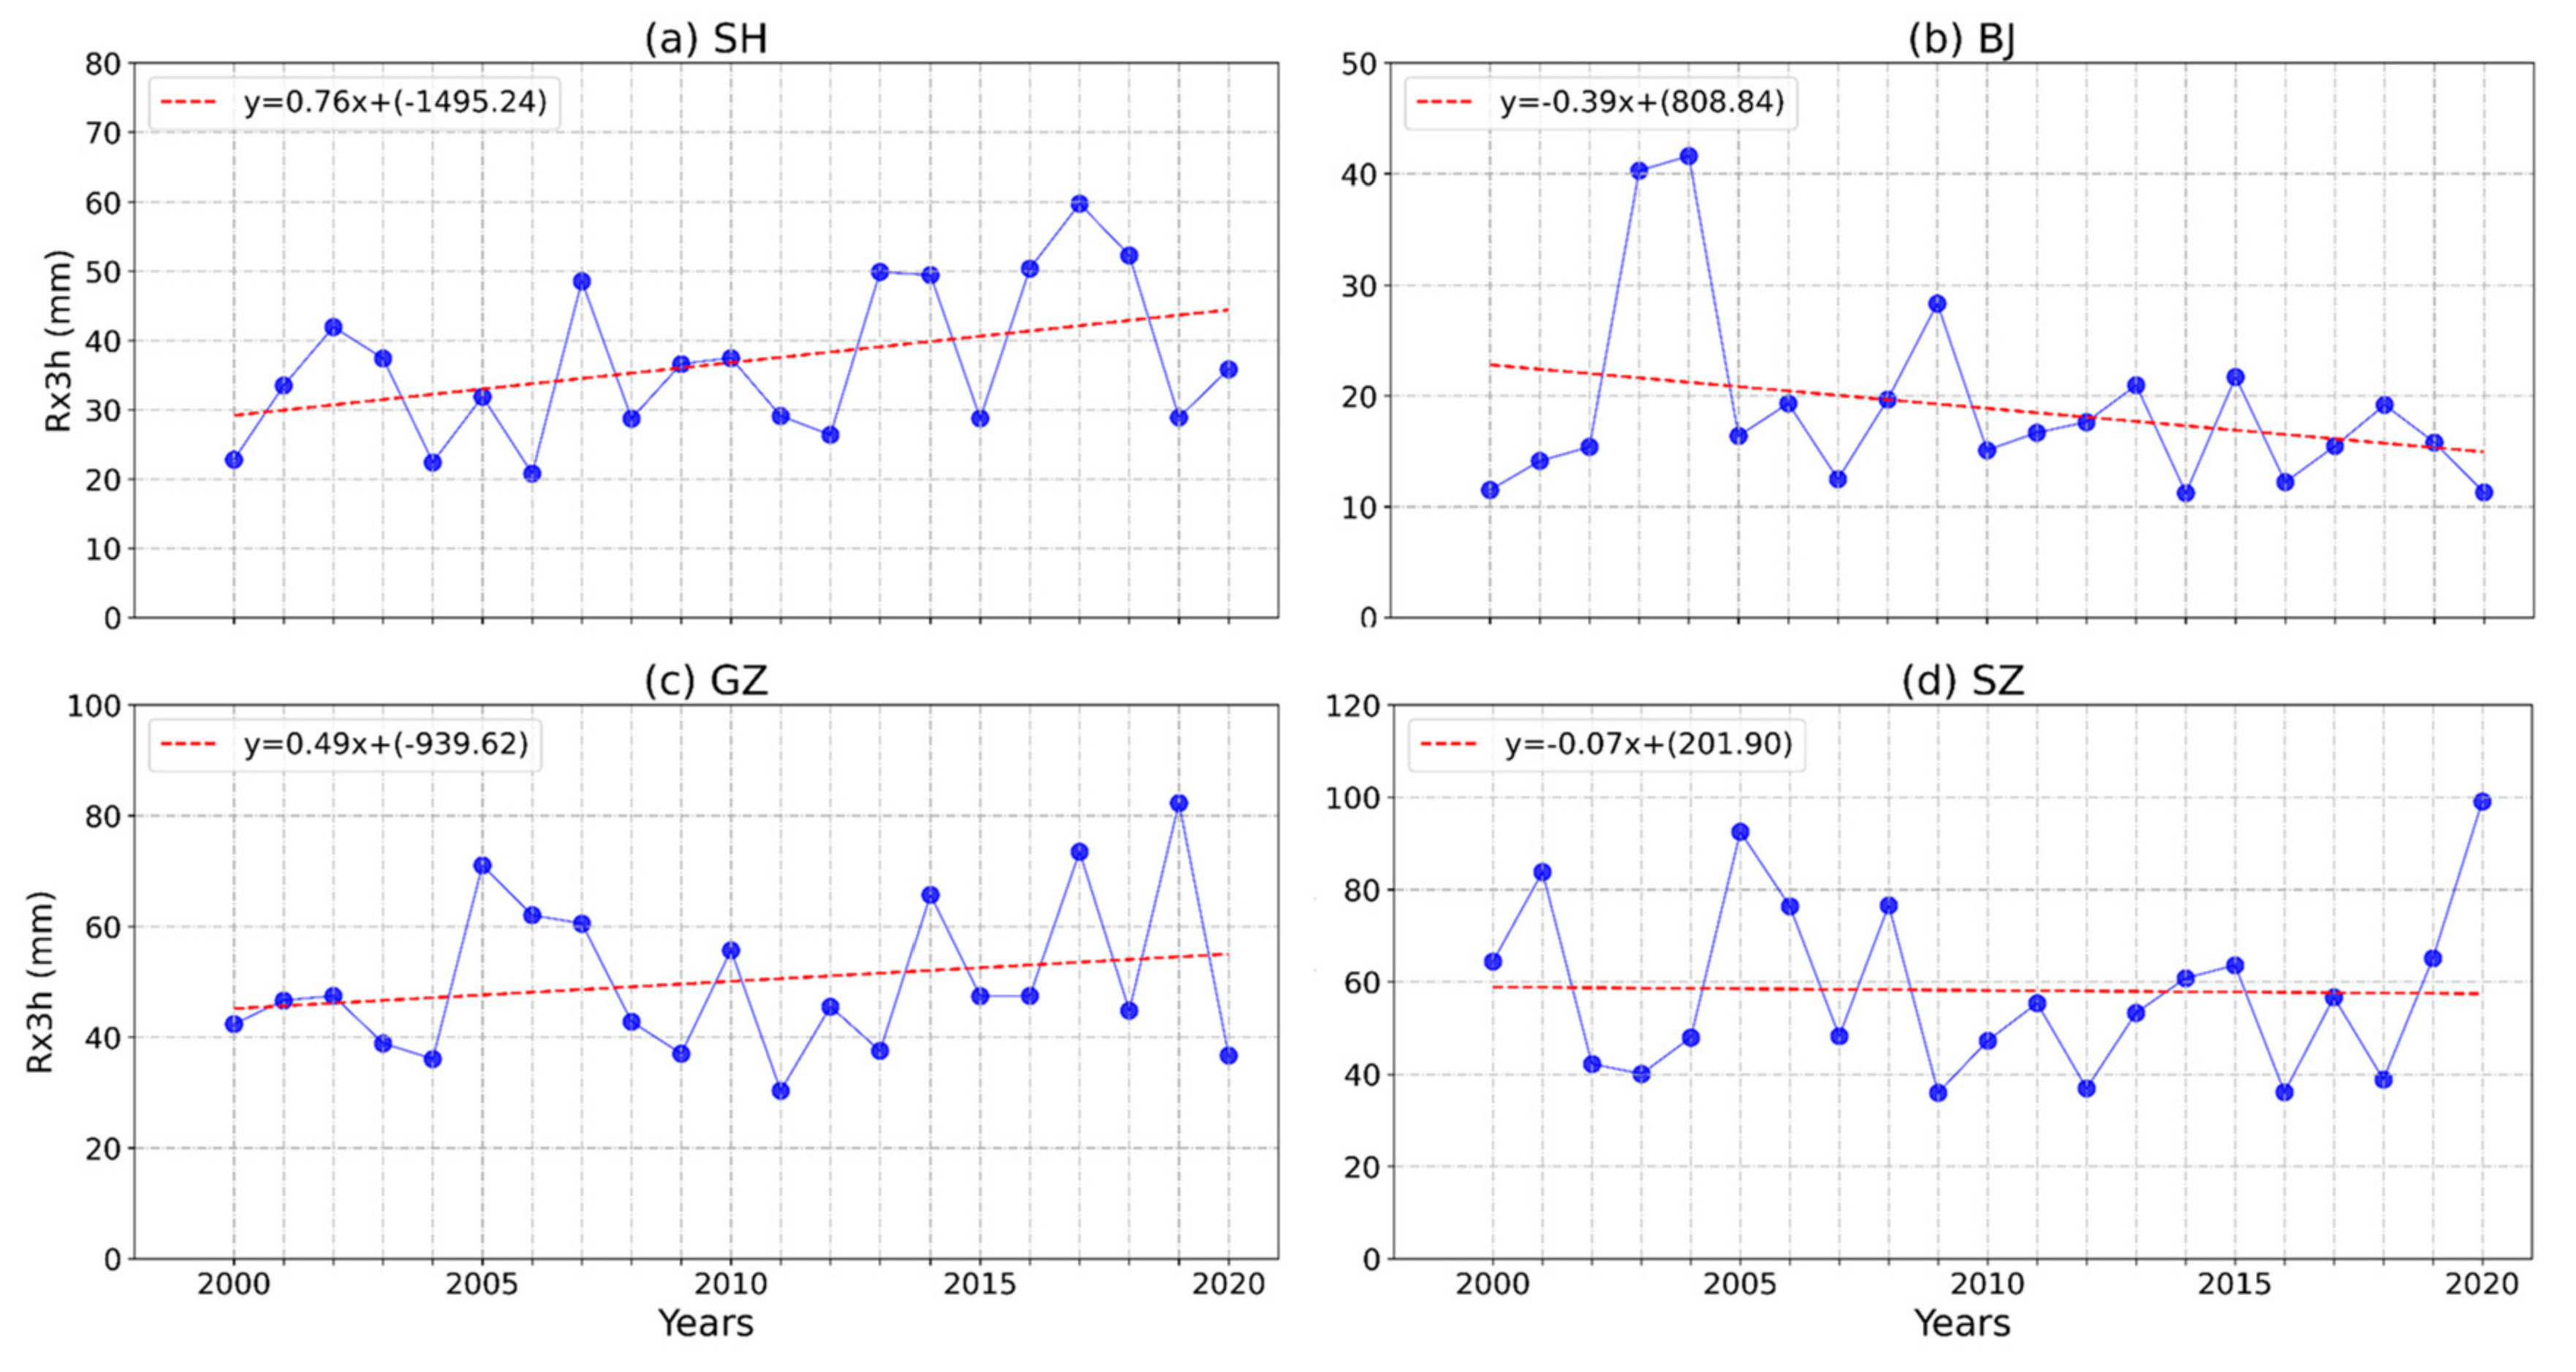
4.1. Temporal Characteristics of Rainfall Series
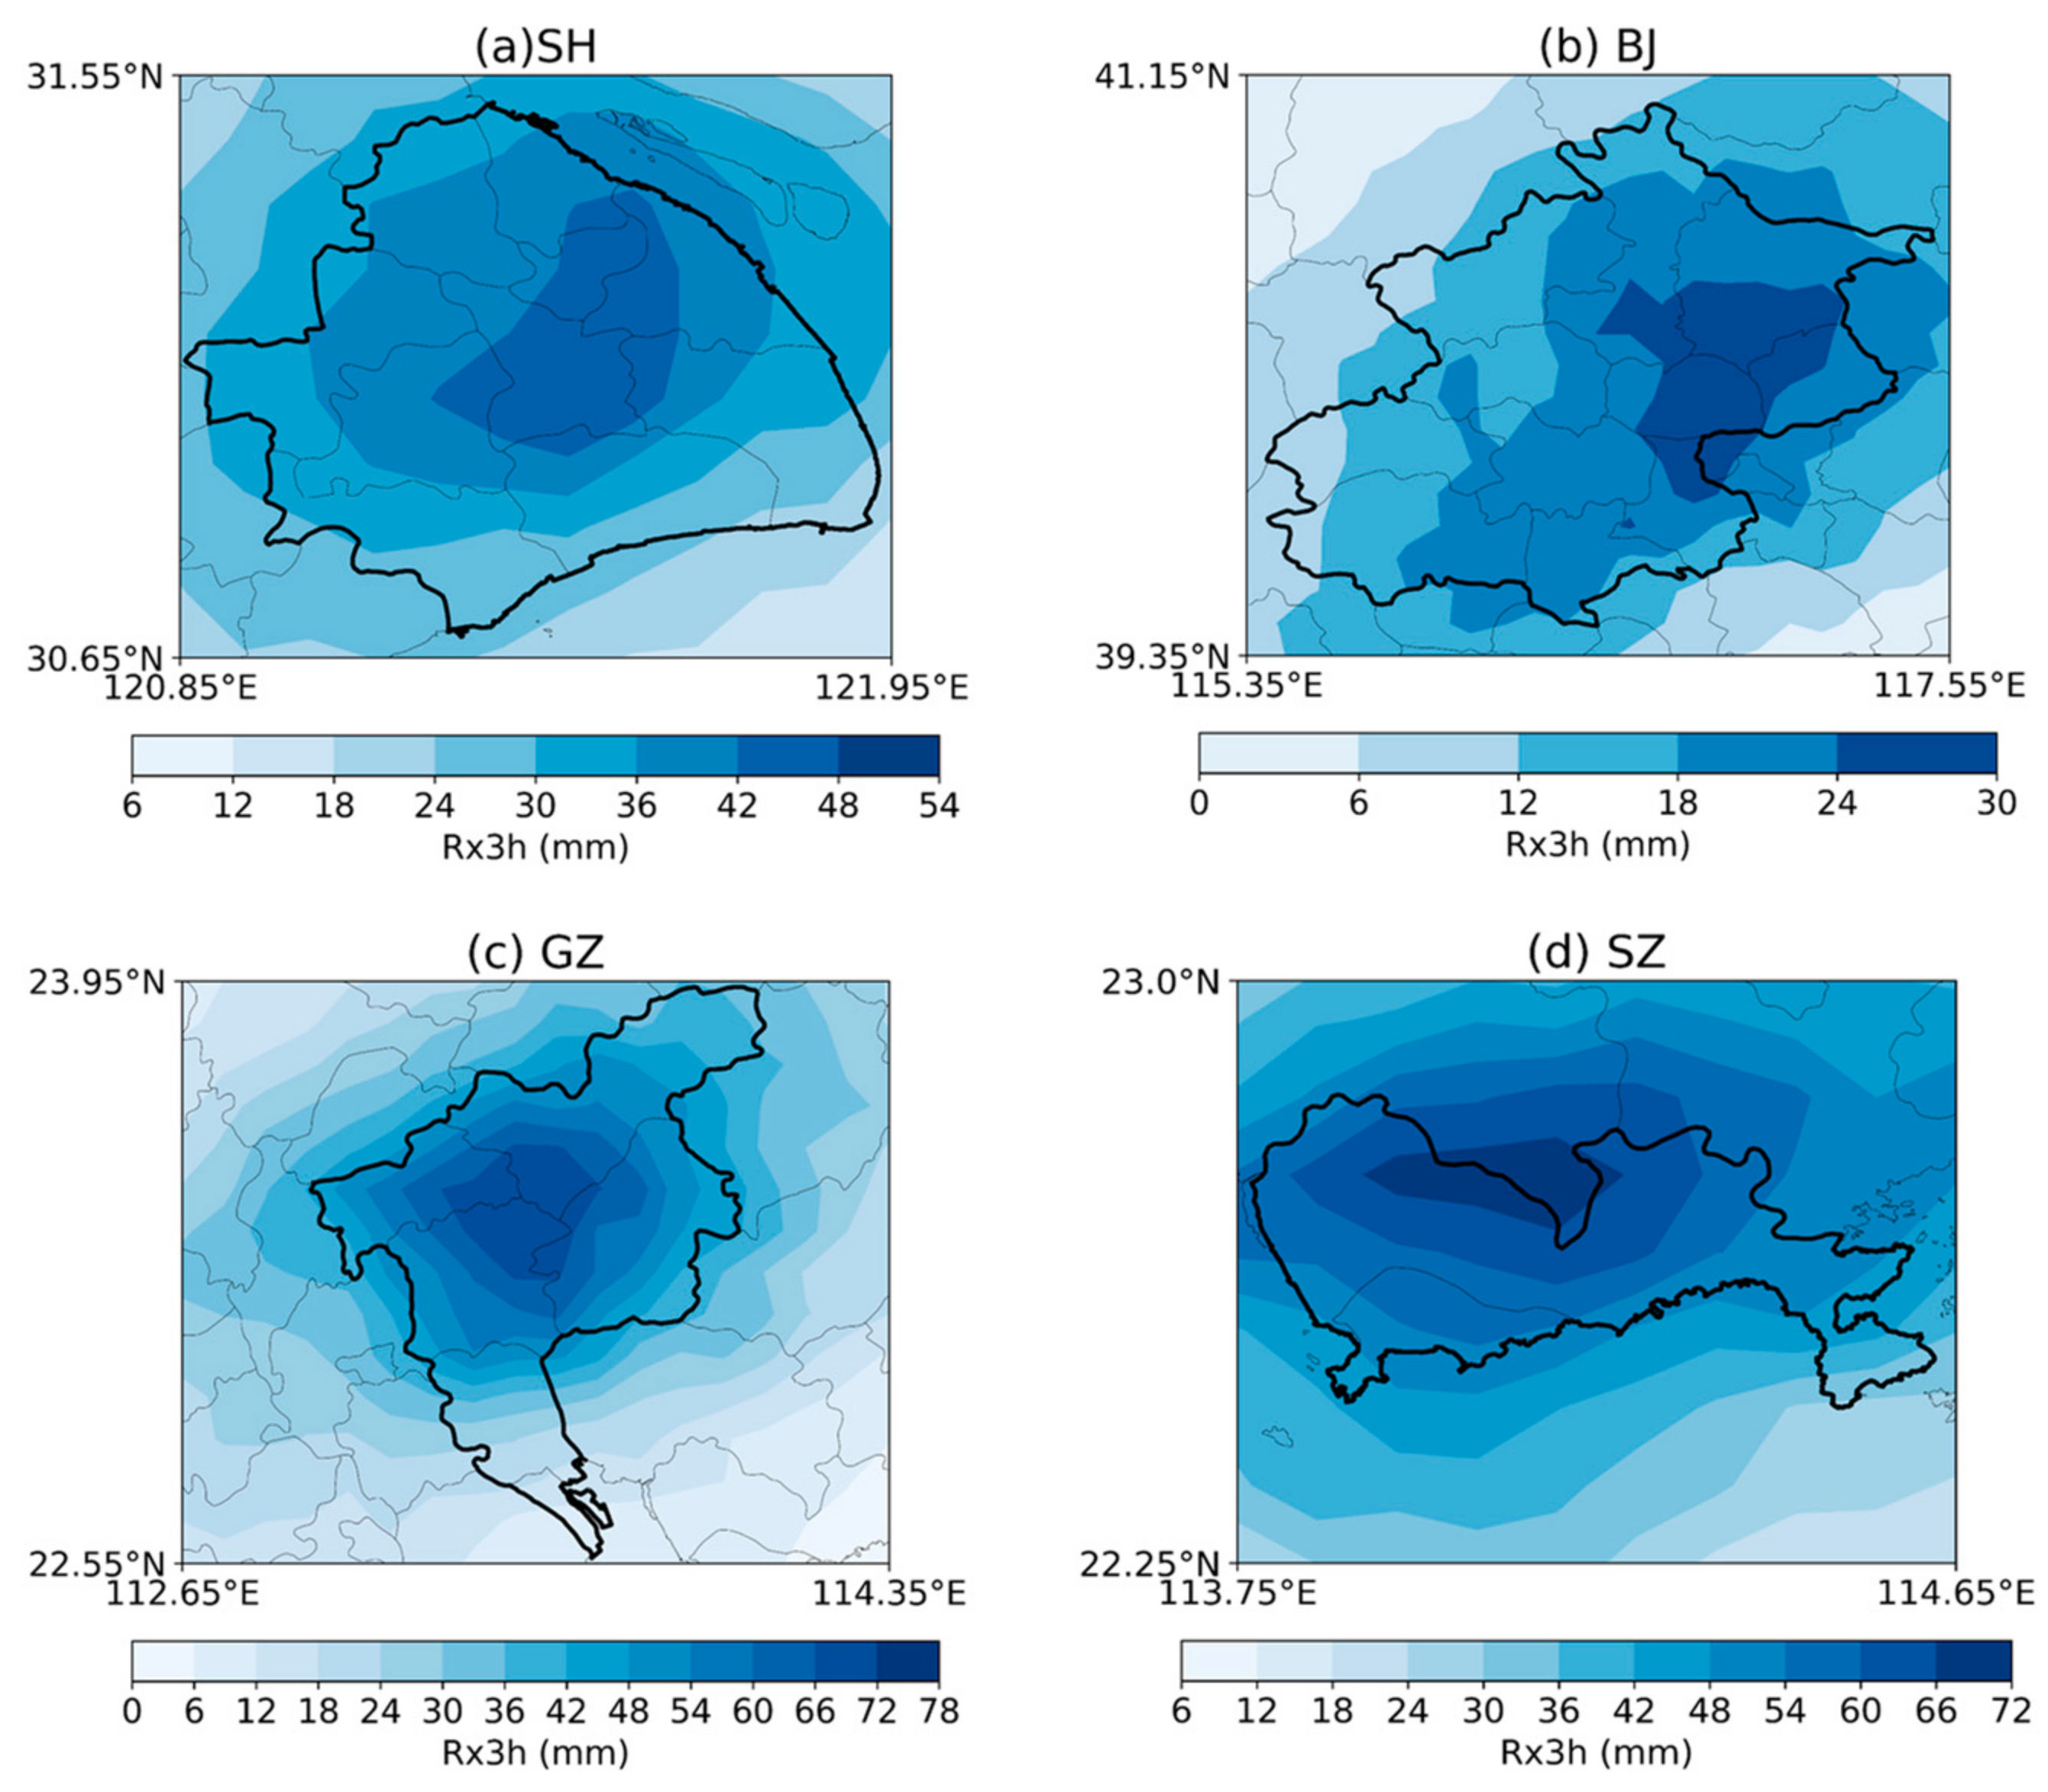
4.2. Spatial Heterogeneity of Extreme Rainfall
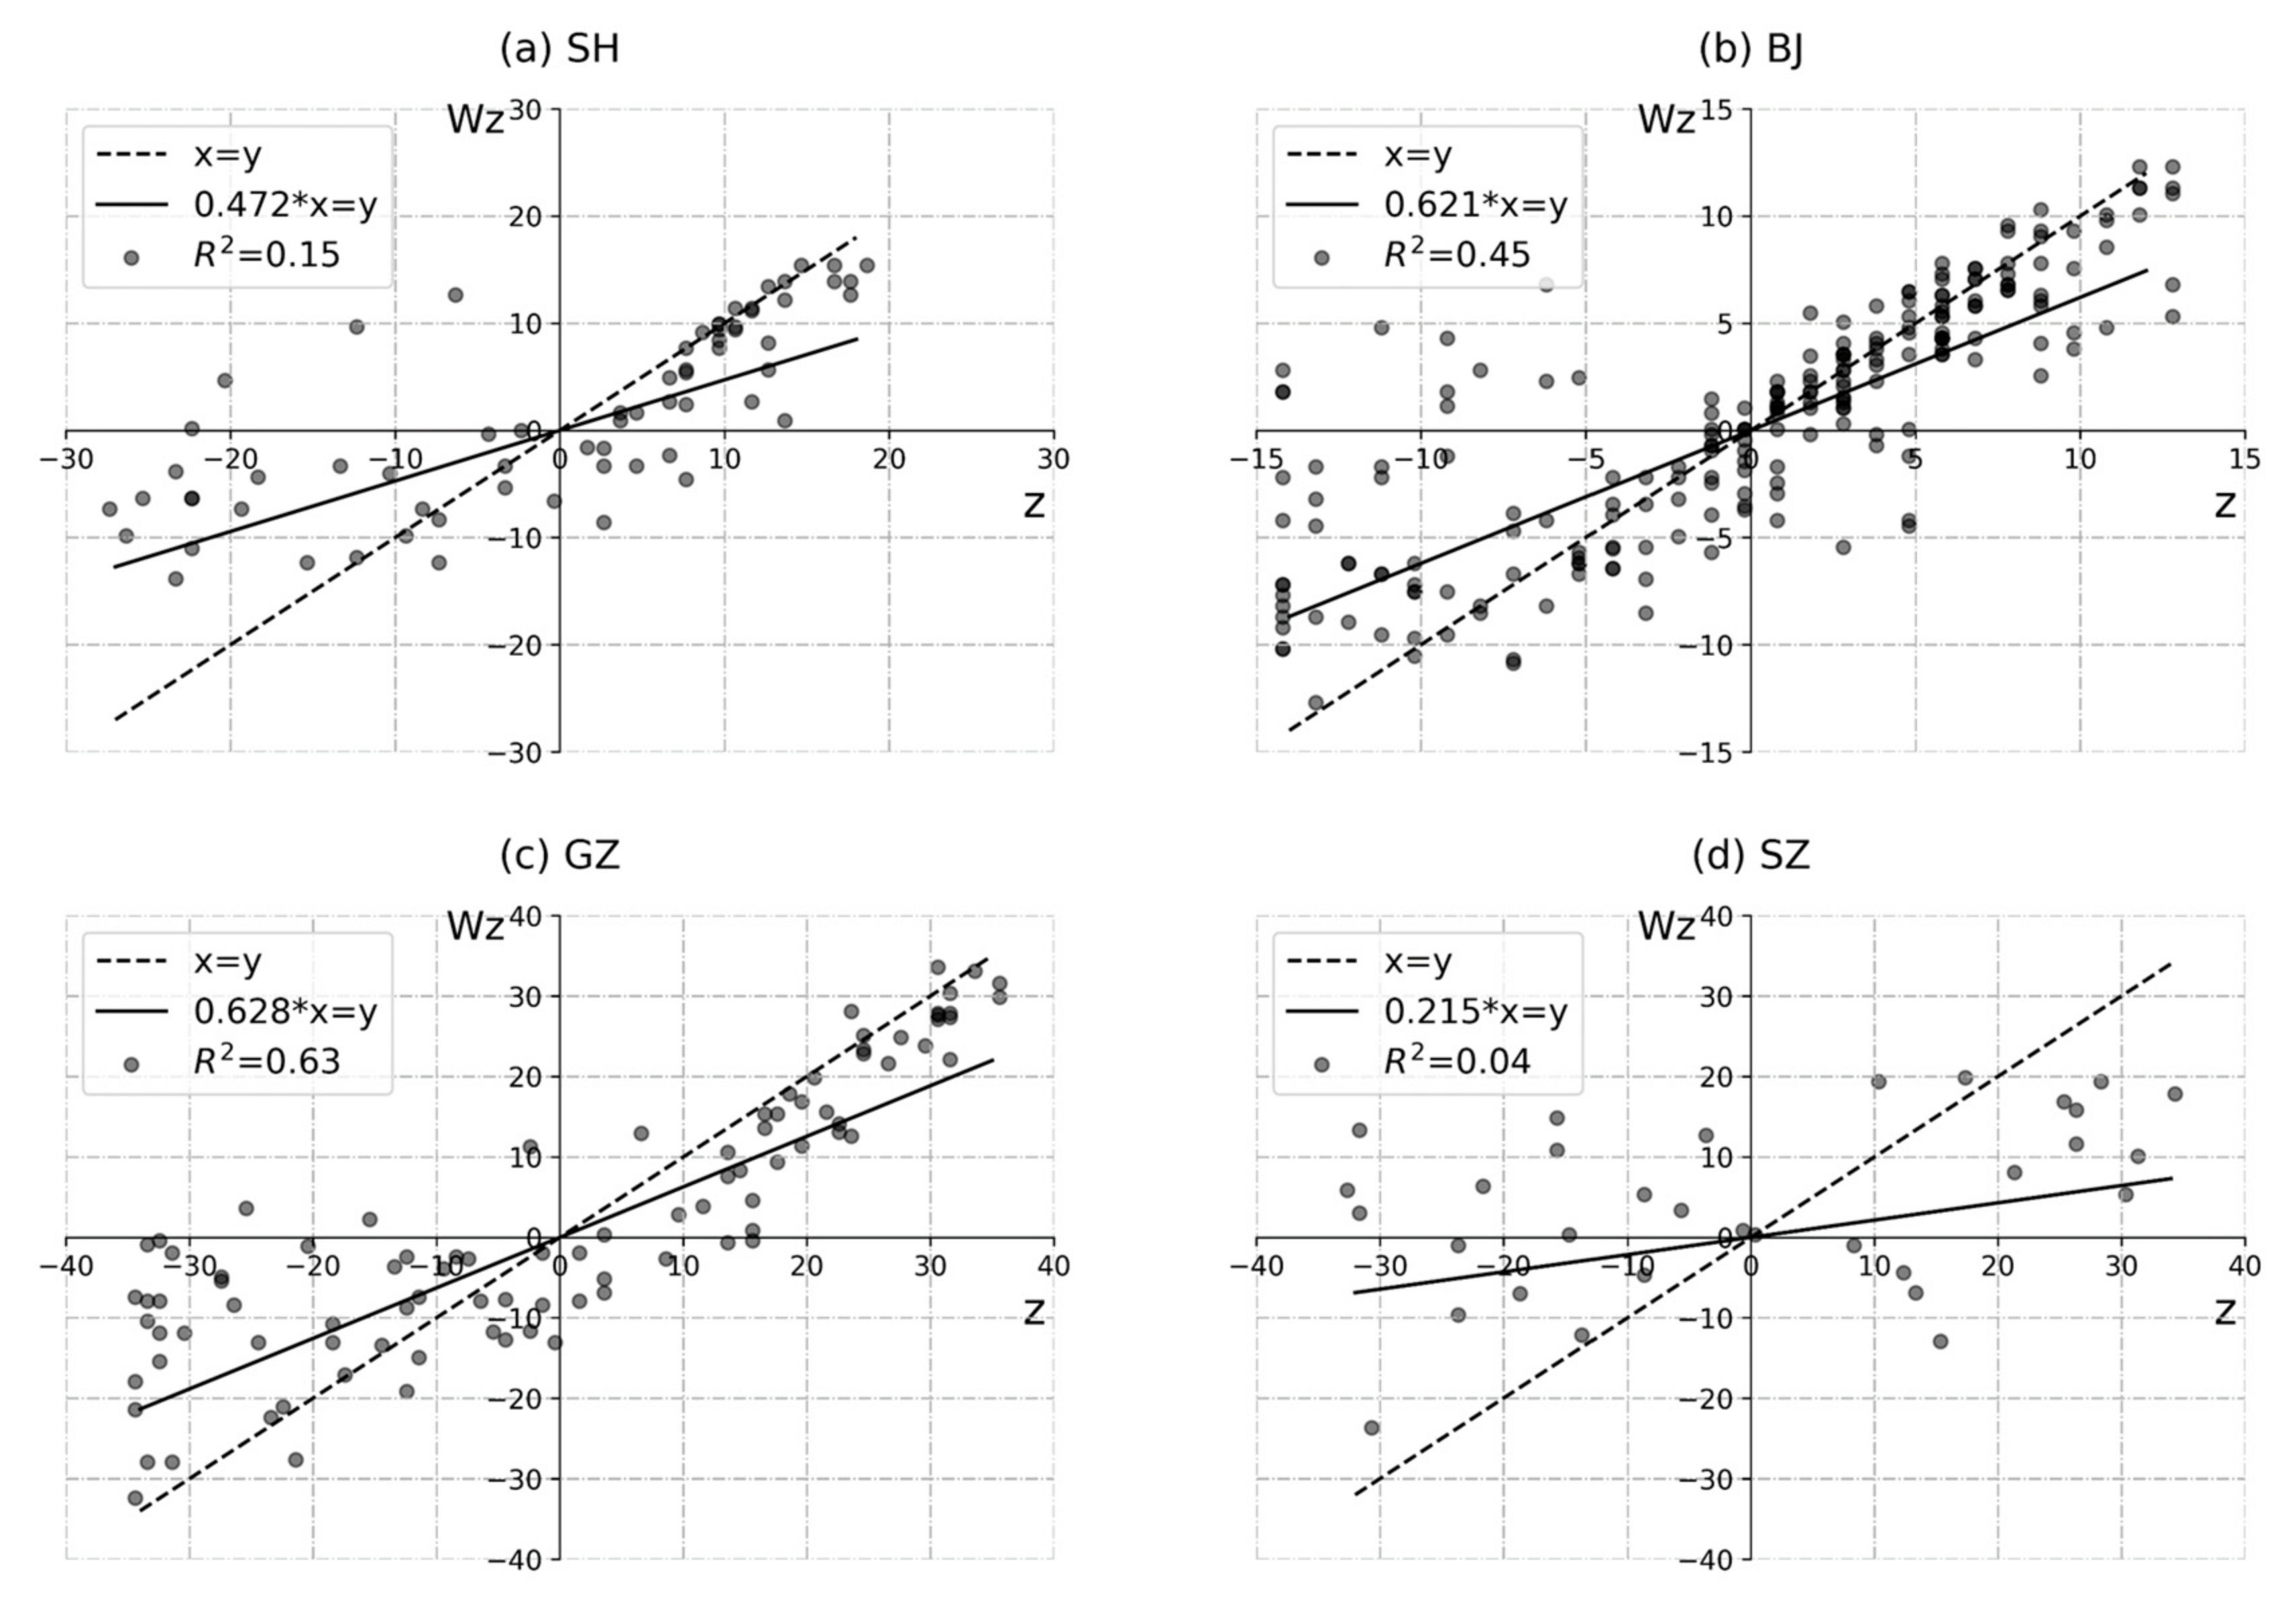
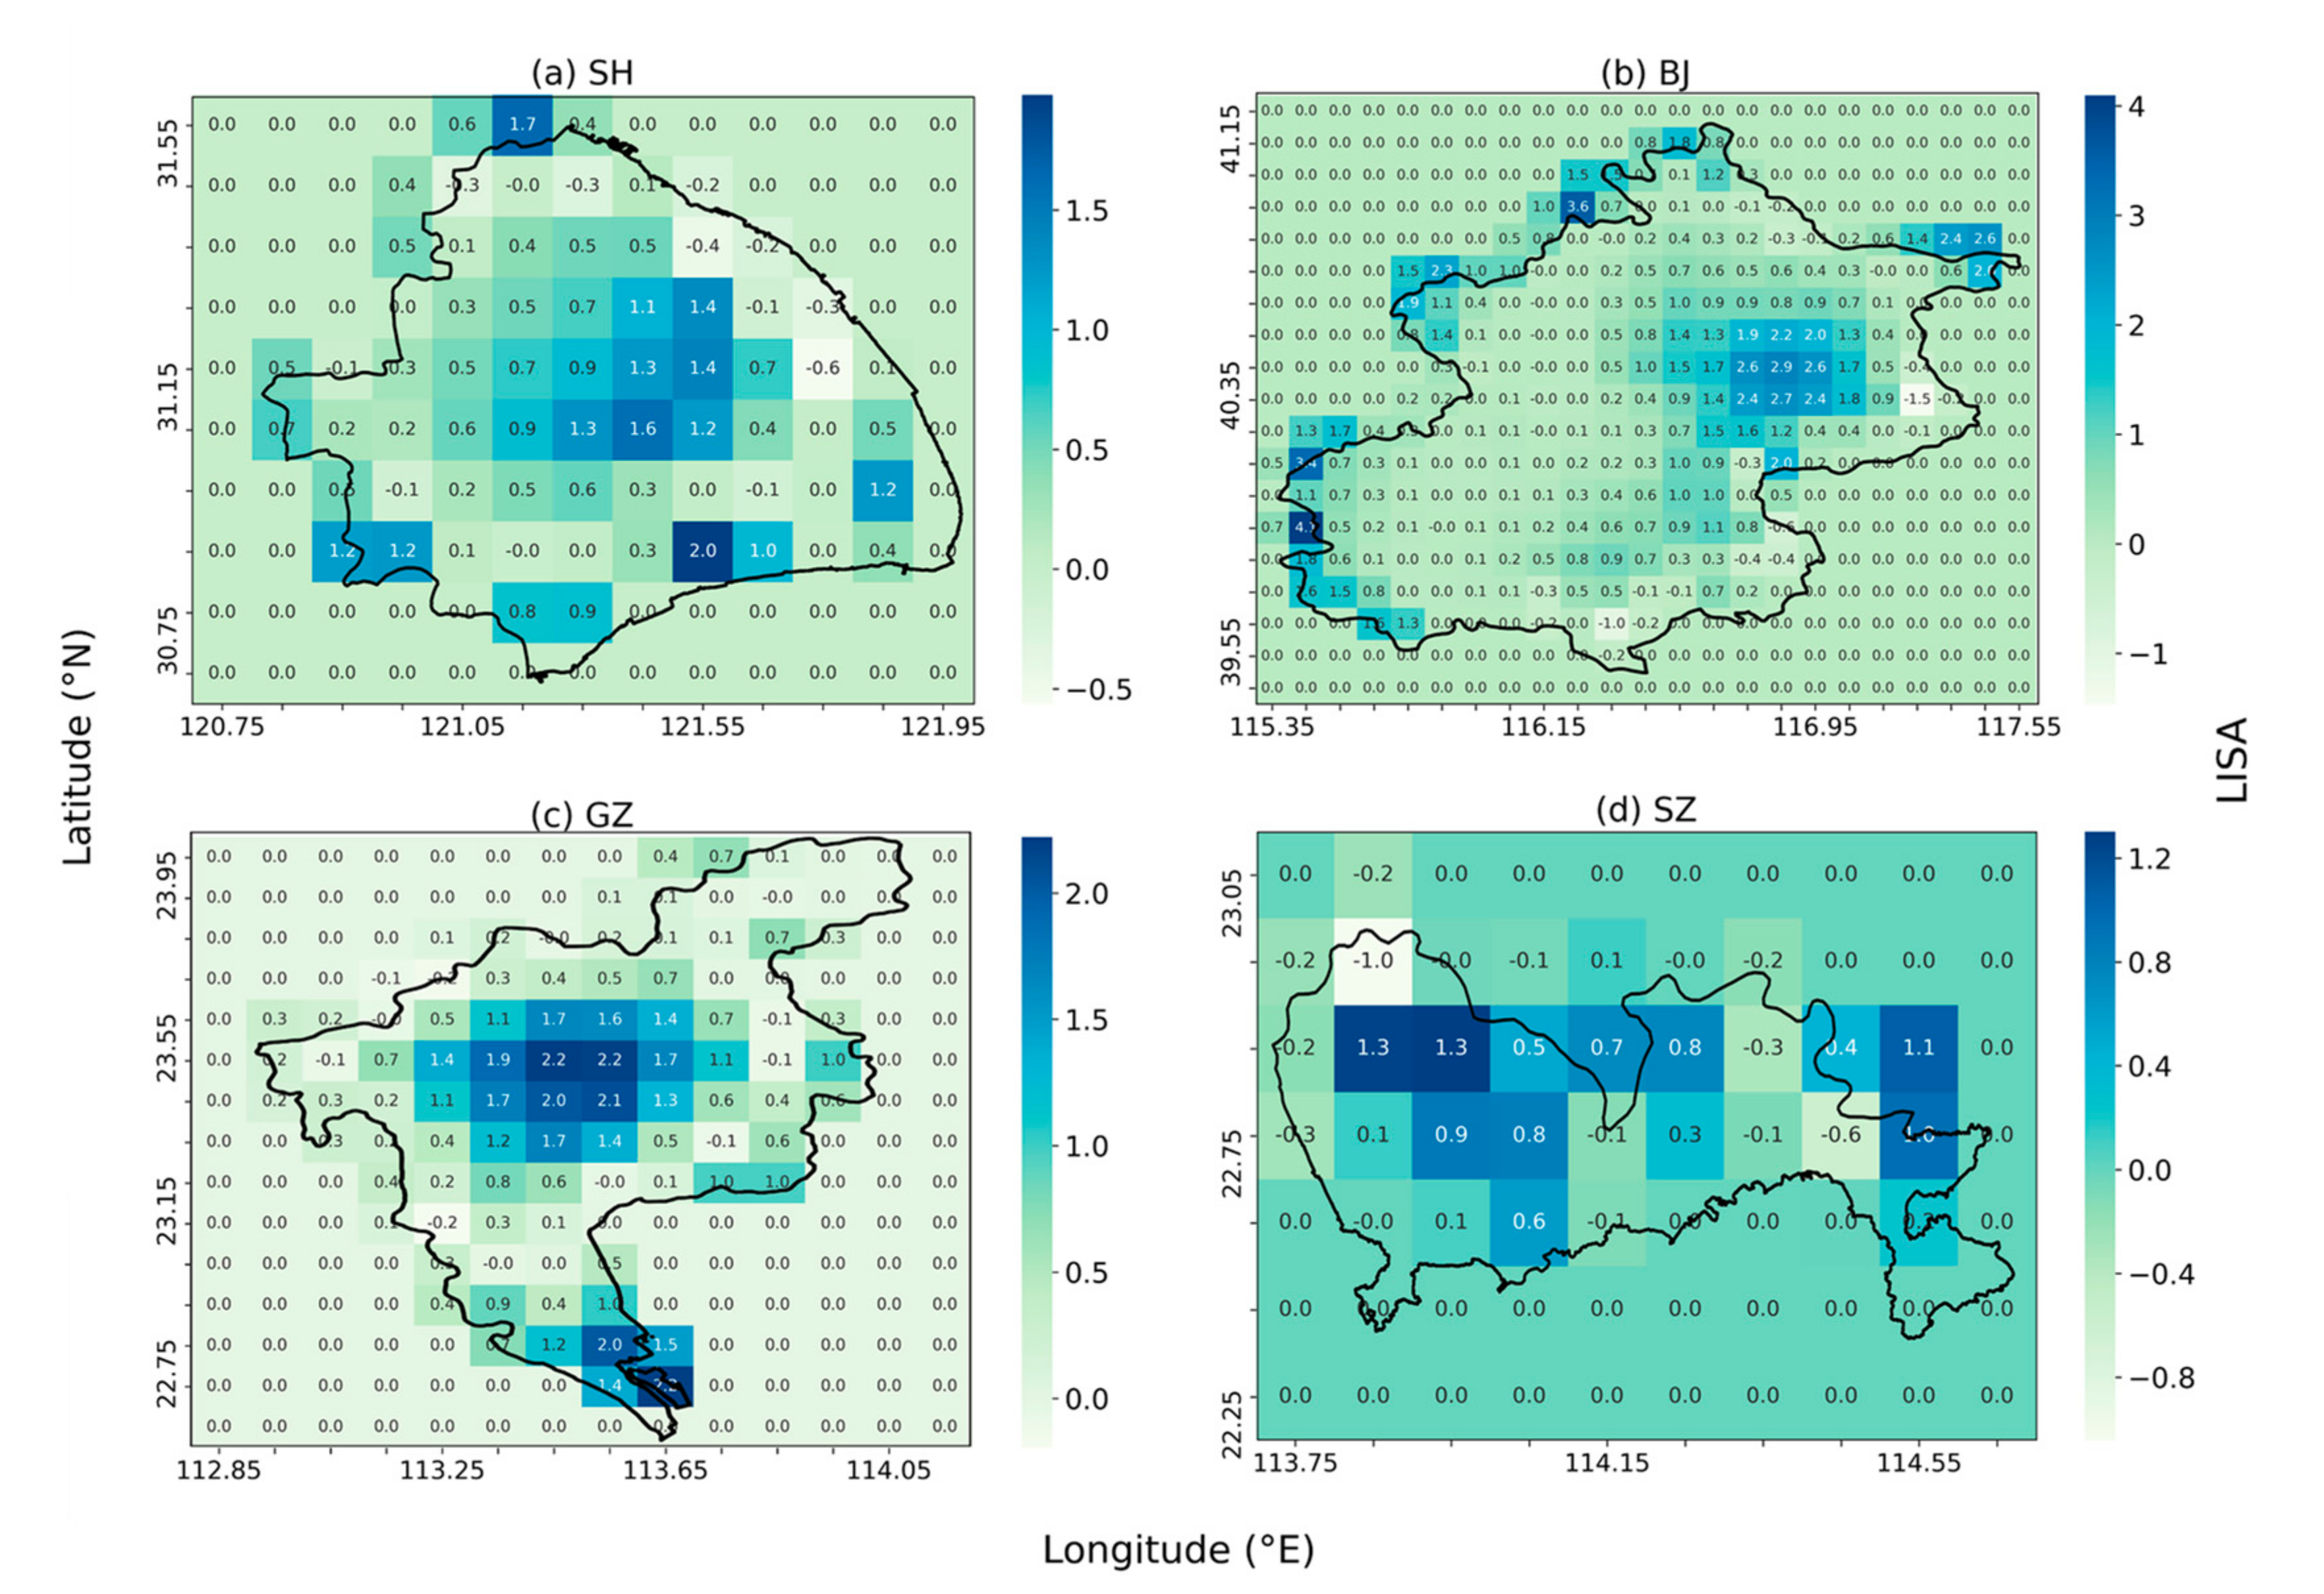
4.2.1. Rainfall Clustering Analysis
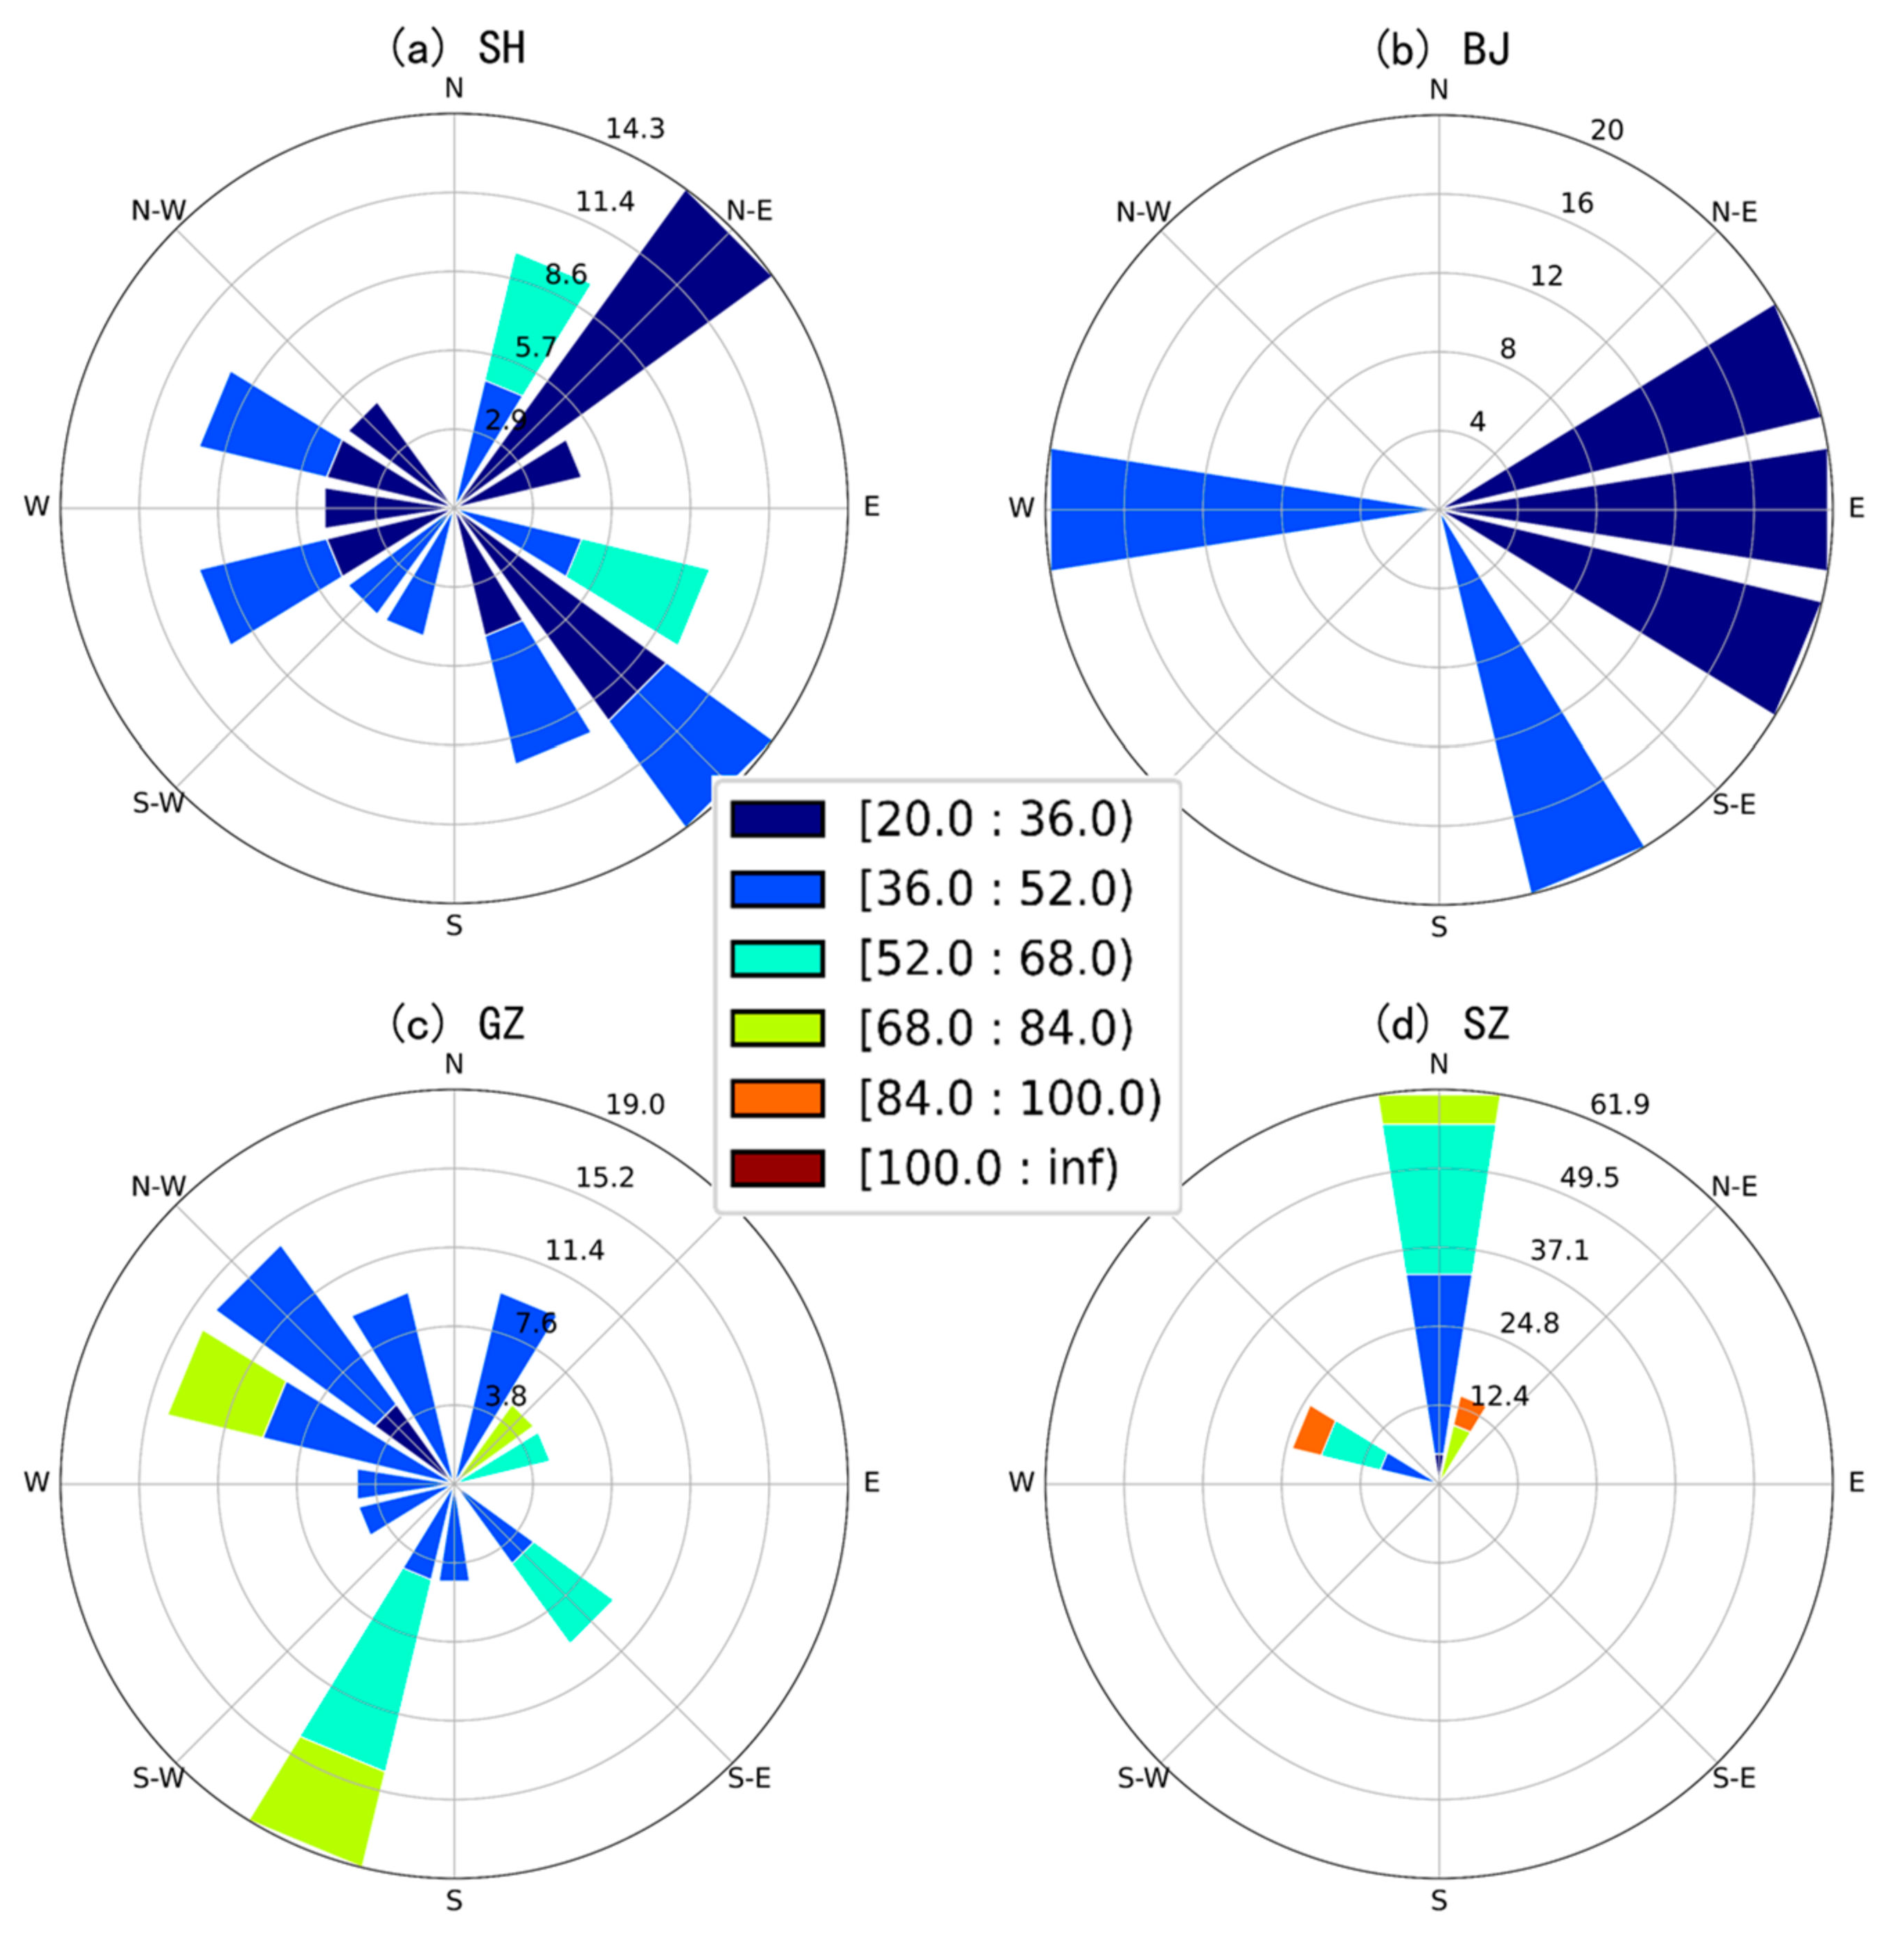
4.2.2. Distribution of Rainfall Centroids
4.3. Discussion
4.3.1. Influence of Urban Growth on Spatial Heterogeneity of Rainfall
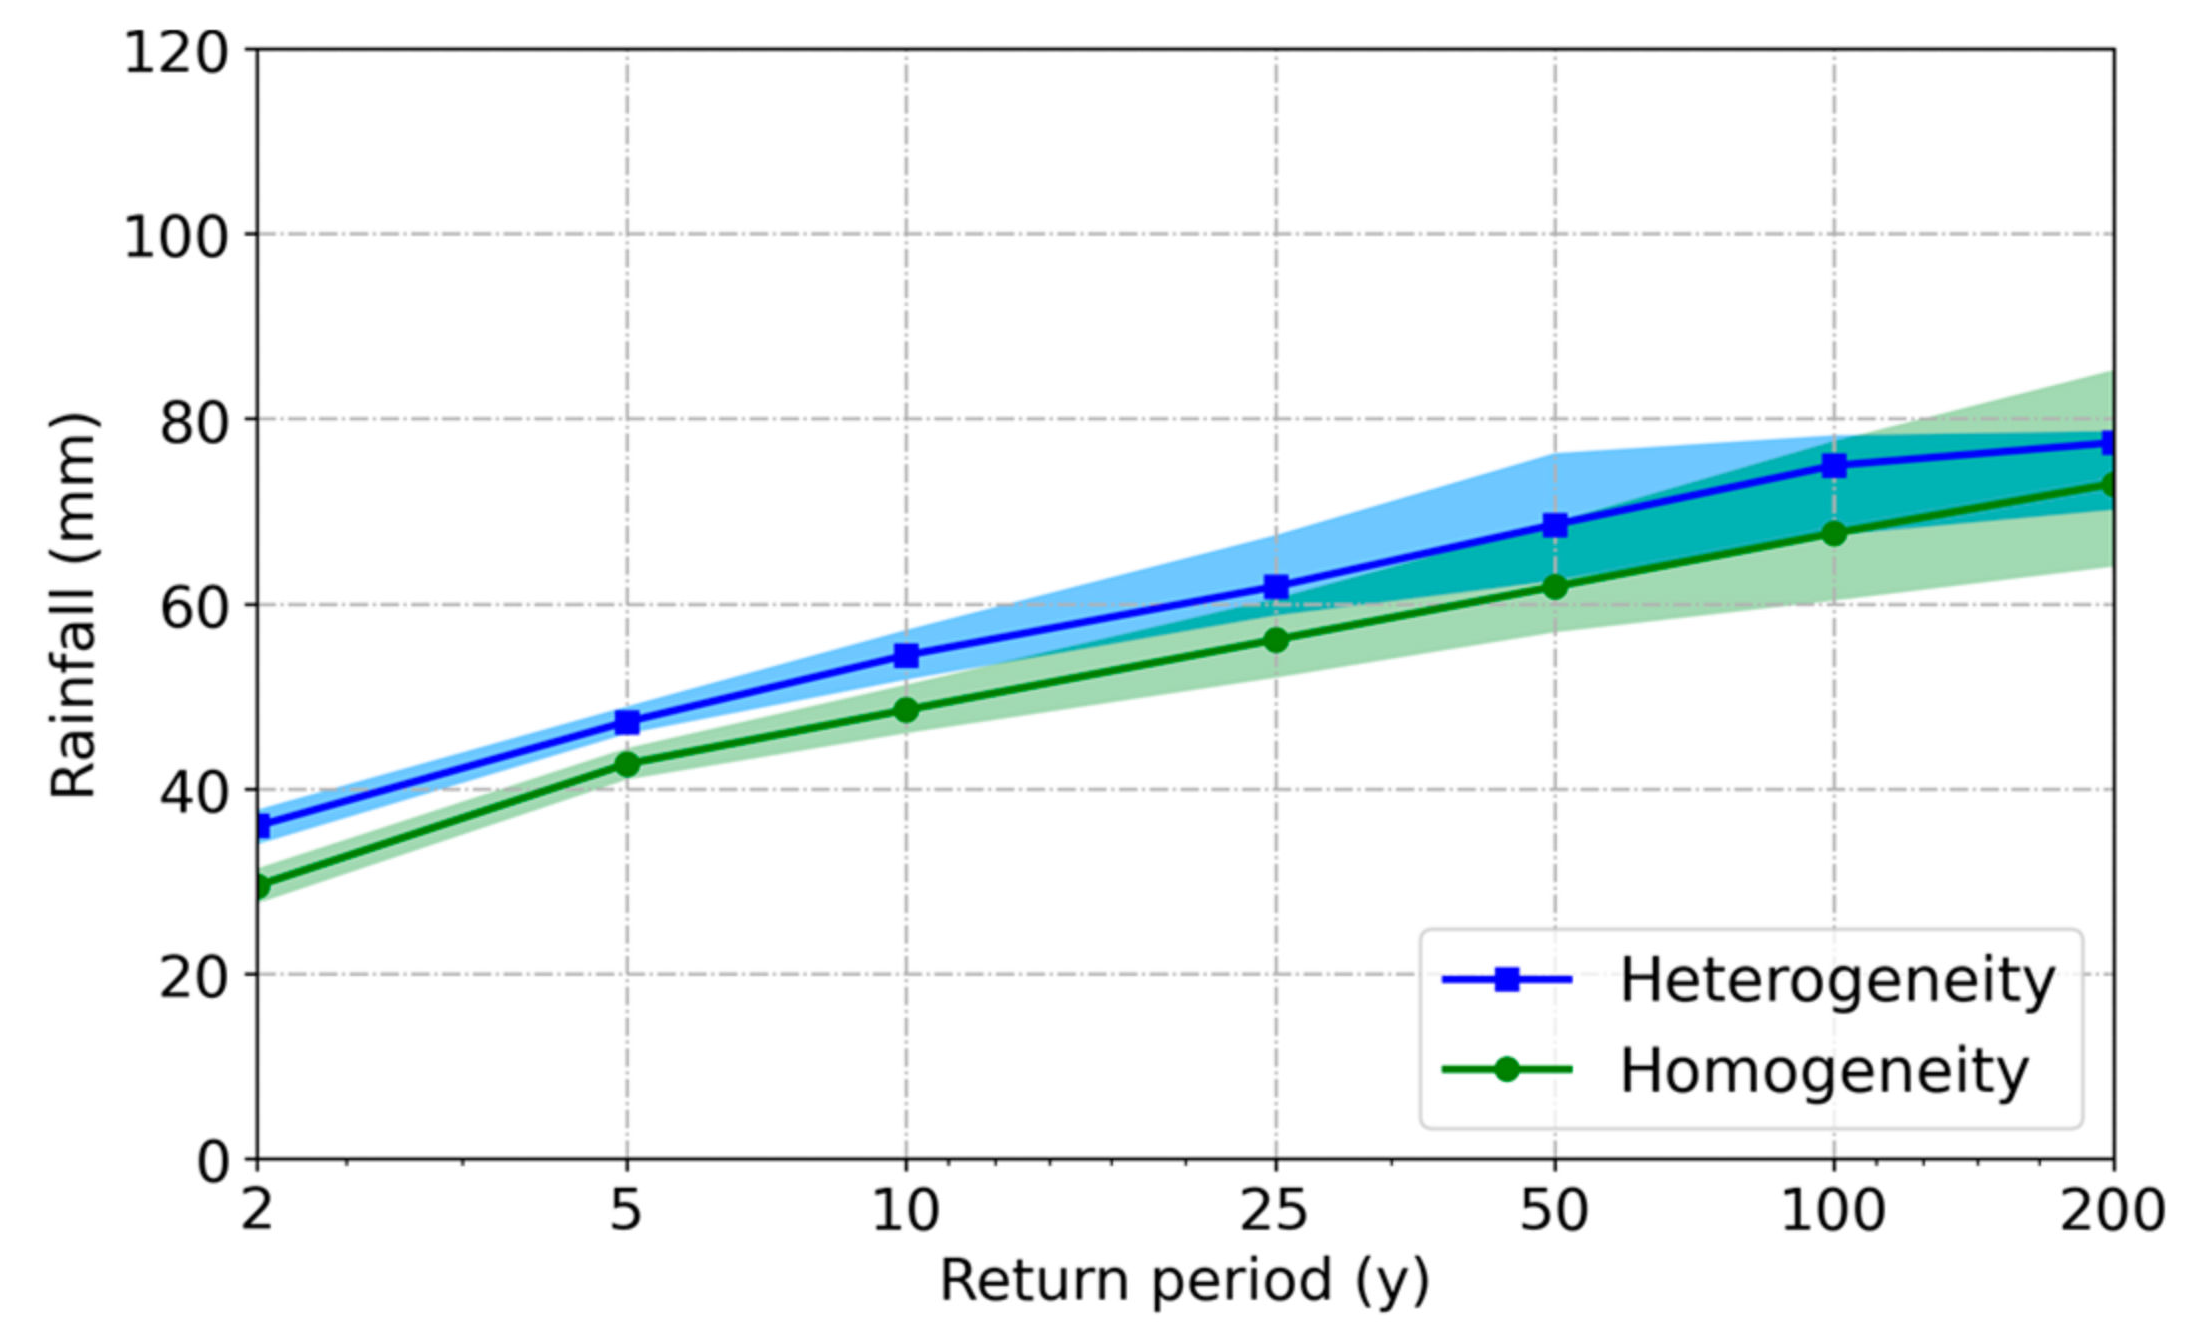
4.3.2. Influence of Rainfall Spatial Heterogeneity on Design Storm
5. Summary and Conclusions
- (1)
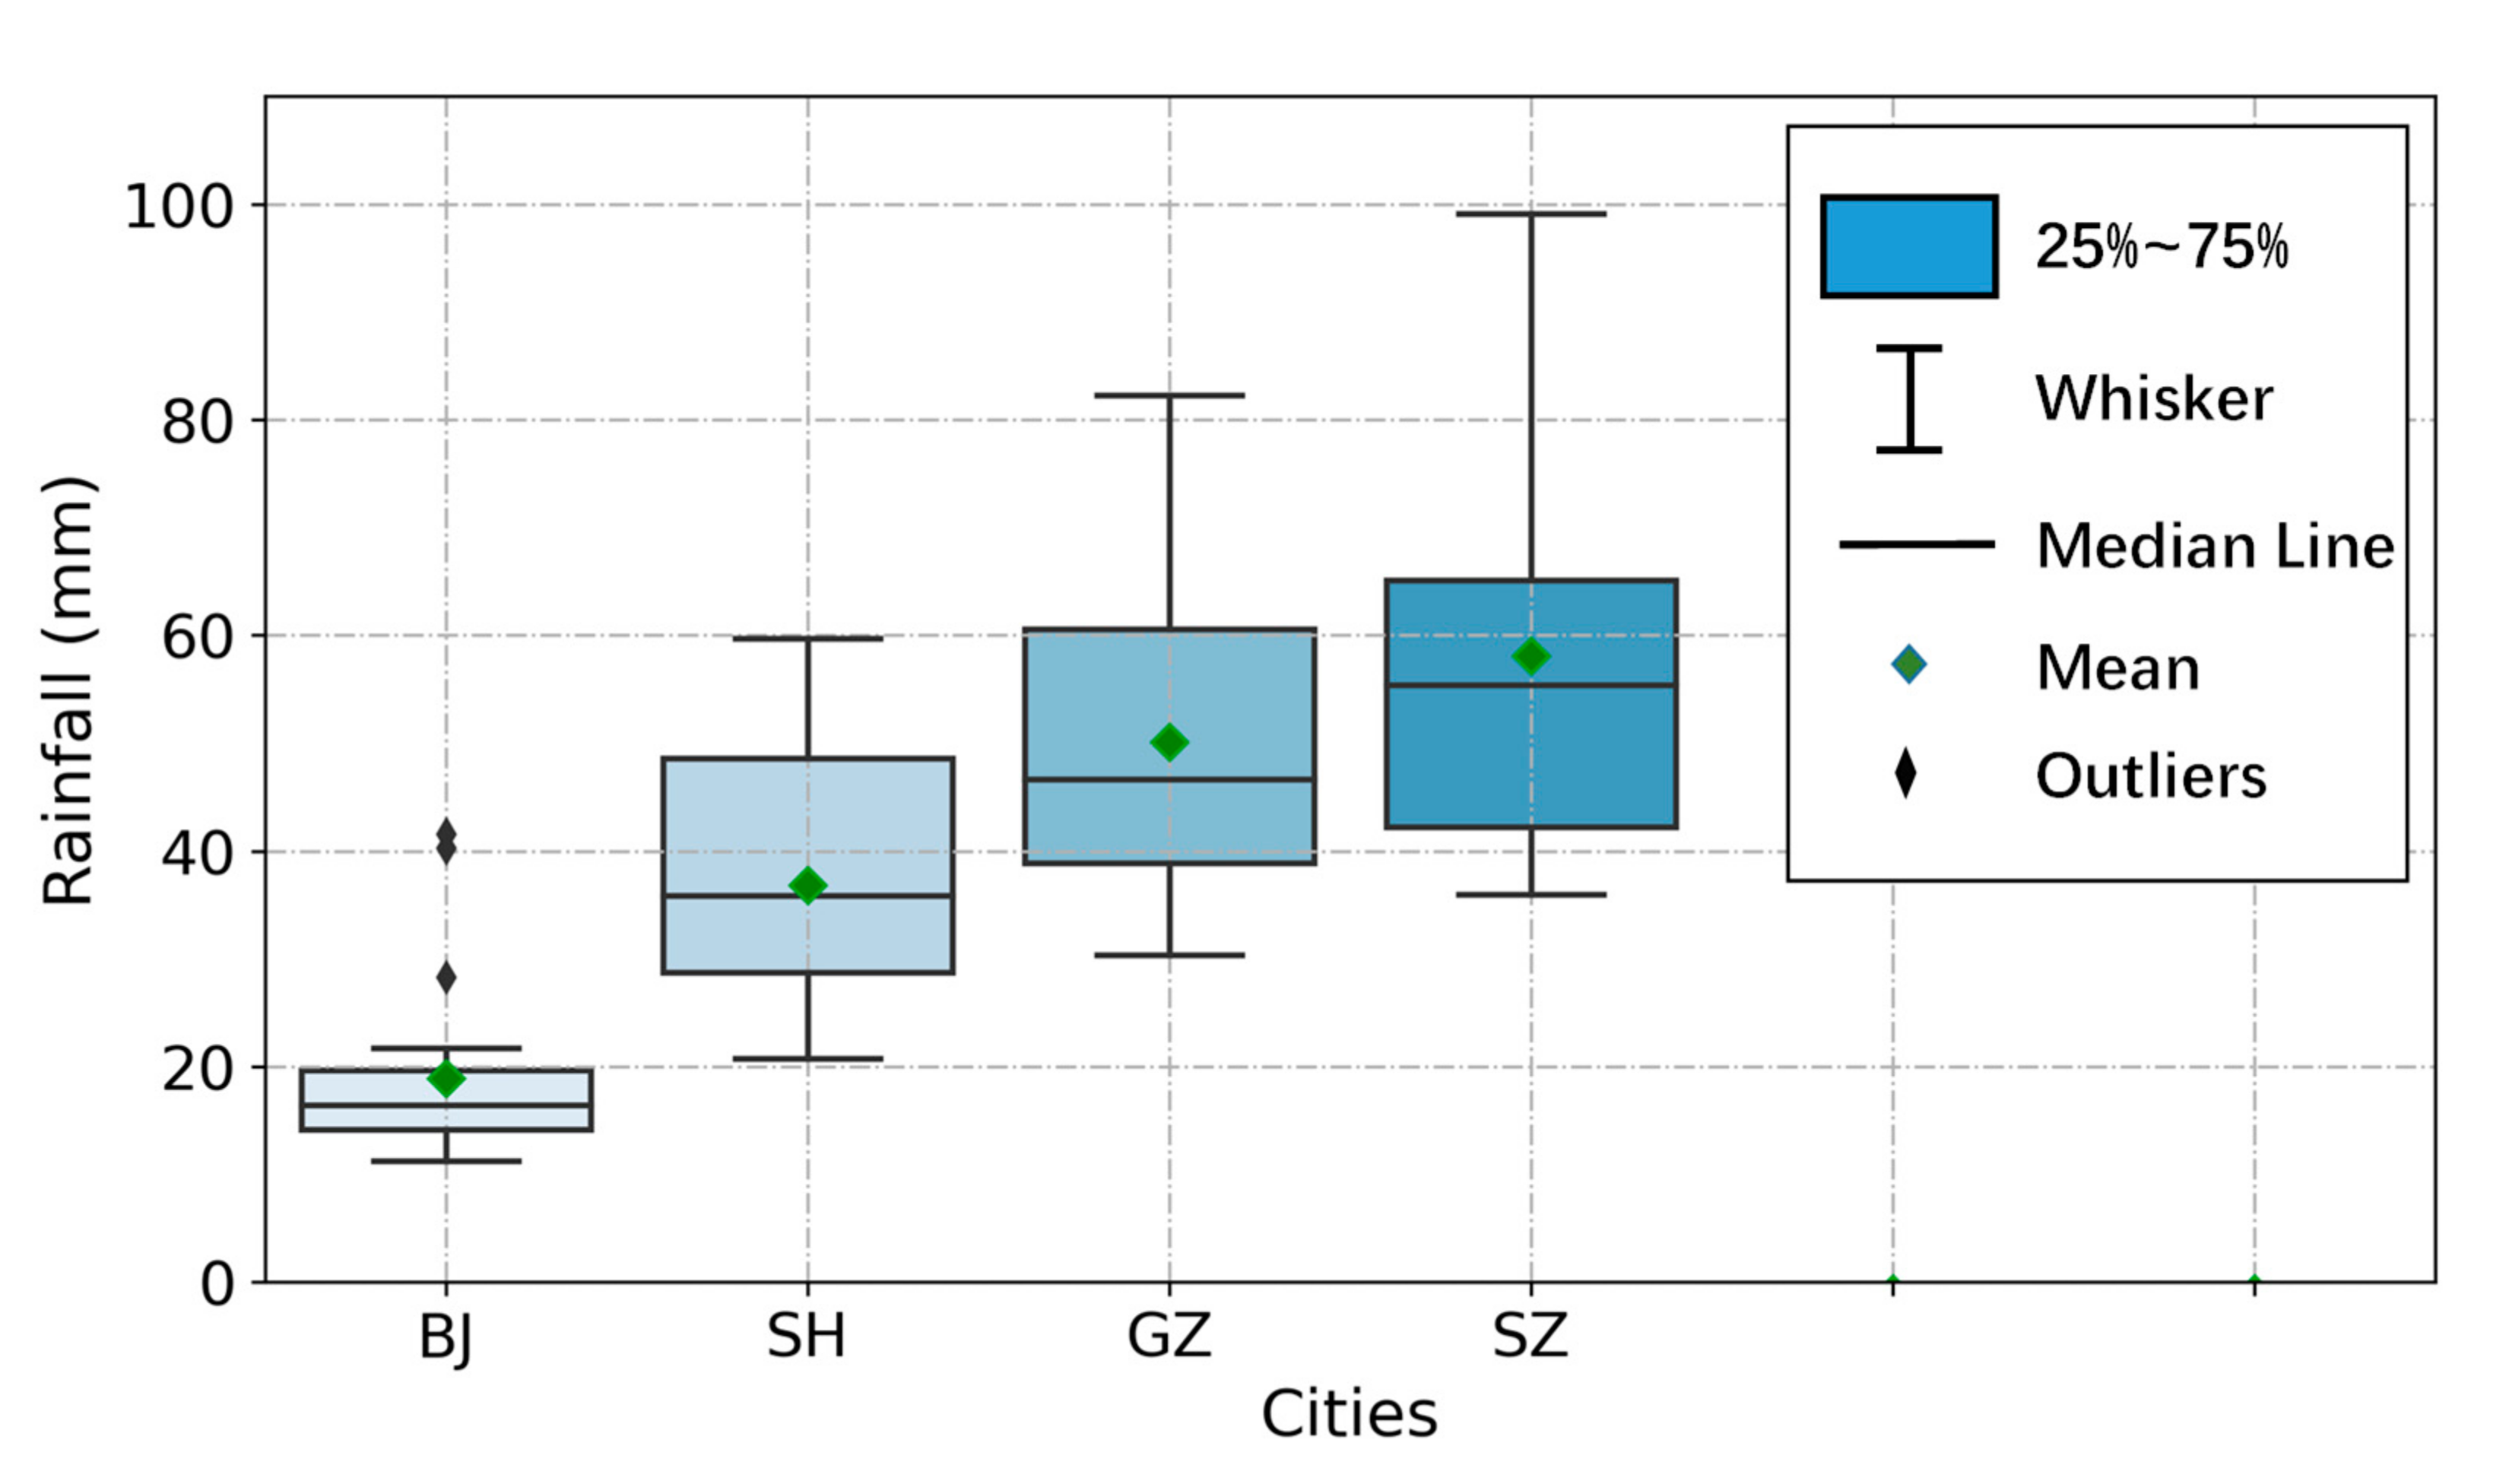
- Though there is no significant change in the magnitude of short-duration extreme rainfall, pronounced rainfall spatial heterogeneity can be found in the four megacities in China. SZ has the largest magnitude of rainfall, while GZ has the largest spatial heterogeneity. It was no significant positive correlation between magnitude and spatial heterogeneity of rainfall. The spatio-temporal analysis of extreme rainfall should attach importance to not only rainfall magnitude but also to the spatial heterogeneity.
- (2)
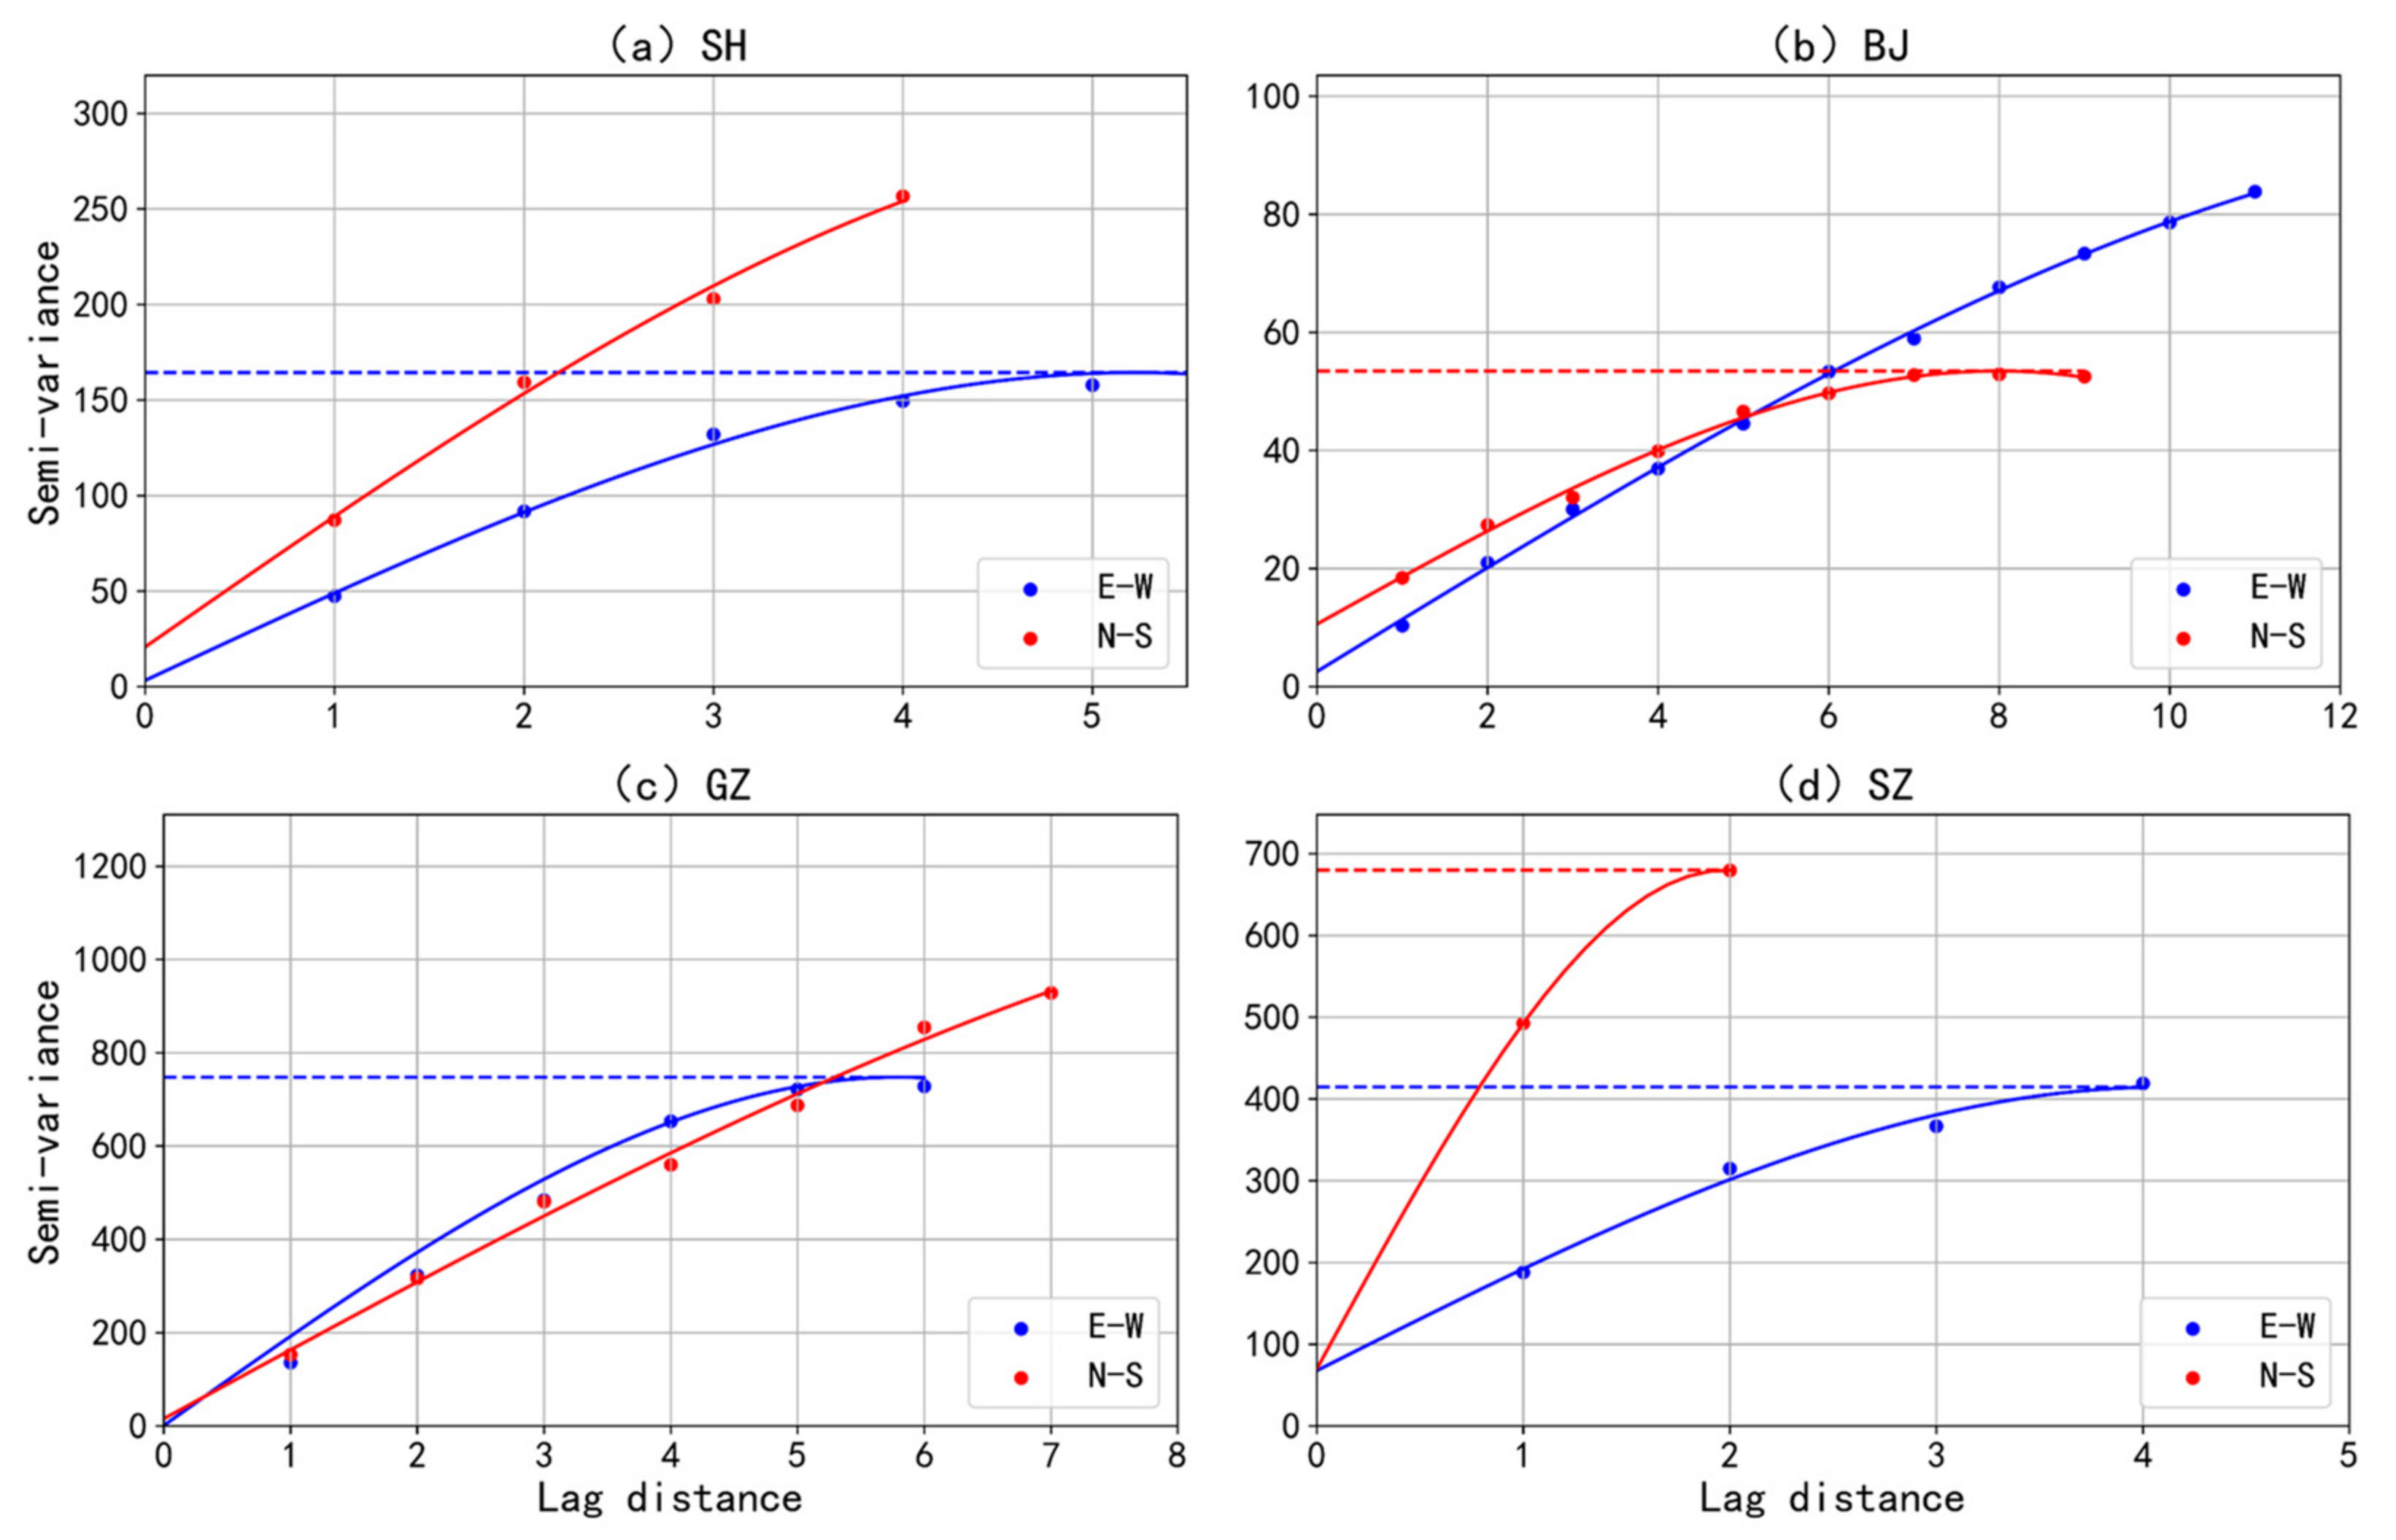
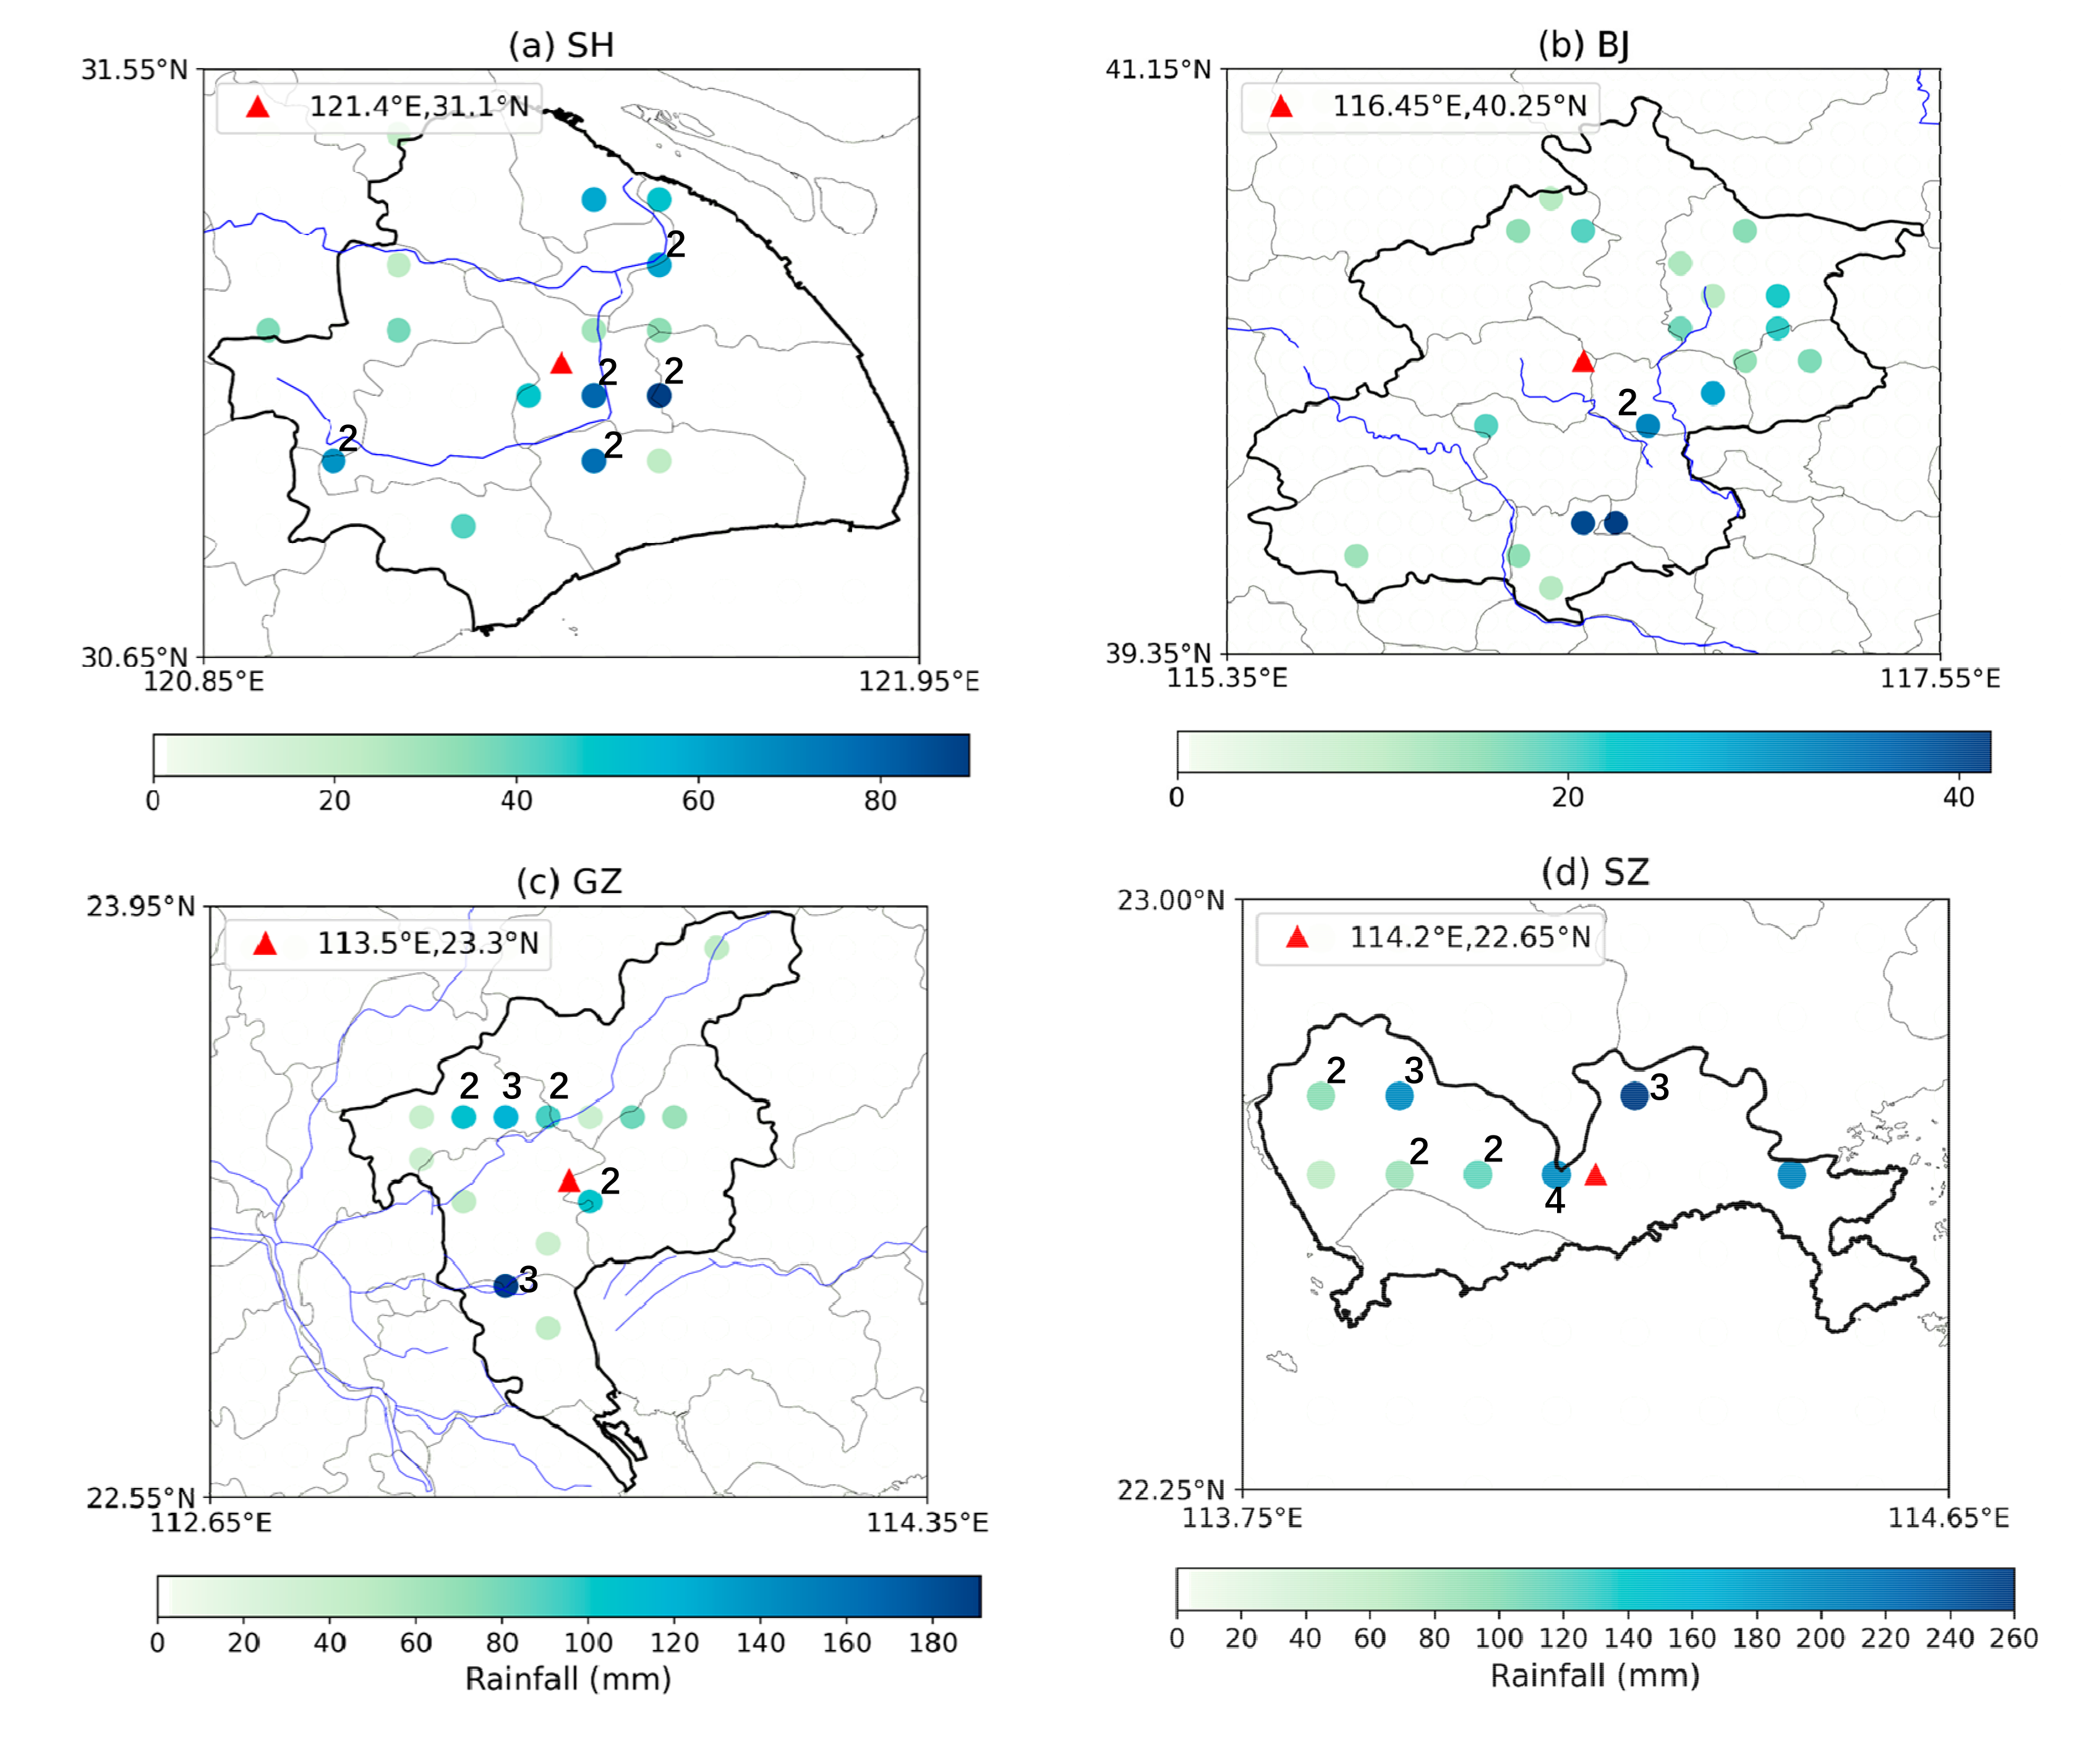
- The short-duration extreme rainfall exhibit four different patterns of spatial variability in SH, BJ, GZ, SZ. The extreme storm in SH clusters in the central portion, keeping a balance between transverse and longitudinal directions. In BJ, extreme storm clusters in the northeast plain with relatively small rainfall magnitude and a smooth process. The extreme storm in GZ shows a highly clustered pattern in the central areas accompanied by large rainfall magnitudes. Rainfall in the east-west attributed more than north-south to spatial clustering here. The clustering feature in SZ is not as significant as other cities, while the variability of rainfall magnitude is remarkable. It shows a transverse clustering pattern on the north side of the city. Due to different climate, topography, and land use, spatial heterogeneity of rainfall shows different characteristics in these four cities.
- (3)
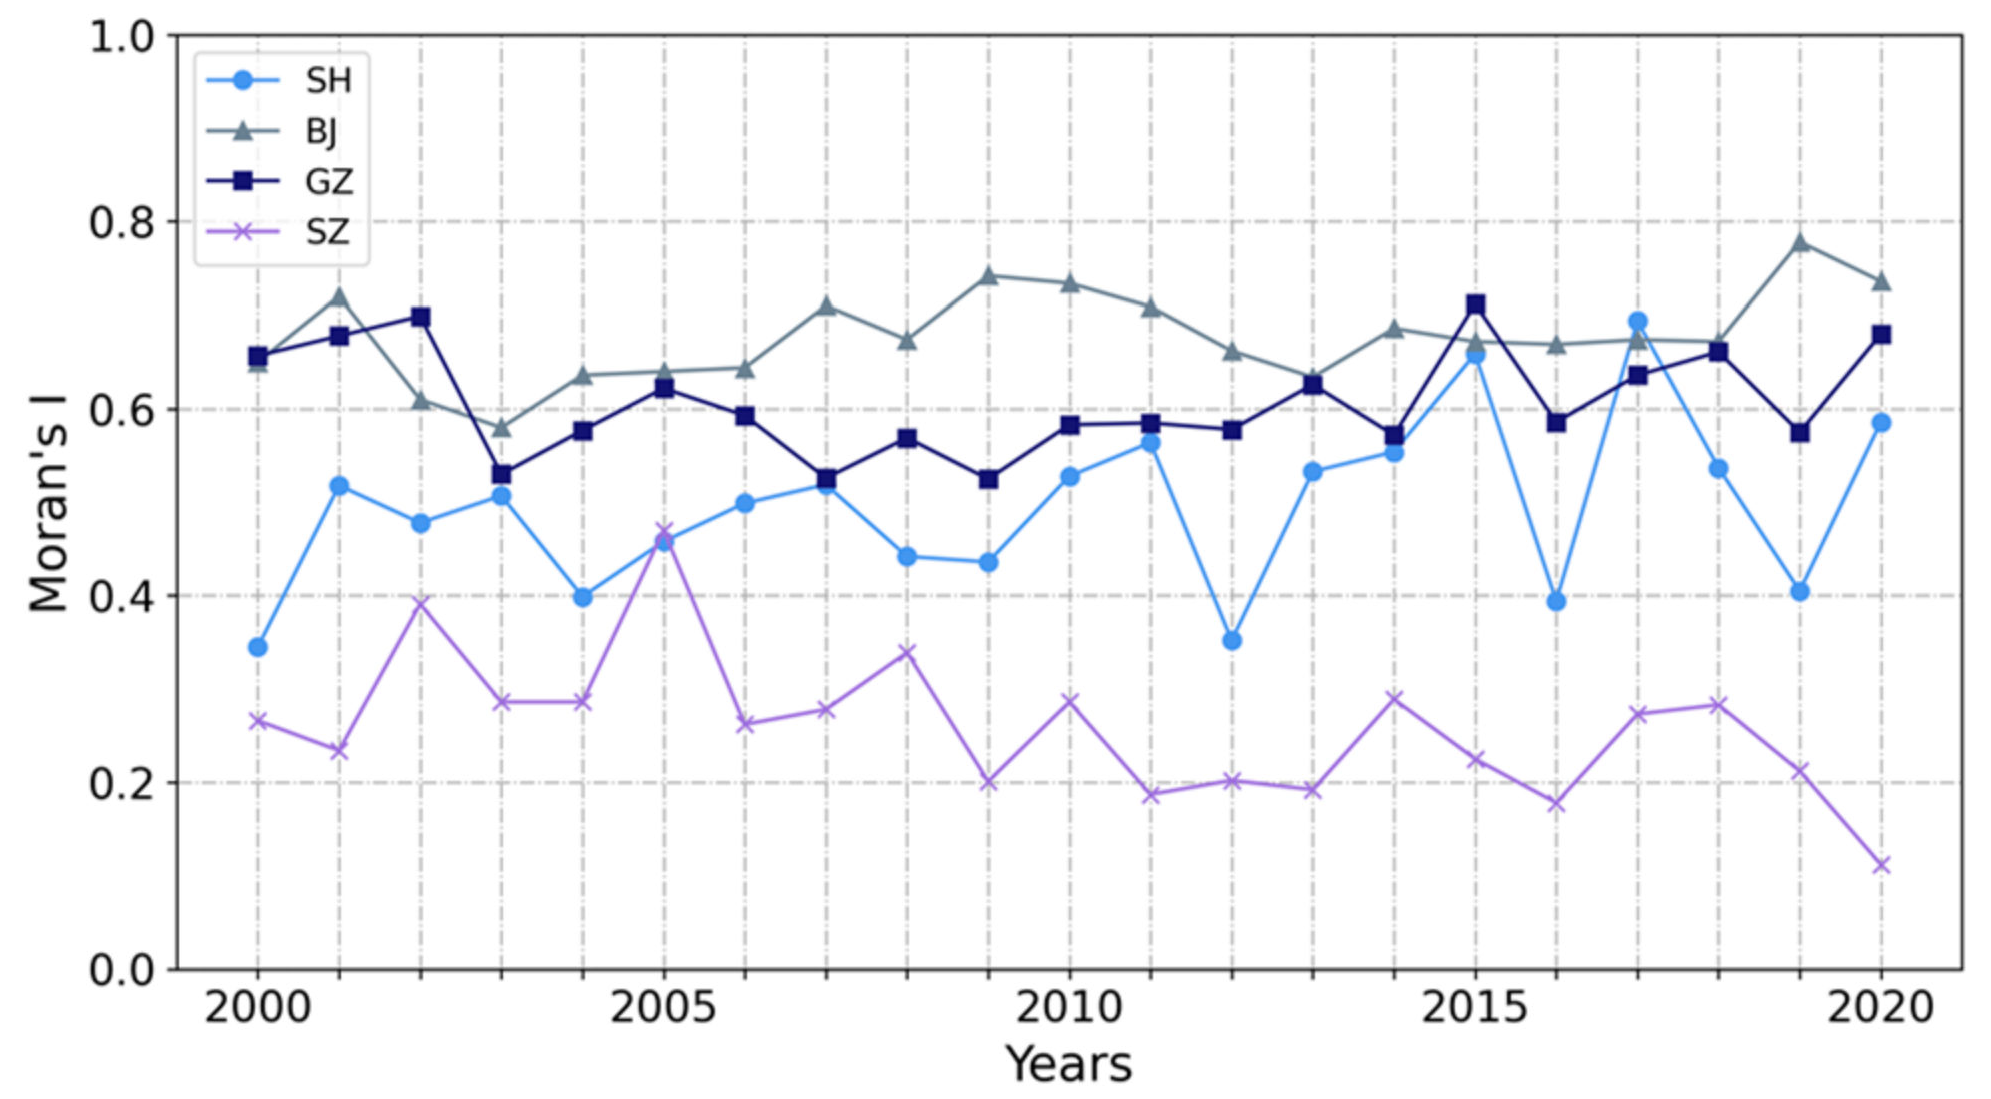
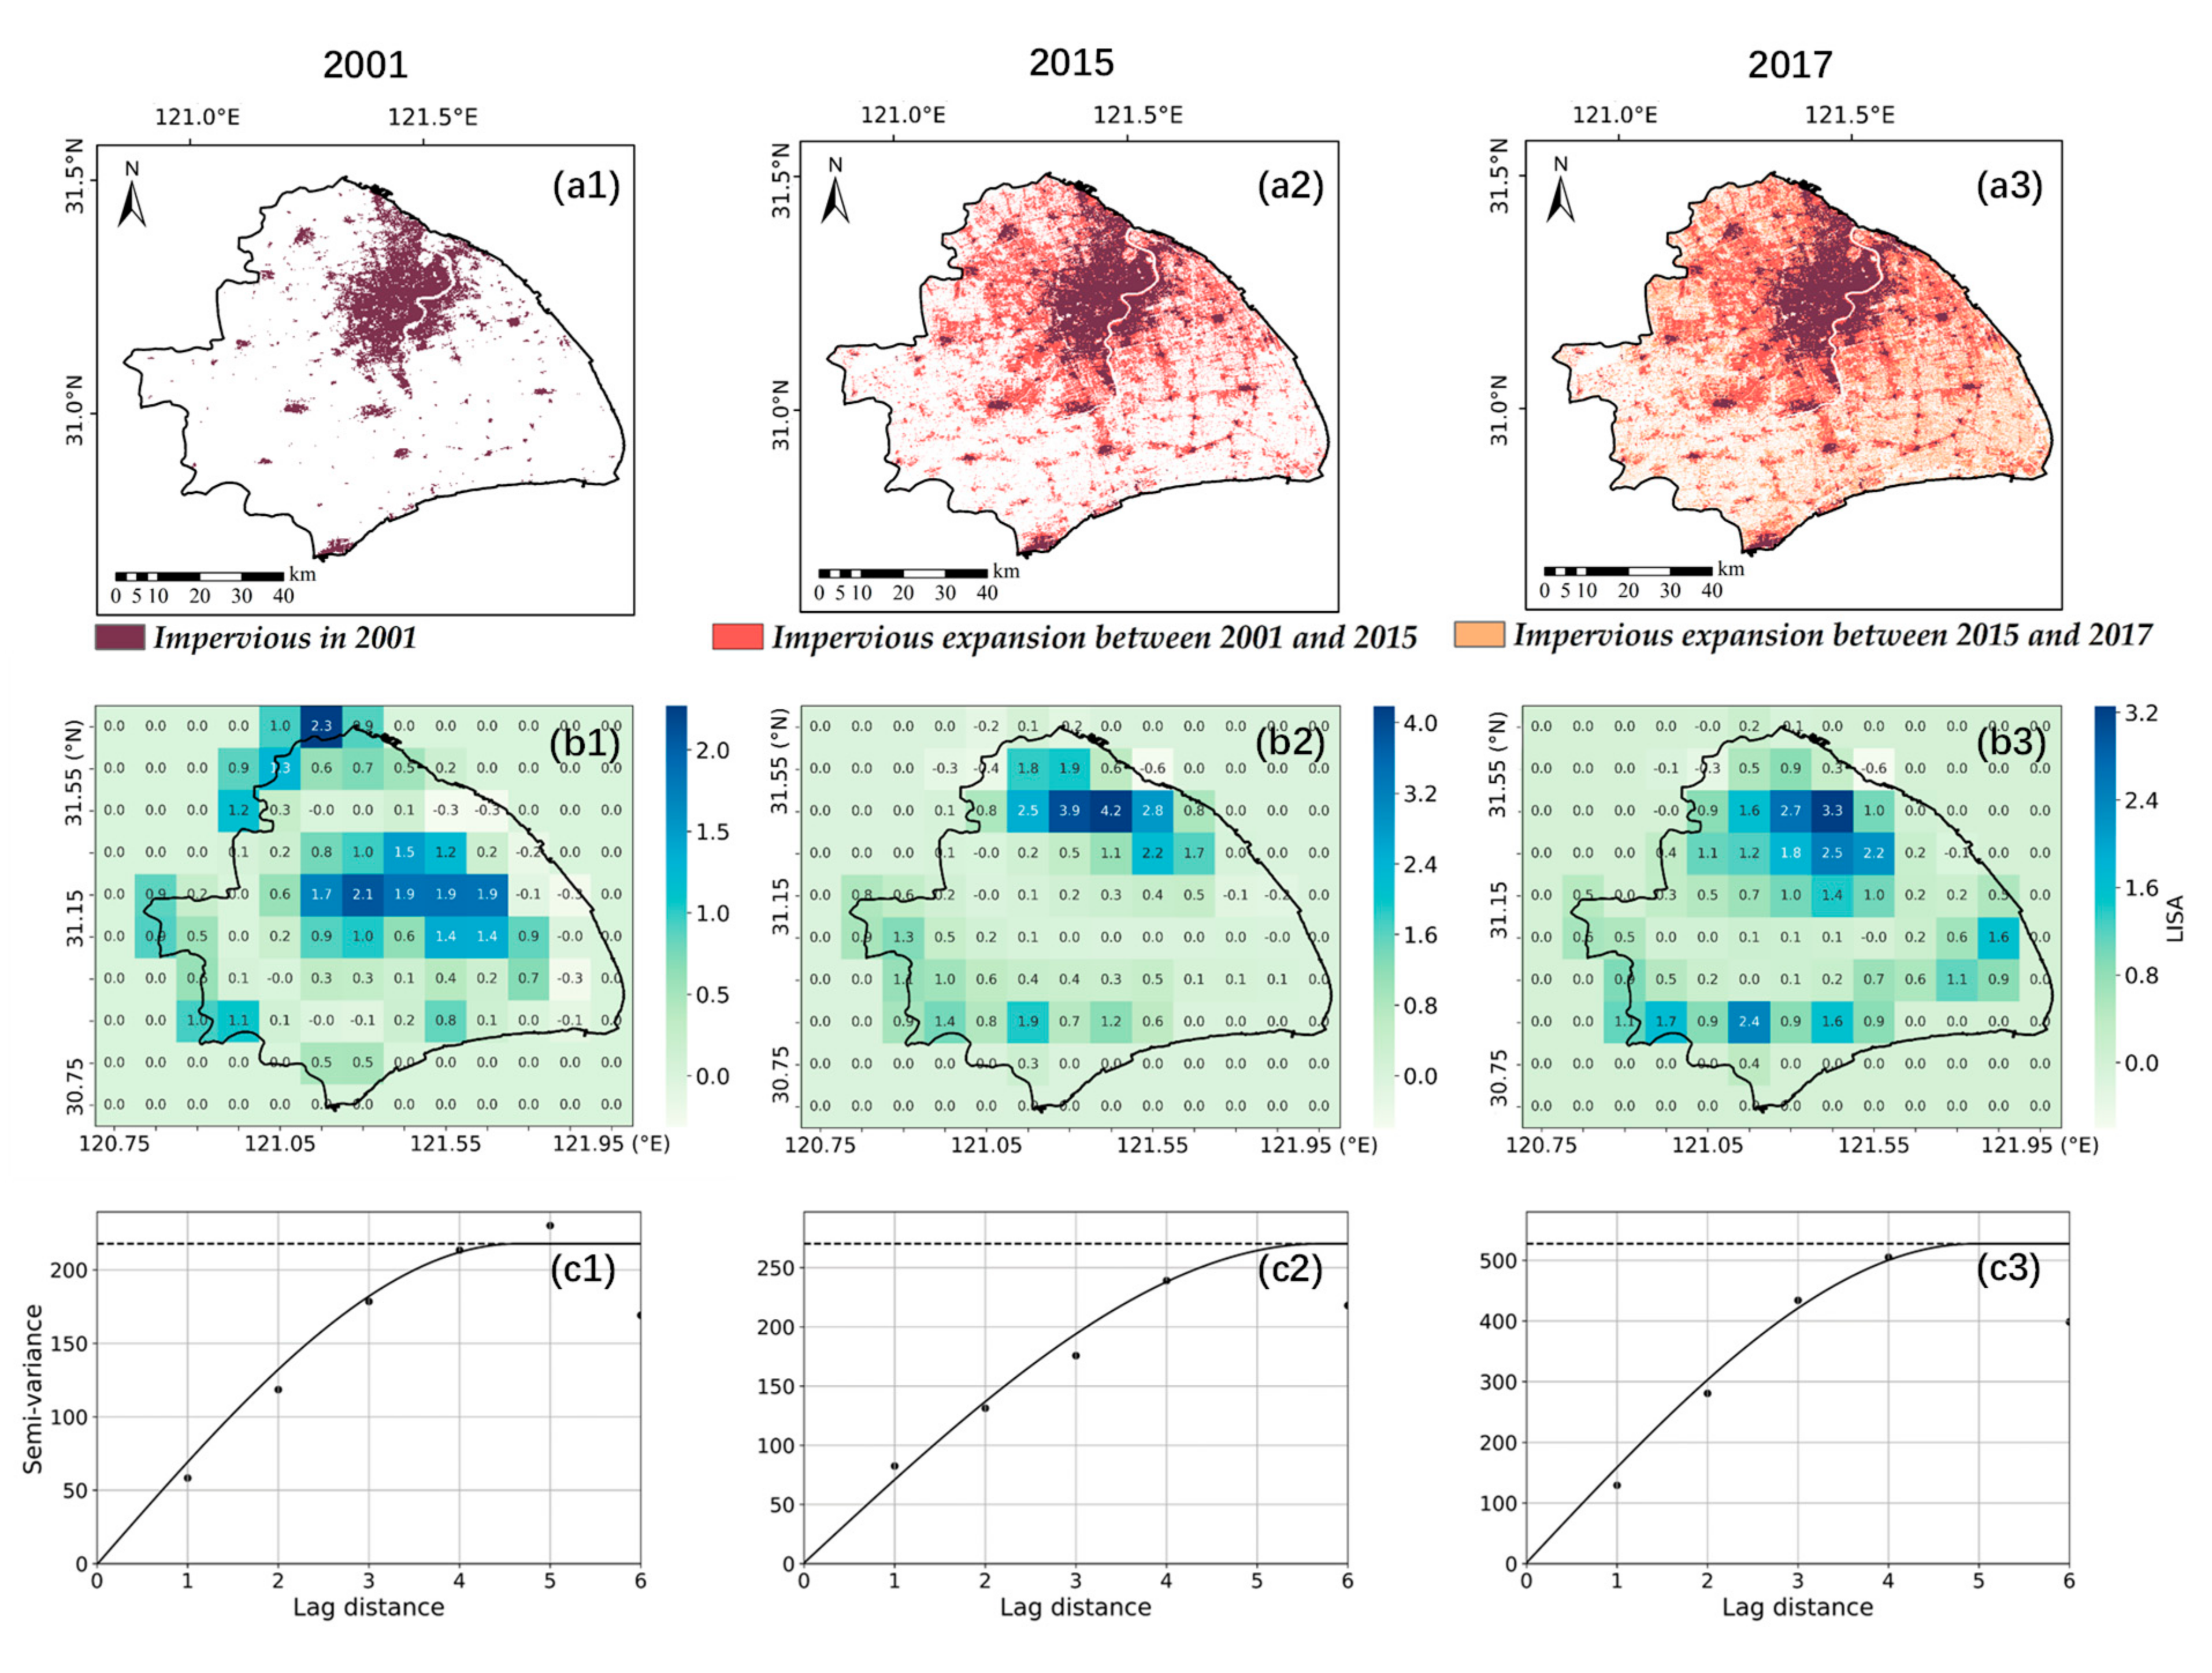
- Urban growth plays a role in the change of rainfall spatial heterogeneity. SH is a city that shows the largest increase in urbanization and rainfall spatial heterogeneity. During its rapid urbanization in the last 20 years, there is an increasing trend in Moran’s I in SH. The rainfall clusters in SH also tend to cluster in the most urbanized areas. Rainfall spatial heterogeneity cannot be neglected in design storms and thus in the design of urban flood mitigation measurements.
Author Contributions
Funding
Acknowledgments
Conflicts of Interest
References
- Westra, S.; Fowler, H.J.; Evans, J.P.; Alexander, L.V.; Berg, P.; Johnson, F.; Kendon, E.J.; Lenderink, G.; Roberts, N.M. Future changes to the intensity and frequency of short-duration extreme rainfall. Rev. Geophys. 2014, 52, 525–555. [Google Scholar] [CrossRef]
- Wright, D.B.; Smith, J.A.; Villarini, G.; Baeck, M.L. Estimating the frequency of extreme rainfall using weather radar and stochastic storm transposition. J. Hydrol. 2013, 488, 155–165. [Google Scholar] [CrossRef]
- Adnan, M.S.G.; Talchabhadel, R.; Nakagawa, H.; Hall, J.W. The potential of tidal river management for flood alleviation in south western Bangladesh. Sci. Total Environ. 2020, 731, 138747. [Google Scholar] [CrossRef] [PubMed]
- World Meteorological Organization. WMO Statement on the State of the Global Climate in 2019; World Meteorological Organization: New York, NY, USA, 2020. [Google Scholar]
- Abd-Elhamid, H.F.; Zeleňáková, M.; Vranayová, Z.; Fathy, I. Evaluating the impact of urban growth on the design of storm water drainage systems. Water 2020, 12, 1572. [Google Scholar] [CrossRef]
- Szwagrzyk, M.; Kaim, D.; Price, B.; Wypych, A.; Grabska, E.; Kozak, J. Impact of forecasted land use changes on flood risk in the Polish Carpathians. Nat. Hazards 2018, 94, 227–240. [Google Scholar] [CrossRef] [Green Version]
- Wang, G.; Zhang, Q.; Yu, H.; Shen, Z.; Sun, P. Double increase in precipitation extremes across China in a 1.5 °C/2.0 °C warmer climate. Sci. Total Environ. 2020, 746, 140807. [Google Scholar] [CrossRef] [PubMed]
- Li, J.; Wang, B. Predictability of summer extreme precipitation days over eastern China. Clim. Dyn. 2018, 51, 4543–4554. [Google Scholar] [CrossRef]
- Han, T.; Wang, H.; Hao, X.; Li, S. Seasonal prediction of midsummer extreme precipitation days over Northeast China. J. App. Meteorol. Climatol. 2019, 58, 2033–2048. [Google Scholar] [CrossRef]
- Wu, Y.; Li, S.; Yu, S. Monitoring urban expansion and its effects on land use and land cover changes in Guangzhou city, China. Environ. Monit. Assess. 2016, 188, 54. [Google Scholar] [CrossRef]
- Wang, Y.; Xie, X.; Liang, S.; Zhu, B.; Yao, Y.; Meng, S.; Lu, C. Quantifying the response of potential flooding risk to urban growth in Beijing. Sci. Total Environ. 2020, 705, 135868. [Google Scholar] [CrossRef]
- Wright, D.B.; Smith, J.A.; Baeck, M.L. Critical examination of area reduction factors. J. Hydraul. Eng. 2014, 19, 769–776. [Google Scholar] [CrossRef]
- Wright, D.B.; Smith, J.A.; Villarini, G.; Baeck, M. Applications of radar-based rainfall estimates to urban flood studies. J. Water Manag. Model. 2013, 21. [Google Scholar] [CrossRef]
- Chaubey, I.; Haan, C.T.; Grunwald, S.; Salisbury, J.M. Uncertainty in the model parameters due to spatial variability of rainfall. J. Hydrol. 1999, 220, 48–61. [Google Scholar] [CrossRef] [Green Version]
- Segond, M.L.; Wheater, H.S.; Onof, C. The significance of spatial rainfall representation for flood runoff estimation: A numerical evaluation based on the lee catchment, UK. J. Hydrol. 2007, 347, 116–131. [Google Scholar] [CrossRef]
- Krvavica, N.; Rubinić, J. Evaluation of design storms and critical rainfall durations for flood prediction in partially urbanized catchments. Water 2020, 12, 2044. [Google Scholar] [CrossRef]
- Yang, L.; Smith, J.A.; Wright, D.B.; Baeck, M.L.; Villarini, G.; Tian, F.; Hu, H. Urbanization and climate change: An examination of nonstationarities in urban flooding. J. Hydrometeorol. 2013, 14, 1791–1809. [Google Scholar] [CrossRef]
- Arnaud, P.; Bouvier, C.; Cisneros, L.; Dominguez, R. Influence of rainfall spatial variability on flood prediction. J. Hydrol. 2002, 260, 216–230. [Google Scholar] [CrossRef]
- Younger, P.M.; Freer, J.E.; Beven, K.J. Detecting the effects of spatial variability of rainfall on hydrological modelling within an uncertainty analysis framework. Hydrol. Process. 2009, 23, 1988–2003. [Google Scholar] [CrossRef]
- Zoccatelli, D.; Borga, M.; Zanon, F.; Antonescu, B.; Stancalie, G. Which rainfall spatial information for flash flood response modelling? A numerical investigation based on data from the Carpathian range, Romania. J. Hydrol. 2010, 394, 148–161. [Google Scholar] [CrossRef]
- Zhu, Z.; Wright, D.B.; Yu, G. The impact of rainfall space-time structure in flood frequency analysis. Water Resour. Res. 2018, 54, 8983–8998. [Google Scholar] [CrossRef]
- Bruni, G.; Reinoso, R.; Giesen, N.C.; van de Clemens, F.H.L.R.; ten Veldhuis, J.A.E. On the sensitivity of urban hydrodynamic modelling to rainfall spatial and temporal resolution. Hydrol. Earth Syst. Sci. 2015, 19, 691–709. [Google Scholar] [CrossRef] [Green Version]
- Hwang, S.H.; Kim, K.B.; Han, D. Comparison of methods to estimate areal means of short duration rainfalls in small catchments, using rain gauge and radar data. J. Hydrol. 2020, 588, 125084. [Google Scholar] [CrossRef]
- Chen, T.; Ren, L.; Yuan, F.; Yang, X.; Jiang, S.; Tang, T.; Liu, Y.; Zhao, C.; Zhang, L. Comparison of spatial interpolation schemes for rainfall data and application in hydrological modeling. Water 2017, 9, 342. [Google Scholar] [CrossRef] [Green Version]
- Lin, B. Application of the step-duration orographic intensification factors method to estimation of PMP for mountainous regions. J. Hohai Univ. 1988, 3, 40–52. [Google Scholar]
- Zhou, Z.; Liu, S.; Wright, D.B. The study of urban design storm based on stochastic storm transposition. Adv. Water Sci. 2020, 31, 583–591. [Google Scholar]
- Kong, F.; Wang, T.; Liu, F.; Fang, J.; Fang, J.; Li, M.; Yang, X.; Shi, P. Spatiotemporal patterns of global-continental-regional scale heavy rainfall. J. Beijing Norm. Univ. 2016, 2, 228–234. [Google Scholar]
- Cristiano, E.; ten Veldhuis, M.; van de Giesen, N. Spatial and temporal variability of rainfall and their effects on hydrological response in urban areas - A review. Hydrol. Earth Sys. Sci. 2017, 21, 3859–3878. [Google Scholar] [CrossRef] [Green Version]
- Donat, M.G.; Lowry, A.L.; Alexander, L.V.; O’Gorman, P.A.; Maher, N. More extreme precipitation in the world’s dry and wet regions. Nat. Clim. Chang. 2016, 6, 508–513. [Google Scholar] [CrossRef]
- Patel, A.; Goswami, A.; Dharpure, J.K.; Thamban, M. Rainfall variability over the Indus, Ganga, and Brahmaputra river basins: A spatio-temporal characterisation. Quat. Int. 2020. [Google Scholar] [CrossRef]
- Smith, J.A.; Miller, A.J.; Baeck, M.L.; Nelson, P.A.; Fisher, G.T.; Meierdiercks, K.L. Extraordinary flood response of a small urban watershed to short duration convective rainfall. J. Hydrometeorol. 2005, 6, 599–617. [Google Scholar] [CrossRef]
- Guo, X.; Fu, D.; Wang, J. Mesoscale convective precipitation system modified by urbanization in Beijing City. Atmos. Res. 2006, 82, 112–126. [Google Scholar] [CrossRef]
- Zhou, Z.; Smith, J.A.; Wright, D.B.; Baeck, M.L.; Yang, L.; Liu, S. Storm catalog-based analysis of rainfall heterogeneity and frequency in a complex terrain. Water Resour. Res. 2019, 55, 1871–1889. [Google Scholar] [CrossRef]
- Zhang, J.; Han, D. Assessment of rainfall spatial variability and its influence on runoff modelling: A case study in the Brue catchment, UK. Hydrol. Process. 2017, 31, 2972–2981. [Google Scholar] [CrossRef] [Green Version]
- Liang, P.; Ding, Y. The long-term variation of extreme heavy precipitation and its link to urbanization effects in Shanghai during 1916–2014. Adv. Atmos. Sci. 2017, 321–334. [Google Scholar] [CrossRef]
- Mei, C.; Liu, J.; Chen, M.; Wang, H.; Li, M.; Yu, Y. Multi-decadal spatial and temporal changes of extreme precipitation patterns in northern China (Jing-Jin-Ji district, 1960e2013). Quat. Int. 2018, 476, 1–13. [Google Scholar] [CrossRef]
- Zhang, Q.; Peng, J.; Xu, C.; Singh, V.P. Spatiotemporal variations of precipitation regimes across Yangtze River Basin, China. Theor. Appl. Climatol. 2014, 115, 703–712. [Google Scholar] [CrossRef]
- Bisht, D.S.; Chatterjee, C.; Raghuwanshi, N.S.; Sridhar, V. Spatio-temporal trends of rainfall across Indian river basins. Theor. Appl. Climatol. 2017, 132, 419–436. [Google Scholar] [CrossRef]
- Thompson, E.S.; Saveyn, P.; Declercq, M.; Meert, J.; Guida, V.; Eads, C.D.; Robles, E.S.J.; Britton, M.M. Characterisation of heterogeneity and spatial autocorrelation in phase separating mixtures using Moran’s I. J. Colloid Interface Sci. 2018, 513, 180–187. [Google Scholar] [CrossRef]
- Kumari, M.; Sarma, K.; Sharma, R. Using Moran’s I and GIS to study the spatial pattern of land surface temperature in relation to land use/cover around a thermal power plant in Singrauli district, Madhya Pradesh, India. Remot. Sens. Appl. Soc. Environ. 2019, 15, 100239. [Google Scholar] [CrossRef]
- Anselin, L. Local indicators of spatial association-LISA. Geogr. Anal. 1995, 27, 93–115. [Google Scholar] [CrossRef]
- Song, W.; Jia, H.; Li, Z.; Tang, D. Using geographical semi-variogram method to quantify the difference between NO2 and PM2.5 spatial distribution characteristics in urban areas. Sci. Total Environ. 2018, 688–694. [Google Scholar] [CrossRef] [PubMed]
- Sun, J.; Chen, Y.; Yang, S.; Dai, K.; Chen, T.; Yao, Y.; Xu, J. Analysis and thinking on the extremes of the 21 July 2012 torrential rain in Beijing part II: Preliminary causation analysis and thinking. Meteorol. Mon. 2012, 10, 1267–1277. [Google Scholar]
- Yin, J.; Yu, D.; Yin, Z.; Liu, M.; He, Q. Evaluating the impact and risk of pluvial flash flood on intra-urban road network: A case study in the city center of Shanghai, China. J. Hydrol. 2016, 537, 138–145. [Google Scholar] [CrossRef] [Green Version]
- Li, H.; Cui, X.; Zhang, D. A statistical analysis of hourly heavy rainfall events over the Beijing metropolitan region during the warm seasons of 2007–2014. J. Climatol. 2017, 37, 4027–4042. [Google Scholar] [CrossRef]
- Liu, Y.-Y.; Li, L.; Liu, Y.-S.; Chan, P.W.; Zhang, W.-H. Dynamic spatial-temporal precipitation distribution models for short-duration rainstorms in Shenzhen, China based on machine learning. Atmos. Res. 2020, 237, 1–12. [Google Scholar]
- Zhou, Z.; Guo, B.; Xing, W.; Zhou, J.; Xu, F.; Xu, Y. Comprehensive evaluation of latest GPM era IMERG and GSMaP precipitation products over mainland China. Atmos. Res. 2020, 246, 105132. [Google Scholar] [CrossRef]
- Li, G.; Yu, Z.; Wang, W.; Ju, Q.; Chen, X. Analysis of the spatial distribution of precipitation and topography with GPM data in the Tibetan Plateau. Atmos. Res. 2021, 247, 105259. [Google Scholar] [CrossRef]
- Hu, Q.; Xiang, M.; Chen, D.; Zhou, J.; Wu, W.; Song, Q. Global cropland intensification surpassed expansion between 2000 and 2010: A spatio-temporal analysis based on GlobeLand30. Sci. Total Environ. 2020, 746, 141035. [Google Scholar] [CrossRef]
- Arsanjani, J.J. Characterizing, monitoring, and simulating land cover dynamics using GlobeLand30: A case study from 2000 to 2030. J. Environ. Manag. 2018, 214, 66–75. [Google Scholar] [CrossRef]
- Mann, H.B. Nonparametric tests against trend. Econometrica 1945, 13, 245–259. [Google Scholar] [CrossRef]
- Kendall, M.G. Rank correlation method. Biometrika 1975, 44, 298. [Google Scholar] [CrossRef]
- Douglas, E.M.; Vogel, R.M.; Kroll, C.N. Trends in floods and low flows in the United States: Impact of spatial correlation. J. Hydrol. 2000, 240, 90–105. [Google Scholar] [CrossRef]
- Lettenmaier, D.P.; Wood, E.F.; Wallis, J.R. Hydro-climatological trends in the continental United States, 1948–88. J. Clim. 1994, 7, 586–607. [Google Scholar] [CrossRef] [Green Version]
- Sen, P.K. Estimates of the regression coefficient based on kendall’s tau. J. Am. Stat. Assoc. 1968, 63, 1379–1389. [Google Scholar] [CrossRef]
- Partal, T.; Kahya, E. Trend analysis in Turkish precipitation data. Hydrol. Process. 2006, 20, 2011–2026. [Google Scholar] [CrossRef]
- Moran, P.A.P. Notes on continuous stochastic phenomena. Biometrika 1950, 37, 17–23. [Google Scholar] [CrossRef]
- Chen, L.; Gao, Y.; Zhu, D.; Yuan, Y.; Liu, Y. Quantifying the scale effect in geospatial big data using semi-variograms. PLoS ONE 2019, 14, e0225139. [Google Scholar] [CrossRef]
- Ye, L.; Tan, W.; Fang, L.; Ji, L.; Deng, H. Spatial analysis of soil aggregate stability in a small catchment of the loess plateau, China: I. Spatial variability. Soil Tillage Res. 2018, 179, 71–81. [Google Scholar] [CrossRef]
- Ahmadi, S.H.; Sedghamiz, A. Geostatistical analysis of spatial and temporal variations of groundwater level. Environ. Monit. Assess. 2007, 129, 277–294. [Google Scholar] [CrossRef]
- Garrigues, S.; Allard, D.; Baret, F.; Weiss, M. Quantifying spatial heterogeneity at the landscape scale using variogram models. Remot. Sens. Environ. 2006, 103, 81–96. [Google Scholar] [CrossRef]
- Lee, T.; Shin, J.; Park, T.; Lee, D. Basin rotation method for analyzing the directional influence of moving storms on basin response. Stoch. Environ. Res. Risk Assess. 2015, 29, 251–263. [Google Scholar] [CrossRef]
- Foroud, N.; Broughton, R.S.; Austin, G.L. Effects of a moving rainstorm on direct runoff properties. J. Am. Water Resour. Assoc. 1984, 20, 87–91. [Google Scholar] [CrossRef]
- Wright, D.B.; Smith, J.A.; Baeck, M.L. Flood frequency analysis using radar rainfall fields and stochastic storm transposition. Water Resour. Res. 2014, 50, 1592–1615. [Google Scholar] [CrossRef]


| Cities | SH | BJ | GZ | SZ |
|---|---|---|---|---|
| Areas (km2) | 6340.5 | 16,410.54 | 7434.4 | 1997.47 |
| Terrain types | Plain | Mountains, and plain | Hilly land | Hilly land, and plain |
| Elevation (Datum: WGS_1984, m) | 0–101 | −121–2306 | 0–1185 | 0–936 |
| Climate | Subtropical monsoon | Continental monsoon | Subtropical maritime monsoon | Subtropical maritime monsoon |
| Annual average temperature (°C) | 17.7 | 12.6 | 22.3 | 22.4 |
| Annual rainfall (during 2000–2020, mm) | 1320 | 441 | 1915 | 1801 |
| Population density (people in per square kilometer) | 3830 | 1312 | 2059 | 6728 |
| Urbanization rate (data up to 2019) | 88.1% | 86.6% | 86.1% | 99.7% |
| GDP (billion CNY) | 3815.53 | 3537.13 | 2362.86 | 2692.71 |
| Cities | Maximum (mm) | Mean (mm) | Minimum (mm) | Standard Deviation |
|---|---|---|---|---|
| SH | 59.7 | 36.8 | 20.8 | 11.2 |
| BJ | 41.6 | 18.9 | 11.2 | 8.4 |
| GZ | 82.3 | 50.1 | 30.3 | 14.1 |
| SZ | 99.1 | 58.1 | 35.9 | 18.8 |
| Cities | Moran’s I | CV | Z-Score |
|---|---|---|---|
| Shanghai | 0.472 | 0.473 | 5.16 |
| Beijing | 0.621 | 0.487 | 12.109 |
| Guangzhou | 0.628 | 0.635 | 8.00 |
| Shenzhen | 0.215 | 0.631 | 1.771 |
| Cities | Orientation | |||||
|---|---|---|---|---|---|---|
| Shanghai | - | 0.487 | 211.753 | 4.840 | 0.2% | 0.893 |
| E-W | 3.185 | 164.353 | 5.226 | 1.9% | 0.993 | |
| N-S | 20.677 | 290.818 | 5.872 | 7.1% | 0.994 | |
| Beijing | - | 8.369 | 68.141 | 11.43 | 12.3% | 0.997 |
| E-W | 2.554 | 94.107 | 15.532 | 2.7% | 0.999 | |
| N-S | 10.574 | 53.445 | 7.991 | 19.8% | 0.996 | |
| Guangzhou | - | 9.469 | 792.589 | 7.669 | 1.2% | 0.976 |
| E-W | 0.679 | 747.718 | 5.798 | 0.09% | 0.974 | |
| N-S | 15.205 | 1191.336 | 11.918 | 1.3% | 0.993 | |
| Shenzhen | - | 173.800 | 427.700 | 2.840 | 26.6% | 0.248 |
| E-W | 67.589 | 414.419 | 4.098 | 16.3% | 0.987 | |
| N-S | 69.477 | 679.700 | 1.980 | 9.9% | 0.999 |
| Cities | Mean of Moving Speed (km/h) | Most Frequently Moving Angles (Frequency) | CV |
|---|---|---|---|
| SH | 12.3 | 270–315 (28.6%) | 0.27 |
| BJ | 24.7 | 225–270 (42.9%) | 0.22 |
| GZ | 13.7 | 270–315 (28.6%) | 0.24 |
| SZ | 11.7 | 0–45 (23.8%), 90–135 (23.8%) | 0.28 |
| Cities | 2001 (%) | 2015 (%) | 2017 (%) | The Annual Rate of Increase (2001–2015) (% Per Year) | The Annual Rate of Increase (2015–2017) (% Per Year) | The Annual Rate of Increase (2001–2017) (% Per Year) |
|---|---|---|---|---|---|---|
| SH | 15.22 | 36.16 | 55.66 | 1.50 | 9.75 | 2.53 |
| BJ | 12.34 | 13.69 | 15.46 | 0.13 | 0.89 | 0.20 |
| GZ | 13.19 | 14.48 | 24.44 | 0.09 | 4.98 | 0.69 |
| SZ | 29.21 | 35.14 | 37.54 | 0.42 | 1.12 | 0.52 |
Publisher’s Note: MDPI stays neutral with regard to jurisdictional claims in published maps and institutional affiliations. |
© 2020 by the authors. Licensee MDPI, Basel, Switzerland. This article is an open access article distributed under the terms and conditions of the Creative Commons Attribution (CC BY) license (http://creativecommons.org/licenses/by/4.0/).
Share and Cite
Zhuang, Q.; Liu, S.; Zhou, Z. Spatial Heterogeneity Analysis of Short-Duration Extreme Rainfall Events in Megacities in China. Water 2020, 12, 3364. https://doi.org/10.3390/w12123364
Zhuang Q, Liu S, Zhou Z. Spatial Heterogeneity Analysis of Short-Duration Extreme Rainfall Events in Megacities in China. Water. 2020; 12(12):3364. https://doi.org/10.3390/w12123364
Chicago/Turabian StyleZhuang, Qi, Shuguang Liu, and Zhengzheng Zhou. 2020. "Spatial Heterogeneity Analysis of Short-Duration Extreme Rainfall Events in Megacities in China" Water 12, no. 12: 3364. https://doi.org/10.3390/w12123364
APA StyleZhuang, Q., Liu, S., & Zhou, Z. (2020). Spatial Heterogeneity Analysis of Short-Duration Extreme Rainfall Events in Megacities in China. Water, 12(12), 3364. https://doi.org/10.3390/w12123364