Article

Significant Extremal Dependence of a Daily North Atlantic Oscillation Index (NAOI) and Weighted Regionalised Rainfall in a Small Island Using the Extremogram

by
Luis Angel Espinosa
1,*,†,
Maria Manuela Portela
1 and
Rui Rodrigues
2
1
National Laboratory for Civil Engineering (LNEC), Instituto Superior Técnico (IST), Civil Engineering Research and Innovation for Sustainability (CERIS), 1040-001 Lisbon, Portugal
2
National Laboratory for Civil Engineering (LNEC), 1700-075 Lisbon, Portugal
*
Author to whom correspondence should be addressed.
Current address: Department of Civil Engineering, Architecture and Georesources (DECivil), Instituto Superior Tecnico (IST), Universidade de Lisboa, Av. Rovisco Pais, No. 1, 1040-001 Lisbon, Portugal.
Water 2020, 12(11), 2989; https://doi.org/10.3390/w12112989
Submission received: 23 September 2020 / Revised: 13 October 2020 / Accepted: 20 October 2020 / Published: 25 October 2020
(This article belongs to the Special Issue Statistical Approach to Hydrological Analysis)

Abstract

:
Extremal dependence or independence may occur among the components of univariate or bivariate random vectors. Assessing which asymptotic regime occurs and also its extent are crucial tasks when such vectors are used as statistical models for risk assessment in the field of Climatology under climate change conditions. Motivated by the poor resolution of current global climate models in North Atlantic Small Islands, the extremal dependence between a North Atlantic Oscillation index (NAOI) and rainfall was considered at multi-year dominance of negative and positive NAOI, i.e., −NAOI and +NAOI dominance subperiods, respectively. The datasets used (from 1948–2017) were daily NAOI, and three daily weighted regionalised rainfall series computed based on factor analysis and the Voronoi polygons method from 40 rain gauges in the small island of Madeira (∼740 km 2 ), Portugal. The extremogram technique was applied for measuring the extremal dependence within the NAOI univariate series. The cross-extremogram determined the dependence between the upper tail of the weighted regionalised rainfalls, and the upper and lower tails of daily NAOI. Throughout the 70-year period, the results suggest systematic evidence of statistical dependence over Madeira between exceptionally −NAOI records and extreme rainfalls, which is stronger in the −NAOI dominance subperiods. The extremal dependence for +NAOI records is only significant in recent years, however, with a still unclear +NAOI dominance.

1. Introduction

In the framework of climate research, problems related to the teleconnection between extreme rainfall and extreme phases of climatic drivers are still debatable issues [1]. Such challenges are even more pronounced in small island environments particularly those with orographic complexity which are often more vulnerable to extreme events [2]. So, adequate knowledge of the extremal dependence of rainfall and of oscillation prominent modes in the climate system—such as the North Atlantic Oscillation (NAO)—is necessary. This is of great concern given the impacts of the more frequent and intense occurrence of extreme rainfall in recent years [3,4,5,6], and, at the same time, the increased interannual variability of the winter NAO [7].
In this context, the present work describes and discusses a historical overview of the extreme rainfall changes in a North Atlantic small island and their probable dependence on the NAO positive and negative phases based on concepts of extremal dependence. In this regard, quantitative tools for measuring different kinds of dependence were used, i.e., the extremogram and its extension the cross-extremogram developed by [8].
Extreme events are natural phenomena with very rare frequencies associated with disasters or events that result in damage—e.g., floods, heat and cold waves, wildfires, earthquakes, and tsunamis [9]. Modelling and prediction of extreme events have been the focus of research in disaster prevention and mitigation efforts. Rainfall is one of the most frequent factor related to widespread severe weather hazards when its intensity far exceeds the average value, i.e., when extreme rainfall occurs. There are some studies on extreme rainfall for mainland Portugal such as [10,11,12]. For Madeira—a Portuguese small island situated in the North Atlantic Ocean, southwest of Portugal—researchers have focused on other meteorological aspects (e.g., fog precipitation) or on isolated case studies of extreme rainfall events such as in [13,14,15,16,17]. Particularly for Madeira Island, any of these relatively few studies have measured the possible time dependencies of extreme regionalised rainfall events and extreme phases of climatic drivers.
The concepts of extremal dependence are defined by requiring that all the components of a random vector have a similar behaviour. The word extremal refers to dependence structures leading to extremal values under certain criteria—e.g., extreme quantiles and probabilities of rare events, peaks over threshold (POT) method, generalised pareto distribution and maximum likelihood estimation approaches, among others [18,19,20]. Extremal dependence can be interpreted as the ordinary perception of an extreme or rare natural event whereby the higher the magnitude, the higher the damage for all the individuals involved can be. Analogously, in a small island all rainfalls, especially the extreme ones, might be influenced by a weather phenomenon, or a combination of phenomena, and react similarly [21]. Weather phenomena (e.g., the NAO, frontal structures, and low-pressure systems) can be defined as natural events that occur as a result of one or a combination of the water cycle and pressure systems effects.
The Autocorrelation Function (ACF) is commonly used to measure dependencies in Gaussian time series and linear models [22]. Nevertheless, the estimation of the extreme values’ ACF—such as of extreme daily rainfalls—can be rather imprecise and even misleading since the asymptotic confidence bands are typically larger than the estimated autocorrelation [8]. Due to the tail-heaviness of daily rainfall time series, as well as of other climate time series, the normal distribution is inadequate for modelling the marginal distribution of extreme events. This tail-heaviness is normally characterised by excess kurtosis, i.e., the higher the kurtosis coefficient is above the normal level (greater than 3), the more likely that future daily rainfall will be extremely large. To overcome the limitations of the ACF and to capture the extremal dependence in time series data, ref. [8] introduced the extremogram. The extremogram is an alternative to the ACF to measure dependencies between events in the upper tail or in the lower tail of a single time series, or of a univariate random vector, that comply with an adopted threshold. The cross-extremogram which is analogous to the Cross-correlation Function (CCF), allows for measuring the extremal dependence—in the upper tails, the lower tails or a combination of both tails—for a bivariate random vector. The presentation of extremograms as well of cross-extremograms in the form of graphs can provide information about the time trend dependency patterns for extreme events.
NAO is a weather phenomenon defined as fluctuations in the difference of atmospheric pressure at sea level (SLP) between two points over a specified period of time across the North Atlantic. The mathematical description of the NAO phase, i.e., the NAO index (NAOI) is traditionally defined by the Icelandic Low and the Azores High, although there are other definitions which consider the pressure observations of the Lisbon High, or the Gibraltar High instead as described in [23,24]. This phenomenon is a major mode of climate variability that influence the likelihood of extreme rainfall of the North Atlantic. Therefore, different NAO phases—positive and negative which sometimes correspond to the upper tail and lower tails in the NAOI time series, respectively—can be can be associated with increases or decreases in natural disaster risk [25].
Climate variability in continental Europe is highly controlled by variability in the atmospheric circulation [26]. Different studies have provided a clear framework of the strong influence of the NAO on the continental European rainfall. [27] have shown that the NAO signal in winter has a controlling influence not only on continental European extreme rainfall anomaly in winter, but also in a delayed way on the extreme rainfall events in the following seasons. For central Portugal, ref. [28] have assessed the impact of the NAO on the winter rainfall and the timing of associated landslide events due to extreme rainfall. However, there is less recognition of the role of the atmospheric circulation variability in the form of the NAO in Madeira Island extreme rainfall.
Generally, investigations into the possible effects of the NAO on extreme rainfall have been performed using indices at monthly or seasonal scale—e.g., the winter, from December through March, station-based NAOI as defined by [23]. Besides this, the rarely detailed presence of small islands in global climate models is very common making this research relevant. Here, a more detailed study is conducted using time series, from 1 January 1948 to 30 September 2017, of the daily NAOI—constructed by projecting the daily anomalies over the Northern Hemisphere onto the loading pattern of the NAO [29]—and of the regionalised daily rainfall records from a dense network of ground-based rain gauges over Madeira Island.
The main objectives are (i) “clustering” of the daily rainfall series at 40 rain gauges based on regionalisation techniques (Figure 1 and Table 1), (ii) identifying subperiods of sustained phases of the NAOI attributable to its extreme daily events, i.e., negative (−NAOI) and positive (+NAOI) dominance subperiods, and (iii) exploring the extremal dependence between regionalised rainfall in Madeira and the NAOI during the dominance subperiods. Throughout this work, the term “extreme” for rainfall refers to values in the upper tail whereas for the NAOI to both lower and upper tails. The probable dependence in the univariate and bivariate time series are ascertained via the extremogram and the cross-extremogram, respectively. This work focuses on the application of extremal dependence methods firstly, to a univariate climatic driver dataset, and secondly to the bivariate case (the regionalised rainfall and climatic driver), rather than on statistical methods for extremal dependence.

2. Study Area

Located in European Macaronesia, Madeira is the largest island of the Madeira Archipelago with an area of ∽740 km 2 , a maximum width of 22.5 km and a length of 57.3 km. Based on its size and topography, Madeira can be categorised as a mountainous small island [30]. Centred at N 32 44 30 and W 16 57 58 , and about 610 km northwest of the Western African coast, the island has a very complex orography and is completely formed by volcanic materials (Figure 1), consisting of a central mountainous system EW oriented (close to ST12 rain gauge, Pico Ruivo with 1862.0 m.a.s.l.; near ST01 rain gauge, Pico do Areeiro, with 1818.0 m.a.s.l.; and in the vicinity of ST02 rain gauge the region of Paúl da Serra which lies above 1400.0 m.a.s.l.) cut by deep valleys. The differences between the winter and summer temperatures are generally small.
According to the Koppen s classification, the island s climate is predominantly temperate with dry and warm to hot summers as approaching the coastal lowland zones of Madeira [31]. The distribution of rainfall presents an evident seasonal pattern, thoroughly different between the rainy season, that extends from November to March (or sometimes to mid-April), and the dry season, with insignificant rainfall amounts during July and August. The rainfall in the island has a wide variation determined by the elevation with higher amounts in the north (∼1500 mm year 1 ) and central highlands (∼2300 mm year 1 ) than in the south (∼600 mm year 1 ), as previously characterised [32].

3. Rainfall and NAO Data

3.1. Daily Rainfall Data

The hydrological data used in the present study were daily rainfalls during almost 70 years, from 1 January 1948 to 30 September 2017, at forty rain gauges evenly spaced over Madeira, except for the most western part of the island which is much less monitored (Figure 1). The rainfall data was obtained via the procedure implemented by [32] to the daily records made available by the competent authority, the Portuguese Institute for Sea and Atmosphere, IPMA (available online on https://www.ipma.pt, accessed on 8 May 2012) which is one of the main sources of hydrometeorological data for Portugal.

3.2. North Atlantic Oscillation Index (NAOI) Daily Data

The NAOI represents a pattern of low-frequency tropospheric height variability. This pressure difference measure is based on centres-of-action of 500 millibars constant pressure (mb) height patterns. Note that these height fields are spectrally truncated to total wavenumber 10 in order to emphasise large-scale aspects of the teleconnections. The calculation of this teleconnection index utilises the ESRL/PSD Global Ensemble Forecasting System Reforecast2 (GEFS/R) ensemble forecasts from the averaged region N 55 –70 ; W 70 –10 which in turn is subtracted from N 35 –45 ; W 70 –10 , retrieved from the NOAA Physical Sciences Laboratory, NOAA PSL portal [33]. The daily NAOI dataset which does not present missing data was utilised for the same period as in the case of daily rainfall (from 1948 through 2017).

4. Methods

4.1. Regionalisation of the Daily Rainfall Series

Notwithstanding Madeira is a small island, it exhibits some significant microclimatic or localised features [31]. Therefore, when analysing the rainfall, it is necessary to identify homogeneous regions or regions with similar regimes and put them together in space [34]. In order to achieve this, a two-steps process was implemented based, firstly, on the principal components analysis (PCA), specifically the principal factors analysis (PFA) to group the rain gauges, followed by the Voronoi polygons method, also known as Thiessen, to spatial average the forty daily rainfall series for the nearly 70-year reference period. The former analysis has been widely used for reducing the number of dimensions or variables by finding uncorrelated linear combinations of the original data, and documenting the homogeneity or detecting structures in the relationship among climatic variables (e.g., [35,36,37,38]). Such analysis has been also applied to rainfall (e.g., [39,40,41,42,43]). The Thiessen intends to assign areal significance [44] to analyse spatially distributed data (e.g., rainfall measurements) and to estimate regionalised rainfall values.
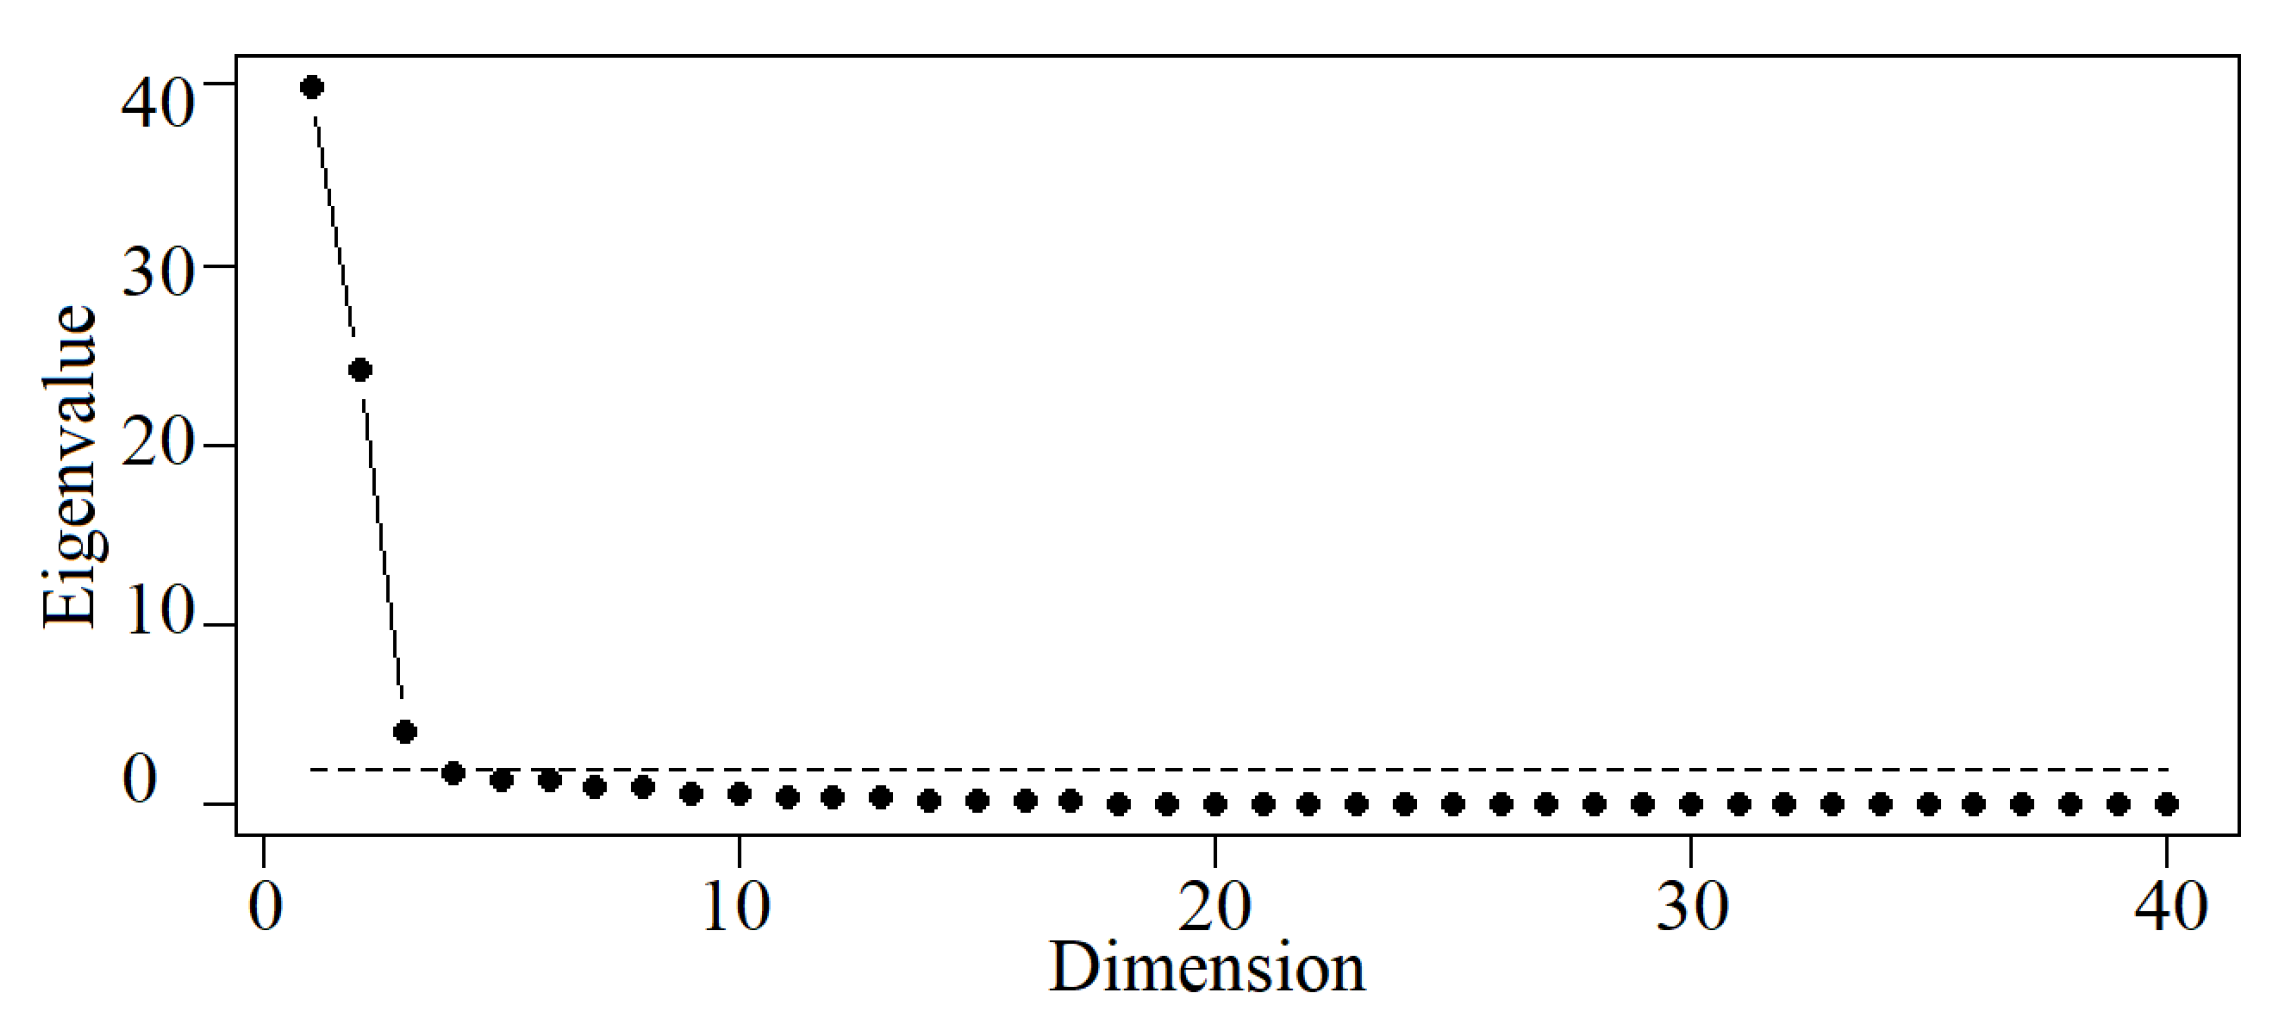
In this work, the factor analysis, taking into account both PCA and PFA, consisted of computing both the covariance and correlation matrices of the daily rainfalls (1948-2017) at the forty rain gauges of Table 1, i.e., the forty variables for the 40-dimension problem with their corresponding eigenvalues and principal factor loadings after varimax rotation [45]. The selection of a possible correct number of principal components or principal factors to retain was determined based on the “elbow” of the scree plot [46] and on the Kaiser s criterion (K1 rule), according to which the factors whose eigenvalues overweight 1.0 are the ones to be retained [46,47]. The final step of the regionalisation process corresponded to the Voronoi method applied to the daily rainfall at the rain gauges located in each homogeneous region to spatially average the daily series. The homogeneous regions were delimited based on the rotated factor loadings of rain gauges with correlations higher than +0.60 [32,36]. The number of regionalised rainfall series depended on the number of the retained factors (i.e., of homogeneous regions) in accordance with the previously specified criteria.

4.2. Dominant Negative and Positive NAO Phases

The influence of the NAO mode on the continental European climatic conditions has been widely studied and well-recognised from a number of studies’ findings, such as those by [24,28], with generalised wet conditions in southern Europe, and increased precipitation affecting northern Europe during the NAO negative phases—contrary circumstances occur during the NAO positive phases. However, such anomalies influence on the extreme rainfall over Madeira has not been addressed in detail, as previously mentioned.
In order to obtain relevant information from the extreme NAOI events and to ascertain how the dominant negative and positive NAO phases throughout the fairly large reference period affect Madeira extreme rainfall at daily scale, a LOWESS (locally weighted regression) was applied to the NAOI series with a typical smoothing parameter value of f = 3 [48]. This was done to build up a function that describes point by point the deterministic part of the variation in the extreme NAOI data (lower and upper tails), and to obtain adequate −NAOI or +NAOI dominance subperiods.
For the established NAOI dominance subperiods, both the NAOI and rainfall data were analysed from an extremal dependence perspective by applying firstly the extremogram solely to the daily NAOI, and secondly the cross-extremogram to the bivariate series of daily NAOI and rainfall. Such methods (implemented in R Available online: https://cran.r-project.org/ (accessed on 8 May 2012).), as well as some necessary concepts, are mathematically described in the following subsections.

4.3. Strictly Stationary and Regularly Varying

A time series { X t } t = 1 , 2 , . . . , is said to be strictly stationary [49] if for all k, all τ , all t 1 , ..., t k
F X ( x t 1 + τ , . . . , x t k + τ ) = d F X ( x t 1 + τ , . . . , x t k + τ )
where = d denotes equality in distribution. Considering a d-dimensional process, i.e., (X t ) and defining Y h : = ( X 1 , ..., X 1 ), the process (X t ) is said to be regularly varying with tail index α if:
P ( x 1 Y h · ) P ( Y h > x ) ν , x
for some non-null Radon measure μ h on the Borel σ -field B R ¯ 0 h d of R ¯ 0 h d = R ¯ 0 h d ∖{0} (that is an extended h d -dimensional real number bounded away from zero) with the property:
μ h ( t C ) = t α μ h ( C ) , t > 0 for any Borel set C R ¯ 0 h d
In Expression (2), · is any norm in R ¯ 0 h d and ν refers to vague convergence on B R ¯ 0 h d , x R 0 h d . If the process is (X t ) regularly varying, then there exists a sequence such that:
n P ( a m 1 Y h · ) ν ν h ( · )
where ν h is another measure. Also, ν h and μ h are only differed by a non-zero proportional constant, c h say (i.e., ν h = c h μ h , c h > 0 ).

4.4. Tail-Dependence

The concepts of tail-dependence are standard tools to describe the amount of extremal dependence between random variables. A tail-dependence coefficient (TDC) roughly measures the probability of occurring extreme values, i.e., exceeding an upper or lower threshold, for one random variable given that another assumes an extreme value as well [49]. The upper TDC is defined for a two-dimensional random variable ( X 0 , X h ) as the limit, provided it does exist, of
λ U = lim x P ( X h > x | X 0 > x )
where X h and X 0 are one-dimensional strictly stationary series. Given the limit exists, Equation (5) can be rearranged into the following expression:
λ U = lim x P ( x 1 X h ( 1 , ) | x 1 X 0 ( 1 , ) )
The lower TDC is defined analogously as:
λ L = lim x P ( X h x | X 0 x )

4.5. Extremogram

Davis and Mikosch [8] developed the extremogram using the upper TDC from ( 1 , ) in Equation (6) to a general Borel sets, and from one-dimensional vector X t in Equation (6) to a d-dimensional vector X t . The extremogram is defined as follows:
ρ A B ( h ) = P ( a m 1 X h B | a m 1 X 0 A ) , h Z
= P ( a m 1 X 0 A , a m 1 X h B ) P ( a m 1 X 0 A )
where A and B are Borel sets, a n is a sequence such that P ( | X t | > a m n 1 ) . Since A and B are bounded away from zero, the events { a m 1 X 0 A } and { a m 1 X h B } are becoming extreme in the sense their probabilities are converging to zero, h is the value of the time lag.
The extremogram—applied to the univariate daily time series X (NAOI)—is estimated by:
E ρ A B ( h ) = t = 1 n h I { a m 1 X t A , a m 1 X t + h B } t = 1 n I { a m 1 X t A }
The numerator in Equation (10) can be expressed as follows:
t = 1 n h I { a m 1 X t ( 1 , ) , a m 1 X t + h ( 1 , ) } = t = 1 n h I { X t ( a m , ) , X t + h ( a m , ) }
which counts the total number of pairs ( X t , X t + h ) when both values are greater or lower than a m (normally a chosen percentile rank). It represents the total number of pairs of extreme values which are h-lags apart. Analogously, the denominator in Equation (10) can be expressed as:
t = 1 n I { a m 1 X t ( 1 , ) } = t = 1 n I { X t ( a m , ) }
which counts the total number of realisations of the random variables { X t } whose values are greater than the adopted a m regarded as extreme values. The extremogram can be interpreted as the conditional probability of occurrence of extreme event in time ( t + h ) given that there is an exceedance at time t.

4.6. Cross-Extremogram

The cross-extremogram is the right method to measure the extremal dependence of bivariate time series the—in this case, the bivariate daily time series X (NAOI) and Y (rainfall)—and to see how far another time series may affect the series that is being analysed. The cross extremogram is defined as:
ρ A B ( h ) = P ( a m 1 Y h B | a m 1 X 0 A ) , h Z
and it is calculated as follows:
E ρ A B ( h ) = t = 1 n h I { a m 1 Y t + h B , a m 1 X t A } t = 1 n I { a m 1 X t A }
where a m is ( 1 1 / m )-quantile that indicates extreme events in time series X t and Y t . Please refer to [8] for the proofs of Equations (10) and (14).
In this application, daily rainfalls above the 99th empirical percentile rank, i.e., an empirical quantile value relative to 100 [50], in the computed weighted regionalised series have been considered as extreme wet days or extreme rainfall events (upper tail) on the basis of the recommendation by the Expert Team on Climate Change Detection, Monitoring and Indices (ETCCDMI) [51]. In a similar way, extreme events for the daily NAOI series have been identified for both, below 1st and above 99th percentiles’ ranks, i.e., the lower tail and upper tail, respectively.

5. Results

5.1. Weighted Regionalised Daily Rainfall Series

Based on the “elbow” of the curve in the scree plot from Figure 2 coupled with the K1 rule, the first three principal factors were retained. Varimax rotation was computed to maximise the variances of each individual record for the various retained factors [45] and to optimise the interpretation of the derived variables found by factor analysis, especially the loadings or correlations. Collectively, the three retained factors explain about 82% of the total variance—F1 30%, F2 28%, and F3 24%.
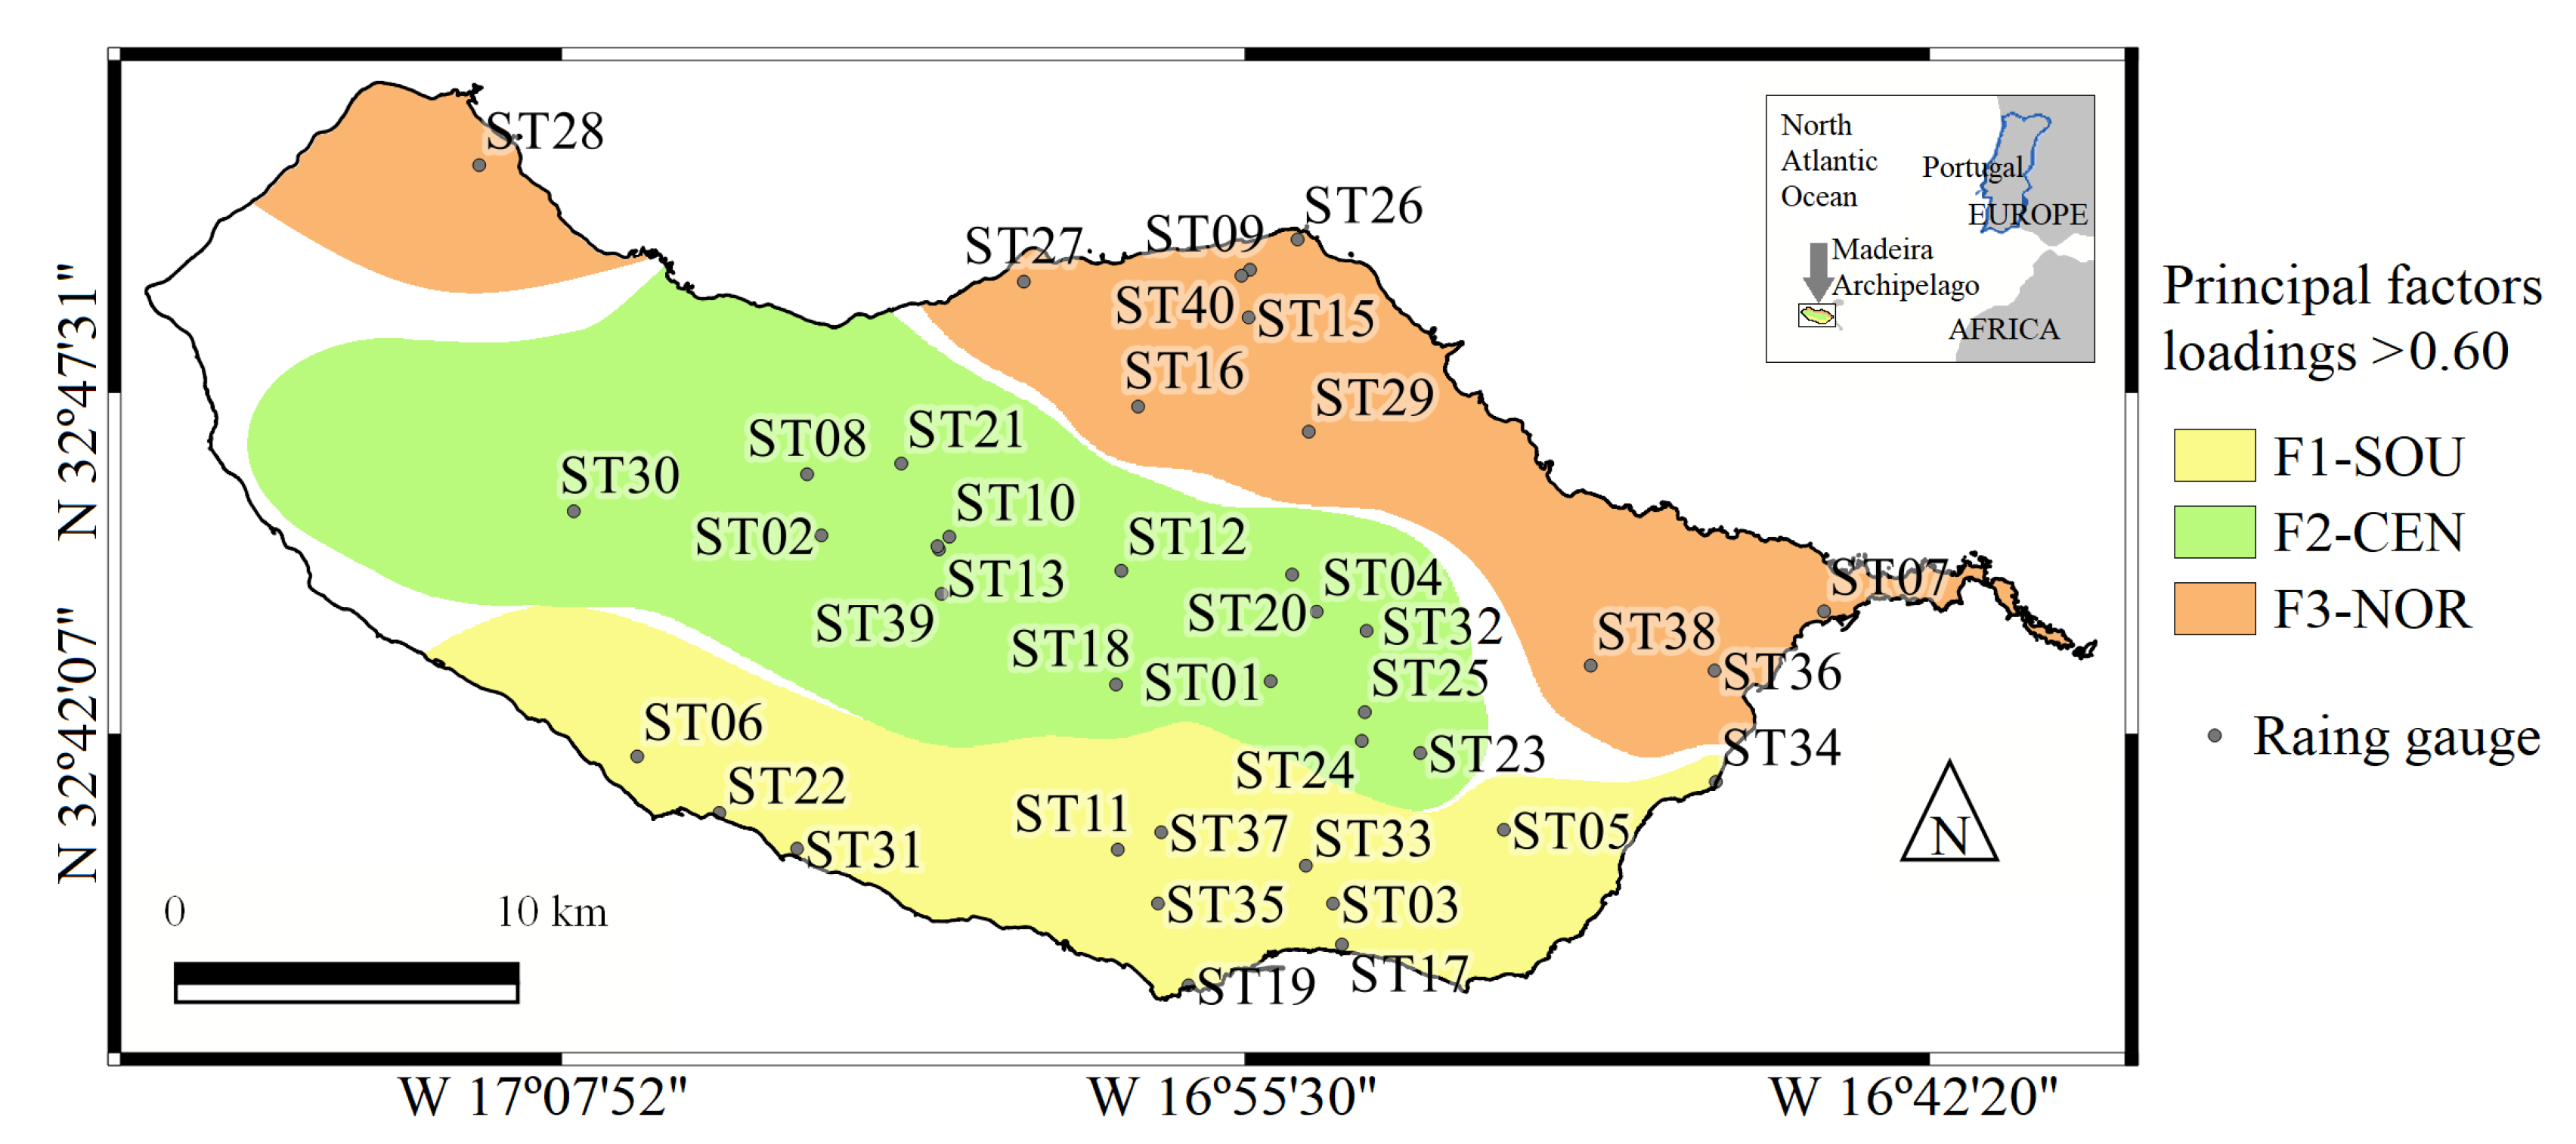
Since the loadings mapping, or correlation mapping, has been considered as one the most effective representation for climatological pattern classification [52], the principal factor loadings (after rotation) from the correlation matrix were used as the main tool for regionalisation. The rotated correlations were interpolated by applying the inverse distance weighting (IDW) interpolation method with an exponent of 2 [53] and then plotted altogether superimposing the three retained factors (Figure 3), although only highlighting those regions higher than the threshold set at +0.60 [36].
On this basis, the spatial distribution of the principal factor loadings is displayed in Figure 3 (see also Factor-Region column of Table 1). Rotation enabled the rainfall field to be divided into coherent homogeneous regions that do not overlap, although the Madeira western part is not fully included in any of the factors due to the lack of rain gauges located there. Even so, this clearly discriminates the island from south to north into three distinctive homogeneous regions: the southern slope (F1-SOU with 12 rain gauges), the central region (F2-CEN with 17 rain gauges), and the northern slope (F3-NOR with 11 rain gauges). Through the factor analysis, it was possible to establish a mature climatic regionalisation in terms of daily rainfalls that encompassed all the rain gauges. This step served only to group the rain gauges and, thus, to spatially average the original daily rainfall series by applying the Voronoi polygons.
To facilitate the calculations of the spatially weighted rainfall data required by the extremal dependence analysis, every rain gauge was assigned to a homogeneous region. This was based on the proximity of the Voronoi polygons sides and the limits of the homogeneous regions of Figure 3—columns identified in Table 1 by Areal influence and Factor-Region.
Figure 4 presents the temporal evolution of daily rainfall series resulting from the Voronoi method, for the period of 1948–2017 in the representative F1-SOU (169.82 km 2 ), F2-CEN (326.80 km 2 ), and F3-NOR (243.98 km 2 ) homogeneous regions. The coastal southern slope F1-SOU, located at lower elevations (Figure 1), is the driest region with weighted mean daily rainfall of 2.40 mm. The equivalent value for F2-CEN, located inland on the central highlands and plateau (Paúl da Serra, close to ST02 rain gauge), is 5.98 mm, which makes it the wettest region, whereas the coastal northern slope F3-NOR has intermediate characteristics, both regarding the weighted mean daily rainfall (4.37 mm) and elevation.
The occurrence of rainfall events identified as extremes is particularly pronounced in the island for the analysed 70-year reference period. Those events occurred during the rainy season from end of October to mid-April, although with a very reduced number of extremes happening in June and September. Though the rainfall seasonal distribution among regions is very much alike, the extreme rainfall quantities are quite contrasting. For instance, the upper tail 99th percentile ranges from 37.2–135.5 mm for F1-SOU, from 75.5–174.2 mm for F2-CEN, and from 46.4–163.5 mm for F3-NOR. Moreover, the temporal occurrence of extremes shows some important differences depending on the region.
As an example, the rainfalls pointed out in Figure 4 by circles correspond to daily values exceeding 81.4, 128.2, 94.8 mm for F1-SOU, F2-CEN, F3-NOR, respectively, i.e., exceeding the 90% quantile of the upper tail 99th percentile in each time series. For F1-SOU, the five highest extremes occurred on 21 January 1952, 8 April 2008, 22nd October and 26 November 2010, and 26 January 2011; additionally, the figure clearly shows that such events are more concentrated in recent years, expressly after the year 2001. In fact, this is the only region with a very recent circled extreme (22 April 2016). F2-CEN and F3-NOR differ from the extremal occurrence pattern in F1-SOU. Considering the temporal distribution of the circled extremes, the central and northern regions seem to have similar distribution, both with a dense agglomeration of circled extremes between the years 1964 and 1990—in addition, F2-CEN has a second-high concentration of extremes from 2004 to 2012. A number of temporal dissimilarities between F2-CEN and F3-NOR arise when comparing their respective highest events. The five highest extremes for F2-CEN are pinpointed on 8 November 1963, 21 June 1964, 26 March 1970, 21 February 2010, and 26 January 2011; whereas for F3-NOR on 19 November 1952, 23 January 1987, 5 March 2001, 6 March 2001, and 2 February 2010.
Despite the temporal distribution differences, the worst rainfall extremes in the three regions took place throughout the hydrological years of 2009/10 and 2010/11 (starting on 1 October). Actually, it has been well-documented that numerous intense rainfall events, resulting in debris flow and flash floods, occurred in Madeira Island in those years such as the events that happened on 2 February 2010 and 20 February which in some areas triggered a sudden rise of the river flows causing debris flows, and thus 47 casualties [54]. Although those documented extremes are mostly based on single rain gauges data, their importance coincide with the ones identified in the computed regionalised daily rainfall series, which reinforces the practical use of the latter.

5.2. Dominant Extremal NAOI Subperiods and Their Extremograms

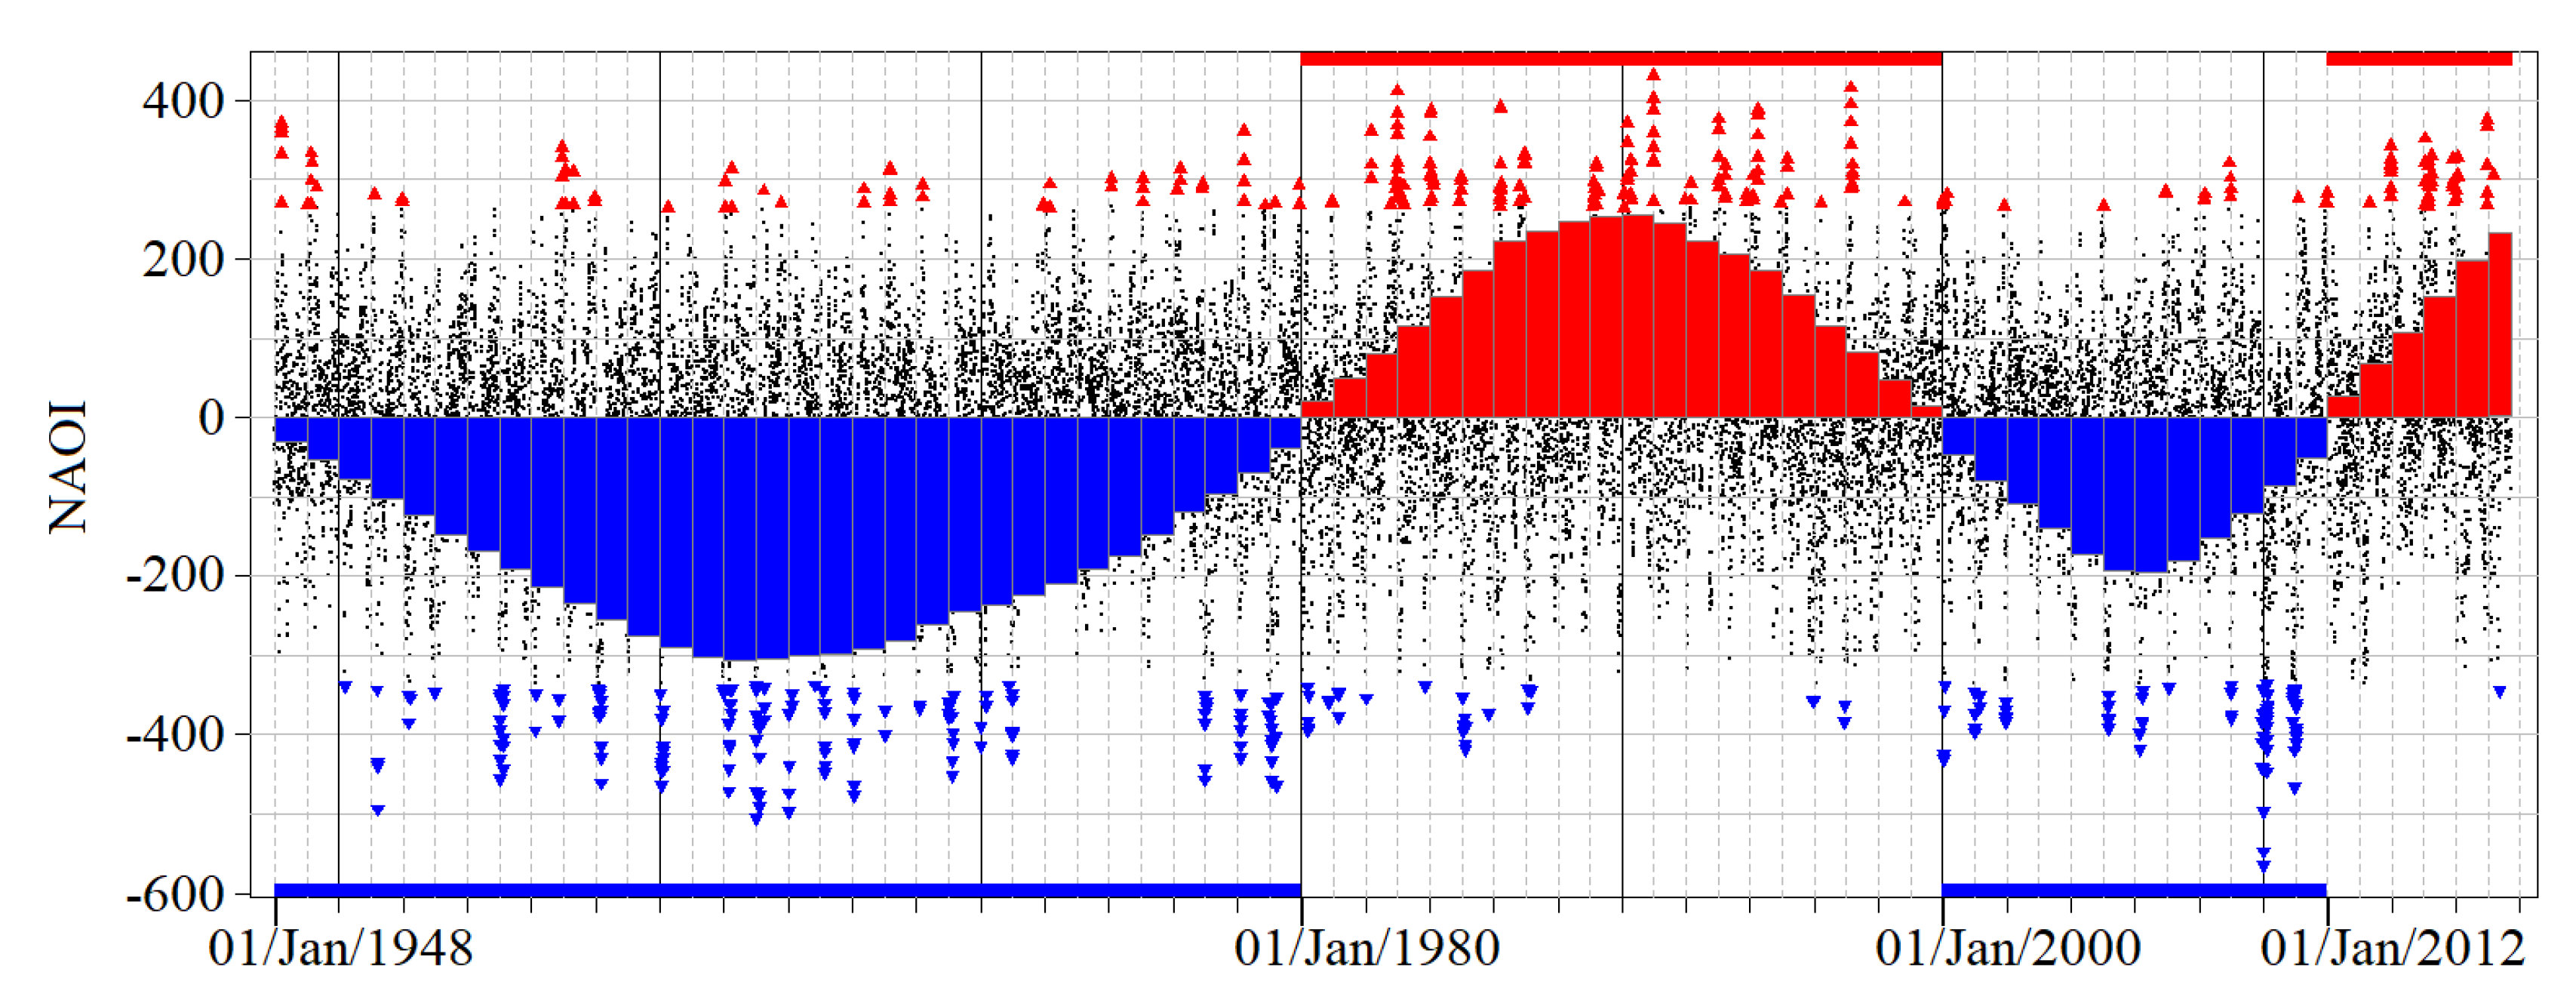
Figure 5 was obtained based on the 26,280 NAOI records from the NOAA PSL—spectrally truncated as mentioned in Section 3.2—for the period 1948 to 2017 (with a sample daily mean of –4.90). In the figure, the records below the 1st and above the 99th empirical percentiles’ ranks are represented by triangles. The dominance subperiods are denoted by solid vertical bars overlapping the original daily data, however not related to extreme events. About 45 years were pinpointed as having −NAOI dominance, and 25 years as having +NAOI dominance. According to the fitted LOWESS curve in Figure 5, the series started markedly with a −NAOI dominance, reaching the negative peak around the year 1963. The negative NAO throughout the winter 1962/63 is also mentioned by [55]. Thereafter, the observations became less negative apparently with an upward trend, which led the signal to switch to a +NAOI dominance in 1980. The first positive dominance with its peak around the year 1990, and also the highest record in the entire period, lasted for almost 19 years. Then, a −NAOI dominated subperiod occurred for 12 years with a close succession or high concentration of very extreme NAOI events in the lower tail during the end of December and the months of January and February 2010. From the year 2012 to the very end of the time series, the signal was positively dominated, although with a seemingly unfinished dominance. It should be noted that the most negative NAOI observations have been registered from November through March, and the highest positive observations from December through April.
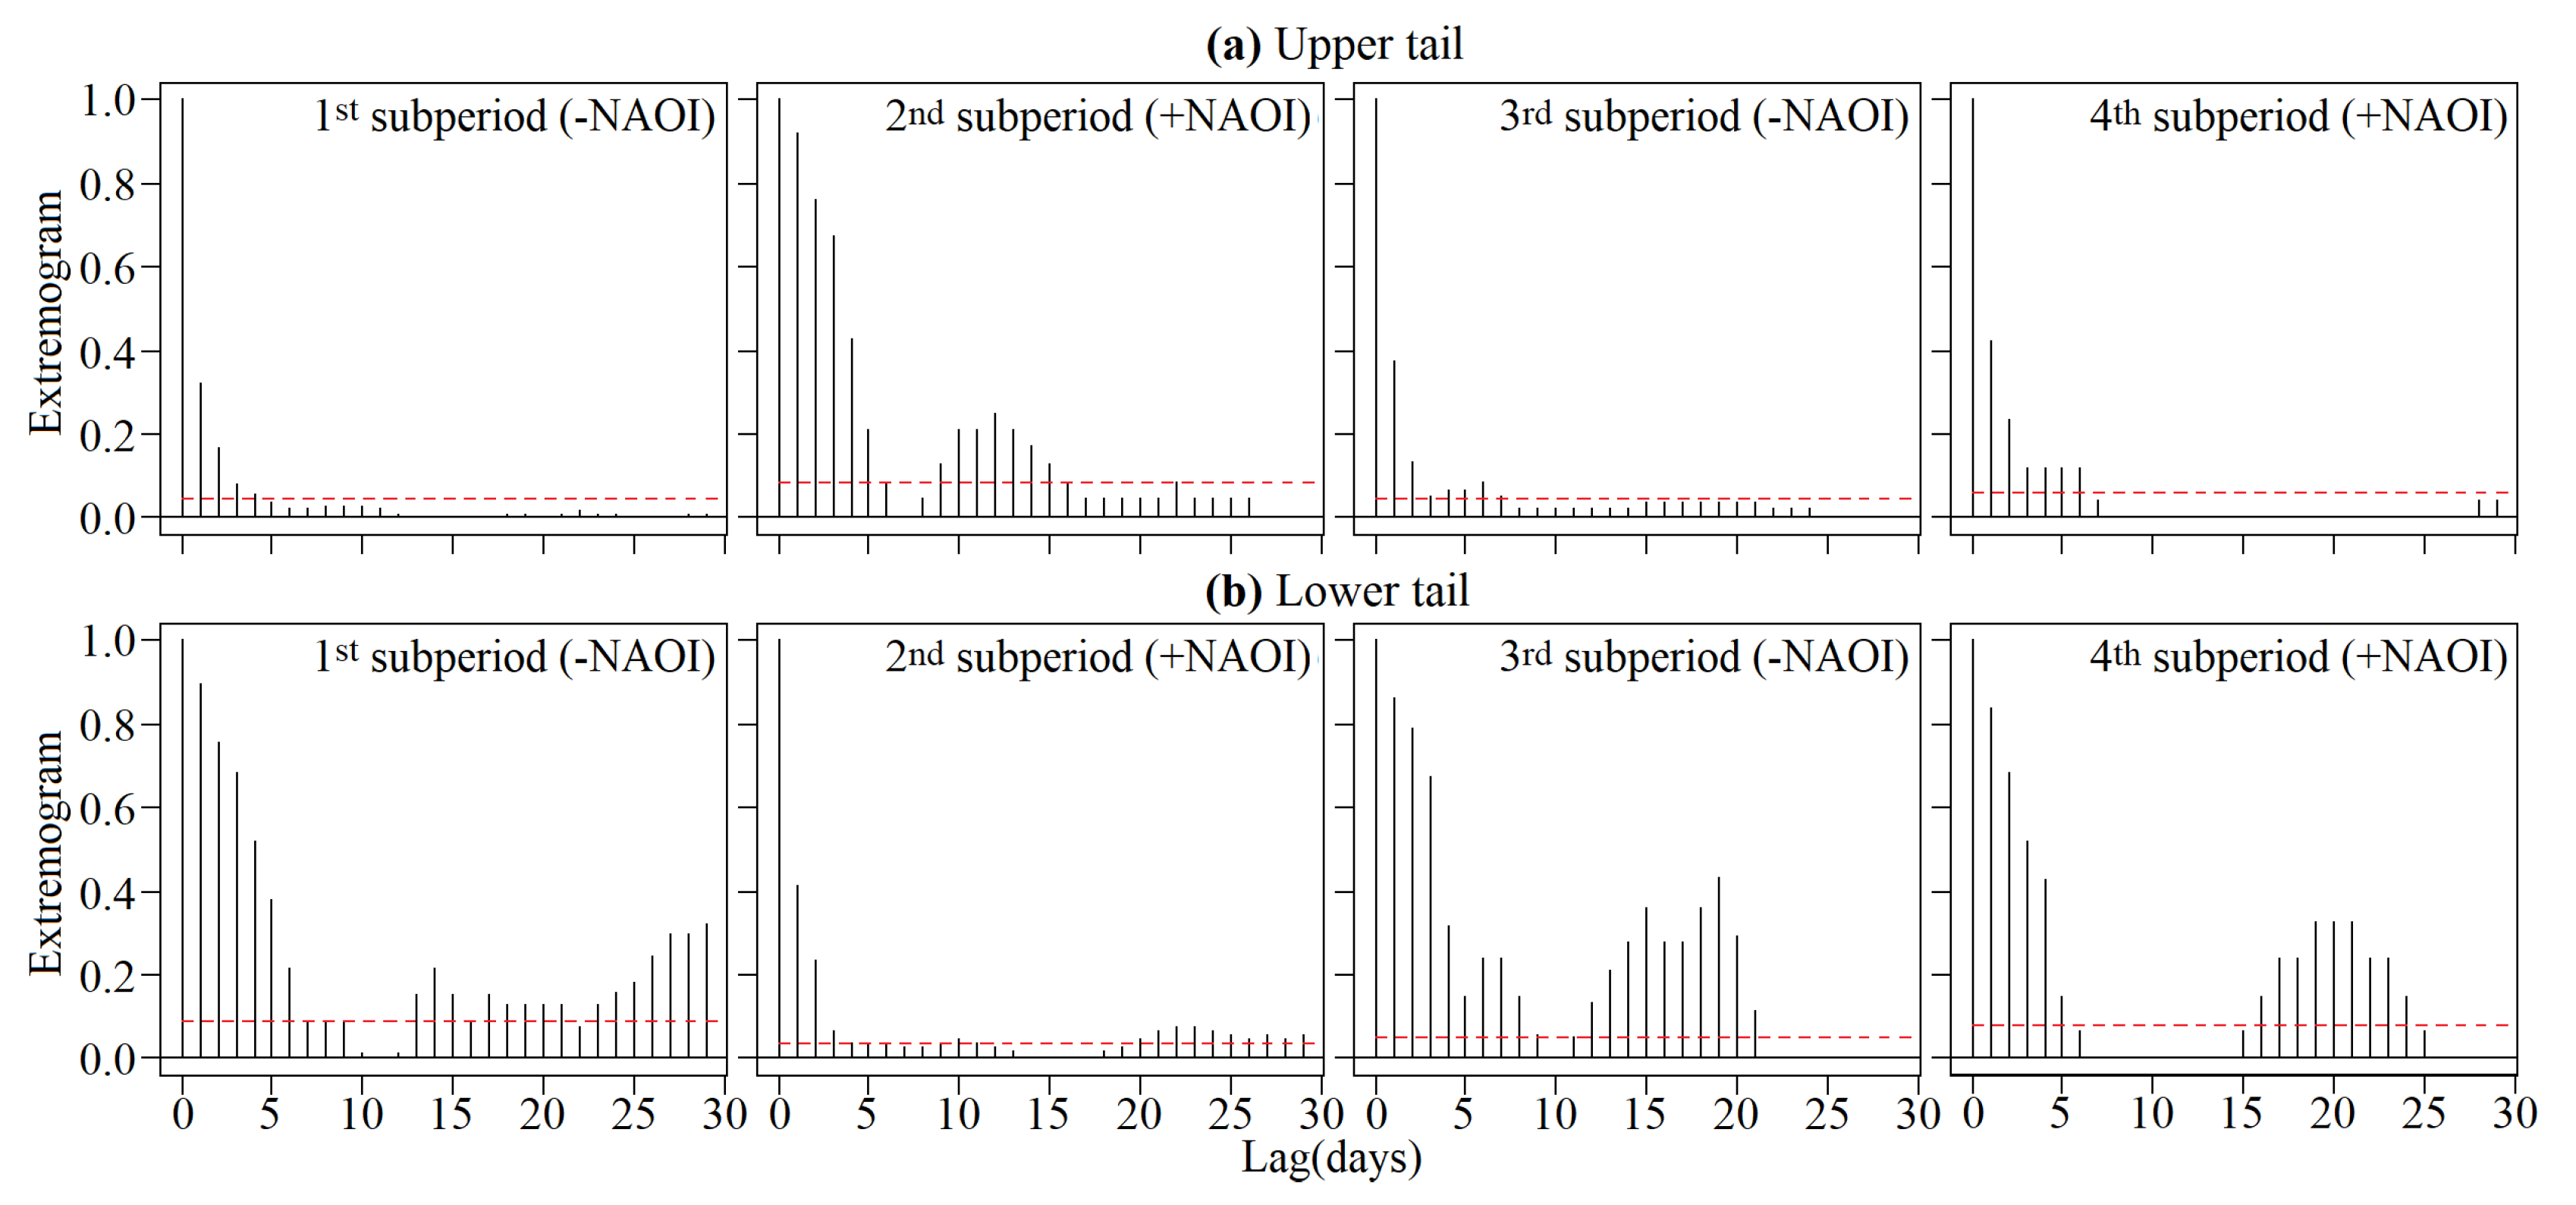
In this perspective, the 70-year reference period was divided into NAOI dominance subperiods, namely: the first, from 1 January 1948 to 31 December 1979; the second, from 1 January 1980 to 31 December 1999; the third, from 1 January 2000 to 31 December 2011; and the fourth, from 1 January 2012 to 30 September 2017. This subdivision was done to determine possible temporal changes in the influence of the extremal NAOI on extreme rainfalls during the NAOI dominance (the −NAOI and +NAOI dominance) based on the adopted techniques for extremal dependence, i.e., the extremogram and its extension the cross-extremogram. The NAOI series in Figure 5 has the property that is heavy-tailed, i.e., the extreme negative and positive values are rather pronounced and occur in clustered days (e.g., the clustered blue triangles in January 2010). It is expected that the NAOI lower and upper tails would exhibit different dependence subject to each dominance subperiod. Thus, the extremogram was applied to the univariate daily NAOI series to quantify its conditional extremal serial dependence—that is, to measure the persistence of extremal daily NAOI with rare event probabilities at future instants of time (i.e., future days) for the upper and lower tails which in this cases refer to +NAOI and −NAOI, respectively. This in turn, supported the decision made to subdivide the reference period into subperiods to be further analysed. The extremograms for the lower and upper tails of the daily NAOI, assessed by Equation (10), are shown in Figure 6 providing a non-parametric estimate at large of extremal dependence as a function of time-lag in days.
In the first subperiod (−NAOI dominated), it is evident from the faster decay of the vertical lines for the upper tail in the top graph of Figure 6 that these extremes lack of clustering while the slower decay and somewhat periodicity shown for the lower tail (bottom graph) indicate the opposite—extremal clustering. Nevertheless, it is virtually impossible to make any inferences whether dependence or independence may occur among the extremal components of the daily NAOI series without a sense for the asymptotic distribution [56]. Under the assumption of no serial dependence ( H 0 , extremes are independent), empirical confidence bands for an α of 5% were computed by using m = 10,000 random permutations of the data for testing significant serial extremal dependence, although only the upper 97.5% confidence bands are shown in the figure.
Clearly, the extremogram for the lower tail in the first subperiod (Figure 6 bottom graph) is significantly greater than the upper limit of the confidence band (dashed line) in most of its realisations with enough evidence to reject H 0 compared with the upper tail extremogram which tails off after lag 4 and obviously fails to reject the null hypothesis of serial dependence. This behaviour is mirrored in the following subperiod, i.e., in the +NAOI dominated subperiod from 1980–1999 in which the extremal positive NAOI events (upper tail) seem to denote serial dependence ( H 1 , extremes are dependent) whereas for the extremal negative NAOI events, this is not the case. Conversely, the third subperiod (−NAOI dominated) displays a strong structure in the plot for the lower tail values themselves, similar to that of the first subperiod, with high probabilities (e.g., higher than 0.2) of given an extreme event at time t to observe another in the next 2 to 4, 6 to 7, and 13 to 20 days. This alternating character of the lower and upper tails throughout each NAOI dominance subperiod is not consistent with that of the most recent period from 2012–2017 which is +NAOI dominated and with higher extremogram values for the lower tail events. This behaviour may be due to the incompleteness of the dominance, as mentioned and shown in the last section of the fitted LOWESS curve of Figure 5.

5.3. Extremal Dependence of the Regionalised Rainfall and NAOI via the Cross-Extremogram

The multivariate extension of the extremogram—that is, the cross-extremogram—was used in this case for teleconnection, to the bivariate daily time series X (NAOI) and Y (rainfall) at the four NAOI dominance subperiods, whether −NAOI or +NAOI, as previously mentioned. The cross-extremogram application provided insightful information about the conditional dependence between the daily NAOI and regionalised rainfall (F1-SOU, F2-CEN, F3-NOR) firstly, in their upper tails, and secondly, in the rainfall upper tail and NAOI lower tail, i.e., P ( Y > y , X > x ) and P ( Y > y , X < x ) , respectively.
Equation (14) was utilised in order to determine the degree of influence of daily NAOI over rainfall. Simply put, it allowed to estimate the dependence and probability of occurrence of rainfall extreme events at lagged time, expressed in days, ( t + h ) provided that a NAOI extreme event occurs in day t. The cross-extremograms for values above the rainfall and NAOI thresholds a m ( u p p e r ) Y , a m ( u p p e r ) X (99th percentiles ranks); and below the NAOI threshold a m ( l o w e r ) X (1st percentile rank) with confidence bands (for m = 10,000 permutations) for lag 1 to 30 days (horizontal axis) and the probabilities of the extremal dependence (vertical axis) are shown in Figure 7, Figure 8, Figure 9 and Figure 10, respectively, for the four NAOI dominance subperiods.
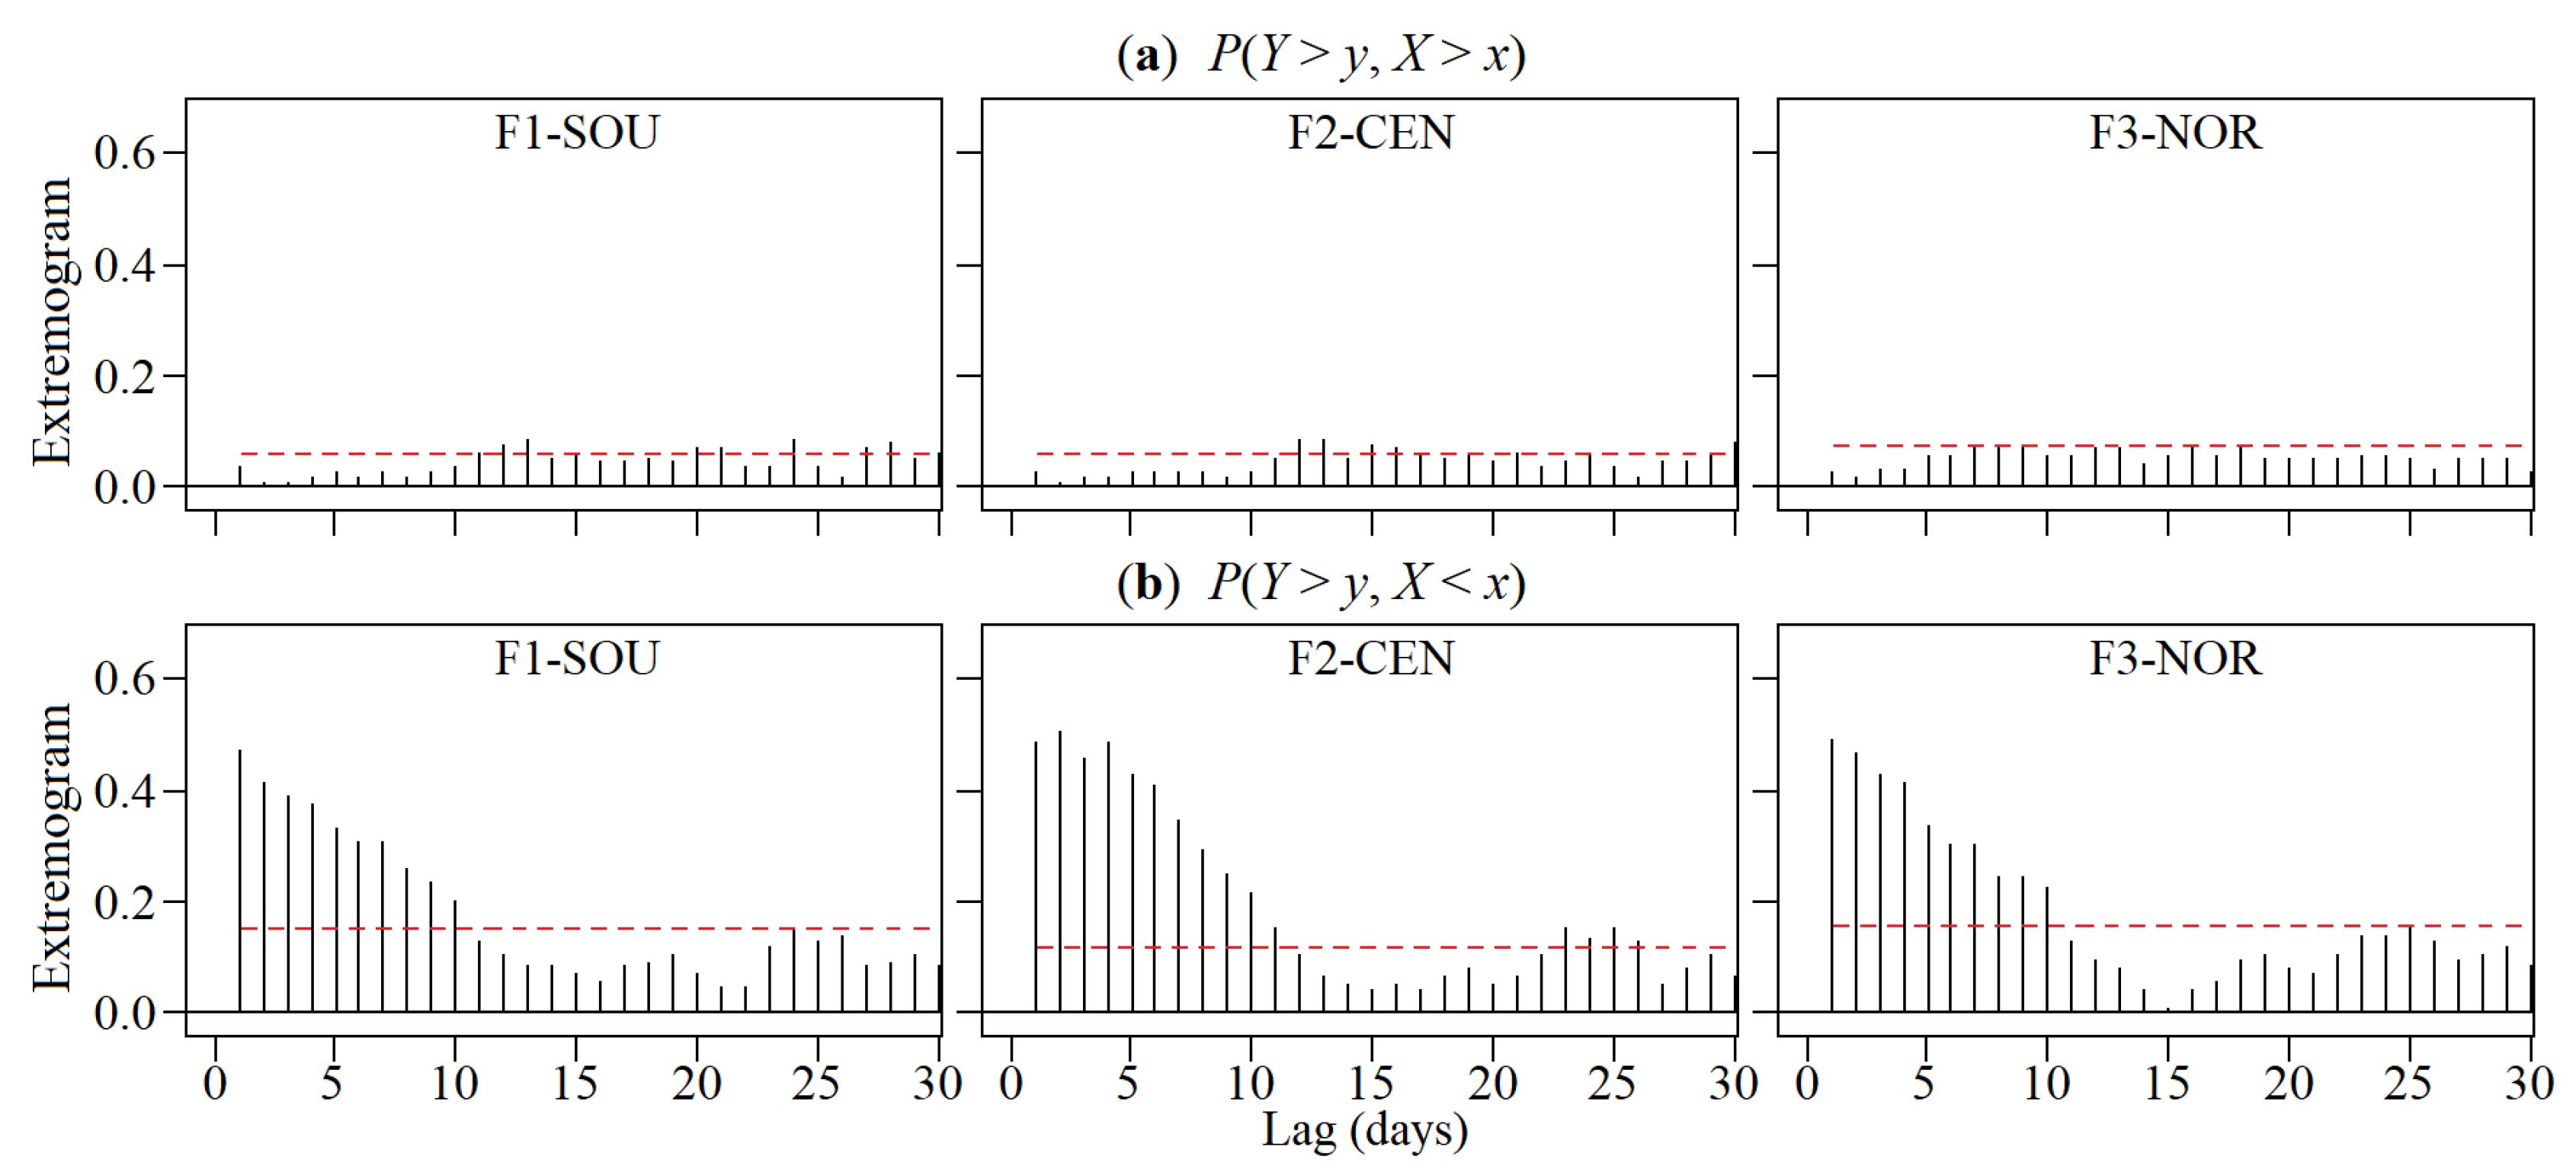
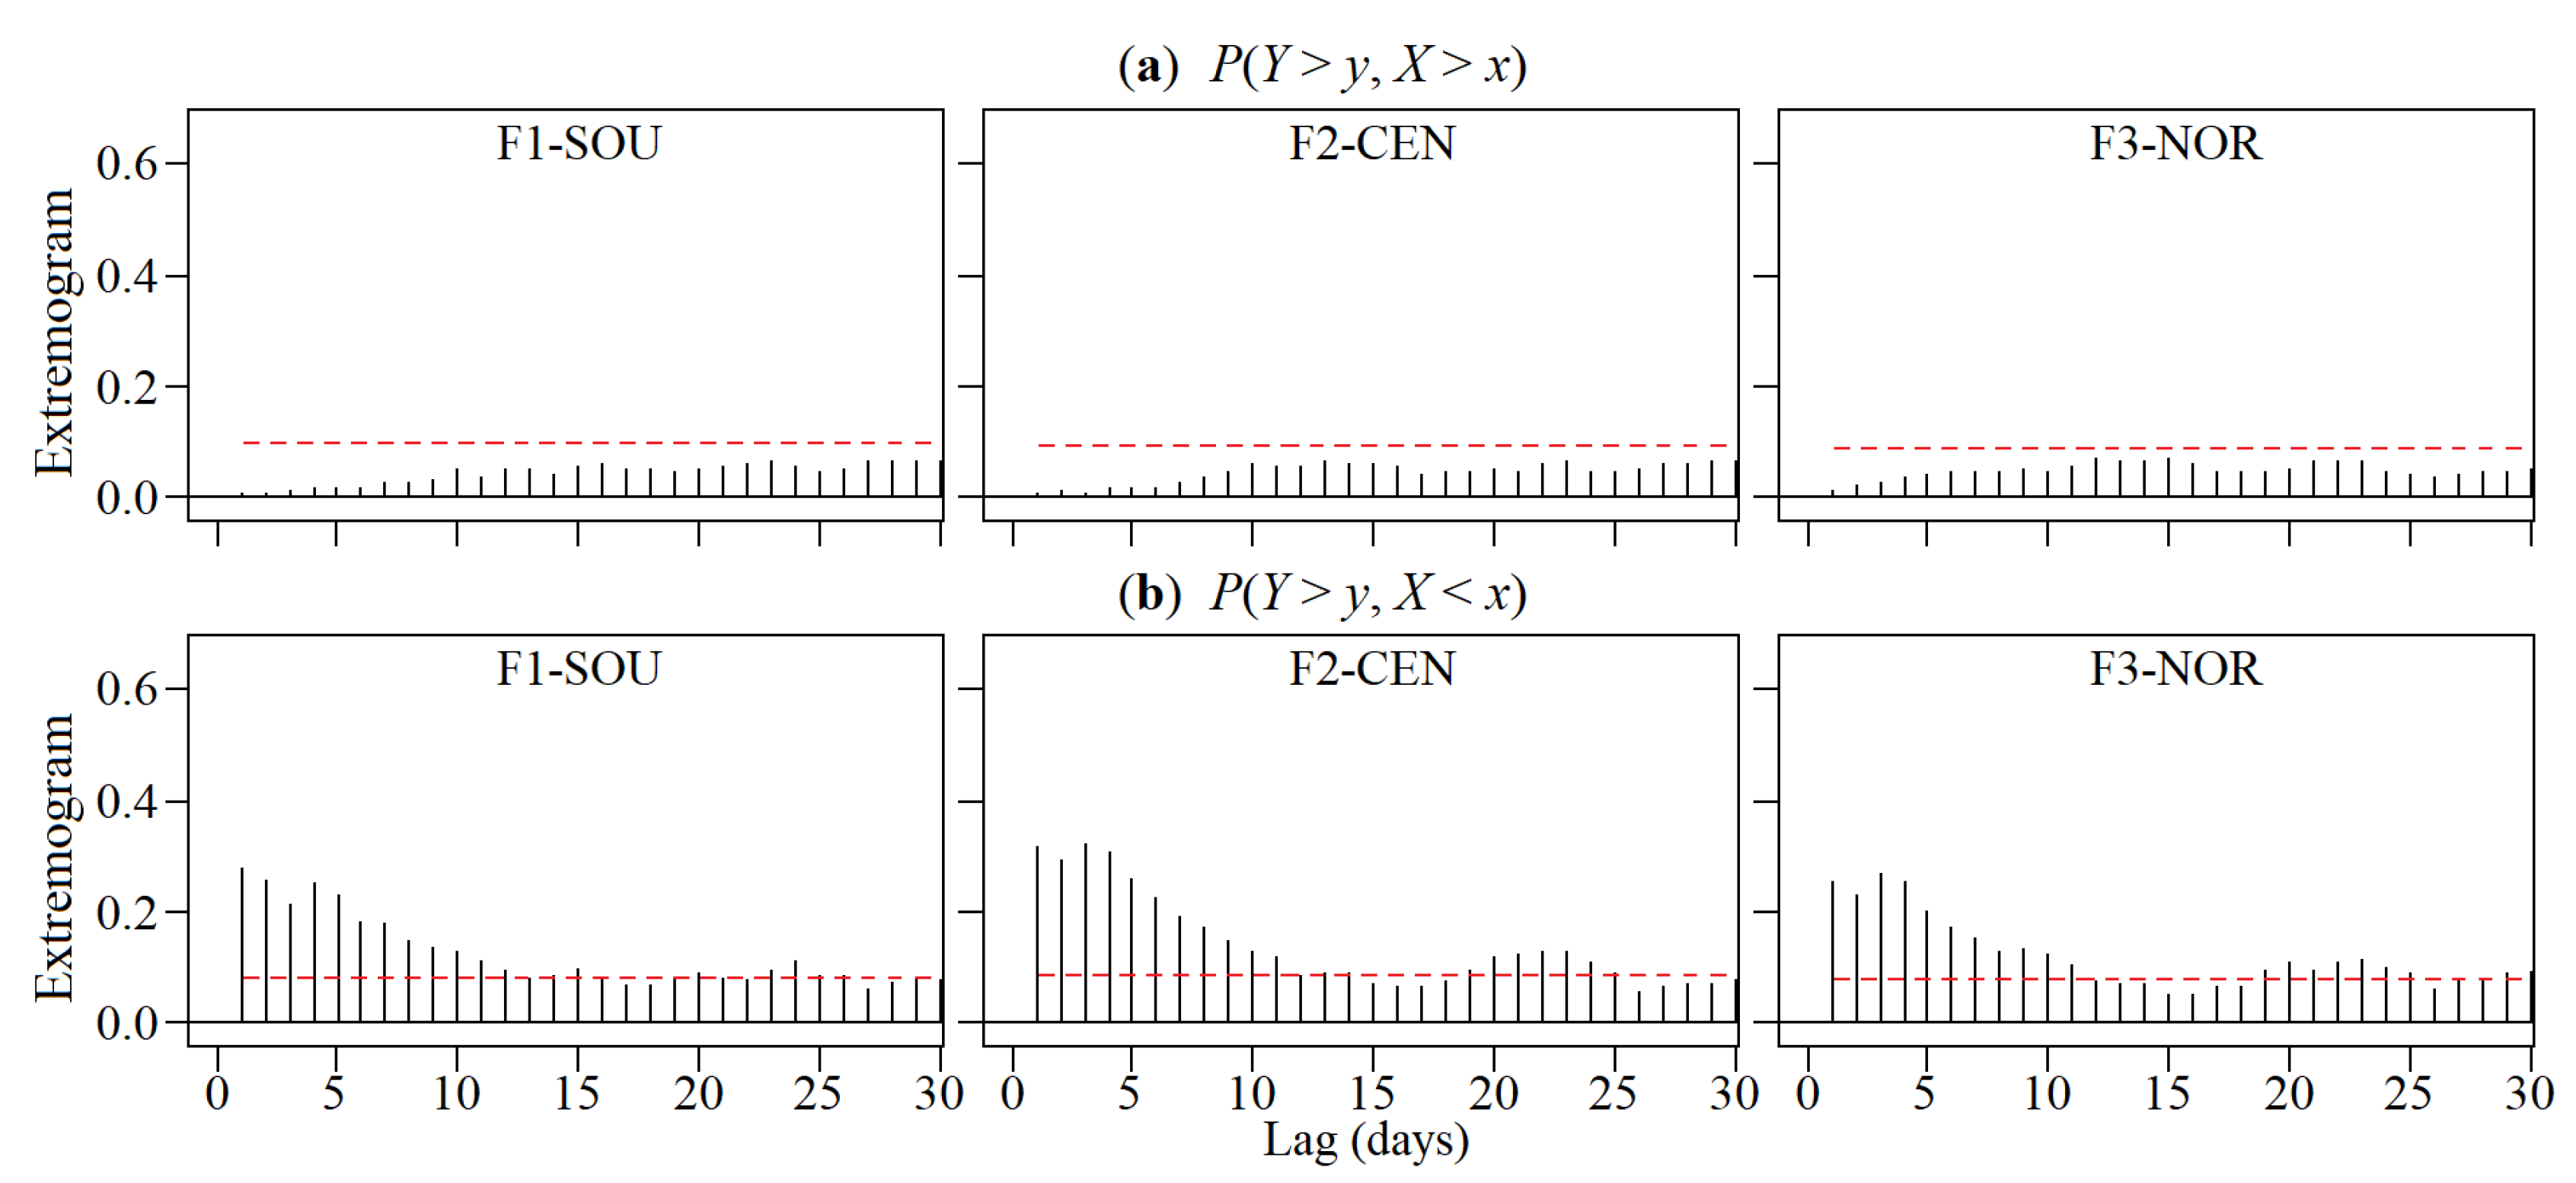
The cross-extremograms in the longest subperiod from the year 1948–1979 (−NAOI dominated) are illustrated in Figure 7. A spike in the figure can be regarded as the probability of obtaining a rainfall extreme in the region given that there was a NAOI extreme event (either positive or negative) in t days before. It is worth noting that after lag 30, there are no significant spikes in any of the generated extremograms and cross-extremograms (here not shown). For this 32-year subperiod as well as the other subperiods, the NAOI lower tail events ( X < x ) are highly negative NAOI records, whereas those of the NAOI upper tail ( X > x ) are highly positive records (as illustrated in Figure 5 by blue and red triangles, respectively). For the upper tails (top graphs), the cross-extremograms give little significance of dependence between the NAOI and rainfall extremes. Specifically, in southern slope (F1-SOU series), there are some signs of extremal dependence of the NAOI at some lags (e.g., at lags 12, 13, and 15 days), however, their probabilities are very low and marginally above the permutation generated confidence band. In the F2-CEN series (central region), the cross-extremogram exhibits a similar pattern as seen in the F1-SOU series with a few extremal dependence indications. Although the cross-extremogram for the F3-NOR series has also a very alike development, any of the clustered events surpasses the correspondent dashed line, meaning that there is not enough evidence to reject H 0 . In contrast with the upper tails results, the cross-extremograms between Y upper tail and X lower tail point at some general strong and significant extremal dependence with a slow decay from lag 1 through 10 days for the three identified regions, as shown in the bottom graphs of Figure 7. This somehow shows that given the −NAOI dominance for this subperiod, there are apparently stronger effects of the NAOI lower tail on rainfall extremes than those of the NAOI upper tail.
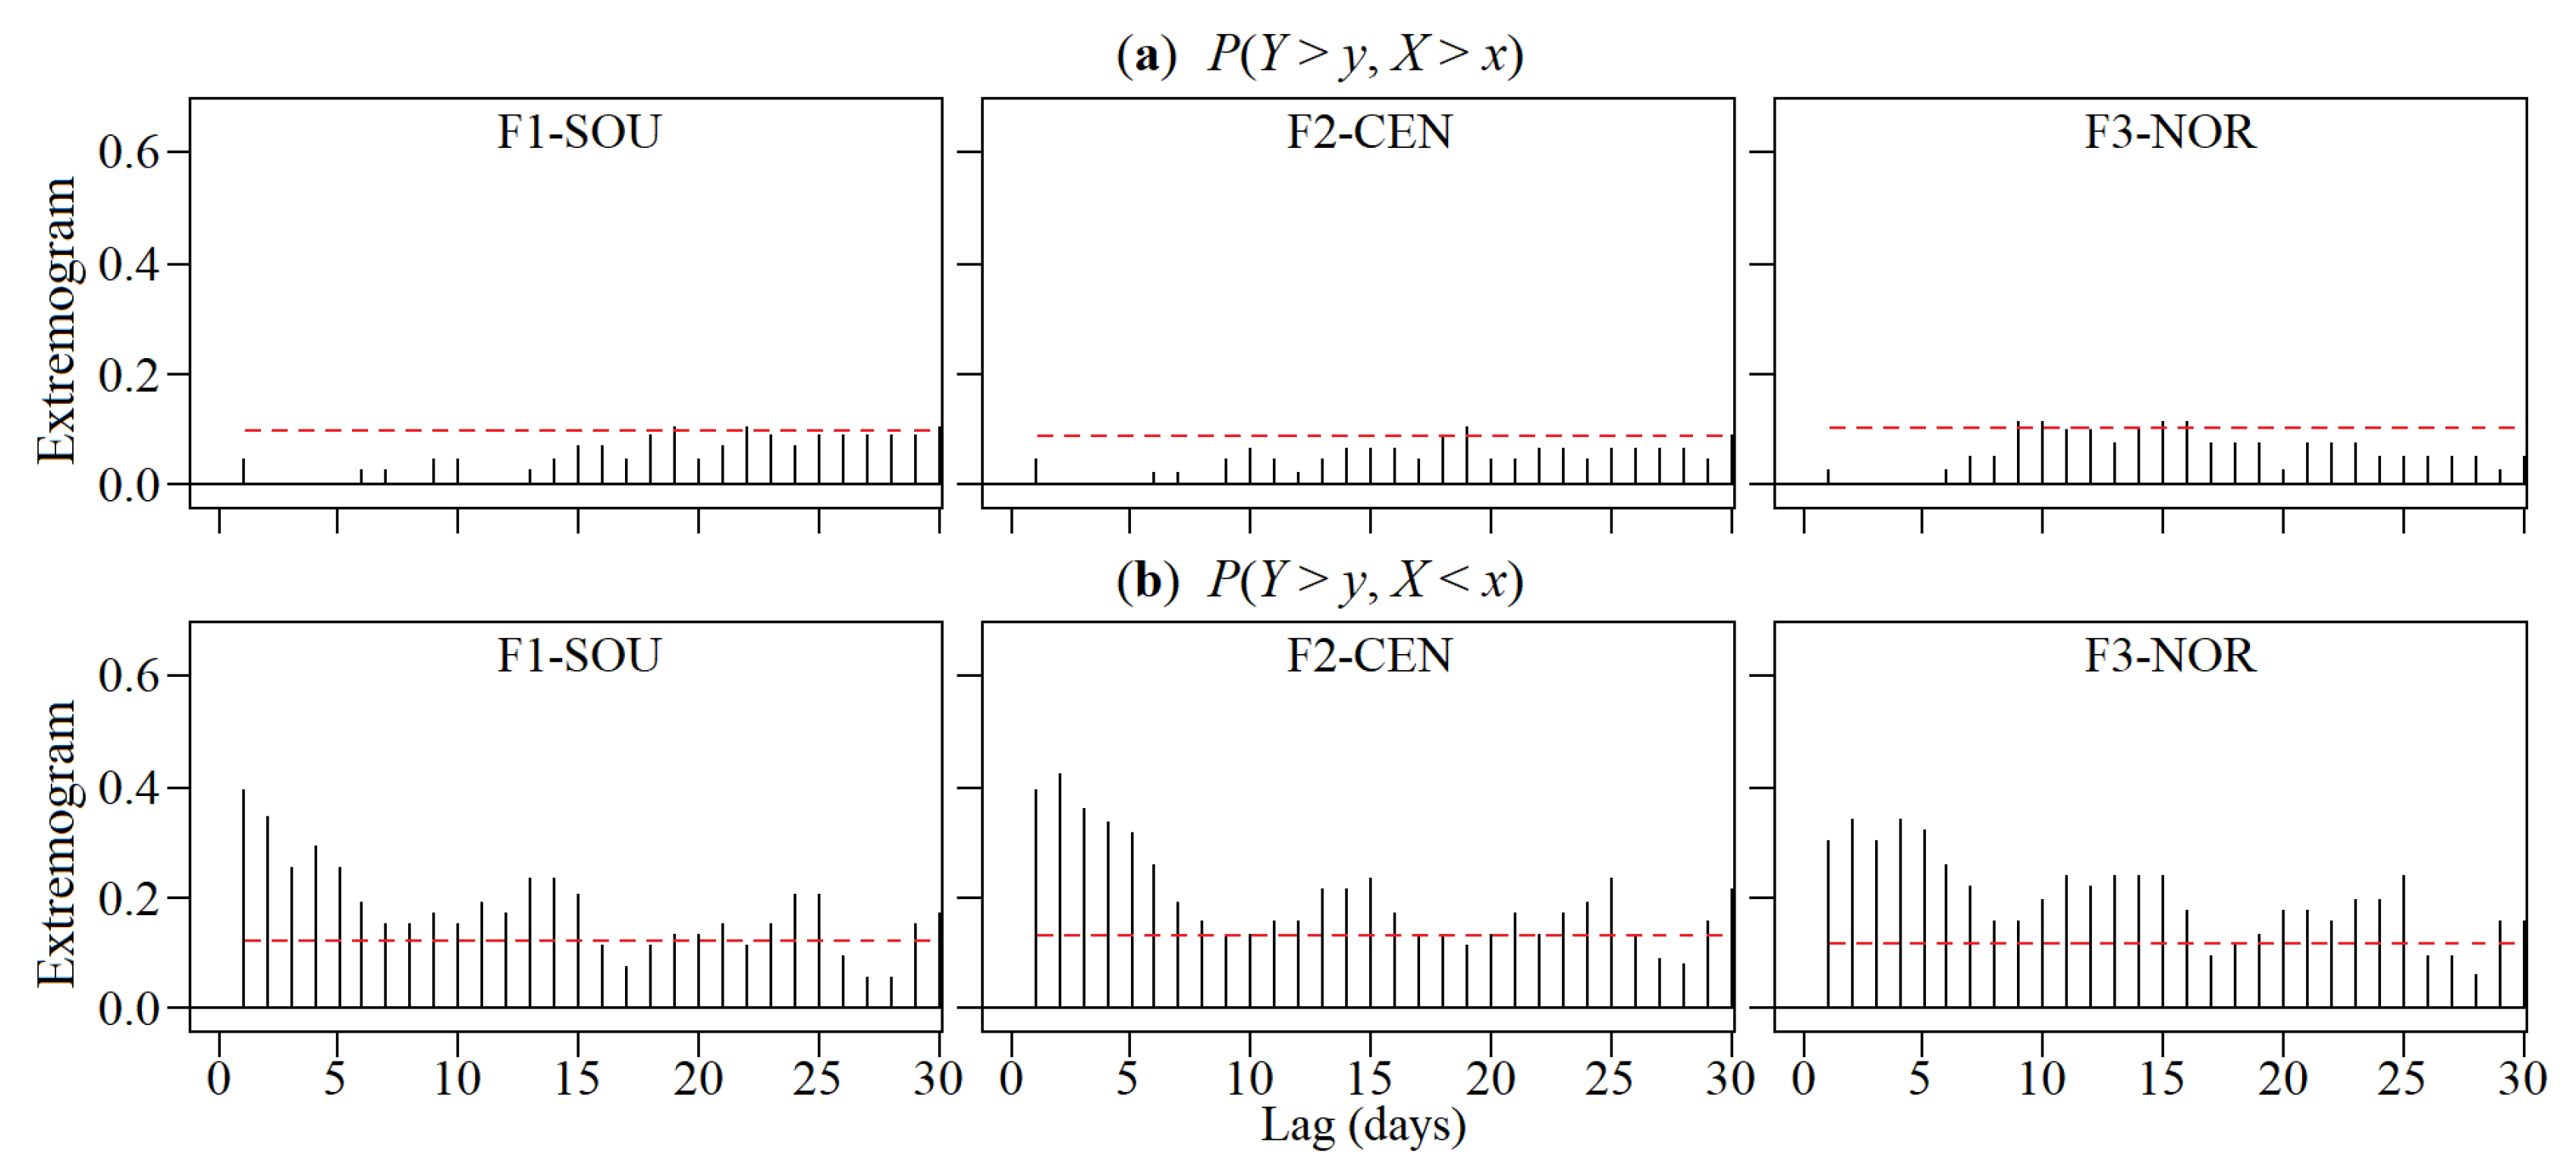
Figure 8 shows the cross-extremograms corresponding to the second subperiod from 1980–1999 with a +NAOI dominance. There is again little structure in the P ( Y > y , X > x ) plots (top graphs) for the three regions—only a few spikes in the F3-NOR cross-extremogram are slightly exceeding the confidence band. On the other hand, the P ( Y > y , X < x ) plots (bottom graphs) have almost identical development with a higher clustering of extremes and significant extremal dependence during three lags around lag 1 to 7, 11 to 15, and 23 to 25 days. However, the degree of dependence is dissimilar at some extent among regions. As an example, the dependence of extremes is greater during the first lags in F2-CEN than in the other regions, whilst F3-NOR denotes a much more delayed response based on its smother high and low levels. In comparison to the results for the first subperiod, the ones for the second subperiod did not meet the expectations of having stronger effects of the NAOI upper tail on rainfall extremes than those of the NAOI lower tail given the +NAOI dominance.
The recognised cross-extremogram pattern in the two previous dominance subperiods coincides with that shown in Figure 9 from 2000–2011 (−NAOI dominated). Despite this, the P ( Y > y , X < x ) plots for the third subperiod (bottom graphs) denote fuzzier decay with significantly greater probabilities of extremal dependence and an increased number of clustered events overweighting the band for independence, and therefore, accepting H 1 —extremes are dependent.
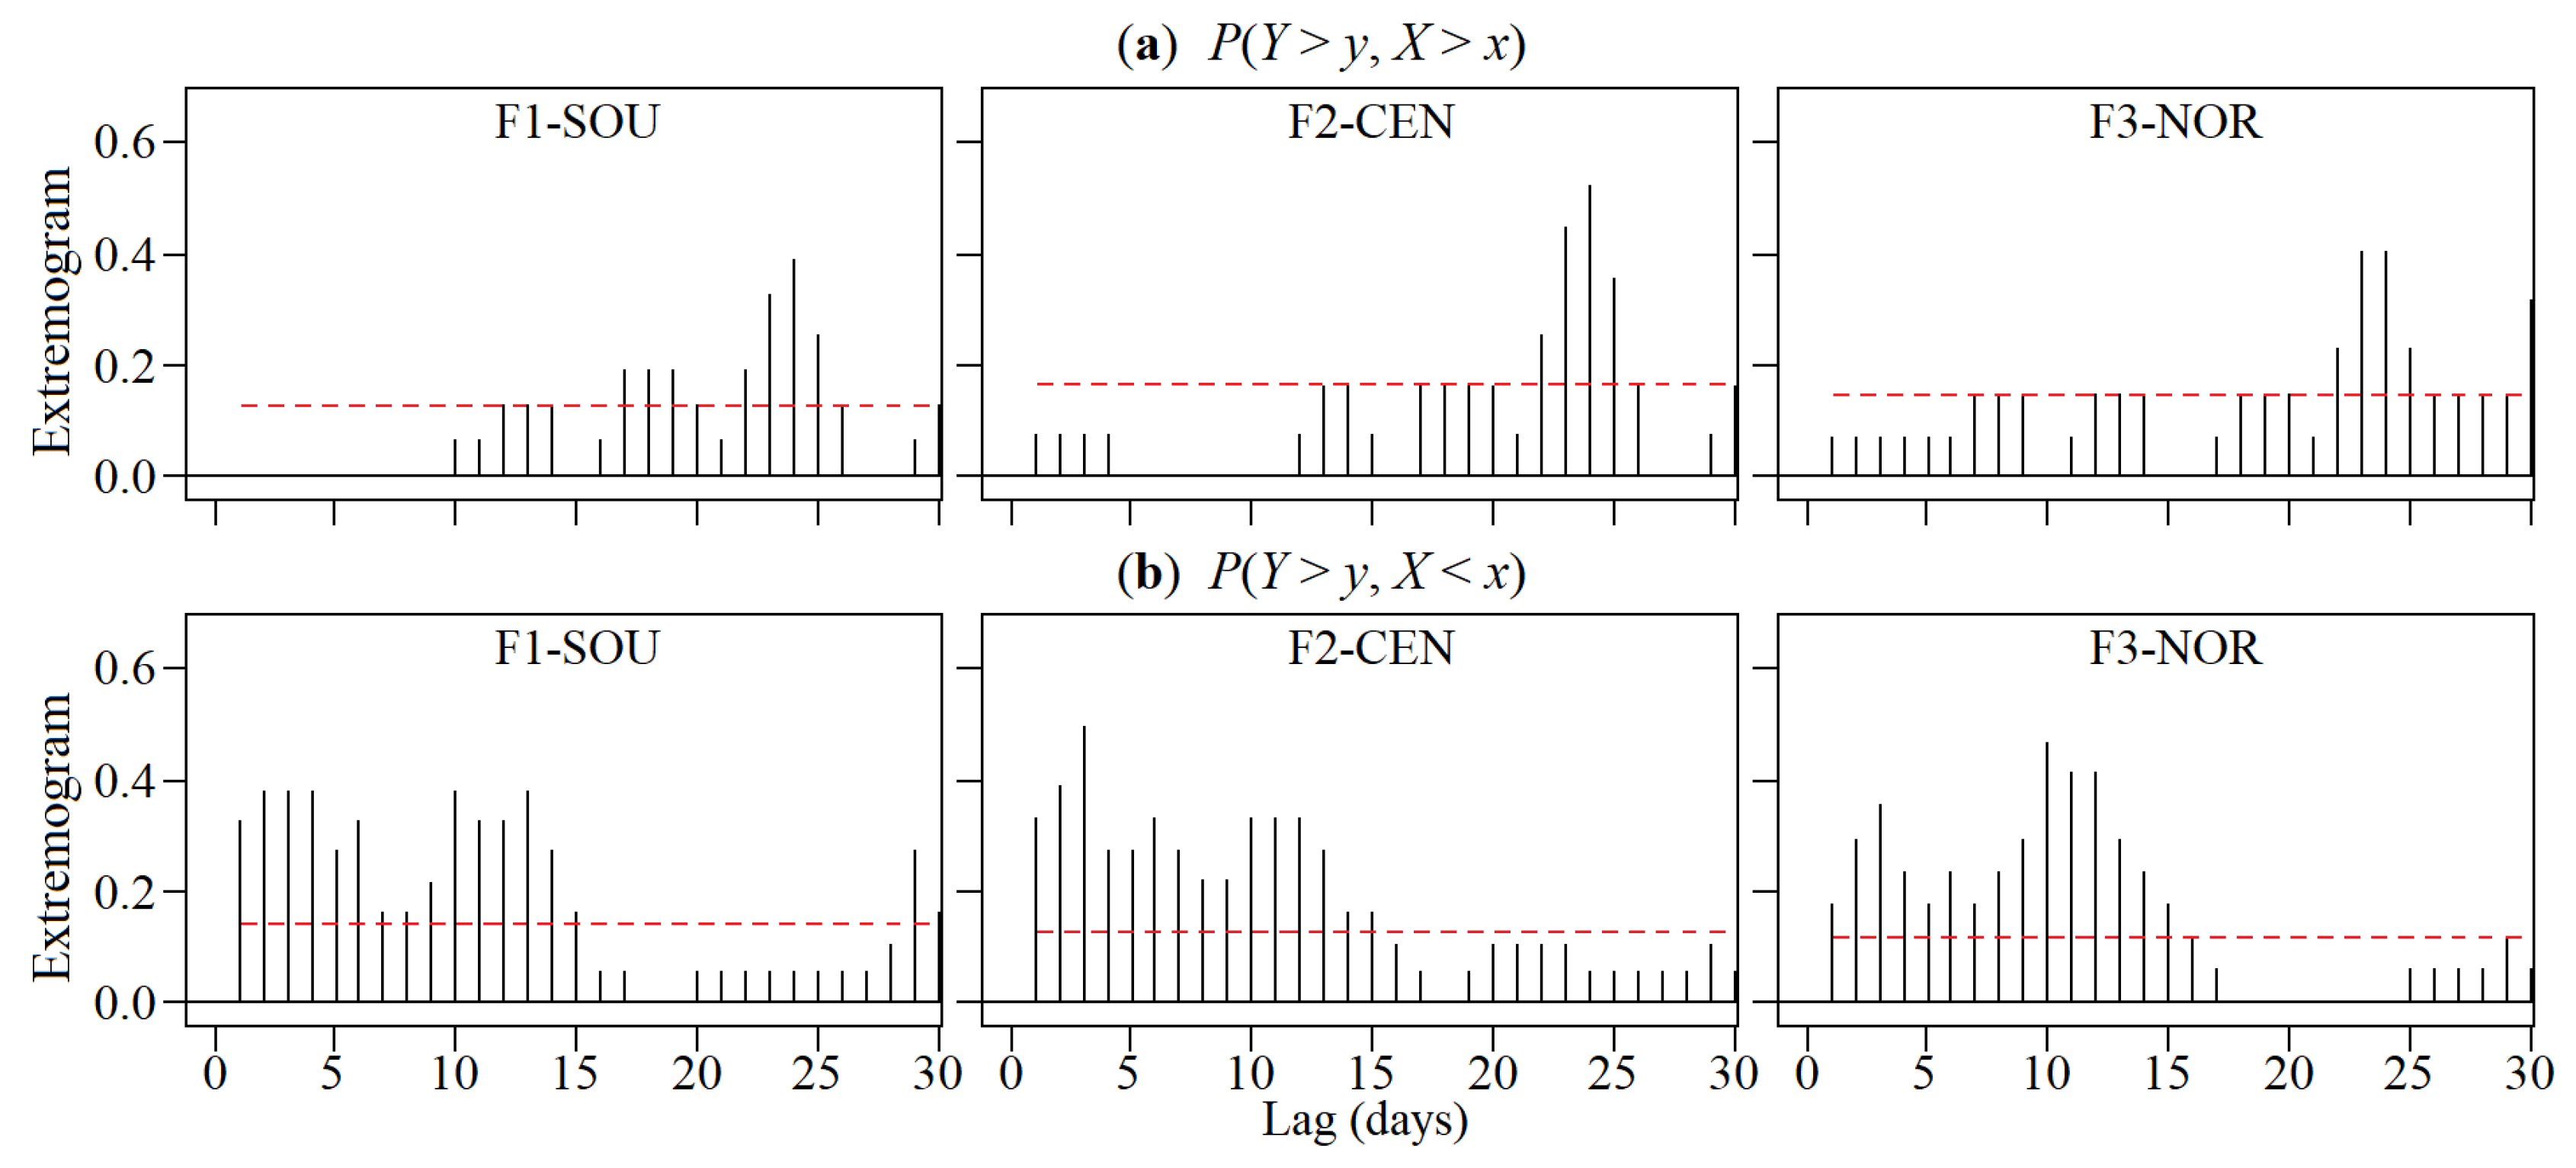
Following the negligible dependence for the bivariate daily series’ upper tails in the third subperiod, the most recent 6-year (2012–2017) subperiod—with an unfinished NAOI dominance as was mentioned—presents a distinct pattern. It is clear from Figure 10 that the upper tails (top graphs) show more significantly dependent events in this subperiod than in the previous ones. Nevertheless, the P ( Y > y , X < x ) plots (bottom graphs) have large spikes and dependence from lag 1–15 days.
Overall, these results suggest a sustained influence all over Madeira Island—at different levels—of extremely negative daily NAOI observations throughout the 70-year reference period than the extremely positive daily NAOI on the localised extreme daily rainfall events. This deserves further discussion.

5.4. Discussion and Conclusions

For Madeira Island, the extremal dependence between local climate and large-scale forcings—such as the North Atlantic Oscillation—was established by incorporating the concepts of rainfall “clustering” by means of regionalisation and the tails dependencies, i.e., the extremogram and cross-extremogram. In understanding the relationship between the large-scale circulation and rainfall extremes, which is increasingly essential in vulnerability and impact assessment studies due to climate change, rainfall regionalisation is useful. The daily rainfall regionalisation of the forty rain gauges’ complete series from 1 January 1948 to 30 September 2017 has been realistically aimed at not only setting up the most ideal of climatic regions of Madeira, but as well at producing an acceptable categorisation scheme based on rainfall variability, and not just on rainfall quantities, for further studies such as for climate change impact analyses. The methodology applied in this work firstly integrated the use of both principal factors based classification of rain gauges’ time series and the Voronoi polygons method applied to those time series.
Climatic regionalisation is not a seamless process that removes all elements of discrepancies. Uncertainty of this process has been the focus for a long time of discussion and debate among classic some other modern classifications—e.g., [57,58,59]. Such examples reflect the long history of discussing changes in regionalisation, some of them, also as a result of climate change. In this paper, the aim was not obtaining factor scores [60] based on the daily rainfalls series but rather computing factor loadings to use them, after rotation, to group the rain gauges into different regions. Therefore, the factor analysis approach in this work was purposely made simpler using rainfall as single variable of the 40 rain gauges with a common period of complete data. Rotation is more usually used in factor analysis than in PCA, and its importance depends much more on the interest of the analysis. The unrotated solution has not been spatially presented but the scree plot (Figure 2) since most of its explained variability is concentrated in the first factor with 71% which would mean that a single region could be acceptable. As an attempt to clarify the relationship among factors or regions, varimax rotation was applied as was performed in climatic regionalisation, but using a different climatic variable [32,36]. Principal factors obtained with other rotation techniques like quartimax, equimax, direct-oblimini, and promax [61] were also tested (here not shown) denoting almost the same results as those obtained via the varimax application, i.e., three factors retained explaining about 82% of the variability. Hence variability and, in some cases, the number of retained factors vary from technique to technique. Moreover, the factor loadings obtained using different rotated factors indicate that retaining three factors do not compromise prime information (explained cumulative variabilities higher than 80%).
Although the correlations mapping using different rotation techniques recognises almost the same regions (southern slope, central region, and northern region), the results of the homogeneous regions differ slightly for some rain gauges within the limits of the spatial distribution of factors (F1, F2, and F3). For instance, ST30 rain gauge is included in F2-CEN homogeneous region (Figure 3) with a correlation of 0.57 for F1, 0.62 for F2, and 0.35 for F3. However, quartimax results are 0.63, 0.56, and 0.33, respectively, making this rain gauge part of F1-SOU instead. Though factor analysis, including both PCA and PFA, is a robust mathematical procedure, its application climatic regionalisation requires subjective decisions to some extent such as the choice of the correlation or covariance matrices, the optimal number of retained factors, and the rotation method [45,46].
The here achieved regionalisation based on daily rainfall data—southern slope, central region, and northern slope—is consistent with previous spatial drought characterisations [32,36], but using monthly data and PFA transformed into Standard Precipitation Index (SPI) and factor scores instead. The small differences among the limits of the homogeneous regions in these characterisations are due to the fact that the regionalised variables are different—though the drought indices SPI were also derived from the rainfall data. Although climatic regionalisation is somewhat a subjective process which does not produce a definitive arrangement and that there are several approaches in the literature (e.g., [62,63,64]), the regionalisation obtained in this work succeeded in explaining the daily rainfall climatology of Madeira Island with strong spatiotemporal variations.
In evaluating whether the computed regionalised rainfall series (after applying the Voronoi method) have been able to capture the seasonality, long-term fluctuation, and particularly daily rainfall extreme events, the extremes and the mean annual rainfall per region (from October to September) were compared to documented individual station’s records and to the official reports, respectively. As mentioned at the end of Section 5.3, there is a fairly good correspondence between the occurrence of rainfall extremes from the regionalised and single rain gauges’ series (e.g., the extreme events that occurred between the years 2009/10 and 2010/11). Overall, the value of 1669 mm for the weighted mean annual rainfall over Madeira is quite close to the one from the river basin management plan of Madeira, of 1628 mm year 1 [65,66], although referred to different periods—in the present study 69 years, from October 1948 to September 2017, and 50 years, from October 1941 to September 1991, in [65,66]. The mean annual rainfall of 873 mm year 1 now obtained for FI-SOU is remarkably below average, for F2-CEN is notably above with 24142 mm year 1 , and for F3-NOR is marginally below with 1590 mm year 1 , which are as well in accordance to the spatial pattern shown in [65].
The rainfall in Madeira is seen to be affected by the local topography coupled with the large-scale forcing interactions. F2-CEN and F3-NOR generally receive more rainfall than F1-SOU. This is due to the influence of the prevailing NE trade winds, from the northeast to southwest, on the climate of the small island [67]. This results in an increasing gradient in rainfall between southern and northern slopes. Due to the elevation differences (Figure 1), the windward-facing regions, namely, F2-CEN and F3-NOR experience orographic rainfall [13], as a result of adiabatic air expansion [30]. This increases the rainfall, particularly in F2-CEN which is one of the most favourable regions out of the three in terms of higher rainfall and water resources availability both surface and groundwater such as the Paúl da Serra plateau [68], ST02 in Figure 1. In contrast, F1-SOU lies in the leeward rain shadow and at lowest elevations which results in a much drier region. This indicates the ability of the rainfall regionalisation to recognise the unique characteristics and contribution of each homogeneous region to total rainfall in the small island. The regionalised daily rainfall series were crucial for the extremal dependence analysis between heavy rainfall events and the large-scale forcing of the NAO with regard to extremely positive and negative NAOI values.
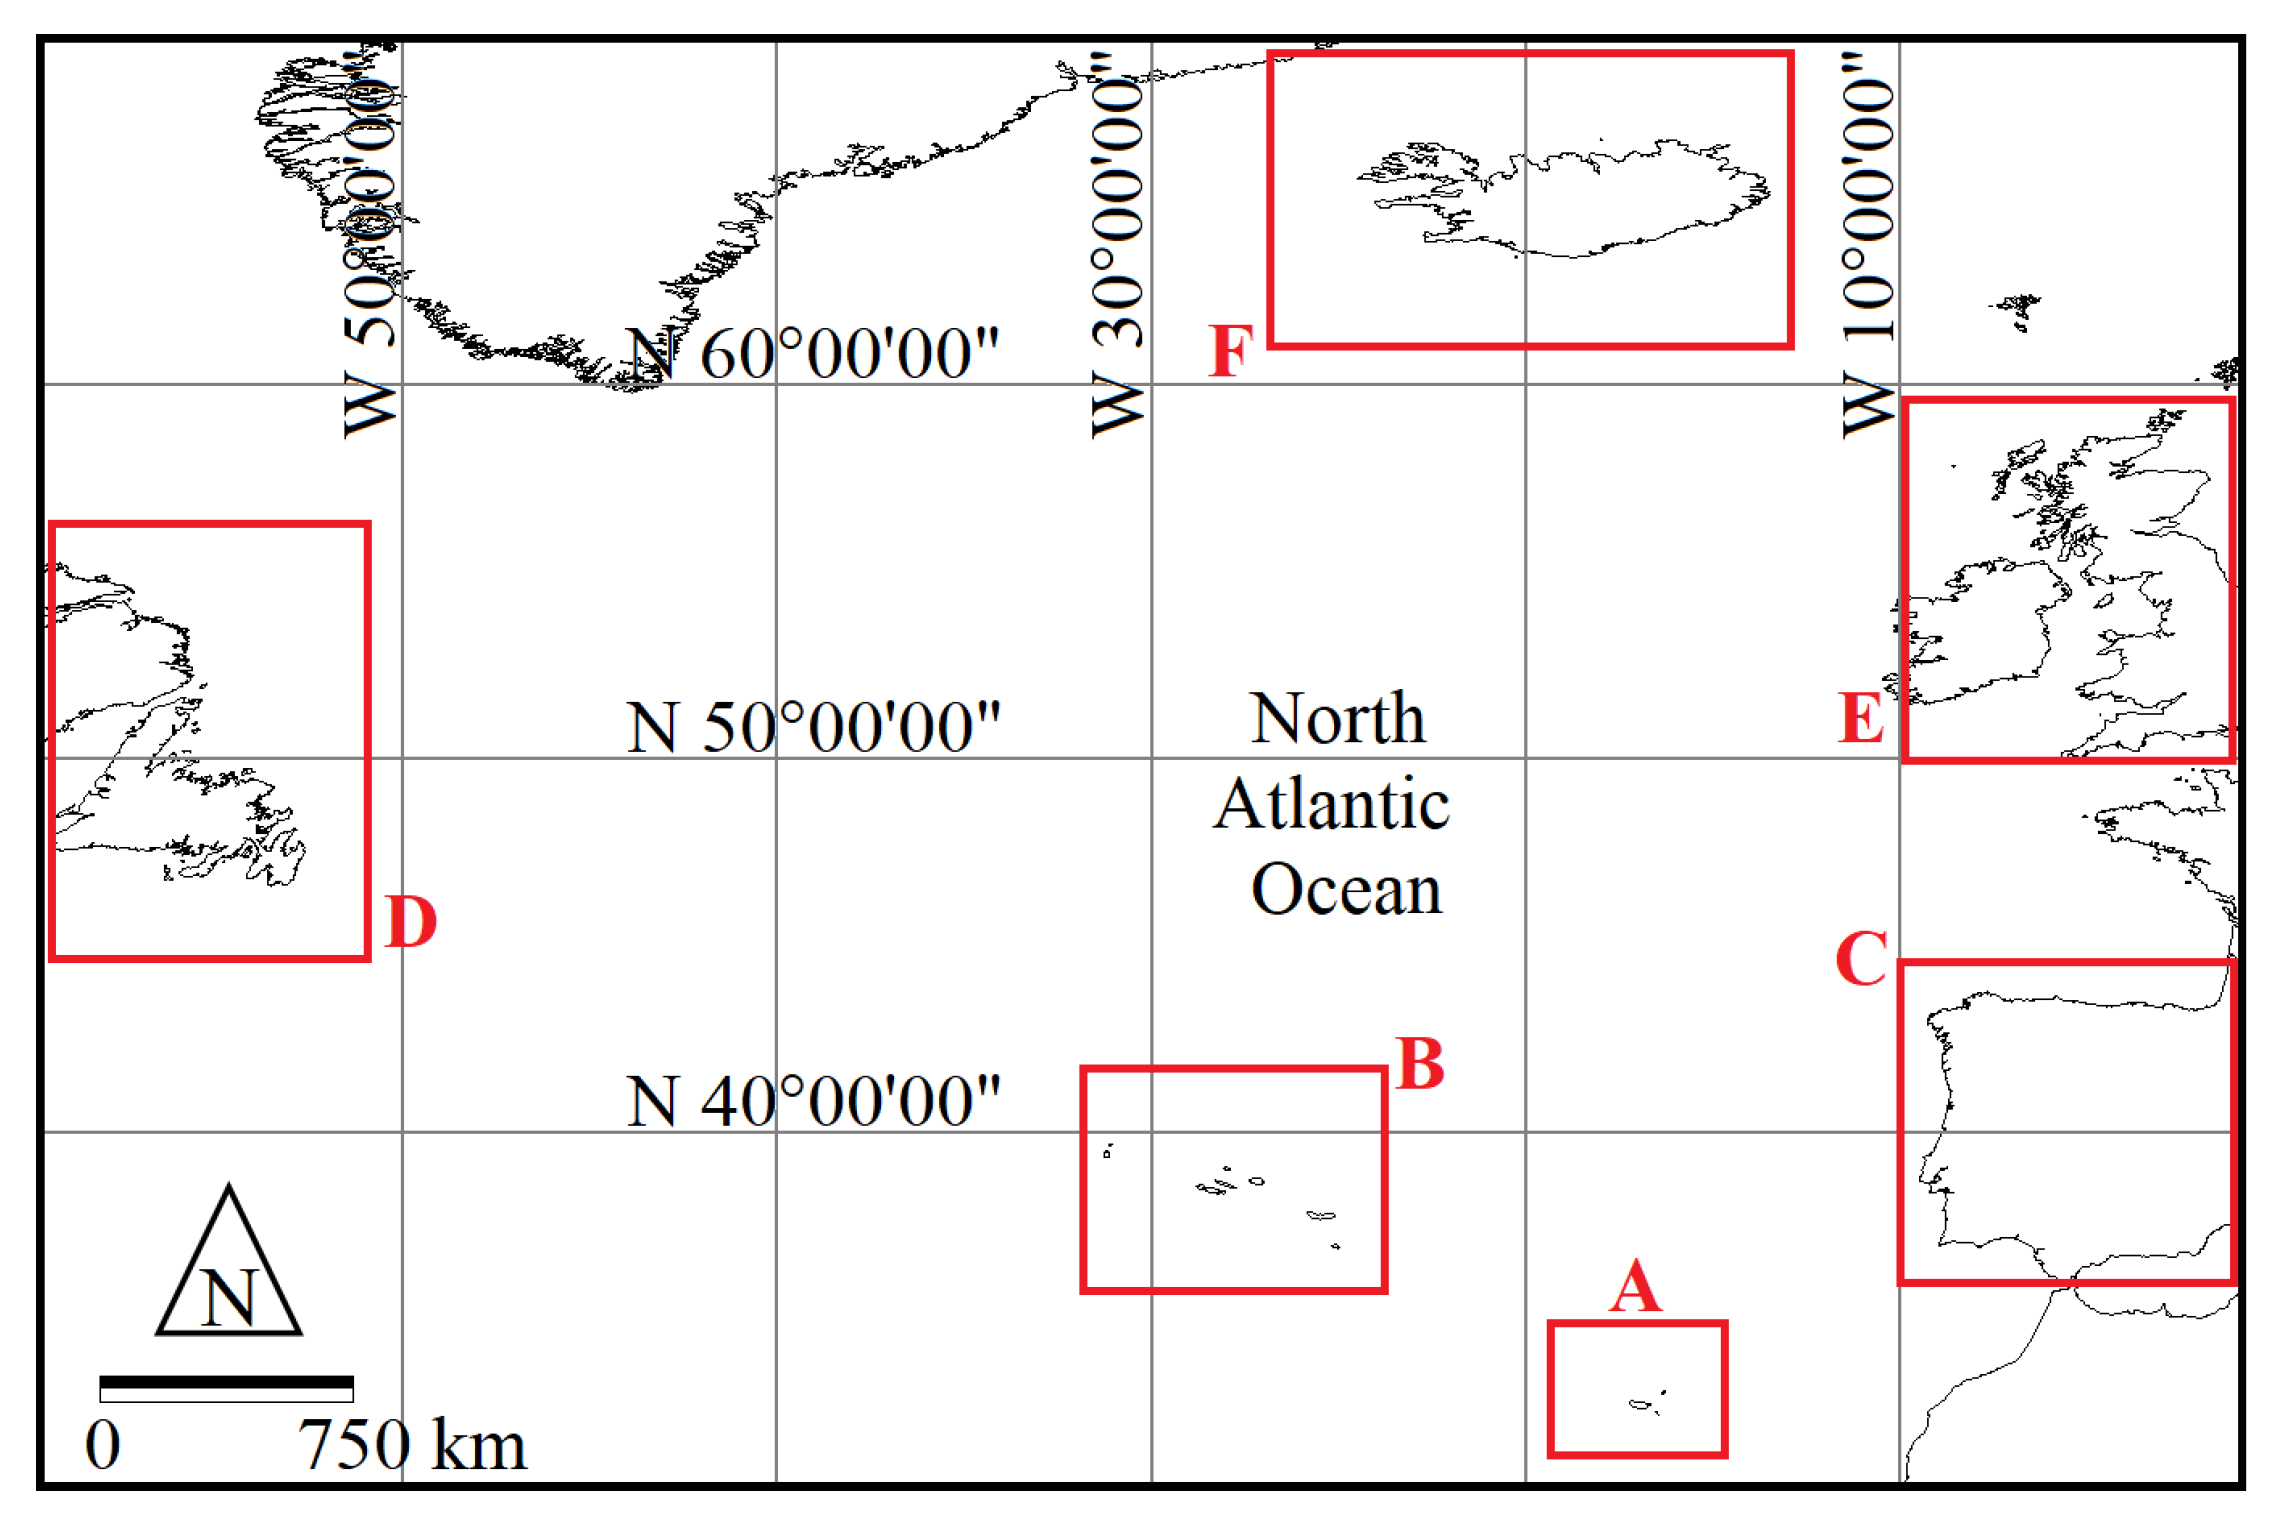
Despite the winter NAO from December through March (the so-called NAOI DJFM in terms of index) shows the strongest influence of the NAO on the surface climate—as stated by [24,69,70]—all-year-long daily NAOI records (from 1948–2017) from the NOAA PSL have been considered. Either way, the lower and upper tails NAOI events (blue and red triangles in Figure 5) were pointed out almost entirely during the first half of the hydrological year (from October through March) neglecting equally important extremes out of this period. Different approaches have been used to define an NAOI such as the station-based method [29] given by the normalised SLP between high pressure, i.e., a southern station located in Iberian Peninsula or the Azores (C and B in Figure 11, respectively) and a northern station (low pressure), usually making use of a southwest Icelandic station (F in Figure 11). As an alternative, NAOI can be obtained from gridded climate datasets utilising orthogonal analysis or PCA. Similar methods like ensembles of simulations from a general circulation model can produce climatic datasets as the one here analysed which extends a daily NAOI back to the year 1948 and consistently updated by the NOAA PSL (Section 3.2). Because all indices from shorter to longer time scales show similar temporal evolutions and are highly correlated at interannual and interdecadal time scales, an exact NAOI definition is of less importance. However, the same time scale and length of both rainfall and NAOI have been reckoned with as determining factors in this study.
The results of the negative (−NAOI) and positive (+NAOI) dominance of NAOI (Figure 5) demonstrate the interannual, but more importantly, the multi-year and interdecadal variability of daily NAOI extreme events. Beyond the generalised spatiotemporal variations of the NAO influencing rainfall throughout the North Atlantic Ocean and over some continental regions (e.g., the Azores, the eastern Canada, U.S., Europe) this work highlights the relevant influence of −NAOI and +NAOI dominance on the extreme rainfall for Madeira Island (A in Figure 11) during the four multi-year subperiods. Thus, the fitted LOWESS curve of Figure 5 was compared to an earlier characterisation from the year 1870–2090 by [23] of a filtered NAOI DJFM single realisation obtained from ensembles means of four greenhouse gases (GSa) experiments. Only the patterns were the focus due to the resolution differences and also because absolute spectrally truncated daily NAOI and NAOI DJFM values are not comparable. Although not shown, the comparison stresses that both signals’ patterns exhibit a prevalence of negative NAOI dominance from the 1950s to 1980s, followed by a reduction of the total NAOI, or integrated area above or under the signal, of alternating sign anomalies, namely, +NAOI, −NAOI, and +NAOI. It is also apparent, that in some recent years there is an increase of more consecutive and more extremes negative NAOI observations (e.g., daily NAOI values from 2009/10 to 2011/12). Additionally, the apparent upward trend in the LOWESS curve from 1960s to 1990s is also in accordance with that based on real data by [23], and also linked to quickly climatic variables changes (e.g., the rapidly temperatures rise) in the North Atlantic Ocean region [71]. These remarks and some others through the extremogram application to the univariate daily NAOI series as mentioned in Section 5.2, strengthen the justification to follow through the extremal dependence analysis adopting subperiods, i.e., from 1948–1979 (1st subperiod), 1980–1999 (2nd subperiod), 2000–2011 (3rd subperiod), and 2012–2017 (4th subperiod).
The statistics of the three weighted regionalised rainfall series indicate that the response of maximum daily rainfall to the NAOI dominance has an alternating structure. For instance, the maximum daily rainfalls for F2-CEN are 162.9 mm for 1st subperiod (−NAOI dominance), 142.0 mm for 2nd subperiod (+NAOI dominance), 174.2 mm for 3rd subperiod (−NAOI dominance), and 128.0 mm for 4th subperiod (+NAOI dominance). In the same way, for F1-SOU the values are 107.1 mm, 104.1 mm, 135.5 mm, and 101.5 mm; and for F3-NOR 156.1 mm, 133.0 mm, 163.5 mm, and 110.3 mm. These figures show that the higher maximum rainfall occurred in the −NAOI dominance periods. The fact that this alternating behaviour is found in the three regions in Madeira is indicative of the important effect of the NAOI lower tail (regarded as −NAOI) rather than the NAOI upper tail (+NAOI) on extreme rainfall events. Additionally, the same cross-extremogram approach was applied for teleconnection between extreme rainfall and extreme NAOI, although considering the complete 70-year reference period instead of the subperiods as done for Figure 7, Figure 8, Figure 9 and Figure 10. The plots of Figure 12 are virtually identical, but with lower spikes smoother than those displayed in Figure 7, Figure 8 and Figure 9, i.e., with a significant extremal dependence between the rainfall extremes and extremely negative NAOI, and an almost non-existent dependence as for the upper tails. This suggests that particularly attention should be given to the negative NAOI and its effects on the extreme rainfall development in Madeira.
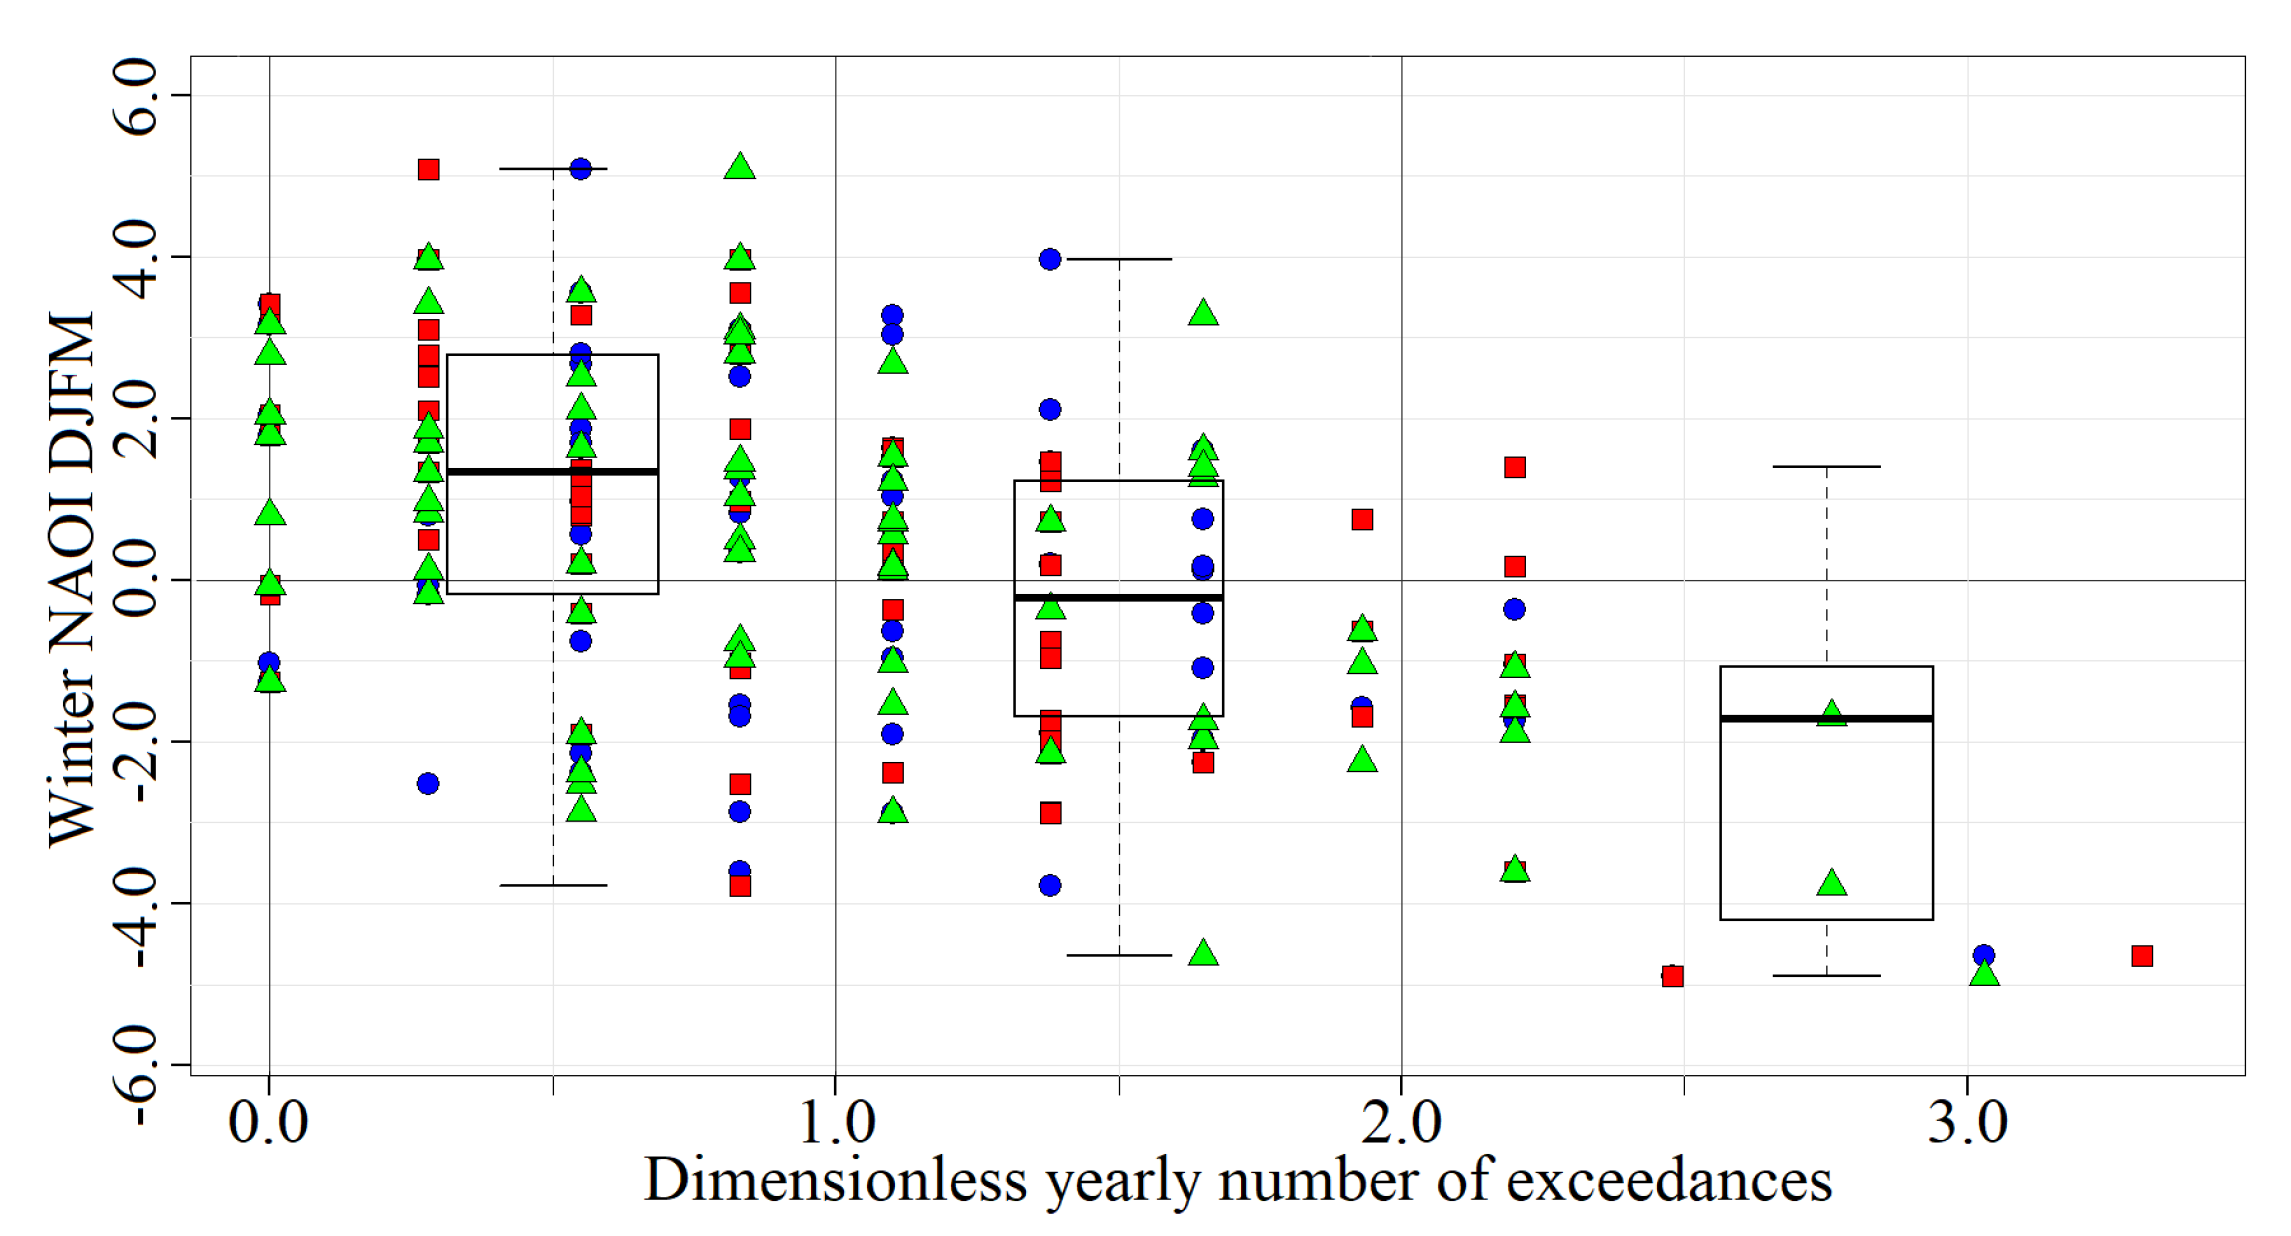
To support the aforementioned findings, a simplified analysis (adopting the same rainfall threshold as for the extremogram analysis, i.e., the 99th percentile rank) between the dimensionless number of exceedances of daily rainfalls and NAOI DJFM, as defined by [24], was carried out for the 69 hydrological years, from October 1948 to September 2017. Figure 13 depicts, for each homogeneous region, the number of rainfalls above a m ( u p p e r ) Y , in each hydrological year divided by their corresponding mean annual number (dimensionless number of exceedances in the horizontal axis) plotted against NAOI DJFM in the same year (vertical axis). The station-based winter NAOI DJFM data was retrieved from National Center for Atmospheric Research, NCAR [72], for the stations located in Lisbon and Stykkisholmur (C and F, respectively, in Figure 11). Boxplots were constructed to represent the NAOI DJFM samples dispersion for three exceedances categories, (i) values lower than the mean, (ii) between one and two times the mean, and (iii) higher than two times the mean. Figure 13 evidences that regardless the region, most of the “weaker” extreme rainfall years, with below average number of exceedances, are associated to positive NAOI DJFM values, and the “very extreme” rainfall years, with more than twice the average number of occurrences, to negative NAOI DJFM. This is in agreement with the detected alternating character of the maximum daily rainfalls for each NAOI dominance subperiod.
Besides the statistical interpretation of (i) the −NAOI and +NAOI dominance subperiods here identified, (ii) the alternating daily maximum structure in the multi-year subperiods, (iii) the teleconnection insights from the extremal dependence analysis (via the extremogram and cross-extremogram), and (iv) the straightforward rainfall exceedances results; an explanation can be drawn from a meteorological perspective. For instance, +NAOI values are associated with stronger westerlies (prevailing anti-trade winds from the west headed for the east) over latitudes N 30 –60 (Figure 11), and with milder weather over western mainland Europe [24]. Generally, extreme or heavy and frequent rainfall are due to long-distance air streams whose origin may be as NE trade winds [73].
On top of the NE trade winds, Madeira’s climate is influenced as well by the Azores anticyclone [74] mostly bringing drier conditions. This anticyclone is stronger-than-average during the high +NAOI. Conversely, very low −NAOI indicates weakening of the Azores anticyclone [75] as occurred in the 2009/10, a year characterised by record persistence of the negative phase of the NAO [76], and with the lowest daily −NAOI ever registered as already shown in Figure 5. Furthermore, −NAOI strengthens the NE trade winds allowing cold air to build up over the small island and may result in wetter conditions [77] favourable for the extreme rainfall occurrence.
The association of disturbances of the atmosphere or storms, usually accompanied by rainfall or snow, with the NAO activity is well known for continental areas and large islands, as has been mentioned, except for some small islands. [78] developed an algorithm to realistically track storms via the NAO activity in winter. According to the authors −NAOI has less storms in Iceland, more in a band stretching from the British Isles to Newfoundland and Labrador, and even more notably over Iberian Peninsula (F, E, D, C, in Figure 11 respectively). This suggests that the −NAOI effect may shift south-eastwards from Iberian Peninsula with increased storms characterised by substantial heavy rainfalls in Madeira Island, with a somewhat symmetrical +NAOI effect but to a lesser degree. These claims are supported by the statistically significant evidence found and discussed in this extremal serial dependence analysis between the weighted regionalised rainfalls and daily NAOI compared with previous studies though focused on single rain gauges and on monthly and seasonal NAOI data.
It is important to point out that a NAOI definition only indicates the most probable set-up over a period of time, which in turn can give strong clues as to the types of storms and their related intensity. Recent studies have shown that weather models have very good performance at predicting winter NAOI [79] and daily NAOI [80]. Such capability coupled with the results here shown gives the possibility of forecasting extreme rainfalls and consequently implementing anticipatory risk reduction measures. Thus, modelling extremal dependence between rainfall and predictable major climatic drivers may play a crucial role in water resources and risk management in Madeira but also in other North Atlantic small islands, namely under a changing climate.

Author Contributions

Conceptualization, L.A.E.; methodology, L.A.E.; software, L.A.E.; validation, L.A.E.; formal analysis, L.A.E.; investigation, L.A.E.; resources, L.A.E.; data curation, L.A.E.; writing–original draft preparation, L.A.E.; writing–review and editing, L.A.E., M.M.P., R.R.; visualization, L.A.E.; supervision, M.M.P. All authors have read and agreed to the published version of the manuscript.

Funding

The work of the first author is funded by The Portuguese Foundation for Science and Technology (FCT), grant No. PD/BD/128509/2017.

Conflicts of Interest

The authors declare no conflict of interest.

References

  1. Boers, N.; Goswami, B.; Rheinwalt, A.; Bookhagen, B.; Hoskins, B.; Kurths, J. Complex networks reveal global pattern of extreme-rainfall teleconnections. Nature 2019, 566, 373–377. [Google Scholar] [CrossRef] [PubMed]
  2. McCarthy, J.J.; Canziani, O.F.; Leary, N.A.; Dokken, D.J.; White, K.S. (Eds.) Climate Change 2001: Impacts, Adaptation, and Vulnerability: Contribution of Working Group II to the Third Assessment Report of the Intergovernmental Panel on Climate Change; Cambridge University Press: Cambridge, UK, 2001; Volume 2. [Google Scholar]
  3. Feng, Z.; Leung, L.R.; Hagos, S.; Houze, R.A.; Burleyson, C.D.; Balaguru, K. More frequent intense and long-lived storms dominate the springtime trend in central US rainfall. Nat. Commun. 2016, 7, 1–8. [Google Scholar] [CrossRef] [PubMed] [Green Version]
  4. Padilla, F.M.; Mommer, L.; de Caluwe, H.; Smit-Tiekstra, A.E.; Visser, E.J.; de Kroon, H. Effects of extreme rainfall events are independent of plant species richness in an experimental grassland community. Oecologia 2019, 191, 177–190. [Google Scholar] [CrossRef] [PubMed] [Green Version]
  5. Sanches, F.; Verdum, R.; Fisch, G.; Gass, S.L.B.; Rocha, V.M. Extreme Rainfall Events in the Southwest of Rio Grande do Sul (Brazil) and Its Association with the Sandization Process. Am. J. Clim. Chang. 2019, 8, 441. [Google Scholar] [CrossRef] [Green Version]
  6. Tabari, H.; Madani, K.; Arnbjerg-Nielsen, K.; Willems, P. Disentangling natural and forced components of extreme rainfall hazards over Europe. EGU2019: European Geophysical Union General Assembly 2019, Vienna, 7–12 April 2019. Geophys. Res. Abstr. 2019, 21. [Google Scholar]
  7. Hanna, E.; Cropper, T.E.; Jones, P.D.; Scaife, A.A.; Allan, R. Recent seasonal asymmetric changes in the NAO (a marked summer decline and increased winter variability) and associated changes in the AO and Greenland Blocking Index. Int. J. Climatol. 2015, 35, 2540–2554. [Google Scholar] [CrossRef]
  8. Davis, R.A.; Mikosch, T. The extremogram: A correlogram for extreme events. Bernoulli 2009, 15, 977–1009. [Google Scholar] [CrossRef] [Green Version]
  9. Smolka, A. Natural disasters and the challenge of extreme events: Risk management from an insurance perspective. Philos. Trans. R. Soc. A Math. Phys. Eng. Sci. 2006, 364, 2147–2165. [Google Scholar] [CrossRef]
  10. Costa, A.C.; Soares, A. Trends in extreme precipitation indices derived from a daily rainfall database for the South of Portugal. Int. J. Climatol. A J. R. Meteorol. Soc. 2009, 29, 1956–1975. [Google Scholar] [CrossRef]
  11. Soares, P.M.; Cardoso, R.M.; Miranda, P.M.; Viterbo, P.; Belo-Pereira, M. Assessment of the ENSEMBLES regional climate models in the representation of precipitation variability and extremes over Portugal. J. Geophys. Res. Atmos. 2012, 117. [Google Scholar] [CrossRef] [Green Version]
  12. Santos, M.; Fragoso, M. Precipitation variability in Northern Portugal: Data homogeneity assessment and trends in extreme precipitation indices. Atmos. Res. 2013, 131, 34–45. [Google Scholar] [CrossRef]
  13. Luna, T.; Rocha, A.; Carvalho, A.; Ferreira, J.; Sousa, J. Modelling the extreme precipitation event over Madeira Island on 20 February 2010. Nat. Hazards Earth Syst. Sci. 2011, 11, 2437–2452. [Google Scholar] [CrossRef] [Green Version]
  14. Fragoso, M.; Trigo, R.; Pinto, J.; Lopes, S.; Lopes, A.; Ulbrich, S.; Magro, C. The 20 February 2010 Madeira flash-floods: Synoptic analysis and extreme rainfall assessment. Nat. Hazards Earth Syst. Sci. 2012, 12, 715–730. [Google Scholar] [CrossRef] [Green Version]
  15. Levizzani, V.; Laviola, S.; Cattani, E.; Costa, M.J. Extreme precipitation on the Island of Madeira on 20 February 2010 as seen by satellite passive microwave sounders. Eur. J. Remote Sens. 2013, 46, 475–489. [Google Scholar] [CrossRef] [Green Version]
  16. Teixeira, J.; Carvalho, A.; Carvalho, M.; Luna, T.; Rocha, A. Sensitivity of the WRF model to the lower boundary in an extreme precipitation event–Madeira island case study. Nat. Hazards Earth Syst. Sci. 2014, 14, 2009–2025. [Google Scholar] [CrossRef] [Green Version]
  17. Gouveia-Reis, D.; Lopes, L.G.; Mendonça, S. A dependence modelling study of extreme rainfall in Madeira Island. Phys. Chem. Earth Parts A/B/C 2016, 94, 85–93. [Google Scholar] [CrossRef] [Green Version]
  18. Van Montfort, M.; Witter, J. The generalized Pareto distribution applied to rainfall depths. Hydrol. Sci. J. 1986, 31, 151–162. [Google Scholar] [CrossRef]
  19. Fan, L.; Chen, D. Trends in extreme precipitation indices across China detected using quantile regression. Atmos. Sci. Lett. 2016, 17, 400–406. [Google Scholar] [CrossRef] [Green Version]
  20. Acero, F.J.; García, J.A.; Gallego, M.C. Peaks-over-threshold study of trends in extreme rainfall over the Iberian Peninsula. J. Clim. 2011, 24, 1089–1105. [Google Scholar] [CrossRef]
  21. Veron, S.; Mouchet, M.; Govaerts, R.; Haevermans, T.; Pellens, R. Vulnerability to climate change of islands worldwide and its impact on the tree of life. Sci. Rep. 2019, 9, 1–14. [Google Scholar] [CrossRef] [Green Version]
  22. Wise, J. The autocorrelation function and the spectral density function. Biometrika 1955, 42, 151–159. [Google Scholar] [CrossRef]
  23. Osborn, T.J.; Briffa, K.R.; Tett, S.F.; Jones, P.D.; Trigo, R.M. Evaluation of the North Atlantic Oscillation as simulated by a coupled climate model. Clim. Dyn. 1999, 15, 685–702. [Google Scholar] [CrossRef]
  24. Hurrell, J.W.; Deser, C. North Atlantic climate variability: The role of the North Atlantic Oscillation. J. Mar. Syst. 2010, 79, 231–244. [Google Scholar] [CrossRef]
  25. Mitchell, D.; Davini, P.; Harvey, B.; Massey, N.; Haustein, K.; Woollings, T.; Jones, R.; Otto, F.; Guillod, B.; Sparrow, S.; et al. Assessing mid-latitude dynamics in extreme event attribution systems. Clim. Dyn. 2017, 48, 3889–3901. [Google Scholar] [CrossRef] [Green Version]
  26. Uvo, C.B. Analysis and regionalization of northern European winter precipitation based on its relationship with the North Atlantic Oscillation. Int. J. Climatol. A J. R. Meteorol. Soc. 2003, 23, 1185–1194. [Google Scholar] [CrossRef]
  27. Tabari, H.; Willems, P. Lagged influence of Atlantic and Pacific climate patterns on European extreme precipitation. Sci. Rep. 2018, 8, 5748. [Google Scholar] [CrossRef]
  28. Trigo, R.M.; Zêzere, J.L.; Rodrigues, M.L.; Trigo, I.F. The influence of the North Atlantic Oscillation on rainfall triggering of landslides near Lisbon. Nat. Hazards 2005, 36, 331–354. [Google Scholar] [CrossRef]
  29. Cropper, T.; Hanna, E.; Valente, M.A.; Jónsson, T. A daily Azores–Iceland North Atlantic Oscillation index back to 1850. Geosci. Data J. 2015, 2, 12–24. [Google Scholar] [CrossRef] [Green Version]
  30. Falkland, A.; Custodio, E. Hydrology and water resources of small islands: A practical guide: A contribution to the International Hydrological Programme. Stud. Rep. Hydrol. 1991, 49, i–xiii. [Google Scholar]
  31. Chazarra, A.; Baceló, A.; Pires, V.; Cunha, S.; Silva, A.; Marques, J.; Carvalho, F.; Mendes, M.; Neto, J.; Mendes, L. Climate Atlas of the Archipelagos of the Canary Islands, Madeira and the Azores: Air Temperature and Precipitation PRECIPITATION (1971–2000); Ministry of Agriculture, Food and Environment, State Meteorological Agency: Madrid, Spain, 2011.
  32. Espinosa, L.A.; Portela, M.M.; Rodrigues, R. Spatio-temporal variability of droughts over past 80 years in Madeira Island. J. Hydrol. Reg. Stud. 2019, 25, 100623. [Google Scholar] [CrossRef]
  33. NOAA. Daily Climate Timeseries: NAO: NOAA PSL. Available online: https://psl.noaa.gov/data/timeseries/daily/NAO/ (accessed on 20 February 2020).
  34. Lyra, G.B.; Oliveira-Júnior, J.F.; Zeri, M. Cluster analysis applied to the spatial and temporal variability of monthly rainfall in Alagoas state, Northeast of Brazil. Int. J. Climatol. 2014, 34, 3546–3558. [Google Scholar] [CrossRef]
  35. Abatzoglou, J.T.; Redmond, K.T.; Edwards, L.M. Classification of regional climate variability in the state of California. J. Appl. Meteorol. Climatol. 2009, 48, 1527–1541. [Google Scholar] [CrossRef] [Green Version]
  36. Espinosa, L.A.; Portela, M.M.; Pontes Filho, J.D.; Studart, T.M.d.C.; Santos, J.F.; Rodrigues, R. Jointly Modeling Drought Characteristics with Smoothed Regionalized SPI Series for a Small Island. Water 2019, 11, 2489. [Google Scholar] [CrossRef] [Green Version]
  37. Ferrelli, F.; Brendel, A.; Aliaga, V.; Piccolo, M.; Perillo, G. Climate regionalization and trends based on daily temperature and precipitation extremes in the south of the Pampas (Argentina). Cuad. De Investig. Geográfica 2019, 45, 393–416. [Google Scholar] [CrossRef] [Green Version]
  38. Pomee, M.S.; Hertig, E. Statistical downscaling of temperature over the Euro-Mediterranean region: The role of sea surface temperature and soil moisture as additional predictors. Geophys. Res. Abstr. 2019, 21, EGU2019-10012-1. Available online: https://meetingorganizer.copernicus.org/EGU2019/EGU2019-10012-1.pdf (accessed on 25 October 2020).
  39. Baeriswyl, P.A.; Rebetez, M. Regionalization of precipitation in Switzerland by means of principal component analysis. Theor. Appl. Climatol. 1997, 58, 31–41. [Google Scholar] [CrossRef] [Green Version]
  40. Álvarez-Rodríguez, J.; Llasat, M.; Estrela, T. Analysis of geographic and orographic influence in Spanish monthly precipitation. Int. J. Climatol. 2017, 37, 350–362. [Google Scholar] [CrossRef]
  41. Santos, M.; Fragoso, M.; Santos, J.A. Regionalization and susceptibility assessment to daily precipitation extremes in mainland Portugal. Appl. Geogr. 2017, 86, 128–138. [Google Scholar] [CrossRef]
  42. Fazel, N.; Berndtsson, R.; Uvo, C.B.; Madani, K.; Kløve, B. Regionalization of precipitation characteristics in Iran’s Lake Urmia basin. Theor. Appl. Climatol. 2018, 132, 363–373. [Google Scholar] [CrossRef] [Green Version]
  43. Raja, N.B.; Aydin, O. Regionalization of precipitation in Mauritius: A statistical approach. Meteorol. Appl. 2019, 26, 711–719. [Google Scholar] [CrossRef] [Green Version]
  44. Evans, D.G.; Jones, S.M. Detecting Voronoi (area-of-influence) polygons. Math. Geol. 1987, 19, 523–537. [Google Scholar] [CrossRef]
  45. Abdi, H. Factor rotations in factor analyses. In Encyclopedia for Research Methods for the Social Sciences; Sage: Thousand Oaks, CA, USA, 2003; pp. 792–795. [Google Scholar]
  46. Kaufman, J.D.; Dunlap, W.P. Determining the number of factors to retain: Q windows-based FORTRAN-IMSL program for parallel analysis. Behav. Res. Methods Instrum. Comput. 2000, 32, 389–395. [Google Scholar] [CrossRef] [PubMed]
  47. Kaiser, H.F. The application of electronic computers to factor analysis. Educ. Psychol. Meas. 1960, 20, 141–151. [Google Scholar] [CrossRef]
  48. Cleveland, W.S. Robust locally weighted regression and smoothing scatterplots. J. Am. Stat. Assoc. 1979, 74, 829–836. [Google Scholar] [CrossRef]
  49. Ledford, A.W.; Tawn, J.A. Modelling dependence within joint tail regions. J. R. Stat. Soc. Ser. B (Stat. Methodol.) 1997, 59, 475–499. [Google Scholar] [CrossRef]
  50. Langford, E. Quartiles in elementary statistics. J. Stat. Educ. 2006, 14. [Google Scholar] [CrossRef]
  51. Klein Tank, A.; Peterson, T.; Quadir, D.; Dorji, S.; Zou, X.; Tang, H.; Santhosh, K.; Joshi, U.; Jaswal, A.; Kolli, R.; et al. Changes in daily temperature and precipitation extremes in central and south Asia. J. Geophys. Res. Atmos. 2006, 111. [Google Scholar] [CrossRef]
  52. Yarnal, B. Synoptic Climatology in Environmental Analysis: A Primer; Belhaven: Jackson, MS, USA, 1993. [Google Scholar]
  53. Burrough, P.; McDonnell, R. Spatial information systems and geostatistics. Geogr. Inf. Syst. 1998, 333, 330. [Google Scholar]
  54. Lopes, S.; Fragoso, M.; Lopes, A. Heavy Rainfall Events and Mass Movements in the Funchal Area (Madeira, Portugal): Spatial Analysis and Susceptibility Assessment. Atmosphere 2020, 11, 104. [Google Scholar] [CrossRef] [Green Version]
  55. Greatbatch, R.J.; Gollan, G.; Jung, T.; Kunz, T. Tropical origin of the severe European winter of 1962/1963. Q. J. R. Meteorol. Soc. 2015, 141, 153–165. [Google Scholar] [CrossRef]
  56. Draisma, G.; Drees, H.; Ferreira, A.; De Haan, L. Bivariate tail estimation: Dependence in asymptotic independence. Bernoulli 2004, 10, 251–280. [Google Scholar] [CrossRef]
  57. Ackerman, E.A. The Köppen classification of climates in North America. Geogr. Rev. 1941, 31, 105–111. [Google Scholar] [CrossRef]
  58. Thornthwaite, C.W. An approach toward a rational classification of climate. Geogr. Rev. 1948, 38, 55–94. [Google Scholar] [CrossRef]
  59. MacLeod, A.; Korycinska, A. Detailing Köppen–Geiger climate zones at sub-national to continental scale: A resource for pest risk analysis. EPPO Bull. 2019, 49, 73–82. [Google Scholar] [CrossRef]
  60. DiStefano, C.; Zhu, M.; Mindrila, D. Understanding and using factor scores: Considerations for the applied researcher. Pract. Assess. Res. Eval. 2009, 14, 20. [Google Scholar]
  61. Kieffer, K.M. Orthogonal versus Oblique Factor Rotation: A Review of the Literature Regarding the Pros and Cons. Available online: https://eric.ed.gov/?id=ED427031 (accessed on 15 May 2020).
  62. Johannessen, O.M.; Kuzmina, S.I.; Bobylev, L.P.; Miles, M.W. Surface air temperature variability and trends in the Arctic: New amplification assessment and regionalisation. Tellus A Dyn. Meteorol. Oceanogr. 2016, 68, 28234. [Google Scholar] [CrossRef] [Green Version]
  63. Parracho, A.; Melo-Gonçalves, P.; Rocha, A. Regionalisation of precipitation for the Iberian Peninsula and climate change. Phys. Chem. Earth Parts A/B/C 2016, 94, 146–154. [Google Scholar] [CrossRef]
  64. Wu, Z.; Xu, H.; Li, Y.; Wen, L.; Li, J.; Lu, G.; Li, X. Climate and drought risk regionalisation in China based on probabilistic aridity and drought index. Sci. Total Environ. 2018, 612, 513–521. [Google Scholar] [CrossRef]
  65. PRAM. Plano Regional da Água da Regiao Autonoma da Madeira; Relatorio Tecnico; PRAM: Autonomous Region of Madeira, Portugal, 2003. [Google Scholar]
  66. DLR. Decreto Legislativo Regional 38/2008/M. 20 August 2008. Available online: https://data.dre.pt/eli/declegreg/38/2008/08/20/m/dre/pt/html (accessed on 15 May 2020).
  67. Liberato, M.L.; Ramos, A.M.; Gouveia, C.M.; Sousa, P.; Russo, A.; Trigo, R.M.; Santo, F.E. Exceptionally extreme drought in Madeira Archipelago in 2012: Vegetation impacts and driving conditions. Agric. For. Meteorol. 2017, 232, 195–209. [Google Scholar] [CrossRef]
  68. Prada, S.N.; Da Silva, M.O.; Cruz, J.V. Groundwater behaviour in Madeira, volcanic island (Portugal). Hydrogeol. J. 2005, 13, 800–812. [Google Scholar] [CrossRef]
  69. Hurrell, J.W.; Kushnir, Y.; Visbeck, M. The north Atlantic oscillation. Science 2001, 291, 603–605. [Google Scholar] [CrossRef] [PubMed] [Green Version]
  70. López-Moreno, J.I.; Vicente-Serrano, S.M. Positive and negative phases of the wintertime North Atlantic Oscillation and drought occurrence over Europe: A multitemporal-scale approach. J. Clim. 2008, 21, 1220–1243. [Google Scholar] [CrossRef] [Green Version]
  71. Xu, H.; Kim, H.M.; Nye, J.A.; Hameed, S. Impacts of the North Atlantic Oscillation on sea surface temperature on the Northeast US Continental Shelf. Cont. Shelf Res. 2015, 105, 60–66. [Google Scholar] [CrossRef]
  72. NCAR. The Climate Data Guide: Hurrell North Atlantic Oscillation (NAO) Index, Station-Based (Last Modified 24 Apr 2020). Available online: https://climatedataguide.ucar.edu/ (accessed on 15 May 2020).
  73. McAdie, A. Monsoon and Trade Winds as Rain Makers and Desert Makers. Geogr. Rev. 1922, 12, 412–419. [Google Scholar] [CrossRef]
  74. Prada, S.; da Silva, M.O.; Figueira, C.; Meneses, M.; Pontes, A. Fog water collection in Madeira Island (Portugal). In Proceedings of the 4th International Conference on Fog, Fog Collection and Dew, La Serena, Chile, 22–27 July 2007; pp. 22–27. [Google Scholar]
  75. Trouet, V.; Esper, J.; Graham, N.E.; Baker, A.; Scourse, J.D.; Frank, D.C. Persistent positive North Atlantic Oscillation mode dominated the medieval climate anomaly. Science 2009, 324, 78–80. [Google Scholar] [CrossRef] [Green Version]
  76. Cattiaux, J.; Vautard, R.; Cassou, C.; Yiou, P.; Masson-Delmotte, V.; Codron, F. Winter 2010 in Europe: A cold extreme in a warming climate. Geophys. Res. Lett. 2010, 37. [Google Scholar] [CrossRef] [Green Version]
  77. Figueira, C.; de Sequeira, M.M.; Vasconcelos, R.; Prada, S. Cloud water interception in the temperate laurel forest of Madeira Island. Hydrol. Sci. J. 2013, 58, 152–161. [Google Scholar] [CrossRef]
  78. Serreze, M.C.; Carse, F.; Barry, R.G.; Rogers, J.C. Icelandic low cyclone activity: Climatological features, linkages with the NAO, and relationships with recent changes in the Northern Hemisphere circulation. J. Clim. 1997, 10, 453–464. [Google Scholar] [CrossRef]
  79. Scaife, A.; Arribas, A.; Blockley, E.; Brookshaw, A.; Clark, R.; Dunstone, N.; Eade, R.; Fereday, D.; Folland, C.; Gordon, M.; et al. Skillful long-range prediction of European and North American winters. Geophys. Res. Lett. 2014, 41, 2514–2519. [Google Scholar] [CrossRef] [Green Version]
  80. Dai, G.; Mu, M.; Jiang, Z. Evaluation of the forecast performance for North Atlantic Oscillation onset. Adv. Atmos. Sci. 2019, 36, 753–765. [Google Scholar] [CrossRef]
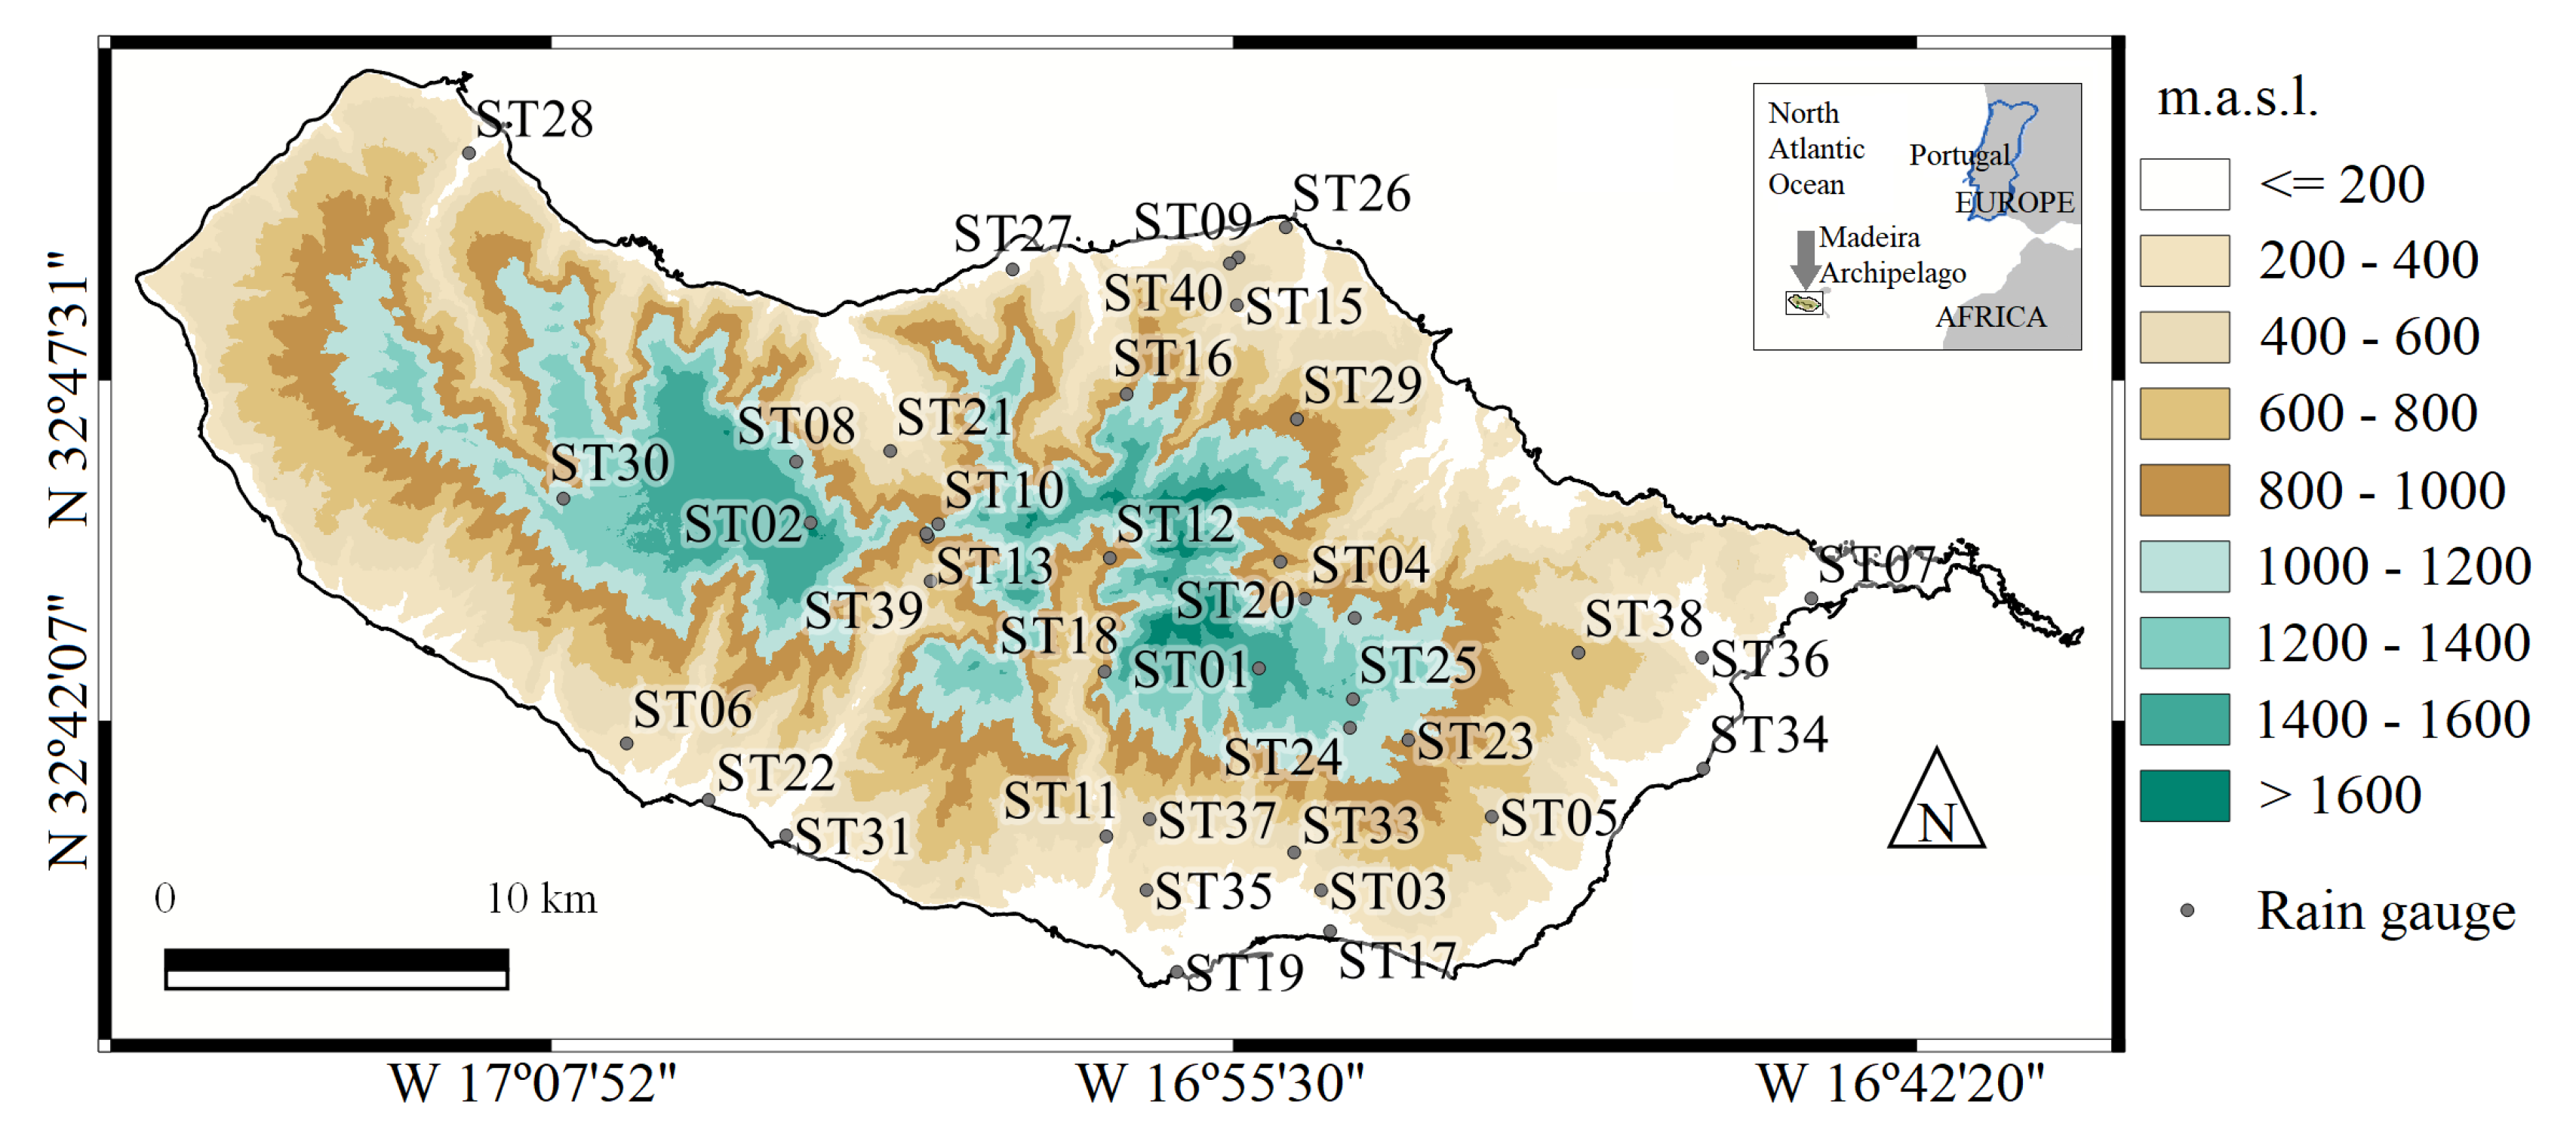
Figure 1. Location (WGS84 coordinates) and relief of Madeira Island. Spatial distribution of the forty rain gauges considered in this study depicted by bullets and their respective identification codes from ST01–ST40.
Water 12 02989 g001
Figure 2. Scree plot from the sample covariance matrix obtained via the factor analysis based on the daily rainfall from 1 January 1948 to 30 September 2017 at the 40 rain gauges (the unrotated solution of the 40-dimensions problem). Horizontal dashed line shows the 1.0 eigenvalue.
Water 12 02989 g002
Figure 3. Spatial distribution of the principal factor loadings after rotation (varimax) higher than 0.60 from the factor analysis based on daily rainfall records (1948–2017) at the 40 rain gauges (WGS84). The region F1-SOU is related to the first factor, F2-CEN to the second factor, and F3-NOR to the third factor.
Water 12 02989 g003
Figure 4. Weighted regionalised daily rainfall series spanning from 1 January 1948 to 30 September 2017 from the Voronoi polygons method for the identified regions via the factor analysis, F1-SOU (southern slope—12 rain gauges), F2-CEN (central region—17 rain gauges), and F3-NOR (northern slope—11 rain gauges). Daily rainfalls exceeding the 90% quantile of the upper tail 99th percentile of the corresponding time series are depicted by circles.
Water 12 02989 g004
Figure 5. Daily records of NAOI from 1 January 1948 to 30 September 2017. The lower and and upper tails’ daily observations are identified by blue and red triangles, respectively; and fitted into a LOWESS curve: the −NAOI dominance subperiods from January 1947 to December 1979, and from January 2000 to December 2011 (blue vertical and horizontal bars); and the +NAOI ones from January 1980 to December 1999, and from 2012 on (red vertical and horizontal bars).
Water 12 02989 g005
Figure 6. Extremograms of the univariate daily time series X (NAOI) for (a) the upper tail, and (b) the lower tail, for the dominance subperiods: 1st one (1948–1979), 2nd one (1980–1999), 3rd one (2000–2011), and 4th one (2012–2017). Horizontal red dashed lines indicate the upper 97.5% empirical confidence bands (for an α of 5%) for independent data, obtained via m = 10,000 permutations.
Water 12 02989 g006
Figure 7. Cross-extremograms for the 1st subperiod (1948–1979, −NAOI) of the bivariate daily time series X (NAOI) and Y (rainfall) for (a) X and Y upper tails, and for (b) the lower tail in X and the upper tail in Y (vertical axes cut off at 0.60). Horizontal red dashed lines indicate the upper 97.5% empirical confidence bands ( α of 5%).
Water 12 02989 g007
Figure 8. Cross-extremograms for the 2nd subperiod (1980–1999, +NAOI) of the bivariate daily time series X (NAOI) and Y (rainfall) for (a) X and Y upper tails, and for (b) the lower tail in X and the upper tail in Y (vertical axes cut off at 0.60). Horizontal red dashed lines indicate the upper 97.5% empirical confidence bands ( α of 5%).
Water 12 02989 g008
Figure 9. Cross-extremograms for the 3rd subperiod (2000–2011, −NAOI) of the bivariate daily time series X (NAOI) and Y (rainfall) for (a) X and Y upper tails, and for (b) the lower tail in X and the upper tail in Y (vertical axes cut off at 0.60). Horizontal red dashed lines indicate the upper 97.5% empirical confidence bands ( α of 5%).
Water 12 02989 g009
Figure 10. Cross-extremograms for the 4th subperiod (2012–2017, +NAOI) of the bivariate daily time series X (NAOI) and Y (rainfall) for (a) X and Y upper tails, and for (b) the lower tail in X and the upper tail in Y (vertical axes cut off at 0.60). Horizontal red dashed lines indicate the upper 97.5% empirical confidence bands ( α of 5%).
Water 12 02989 g010
Figure 11. Location of: (A) Madeira Archipelago, (B) The Azores, (C) Iberian Peninsula (mostly formed by continental Portugal and Spain), (D) Newfoundland and Labrador (the easternmost province of Canada), (E) The British Isles, and (F) Iceland. Projection: Geographic Latitude-Longitude; datum: WGS84; planar unit: arc degrees.
Water 12 02989 g011
Figure 12. Cross-extremograms for the reference period from 1948 to 2017 of the bivariate daily time series X (NAOI) and Y (rainfall) for (a) X and Y upper tails, and for (b) the lower tail in X and the upper tail in Y (vertical axes cut off at 0.60). Horizontal red dashed lines indicate the upper 97.5% empirical confidence bands ( α of 5%).
Water 12 02989 g012
Figure 13. Dimensionless yearly number of exceedances (horizontal axis) in each hydrological year, from 1948/49 to 2016/17, for each of the weighted regionalised daily rainfall series (F1-SOU, blue circles; F2-CEN, red squares; F3-NOR, green triangles) and their corresponding NAOI DJFM (vertical axis). Boxplots constructed based on the NAOI DJFM on an annual basis for three exceedances categories: less than one exceedance per year, from one to two exceedances per year, and more than two exceedances per year.
Water 12 02989 g013
Table 1. The forty rain gauges utilised. Identification (code and name), coordinates (WGS84), elevation, areal influence according to the Voronoi polygons method, and the region to which they belong from the factor analysis.
CodeNameCoordinateElevation (m.a.s.l.)Areal Influence (km 2 )Factor-Region
Latitude NLongitude W
ST01Areeiro32 43 11 16 55 01 1610.113.67F2-CEN
ST02Bica da Cana32 45 22 17 03 19 1560.222.05F2-CEN
ST03Bom Sucesso32 39 43 16 53 45 292.06.98F1-SOU
ST04Cabeço do Meio-Nogueira32 44 08 16 53 55 995.34.07F2-CEN
ST05Camacha-Valparaiso32 40 34 16 50 31 675.228.57F1-SOU
ST06Canhas32 41 39 17 06 35 400.425.19F1-SOU
ST07Caniçal32 44 14 16 44 19 16.211.34F3-NOR
ST08Caramujo32 46 09 17 03 30 1214.530.41F2-CEN
ST09Cascalho32 49 44 16 55 30 430.41.83F3-NOR
ST10Chão dos Louros Encumeadas32 45 25 17 01 04"895.29.54F2-CEN
ST11Covão ETA32 40 29 16 57 46 510.122.45F1-SOU
ST12Curral das Freiras32 44 44 16 57 35 787.420.08F2-CEN
ST13Encumeada de São Vicente32 45 01 17 01 00 900.21.12F2-CEN
ST14Encumeadas Casa EEM32 45 14 17 01 15 1010.52.32F2-CEN
ST15ETA São Jorge32 48 57 16 55 33 500.510.42F3-NOR
ST16Fajã Penedo32 47 31 16 57 36 620.523.83F3-NOR
ST17Funchal Observatório32 38 51 16 53 32 58.27.08F1-SOU
ST18Lapa Branca-Curral das Freiras32 43 08 16 57 53"610.222.45F2-CEN
ST19Lido-Cais do Carvão32 38 11 16 56 11 20.54.98F1-SOU
ST20Lombo Furão32 44 56 16 54 39 994.513.61F2-CEN
ST21Loural32 46 21 17 01 45 368.119.37F2-CEN
ST22Lugar de Baixo32 40 44 17 04 59 15.110.94F1-SOU
ST23Meia Serra32 42 07 16 52 12 115.312.47F2-CEN
ST24Montado do Pereiro32 42 06 16 53 02 1261.06.53F2-CEN
ST25Poiso-Posto Florestal32 42 46 16 53 13 1360.24.60F2-CEN
ST26Ponta de São Jorge32 50 01 16 54 24 266.56.15F3-NOR
ST27Ponta Delgada32 49 16 16 59 31 123.317.26F3-NOR
ST28Porto do Moniz32 50 57 17 09 46 64.380.65F3-NOR
ST29Queimadas32 46 59 16 54 07 881.434.66F3-NOR
ST30Rabaçal32 45 30 17 07 51 1233.4101.10F2-CEN
ST31Ribeira Brava32 40 26 17 03 46 25.424.13F1-SOU
ST32Ribeiro Frio32 43 51 16 52 58 1167.119.07F2-CEN
ST33Sanatório32 40 07 16 54 02 384.111.75F1-SOU
ST34Santa Catarina32 41 36 16 46 23 49.27.74F1-SOU
ST35Santa Quitéria ETA32 39 39 16 57 03 321.09.20F1-SOU
ST36Santana32 43 19 16 46 27 80.416.46F3-NOR
ST37Santo António32 40 36 16 56 45 525.310.82F1-SOU
ST38Santo da Serra32 43 33 16 49 01 660.236.08F3-NOR
ST39Serra de Água32 44 31 17 01 11 573.224.34F2-CEN
ST40Vale da Lapa32 49 37 16 55 40 347.05.31F3-NOR
Publisher’s Note: MDPI stays neutral with regard to jurisdictional claims in published maps and institutional affiliations.