Article

Influence of Erodible Beds on Shallow Water Hydrodynamics during Flood Events

Department of Civil Engineering, Hydraulics, Energy and Environment, Universidad Politécnica de Madrid, 28040 Madrid, Spain
*
Author to whom correspondence should be addressed.
Water 2020, 12(12), 3340; https://doi.org/10.3390/w12123340
Submission received: 22 October 2020 / Revised: 23 November 2020 / Accepted: 23 November 2020 / Published: 28 November 2020
(This article belongs to the Special Issue Planning and Management of Hydraulic Infrastructure)

Abstract

:
Flooding has become the most common environmental hazard, causing casualties and severe economic losses. Mathematical models are a useful tool for flood control, and current computational resources let us simulate flood events with two-dimensional (2D) approaches. An open question is whether bed erosion must be accounted for when it comes to simulating flood events. In this paper we answer this question through numerical simulations using the 2D depth-averaged shallow-water equations. We analyze the effect of mobile beds on the flow patterns during flood events. We focus on channel confluences where water flow and sediment mobilization have a marked 2D behavior. We validate our numerical simulations with laboratory experiments of erodible beds with satisfactory results. Moreover, our sensitivity analysis indicates that the bed roughness model has a great influence on the simulated erosion and deposition patterns. We simulate the sediment transport and its influence on the water flow in a real river confluence during flood events. Our simulations show that the erosion and deposition processes play an important role on the water depth and flow velocity patterns. Accounting for the mobile bed leads to smoother water depth and velocity fields, as abrupt fields for the non-erodible model emerge from the irregular bed topography. Our study highlights the importance of accounting for erosion in the simulation of flood events, and the impact on the water depth and velocity fields.

1. Introduction

The numerical simulation of flood events to model fluvial hydraulics and flood inundation areas has become a key tool to assess flood risks, effectively manage and control flood events, and evaluate practices on flood prevention, protection and mitigation—the so-called flood control. Flooding is the most common environmental risk [1], causing heavy life and economic losses. Moreover, climate change is expected to increase the intensity and frequency of extreme rainfall events that drive floods [2,3].
One of the most widely used approaches to model fluvial hydraulics at a river scale is based on the numerical solution of the one-dimensional (1D) Saint Venant equations [4]. This approach requires low computational resources, allowing us to simulate long river length. Nevertheless, the simplifying assumptions involve several drawbacks: (1) the flow is one-dimensional, (2) velocity is uniform across the cross-section, and (3) the water level is horizontal across the cross-section. Despite the simplifying assumptions of these approaches, in-channel flows are satisfactorily simulated by 1D models. However, out-of-bank flows or singular elements such as channel junctions or bridge piers incorporating two- and three-dimensional (3D) effects may not be satisfactorily described by 1D approaches [5].
Currently, the development of computational capacity has allowed us to simulate fluvial hydraulics with approaches based on the two-dimensional (2D) Shallow-Water Equations. These approaches have emerged as a robust and efficient tool for the simulation of flow on both natural and man-made environments [6]. Moreover, sophisticated 2D hydrodynamic codes have recently become available, as for instance, Delf3D-FLOW [7] or Iber [8,9,10]. The approach relies on the assumption of depth-averaged velocity and, in most cases, quasi-hydrostatic flow pressure, which involves neglecting vertical acceleration. Although this assumption has been identified as a source of error in flows in non-prismatic channels [11], over curved beds in 1D [12] and 2D simulations [13,14], or channel configurations with vertical water circulation [15], the approach is suitable for modeling the hydrodynamics of flood events.
While 2D Shallow-Water models may naturally incorporate well resolved bed topography on flow hydrodynamics, most numerical studies of flood events so far have neglected changes in bed topography on the water flow dynamics during flood events. Much effort has been focused on the long-term bed erosion patterns and the evolution of river morphologies over time scales of years or decades, such as the formation of bars in alluvial channels [16], the bedload transport in river confluences [17,18], the riverbank migration and island dynamics [19], or at a basin scale [20]. However, erosion during flood events may significantly modify bed topography [21,22], even leading to the formation of canyons by a single flood event [23]. The hydrodynamics, sediment transport processes and river morphology are strongly coupled in rivers and channels with erodible beds and cannot be studied in isolation [24]. Mathematical models should then interlink these three processes through fully coupled approaches.
A paradigmatic case of bed erosion on both natural and man-made environments are the river and channel confluences. Junctions of two open channels or rivers are common configurations present in many hydraulic structures such as urban channels [25], tidal channels [26], tidal river confluences [27], irrigation channels or river confluences. The morphological progress of river bathymetry is significantly influenced by turbulent flow structures associated with dunes [28], junctions of channels with different depths [29] or discordant channels [30,31,32], indicating that these structures may play a key role in the upstream erosion patterns under subcritical flows. Flow dynamics at channel junctions have been characterized with laboratory or field experiments, aimed at the characterization of the flow-separation zone [33] and the effect of curved profiles [34], the contaminant transport with lab experiments [35] or field studies [36,37], the development computational approaches [38,39], or providing benchmark experimental data sets [40]. Erosion patterns at junctions have also been experimentally characterized in channels with [41,42] or without [43,44,45] sediment supply.
Flow dynamics at junctions are characterized by six regions [43], as shown in Figure 1; of particular interest among them are the separation zone in the main channel intermediately downstream of the junction [33], and the shear plane between the two flows in the main channel [46,47]. In the separation zone the water depth depresses and a recirculating flow appears. The shear plane is characterized by high turbulence levels that generate quasi-two-dimensional vortices with near-vertical axes [48,49].
Steady-state bed bathymetry at junctions presents two salient morphological features [50]: a scour-hole on the downstream corner of the junction, and a bar on the left bank closed to the downstream side of the confluence, denoted as a bank-attached lateral bar. Scour hole depth varies non-linearly with the confluence angle [45,51,52]. The bar appears due to the lower water depth and recirculating flow in the separation zone, as well as the flow detaches from the left sidewall downstream of the junction. Moreover a helicoidal flow emerges in the main channel downstream of the junction [50], which is responsible for the movement of water in the vertical direction and the concentration of the finest sediments in the bar [45].
In this study we assess the effect of mobile beds on the flow patterns during flood events. Our case study is a river confluence in a semiarid basin located in southeast Spain. Our main objective is to determine whether erosion should be accounted for or not to simulate fluvial hydraulics during flood events. To validate our numerical model, we compare our simulated results with laboratory experiments of sediment transport at channel confluences. In particular, we focus on two laboratory setups: (1) a set of experiments without mobile beds to validate the hydraulic model, and (2) an experiment of dynamics of bed morphology to validate the erosion model. We test those predictions against the experiments and identify the sources of model discrepancy. Lastly, we take advantage of the mathematical model to evaluate the effect of mesh size and bed properties on the erosion patterns.

2. Materials and Methods

We use the freely available Iber code [8,53]. Iber is a 2D hydraulic model that solves the hydrodynamic equations coupled to the sediment transport equations, among others. In the following sections, we describe the hydrodynamic equations and the erosion model.

2.1. Two-Dimensional Depth-Integrated Shallow-Water Equations (SWE)

Iber solves the 2D SWE using a finite volume scheme. This scheme is able to handle unstructured meshes, irregular topographies, friction losses, and wet-dry fronts [53]. The 2D SWE are derived from the Navier–Stokes equations by assuming quasi-hydrostatic flow and incompressibility of water. The 2D mass conservation equation in a Cartesian coordinate system reads:
h t + h U x x + h U y y = S q
where h is the water depth, t is time, ( U x , U y ) is the depth-averaged velocity in the x and y-directions, and S q are the sources or sinks.
The linear momentum conservation equation in a Cartesian coordinate system is given by:
h U x t + x h U x 2 + g h 2 2 + y h U x U y = g h Z b x τ b , x ρ + x ν t h U x x + y ν t h U x y ,
and
h U y t + y h U y 2 + g h 2 2 + x h U x U y = g h Z b y τ b , y ρ + x ν t h U y x + y ν t h U y y ,
where g is the gravity, Z b is the channel-bottom elevation, τ b is the bed friction, ρ is the density of the water, and ν t is the eddy viscosity. We neglect wind surface tractions and Coriolis force. τ b is computed through the Manning formulation as:
τ b , j = ρ g h n 2 U j U h 1 / 3 ,
where j = x , y , and n is the Manning’s coefficient.
The last two terms in Equations (3) and (4) are the turbulent stresses. They are determined from the so-called k- ϵ turbulence model of Rastogi and Rodi [54]. The model consists of two differential transport equations for the turbulence kinetic energy, k, and the rate of its dissipation, ϵ . The turbulence kinetic energy is given by:
k t + U x k x + U y k y = x j ν + ν t σ k k x j + 2 ν t S i j S i j + c k u f 3 h ϵ ,
and the rate of its dissipation by:
ϵ t + U x ϵ x + U y ϵ y = x j ν + ν t σ ϵ ϵ x j + C ϵ 1 ϵ k 2 ν t S i j S i j + C ϵ u f 4 h 2 C ϵ 2 ϵ 2 k ,
where S i j is the velocity gradient, given by:
S i j = 1 2 U i x j + U j x i ,
and ν T = C μ k 2 ϵ , C k = C f , C ϵ = 3.6 C k 3 / 2 C ϵ 2 C μ , and C f = τ b ρ U 2 . The constants of the model are: C μ = 0.09 , C ϵ 1 = 1.44 , C ϵ 2 = 1.92 , σ k = 1.0 , and σ ϵ = 1.31 .

2.2. Erosion Model

Iber erosion and sediment transport module solves the non-cohesive sediment transport equations with uniform granulometries, in a non-stationary regime. The hydrodynamics, sediment transport processes, and river morphology interplay at mobile-bed confluences [55,56] and cannot be studied in isolation [24].
Iber software couples these three processes. The sediment transport process is simulated through the 2D Exner equation [57,58,59]. The equation provides the bed elevation evolution in response to the erosion and sedimentation and is given in the form of bedload and suspended load. It reads:
( 1 Φ ) Z b t + q b , j x j + ω s ( E s C b ) = 0 ,
where Φ is the porosity, q b , j is the bedload discharge along the j direction, ω s is the fall velocity of the suspended sediments, E s is the dimensionless factor of the inlet of suspended sediment, and C b is the concentration of suspended sediment on the bed.
Several formulations are available in Iber to compute the bedload solid flow rate due to the bedload transport. We have conducted our simulations with the van Rijn equation [60], given by:
q b * = 0.053 D 0.3 τ * τ c r i t * 1 2.1 ,
where q b * is the dimensionless bedload solid volumetric flow rate, D * is the dimensionless diameter of solid particles, τ * is the dimensionless shear stress acting on the particles, and τ c r i t * is the dimensionless critical shear stress.
The dimensionless bedload solid volumetric flow rate, q b * , reads:
q b * = q b ( s 1 ) g D 3 ,
being q b * the bedload solid volumetric flow rate, s is the ratio between the densities of the particles and water, s = ρ s / ρ , and D is the characteristic diameter of sediments, usually taken as the median diameter D = D 50 .
The dimensionless diameter of solid particles, D * , reads:
D * = D g ( s 1 ) ν 2 1 / 3 ,
where ν is the kinematic viscosity of water.
The dimensionless shear stress, τ * , has the form:
τ * = τ b ρ ( s 1 ) g D ,
where τ b is the bed friction shear stress, given by Equation (4).
The solid bedload flow rate equation is combined with the Shields-stress criterion for incipient motion [61] and a bed slope correction for bedload transport. Moreover, Iber simulates the suspended sediment transport with the depth-averaged convection-diffusion equation for the sediment concentration. The model accounts for the turbulent diffusion and the equilibrium suspended concentration. The latter, together with the sedimentation velocity, are computed with the van Rijn formulation [62]. In the following, we do not consider the suspended sediment transport since it is negligible compared with the bedload sediment transport.

2.3. Solution of the System of PDEs

We solve the system of Partial Differential Equations (PDEs) with a second-order numerical scheme based on the Monotonic Upwind Scheme for Conservation Laws (MUSCL) scheme [63]. High-resolution finite volume methods [64,65,66,67,68] are suitable to minimize numerical dissipation and capture complex flow patterns [69].

3. Results and Discussion. Model Validation with Laboratory-Scale Channel Junctions

3.1. Validation of the Hydraulic Model

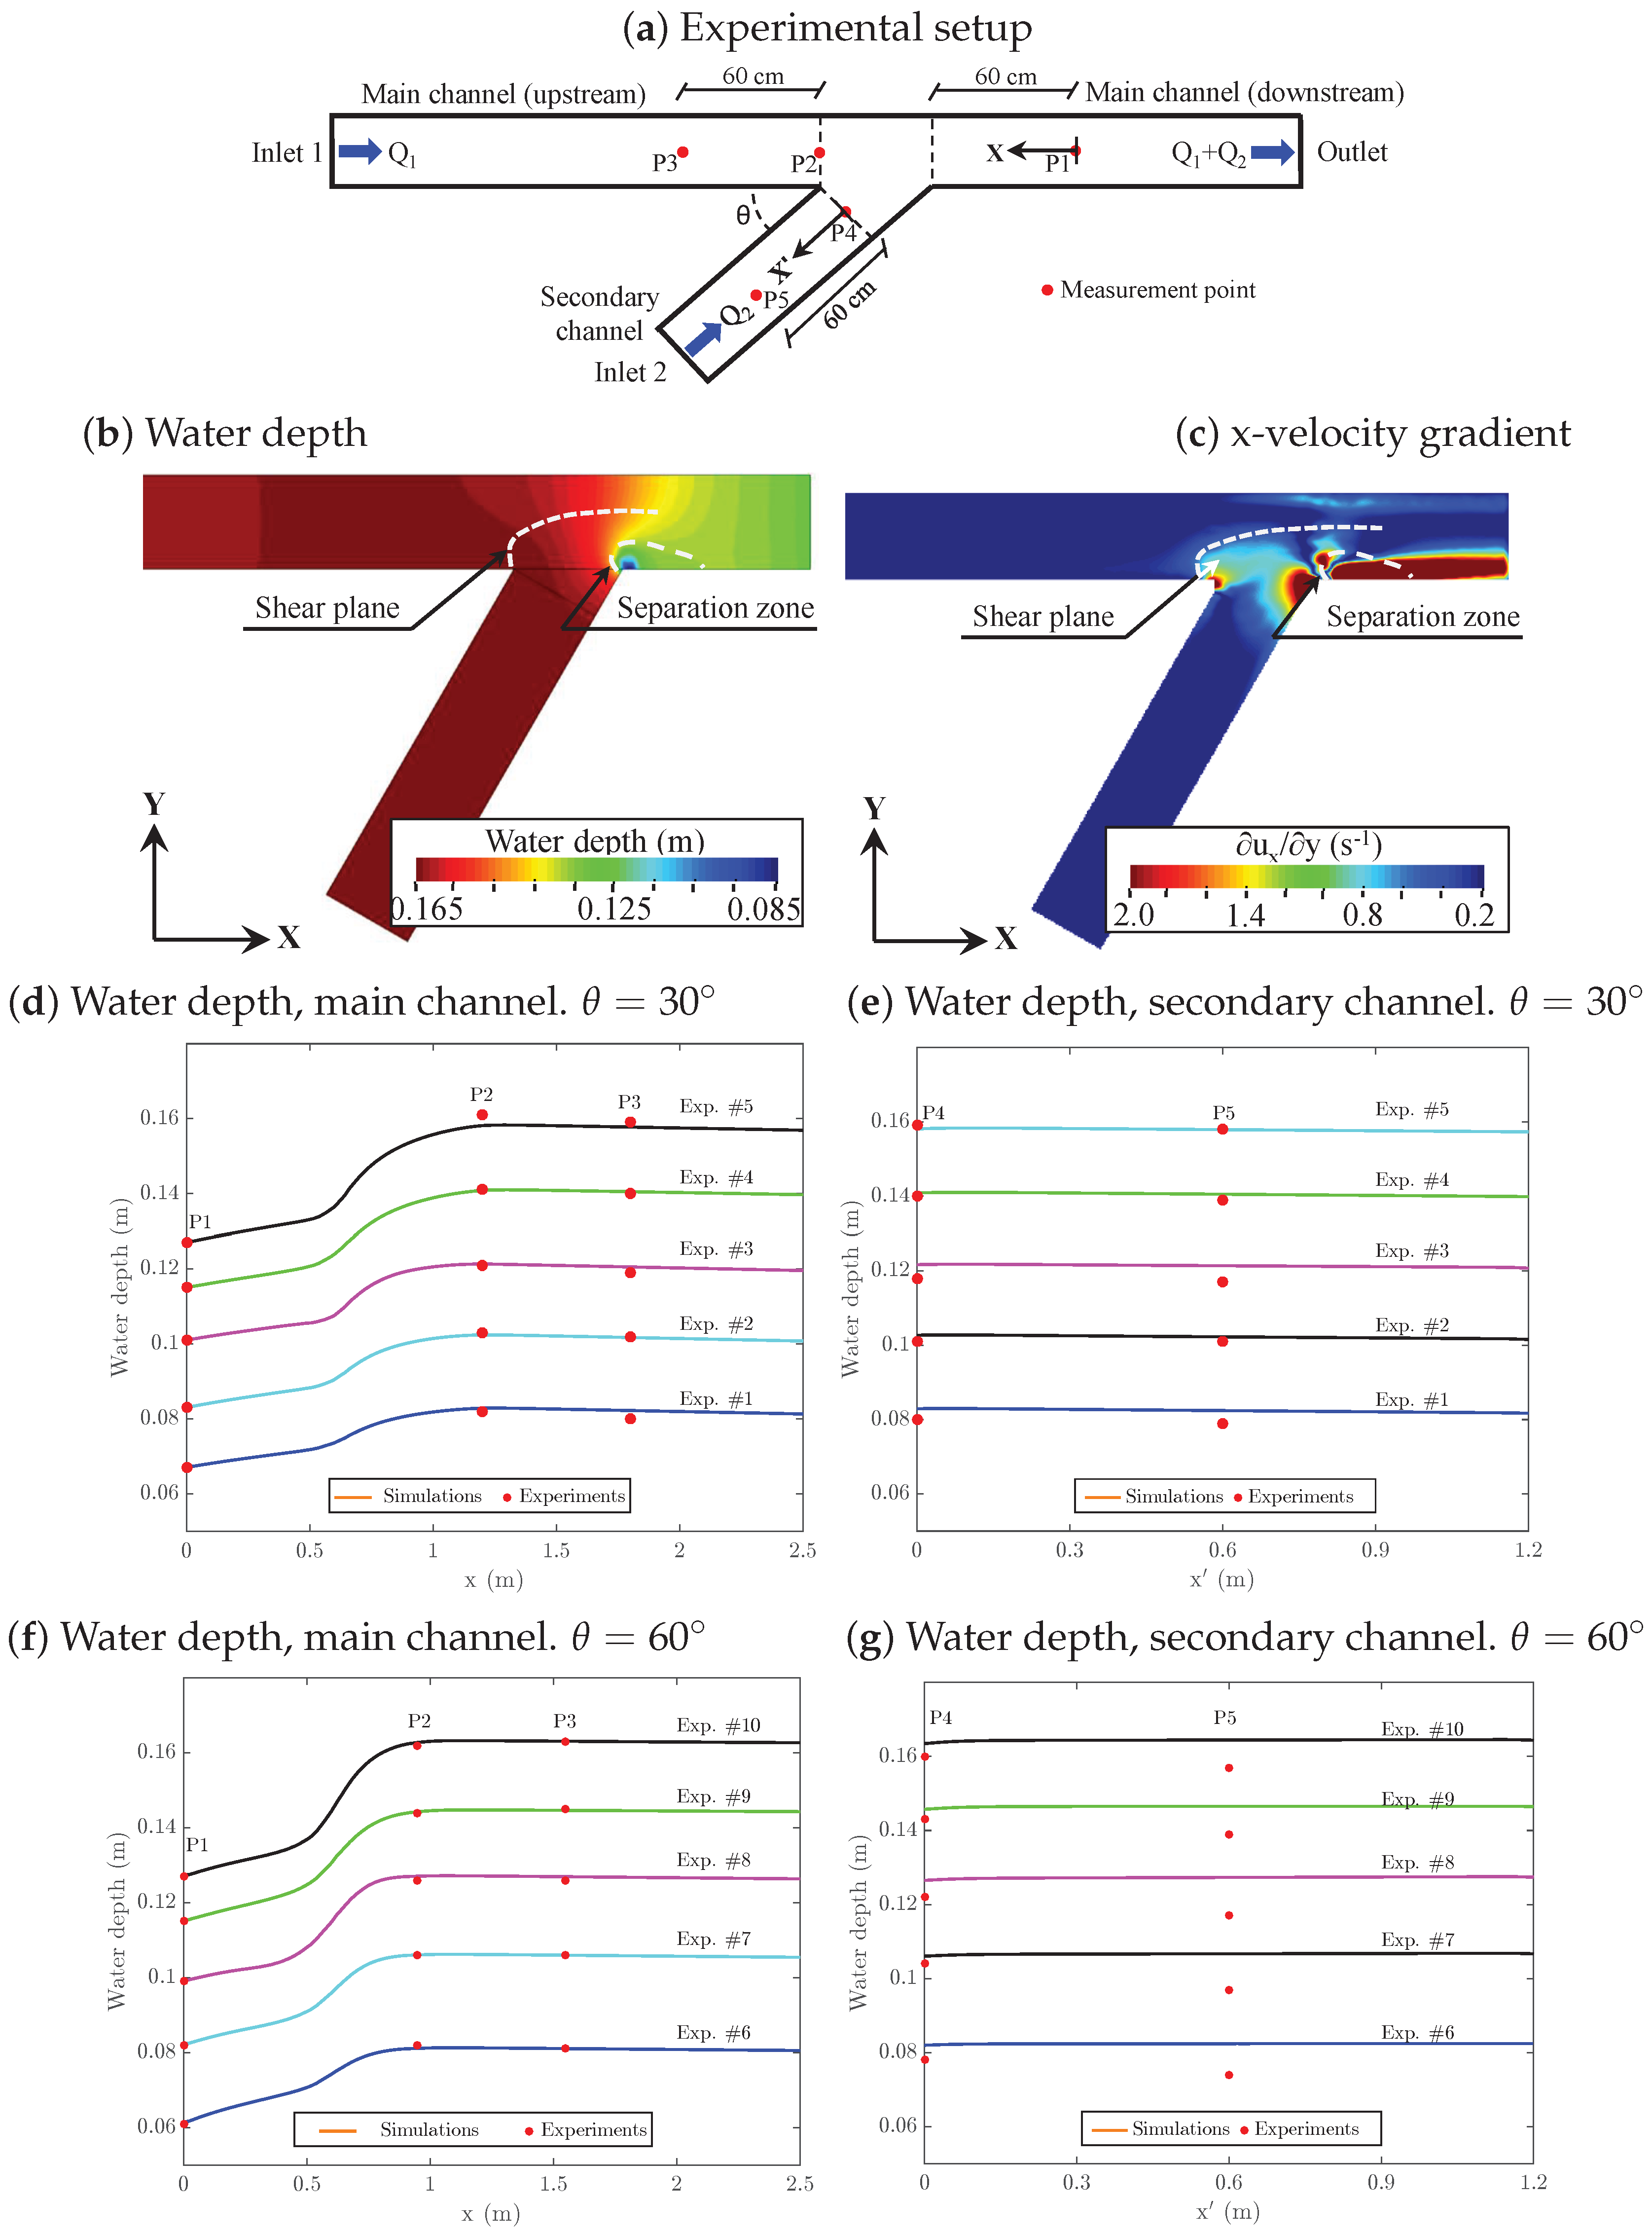
We test our hydraulic model by comparing the numerical outputs with laboratory experiments reported on the literature [70]. Although the Iber code has been previously validated with experiments of open-channel contractions with several geometries and flow regimes [71], here we compare the outputs of the model with a set of lab experiments of open-channel junctions [70]. The experiment setup is a rectangular channel confluence of 0.30 m wide, as shown in Figure 2a. The channel was made of acrylic plates and metal sheets. The slope in both channels was 0.14%. Water was introduced in the system through both inlets located upstream in the main and secondary channels. Water level was measured at five points. Here, we simulate the experiments under subcritical flow. The confluence angle θ between the main and secondary channels θ is 30 and 60 . The simulated experiments are listed on Table 1, as well as the flow rates and water levels measured at five points.
Laboratory experiments have characterized the flow behavior at the junction of rectangular channels [33,34,38,39,40]. Briefly, flow dynamic is characterized by six regions [43], of which the separation zone in the main channel intermediately downstream of the junction [33], and the shear plane between the two flows in the main channel are of particular interest [46,47].
Our model is able to reproduce the main flow features at channel junctions, as shown in Figure 2b,c. The momentum of the water in the secondary channel makes the flow detach from the sidewall as water gets in the main channel, and water depth decrease in the vicinity of the wall. Our model replicates this effect, as shown in Figure 2b where a depression in water depth appears at the downstream intersection of both channels and extends along the downstream direction. Another side effect of the intersection is the increase in water depth upstream the junction in both channels. Our model reproduces this effect, Figure 2b.
The interaction between both channel streams generates a shear plane that divides the main and lateral flow. We identify this plane with our numerical results by plotting the x-velocity gradient, given by U x / y , in Figure 2c. The gradient is high along the intersection of both water streams in the main channel. As expected, the gradient is especially high downstream of the junction, in the separation zone. However, since our model is 2D depth-averaged, it is unable to reproduce the helicoidal flow that appears downstream of the junction in the main channel [50]. The helicoidal flow is responsible for the movement of water in the vertical direction and may influence the erosion patterns.
We compare the output of our numerical model with the results of the laboratory experiment listed ih,n Table 1 in Figure 2d,e for the channel junction with θ = 30 . The agreement between the five experiments and the simulations is remarkable. Such agreement is also satisfactory for the channel junction with θ = 60 , depicted in Figure 2f,g. Nevertheless, the numerical results at point P5 slightly deviate from the lab experiments for this channel configuration. However, the agreement between experiments and numerical simulations at point P5 is very satisfactory for the channel junction with θ = 60 .

3.2. Validation of the Erosion Model

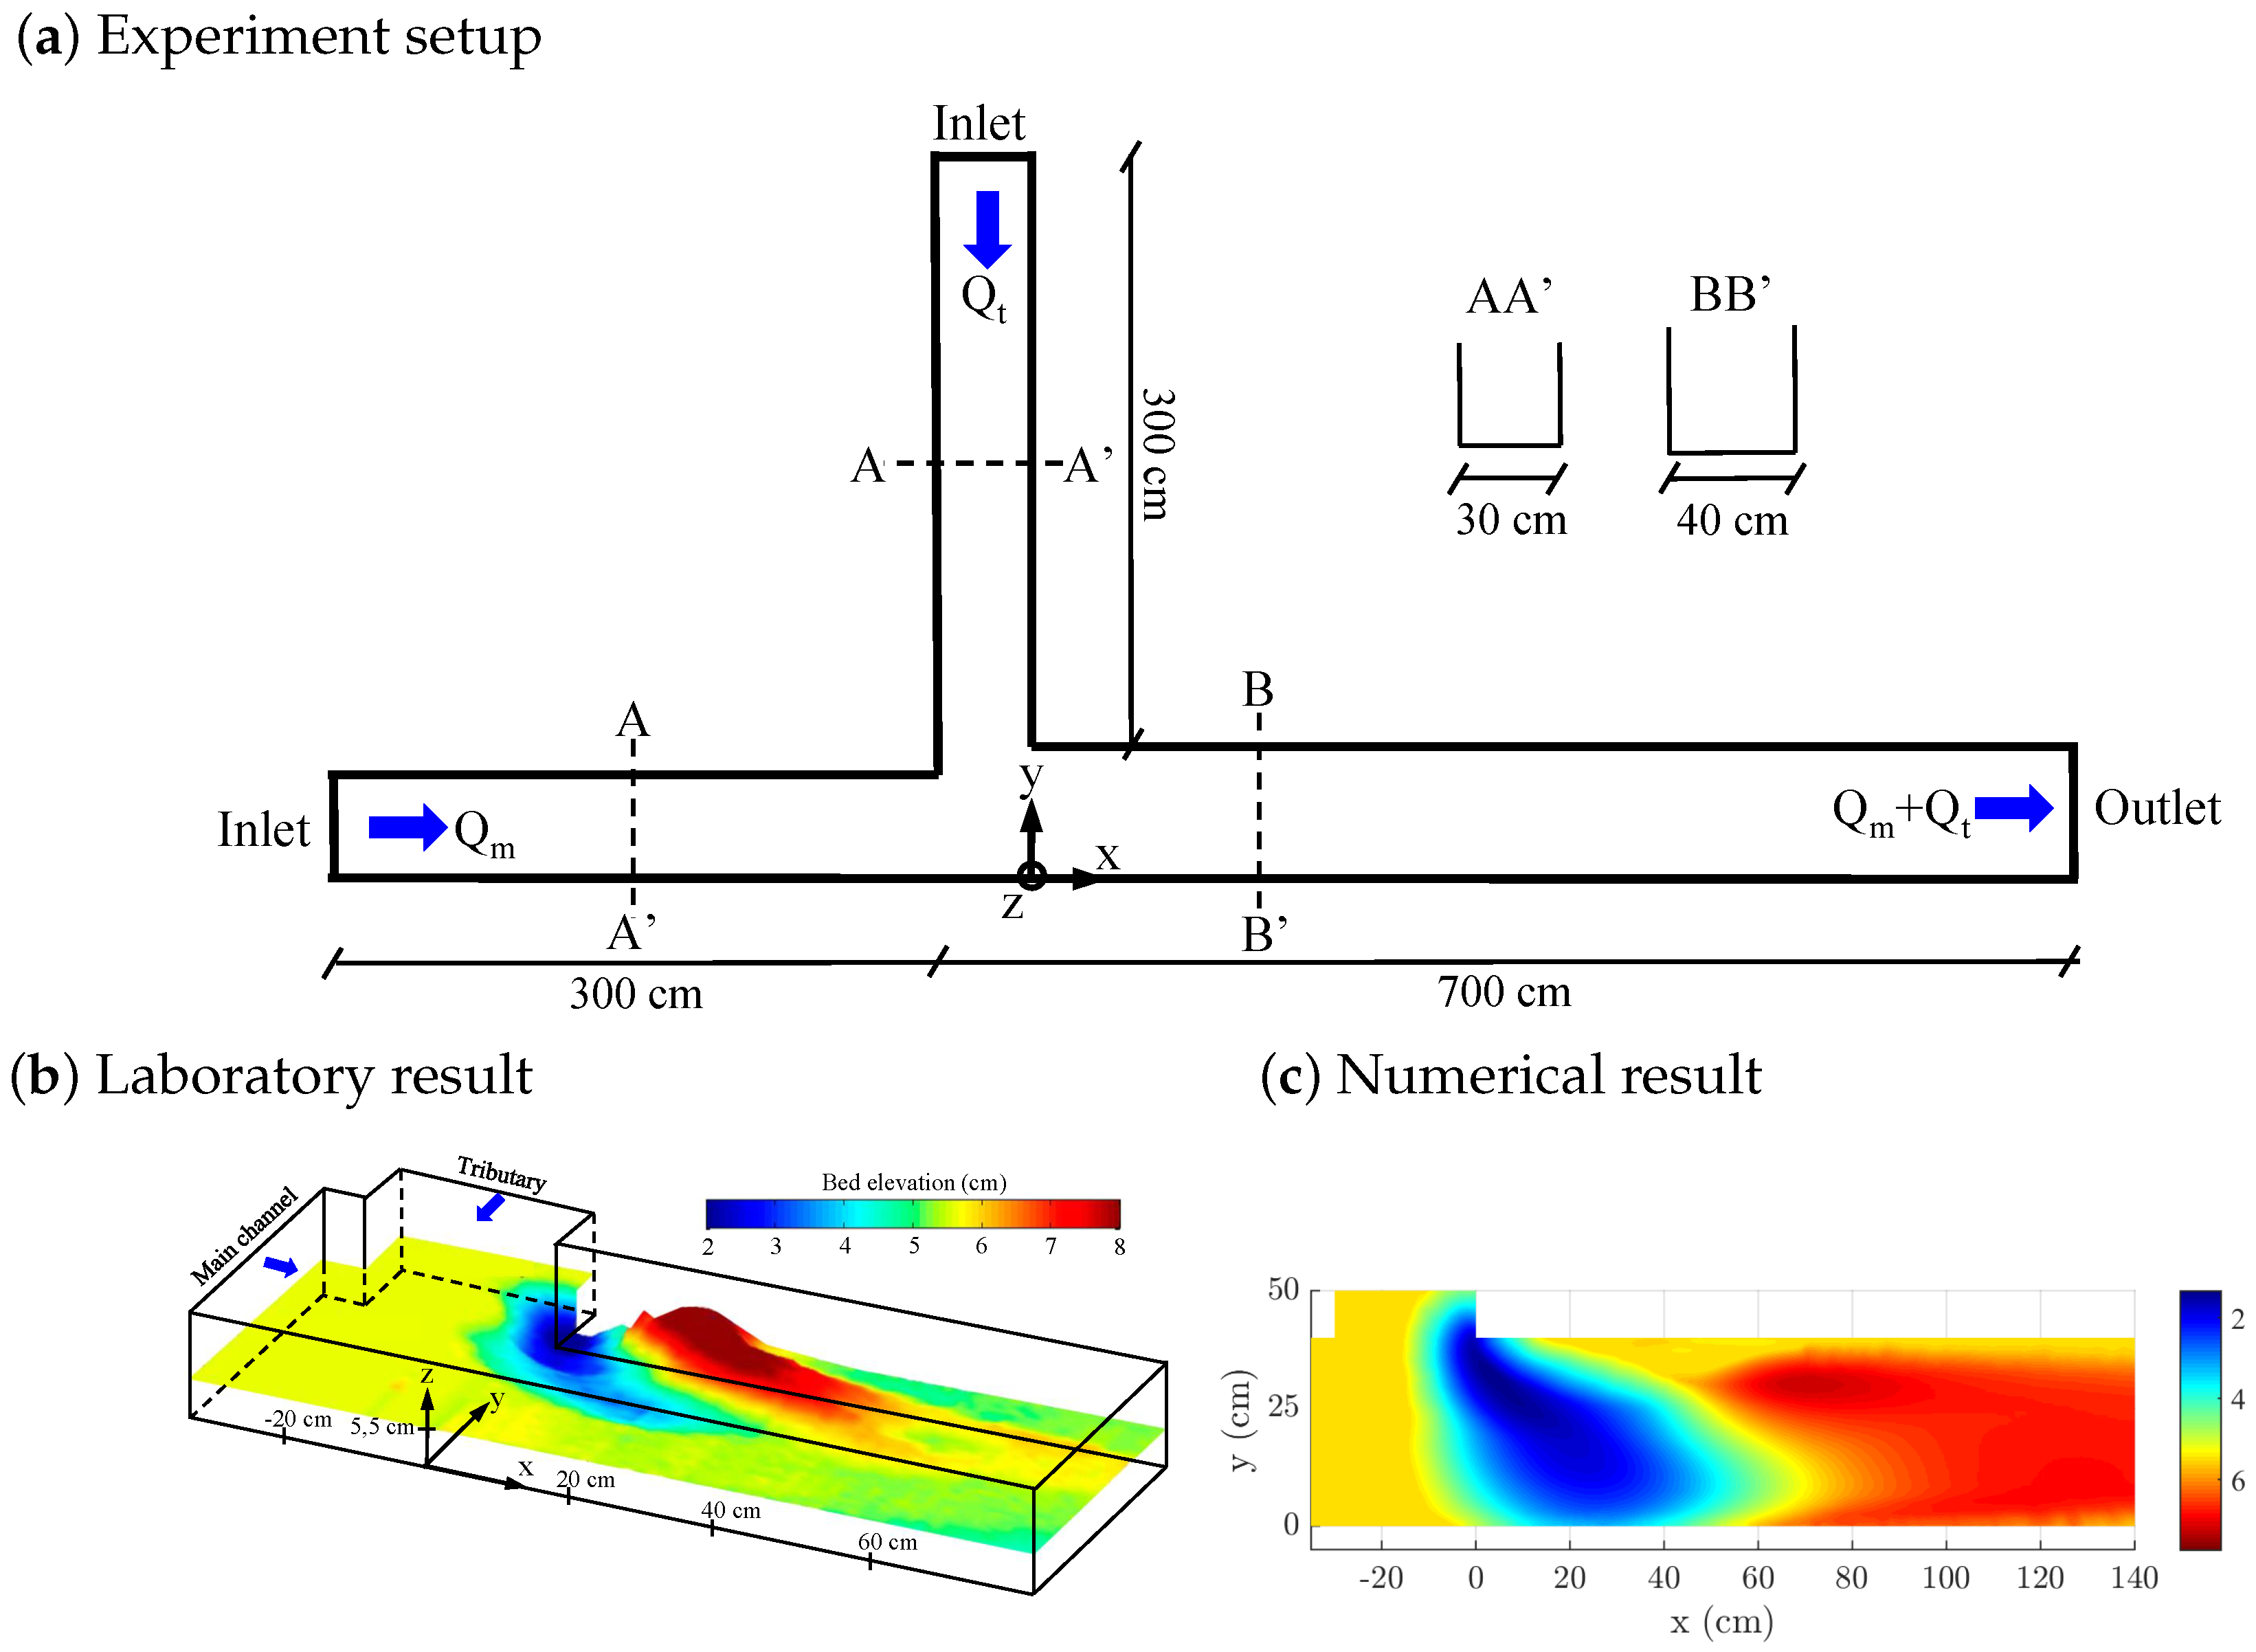
Our next validation experiment was conducted by Yuan et al. [45]. The authors studied the dynamics of bed morphology in channel confluences through laboratory experiments under subcritical flow conditions. The setup consisted of a perpendicular confluence of rectangular concordant-bed open-channels, the dimensions of which are shown in Figure 3a. The inlet flow rates of the simulated experiment are Q m = 9 L/s and Q t = 6 L/s. The bed sediment was poorly sorted with D 50 = 0.9 mm, and D 90 = 2.5 mm, and the bed was initially covered with a 5.5 cm-thick layer of sediment. In our numerical simulations, we got the best agreement between experiments and numerical simulations with the following properties of the sediments: density of grains ρ = 2500 kg/m 3 , friction angle ϕ = 25 , and Manning’s coefficient n = 0.018 s·m 1 / 3 . The steady-state bed elevation contour is shown in Figure 3b, we remind the initial bed elevation was 5.5 cm.
Our 2D numerical model is suitable to replicate this experiment. The eddy development process in the shear layer takes place in a quasi-horizontal plane [46] in concordant-bed confluences, and vortices are then quasi-two-dimensional with near-vertical axes [48,49]. The two-dimensional nature of the shear layer may disappear in discordant-bed confluences [30,31].
We depict the steady-state bed elevation contour plot computed with our mathematical model in Figure 3c. The profile presents two morphological features [50]: a scour-hole at the downstream corner of the confluence, and a sediment bar on the left bank immediately downstream of the confluence. The mathematical model is able to reproduce both features, as shown in Figure 3c.
The scour hole depth is similar in both models, experimental and numerical, with a maximum depth of about 2 cm. The experiment is highly sensitive to the depth, since it increases with the confluence angle [45,51] in a non-linear fashion [52]. However, the extension of the hole slightly differs in both models. The experiment shows the hole extends up to the central axis of the main channel, whereas the numerical model provides a hole that extends up to the left bank. Under certain conditions, experiments also show scour holes that expand up to the bank [50].
The sediment bar on the left bank downstream confluence, also denoted as a bank-attached lateral bar, is also reproduced in both the experiment and the numerical model. The sediment bar appears due to the lower water depth and recirculating flow in the separation zone, as well as from the flow detached from the left sidewall. The experiment results in a higher and more concentrated bar than the dimensions computed with the mathematical model. Since our mathematical model is depth-averaged, it is unable to reproduce the helicoidal flow that emerges downstream of the junction in the main channel [50]. The helicoidal flow is responsible for the movement of water in the vertical direction and may concentrate the sediments resulting in a higher and narrower bar. Moreover, the van Rijn model for bedload transport [60] characterizes the sediments with the median diameter ( D 50 ) and disregards the variance of the diameter distribution. Bank-attached lateral bars are made of the finest sediments [45], which our model is unable to consider because the variance of the sediment diameter is ignored.
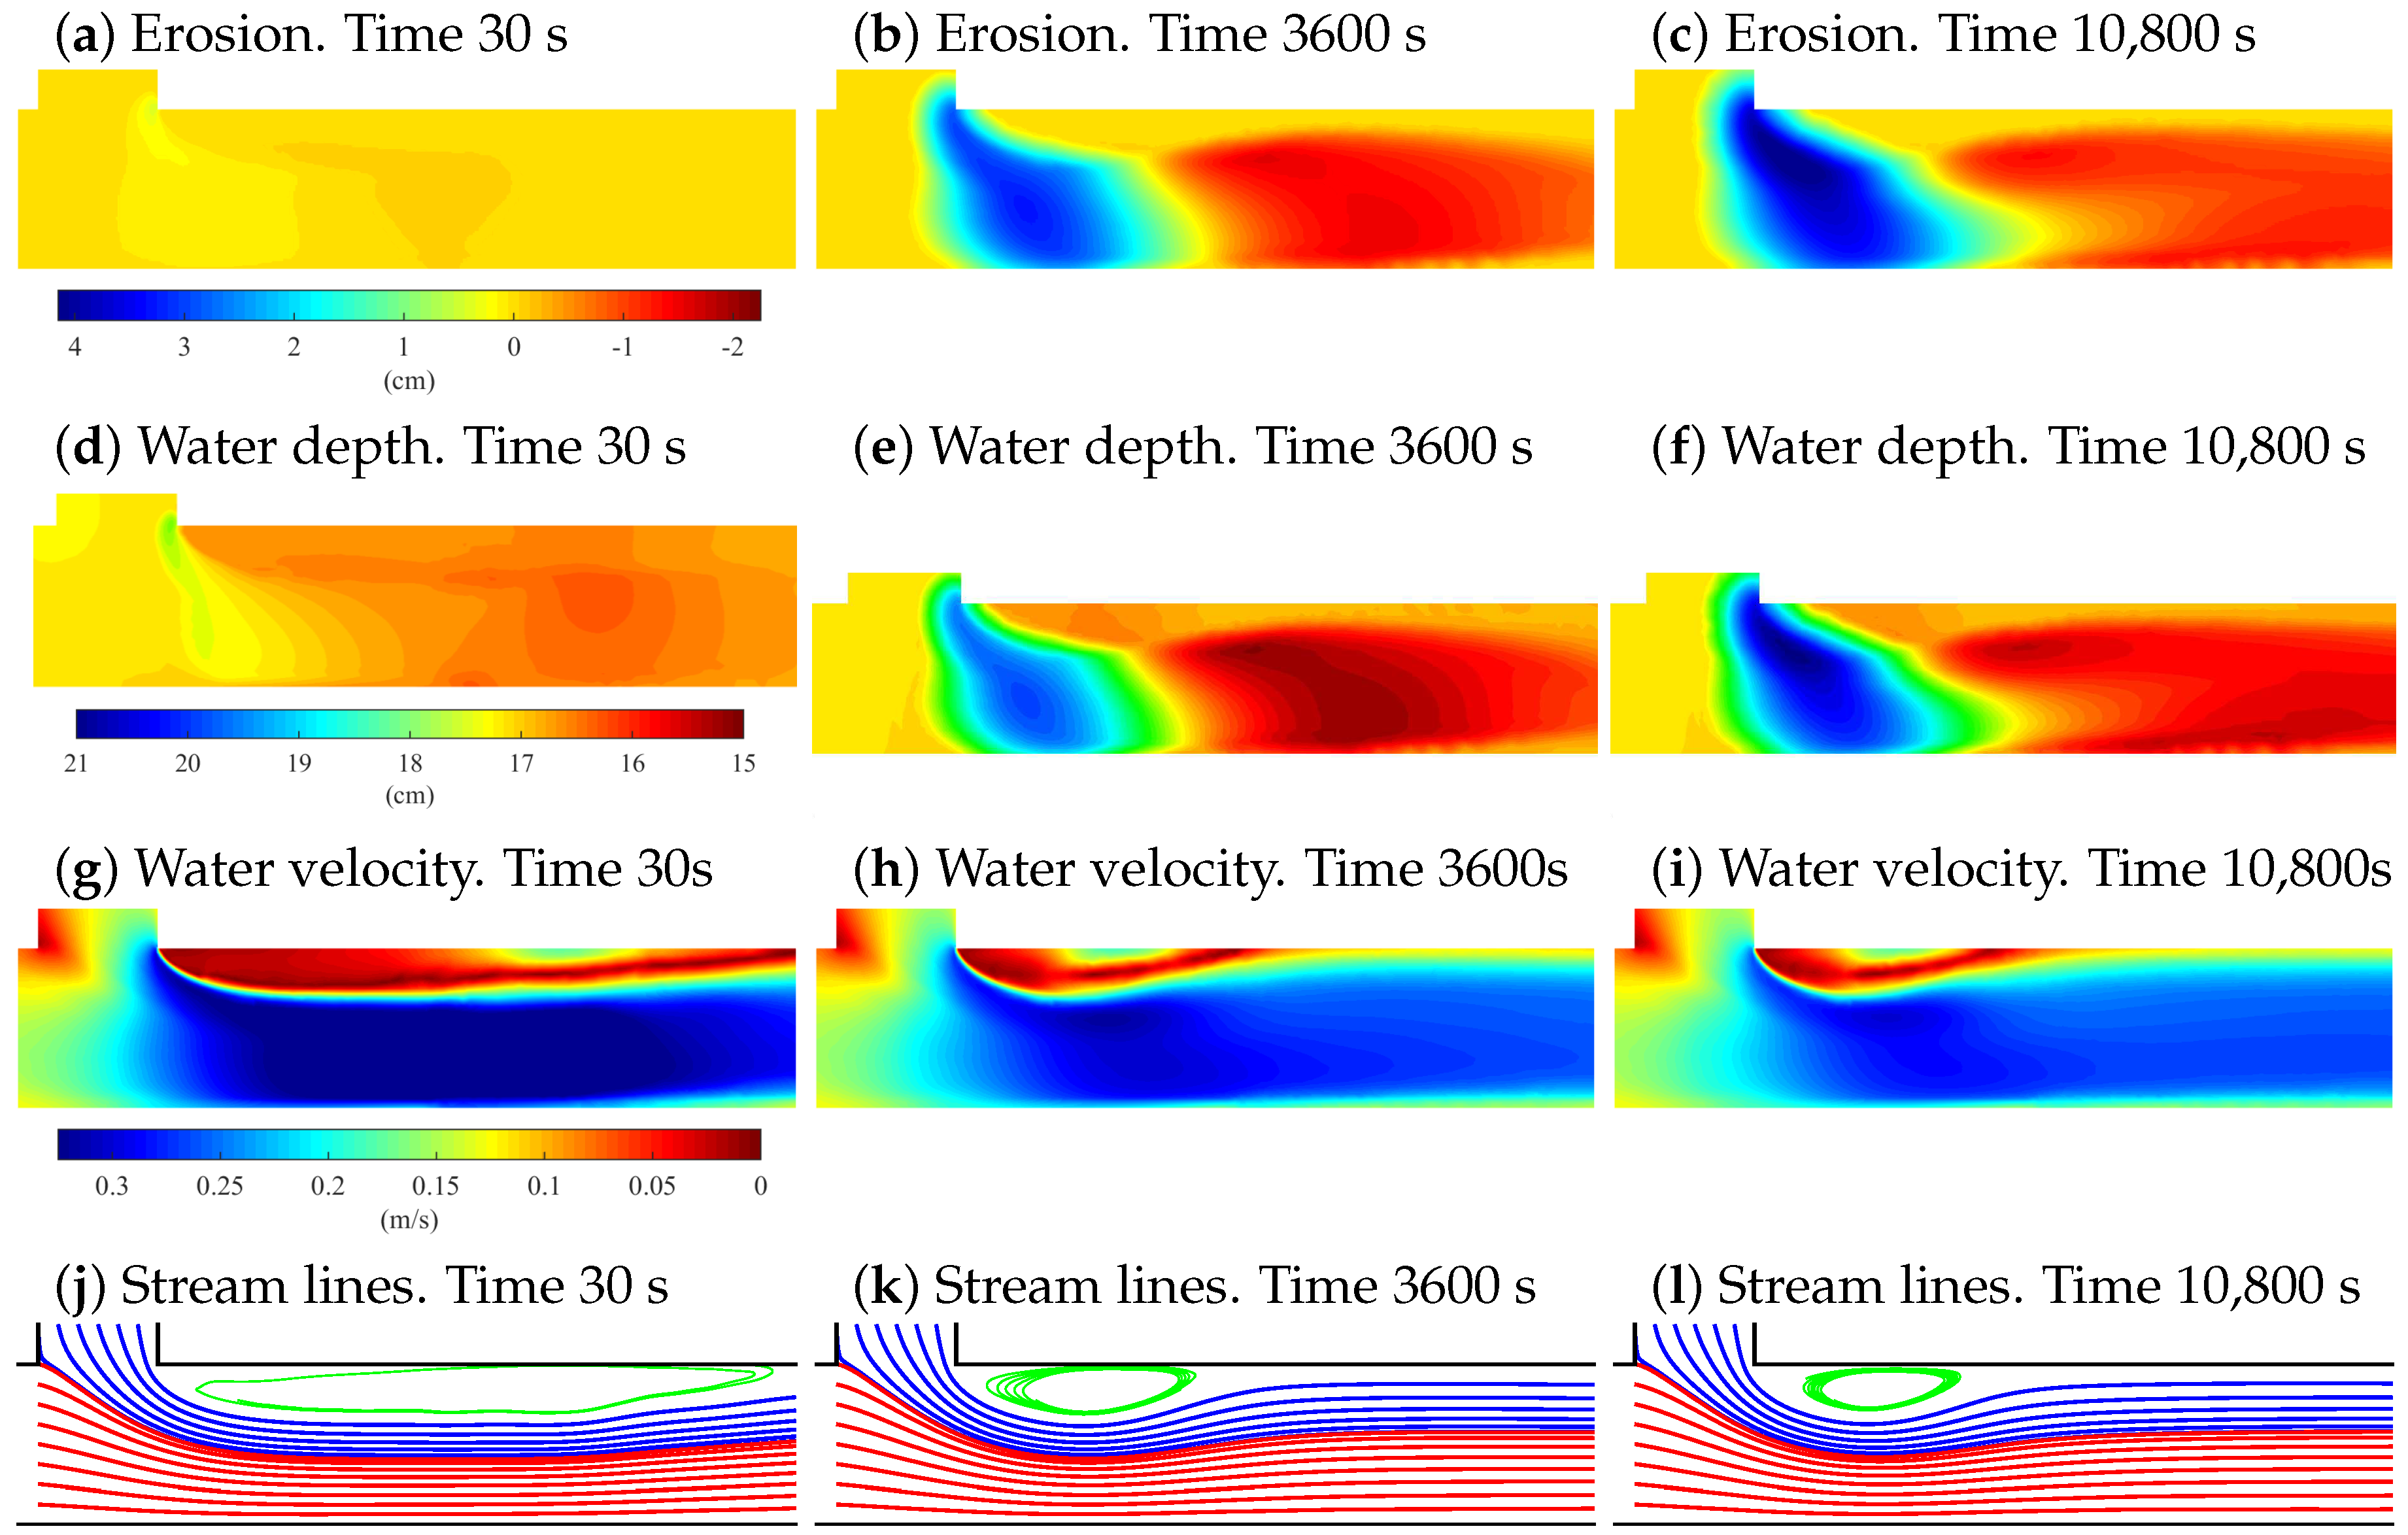
The evolution of the bed elevation, water head, water velocity, and stream lines provided by the numerical model are depicted in Figure 4. Initially, the bed elevation is 5.5 cm, as shown in Figure 4a, which provides an almost constant water head everywhere except in the separation zone, i.e., the downstream corner of the confluence (Figure 4d). Under this situation, the velocity contour plot shows a clear shear layer in the separation zone, as shown in Figure 4g, and the highest velocities are given downstream of the confluence in the main channel. The streamline plot shows how water recirculates inside the circulation zone, as shown in Figure 4i. Moreover, this zone extends up to 1.6 m downstream of the junction.
After 3600 s, the bed topography has changed significantly. The scour hole depth is up to 3 cm and the extension is almost the definitive, and slight sedimentation appears downstream of the hole (Figure 4b). The water depth increases in the area of the scour hole due to the erosion, but increases downstream of the hole because of sedimentation (Figure 4e). The water velocity is also affected by the bed elevation evolution. The velocity decreases in the scour hole area thanks to the erosion, but also water slows down downstream of the hole due to the contraction of the recirculation zone that increases the effective channel width (Figure 4h). The contraction of the recirculation zone is well represented in the streamline plot (Figure 4j).
The steady-state is given at time 10,800 s. The bed elevation has evolved up to create a scour hole of about 4 cm deep that extends up to the left bank and a bar in the left bank downstream of the hole (Figure 4c). The water depth increases in the scour hole due to erosion, as shown in Figure 4f, and water slows down due to the larger depth (Figure 4i). The recirculation zone contracts slightly compared with the previously analyzed time step (Figure 4l).

3.3. Sensitivity Analysis

We take advantage of our mathematical model to study the erosion patterns as a function of the mesh computational size and the bed properties—friction angle of sediments and roughness. In the following subsection we present and discuss the results of a mesh refinement study and the effect of the friction angle of the sediments and roughness on the erosion patterns. The properties of the sediments and the bed are: D 50 = 0.9 mm, n = 0.018 s·m 1 / 3 , ϕ = 25 , ρ = 2500 kg/m 3 , unless otherwise indicated.

3.3.1. Mesh Refinement Study

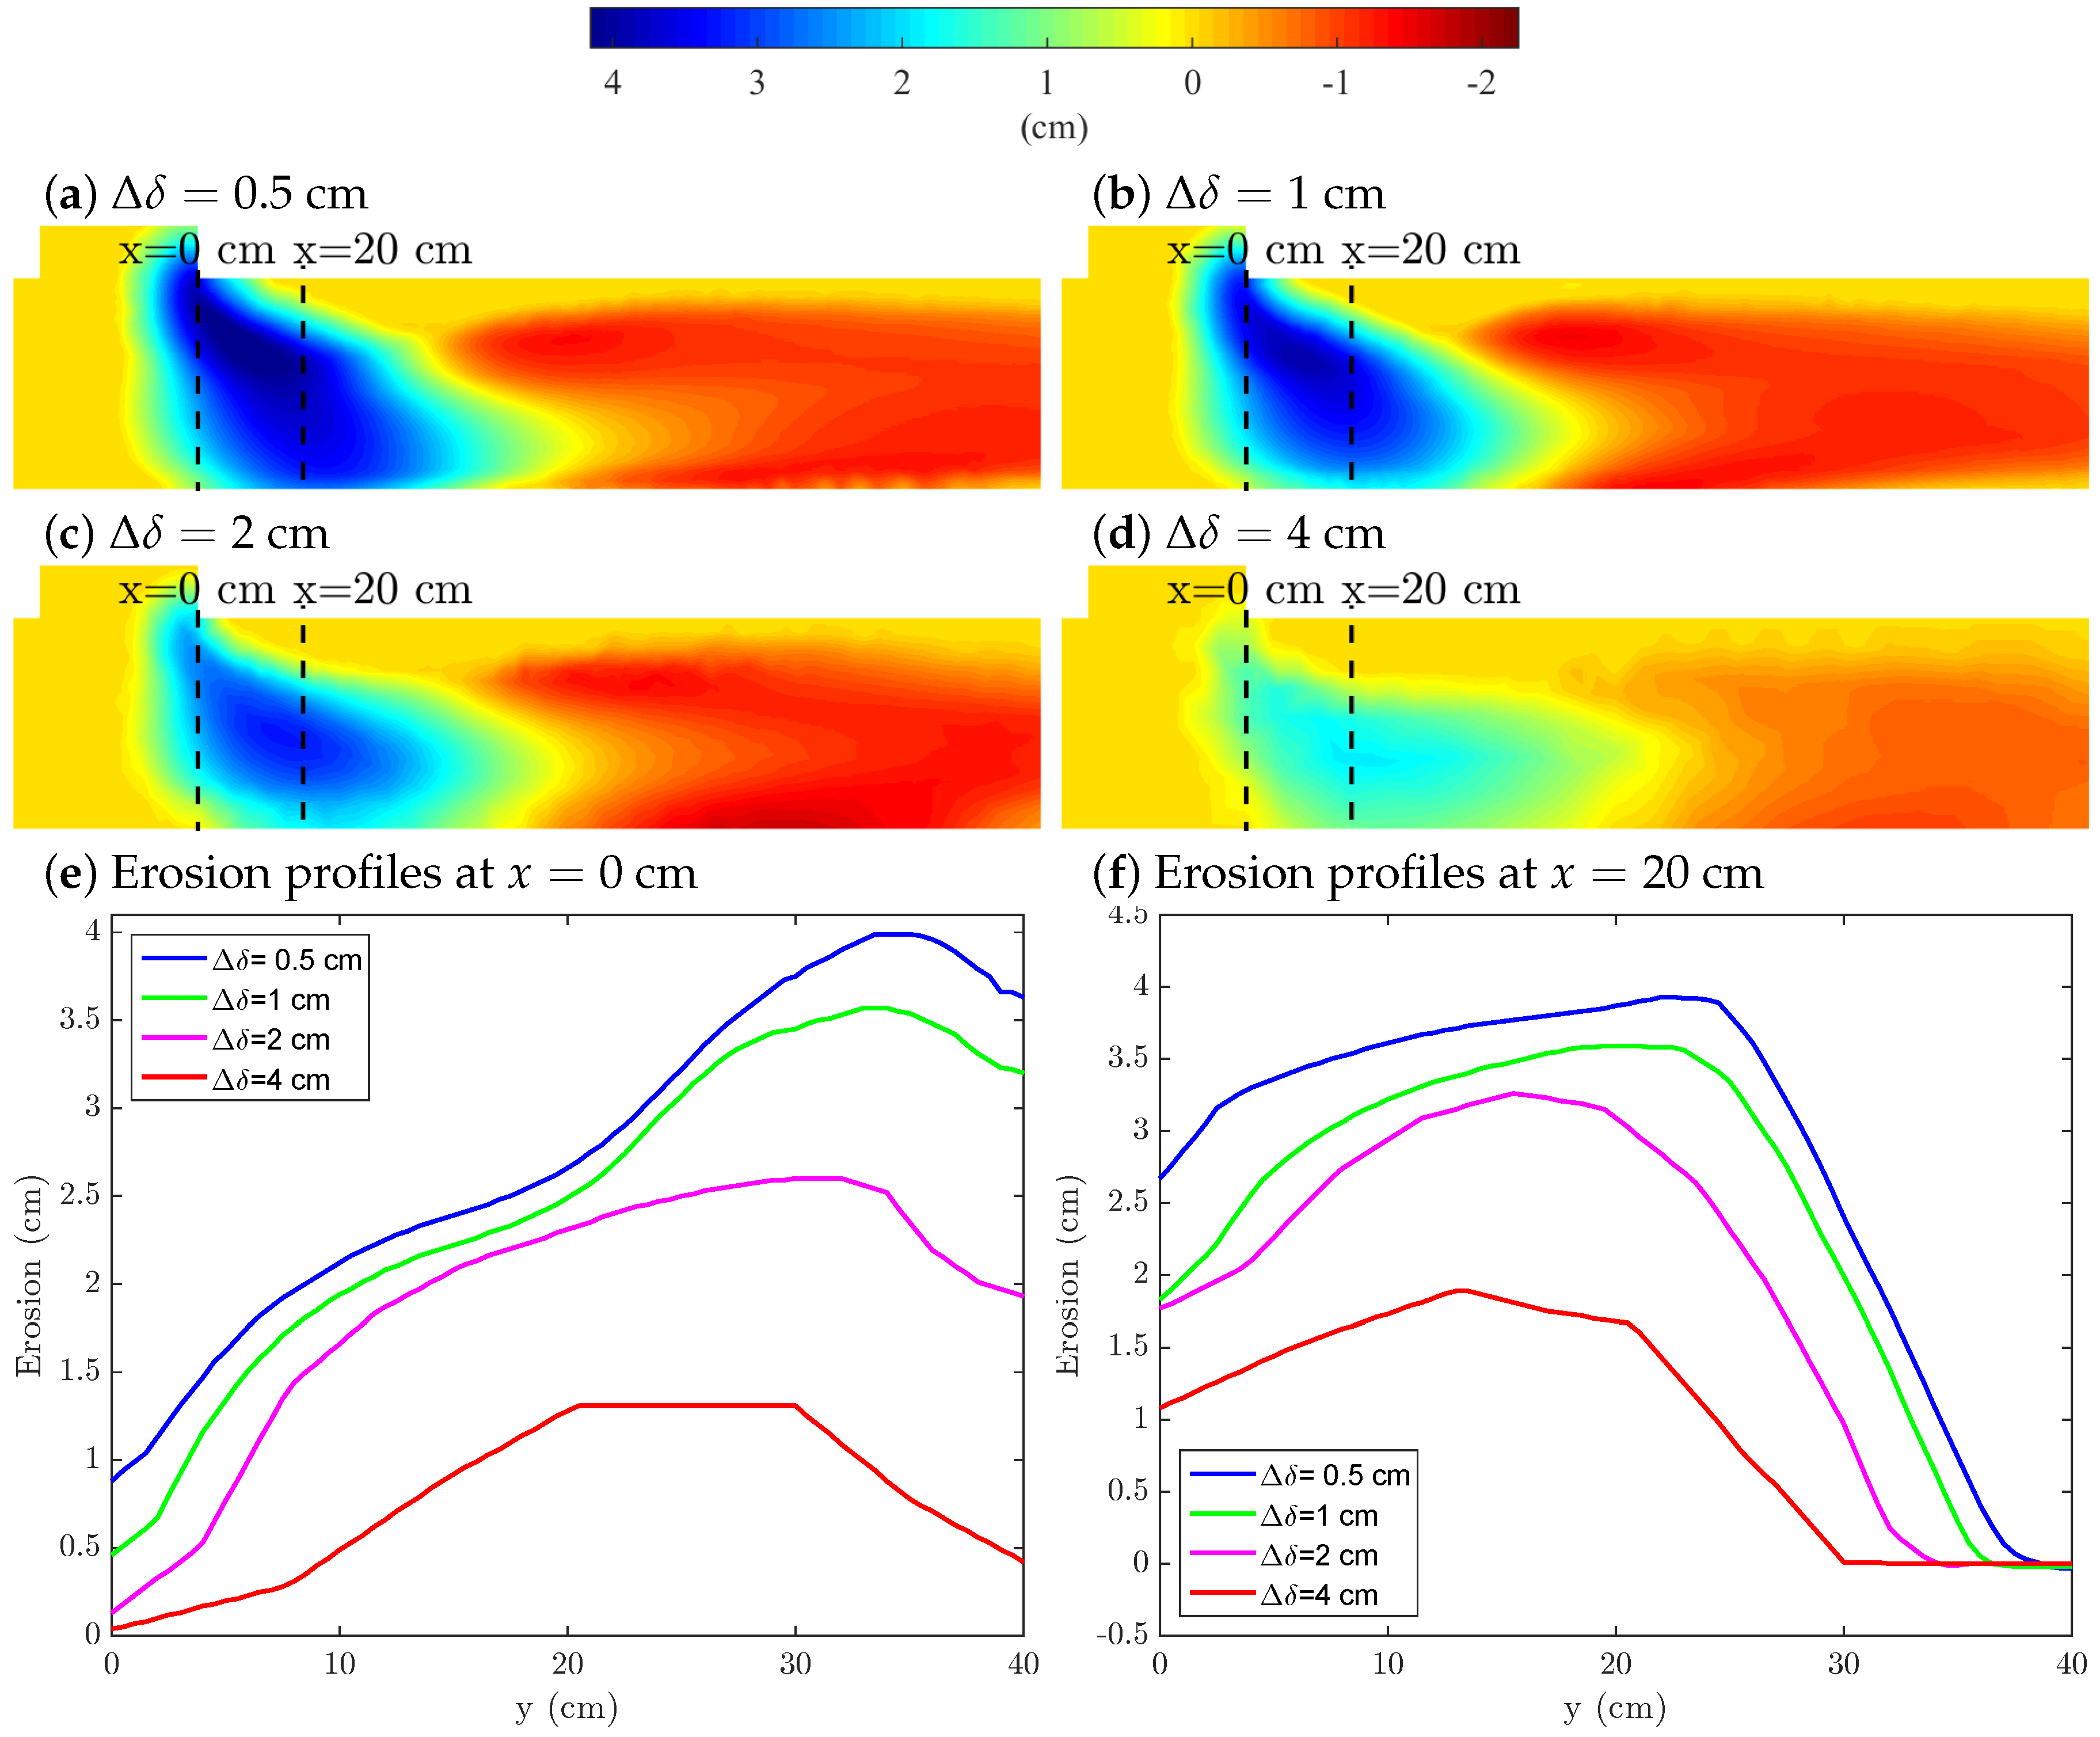
We test the grid convergence of our model results with a mesh refinement study. We simulate the erosion experiment depicted in Figure 3 using four mesh sizes, Δ δ = ( 0.5 , 1 , 2 , 4 ) cm, in the erodible areas of the channel. The erosion patterns and two bed profiles at the x-coordinates 0 and 20 cm (see reference system in Figure 3a) are included in Figure 5.
The overall erosion patterns are grid independent, but quantitatively we observe smoother topographies (less erosion) in coarser grids. Note that the finest grid already has a grid size that is comparable with the characteristic size of the sediment particles (around 1 mm), so refining below the sub-millimeter scale may raise questions about the validity of the continuum hypothesis. For fixed hydro-mechanical properties the steady state bed elevation converges for four increasing mesh sizes, from Δ δ = 4 cm to Δ δ = 0.5 cm (Figure 5a–d). The deepest scour hole and highest downstream bar are computed with the finest mesh: as the mesh is refined, the scour hole depth increases.
The difference between the computed erosion depths decreases as the grid is refined in both profiles, as shown in Figure 5e,f, as it remains relatively small for the finest grids, Δ δ = 1 cm and Δ δ = 0.5 cm. Nevertheless, the scour hole depth is quite short for the coarsest mesh, 1 cm deep, in contrast with the estimated depth with the finest mesh, 4 cm deep. Based on these convergence results, we adopt a mesh size of 0.5 cm.

3.3.2. Bed Properties: Friction Angle of Sediments

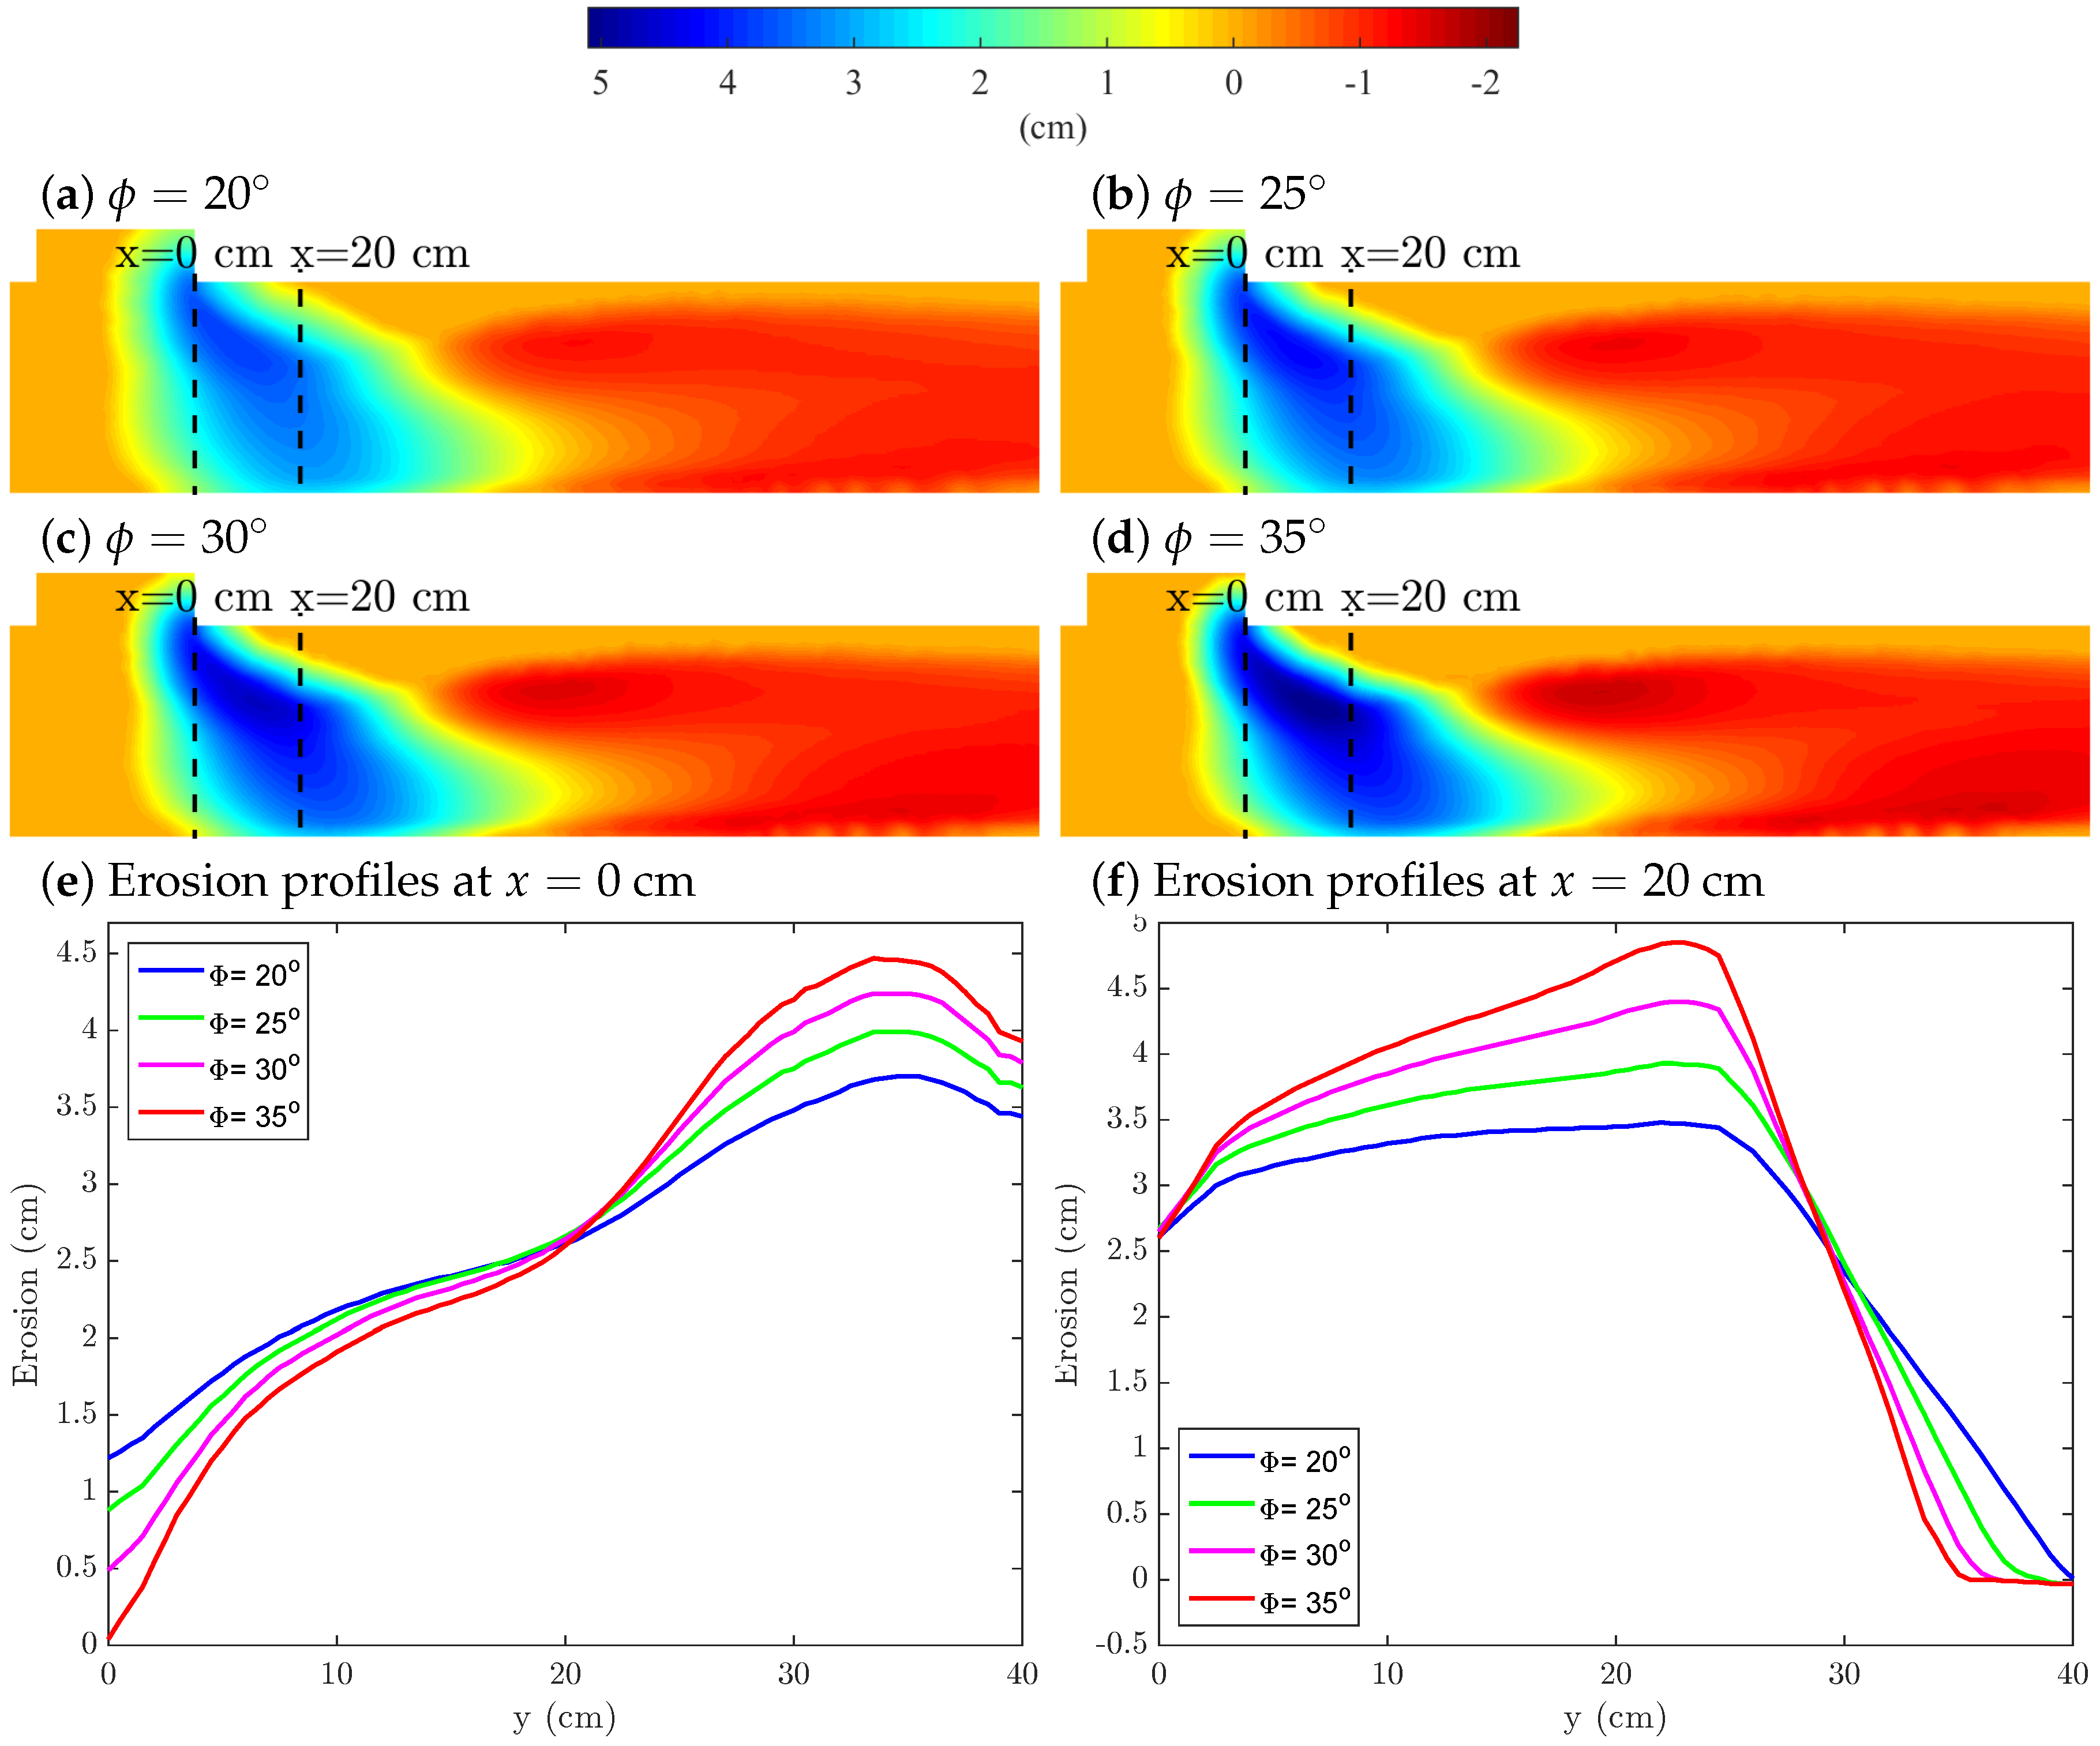
The model assumes that the sediments can be described as a cohesion-less granular material. We study the effect of the internal friction angle, ϕ , of sediments on the erosion pattern through four mathematical simulations of the experiment depicted in Figure 3. We adopt four angles, from ϕ = 20 up to ϕ = 35 and run the mathematical simulations. The erosion patterns and two bed profiles at the x-coordinates 0 and 20 cm (see reference system in Figure 3a) are included in Figure 6.
The friction angle plays an important role in the erosion pattern: the higher friction angle, the steeper scour hole and bar. The sediment with the lowest angle, ϕ = 20 , provides a flatter pattern, as shown in Figure 6a, than the sediment with the highest angle, ϕ = 35 and Figure 6d, for both the scour hole and the bar.
The deepest point of the scour hole is given near the downstream corner of the junction close to the left bank, and ranges from almost 5 cm for the sediment with the highest friction angle to 3.5 cm for the sand with the lowest ϕ (Figure 6e,f). Sediments with high friction angles allow for steeper steady state holes and, consequently, deeper ones. Nevertheless, the erosion in the right bank of the main channel, y-coordinate equal to 0 cm, is deeper as the friction angle decreases. Indeed, the low friction angle of the sand hampers a deep scour hole in the downstream corner of the junction and sediment is conveyed by sliding from the right bank to the left (Figure 6e). A similar behavior is given in the profile at x-coordinate equal to 20 cm, but in the left bank where y = 40 cm (Figure 6f). Since the sediment with the lowest angle does not allow for a steep hole, the erosion conveys up to the left bank.

3.3.3. Bed Properties: Effective Roughness

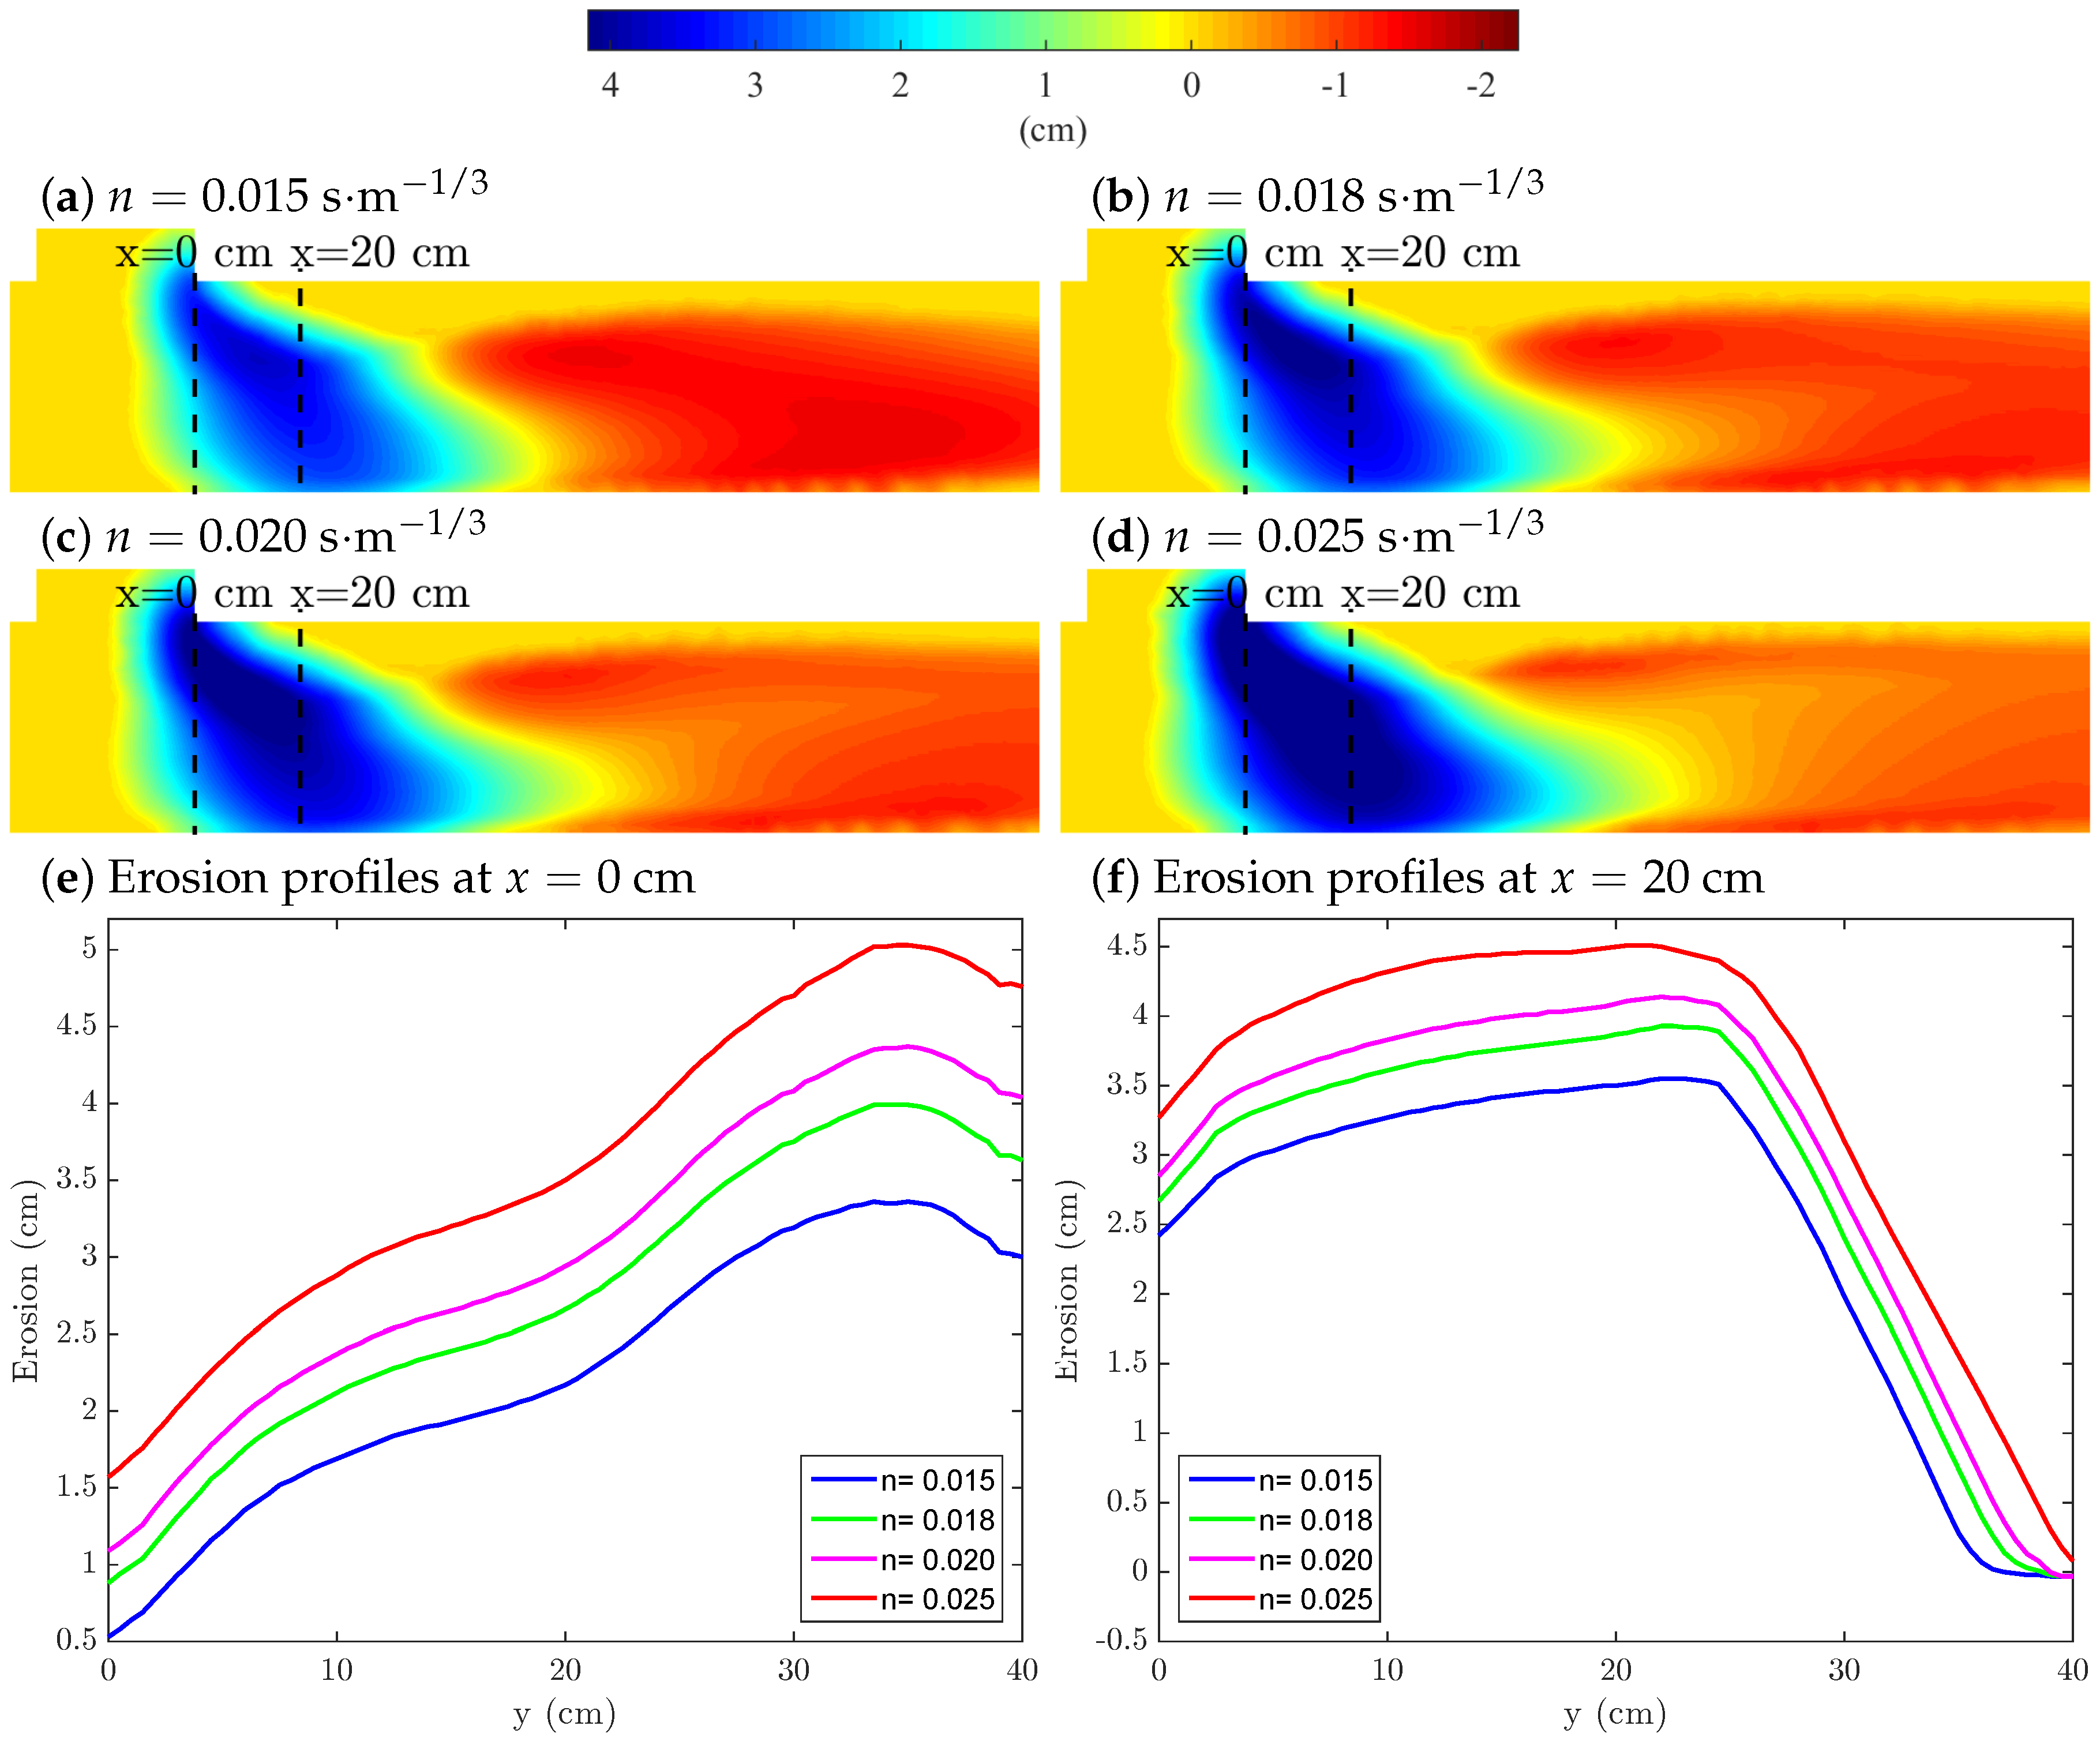
We simulate the roughness of the bed channel with the Manning’s coefficient, n. We simulate four erosion experiments with four coefficients with values ranging from 0.015 to 0.025 s·m 1 / 3 . The erosion patterns and two bed profiles at the x-coordinates 0 and 20 cm (see reference system in Figure 3a) are depicted in Figure 7.
Roughness has a significant influence on the erosion patterns. The larger the Manning’s coefficient, the deeper and larger scour hole, and the lower and smaller downstream bar (Figure 7a–d). The maximum depth of the scour hole varies from 3.5 cm for the experiment with the lowest friction to 5 cm for the simulation with the highest n. The shear stress due to friction between the flow and the bed is proportional to the roughness and increase as n does. Consequently, the scour hole is larger in both sections of the main channel as the n-coefficient increases (Figure 7e,f).
The bar in the main channel downstream of the junction is affected only slightly by roughness. As the n-coefficient increases, the area of the bar decreases and concentrates in both banks of the channel (Figure 7a compared to Figure 7d).
The effective roughness can be estimated through formulae as function of the particle size. Two examples are the Muller formula [72], n = D 90 1 / 6 / 26 , or the Strickler equation [73], n = D 50 1 / 6 / 21.1 . Both formulae provides n-values of 0.0142 and 0.0147 , respectively, for the sediment size used in the experiments. We got the best agreement between experiments and numerical simulations for n = 0.018 s·m 1 / 3 , which is higher than the previous values. The discrepancy may arise from the grain-size distribution of the sediments, since the formulae account for the whole distribution with only one variable, D 90 or D 50 .

4. Results and Discussion. Model Application to Field-Scale Channel Junction

To test the implications of sediment erosion and transport for river hydraulics during flash floods, we simulate the erosion on a real river confluence during a flood event. The simulations allow us to study the interplay between bed erosion and water flow patterns and to discern whether erosion has to be taken into account in eroded beds during flood events. Our case study is a channelized junction in southeast Spain. The confluence is located within a semiarid basin with major soil erosion problems situated between Sierra Nevada and Sierra de Los Filabres mountain ranges in Almería, Spain [74,75].

4.1. Case Study

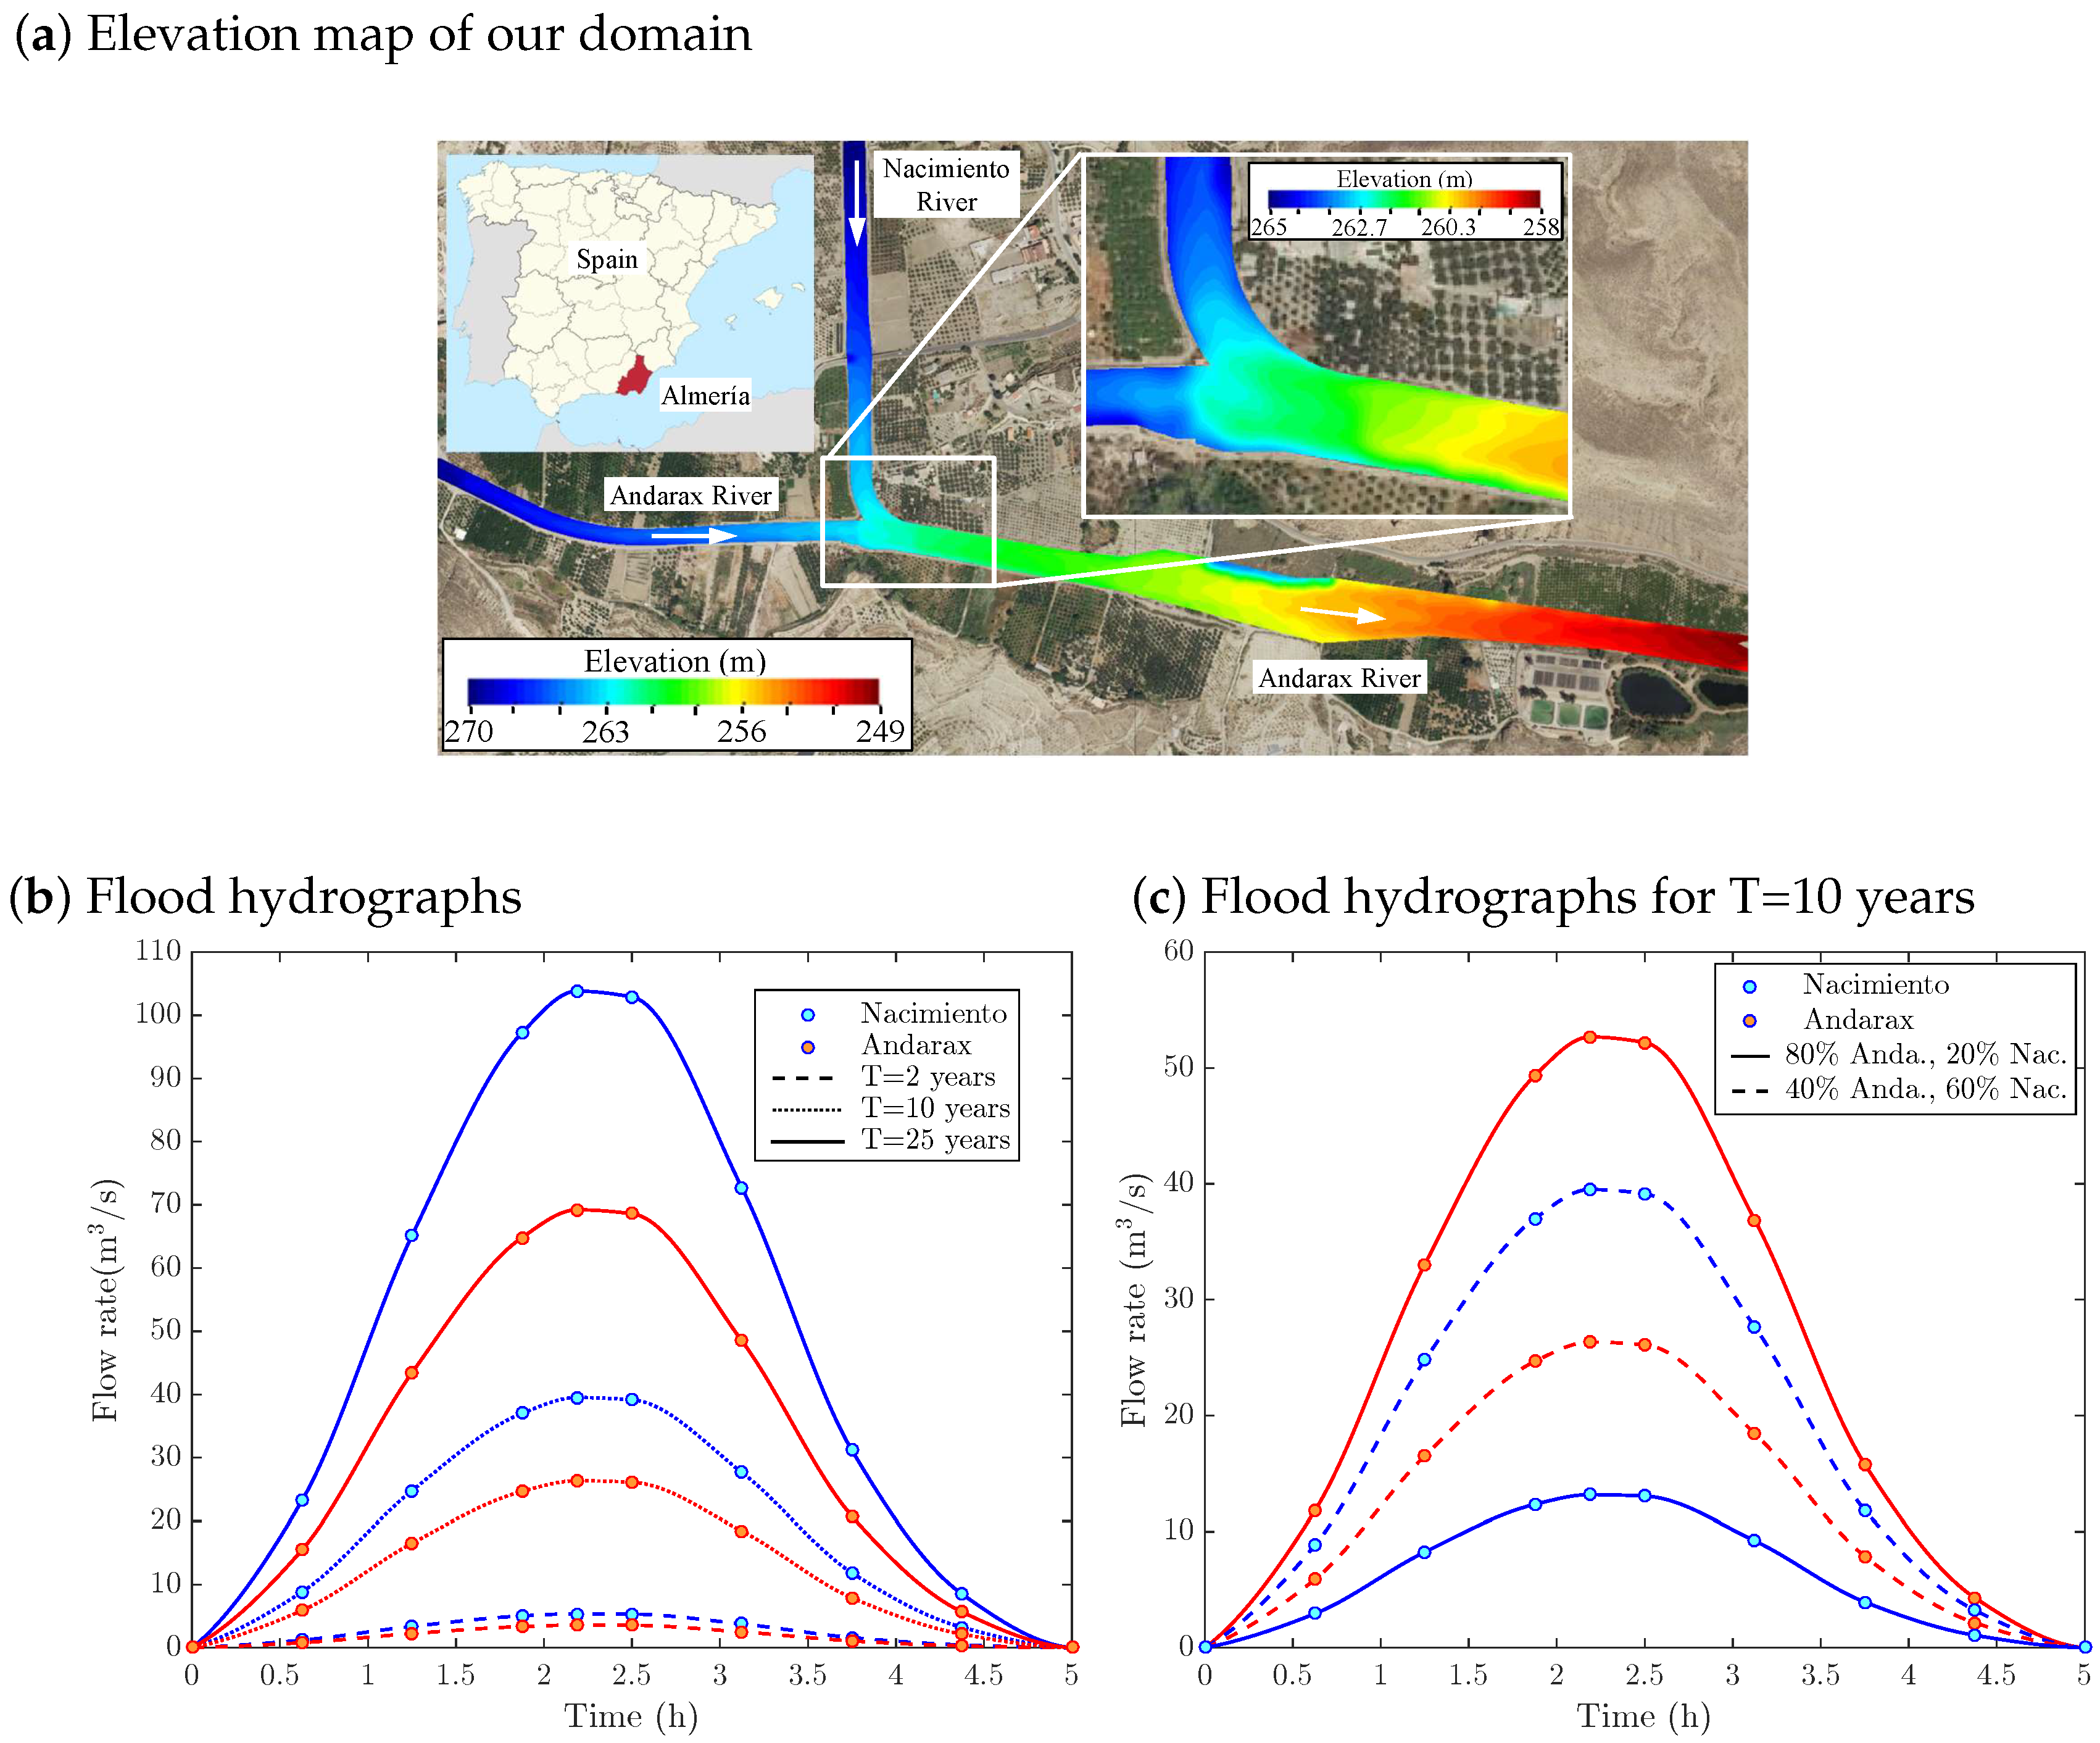
Our case study is the confluence of the Nacimiento and Andarax rivers. Both streams are located in Almería province, Spain, between Sierra Nevada and Sierra de Los Filabres mountain ranges. The Nacimiento river is a left tributary of the Andarax river, and both meet at Alhabia, Almería province, Spain. The junction is channelized and the bed of the river is sand, whereas banks are protected with vertical concrete walls. The topography of the simulated stretch is depicted in Figure 8a. Since the river typically has a very small natural discharge, we know the actual bathymetry, which is typically unknown in most practical scenarios. The width of the Andarax river before the confluence is 25 m, and after it is 40 m, and the width of the Nacimiento river is 30 m.
The Nacimiento river is 40 km in length at the junction. The catchment area is 600 km 2 , the terrain elevation at the junction is about 263 m and the maximum elevation is about 1100 m. The Almarax river is 33 km in length at the junction. The basin area is 288 km 2 , and the maximum elevation is approximately 1160 m. The median diameter of the sediments at the junction is D 50 = 1 mm, the porosity is 0.4 , the density is 2650 kg/m 3 , and the friction angle is 30 . The roughness of the rivers, measured with the Manning’s coefficient, is n = 0.025 s·m 1 / 3 . We include an elevation map of our simulation domain in Figure 8a.
We estimate the annual maximum flood quantile for the desired return period through the map of maximum discharges in Spain [76,77]. The map divides Spain into a set of homogeneous regions and provides the most likely regression model to estimate the annual maximum flood quantiles for the desired return period. The map was built using flood series recorded at gauged basins [76]. We compute the flood quantiles downstream of the junction for the return periods, T, of 2, 10, and 25 years. These quantiles are 8.97 , 65.84 , and 173.06 m 3 /s, respectively. We consider that the flood event lasts 5 h with a parabolic shape, and assign the total flow rate to each basin proportional to its area. The simulated flood events in both basins for the selected return periods are plotted in Figure 8b. Since the overall water flow regime in our domain is subcritical, as boundary conditions we impose the total discharge at the upstream boundary, and critical flow (free discharge) at the downstream end. The outlet of the model is far enough from the junction to guarantee that water reaches uniform flow downstream the confluence. The imposed flow rates are plotted in Figure 8b.
We take advantage of our model and study the effect of the discharge ratio on the erosion patterns. In this sense, we study two situations for the total flood quantile of 10-year return period, i.e., 65.84 m 3 /s: (1) the flow distributes 80% in the Andarax river and 20% in the Nacimiento river, which gives a discharge ratio of 0.2 ; and (2) the flow distributes 20% in the Andarax river and 80% in the Nacimiento river, which gives a discharge ratio of 0.8 . The evolution of the flood events, assuming 5-h duration and parabolic shape, are depicted in Figure 8c.

4.2. Effect of Bed Erosion on Hydrodynamics During Flood

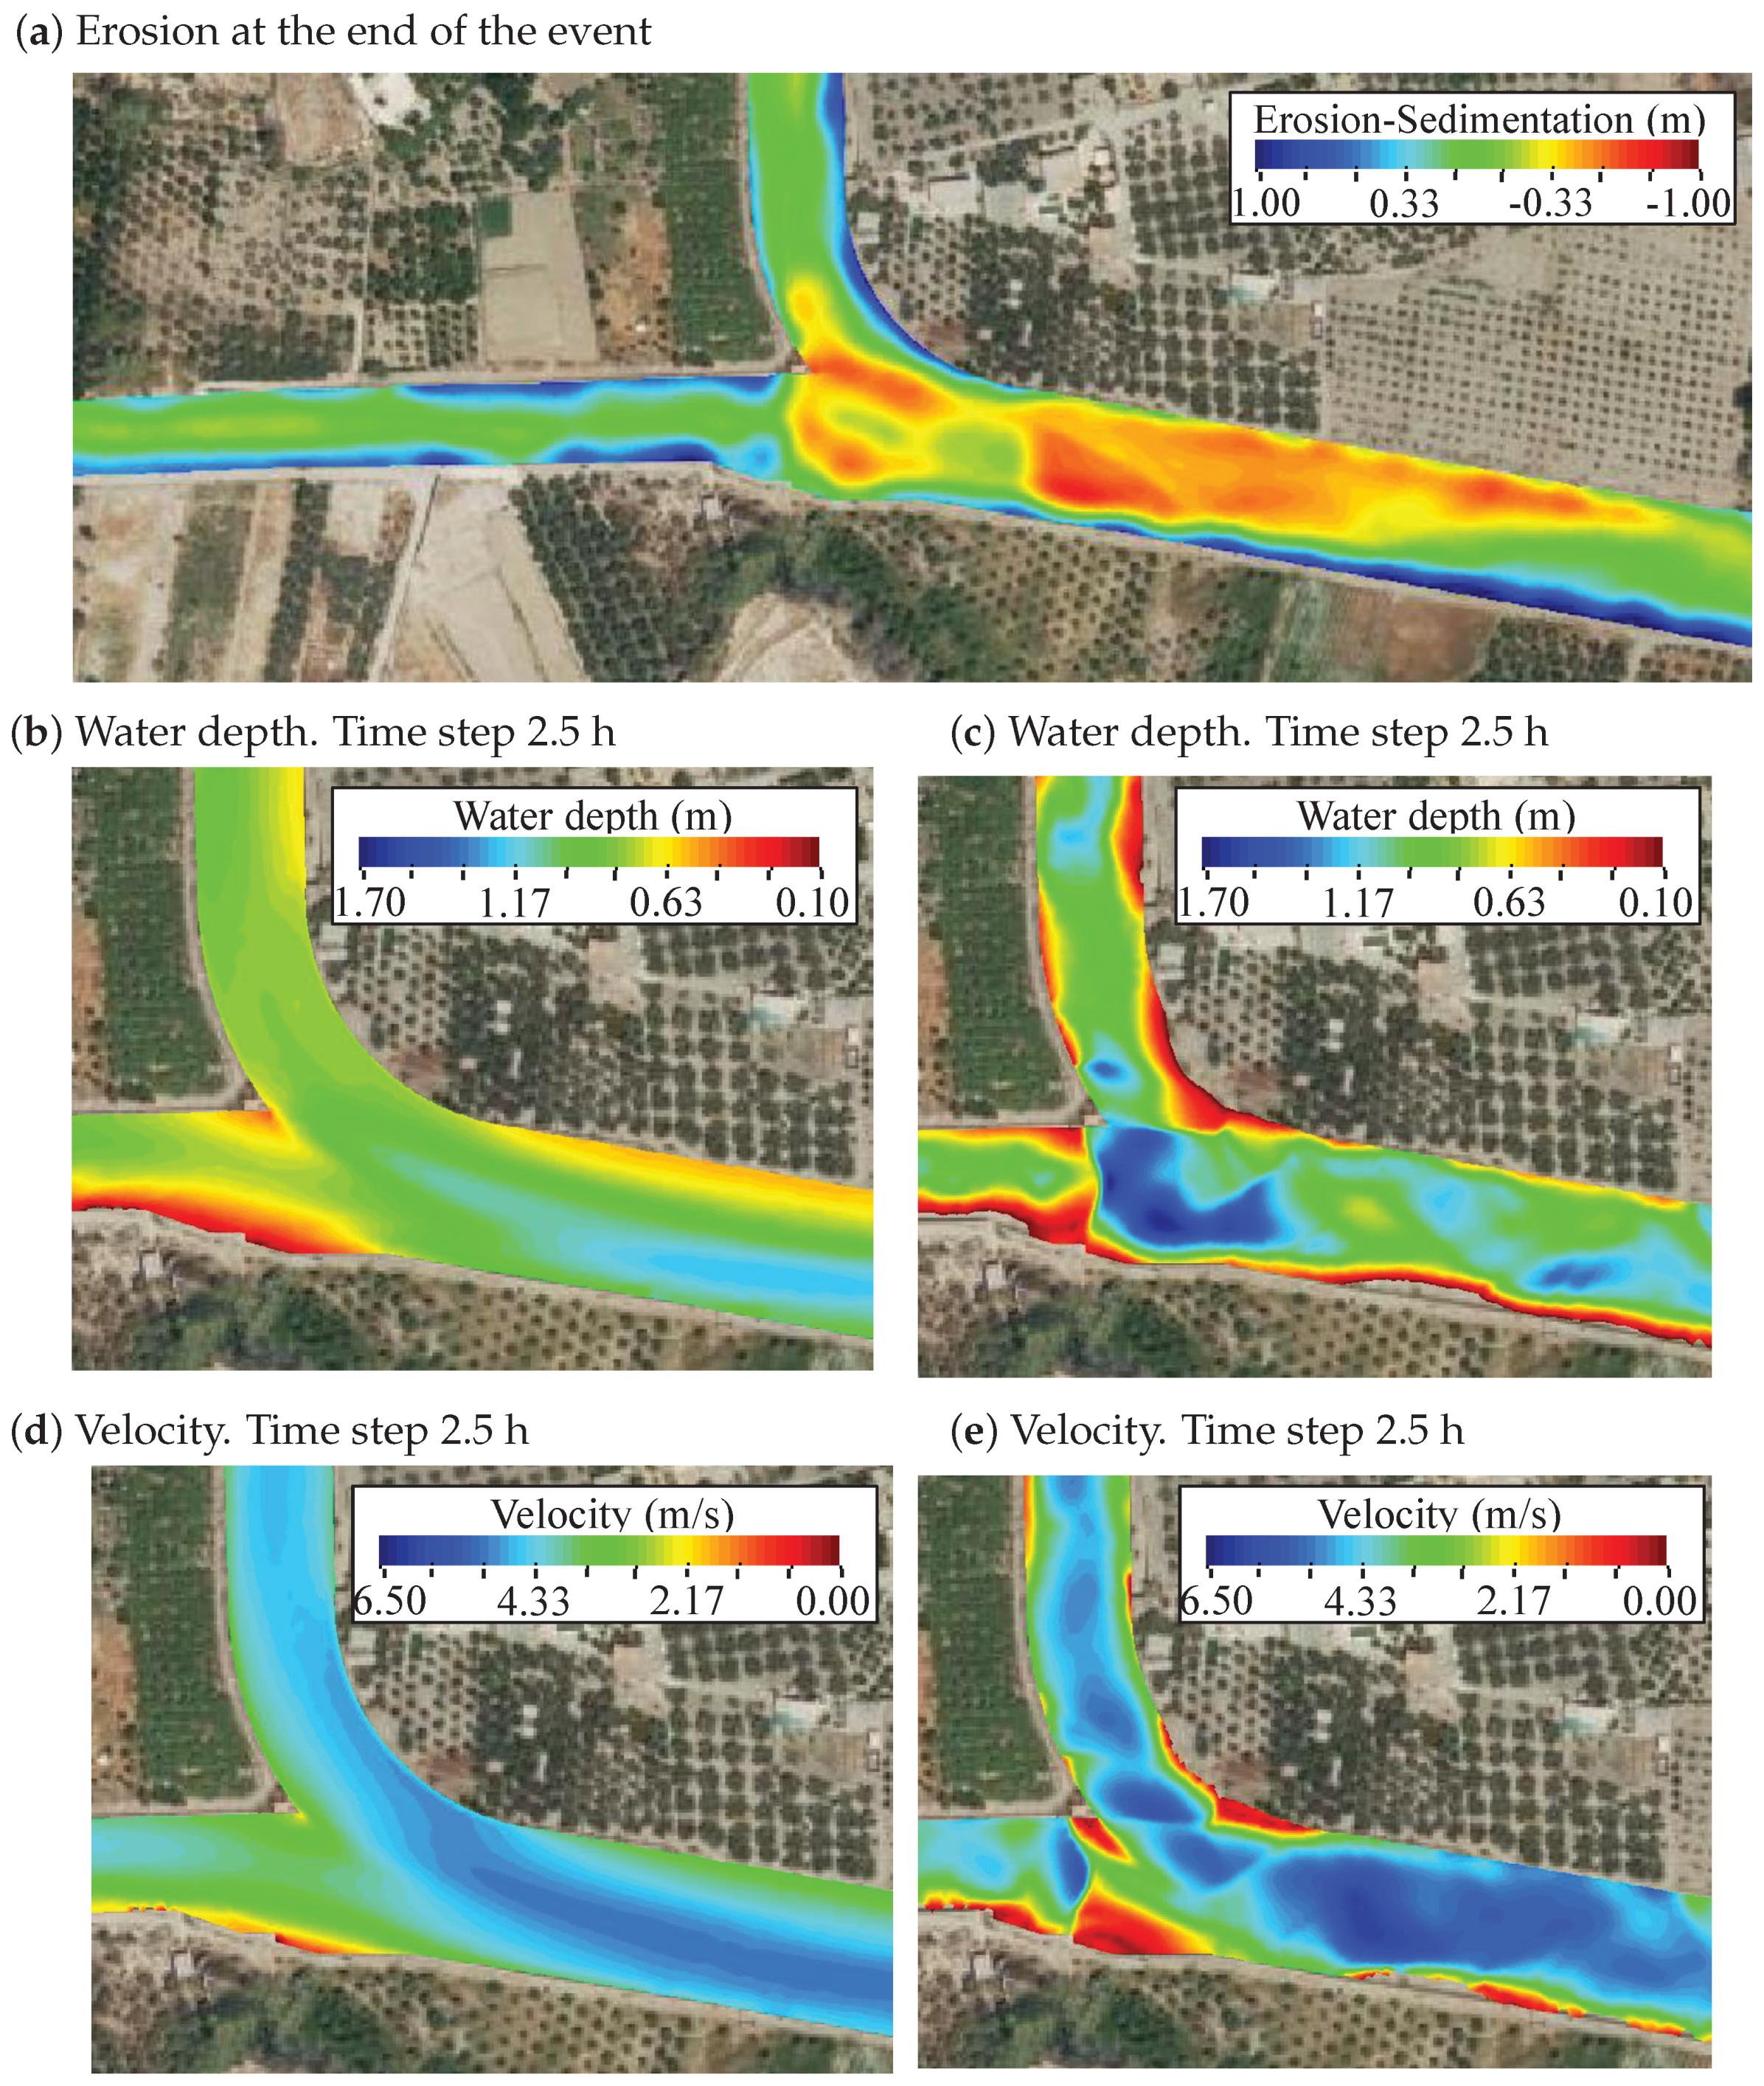
We study the interplay between the bed erosion on the flow pattern and vice-versa. We simulate the 25-year return period flood event, as shown in Figure 8b, in our computational domain (Figure 8a). The erosion at the end of the flood event is represented in Figure 9a, and we include the water depth and velocity contour plots at time step 2.5 h in Figure 9b,c, respectively. We also depict the water depth and velocity contour plots at time step 2.5 h in Figure 9d,e, respectively, for a simulation with non-erodible bed.
The initial bed topography is irregular, as represented in Figure 8a. The cross sections of all the channels are proximately U-shape in the central part and flat in the banks. The irregular initial bed shape results in an irregular erosion pattern, as shown in Figure 9a. The junction between both rivers is curved to avoid the scour hole that appears in rectangular confluences.
The curved shape produces erosion in the left or inlet bank and sedimentation in the right or outer bank. Erosion experiments and numerical models of sediment transport in curved channels have demonstrated that erosion occurs in the opposite way: erosion in the outer bank and sedimentation in the inlet bank [78,79]. However, the influence of the lateral flow is not considered in these studies, as well as the bed topography was initially flat. The flow from the Andarax river pushes the Nacimiento flow and detaches it from the outer wall. This effect, together with the bed topography produces erosion on the inner bank. Moreover, the widening of the Andarax river at the confluence promotes the sedimentation at the junction, as two bars appear: the first one in the upstream corner of the junction and the second one in the central area of the Andarax river just downstream of the upstream corner.
The flood event slightly erodes the right bank downstream of the confluence, whereas several sediment ridges emerged in the mid-channel area as well as a bar in the left bank (Figure 9a). Sedimentation patterns downstream of the junction have been observed in laboratory experiments [45], and they are caused by the decrease in velocity since the shear layer vanishes [46].
Erosion has a great influence on the water depth and flow velocity patterns. The water depth pattern computed with a bed-mobile model at a given time step is smooth, as shown in Figure 9b, whereas the output provided by a model without bed erosion is very irregular, with areas with high depths close to other ones with low depths, as shown in Figure 9c. The abrupt pattern for the non-erodible model emerges from the irregular bed topography. Since the bed topography in the bed mobile model can evolve according to the flow conditions, the water depth pattern is smoother.
Water velocity patterns are also greatly influenced by erosion. The water velocity pattern computed with the bed-mobile model at a given time step is much smoother than the one provided by the fixed bed approach, as shown in Figure 9d,e. As in the water depth pattern, the initial abrupt bed topography causes the water velocity pattern to also be abrupt.

4.3. Effect of Flooding on Erosion Patterns

We take advantage of our model to study the effect of the flood event on the erosion pattern. We analyze the effect of the flood return period, and the flood discharge ratio—the distribution of the total flow between the two rivers—on the erosion patterns.
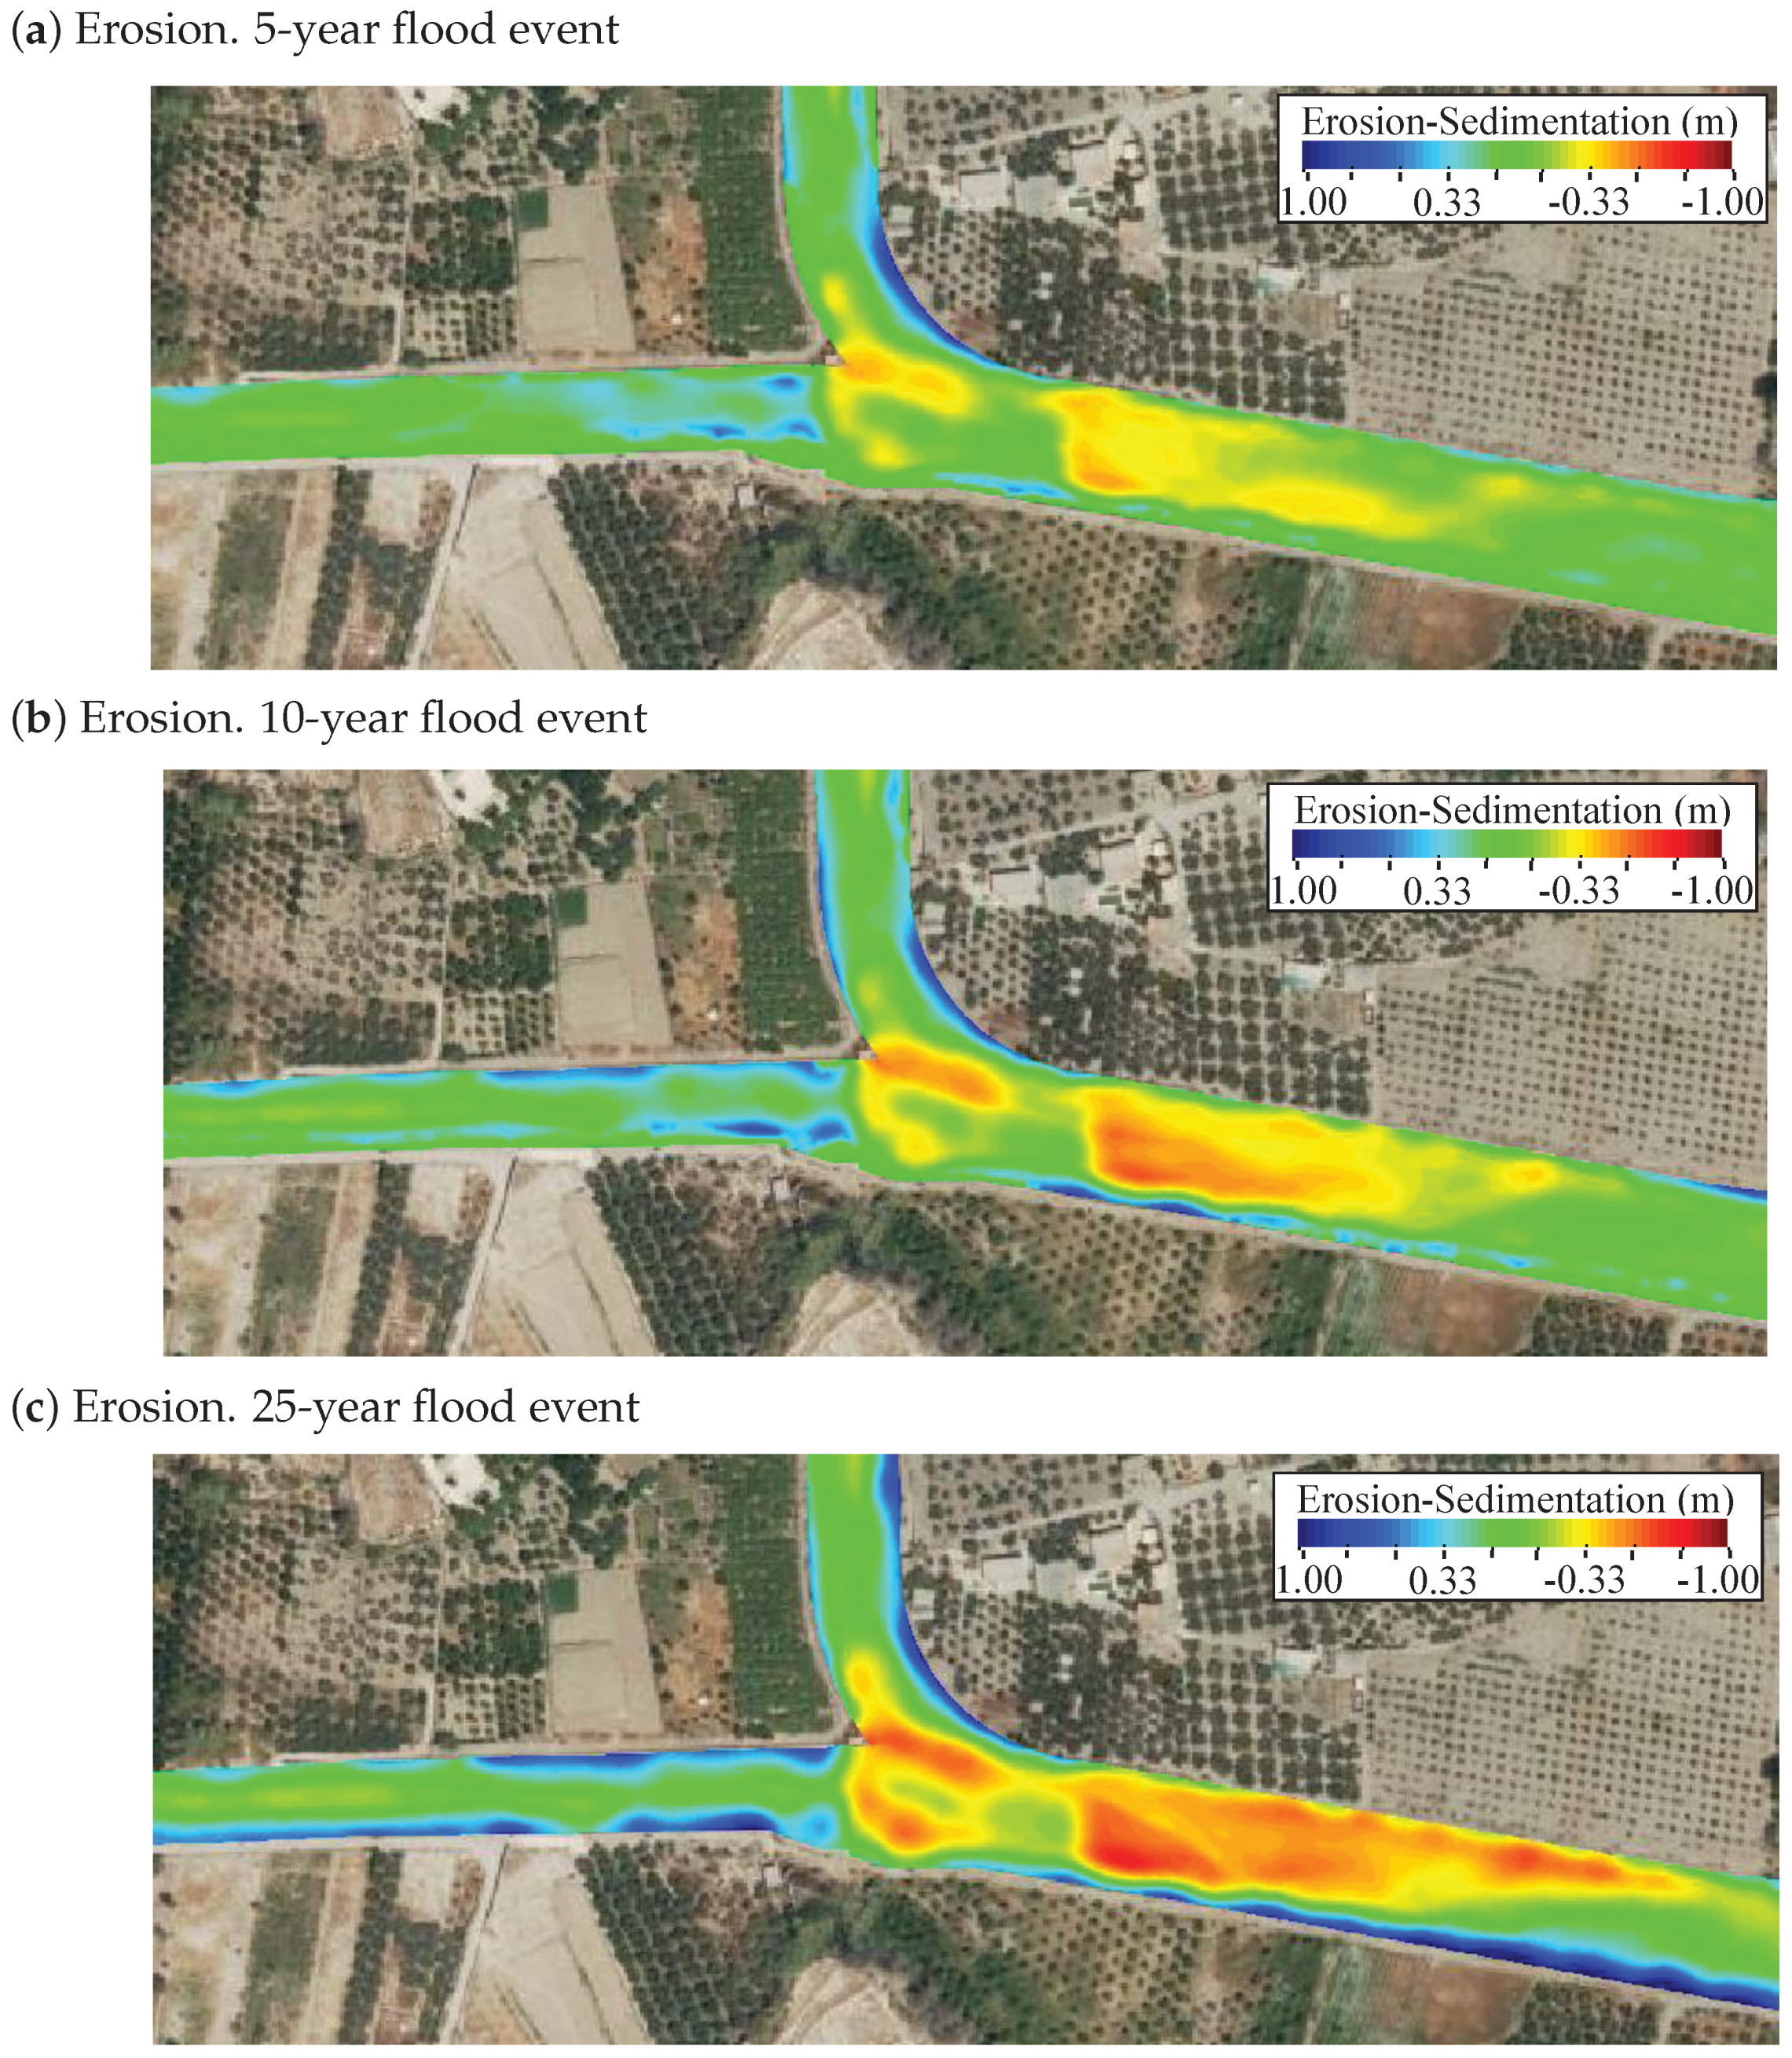
We simulate three flood events with return period of 5, 10, and 25 years, respectively. The flood return period influences the erosion or sedimentation intensity, but not the erosion pattern, which remains constant in all of them (Figure 10). As the return period increases, so does the intensity of the erosion and sedimentation.
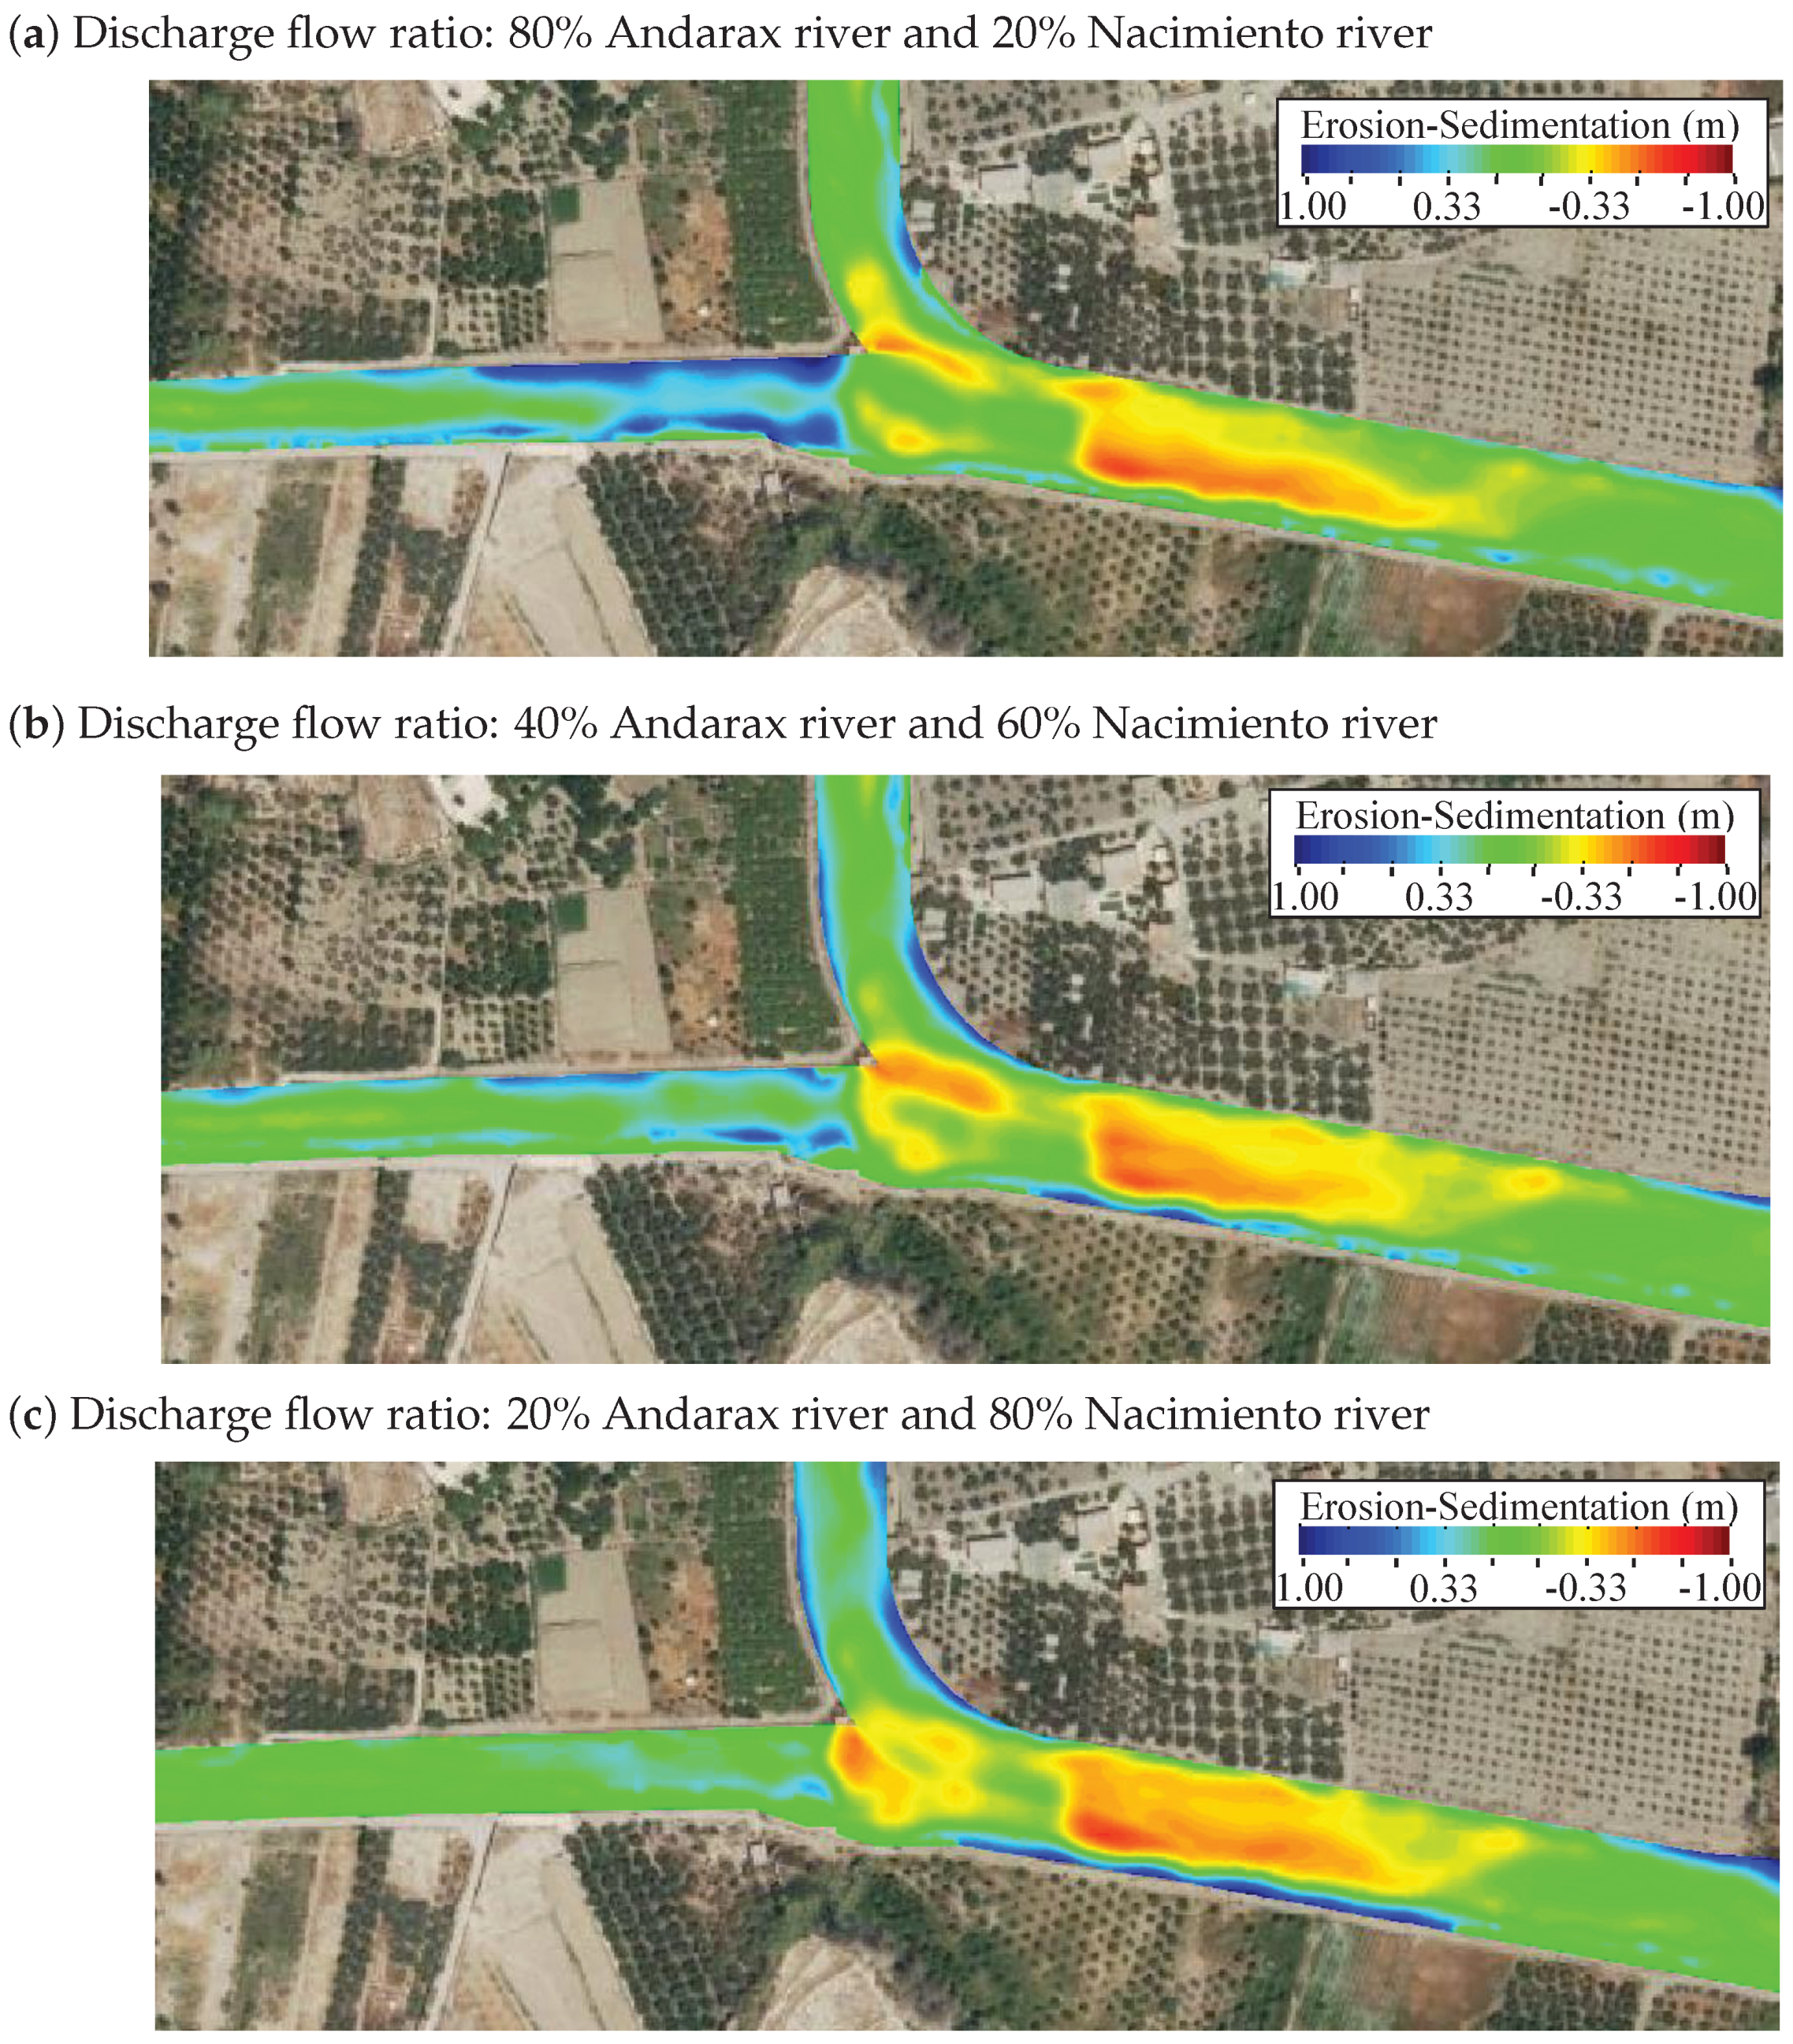
We also study the effect of the flood discharge ratio, or total flow distribution between both rivers, on the erosion patterns. We simulate three new scenarios for the 10-year flood event: (1) the total flow distributes 80% in the Andarax river and 20% in the Nacimiento river, which results in the pattern included in Figure 11a, (2) the flow distributes 40% in the Andarax river and 60% in the Nacimiento river, which has the outcome of the pattern depicted in Figure 11b, and (3) the flow distributes 20% in the Andarax river and 80% in the Nacimiento river with the pattern depicted in Figure 11c.
The comparison between the erosion patterns for the three flood discharge ratios allow us to reach the following conclusions. As the flow rate in the Andarax river increases, the erosion in both banks of the river upstream the junction also does. In the same way, the erosion in the banks of the Nacimiento river upstream the junction rises up as the flow rate in the rives does.
The sedimentation patterns downstream of the junction are nearly the same for the three flood discharge ratios, since the flow rate in this stretch is identical in all the simulations. Small differences emerge in the tail of the bar, which may arise from the total volume of sediment eroded that is different in every situation.
The erosion in the right bank downstream of the junction increases as the flow in the Nacimiento river does. The Andarax river flow displaces the Nacimiento river flow at the junction, pushing the main stream away from the right bank downstream of the confluence. The larger the Nacimiento river flow rate, the lower the Andarax river flow and the more water hits the right bank that promotes erosion.
Two bars emerge from the upstream corner of the junction. The first one is parallel to the Andarax river and extends in some cases upstream along the Nacimiento river. This bar shrinks as the Nacimiento river flow increases. The second bar is perpendicular to the Andarax river and in some cases changes its direction and becomes parallel to the flow. Opposite to the other bar, this one contracts as the Nacimiento river flow increases.

5. Conclusions

Flooding has become the most frequent environmental hazard, causing significant losses of life and severe economic damage. Mathematical models are useful tools for flood risk forecasting and control, and the current computational resources allow us to simulate flood events with two-dimensional (2D) approaches. An open question is whether erosion should be accounted for or not when it comes to high-fidelity simulation of flood events.
In this paper we have addressed the question by assessing the effect of mobile beds on the flow patterns during flood events through numerical simulations. We have simulated the erosion in a river confluence located in a semiarid basin of southeast Spain. We have also validated our simulations by comparing our numerical results with laboratory experiments of channel confluences reported in the literature. Our 2D simulation is able to reproduce the main features of the erosion patterns in a rectangular channel confluence: a scour-hole on the downstream corner of the confluence, and a bar on the left bank immediately downstream of the junction. However, laboratory experiments have shown that a helicoidal flow emerges downstream of the junction in the main channel and concentrates the sediments. Since our mathematical model is 2D depth-averaged, it is unable to reproduce the helicoidal flow and discordance between experiments and simulations arises.
We have conducted a mesh refinement study that has shown the well-posedness of the problem. Moreover, our sensitivity analysis has concluded that the bed roughness has a great influence on the erosion patterns: the higher the effective bed roughness, the deeper and larger the scour hole, and the lower and smaller the downstream bar. The internal friction angle of the granular river bed sediments plays an important role in the erosion pattern: the larger the friction angle, the steeper the scour hole and bar, which in turn controls the overall hydrodynamics.
We have simulated the erosion process in a channelized river confluence during flood events. The case study is located in a semiarid basin in southern Spain. Erosion has a great influence on the water depth and flow velocity patterns. The water depth pattern computed with a bed-mobile model at a given time step is smooth, whereas the depth provided by a model without bed erosion is very abrupt. Water velocity patterns are also greatly affected by erosion: the pattern provided by a bed-erodible model is smoother than the one computed with the fixed bed approach.
We have analyzed the effect of the flood return period on the erosion pattern. The return period influences the erosion or sedimentation intensity, but not the erosion pattern, which remains constant for all the simulated periods. We have studied the distribution of a given flow rate between both rivers, i.e., the discharge ratio. The increase in flow rate in one river also increases the erosion upstream from the junction in that river. Moreover, the formation of bars in the junction is quite influenced by the discharge ratio. Nevertheless, the erosion pattern downstream of the junction is quite independent of the discharge ratio.
Our study elucidates the interplay between shallow water hydrodynamics and sediment transport during flood events. Erosion plays a key role in these processes, leading to smoother water profiles and overall smaller flow velocities. Current computational resources can deal with 2D numerical simulations of river flow that incorporate sediment transport. Hydrodynamic models in conjunction with sediment transport arise as a useful tool for engineers, practitioners, and stakeholders to evaluate flood control problems.

Author Contributions

Literature review, L.C.-F.; research design, D.S. and L.C.-F.; validation cases, L.C.-F., and A.S.-W.; numerical experiments, D.S.; results discussion, D.S., A.S.-W., L.C.-F., and L.G.; manuscript drafting, D.S.; manuscript proofing, L.C.-F., A.S.-W., and L.G. All authors have read and agreed to the published version of the manuscript.

Funding

Spanish Ministry of Science and Innovation under grant PID2019-106887GB-C33.

Acknowledgments

D.S. gratefully acknowledges funding from the BBVA Foundation through the 2019 Leonardo Grant for Researchers and Cultural Creators. The BBVA Foundation accepts no responsibility for the opinions, statements and contents included in the project and/or the results thereof, which are entirely the responsibility of the authors.

Conflicts of Interest

The authors declare no conflict of interest. The founders had no role in the design of the study; in the collection, analyses, or interpretation of data; in the writing of the manuscript, or in the decision to publish the results.

References

  1. Smith, K. Environmental Hazards: Assessing Risk and Reducing Disaster; Routledge: London, UK; New York, NY, USA, 2013. [Google Scholar]
  2. Kundzewicz, Z.W.; Kanae, S.; Seneviratne, S.I.; Handmer, J.; Nicholls, N.; Peduzzi, P.; Mechler, R.; Bouwer, L.M.; Arnell, N.; Mach, K.; et al. Flood risk and climate change: Global and regional perspectives. Hydrol. Sci. J.-J. Sci. Hydrol. 2014, 59, 1–28. [Google Scholar] [CrossRef] [Green Version]
  3. Mediero, L.; Santillán, D.; Garrote, L.; Granados, A. Detection and attribution of trends in magnitude, frequency and timing of floods in Spain. J. Hydrol. 2014, 517, 1072–1088. [Google Scholar] [CrossRef]
  4. Tayefi, V.; Lane, S.; Hardy, R.; Yu, D. A comparison of one-and two-dimensional approaches to modelling flood inundation over complex upland floodplains. Hydrol. Process. 2007, 21, 3190–3202. [Google Scholar] [CrossRef]
  5. Sellin, R.; Ervine, D.; Willetts, B. Behaviour of meandering two-stage channels. Proc. Inst. Civ. Eng.-Water Marit. Energy 1993, 101, 99–111. [Google Scholar] [CrossRef]
  6. Toro, E.F. Shock–Capturing Methods for Free–Surface Shallow Flows; John Wiley & Sons, Ltd.: Chichester, UK, 2001. [Google Scholar]
  7. Deltares Systems. Simulation of Multidimensional Hydrodynamic Flows and Transport Phenomena, Including Sediments; User Manual: Delft, The Netherlands, 2011. [Google Scholar]
  8. Bladé, E.; Cea, L.; Corestein, G.; Escolano, E.; Puertas, J.; Vázquez-Cendón, E.; Dolz, J.; Coll, A. Iber: Herramienta de simulación numérica del flujo en ríos. Rev. Int. Métodos Numér. Cálc. Diseño Ing. 2014, 30, 1–10. [Google Scholar] [CrossRef] [Green Version]
  9. Pérez-Sánchez, M.; Sánchez-Romero, F.; Redón-Santafé, M.; Torregrosa Soler, J.; Ferrer Gisbert, C.; Ferrán Gozálvez, J.; Ferrer Gisbert, A.; López-Jiménez, P. Numerical study for the development of flood maps considering the break hypothesis in irrigation reservoirs. Ing. Agua 2019, 23, 1–18. [Google Scholar] [CrossRef]
  10. Sanz-Ramos, M.; Bladé, E.; Escolano, E. Optimization of the Floodplain Encroachment calculation with hydraulic criteria. Ing. Agua 2020, 24, 203–218. [Google Scholar] [CrossRef]
  11. Zerihun, Y.T. A Numerical Study on Curvilinear Free Surface Flows in Venturi Flumes. Fluids 2016, 1, 21. [Google Scholar] [CrossRef]
  12. Zerihun, Y.T.; Fenton, J.D. One-dimensional simulation model for steady transcritical free surface flows at short length transitions. Adv. Water Resour. 2006, 29, 1598–1607. [Google Scholar] [CrossRef]
  13. Berger, R.C.; Carey, G.F. Free-surface flow over curved surfaces Part II: Computational model. Int. J. Numer. Methods Fluids 1998, 28, 201–213. [Google Scholar] [CrossRef]
  14. Shimozono, T.; Sato, S. Coastal vulnerability analysis during tsunami-induced levee overflow and breaching by a high-resolution flood model. Coast. Eng. 2016, 107, 116–126. [Google Scholar] [CrossRef]
  15. Sánchez-Cordero, E.; Gómez, M.; Bladé, E. 3D numerical analysis of flow characteristics in an open—Channel bend. Ing. Agua 2020, 24, 157–168. [Google Scholar] [CrossRef]
  16. Duró, G.; Crosato, A.; Tassi, P. Numerical study on river bar response to spatial variations of channel width. Adv. Water Res. 2016, 93, 21–38. [Google Scholar] [CrossRef]
  17. Martín-Vide, J.; Plana-Casado, A.; Sambola, A.; Capapé, S. Bedload transport in a river confluence. Geomorphology 2015, 250, 15–28. [Google Scholar] [CrossRef]
  18. Herrero, H.S.; Lozada, J.M.D.; García, C.M.; Szupiany, R.N.; Best, J.; Pagot, M. The influence of tributary flow density differences on the hydrodynamic behavior of a confluent meander bend and implications for flow mixing. Geomorphology 2018, 304, 99–112. [Google Scholar] [CrossRef]
  19. Baki, A.B.M.; Gan, T.Y. Riverbank migration and island dynamics of the braided Jamuna River of the Ganges—Brahmaputra basin using multi-temporal Landsat images. Quat. Int. 2012, 263, 148–161. [Google Scholar] [CrossRef]
  20. Hicks, D.M.; Gomez, B.; Trustrum, N.A. Erosion thresholds and suspended sediment yields, Waipaoa River basin, New Zealand. Water Resour. Res. 2000, 36, 1129–1142. [Google Scholar] [CrossRef]
  21. R. Grove, J.; Croke, J.; Thompson, C. Quantifying different riverbank erosion processes during an extreme flood event. Earth Surf. Process. Landf. 2013, 38, 1393–1406. [Google Scholar]
  22. Croke, J.; Fryirs, K.; Thompson, C. Channel–floodplain connectivity during an extreme flood event: Implications for sediment erosion, deposition, and delivery. Earth Surf. Process. Landf. 2013, 38, 1444–1456. [Google Scholar] [CrossRef]
  23. Lamb, M.P.; Fonstad, M.A. Rapid formation of a modern bedrock canyon by a single flood event. Nat. Geosci. 2010, 3, 477–481. [Google Scholar] [CrossRef] [Green Version]
  24. Bilal, A.; Xie, Q.; Zhai, Y. Flow, Sediment, and Morpho-Dynamics of River Confluence in Tidal and Non-Tidal Environments. J. Mar. Sci. Eng. 2020, 8, 591. [Google Scholar] [CrossRef]
  25. Arega, F.; Lee, J.H.; Tang, H.W. Hydraulic jet control for river junction design of Yuen Long Bypass Floodway, Hong Kong. J. Hydraul. Eng. 2008, 134, 23–33. [Google Scholar] [CrossRef]
  26. Ferrarin, C.; Madricardo, F.; Rizzetto, F.; Kiver, W.M.; Bellafiore, D.; Umgiesser, G.; Kruss, A.; Zaggia, L.; Foglini, F.; Ceregato, A.; et al. Geomorphology of scour holes at tidal channel confluences. J. Geophys. Res. Earth Surf. 2018, 123, 1386–1406. [Google Scholar] [CrossRef]
  27. Xie, Q.; Yang, J.; Lundström, S.; Dai, W. Understanding morphodynamic changes of a tidal river confluence through field measurements and numerical modeling. Water 2018, 10, 1424. [Google Scholar] [CrossRef] [Green Version]
  28. Bennett, S.; Best, J. Mean flow and turbulence structure over fixed, two-dimensional dunes: Implications for sediment transport and bedform stability. Sedimentology 1995, 42, 491–513. [Google Scholar] [CrossRef]
  29. Best, J.L.; Roy, A.G. Mixing-layer distortion at the confluence of channels of different depth. Nature 1991, 350, 411–413. [Google Scholar] [CrossRef]
  30. Biron, P.; Best, J.L.; Roy, A.G. Effects of bed discordance on flow dynamics at open channel confluences. J. Hydraul. Eng. 1996, 122, 676–682. [Google Scholar] [CrossRef]
  31. Biron, P.; Roy, A.; Best, J. Turbulent flow structure at concordant and discordant open-channel confluences. Exp. Fluids 1996, 21, 437–446. [Google Scholar] [CrossRef]
  32. Boyer, C.; Roy, A.G.; Best, J.L. Dynamics of a river channel confluence with discordant beds: Flow turbulence, bed load sediment transport, and bed morphology. J. Geophys. Res. Solid Earth 2006, 111. [Google Scholar] [CrossRef]
  33. Best, J.L.; Reid, I. Separation zone at open-channel junctions. J. Hydraul. Eng. 1984, 110, 1588–1594. [Google Scholar] [CrossRef]
  34. Webber, N.B.; Greated, C.A. An investigation of flow behaviour at the junction of rectangular channels. Proc. Inst. Civil. Eng. 1966, 34, 321–334. [Google Scholar] [CrossRef]
  35. Tang, H.; Zhang, H.; Yuan, S. Hydrodynamics and contaminant transport on a degraded bed at a 90-degree channel confluence. Environ. Fluid Mech. 2018, 18, 443–463. [Google Scholar] [CrossRef]
  36. Yuan, S.; Tang, H.; Xiao, Y.; Xia, Y.; Melching, C.; Li, Z. Phosphorus contamination of the surface sediment at a river confluence. J. Hydrol. 2019, 573, 568–580. [Google Scholar] [CrossRef]
  37. Cheng, Z.; Constantinescu, G. Stratification effects on hydrodynamics and mixing at a river confluence with discordant bed. Environ. Fluid Mech. 2019, 20, 843–872. [Google Scholar] [CrossRef]
  38. Gurram, S.K.; Karki, K.S.; Hager, W.H. Subcritical junction flow. J. Hydraul. Eng. 1997, 123, 447–455. [Google Scholar] [CrossRef]
  39. Hsu, C.C.; Lee, W.J.; Chang, C.H. Subcritical open-channel junction flow. J. Hydraul. Eng. 1998, 124, 847–855. [Google Scholar] [CrossRef]
  40. Weber, L.J.; Schumate, E.D.; Mawer, N. Experiments on flow at a 90 open-channel junction. J. Hydraul. Eng. 2001, 127, 340–350. [Google Scholar] [CrossRef]
  41. Guillén-Ludeña, S.; Franca, M.; Cardoso, A.; Schleiss, A. Evolution of the hydromorphodynamics of mountain river confluences for varying discharge ratios and junction angles. Geomorphology 2016, 255, 1–15. [Google Scholar] [CrossRef]
  42. Leite Ribeiro, M.; Blanckaert, K.; Roy, A.; Schleiss, A.J. Flow and sediment dynamics in channel confluences. J. Geophys. Res. Earth Surf. 2012, 117. [Google Scholar] [CrossRef] [Green Version]
  43. Best, J.L. Sediment transport and bed morphology at river channel confluences. Sedimentology 1988, 35, 481–498. [Google Scholar] [CrossRef]
  44. Nazari-Giglou, A.; Jabbari-Sahebari, A.; Shakibaeinia, A.; Borghei, S.M. An experimental study of sediment transport in channel confluences. Int. J. Sediment Res. 2016, 31, 87–96. [Google Scholar] [CrossRef]
  45. Yuan, S.; Tang, H.; Xiao, Y.; Qiu, X.; Xia, Y. Water flow and sediment transport at open-channel confluences: An experimental study. J. Hydraul. Res. 2018, 56, 333–350. [Google Scholar] [CrossRef]
  46. Rhoads, B.L.; Sukhodolov, A.N. Spatial and temporal structure of shear layer turbulence at a stream confluence. Water Resour. Res. 2004, 40. [Google Scholar] [CrossRef]
  47. Rhoads, B.L.; Sukhodolov, A.N. Lateral momentum flux and the spatial evolution of flow within a confluence mixing interface. Water Resour. Res. 2008, 44. [Google Scholar] [CrossRef]
  48. Rhoads, B.L.; Sukhodolov, A.N. Field investigation of three-dimensional flow structure at stream confluences: 1. Thermal mixing and time-averaged velocities. Water Resour. Res. 2001, 37, 2393–2410. [Google Scholar] [CrossRef]
  49. Sukhodolov, A.N.; Rhoads, B.L. Field investigation of three-dimensional flow structure at stream confluences: 2. Turbulence. Water Resour. Res. 2001, 37, 2411–2424. [Google Scholar] [CrossRef]
  50. Mosley, M.P. An experimental study of channel confluences. J. Geol. 1976, 84, 535–562. [Google Scholar] [CrossRef]
  51. Wallis, E.; Nally, R.M.; Lake, P.S. A Bayesian analysis of physical habitat changes at tributary confluences in cobble-bed upland streams of the Acheron River basin, Australia. Water Resour. Res. 2008, 44. [Google Scholar] [CrossRef] [Green Version]
  52. Best, J.L.; Rhoads, B.L. River Confluences, Tributaries and the Fluvial Network; John Wiley & Sons, Ltd.: Chichester, UK, 2008; Chapter Sediment transport, bed morphology and the sedimentology of river channel confluences; pp. 45–72. [Google Scholar]
  53. Cea, L.; Puertas, J.; Vázquez-Cendón, M.E. Depth Averaged Modelling of Turbulent Shallow Water Flow with Wet-Dry Fronts. Arch. Comput. Methods Eng. 2007, 14, 303–341. [Google Scholar] [CrossRef]
  54. Rastogi, A.K.; Rodi, W. Predictions of heat and mass transfer in open channels. J. Hydraul. Div. 1978, 104, 397–420. [Google Scholar]
  55. Ashworth, P.; Ferguson, R. Interrelationships of Channel Processes, Changes and Sediments in a Proglacial Braided River. Geogr. Ann. Ser. A Phys. Geogr. 1986, 68, 361–371. [Google Scholar] [CrossRef]
  56. Leeder, M.R. On the Interactions between Turbulent Flow, Sediment Transport and Bedform Mechanics in Channelized Flows. In Modern and Ancient Fluvial Systems; John Wiley & Sons, Ltd.: Hoboken, NJ, USA, 2009; pp. 3–18. [Google Scholar] [CrossRef]
  57. Anderson, R.S. Modeling the tor-dotted crests, bedrock edges, and parabolic profiles of high alpine surfaces of the Wind River Range, Wyoming. Geomorphology 2002, 46, 35–58. [Google Scholar] [CrossRef]
  58. Mudd, S.M.; Furbish, D.J. Influence of chemical denudation on hillslope morphology. J. Geophys. Res. Earth Surf. 2004, 109. [Google Scholar] [CrossRef] [Green Version]
  59. Paola, C.; Voller, V.R. A generalized Exner equation for sediment mass balance. J. Geophys. Res. Earth Surf. 2005, 110. [Google Scholar] [CrossRef]
  60. Van Rijn, L.C. Sediment Transport, Part I: Bed Load Transport. J. Hydraul. Eng. 1984, 110, 1431–1456. [Google Scholar] [CrossRef] [Green Version]
  61. Shields, A. Anwendung Der Aehnlichkeitsmechanik Und Der Turbulenzforschung Auf Die Geschiebebewegung. Ph.D. Thesis, Technical University Berlin, Berlin, Germany, 1936. [Google Scholar]
  62. Van Rijn, L.C. Sediment Transport, Part II: Suspended Load Transport. J. Hydraul. Eng. 1984, 110, 1613–1641. [Google Scholar] [CrossRef]
  63. Van Leer, B. Towards the Ultimate Conservative Difference Scheme, V. A Second Order Sequel to Godunov’s Method. J. Comput. Phys. 1979, 32, 101–136. [Google Scholar] [CrossRef]
  64. Alcrudo, A.; García-Navarro, P. A High Resolution Godunov–Type Scheme in Finite Volumes for the 2D Shallow Water Equations. Int. J. Numer. Methods Eng. 1993, 16, 489–505. [Google Scholar] [CrossRef]
  65. García-Navarro, P.; Hubbard, M.E.; Priestley, A. Genuinely Multidimensional Upwinding for the 2D Shallow Water Equations. J. Comput. Phys. 1995, 121, 79–93. [Google Scholar] [CrossRef]
  66. Toro, E.F.; García-Navarro, P. Godunov–Type Methods for Free–Surface Shallow Flows: A Review. J. Hydraul. Res. 2007, 45, 736–751. [Google Scholar] [CrossRef]
  67. Cueto-Felgueroso, L.; Colominas, I. High-order finite volume methods and multiresolution reproducing kernels. Arch. Comput. Methods Eng. 2008, 15, 185–228. [Google Scholar] [CrossRef]
  68. Cueto-Felgueroso, L.; Colominas, I.; Fe, J.; Navarrina, F.; Casteleiro, M. High-order finite volume schemes on unstructured grids using moving least-squares reconstruction. Application to shallow water dynamics. Int. J. Numer. Methods Eng. 2006, 65, 295–331. [Google Scholar] [CrossRef] [Green Version]
  69. Navas-Montilla, A.; Murillo, J.; García-Navarro, P. High order simulation models for the resolution of wave propagation phenomena in turbulent free surface flows. Ing. Agua 2019, 23, 275–287. [Google Scholar] [CrossRef]
  70. Pinto Coelho, M.M.L. Experimental determination of free surface levels at open-channel junctions. J. Hydraul. Res. 2015, 53, 394–399. [Google Scholar] [CrossRef]
  71. Cueto-Felgueroso, L.; Santillán, D.; García-Palacios, J.H.; Garrote, L. Comparison between 2D Shallow-Water Simulations and Energy-Momentum Computations for Transcritical Flow Past Channel Contractions. Water 2019, 11, 1476. [Google Scholar] [CrossRef] [Green Version]
  72. Muller, R. Theoretische Grundlagen der Flussund Wildbachverbauungen; Leemann: Zurich, Switzerland, 1943. [Google Scholar]
  73. Strickler, A. Beitrage zur Frage der Geschwindigkeitsformel und der Rauhigkeitszahlen fur Strome, Kanale und Geschlossene Leitungen; Amt. f. Wasserwirtschaft: Berna, Switzerland, 1923. [Google Scholar]
  74. Bellin, N.; Vanacker, V.; Van Wesemael, B.; Solé-Benet, A.; Bakker, M. Natural and anthropogenic controls on soil erosion in the Internal Betic Cordillera (southeast Spain). Catena 2011, 87, 190–200. [Google Scholar] [CrossRef] [Green Version]
  75. Martinez-Mena, M.; Castillo, V.; Albaladejo, J. Hydrological and erosional response to natural rainfall in a semi-arid area of south-east Spain. Hydrol. Process. 2001, 15, 557–571. [Google Scholar] [CrossRef]
  76. Álvarez, A.J.; Montañés, C.G.; Orduña, L.M.; Caballer, L.I.; Revilla, J.G. El mapa de caudales máximos de las cuencas intercomunitarias. Rev. Obras Públicas 2012, 3533, 7–32. [Google Scholar]
  77. Santillán, D.; Mediero, L.; Garrote, L. Modelling uncertainty of flood quantile estimations at ungauged sites by Bayesian networks. J. Hydroinform. 2014, 16, 822–838. [Google Scholar] [CrossRef] [Green Version]
  78. Odgaard, A.J.; Bergs, M.A. Flow processes in a curved alluvial channel. Water Resour. Res. 1988, 24, 45–56. [Google Scholar] [CrossRef]
  79. Wu, W.; Rodi, W.; Wenka, T. 3D numerical modeling of flow and sediment transport in open channels. J. Hydraul. Eng. 2000, 126, 4–15. [Google Scholar] [CrossRef]
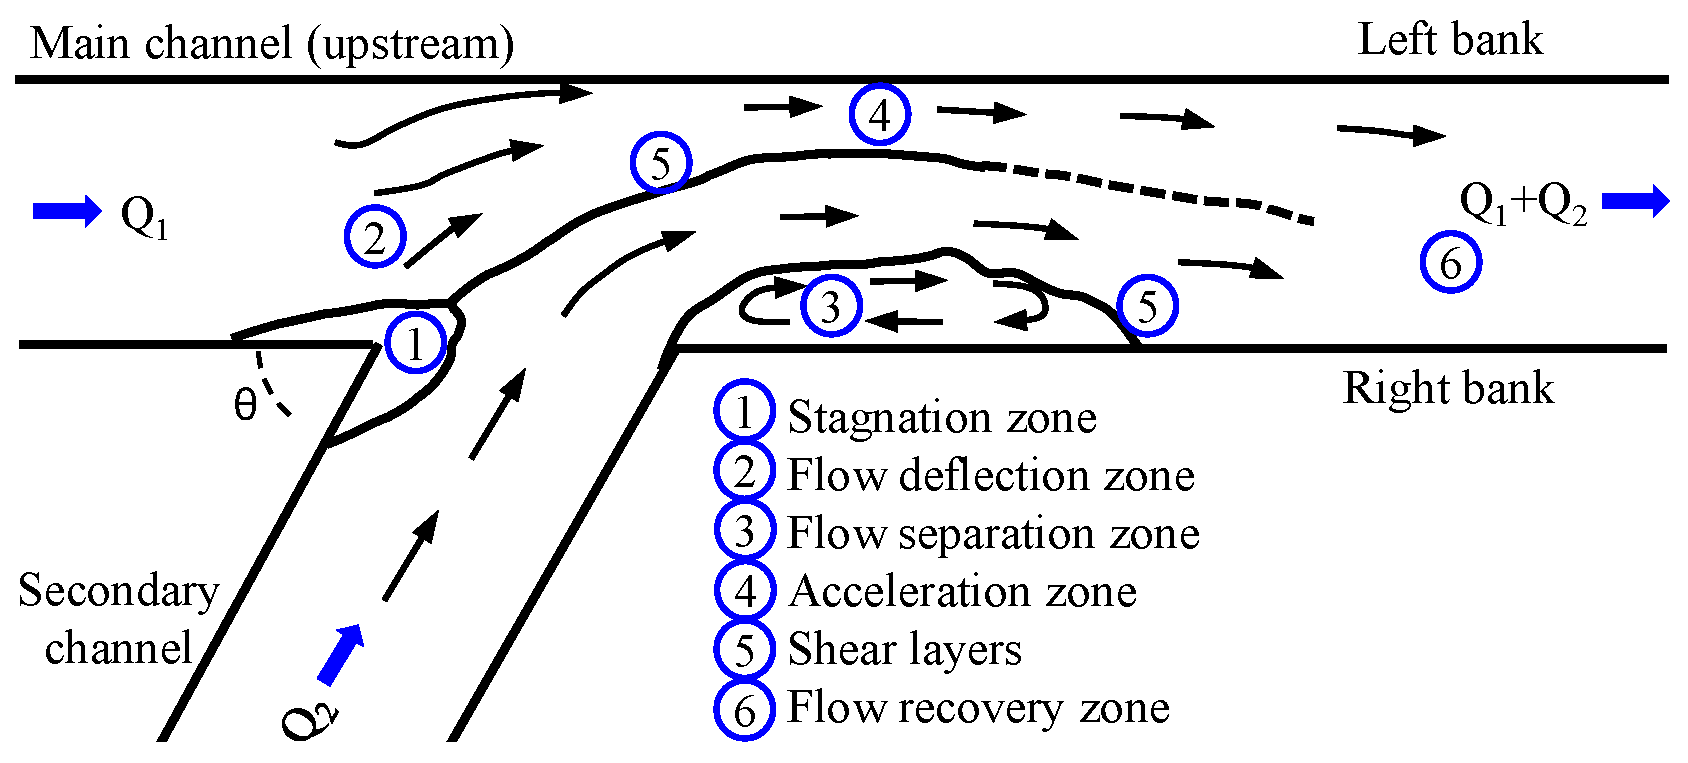
Figure 1. Hydrodynamics at open-channel junctions. Here we plot the six characteristic regions.
Water 12 03340 g001
Figure 2. Validation of the numerical hydraulic model with laboratory experiments. (a) Setup of the laboratory experiments. (b) Contour plot of the water depth computed with the numerical model. Experiment # 10. (c) Contour plot of the x-velocity gradient given by U x / y computed with the numerical model. Experiment # 10. (d) Water depth for the model with θ = 30 along the main channel, and (e) along the secondary channel. (f) Water depth for the model with θ = 60 along the main channel, and (g) along the secondary channel.
Water 12 03340 g002
Figure 3. Sketch of bed erosion experiment setup and results. Panel (a) depicts the setup. It consists of a perpendicular confluence of rectangular concordant-bed open-channels. The dimensions of the channels are included in the figure. Panel (b) depicts a contour of the steady-state bed elevation provided by the laboratory experiment. The initial bed elevation was 5.5 cm. The plot is reproduced from [45]. Panel (c) includes the steady-state bed elevation computed with the numerical model. Units are in cm.
Water 12 03340 g003
Figure 4. Evolution of bed elevation, water head, water velocity, and stream lines computed with the mathematical model. The first row plots the contour plot of the erosion at time 30 s—panel (a), 3600 s—panel (b), and 10,800 s—panel (c). Erosion is positive and sedimentation negative. The second row shows the water depth at time 30 s—panel (d), 3600 s—panel (e), and 10,800 s—panel (f). The third row includes the water velocity at time 30 s—panel (g), 3600 s—panel (h), and 10,800 s—panel (i). The last row includes the stream lines at time 30 s—panel (j), 3600 s—panel (k), and 10,800 s—panel (l).
Water 12 03340 g004
Figure 5. Mesh refinement study. We plot the erosion patterns for four increasingly refined meshes: in panel (a) the mesh size, Δ δ , is 0.5 cm, in panel (b) 1 cm, in panel (c) 2 cm, and in panel (d) 4 cm. We plot two erosion profiles of the main channel at x-coordinate 0 cm in panel (e) and x = 20 cm in panel (f). The reference system is depicted in Figure 3a. Erosion is positive and sedimentation negative.
Water 12 03340 g005
Figure 6. Effect of the friction angle of sediment on the erosion pattern. We plot the erosion contour plot for four friction angles, ϕ : in panel (a) ϕ is 20 , in panel (b) ϕ = 25 , in panel (c) ϕ = 30 , and in panel (d) ϕ = 35 . We plot two erosion profiles of the main channel at x-coordinate 0 cm in panel (e) and x = 20 cm in panel (f). The reference system is depicted in Figure 3a. Erosion is positive and sedimentation negative.
Water 12 03340 g006
Figure 7. Effect of roughness on the erosion pattern. We plot the erosion contour plot for four Manning’s coefficients, n: in panel (a) n is 0.015 s·m 1 / 3 , in panel (b) n = 0.018 s·m 1 / 3 , in panel (c) n = 0.020 s·m 1 / 3 , and in panel (d) n = 0.025 s·m 1 / 3 . We plot two erosion profiles of the main channel at x-coordinate 0 cm in panel (e) and x = 20 cm in panel (f). The reference system is depicted in Figure 3a. Erosion is positive and sedimentation negative.
Water 12 03340 g007
Figure 8. Model geometry and input flow-rates. In panel (a) we plot the location of the study area and the elevation map of our domain. Panel (b) includes the flood hydrographs for three return periods: T = 2, 10, and 25 years. Panel (c) depicts two flood hydrographs for the return period T = 10 years. The plot includes two discharge ratios, i.e., two flow distribution between the Nacimiento and Almarax rivers.
Water 12 03340 g008
Figure 9. Effect of erosion on the flow patterns. In panel (a) we depict the contour plot of erosion after the 25-year flood event. Erosion is positive and sedimentation negative. Panel (b) depicts the water depth at time step 2.5 h for the 25-year flood event computed with bed-mobile model, whereas panel (c) plots the result provided by a model without bed erosion. Panel (d) depicts the water velocity at time step 2.5 h for the 25-year flood event computed with a bed mobile model, and panel (e) plots the result provided by a model without bed erosion.
Water 12 03340 g009
Figure 10. Effect of flood return period on the erosion pattern. We plot the erosion patterns for three flood events with return periods: (a) T = 5 years, (b) T = 10 years, (c) T = 25 years. Erosion is positive and sedimentation negative.
Water 12 03340 g010
Figure 11. Effect of the discharge ratio on the erosion patterns. Here we plot the erosion patterns under the 10-year flood event. In panel (a) the total flow distributes 80% in the Andarax river and 20% in the Nacimiento river, in panel (b) the distribution is 40% in the Andarax river and 60% in the Nacimiento river, and in panel (c) it is 20% in the Andarax river and 80% in the Nacimiento river.
Water 12 03340 g011
Table 1. Experimental results taken from [70].
# Experiment θ Q 1 (L/s) Q 2 (L/s) y 1 (cm) y 2 (cm) y 3 (cm) y 4 (cm) y 5 (cm)
1 30 5.1 5.4 8.0 8.2 7.9 8.0 6.7
2 30 5.0 10.1 10.2 10.3 10.1 10.1 8.3
3 30 5.0 14.9 11.9 12.1 11.7 11.8 10.1
4 30 14.9 9.8 14.0 14.1 13.9 14.0 11.5
5 30 14.9 14.9 15.9 16.1 15.8 15.9 12.7
6 60 5.1 4.9 8.1 8.1 7.4 7.8 6.1
7 60 5.1 9.9 10.6 10.6 9.7 10.4 8.2
8 60 5.1 14.8 12.6 12.6 11.7 12.2 9.9
9 60 15.1 9.9 14.5 14.4 13.9 14.3 11.5
10 60 15.1 14.8 16.3 16.2 15.7 16.0 12.7
Publisher’s Note: MDPI stays neutral with regard to jurisdictional claims in published maps and institutional affiliations.