Article

Selection of Macroinvertebrate Indices and Metrics for Assessing Sediment Quality in the St. Lawrence River (QC, Canada)

by
Mélanie Desrosiers
1,*,
Bernadette Pinel-Alloul
2,* and
Charlotte Spilmont
3
1
Division de l’Ecotoxicologie et de l’Evaluation du Risque, Centre d’Expertise en Analyse Environnementale du Québec, Ministère de l’Environnement et de la Lutte Contre les Changements Climatiques (MELCC), Québec, QC G1P 3W8, Canada
2
Groupe de Recherche Interuniversitaire en Limnologie (GRIL), Département de Sciences Biologiques, Université de Montréal, Montréal, QC H2V 0B3, Canada
3
UFR Sciences fondamentales et appliquées, Université de Lorraine, 57070 Metz, France
*
Authors to whom correspondence should be addressed.
Water 2020, 12(12), 3335; https://doi.org/10.3390/w12123335
Submission received: 5 November 2020 / Revised: 25 November 2020 / Accepted: 25 November 2020 / Published: 27 November 2020
(This article belongs to the Special Issue Freshwater Macroinvertebrates: Main Gaps and Future Trends)

Abstract

:
This study aims to evaluate the anthropogenic pressure in the St. Lawrence River by assessing the relationships between composition and chemical contamination of sediments and macroinvertebrate community structure using a selection of indices and metrics. The aims of this study are to (i) determine the composition of macroinvertebrate community in sediments across a gradient of disturbance, (ii) select relevant macroinvertebrate indices and metrics for the assessment of sediment quality, (iii) investigate whether responses of selected indices and metrics differ across habitats and/or sediment quality classes, and finally, (iv) determine the thresholds for critical contaminants related to significant changes in the most relevant indices and metrics. Organic and inorganic contaminants as well as other sediment variables (sediment grain size, total organic carbon, nutrients, etc.) and macroinvertebrate assemblages were determined in 59 sites along the river. Fourteen macroinvertebrate indices and metrics, on the 264 initially selected, were shown to be the most effective to be used in bioassessment for the St. Lawrence River. However, the variation in macroinvertebrate indices and metrics remains strongly explained by habitat characteristics, such as sediment grain size or the level of nutrients. There is also an influence of metals and, to a lesser extent, organic contaminants such as petroleum hydrocarbons. The 14 selected indices and metrics are promising bioassessment tools that are easy to use and interpret in an environmental assessment of sediment quality in the St. Lawrence River.

1. Introduction

According to the requirements of the European Water Framework Directive [1,2], the Canadian Aquatic Biomonitoring Network (CABIN; [3]), and the U.S. Environmental Protection Agency [4], macroinvertebrates have been commonly used for the bioassessment of anthropogenic disturbances in rivers because they are (i) reliable bioindicators of water and sediment qualities [5,6], (ii) efficient and cost-effective biomonitoring tools [7,8], and (iii) useful to differentiate reference conditions from impaired sites [9,10]. In streams and small rivers, studies showed that the structure of the benthic macroinvertebrate community reflects the impacts of anthropogenic disturbances such as water acidification, organic pollution, metal contamination, and habitat degradation [11,12,13,14]. In large rivers, changes in the macroinvertebrate community are related to multiple environmental factors [15], including changes in habitat vegetation [16,17], water-level fluctuations [18], water quality [19,20], sediment grain size and contamination [21,22,23], and human disturbances [24].
Bioassessment approaches comparing reference and disturbed sites are designed to determine whether poor water or sediment qualities are stressing the macroinvertebrate community beyond the range of natural variation [25,26]. However, this is a difficult task due to the complexity of river ecosystems and the interaction of multiple factors which limit the possibility to predict the overall responses of macroinvertebrate assemblages to environmental changes, either natural or anthropogenic. Difficulty to find reference sites in large and complex rivers under significant anthropogenic stressors is another problematic issue that further limits bioassessment. Approaches comparing sites on a disturbance gradient are now more suitable for bioassessment in rivers because they help to establish the relationships between macroinvertebrate community structure and natural environmental conditions and anthropogenic stressors [6,23].
Over the past 20 years, 60% of the biological indicators used to assess ecological quality of rivers were based on macroinvertebrate communities [27]. A myriad of indices and metrics have been applied in bioassessment approaches to establish the various sensitivities of macroinvertebrates to different types of disturbances. However, the development of most suitable macrobenthic indices and metrics for the bioassessment of the ecological quality status of rivers and lakes is still in progress. The first indices that come to mind are the diversity indices and metrics based on taxon richness, used since the eighties. However, their relevance has been discussed [28] because taxon richness and diversity indices depend more on geographical, climatic, historical, and ecological factors than on the direct impact of anthropogenic stressors, except in the case of extreme physical or chemical disturbance. Diversity indices and metrics alone are no longer recognized as relevant tools in biological assessment [29] but they could be included such as multimetric STAR-ICM index in small, lowland rivers in Europe [30]. Biotic indices combining richness and abundance of sensitive or tolerant taxa were more successful in detecting ecological changes among sites and the effects of anthropogenic stressors in rivers [31], lakes [32] and ponds [33]. Among the indices used to assess stressor-specific disturbances, we can cite: (i) the saprobic index [8,34] and the Hilsenhoff index [35,36] for organic pollution, (ii) the Index of Community Sensitivity (ICS, [22]) or the Invertebrate Community Index (ICI, [37]) for water quality and sediment metal contamination. More complex integrated monitoring based on multimetric procedures has recently been implemented for biological assessment in Europe [12,20,38,39] and North America [22,24,37,40]. These procedures allow the selection and aggregation of metric scores in a single index that helps to determine whether action or restoration is needed and simplify management and decision-making. Successful multimetric score procedures have been validated for river pollution surveys. As examples, we can cite: (i) the Biological Monitoring Working Party (BMWP) used in Spain [41], the UK [12], Poland [27], and Canada [42], (ii) the Index of Biotic Integrity (IBI, [43]) and the Panel Index [40] used in the USA, (iii) the Belgian Biotic Index (BBI, [44]) or the Multimetric Macroinvertebrate Index Flanders (MMIF, [12]) used in Belgium, and (iv) the Macroinvertebrate-Based Multimetric Index (IBMA) applied in Martinique and Guadeloupe territories [39]. In Canada, multimetric indices have been developed to assess sensitivity of benthic biota to river flow regimes [45] and water quality [42]. However, in Canada, there are still few developments towards a multimetric approach using macroinvertebrates to assess sediment contamination in large rivers compared to those in other countries [15,24,46,47]. The future needs for the development of sediment bioassessment methods in large rivers include: (i) the selection of relevant macroinvertebrates indices and metrics based on ecological principles underlying metric choice for specific disturbances, (ii) the validation of the potential of indices and metrics to discriminate sites according to a gradient of environmental conditions and disturbances, and (iii) the determination of criteria and management thresholds that indicate environmental degradation and the need for quantitative assessment studies and remediation projects.
The present research focuses on the St. Lawrence River (QC, Canada), one of the most important large rivers in the world draining a watershed area of 1,610,000 km2 and flowing across 1000 km from Lake Ontario to the Gulf of St. Lawrence. Since the 1950s, intensive agriculture, urbanization, and industrialization have caused the contamination of sediments in the St. Lawrence River [48]. Macroinvertebrates are a critical component of the wetland and sediment food webs in the St. Lawrence River [18]. Previous studies showed that their distribution, community composition and functional traits vary according to ecological and toxicological factors such as vegetation types (filamentous algal mats, emergent and submerged macrophytes) [16], water quality and sediment contamination [17,23,37,49], landscape features and hydrological regime [18]. However, most of these studies were limited to littoral wetland habitats or to specific approaches based on species assemblages and functional traits. Since macroinvertebrates can be impacted by sediment contaminants, their biomonitoring is required to complete the contamination assessment, to evaluate the ecotoxicological risk, and to determine the remediation needs at sediment-contaminated sites in the St. Lawrence River. This large river is also an essential transportation route in northeastern America, and periodic dredging of sediment is required for the maintenance of the waterway and harbour facility. Because dredged sediments may contain a range of contaminants that could affect benthic organisms at deposit sites, environmental risk assessment and management of these dredging projects are required to determine sediment quality [50].
No study has yet compared the potential of multiple indices and metrics to assess specific stressors such as sediment dredging and contamination across the fluvial section of the St. Lawrence River. The objectives of this study are as follows: (i) determine the composition of macroinvertebrate community in sediments of typical habitats across a gradient of disturbance, (ii) select relevant indices and metrics from a panel of macroinvertebrate indices and metrics based on their ecological relevance for the assessment of sediment quality and contamination and on their potential for large river ecotoxicological risk assessment, (iii) investigate whether sensitivity of selected indices and metrics differ across habitats and/or sediment quality classes, and finally, (iv) determine the thresholds for critical contaminants related to significant changes in the most relevant indices and metrics.

2. Materials and Methods

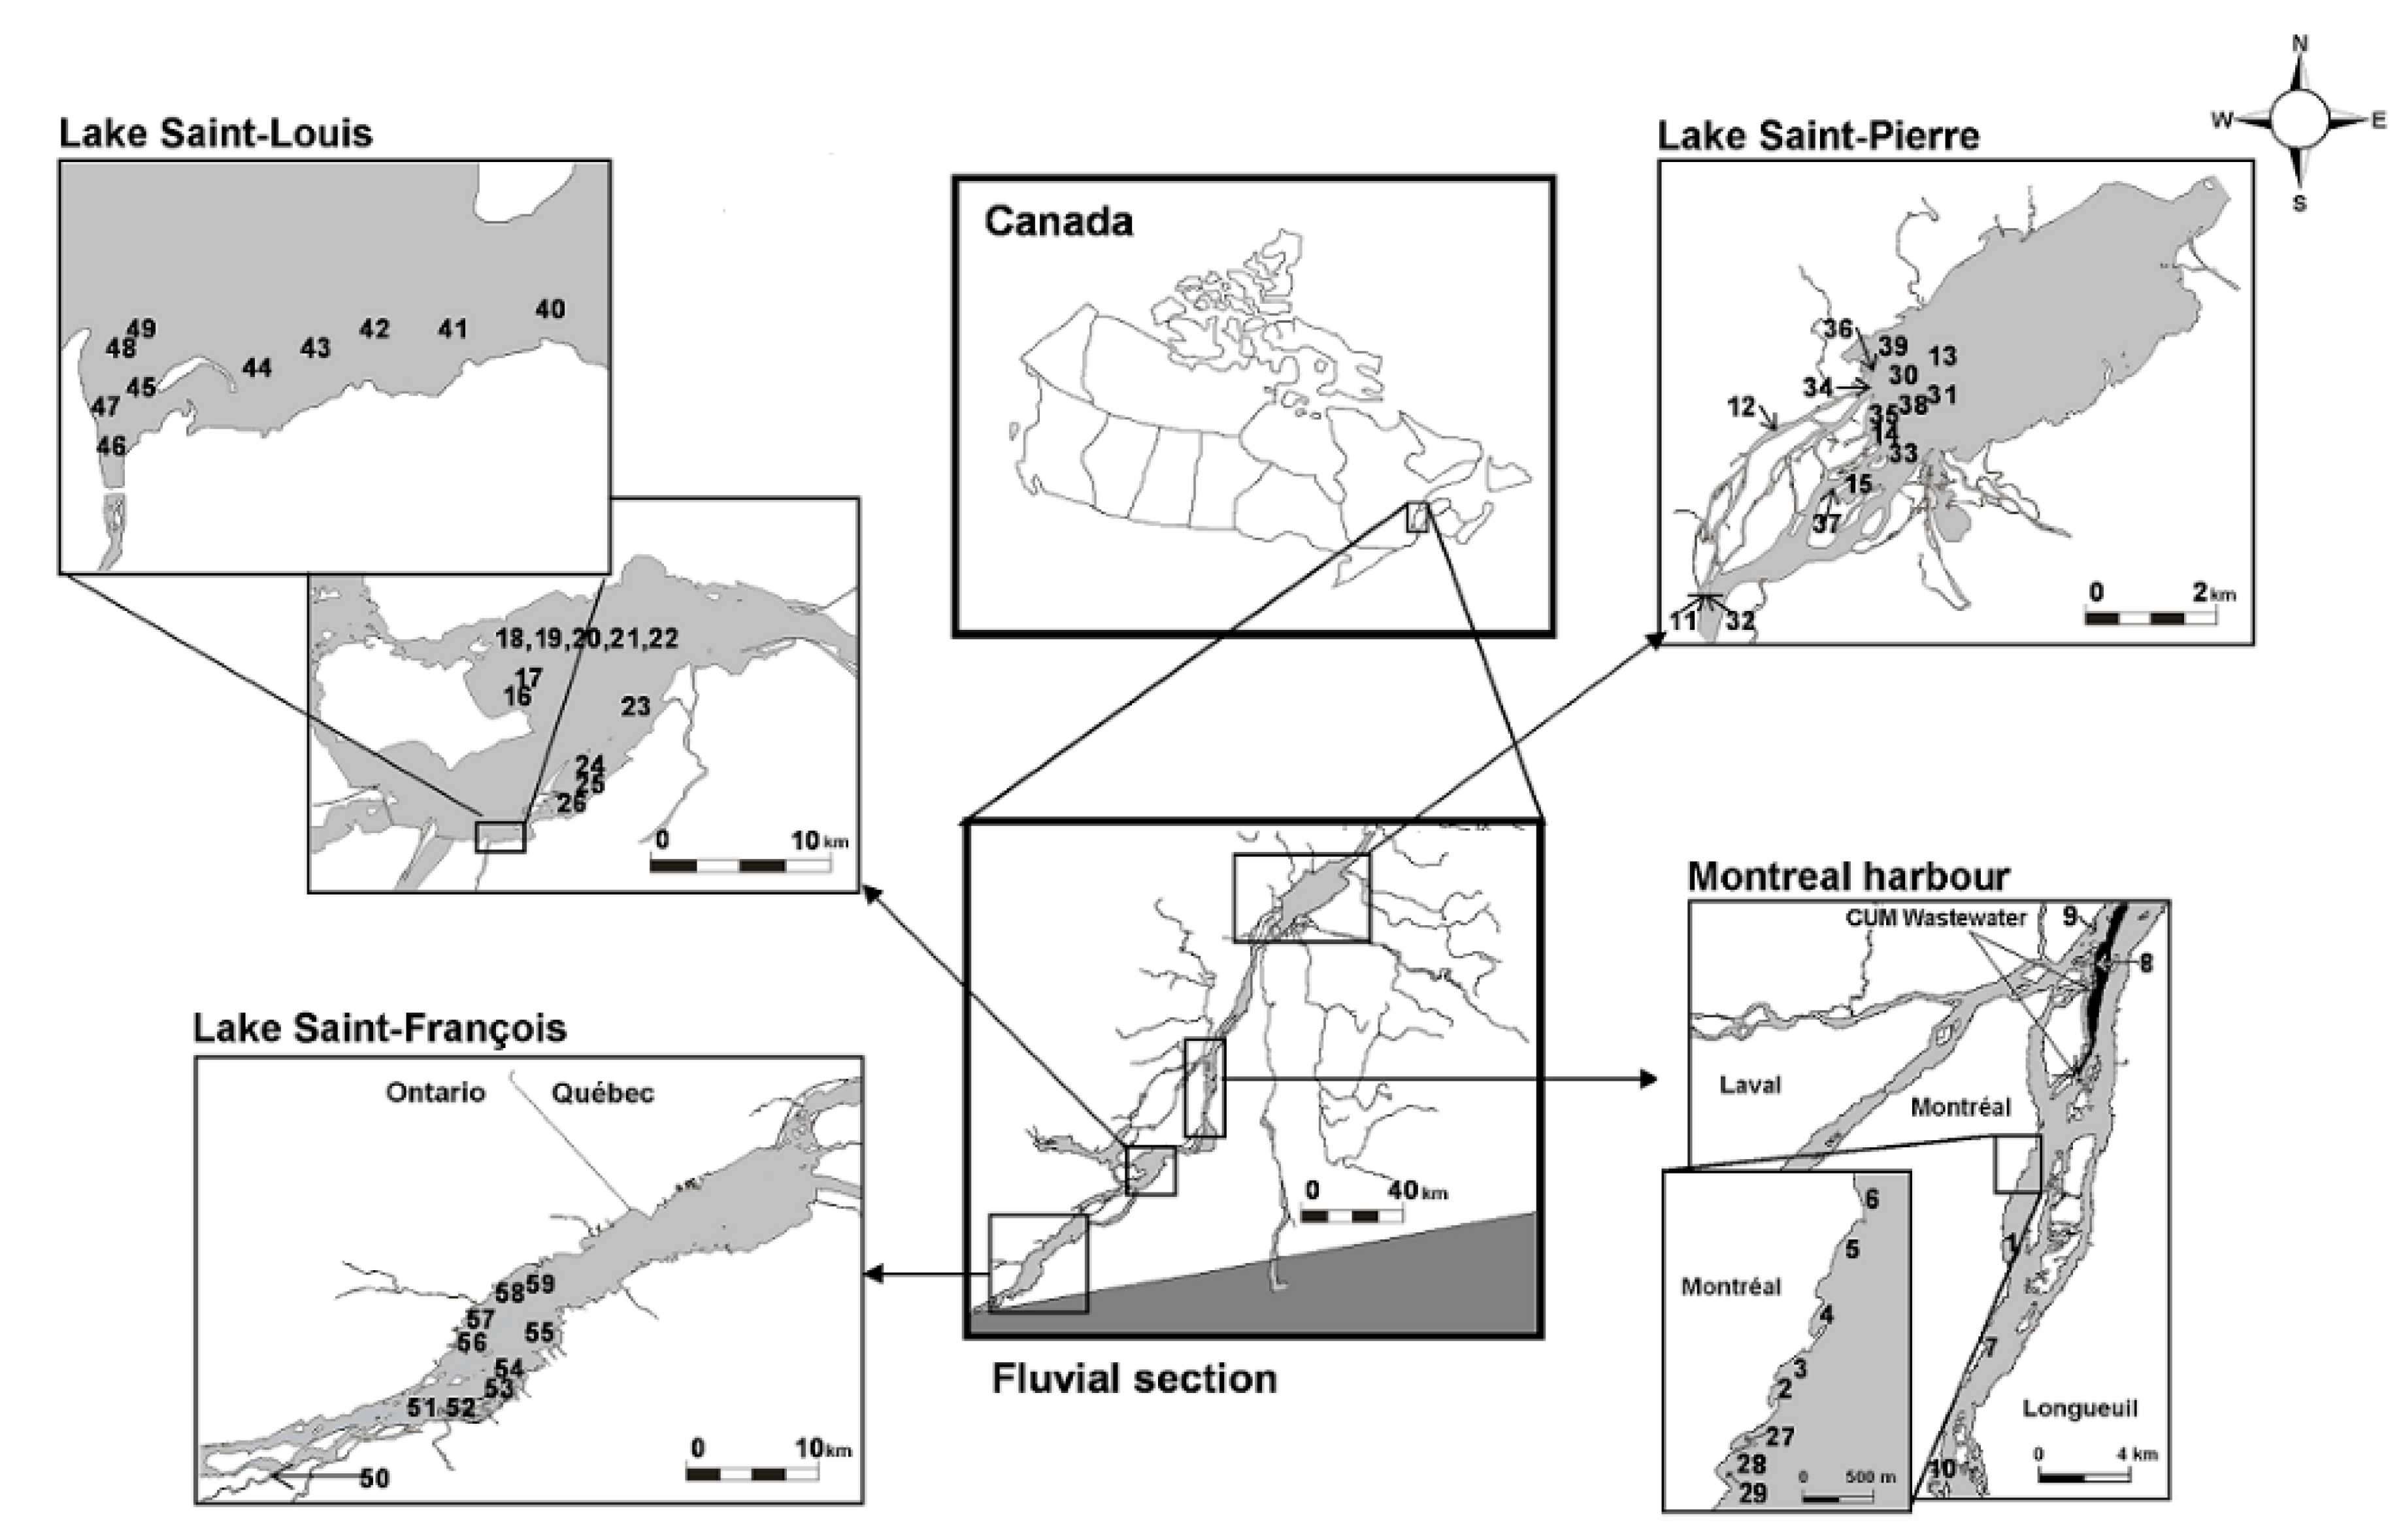
2.1. Sampling Sites at the St. Lawrence River

The study covers a 240 km longitudinal transect of the fluvial section of the St. Lawrence River including three fluvial lakes (Lake Saint-François, Lake Saint-Louis, and Lake Saint-Pierre) and the Montreal Harbour area (Figure 1). Sampling sites were in sedimentation zones impacted by fine-particle deposition, potential dredging, and past or present point sources of anthropogenic contamination [23]. A total of 59 sites were distributed among the different habitat zones and sampled during the fall of 2004 and 2005, because it is the period of higher biomass in the St. Lawrence River [17,23]. Ten sites were sampled in Lake Saint-François (LSF), the first natural enlargement of the St. Lawrence River downstream of Lake Ontario. This fluvial lake is relatively oligotrophic, shallow and covered with submerged macrophytes over most of its western section [37]. Its sediments were polluted by organic and metallic contaminants during the 1950–1980 period [48]. Twenty-one sites were sampled in Lake Saint-Louis (LSL), which receives waters from the Ottawa River in the north shore and from the St. Lawrence River in the south shore. In this fluvial lake, the waters and sediments of the north shore are enriched with organic carbon while those of the south-shore were polluted by metals, particularly mercury from industrial point sources in the 1960–1970 period [51,52,53]. Fifteen sites were sampled in Lake Saint-Pierre (LSP), the largest fluvial lake of the St. Lawrence River, 100 km downstream of Montreal. This large shallow lake is divided by the deep waterway, separating the north and south water masses. Three quarters of the lake area are covered with emergent and submerged vegetation, forming large wetlands inhabited by macroinvertebrates [16,17]. On the south shore, plumes from two rivers draining dairy farms and farmlands are point sources of nutrient and pesticide pollution, inducing the proliferation of benthic cyanobacteria [54]. Finally, thirteen sites were sampled in the Montreal Harbour area (MH), and downstream towards the Montreal municipality wastewater discharge plumes. The sediments in this area are the most heavily altered by organic and inorganic pollutants, and physical stress by regular maintenance dredging. All together, these sites represent the common habitats encountered in the fluvial section of the St. Lawrence River and cover a wide range of environmental conditions across a gradient of disturbances.

2.2. Sediment Sampling and Analysis

Twenty to twenty-five litres of surface sediments were collected using a Shipek grab sampler (400 cm2) at each site and placed in clear polyethylene bags. In the field, sediment samples were kept on ice in containers for 24–30 h and thereafter stored at 4 ᵒC in a cold chamber at the laboratory [23]. Up to 2 days after sampling, each sediment sample was manually homogenized and sieved through a 2 mm mesh size to retain coarse material prior to chemical analysis. The sediment analyses followed standard Quality Assurance and Control (QA/QC) protocols (see Table S1, Supplementary Materials for specific methods and detection limits in [49,50]). A wide range of sediment characteristics such as pH, total and dissolved organic carbon contents (TOC, DOC), particle grain size (% of sand, silt, clay, gravel) as well as the concentrations of nutrients, metalloids, metals and organic chemicals were analyzed (see Table S1, Supplementary Materials). Based on the sediment quality criteria established in the province of Quebec (Canada) for the remediation framework of contamination sites, the sediment in each site was classified into three quality classes (Table 1) according to the highest classification observed among all contaminants covered by the criteria [55]. Class 1 represents better sediments quality with all contaminants below the level of probable effect (PEL). Class 2 represents intermediate sediments quality with at least one contaminant between PEL and frequent effect levels (FEL). Class 3 represents lower sediments quality with at least one contaminant at a concentration higher than FEL. Class 3 sites were also divided into A and B categories according to whether the sites were contaminated and also under physical stress and degraded habitat (A: most of the Montreal Harbour sites) or only with historical contamination (1960–1980), without recent physical anthropogenic stress and better habitat condition (B: some of the sites in fluvial lakes). Sediment Class 1 includes 2 LSF, 9 LSL, 12 LSP and 2 MH Montreal wastewater sites. Sediment Class 2 includes 5 LSF, 4 LSL, 3 LSP and 2 MH sites. Sediment Class 3 includes 3 LSF, 8 LSL, 9 MH and no LSP site (Table 1, see Figure 1 for location sites). Spatial patterns in sediment quality classes reflect the gradient of disturbances. LSP sediments were generally of higher quality (Class 1 and Class 2). LSF sediments were also mostly of higher quality (Class 1 and Class 2) with only 3 sites in Class 3. LSL sediments were distributed in all classes, mostly in Class 1 and Class 3. LSL sites of Class 3 (considered for remediation) were in the south shore near a historical point source (River St. Louis) of mercury contamination [51]. Most of the MH sediments were of poor quality (Class 3) except for 2 sites in Class 2. In the 2 sites in the Montreal wastewater plume (PM8-PM9), sediments were of good quality (Class 1).

2.3. Macroinvertebrate Sampling and Analysis

Triplicate samples of macroinvertebrates were collected from the sediments using the Shipek grab (400 cm2), placed in a polyethylene bag and preserved directly in the field with 10% formaldehyde solution. A Rose Bengal solution was added in each sample to stain macroinvertebrates and reduce sorting time. Back at the laboratory, the samples were rinsed with tap water on a 500 μm mesh size sieve, and the retained macroinvertebrates were transferred to 70% alcohol for subsequent identification [23]. Macroinvertebrates were counted and sorted in each replicate by a private company (SAB Laboratories Inc.); quality control was performed on 10% of the samples by a taxonomist expert (see [23,49] for more details). Variability in the number of taxa among replicated samples was low with less than 8% of new taxa sorted after analysing all triplicate samples compared to a single sample [49]. Macroinvertebrates were identified at the family and genus levels (except Nematoda) using several identification keys [56,57,58]. When the abundances of the dominant groups (Oligochaeta, Chironomidae and Gastropoda) were extremely high, a minimum of 100 individuals for these groups were randomly collected and identified. A complete list of the macroinvertebrate taxa recorded in the St. Lawrence River and used for this study is presented in Table S2 (Supplementary Materials). Dominance of macroinvertebrate taxonomical groups at each site served to establish spatial patterns in community composition among the habitat zones of the fluvial section, to calculate indices and metrics, and to determine the relationships with sediment characteristics and contamination.

2.4. Metrics Selection, Scoring, and Statistical Analysis

In the first step of the selection procedure (see Figure S1, Supplementary Materials), we made an inventory of all available macroinvertebrate indices and metrics based on taxon richness and diversity, abundance, and tolerance of taxa, multimetric biotic indices, and functional traits. This first selection gathered a total of 264 indices and metrics (see Table S3 in Supplementary Materials). Among these 264 indices and metrics, there were 21 usual indices of diversity and similarity, 72 metrics on richness, 93 indices and metrics on taxa abundances, 35 biotic indices, and 43 functional traits as recently proposed by Desrosiers et al. [49]. All indices and metrics that could not be calculated due to a lack of data (e.g., lack of data on taxa tolerance) or that were simply considered irrelevant to the current bioassessment in the St. Lawrence River (e.g., those used in small rivers and streams, or in foreign countries) were eliminated (33 indices and metrics in italics in Table S3). Finally, 231 indices and metrics were retained to test their relevance for assessing changes in macroinvertebrate community structure among the habitat zones of the fluvial section and among classes of sediment quality.
At the second step of the selection procedure (see Figure S1), we scored the 231 indices and metrics according to their potential to differentiate habitat zones (fluvial lakes and Montreal Harbour) and sediment quality classes by performing one-way ANOVAs (analysis of variance) by using a general linear model (GLM) with JMP (version 8.0.1, SAS Institute Inc Cary, NC, USA). Data distribution normality and variance equality were verified. In a small proportion, when the results did not meet these statistical requirements, we used a nonparametric test (Wilcoxon and Kruskal–Wallis). When analyses of variance were significant, differences among habitat zones or sediment classes were tested using Tukey–Kramer test for multiple comparisons. None of the indices and metrics without significant differences among habitat zones and classes of sediment quality were retained. Other indices and metrics showing significant differences among habitat zones (highlighted in blue in Table S3) or among sediment quality classes (highlighted in orange in Table S3), or among both habitat zones and sediment classes (highlighted in green in Table S3) were retained for further analysis. Since many of the indices and metrics could be redundant, a Spearman correlation table analysis among selected indices and metrics was performed to complement the analysis of variance to sustain our choices. This second procedure of selection based on analysis of variance and correlation analysis has enabled us to select 157 indices and metrics (in bold in Table S3) among the 231 ones retained after the first selection procedure.
In the third step of the selection procedure (see Figure S1), we applied principal component analysis (PCA) using CANOCO 4.0 [59,60] to determine the relevance of indices and metrics according to their collinearity and their potential to differentiate sampling sites in habitat zones. Collinearities among macroinvertebrate indices and metrics were determined by the angles between vectors ranging from 0° (maximum positive covariance) to 180° (maximum negative covariance), an angle of 90° indicating a lack of covariance [61]. A first PCA was carried out using the 157 indices and metrics retained after the second selection procedure. A stepwise sorting was performed by removing all indices and metrics with a low contribution in PCA ordination, i.e., close to the center or inside the circle of equilibrium contribution. Only those indices or metrics with a projection vector longer than the radius of the equilibrium contribution circle on the first two PCA axes were interpreted as the most suitable and relevant considering their potential to differentiate the sites representing a gradient of disturbance. The final selection was performed using PCA analyses with all sampling sites first and then with only the most representative sites (without extreme sites in LSL) to select the most parsimonious number of indices and metrics. After this third selection procedure, only 14 indices and metrics were retained (see Section 3).
In the fourth step of the selection procedure (see Figure S1) to establish a model linking the selected macroinvertebrate indices and metrics to sediment quality, we performed redundancy analyses (RDAs) using Monte Carlo unrestricted 999 permutation tests [61]. In the final RDA models, only the variables presenting significant relationships (prob. < 0.05) after stepwise selection were kept. The significance of the first three axes of the RDA was tested using the ‘marginal’ testing method using CANOCO 4.0 [59,60]. Finally, a regression tree methodology was applied using JMP software to develop predictive models determining contaminant thresholds which partitioned sites into homogeneous groups for each of the 14 final indices and metrics. This technique employs Euclidean distances to summarize between-site differences in community composition along changes in sediment contamination. Tree algorithms split the macroinvertebrate data set (assign macroinvertebrate data to groups) hierarchically (groups are then divided into subgroups) based on the ability of the contamination variables to predict changes in macroinvertebrate composition. This method is particularly useful to detect partitions (abrupt changes) in indices and metrics along a disturbance gradient in relation to significant thresholds in sediment contaminants [62,63].

3. Results

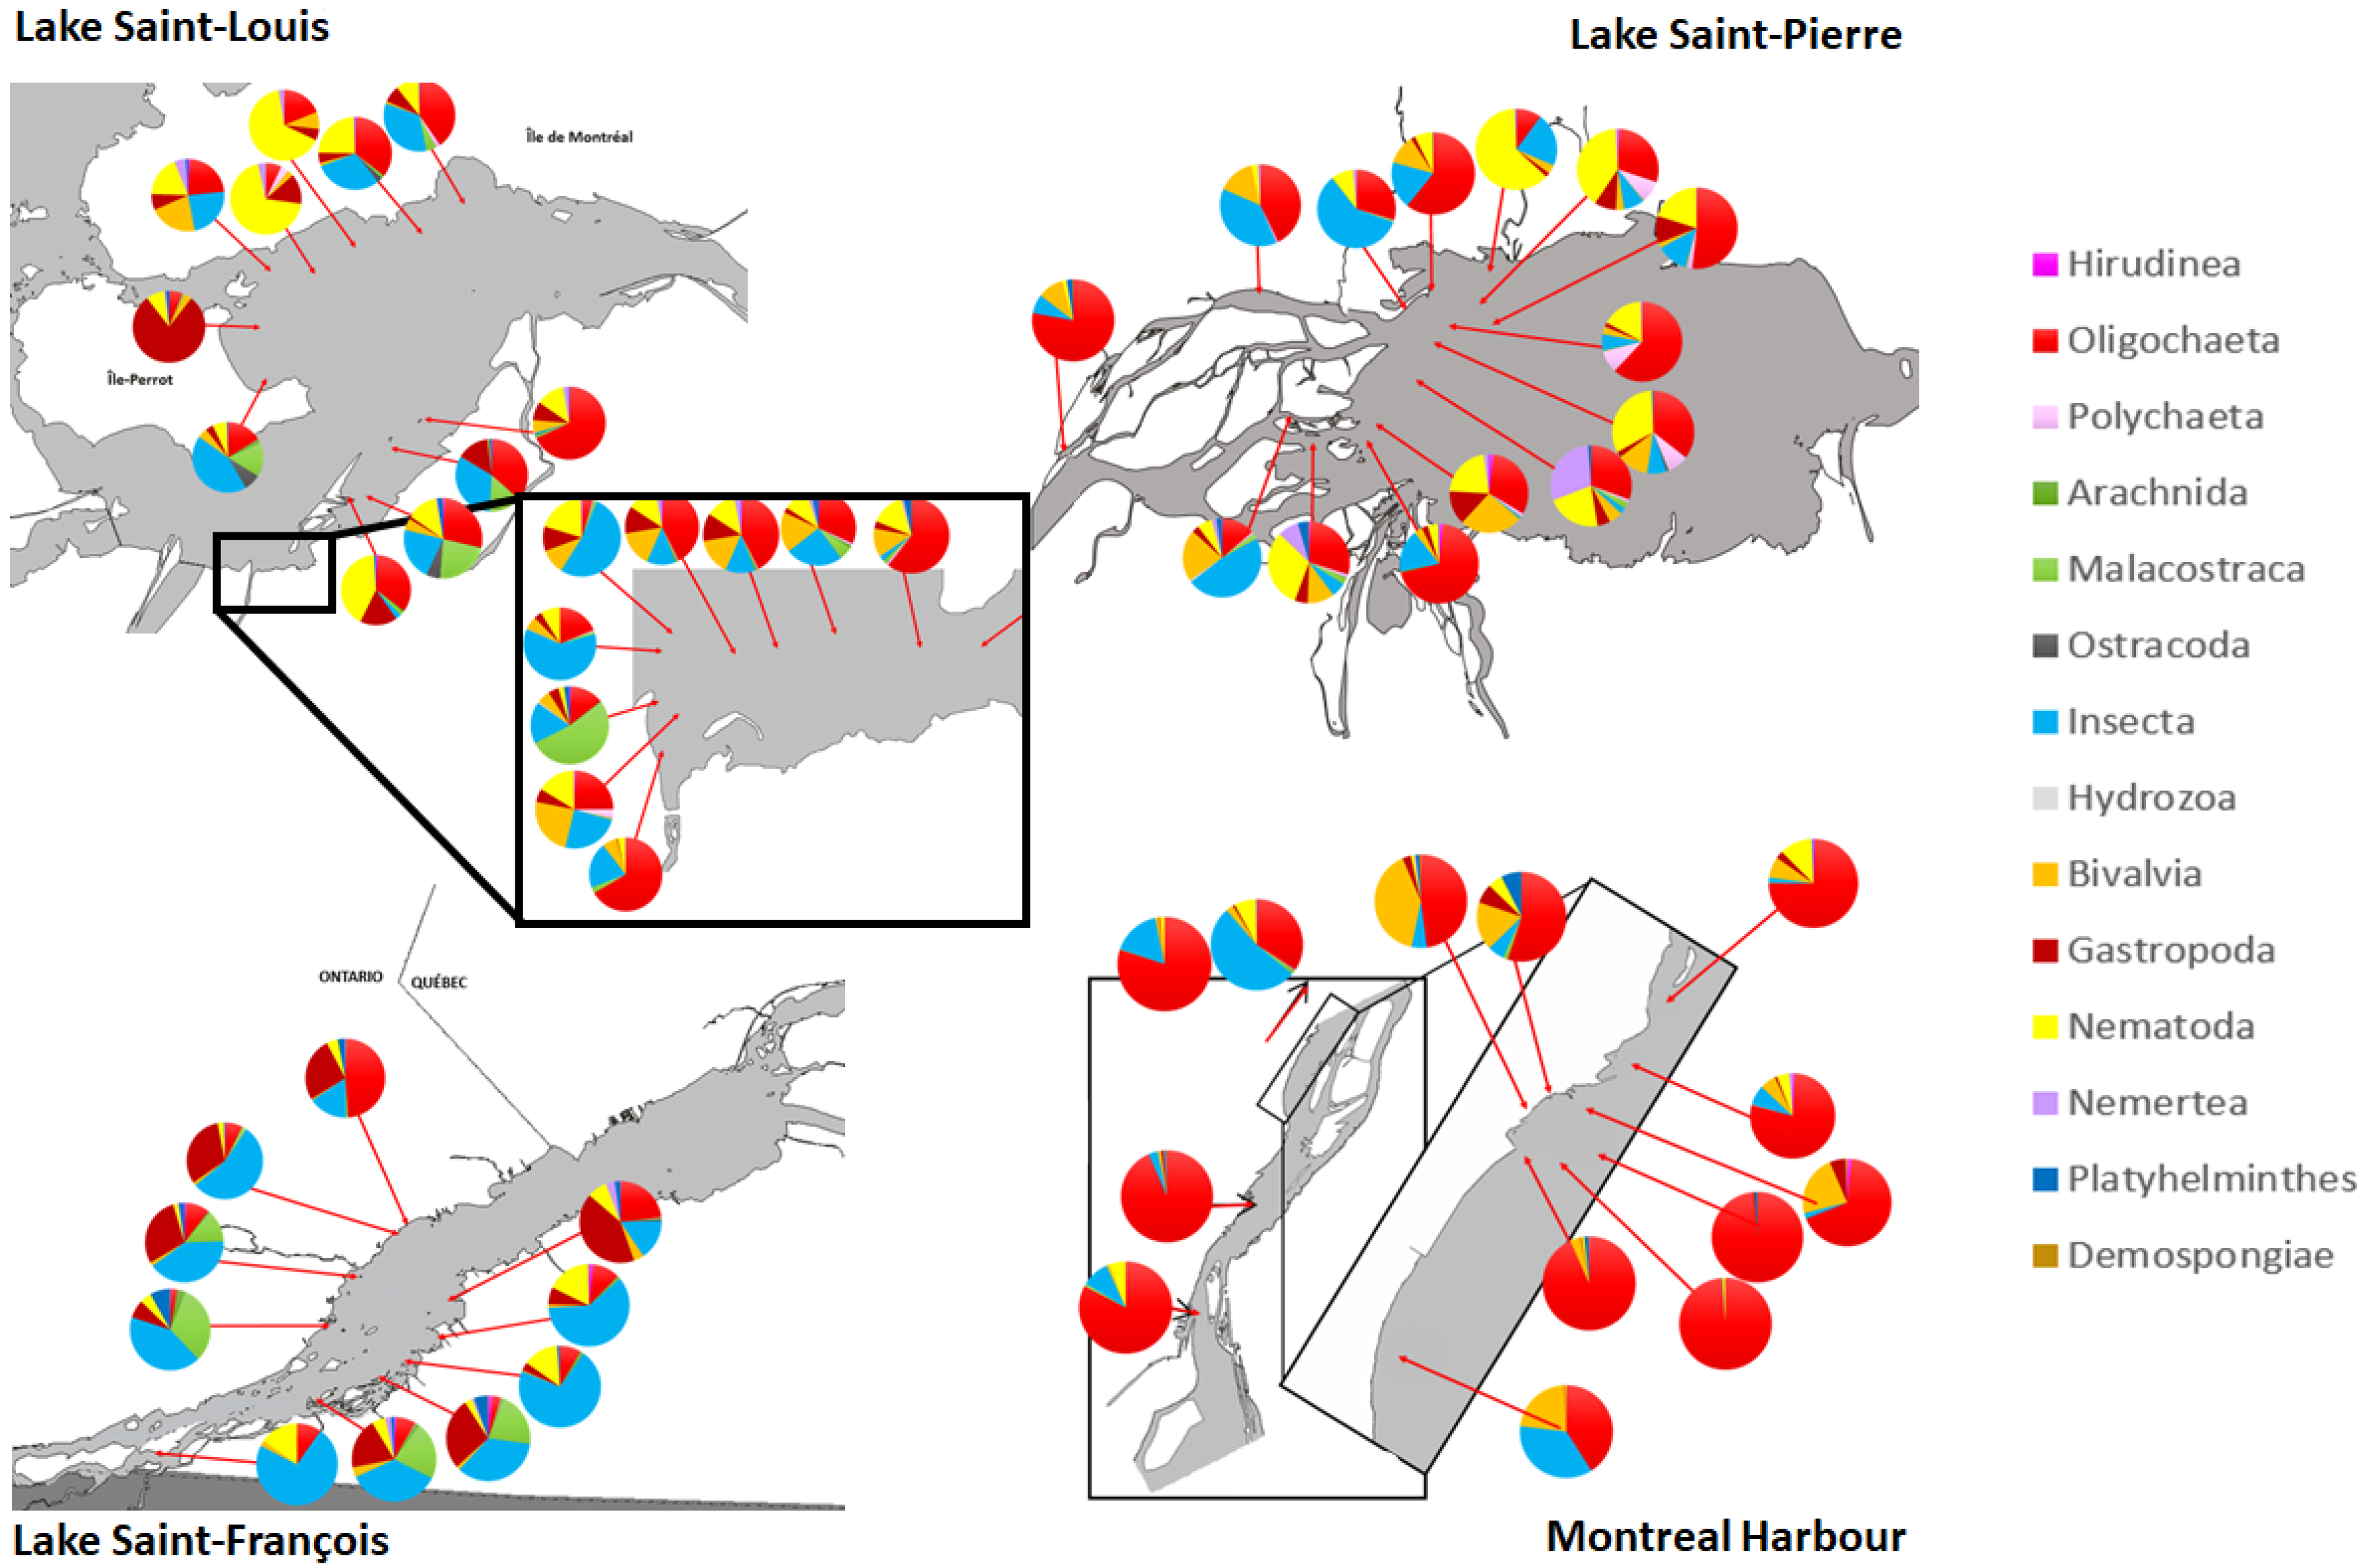
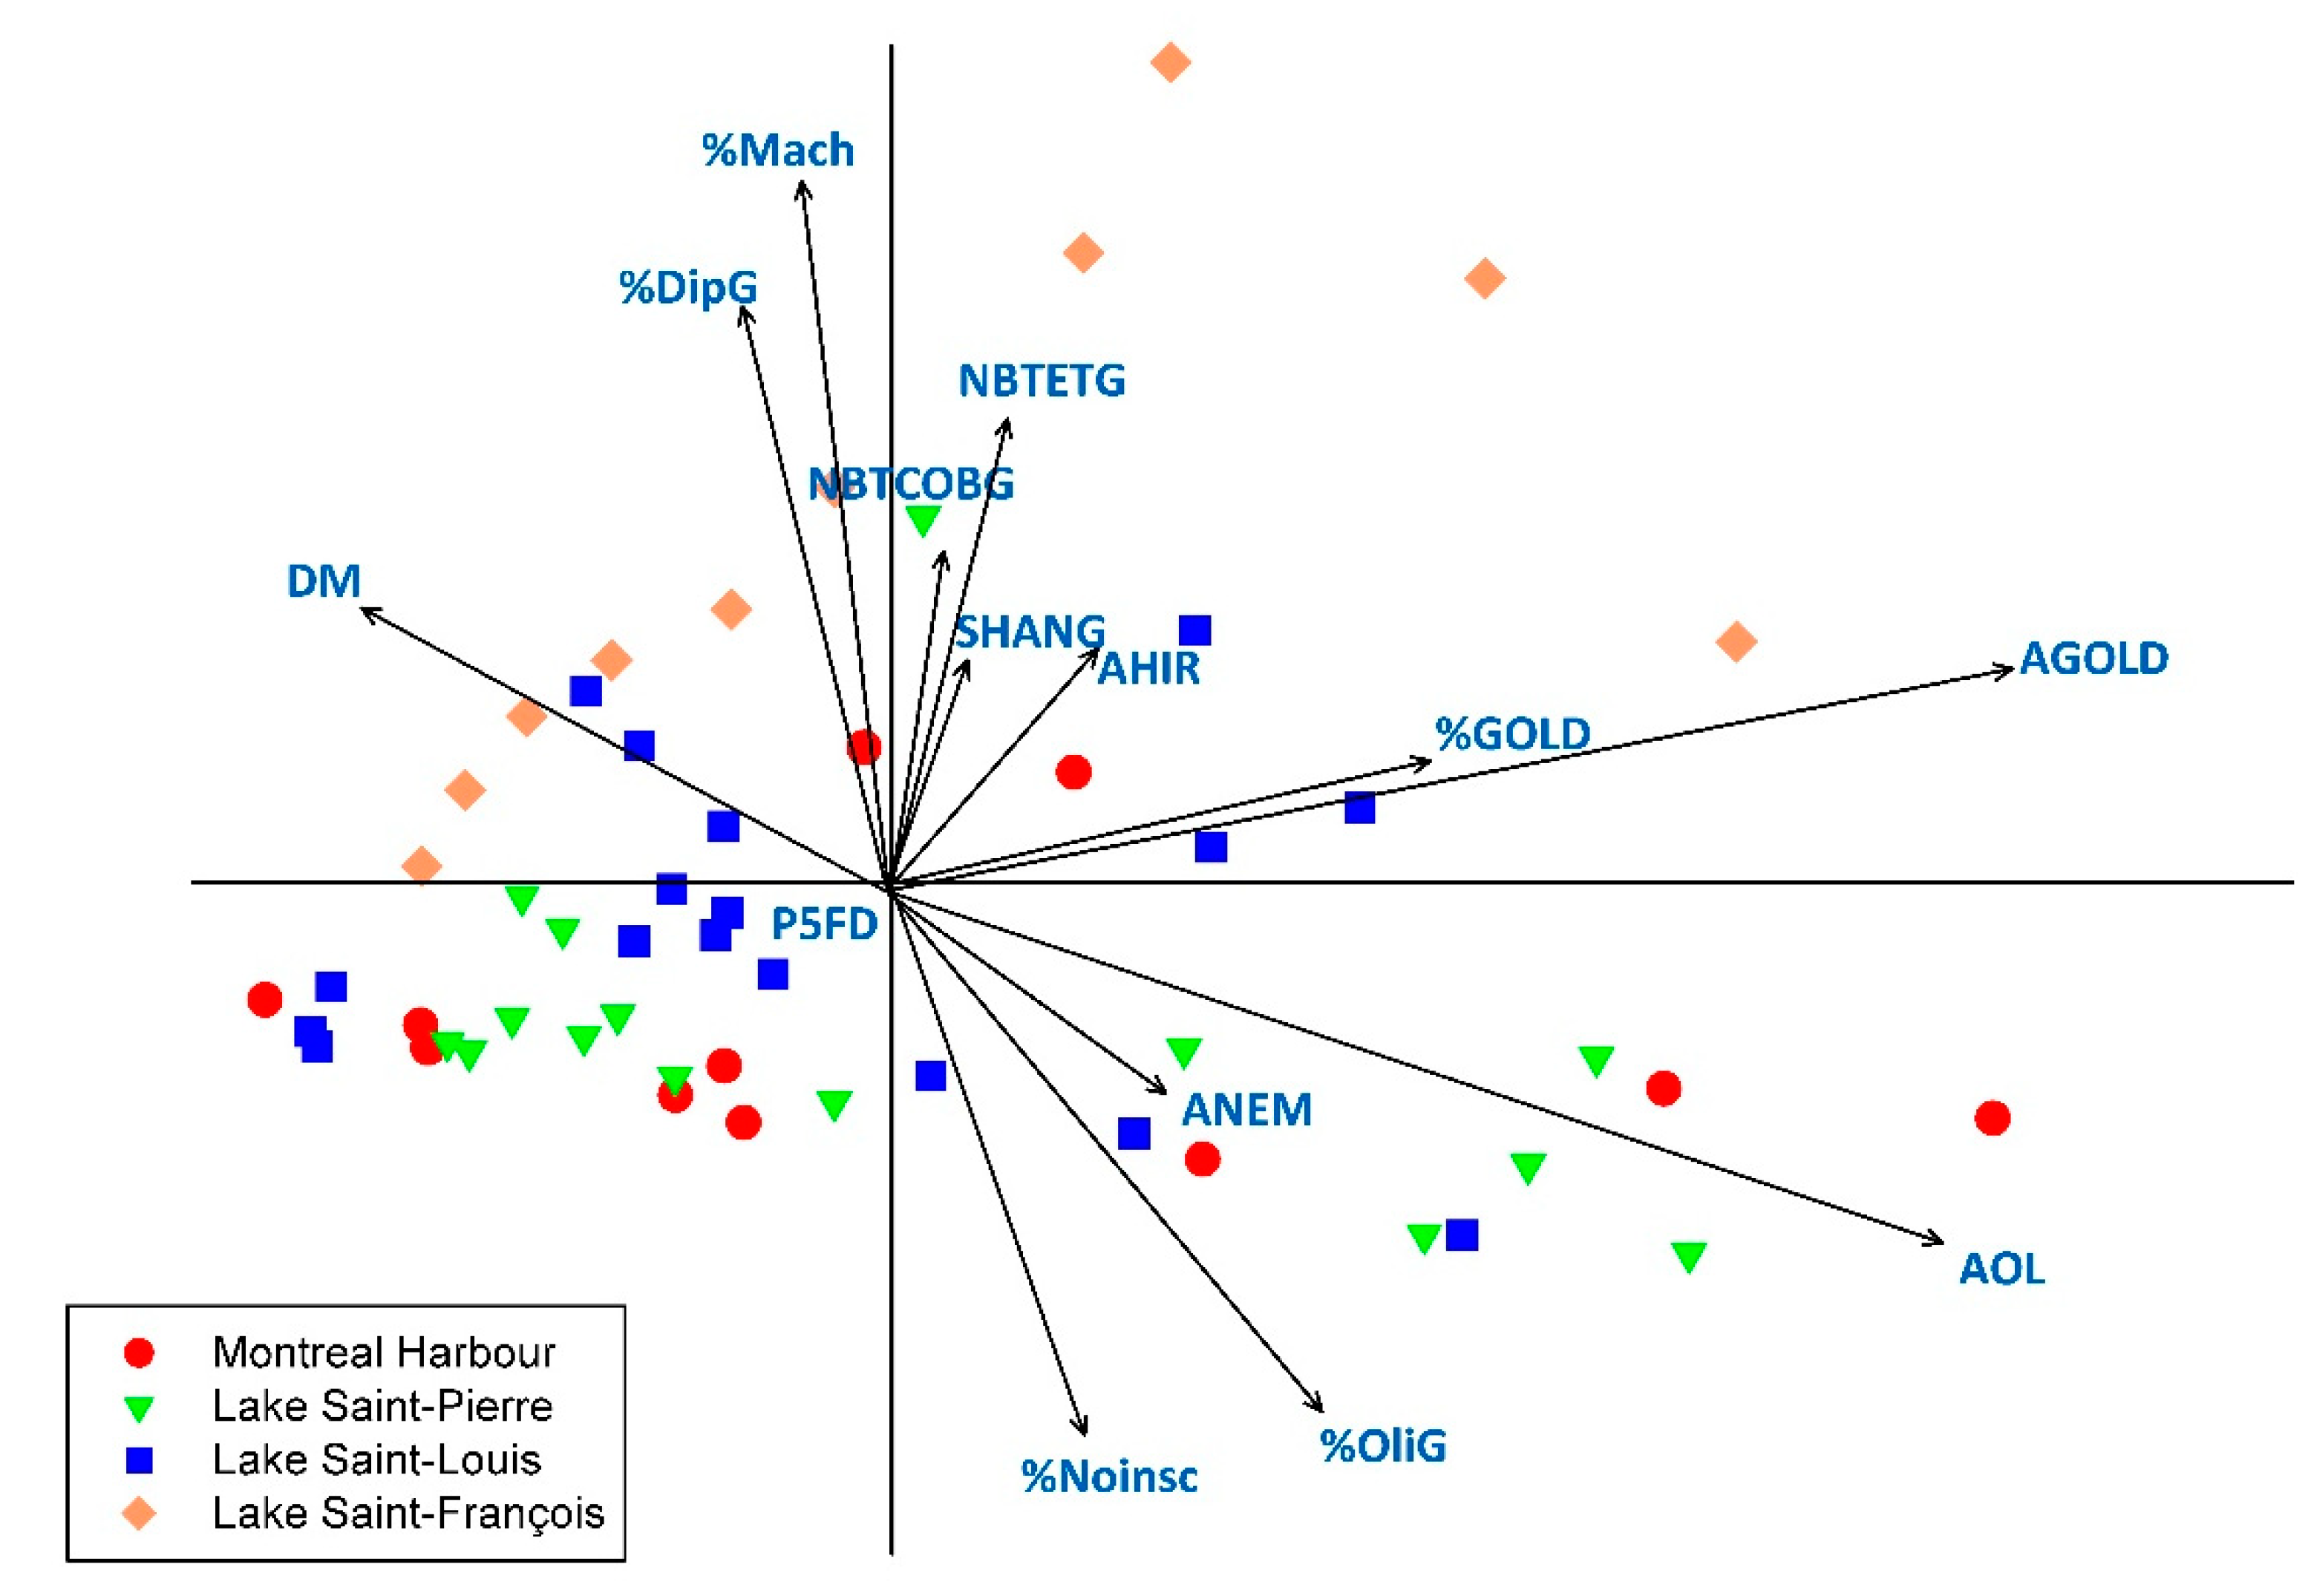
3.1. Typology of Macroinvertebrate Communities in the Fluvial Section

The sediments of the fluvial section of the St. Lawrence River supported abundant and diverse macroinvertebrate communities composed of fourteen taxonomic groups (Figure 2). Overall, the taxa belonged to 45 families and 109 genera (see Table S2 for the full list of taxa, Supplementary Materials). Macroinvertebrate composition varies among habitat zones and sites. In Lake Saint-Francois, macroinvertebrates were mainly composed of arthropods (Insecta), molluscs (Gastropoda), and crustaceans (Malacostraca). Community composition differed from upstream to downstream and between the north and south shores. Nematoda were found in greater abundance on the south shore than on the north shore while the Oligochaeta were relatively more abundant downstream than upstream, and inversely for the Malacostraca. In Lake Saint-Louis, community composition and dominance patterns were more variable from site to site than in Lake Saint-François. The Nematoda were more common on the north shore, the Gastropoda and Insecta in the bay of the island, and the Oligochaeta, Malacostraca and Bivalvia on the south shore. The Oligochaeta were more frequent downstream and the Nematoda upstream. In Lake Saint-Pierre, macroinvertebrate communities were also relatively diverse. Oligochaetes, Nematodes, Insects, and Bivalves were the most predominant groups. Community composition varied among the north and south shores, and along the longitudinal gradient. On both the north and south shores, communities were dominated by worms (Oligochaeta, Nematoda). However, Insecta and Bivalvia were more common in the north shore and at the upstream sites, while worms were more common at downstream sites. The Montreal Harbour supported the most disturbed community with a low diversity and a predominance of Oligochaeta associated to Insecta (mainly Diptera Chironomidae) and Bivalvia. Despite a large variability in macroinvertebrate composition among sites and habitat zones, the typology suggests a gradient of disturbance.

3.2. Selection of Macroinvertebrate Indices and Metrics

Selection procedures based on ANOVA and correlation analyses allowed us to select 157 indices and metrics (in bold in Table S3). These included 20 indices of diversity and similarity, 49 metrics of taxa richness, 36 metrics of taxa abundance and trophic guilds, 13 biotic indices based on taxa tolerance, and 39 functional traits (Table 2). Most of the selected indices and metrics (142) showed significant differences among habitat zones (highlighted in blue in Table S3). In contrast, only 5 metrics based on taxa abundance showed significant variation among sediment quality classes (ANEM, AHIR, ADIP, AHYD, AGOLD: highlighted in orange in Table S3), and only 3 metrics based on number of tolerant taxa and the dominance of scrapers, as well as 7 functional traits showed significant variation among both habitat zones and sediment quality classes (highlighted in green in Table S3).
The PCA analysis based on the 157 indices and metrics allowed us to eliminate additional 61 indices and metrics showing no significant contribution to spatial patterns in macroinvertebrate communities and sampling sites (Figure S2, Supplementary Materials). All fluvial lakes sites were grouped together in the center of the ordination plan, except for one extreme site in Lake Saint-Louis located in the lower right quadrant. The most impaired sites of Montreal Harbour were dissociated from those of the fluvial lakes in the upper right quadrant.
Finally, the stepwise RDA procedure comparing pairs of indices and metrics based on six criteria allowed us to eliminate another 143 indices and metrics and to retain only 14 metrics and indices as the most selective and parsimonious choices (Table 3). We selected the indices and metrics which were recognized as (1) relevant and easily to apply for bioassessment in large rivers, (2) having the potential to distinguish macroinvertebrate communities among habitat zones and/or sediment quality classes based on ANOVA analyses, (3) having the highest contributions in PCA ordination, and (4) showing significant relationships with sediment characteristics and contamination based on correlation analysis, RDA and regression tree analysis. We also gave priority to indices and metrics calculated at the genus level since our previous studies have shown a higher explanatory power at this taxon level [23,49] (5) and based on abundance and tolerance (6). Selective choices were made among indices and metrics that were collinear or had similar ecological principles. For instance, the metrics Ita and AOL were collinear (ρ Spearman 0.95, p = 0.9925) (see also vector projections in Figure S2, Supplementary Materials). Thus, we retained only the metric AOL based on the abundance of Oligochaeta which was associated with the most impaired sites of the Montreal Harbour as shown with ANOVA and PCA analyses (Table 4, Figure S2). For example, we eliminated the metric Ital that was developed for small Italian rivers and judged inappropriate for a large and complex river such as the St. Lawrence River. The comparative selection of pairs of indices and metrics is detailed and presented in Table S4 (Supplementary Materials).
The 14 indices and metrics selected were the most relevant for distinguishing habitat zones in the fluvial section (Figure 3). Increased diversity indices (SHANG, DM), greater richness in Ephemeroptera, Trichoptera, Coleoptera, Odonata and Bivalvia taxa (NBTETG, NBTCOBG), and higher abundances of Mollusca and Diptera Chironomidae (%Mach, %DipG, %GOLD, AGOLD) were associated primarily with Lake Saint-François sites (upper right and left quadrants), and opposed to certain sites of the Lake Saint-Pierre, Lake Saint-Louis and of the Montreal Harbour (lower left quadrant). In contrast, a higher percentage and abundance of non-insects (%NoIns) and worms such as Oligochaeta and Nematoda (ANEM, AOL, %OliG) were associated with certain impaired sites of the Lake Saint-Pierre, Lake Saint-Louis, and the Montreal Harbour (lower right quadrant).
Some of the final metrics were collinear (Figure 3) and based on similar ecological principles. For instance, the metrics %GOLD and AGOLD are redundant as well as the metrics %DipG and %Mach. Thus, for a more parsimonious selection, it may be appropriate to retain only those metrics with the highest contribution in the PCA ordination of sites such as AGOLD and %Match. Therefore, the ANEM, AHIR, SHANG, and NBTCOBG metrics could also be eliminated as they have the lowest contributions. The ANOVA analyses indicated which indices and metrics have the highest potential to discriminate habitat zones and sediment quality classes (Table 4) and complement the selection procedures.
Concerning habitat zones, diversity indices (DM, SHANG) distinguished only the sites of the fluvial lakes from the most impaired sites of the Montreal Harbour. Among metrics based on taxa richness, NBTCOBG also segregated the Montreal Harbour from the fluvial lake sites, while NBTETG segregated the LSF and LSL sites from the LSP and MH sites. The metrics %OliG and P5FD had a better potential than AOL, which distinguished only the two extreme habitat zones (LSF from MH). The metric %OliG segregated the MH impaired sites on one hand and the LSF sites on the other hand, but did not differentiate LSL and LSF sites, and LSP and LSL sites. The metrics %DipG, %Match and %NoIns segregated LSF sites from the sites of the two other fluvial lakes and the Montreal Harbour. The metrics ANEM, AHIR, and AGOLD failed to distinguish habitat zones, and the metric %GOLDG did not separate the less impaired LSF sites from the most impaired MH sites.
When considering the sediment quality classes, 12 final indices and metrics (except AHIR and AGOLD) presented a potential for distinguishing sediment quality classes when considering both categories of the class 3 (Table 4). Macroinvertebrate indices and metrics with the greatest potential to distinguish sediment quality classes were the diversity indices (DN, SHANG), the number of taxa at the genus level for the Ephemeroptera, and Trichoptera (NBTETG) as well as the total number of taxa of Trichoptera, Coleoptera, Bivalvia and Gastropoda (NBTCOBG). Most of them clearly differentiated the less impaired sites (Class 1) from the most impaired sites (Class 3A and 3B), indicating improved sediment quality. In contrast, the metrics based on the abundance and dominance of Oligochaeta (AOL, %OliG) discriminated the most contaminated sites (Class 3A), indicating lower sediment quality. The other metrics based on the abundance or percentage of tolerant taxa (%DipG, P5FD, ANEM, %Match, %NoIns, %GOLDG) presented the lowest potential to distinguish sediment quality classes. Although functional traits metrics performed slightly better than usual taxonomical metrics [49], they did not emerge as relevant in this sorting exercise. In addition, the database of traits available for macroinvertebrates of the St. Lawrence River is still incomplete. Consequently, trait approach is not currently used for bioassessment monitoring due to difficulty of their application in ecotoxicological risk assessment.

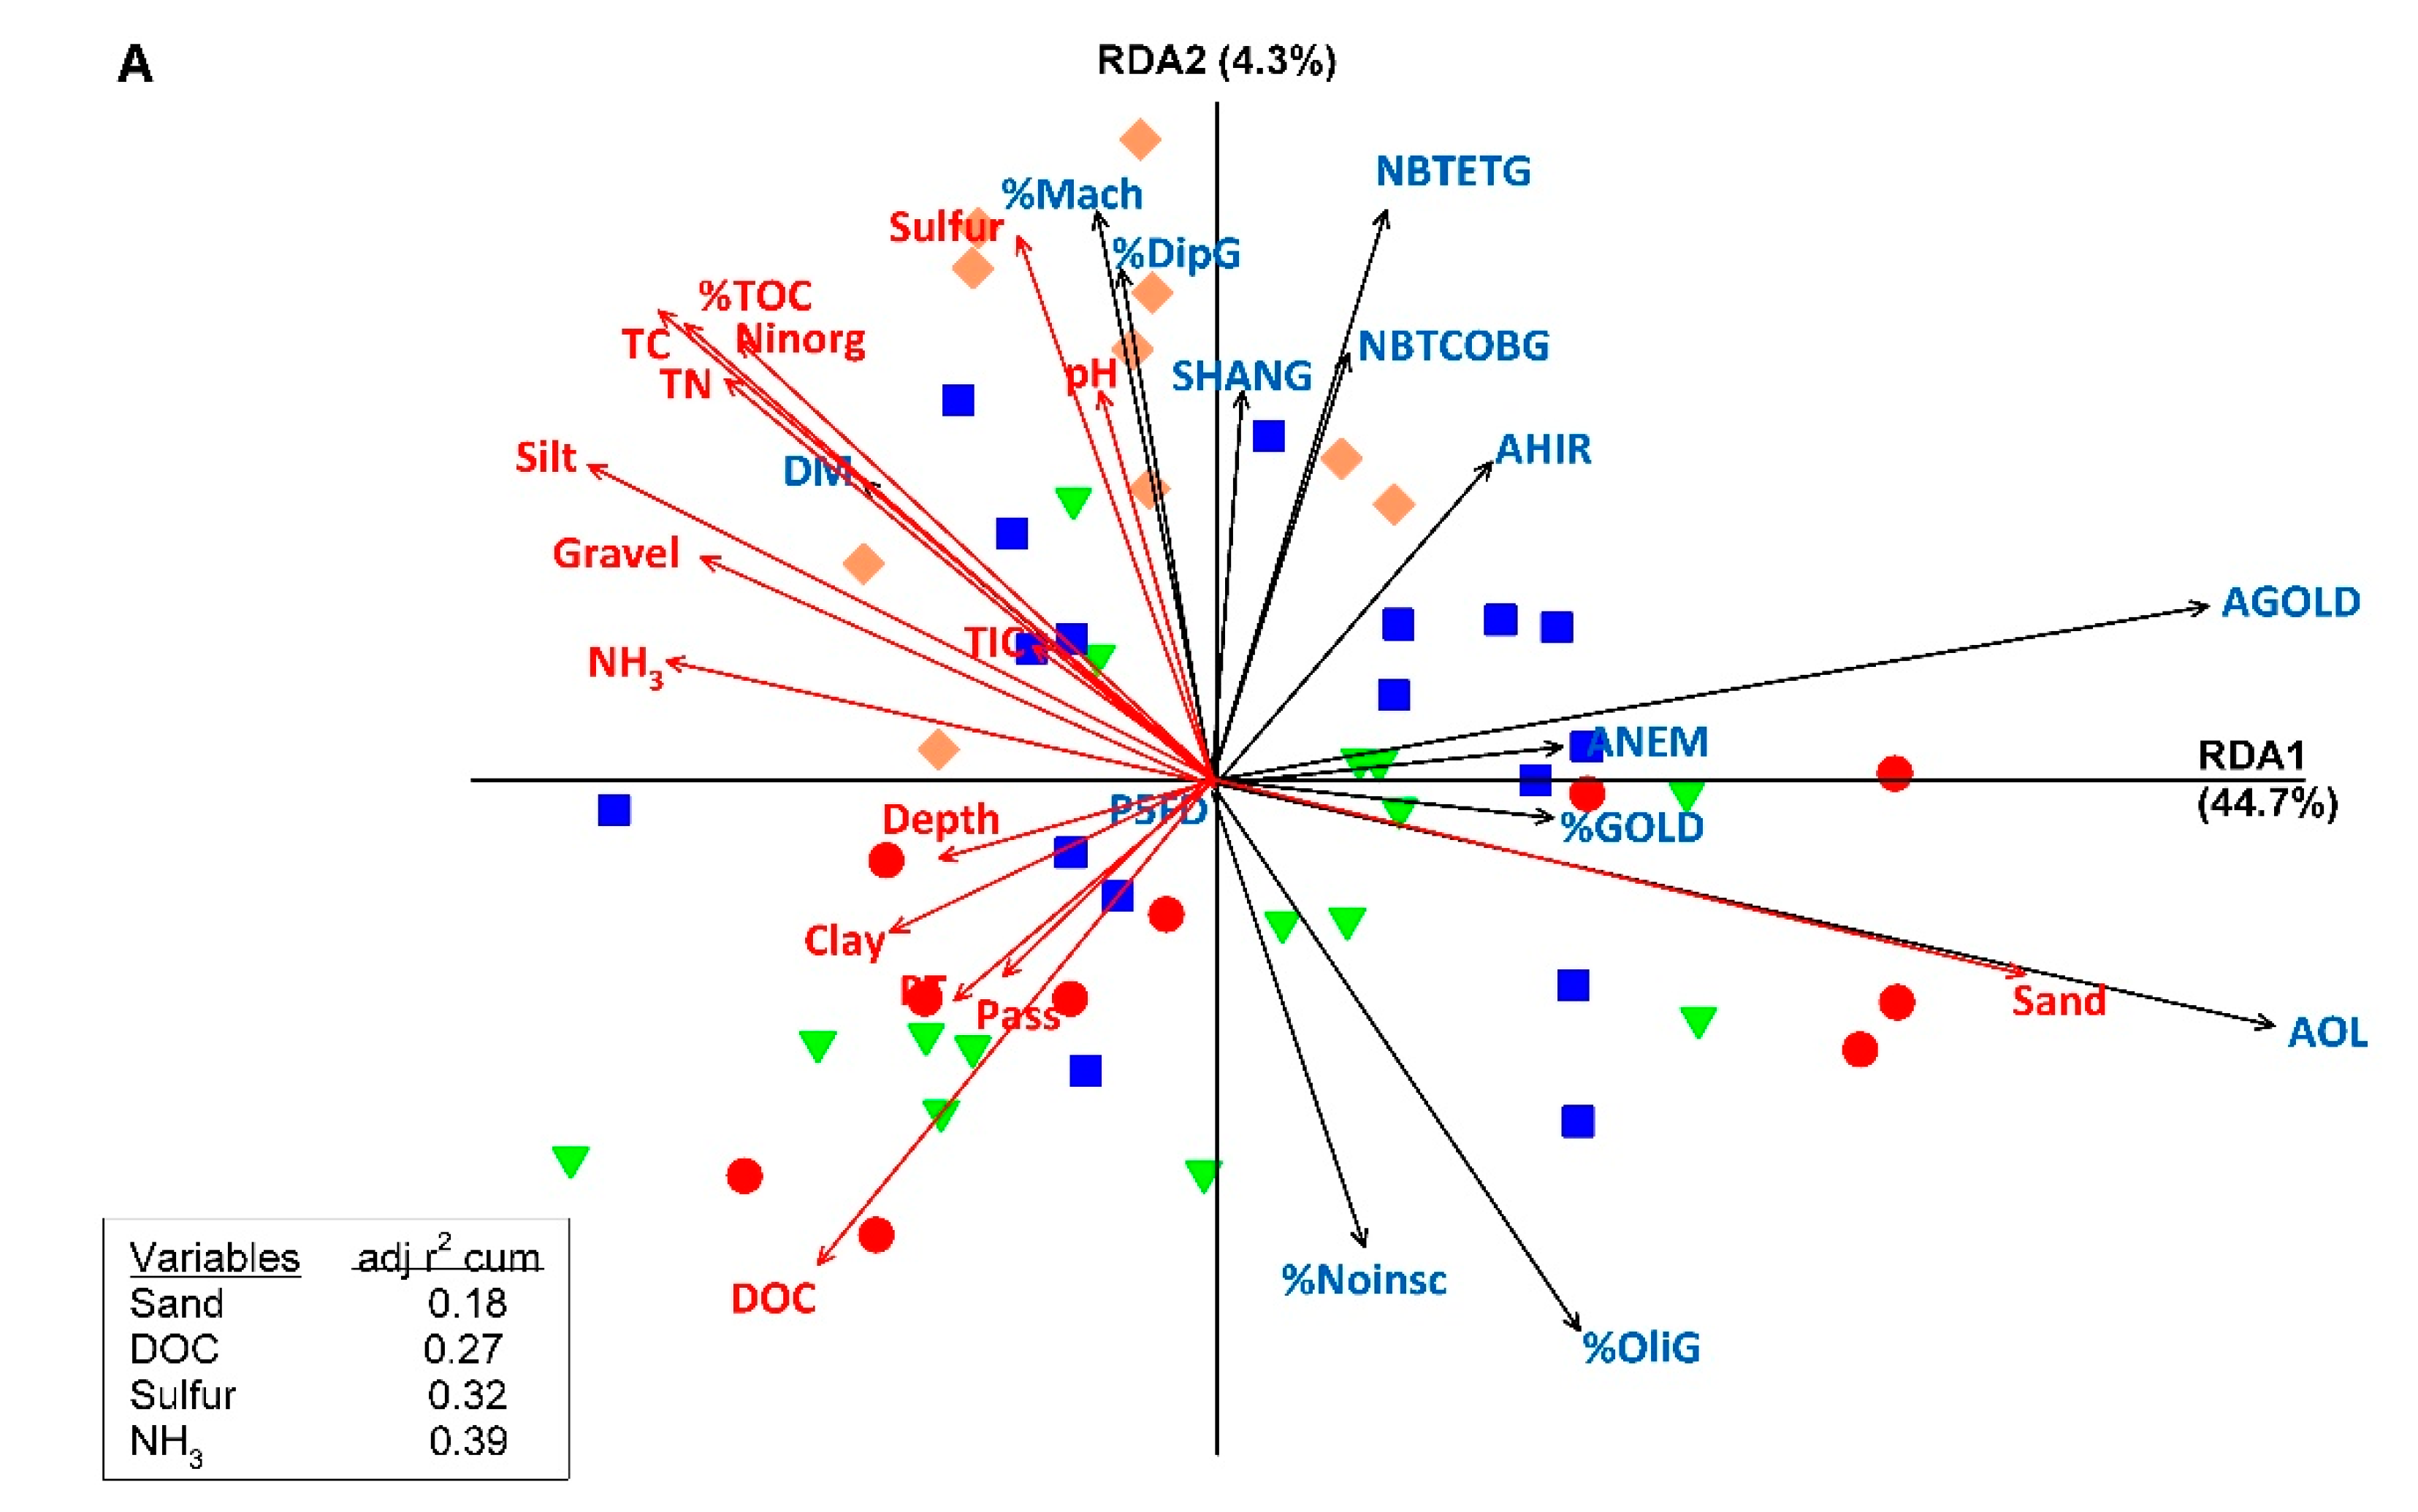
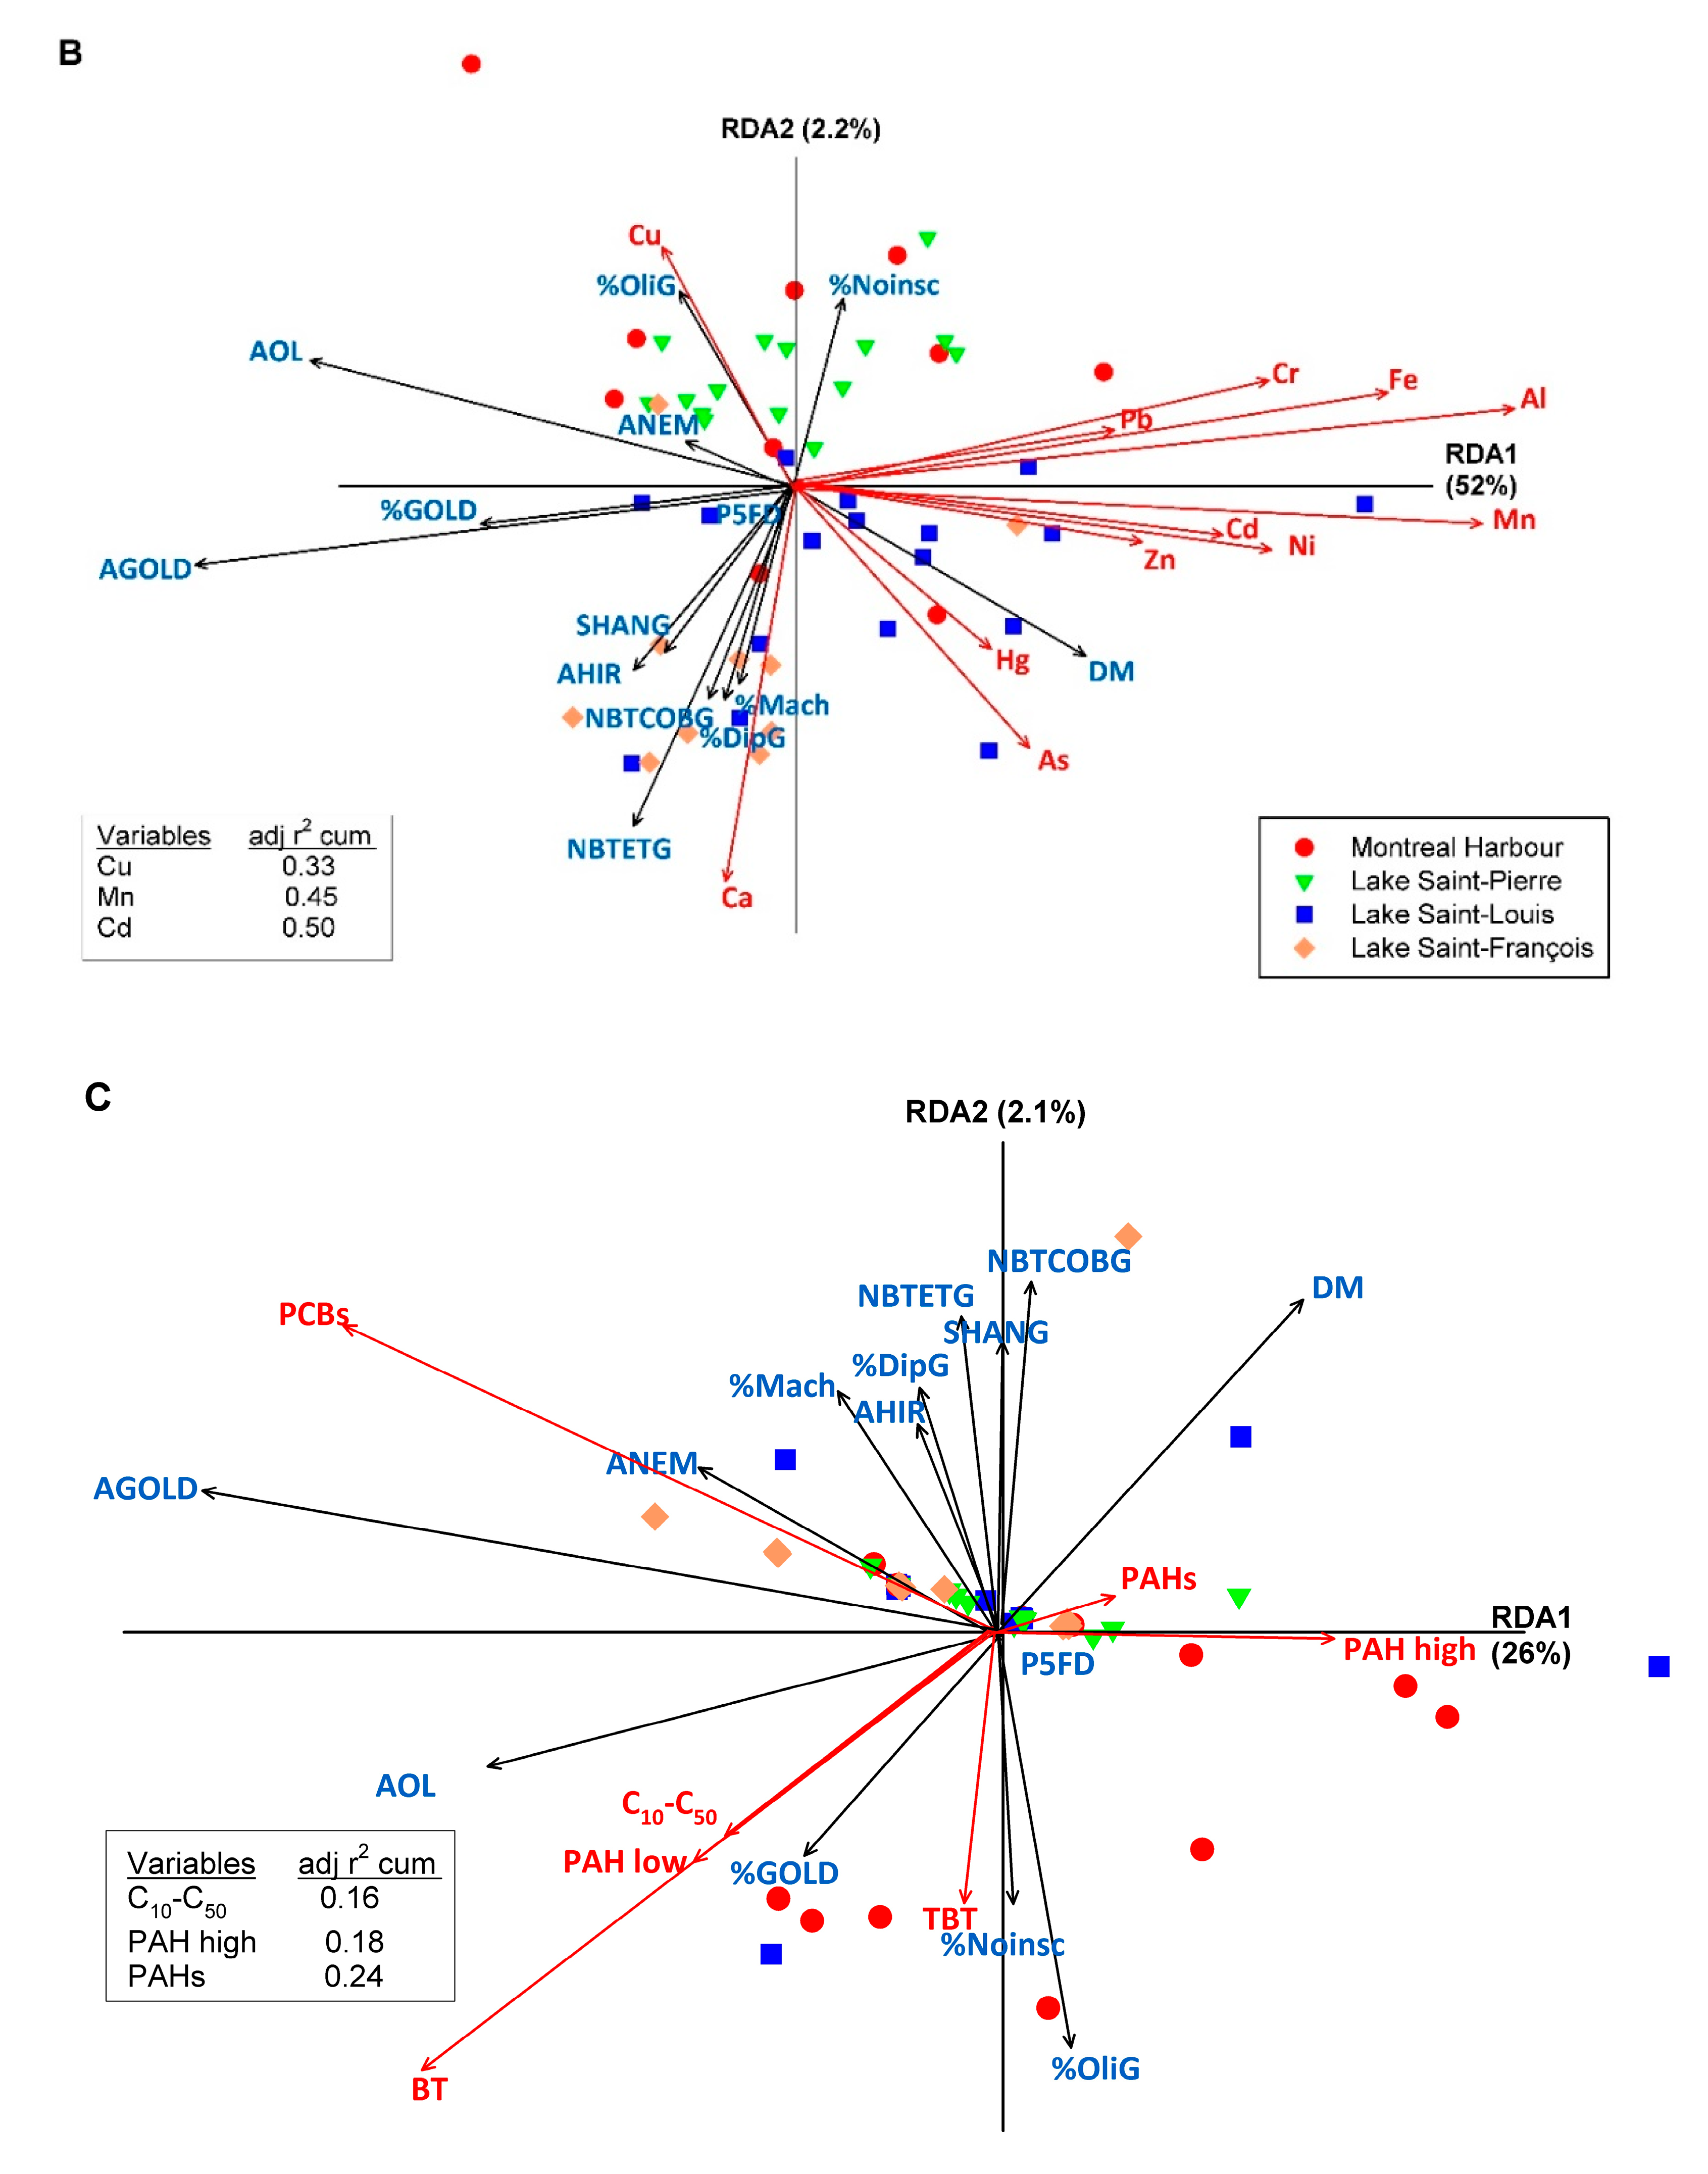
3.3. Relationships between Macroinvertebrates Metrics and Indices and Sediment Characteristics and Contamination

To assess how the selected indices and metrics were related to sediment characteristics and contamination, we performed RDA analyses (Figure 4) and supplemented them with correlation analyses (Table S5). Only the results of RDA analysis without outlier sites are presented to provide a more comprehensive illustration of the relationships with sediment variables and the spatial distribution of sampling sites (see Figure S3, for the results with the outlier sites). In general, most of the indices and metrics showed higher significant correlations with sediments characteristics than contamination (Table S5).
Overall, the RDA model relating indices and metrics to sediment characteristics explained 50% of the total variation in the macroinvertebrate community. We could dissociate two groups of metrics and indices depending on sediment composition, depth, nutrients and inorganic and organic carbon (Figure 4A). The significant explanatory variables were sand and NH3 on axis 1, DOC and sulfur on axis 2 that explained 39% of the variance. Globally, along the first axis, metrics based on the abundance of tolerant taxa (AGOLD, AOL, %GOLD, ANEM) were associated with nutrient-poor sandy sediments (Sand, low NH3) in shallow sites; other similar metrics (%NoIns, %OliG) were also associated with nutrient-poor sandy sediments (TN, Ninorg) and organic carbon (DOC, TOC, %TOC, TC). Most of these metrics had higher scores in the Montreal Harbour, Lake Saint-Louis, and Lake Saint-Pierre sites, which were considered to be the most impaired. On the second axis, diversity metrics (DM, SHANG), and metrics based on the relative abundance of ubiquist and sensitive taxa (% Match, %DipG) had higher scores in sediments composed of silt and gravel, with higher pH, sulfur, organic carbon (TOC, %TOC) and nitrogen (TN, Ninorg) levels. Taxa richness metrics (NBTETG, NBTCOBG) had higher scores in shallow sediments poor in nutrients (TP, Pass) and dissolved organic carbon (DOC). Most of these metrics had higher scores in the sites of Lake Saint-Louis and Lake Saint-François, which were considered as the less impaired.
Overall, the RDA model relating indices and metrics to sediment inorganic contamination explained 55.7% of the total variation in macroinvertebrate community. Given the trends observed with inorganic contaminants (Figure 4B), the sediments most polluted with metals and metalloids were found in the Montreal Harbour and the Lake Saint-Louis (see also Figure S3B). The significant explanatory variables were Mn and Cd on axis 1 and Cu on axis 2, which explained 50% of the variance. Diversity indices (DM, SHANG) and metrics based on richness or abundance of intolerant taxa (NBTETG, NBTCOBG, %Match, %DipG) were associated with sediments rich in calcium (Ca), mercury (Hg) and arsenic (As) but less contaminated in metals (Cd, Cu, Pb, Zn), most of which were found in the Lake Saint-François sites. The metrics based on tolerant taxa (%OliG) were associated with sediments rich in Cu at the Lake Saint-Pierre sites and other metals mainly at Montreal Harbour sites (relationships are better seen in Figure S3B). Spearman correlation analysis indicated significant positive or negative relationships between indices and metrics and inorganic contaminants (Al, As, Cd, Cr, Cu, Fe, Hg, Ni, Pb, Zn; Table S5).
Overall, the RDA model relating indices and metrics to sediment organic contaminants explained 28.1% of the total variation in the macroinvertebrate community. Given the trends observed for organic contaminants (Figure 4C), the sediments of the Montreal Harbour were the most contaminated by hydrocarbons and butyltins (PAHs, PAH High, PAH low, C10-C50 Petroleum Hydrocarbons, BT, TBT). The significant explanatory variables were C10-C50 petroleum hydrocarbon, PAH with high molecular weight (HAP high) and total PAH (PAHs). Here again, two types of metrics were opposed (better seen in Figure S3C). Metrics based on diversity indices and sensitive taxa (DM, SHANG, NBTETG, NBTCOBG, %Match, %DipG) were associated with the less contaminated sites in Lakes Saint-François, Saint-Louis, and Saint-Pierre. On the other hand, metrics based on tolerant taxa (AOL, %OliG, %GOLD, %NoIns) were associated with the most oil- or butyltin-polluted sediments in the Montreal Harbour.

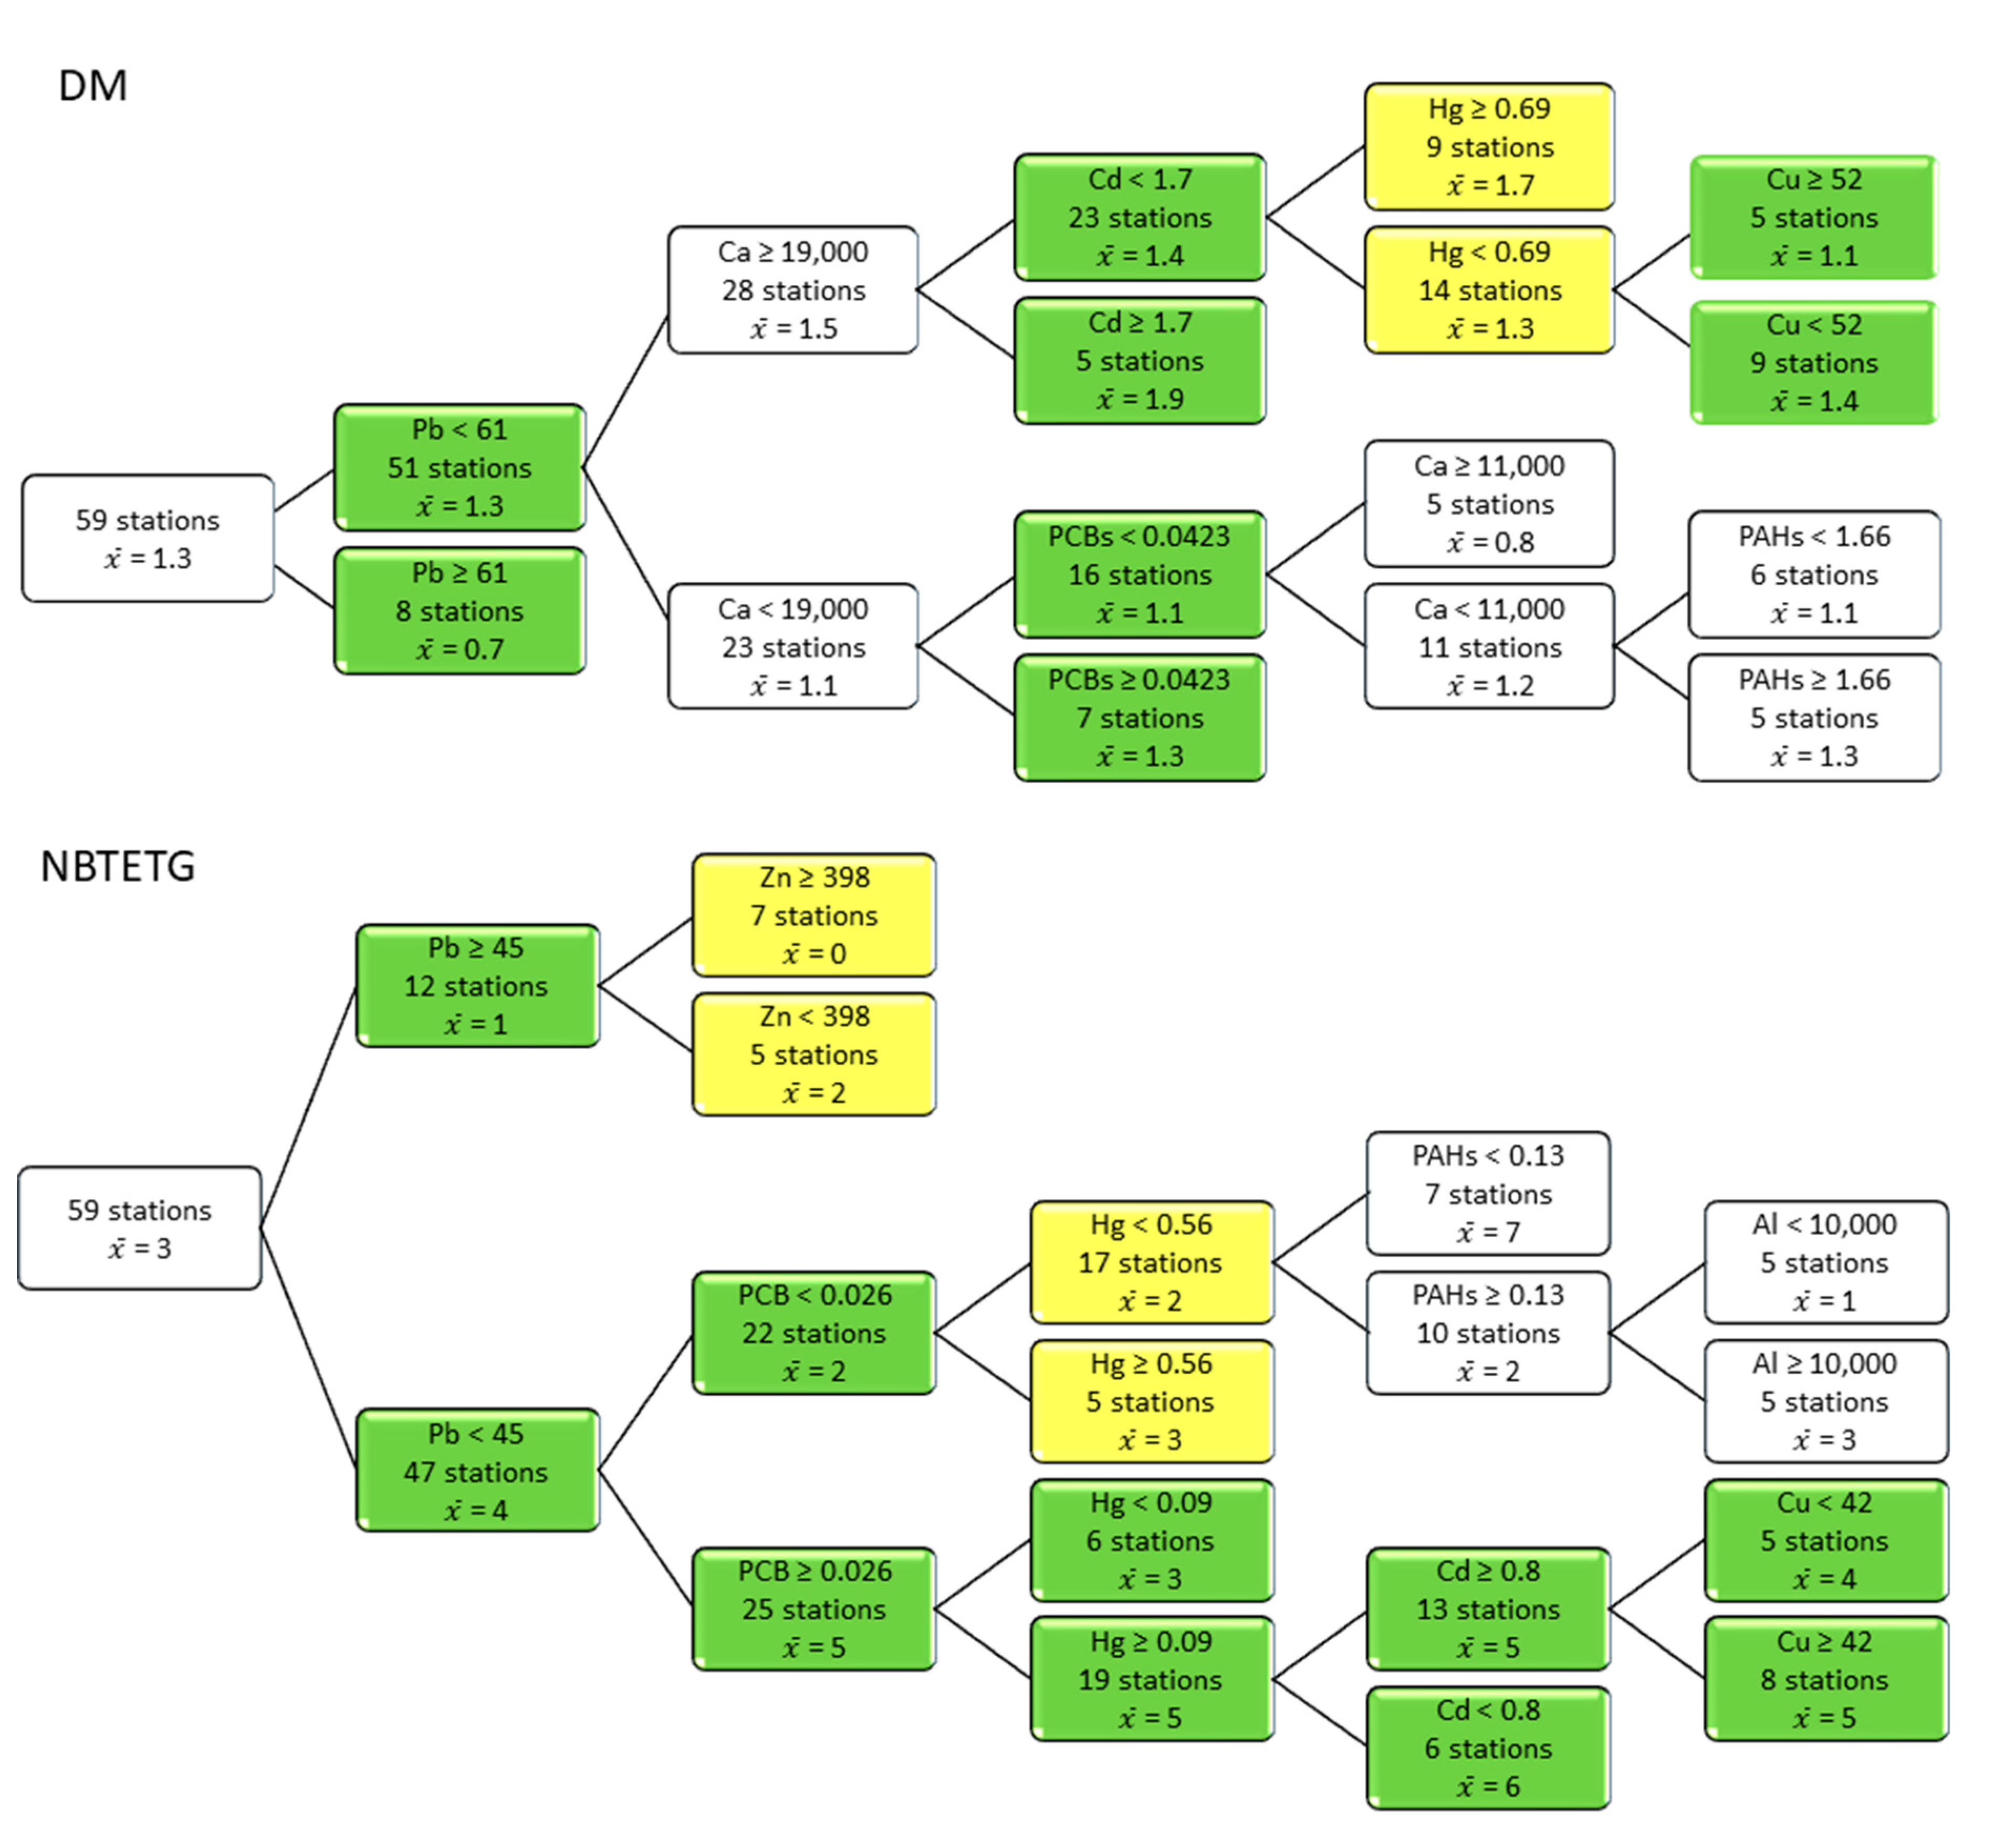
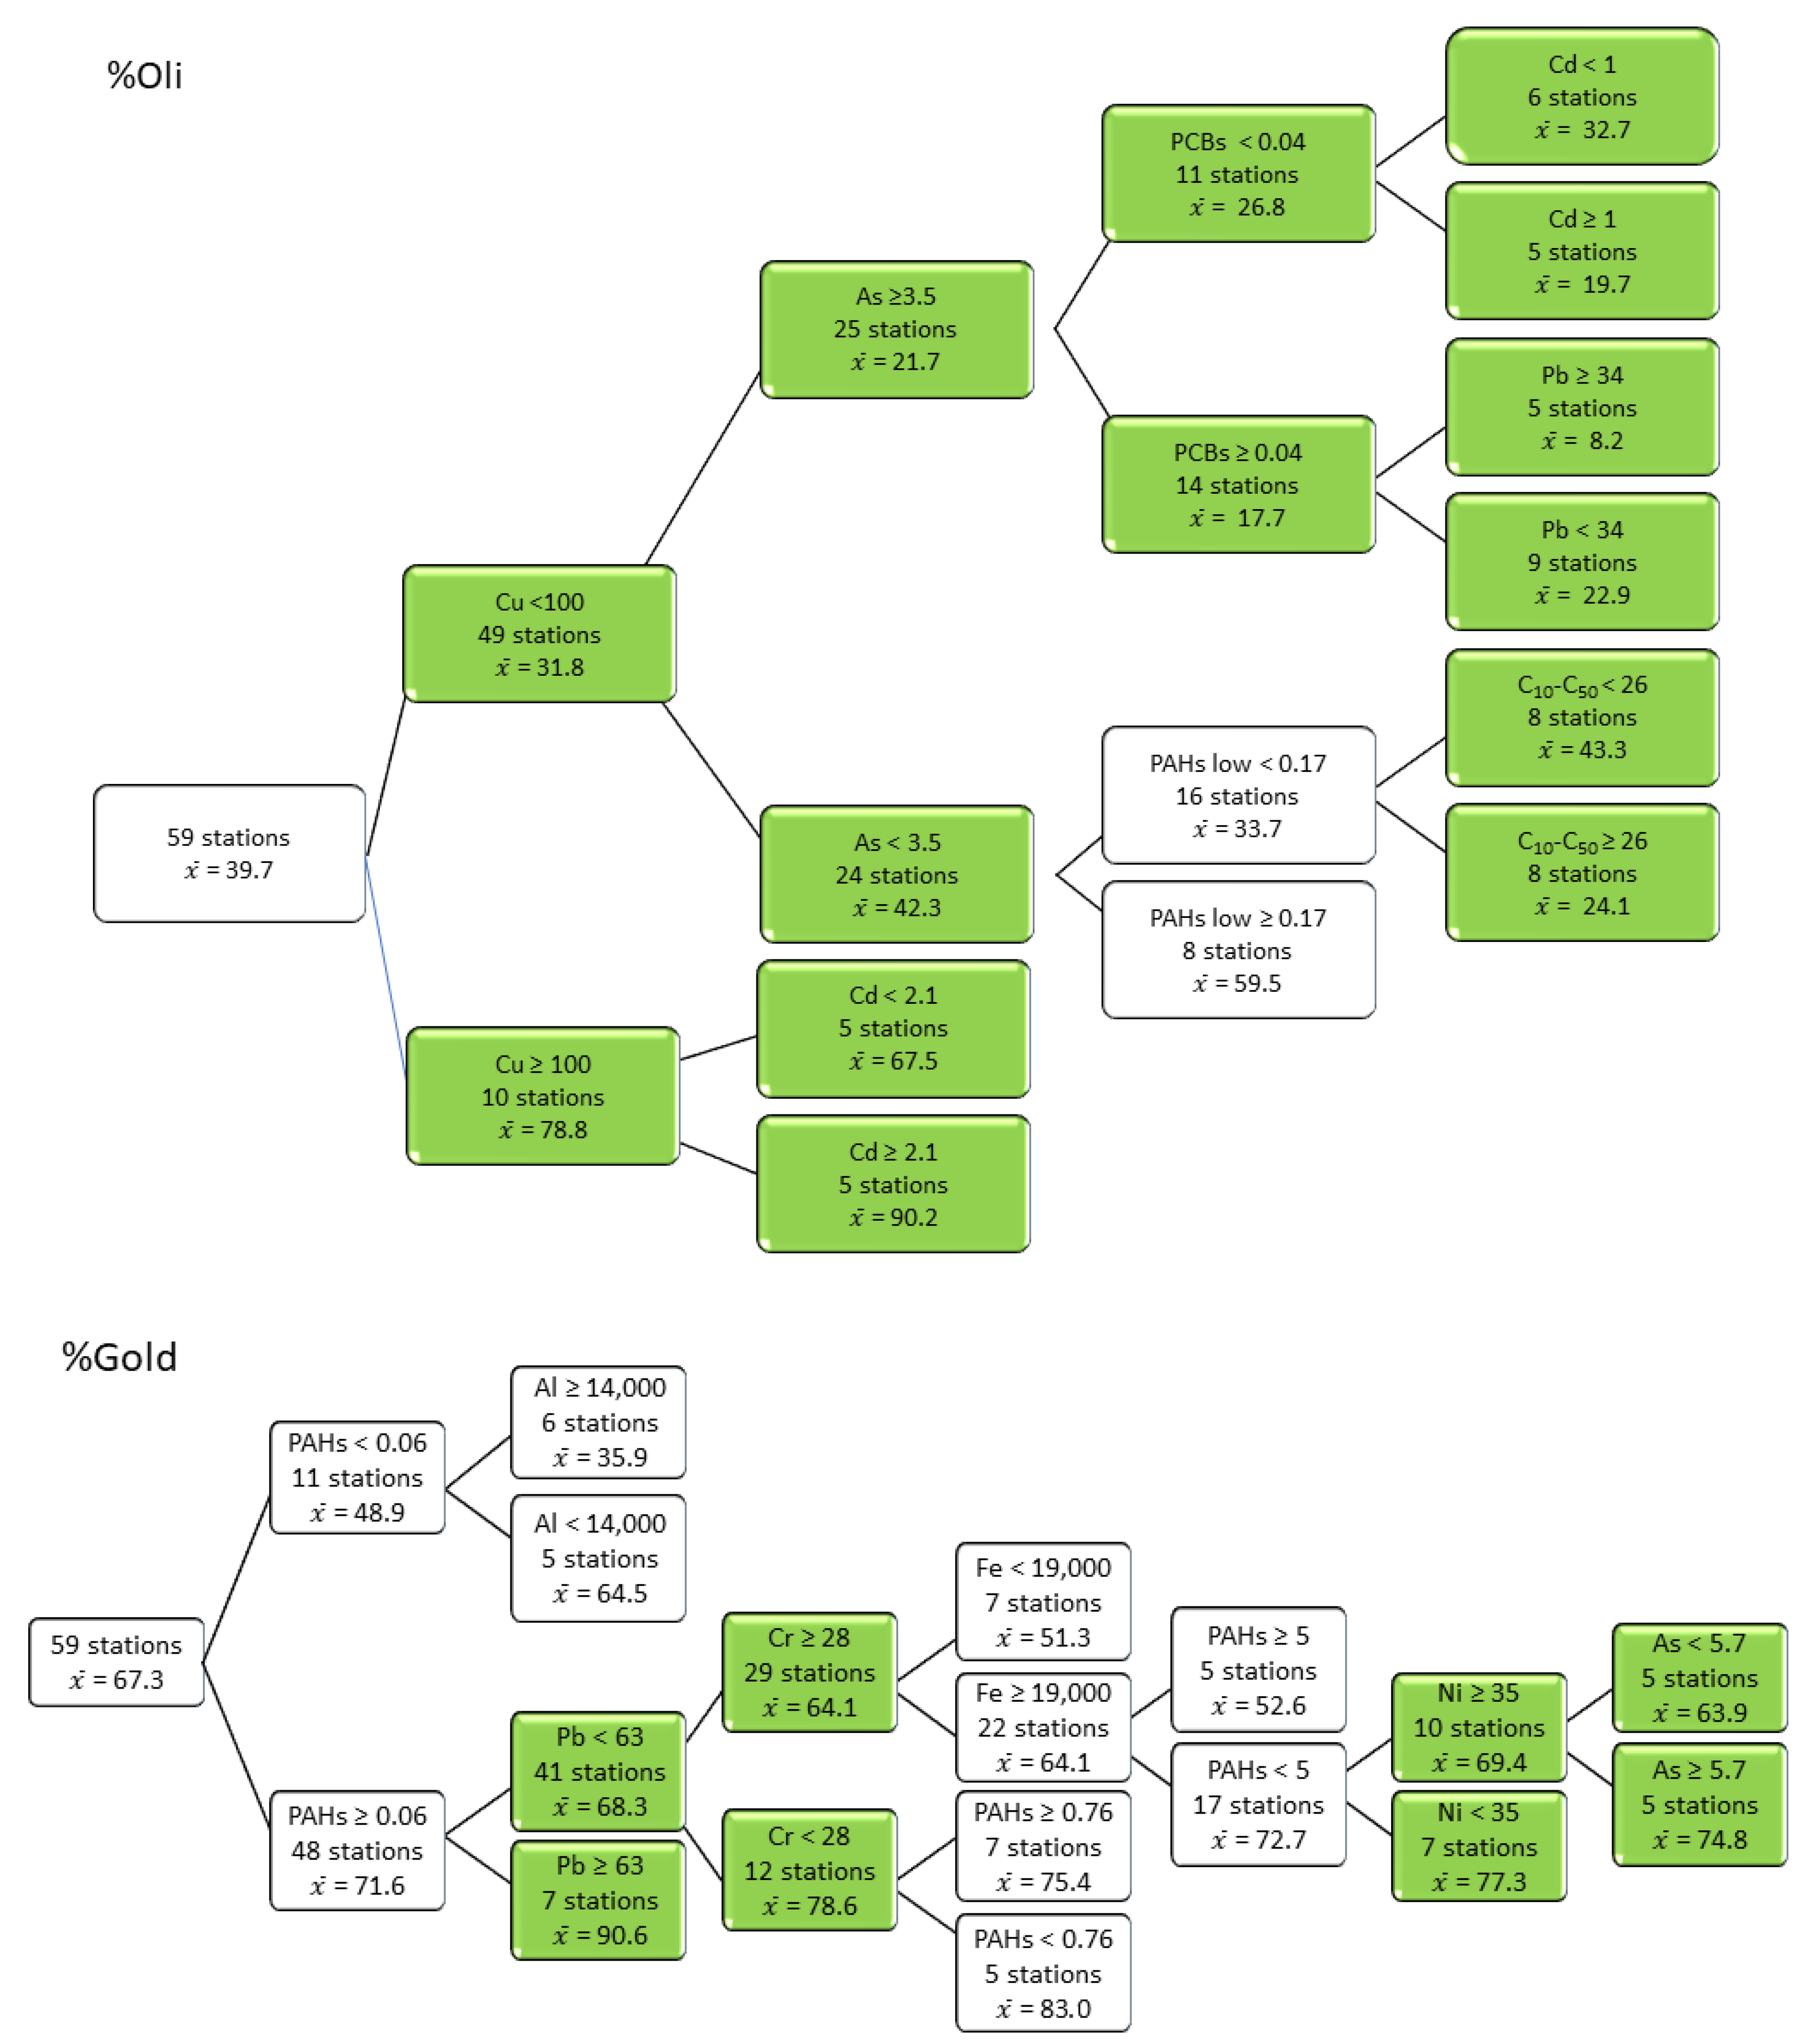
3.4. Responses of Metrics and Indices to Contaminant Thresholds

Cascading homogenous grouping thresholds were determined for the 14 selected indices and metrics using inorganic and organic contaminants in regression tree models. For each index and metric, the estimated thresholds were compared to (i) the criteria established to assess the sediment quality in a remediation context [55], and (ii) natural concentrations in sediments during preindustrial period < 1950 and postglacial clays [55,64] (See Table S6A,B). A total of 10 over 14 indices and metrics showed robust tree regression models (r2 > 60%). There were divided into two groups: (1) diversity (DM, SHANG), richness (NBTETG, NBTCOBG) and dominance (P5FD) metrics based on ubiquitous and sensitive taxa changed mainly with inorganic contaminants (Pb, Zn, Hg, Ca) rather than with organic contaminants (PCBS, PAHs), (2) metrics based on the abundance of tolerant taxa (%GOLD, %OliG, %Match, %Noinsc) were more related to organic contaminants (PCBS, PAHs) than inorganic contaminants (Cu, As, Cd). An example of a regression tree model for each type of indices and metrics is presented in Figure 5. The other models are presented in the Figure S4, Supplementary Materials.
According to the criteria established for the sediment quality [55], most of the thresholds determined by the regression trees were below Probable Effect Level (PEL) or Frequent Effect Level (FEL), but still above concentrations in preindustrial sediments except for As (6.6 mg/kg), and in postglacial clays except in some case for Ni, Cr and Cu (75, 150 and 54 mg/kg respectively) or ambient levels except for As (2–7 mg/kg) and Cr (52–93 mg/kg) [55,64].
For the DM model (r2 = 0.65), Pb concentration below the PEL was the first node discriminating 51 sites with a concentration below 61 mg/kg with DM values of 1.35 ± 0.40, followed by calcium dividing these sites into two blocks with 23 sites below and 28 sites above 19,000 mg/kg of calcium. In sites with lower Ca concentration, PCBs were taken into account for the classification of the sites, most sites with PCBs content below 0.0423 mg/kg were discriminated a second time by calcium (11,000 mg/kg) and PAHs (1.66 mg/kg). In sites with Ca concentration above 19,000 mg/kg, contamination by Cd, Hg and Cu below the PEL threshold completed the site classification.
For the NBTETG model, a Pb concentration below the PEL was again the first node discriminating 47 sites below and 12 sites above 45 mg/kg. The 12 sites with higher Pb concentration were divided by a Zn concentration between PEL and FEL (398 mg/kg). The group of 7 sites with higher Pb and Zn contamination had the lowest NBTETG value (0.14 ± 0.38). The 47 sites below the threshold of 45 mg/kg was followed by a separation of sites in two blocks based on PCBs contamination threshold (0.026 mg/kg) below the PEL. At the sites with PCBs concentrations below this threshold (22 sites), Hg, PAHs and Al explained the classification of sites. At sites with higher PCBs concentrations (25 sites), Hg, Cd and Cu explained the classification of the sites.
For the %OliG model, a Cu concentration below the PEL was the first node discriminating 49 sites with higher Cu concentrations (100 mg/kg). For sites with higher Cu concentrations, the Cd concentration was the second node (2.1 mg/kg) separating the sites in two equal numbers (5 sites each). The group of 5 sites with higher Cu and Cd contamination had the highest %OliG value (90.20 ± 13.10%). At the sites with low Cu content, As (3.5 mg/kg) at the lower than pre-industrial concentration was the second node dividing the sites into two equal blocks. At sites with higher As content, PCBs was the third node, and metal contamination by Cd or Pb was the last node. At sites with low As, organic contaminants (PAHs, C10-C50 Petroleum hydrocarbons) were the last nodes.
For the %GOLD model, organic contamination by PAHs was the first node separating 48 sites with higher PAHs concentrations. Pb concentration (63 mg/kg) below the PEL segregated another 41 stations with lower Pb concentration and 7 stations with higher concentration. The 7 sites with higher PAHs and Pb concentration had the highest %GOLD value (90.61 ± 9.71%). The 41 sites with low Pb concentration the second node was divided by Cr (28 mg/kg). The sites with concentration below this threshold (12 stations) was divided by PAHs and the sites with concentration above this threshold (29 stations) were divided by Fe (22 stations), PAHs contamination (17 stations), followed by metal contaminants (Ni, As).
Overall, models for the diversity indices and metrics based on richness (DM, SHANG) and the number and abundance of ubiquitous or intolerant taxa (NBTETG, NBTCOBG, P5FD, %Match) were more related to changes in inorganic Pb and Zn contamination for the first nodes, and organic contamination by PCBs for the second nodes. Metrics based on relative abundance of tolerant taxa (%OliG, %NoIns, %DipG) were also related to changes in inorganic Cu contamination. Metrics based on the abundance of tolerant taxa (%GOLD, AOL, AHIR, ANEM, AGOLD) were more related to organic contamination by PAHs contamination for the first nodes and inorganic contamination by Pb, Cu, and Mn for the second nodes.

4. Discussion

4.1. The St. Lawrence River Case Study

The St. Lawrence River does not fit to the River Continuum Model [65], since it is not oriented along a longitudinal gradient (upstream to downstream). It forms a complex hydrological network made up of different water masses and a mosaic of habitats along its transversal dimension (from the uplands to the channel). This corresponds to the complex river model developed by Thorp and collaborators [66,67]. In accordance with the Serial Discontinuity Model [68], fluvial lakes and river confluences disrupt the St. Lawrence River continuum by creating discontinuities and riparian zones of sediment deposition invaded by macrophytes [18]. Compared to small rivers with specific pollution sources where changes in macroinvertebrate indices and metrics can easily be detected and monitored between sites upstream and downstream of the pollution point source [40], large rivers are impacted by multiple anthropogenic stressors and diffuse pollution sources that can interact in multiple ways with environmental conditions [24,46].
In the St. Lawrence River, the absence of defined stress gradients and the wide variation in benthic communities among habitats are important challenges for the development of bioassessment programs. Previous studies in the Lake Saint-Pierre have compared macroinvertebrate assemblages at reference sites and impacted tributary plume sites downstream of two rivers draining agricultural lands [17]. Macroinvertebrate communities in sediments were dominated by endobenthic fauna such as Oligochaeta and Sphaeridae. Taxon richness and composition differed between the reference fluvial sites and the impacted tributary plume sites, reflecting the variation in sediment metal contamination. Oligochaeta and Diptera Chironomidae were characteristic of the impacted sites, while the Gastropoda Valvatidae and the Amphipoda Gammaridae and Asellidae were more abundant in the reference sites. Other studies conducted at the scale of the fluvial sector of the St. Lawrence River analysed spatial patterns of variation of macroinvertebrate communities as a function of taxonomic composition [23] or functional traits [49]. Four macroinvertebrate assemblages were found distributed in the different zones of the fluvial continuum in relation to habitat characteristics and sediment contamination [23]. Four groups of sites were also defined using the functional trait-based approach, which performed better than the taxonomic approach in differentiating sites along the sediment contamination gradient [49]. However, none of these studies evaluated the performance of various macroinvertebrates-based indices and metrics to assess changes in sediments characteristics and contamination. Our case study in the fluvial continuum of the St. Lawrence River is a new complement to previous studies conducted in American [15,24] and Russian [46] large rivers.

4.2. Rational for the Selection and Inclusion of Indices and Metrics

Only a limited number (14) of indices and metrics from an initial selection of 157 were deemed relevant to assess sediment quality in the fluvial section of the St. Lawrence River (Table 2 and Table 3). Our final score was composed of 2 diversity indices (DM, SHANG), 2 metrics based on the number of sensitive taxa (NBTETG, NBTCOBG), and 10 metrics based on the abundance and dominance of sensitive (%Match, %NoInsc, %DipG) or tolerant (%OliG, %GOLD, AOL, AHIR, ANEM, AGOLD) taxa. This score is similar to this of 9 of the 97 benthic metrics used in the bioassessment of six large tributaries of the upper Mississippi and Ohio rivers in Midwest United States [15]. Their final index was composed of metrics based on the number of taxa and dominance of sensitive (Diptera, EPT and Coleoptera taxa richness) or tolerant (tolerant taxa richness, % of Oligochaete and leech taxa) organisms, and metrics based on trophic groups (% of collector-filterer, burrower, and facultative taxa, predator taxa richness). Our final score also corresponds to the 12 indices and metrics included in the PANEL multimetric index developed for the Ohio River, considered responsive to water quality disturbance and ecologically relevant [40].
The diversity indices included in this study (DM, SHANG) are based on the premise that stable and healthy benthic communities at reference sites are taxonomically richer than those at sites impacted by anthropogenic disturbances (e.g., acid drainage, nutrient enrichment, sediment contamination) [40]. Total taxon richness has also been reported as a reliable index in different Austrian river types [38]. Macroinvertebrate diversity indices are considered not robust metrics for biological assessment [29]. Indeed, they are more related to ecological factors such as productivity and habitat heterogeneity than to ecotoxicological and disturbance factors [29], except in cases of extreme pollution. This is also the case of the St. Lawrence River, where the selected diversity indices (DM, SHANG) based on genus level distinguished only the most disturbed sites of the Montreal Harbour from the fluvial sites (Table 4). However, they have an interesting potential for distinguishing sediment quality classes (Table 4).
Metrics based on the numbers of sensitive taxon at the genus level of insects (Ephemeroptera, Trichoptera: NBTETG), and on the richness of facultative taxa (Trichoptera, Coleoptera, Odonata and Bivalvia: NBTCOBG) were effective in differentiating habitat zones and sediment quality classes (Table 4). They show consistently high discriminatory power for less impaired sites and better water and sediment quality [69]. These sensitive organisms are highly intolerant to pollution and their species richness and abundance decrease as anthropogenic disturbances increase in rivers [40], lakes [12] and streams [14,38]. Ephemeroptera larvae are the most sensitive and the first group to disappear in the presence of anthropogenic disturbances, while Trichoptera larvae are considered moderately tolerant. They have the best BMWP scores (6–10) for predicting the deleterious effects of pesticides, metals and organic contaminants on benthic communities in small rivers [20]. In the St. Lawrence River, these metrics showed a wide variation, but allowed us to differentiate between the most impacted sites in the Montreal Harbour and the less impaired sites in the fluvial lakes (mainly LSF and LSL), and the sediment quality classes (Table 4). The potential of these metrics reflects their relevance as indicator taxa of good ecological status in previous studies based on taxonomic composition and functional traits of macroinvertebrates. In the St. Lawrence River, Ephemeroptera (Ephemeridae) and Trichoptera (Hydroptilidae and Leptoceridae) were indicator taxa of the reference sites and less impaired LSF, LSL, and LSP sites [23]. They belong to functional groups composed of univoltine insect larvae with collector and shredder feeding modes, sensitive to organic pollution [49]. Hydroptilidae is mainly a family of large rivers and constitutes one of the most sensitive taxa of Trichoptera [40]. Coleoptera (Elmidae), Odonata and Bivalvia were also sensitive taxa found in less impaired sites in the St. Lawrence River.
Metrics based on the dominance of tolerant taxa (%OliG, %DipG, %Match, %Noinsc, %GOLDG, %P5FD) were also useful for differentiating habitat zones and sediment quality classes (Table 4). They indicate many conditions in moderately to highly disturbed sites, and lower sediment quality. Diptera, especially Chironomidae, show tolerances to many factors but increase under disturbed conditions, as does the percentage of non-insects in rivers [40] and streams [38]. Worms such as Oligochaeta and Dipteran Chironomidae have the worst BMWP scores (1–2) and can support high levels of pollution by pesticides, metals and organic contaminants in small rivers [20]. Although this is true when just looking at a family level of Chironomidae, this is not true anymore when you look at the species level, as the structure and species assemblage of the family Chironomidae changes substantially in lakes [70] and also in the St. Lawrence river [23,49]. Gastropoda and Amphipoda share intermediate BMWP scores (3–6) and are relatively tolerant pollution stress. In the St. Lawrence, the metric based on the 5 most dominant groups (%P5FD) is composed of these tolerant taxa (Oligochaeta, Diptera, Gastropoda) and has been associated with disturbed conditions. The metric based on the percentage of highly tolerant taxa such as the Oligochaeta (%OliG) was the most associated with impaired sites in the Montreal Harbour (Table 4). However, metrics based on the abundance of tolerant taxa (AOL, ANEM, AHIR, AGOLD) had less or no potential to differentiate between habitat zones and sediment quality classes.

4.3. Comparative Responses to Habitat Characteristics and Sediment Contamination

Distinguishing anthropogenic and natural influences and effects on ecosystems is a fundamental problem in environmental sciences [46]. This is problematic in bioassessment of large rivers with macroinvertebrates, where most of the currently applied indices and metrics depend on natural environmental factors. The St. Lawrence River case study is another highlight of the importance of habitat characteristics above sediment contamination. On the other hand, in extreme conditions of pollution or disturbance in the Montreal Harbor, identifying of indices and metrics specific to sediment contamination in large rivers is challenging due to the high natural variability and diversity of factors affecting macroinvertebrate communities [71]. Understanding the relationships between different bioassessment indices and metrics and natural environmental factors is necessary to assess their lack of correlation.

4.4. Bioassessment in a Large and Complex River: Limit and Pertinence

The hydrology, water quality and riparian habitats of the St. Lawrence River have been substantially altered in recent decades [72,73]. Water level fluctuations related to climatic conditions, can strongly affect emergent and submerged aquatic vegetation and macroinvertebrate communities on plants and sediments [16,18,74]. For the bioassessment of the ecological status of large and complex rivers as the St. Lawrence, special attention is needed to assess the impacts of: (1) hydromorphological alterations; (2) activities such as dredging; and (3) harbor and industrial development on biological communities, especially those that affect river continuity and riparian cover [2]. One of the challenges in large rivers is to distinguish the effects of natural ecological factors and anthropogenic stressors. This is to support ecological risk assessment and management in river systems and to assess the complex interactions between multiple stressors.

4.5. Conclusions and Recommendation for Bioassessment Programs

Macroinvertebrates are commonly used for the bioassessment of rivers subject to anthropogenic disturbance. This approach generally requires comparison with reference conditions. Unfortunately, it is not always easy to predict the response of macroinvertebrate communities to environmental changes either anthropogenic or simply related to natural habitat variations. This is particularly the case in large rivers with a mosaic of highly diverse habitats. Indeed, in this study, the typology of macroinvertebrate communities varies according to fluvial lakes, water bodies and sediment quality. Fourteen indices and metrics were shown to be most effective in differentiating between sites and quality classes, and it is these parameters that are most likely to be used in bioassessment for the St. Lawrence River or other large and complex river in northern temperate regions. However, the indices and metrics remain strongly explained by habitat characteristics, such as sediment grain size or the presence of nutrients. There is also an influence of metals and, to a lesser extent, organic contaminants such as petroleum hydrocarbons. The predictive power of indices and metrics is also higher than what has been observed in our previous studies of community structure using taxonomy or functional traits [23,49]. This makes the 14 selected indices and metrics promising bioassessment tools while being easier to use, interpret and explain in an environmental assessment context.
Projects in the St. Lawrence River will continue, and more data will be needed to establish management thresholds. On the other hand, analysis of the results obtained from the regression trees highlights changes in the structure of the macroinvertebrate community below the FEL or even PEL, allowing for the detection of more subtle and early effects. The use of %Oligochaeta seems a very promising variable to detect the presence of metals, but also to distinguish the combined effect with that of hydrocarbons.

Supplementary Materials

The following are available online at https://www.mdpi.com/2073-4441/12/12/3335/s1, Table S1. Minimum and maximum values of the sediment characteristics in the 59 sampling stations: pH, total and dissolved organic carbon (TOC, DOC), and concentrations of nutrients, metals, metalloid and organic chemicals (mg/kg DW). <DL = under detection limit, min and max, Table S2. Macroinvertebrate taxa at genus level recorded in the fluvial section of the St. Lawrence River and used for this case study: Occurrences based on number of sites and frequency (%), Table S3. List of the 264 macroinvertebrate metrics and indices (with their abbreviations) colligated from the literature including 181 usual and 83 new (with asterisks) metrics and indices. (A) Usual and news metrics and indices. (B) Functional traits indices. The 157 metrics and indices retained after ANOVAs and correlations analyses are in bold. Metrics highlighted in blue showed significant differences among habitat zones; metrics highlighted in orange showed significant differences among sediment quality classes; metrics highlighted in green showed significant differences among habitat zones and sediment quality classes (ANOVAs, p < 0.01), Table S4. Step by step pair comparisons (index 1 vs index 2) of the 157 macroinvertebrate metrics and indices (with their abbreviations) based on several criteria: (1) their pertinence in bioassessment of large rivers (Per), (2) their potential for discriminating habitat zones and class of sediment quality (ANOVA), (3) their correlations with sediment variables (Cor), (4) their contribution in the PCA ordination (PCA+), (5) their easy identification at the genus level (Gen), and (6) as quantitative metrics based on taxa abundance (AB). Taxa in bold are those selected step by step for each pair of metrics or indices. The metrics based on functional traits were not retained because of their difficulty to be applied by managers in current bioassessment, Table S5. Correlations (ρ de Spearman) among macroinvertebrate metrics and indices retained after the selection procedure and the characteristics of habitat and sediment (* p < 0.05; ** p < 0.01; *** p < 0.0001), Table S6. A- Criteria used for the evaluation of sediments quality, Table S6. B - Criteria used for the evaluation of sediments quality, Figure S1. Macroinvertebrates indices and metrics selection procedure framework, Figure S2. Principal component analysis (PCA) based of the 157 metrics and indices retained after the first selection using ANOVAs, and of sampling sites in three fluvial lakes and the Montreal harbour along the sections of the St. Lawrence River, Figure S3. Redundancy analyses (RDA) based of the 14 selected metrics and indices and sediment characteristics and contaminants in all sampling sites of the three fluvial lakes and the Montreal harbour along the fluvial section of the St. Lawrence River. (A) grain size, composition, and chemistry, (B) inorganic contaminants, (C) organic contaminants, Figure S4. Regression tree models. Green represents the thresholds below the PEL, yellow between the PEL and the FEL and white are the substances without sediment quality criteria.

Author Contributions

M.D. at MELCC and B.P.-A. at the Université de Montréal managed the project. They conceived the framework, supervised the data collated and analysis of the Master student, and wrote the English version of the paper. C.S. collated all data on macroinvertebrate indices and metrics from previous studies, ran the statistical analysis and wrote the French report. All authors have read and agreed to the published version of the manuscript.

Funding

This study is a component of a collaborative program included in the St. Lawrence Plan for Sustainable Development, and realised with the active participation of Environment and Climate Change Canada (Environmental Protection Operations Division and Science and Technology Branch), the Ministère de l’Environnement et de la Lutte contre les changements climatiques (Centre d’expertise en analyse environnementale du Québec; Direction des évaluations environnementales des projets hydriques et industriels; Direction générale du suivi de l’état de l’environnement). C. Spilmont was supported by a scholarship grant from a Discovery funding of the National Science and Engineering Research Council (NSERC) to B.P.A.

Acknowledgments

We thank Gaëlle Triffault-Bouchet for the revision of the manuscript, and collaborative training of the Master student. Macroinvertebrates were identified by a private firm (Laboratoires SAB Inc.). We also thank M. Arseneault, G. Brault, A. Lajeunesse and P. Turcotte, who participated to fieldwork and all persons connected to the laboratories of chemistry of the Centre d’expertise en analyse environnementale du Québec. We thank Louise Cloutier (Université de Montréal), for their help about taxonomic identification.

Conflicts of Interest

The authors declare no conflict of interest.

References

  1. Hering, D.; Feld, C.K.; Moog, O.; Ofenböck, T. Cook book for the development of a Multimetric index for biological condition of aquatic ecosystems: Experiences from the European AQEM and STAR projects and related initiatives. Hydrobiologia 2006, 556, 311–324. [Google Scholar] [CrossRef]
  2. Reyjol, Y.; Argillier, C.; Bonne, W.; Borja, A.; Buijse, A.D.; Cardoso, A.C.; Daufresne, M.; Kernan, M.; Ferreira, M.T.; Poikane, S.; et al. Assessing the ecological status in the context of the European water framework directive (WFD): Where should we go now? Sci. Total Environ. 2014, 497/498, 332–344. [Google Scholar] [CrossRef] [PubMed]
  3. Pinel-Alloul, B.; Méthot, G.; Borcard, D. Évaluation de L’état des Données sur les Macroinvertébrés Benthiques du Fleuve Saint-Laurent et de ses Tributaires Pour une Application d’un Modèle de Suivi Environnemental avec L’approche des Conditions de Référence (CABIN); Centre Saint-Laurent, E.C., Ed.; Université de Montréal: Montréal, QC, Canada, 2004; p. 68. [Google Scholar]
  4. U.S. Environmental Protection Agency. Methods for Evaluating Wetland Conditions: Developing an Invertebrate Index for Biological Integrity of Wetlands Office of Water; U.S.E.P.A.: Washington, DC, USA, 2002.
  5. Chessman, B.C. Rapid assessment of rivers using macroinvertebrates: A procedure based on habitat-specific sampling, family-level identification, and a biotic index. Aust. J. Ecol. 1995, 20, 122–129. [Google Scholar] [CrossRef]
  6. Chessman, B.C.; Royal, M.L. Bioassessment without reference sites: Use of environmental filters to predict natural assemblages of river macroinvertebrates. J. North Am. Benthol. Soc. 2004, 23, 599–615. [Google Scholar] [CrossRef]
  7. Metzeling, L.; Chessman, B.; Hardwick, R.; Wong, V. Rapid assessment of rivers using macroinvertebrates: The role of experience, and comparisons with quantitative methods. Hydrobiologia 2003, 510, 39–52. [Google Scholar] [CrossRef]
  8. Bonada, N.; Prat, N.; Resh, V.H.; Statzner, B. Developments in aquatic insect biomonitoring: A comparative analysis of recent approaches. Annu. Rev. Entomol. 2006, 51, 495–523. [Google Scholar] [CrossRef] [Green Version]
  9. Resh, V.H.; Norris, R.H.; Barbour, M.T. Design and implementation of rapid assessment approaches for water resource monitoring using benthic macroinvertebrates. Aust. J. Ecol. 1995, 20, 108–121. [Google Scholar] [CrossRef]
  10. Cayrou, J.; Compin, A.; Giani, N.; Céréghino, R. Associations spécifiques chez les macroinvertébrés benthiques et leur utilisation pour la typologie des cours d’eau. Cas du réseau hydrographique Adour-Garonne (France). Ann. Limnol. Int. J. Limnol. 2000, 36, 189–202. [Google Scholar] [CrossRef] [Green Version]
  11. Tripole, S.; Vallania, E.A.; Corigliano, M.C. Benthic macroinvertebrate tolerance to water acidification in the Grande River sub-basin (San Luis, Argentina). Limnetica 2008, 27, 29–38. [Google Scholar]
  12. Gabriels, W.; Lock, K.; De Pawn, N.; Goethals, P.L.M. Multimetrics macroinvertebrate Index Flanders (MMIF) for biological assessment of rivers and lakes in Flanders (Belgium). Limnologica 2010, 40, 199–207. [Google Scholar] [CrossRef] [Green Version]
  13. Lewin, I.; Czerniawska-Kusza, I.; Lawniczak, A.E.; Jusik, S. Biological indices applied to benthic macroinvertebrates at reference conditions of mountain streams in two ecoregions (Poland, the Slovak Republic). Hydrobiologia 2013, 709, 183–200. [Google Scholar] [CrossRef] [Green Version]
  14. Alemneh, T.; Ambelu, A.; Zaitchik, B.F.; Bahrndorff, S.; Mereta, S.T.; Pertoldi, C. Macroinvertebrate multi-metric index for Ethiopian highland streams. Hydrobiologia 2019, 843, 125–141. [Google Scholar] [CrossRef]
  15. Blocksom, K.A.; Johnson, B.R. Development of a regional macroinvertebrate index for large river bioassessment. Ecol. Indic. 2009, 9, 313–328. [Google Scholar] [CrossRef]
  16. Tessier, C.; Cattaneo, A.; Hudon, C.; Borcard, D. Invertebrate communities associated with metaphyton and emergent and submerged macrophytes in a large river. Can. J. Fish. Aquat. Sci. 2008, 70, 10–20. [Google Scholar] [CrossRef]
  17. Tall, L.; Méthot, G.; Armellin, A.; Pinel-Alloul, B. Bioassessment of benthic macroinvertebrates in wetland habitats of Lake Saint-Pierre (St. Lawrence River). J. Great Lakes Res. 2008, 34, 599–614. [Google Scholar] [CrossRef]
  18. Tall, L.; Armellin, A.; Pinel-Alloul, B.; Méthot, G.; Hudon, C. Effects of hydrological regime, landscape features, and environment on macroinvertebrates in St. Lawrence River wetlands. Hydrobiologia 2016, 778, 221–241. [Google Scholar] [CrossRef]
  19. Armitage, P.D.; Moss, D.; Wright, J.T.; Furse, M.T. The performance of a new biological water quality score system based on macroinvertebrates over a wide range of unpolluted running water sites. Water Res. 1983, 17, 333–347. [Google Scholar] [CrossRef]
  20. Armitage, P.D. The potential of RIPACS for predicting the effects of environmental change. Chapter 7. In Assessing the Biological Quality of Freshwaters: RIPACS and Other Techniques; Wright, J.F., Sutcliffe, D.W., Furse, M.T., Eds.; Freshwater Biological Association: Ambleside, UK, 2000; pp. 93–111. [Google Scholar]
  21. Burt, A.J.; McKee, P.M.; Hart, D.R.; Kauss, P.B. Effects of pollution on benthic invertebrate communities of the St. Marys River. Hydrobiologia 1991, 2019, 63–81. [Google Scholar] [CrossRef]
  22. Clements, W.H.; Cherry, D.S.; Van Hassel, J.H. Assessment of the impact of heavy metals on benthic communities at the Clinch River (Virginia): Evaluation of an index of community sensitivity. Can. J. Fish. Aquat. Sci. 1992, 49, 1686–1694. [Google Scholar] [CrossRef]
  23. Masson, S.; Desrosiers, M.; Pinel-Alloul, B.; Martel, L. Relating macroinvertebrate community structure to environmental characteristics and sediment contamination at the scale of the St. Lawrence River. Hydrobiologia 2010, 647, 35–50. [Google Scholar] [CrossRef]
  24. Angradi, T.R.; Pearson, M.S.; Bolgrein, D.W.; Jicha, T.M.; Taylor, D.L.; Hill, B.H. Multimetric macroinvertebrate indices for mid-continent US great rivers. J. North Am. Benthol. Soc. 2009, 28, 785–804. [Google Scholar] [CrossRef]
  25. Reynoldson, T.B.; Norris, R.H.; Resh, V.H.; Day, K.E.; Rosenberg, D.M. The reference condition: A comparison of multimetric and multivariate approaches to assess water-quality impairment using benthic macroinvertebrates. J. North Am. Benthol. Soc. 1997, 16, 833–852. [Google Scholar] [CrossRef]
  26. Bailey, R.C.; Kennedy, M.G.; Dervish, M.Z.; Taylor, R.M. Biological assessment of freshwater ecosystems using a reference condition approach: Comparing predicted and actual benthic invertebrate communities in Yukon streams. Freshw. Biol. 1998, 39, 765–774. [Google Scholar] [CrossRef]
  27. Czerniawska-Kusza, I. Comparing modified biological monitoring working partly score system and several biological indices based on macroinvertebrates for water quality assessment. Limnologica 2005, 35, 169–176. [Google Scholar] [CrossRef] [Green Version]
  28. Washington, H.G. Diversity, biotic and similarity indices: A review with special relevance to aquatic ecosystems. Water Res. 1984, 18, 653–694. [Google Scholar] [CrossRef]
  29. Koperski, P. Diversity of freshwater macrobenthos and its use in biological assessment: A critical review of current applications. Environ. Rev. 2011, 19, 16–31. [Google Scholar] [CrossRef]
  30. Buffagni, A.; Erba, S.; Cazzola, M.; Murray-Bligh, J.; Soszka, H.; Genoni, P. The STAR common metrics approch to the WFD intercalibration process: Full application for small, lowland rivers in three European countries. Hydrobiologia 2006, 566, 379–399. [Google Scholar] [CrossRef]
  31. Reynoldson, T.B.; Rosenberg, D.M.; Resh, V.H. Comparison of models predicting invertebrate assemblages for biomonitoring in the Fraser River catchment, British Columbia. Can. J. Fish. Aquat. Sci. 2001, 58, 1395–1410. [Google Scholar] [CrossRef]
  32. Odoutan, O.H.; Janssens de Bisthoven, L.; Abou, Y.; Eggermount, H. Biomonitoring of lakes using macroinvertebrates: Recommended indices and metrics for use in West Africa and developing countries. Hydrobiologia 2019, 826, 1–23. [Google Scholar] [CrossRef]
  33. Oertli, B.; Indermuehle, N.; Angélibert, S.; Hinden, H.; Stoll, A. Macroinvertebrate assemblages in 25 high alpine ponds of the Swiss National Parks (Cirque of Macun) and relation to environmental variables. Hydrobiologia 2008, 597, 29–41. [Google Scholar] [CrossRef]
  34. Walley, W.J.; Grbowitč, J.; Dzeroski, S. A reappraisal of saprobic values and indicator weights based on Slovenian river quality data. Water Res. 2001, 35, 4285–4292. [Google Scholar] [CrossRef]
  35. Hilsenhoff, W.L. Rapid field assessment of organic pollution with a family-level biotic index. J. North Am. Benthol. Soc. 1988, 7, 65–68. [Google Scholar] [CrossRef]
  36. Hilsenhoff, W.L. An improved biotic index for organic stream pollution. Great Lakes Entomol. 1987, 20, 31–39. [Google Scholar]
  37. Pinel-Alloul, B.; Méthot, G.; Lapierre, L.; Willsie, A. Macroinvertebrate community as a biological indicator of ecological and toxicological factors in Lake Saint-François (Québec). Environ. Pollut. 1996, 91, 65–87. [Google Scholar] [CrossRef]
  38. Ofenböck, T.; Moog, O.; Gerritsen, J.; Barbour, M. A stressor specific multimetric approach for monitoring running waters in Austria using benthic macro-invertebrates. Hydrobiologia 2004, 516, 251–268. [Google Scholar] [CrossRef]
  39. Touron-Poncet, H.; Bernadet, C.; Compin, A.N.B.; Céréghino, R. Implementing the Water Framework Directive in overseas Europe: A multimetric macroinvertebrate index for river bioassessment in Caribbean islands. Limnologica 2014, 47, 34–43. [Google Scholar] [CrossRef]
  40. Applegate, J.M.; Baumann, P.C.; Emery, E.B.; Wooten, M.S. First steps in developing a multimetric macroinvertebrate index for the Ohio River. River Res. Appl. 2007, 23, 683–697. [Google Scholar] [CrossRef]
  41. Zamora-Muñoz, C.; Alba-Tercedor, J. Bioassessment of organically polluted Spanish rivers, using a biotic index and multivariable methods. J. North Am. Benthol. Soc. 1996, 15, 332–352. [Google Scholar] [CrossRef]
  42. Barton, D.R.; Metcalfe-Smith, J.L. A comparison of sampling techniques and summary indices for assessment of water quality in the Yamaska River, Quebec, based on benthic macroinvertebrates. Environ. Monit. Assess. 1992, 21, 225–244. [Google Scholar] [CrossRef]
  43. Karr, J.R.; Fausch, K.D.; Angermeier, P.L.; Yant, P.R.; Scholosser, U. Assessing Biological Integrity in Running Waters: A Method and Its Rationale; Illinois Natural History Survey Special Publication No 5: Champaign, IL, USA, 1986. [Google Scholar]
  44. De Pauw, N.; Vanhooren, G. Method for biological quality assessment of watercourses in Belgium. Hydrobiologia 1983, 100, 153–168. [Google Scholar] [CrossRef]
  45. Armanini, D.G.; Horrigan, N.; Monk, W.A.; Peters, D.L.; Baird, D.J. Development of a benthic macroinvertebrate flow sensitivity index for Canadian rivers. River Res. Appl. 2011, 27, 723–737. [Google Scholar] [CrossRef]
  46. Schletterer, M.; Fureder, L.; Kusolev, V.V.; Beketov, M.A. Testing the coherence of several macroinvertebrates indices and environ mental factors in a large lowland river system (Volga River, Russia). Ecol. Indic. 2010, 10, 1083–1092. [Google Scholar] [CrossRef]
  47. Collier, K.J.; Hamer, M.P.; Moore, S.C. Littoral and benthic macroinvertebrate community responses to contrasting stressors in a large New Zealand river. N. Z. J. Mar. Freshw. Res. 2014, 48, 560–576. [Google Scholar] [CrossRef]
  48. Carignan, R.; Lorrain, S.; Lum, K. A 50-yr record of pollution by nutrients, trace metals, and organic chemicals in the St. Lawrence River. Can. J. Fish. Aquat. Sci. 1994, 51, 1088–1100. [Google Scholar] [CrossRef]
  49. Desrosiers, M.; Usseglio-Polatera, P.; Archaimbault, V.; Larras, F.; Méthot, G. Pinel-Alloul, B. Assessing anthropogenic pressure in the St. Lawrence River using traits of benthic macroinvertebrates. Sci. Total Environ. 2019, 649, 233–246. [Google Scholar] [CrossRef]
  50. Desrosiers, M.; Babut, M.P.; Pelletier, M.; Bélanger, C.; Thibodeau, S.; Martel, L. Efficiency of sediment quality guidelines for predicting toxicity: The case of the St. Lawrence River. Integr. Environ. Assess. Manag. 2010, 6, 225–239. [Google Scholar]
  51. Désy, J.C.; Archambault, J.F.; Pinel-Alloul, B.; Hubert, J.; Campbell, P.G.C. Relationships between total mercury in sediments and methyl mercury in the freshwater gastropod prosobranch Bithynia tentaculata in the St. Lawrence River, Quebec. Can. J. Fish. Aquat. Sci. 2000, 57, 164–173. [Google Scholar]
  52. Flessas, C.; Couillard, Y.; Pinel-alloul, B.; St-Cyr, L.; Campbell, P.G.C. Metal concentration in two freshwater gastropods (Mollusca) in the St. Lawrence River and relationships with environmental contamination. Can. J. Fish. Aquat. Sci. 2000, 57, 126–137. [Google Scholar] [CrossRef]
  53. Amyot, M.; Pinel-Alloul, B.; Campbell, P.G.C. Abiotic and seasonal factors influencing trace metal levels (Cd, Cu, Ni, Pb, and Zn) in the freshwater amphipod Gammarus fasciatus in two fluvial lakes of the St. Lawrence River. Can. J. Fish. Aquat. Sci. 1994, 51, 2003–2016. [Google Scholar] [CrossRef]
  54. Lévesque, D.; Cattaneo, A.; Hudon, C.; Gagnon, P. Predicting the risk of proliferation of the benthic cyanobacterium Lyngbia wollei in the St. Lawrence River. Can. J. Fish. Aquat. Sci. 2012, 69, 1585–1595. [Google Scholar] [CrossRef]
  55. Environnement Canada, Ministère du Développement durable, de l’Environnement et des Parcs du Québec. Criteria for the Assessment of Sediment Quality in Quebec and Application Frameworks: Prevention, Dredging and Remediation; Plan Saint-Laurent pour un développement durable: Québec, QC, Canada, 2007; p. 39.
  56. Klemm, D.J.; Lewis, P.A.; Fulk, F.; Lazorchak, J.M. Macroinvertebrate Field and Laboratory Methods for Evaluating the Biological Integrity of Surface Waters; U.S Environmental Protection Agency, Office of Research and Development of the Environmental Monitoring Systems Laboratory: Cincinnati, OH, USA, 1990; p. 206.
  57. Merritt, R.W.; Cummins, K.W. An Introduction to the Aquatic Insects of North America, 3rd ed.; Kendall/Hunt Publishing Company: Dubuque, Iowa, 1996; p. 442. [Google Scholar]
  58. Thorp, J.H.; Covich, A.P. Ecology and Classification of North American Freshwater Invertebrates, 2nd ed.; Academic Press: San Diego, CA, USA, 2001; p. 1038. [Google Scholar]
  59. Ter Braak, C.J.F. Canonical correspondence analysis: A new eigenvector technique for multivariate direct gradient analysis. Ecology 1996, 67, 1167–1179. [Google Scholar] [CrossRef] [Green Version]
  60. Ter Braak, C.J.F.; Smilauer, P. CANOCO Reference Manual and User’s Guide to Canoco for Windows: Software for Canonical Community Ordination (Version 4); Microcomputer Power: Ithaca, NY, USA, 1998. [Google Scholar]
  61. Legendre, P.; Legendre, L. Numerical Ecology. In Development in Environmental Modelling, 3rd ed.; Elsevier Science BV: Amsterdam, The Netherlands, 2012; Volume 24, p. 1006. [Google Scholar]
  62. De’ath, G. Multivariate regression trees: A new technique for modeling species-environment relationships. Ecology 2002, 83, 1105–1117. [Google Scholar]
  63. Ouelette, M.-H.; Legendre, P.; Borcard, D. Cascade multivariate regression tree: A novel approach for modelling nested explanatory sets. Methods Ecol. Evol. 2012, 3, 234–244. [Google Scholar] [CrossRef]
  64. Saulnier, I.; Gagnon, C. Background levels of metals in St. Lawrence River sediments: Implications for sediment quality criteria and environmental management. Integr. Environ. Assess. Manag. 2006, 2, 126–141. [Google Scholar] [CrossRef] [PubMed]
  65. Vannote, R.L.; Minshall, G.W.; Cummins, K.W.; Sedell, J.R.; Cushing, C.E. The river continuum concept. Can. J. Fish. Aquat. Sci. 1980, 37, 130–137. [Google Scholar] [CrossRef]
  66. Thorp, J.H.; Thoms, M.C.; Delong, M.D. The riverine ecosystem synthesis: Biocomplexity in river networks across space and time. Res. Appl. 2006, 22, 123–147. [Google Scholar] [CrossRef]
  67. Thorp, J.H.; Thoms, M.C.; Delong, M.D. The Riverine Ecosystem Synthesis: Towards Conceptual Cohesiveness in River Science; Academic Press: London, UK, 2008; p. 232. [Google Scholar]
  68. Stanford, J.A.; Ward, J.V. Revisiting the serial discontinuity model. River. River Res. Appl. 2001, 17, 303–310. [Google Scholar] [CrossRef]
  69. Wallace, J.B.; Grubaugh, J.W.; Whiles, M.R. Biotic indices and stream ecosystem processes: Results from an experimental study. Ecol. Appl. 1996, 6, 140–151. [Google Scholar] [CrossRef]
  70. Dorić, V.; Pozojević, I.; Vučković, N.; Ivković, M.; Mihaljević, Z. Lentic chironomid performance in species-based bioassessment proving: High-level taxonomy is not a dead end in monitoring. Ecol. Indic. 2020, 107041. in press. [Google Scholar]
  71. Beketov, M.A.; Liess, M. An indicator for effects of organic toxicants on lotic invertebrate communities: Independence of confounding environmental factors over an extensive river continuum. Environ. Pollut. 2008, 156, 980–987. [Google Scholar] [CrossRef]
  72. Hudon, C. Impact of water-level fluctuations on St. Lawrence River aquatic vegetation. Can. J. Fish. Aquat. Sci. 1997, 54, 2853–2865. [Google Scholar] [CrossRef]
  73. Hudon, C.; Carignan, R. Cumulative impacts of hydrology and human activities on water quality in the St. Lawrence River (Lake Saint-Pierre, Québec, Canada). Can. J. Fish. Aquat. Sci. 2008, 65, 1165–1180. [Google Scholar] [CrossRef]
  74. Hudon, C.; Gagnon, P.; Amyot, J.-P.; Létourneau, G.; Jean, M.; Plante, C.; Rioux, D.; Deschênes, M. Historical changes in herbaceous wetland distribution induced by hydrological conditionsin Lake Saint-Pierre (St. Lawrence River, Quebec, Canada). Hydrobiologia 2005, 539, 205–224. [Google Scholar] [CrossRef]
Figure 1. Sites sampled on four habitat zones across the fluvial section of the St. Lawrence River, including the three fluvial lakes and the Montreal Harbour area (from Figure 1, in [23,49]).
Water 12 03335 g001
Figure 2. Relative abundance of macroinvertebrate communities in three fluvial lakes and the Montreal harbour along the fluvial section of the St. Lawrence River.
Water 12 03335 g002
Figure 3. Principal component analysis showing the projection of the vectors of the 14 final indices and metrics and the ordination of the sampling sites of each habitat zone of the fluvial section (without 2 outliers of LSL sites).
Water 12 03335 g003
Figure 4. Redundancy analyses (RDA) based of the 14 selected indices and metrics and sediment characteristics and contaminants in 53 sampling sites of the three fluvial lakes and the Montreal harbour along the fluvial section of the St. Lawrence River. (A) sediment grain size composition and chemistry, (B) inorganic contaminants, (C) organic contaminants. Results without 6 outlier sites (LSL16, LSL17, LSL22, LSL26, PM28, PM6).
Water 12 03335 g004aWater 12 03335 g004b
Figure 5. Regression tree models for a diversity index (DM), and metrics based on taxa richness (NBTETG) and taxa abundances (%OliG, %GOLD). Green represents the thresholds below the PEL, yellow between the PEL and the FEL and white are the substances without sediment quality criteria.
Water 12 03335 g005aWater 12 03335 g005b
Table 1. Application of the sediment remediation framework and number of sites for each sediment quality class in the habitat zones (Lake Saint-François (LSF), Lake Saint-Louis (LSL), Lake Saint-Pierre (LSP) and Montréal Harbour (MH)).
Sediment Quality ClassRemediation of Contaminated Site
Application Framework [55]
LSFLSLLSPMH
1
  • All contaminant concentration < PEL (Probable Effect Level)
  • Adverse biological effects may be anticipated
  • Level of contamination alone does not justify site remediation
n = 2
LSF51 LSL53
n = 9
LSL16 LSL17 LSL18 LSL19 LSL20 LSL22 LSL23 LSL24 LSL26
n = 12
LSP12 LSP13 LSP14 LSP15 LSP30 LSP31 LSP33 LSP34 LSP35 LSP37 LSP38 LSP39
n = 2
PM8 PM9
2
  • At least one contaminant concentration between PEL < concentration < FEL (Frequent Effect Level.)
  • Identify the sources and take action If applicable eliminate inputs of contaminants Environmental studies may be necessary
  • Assess the ecotoxicological risk
  • Determine the remediation requirements
n = 5
LSF52 LSF56 LSF57 LSF58 LSF59
n = 4
LSL21 LSL41 LSL43 LSL46
n = 3
LSP11 LSP32 LSP36
n = 2
PM2 PM5
3
  • At least one contaminant concentration > FEL
  • Sediment contamination is considered a serious problem
  • Identify the sources and take action If applicable eliminate inputs of contaminants
  • Site remediation is desirable
  • Biological assessments should be carried out to determine the feasibility of a remediation process, set the priorities for action and identify the environmental gains.
n = 3
LSF50 LSF54 LSF55
n = 8
LSL25 LSL40 LSL42 LSL44 LSL45 LSL47 LSL48 LSL49
n = 0n = 9
PM1 PM3 PM4 PM6 PM7 PM10 PM27 PM28 PM29
Table 2. List of the 157 metrics and indices retained after the first and second selection procedures. See Table S3 for full names and corresponding abbreviations. Taxa with significant difference among habitat zones (normal font); taxa with significant difference among sediment quality classes (italic font); taxa with significant differences among both habitat zones and sediment quality classes (underline font).
Indices and Metrics
Diversity indicesDSW, Hmax, ESW, DS, ES, M, BP, DH, DM, IG, PIE, TU, SIMF, SIMG, SHANF, SHANG, MARGF, MARGG, EVENF, EVENG
Metrics on taxa richness NBFA, NBFOD, NBFEP, NBFTR, NBFDI, EPT, ETO, NBGE, NBGOD, NBGEP, NBGTR, NBGDI, NBGCH, NBTGaG, NBTGaF, NBTBiG, NBTBiF, NBTHiG, NBTHiF, NBTCrG, NBTCrF, NBTEG, NBTEF, NBTOdG, NBTOdF, NBTTrG, NBTTrF, NBTDiG, NBTDiF, NBTOtG, NBTOtF, NBTETG, NBTETF, NBTET/G, NBTET/F, NBTO/F, NBtEF, NBTOBF, NBTaxF, NBTODF, NBTODG, NBTEGA, NBTOLDG, NBTOD/G, NBTEG, NBTCOBG, NBFamG, NBGen, Ita
Metrics on taxa abundances AOL, PFD, P2FD, P5FD, PCH, POL, PTR, PDI, PAM, PGA, PBI, PIN, %collector, %scraper, %predator, Mach%, NoIns%, %NemG, %GasG, %PolG, %OliG, %CruG, %TriG, %DipG, %HydG, %ETG, %ET/OLG, %AETG, %GOLDG, ANEM, APOL, AOLI, AHIR, ADIP, AHYD, AGOLD
Multi-metric biotic indicesIBGN, GFI, BMWP, ASPT, BBIF, BBIG, HAIF, HAIG, r/KF, r/KG, RETIF, RETIG, ICI
Metrics on functional traits [49]Volt3, Life2, Sta3, Diss1, Diss3, Hab1, Hab2, Hab4, Att1, Att2, Att3, Att4, Form2, Form3, Arm1, Arm2, Arm3, Size2, Size4, Size5, Resp1, Resp2, Rep1, Rep2, Ovo2, Ovo3, Trop1, Trop4, Trop5, Foo1, Foo2, Foo4, Foo7, Vc1, Sub2, Sub3, Sub4, Sub5, Sub6
Table 3. List of taxa, metrics, and indices (with abbreviations) at the family (F) or genera (G) taxonomic levels, with equations, retained after all selection procedures.
TaxaIndices and MetricsAbbreviationsG/FEquations
MacroinvertebratesDiversity of
Menhinick
DMF DM n = S N
MacroinvertebratesDiversity Shannon-Wiener-IndexSHANGG SHANG = ( p i log e p i )
OligochaetaTaxonomic group
(abundance)
Oligochaeta
AOLG AOL = (       Oligochaeta Total   effective )
NematodaTaxonomic group (abundance)—NematodaANEMG ANEM = (       Nematoda Total   effective )
HirudineaTaxonomic group (abundance)—HirudineaAHIRG AHIR = (       Hirudinea Total   effective )
Gastropoda, Oligochaeta, DipteraTaxonomic group (abundance)—GOLDAGOLDG AGOLD = (       Taxons ( Gastropoda + Oligochaeta + Diptera )   Total   effective )
OligochaetaTaxonomic group [%]—Oligochaeta [%]%OliG % Oli = (       Oligochatea Total   effective ) × 100
DipteraTaxonomic group [%]—Diptera [%]%DipG % Dip = (       Diptera Total   effective ) × 100
Gastropoda, Oligochaeta, DipteraTaxonomic group [%]—GOLD%GOLDG % GOLD = (       Taxa ( Gastropoda + Oligochaeta + Diptera )   Total   effective ) × 100
Mollusca, Chironomidae, Achaeta%abundance Mollusca, Achaeta, Chironomidae%MachG % Mach = (       Taxa ( Mollusca + Achaeta + Chironimidae )   Total   effective ) × 100
Non-insect%abundance Non-insect relativeNoIns%G % Noinsc = (       Taxons   insecta   Total   effective ) × 100
Macroinvertebrates5% first dominant familiesP5FDF P 5 FD = (   Effectif   5   dominant   families Total   effective ) × 100
Ephemeroptera, Trichoptera, Coleoptera, Odonata, BivalviaTaxonomic group (number of taxa)—ETCOBNBTCOBGG NBTCOBG =     Taxa ( Ephemeroptera + Trichoptera + Coleoptera + Odonata + Bivalvia )
EphemeropteraTaxonomic group (number of taxa)—
E-Taxa
NBTETGG NBTETG = Number   of   Ephemeroptera   taxa
Table 4. Results of ANOVA analyses (classification and probabilities) for the 14 final metrics and indices considering variations among habitat zones (LSF-LSL-LSP-MH) or sediment quality classes based on the remediation framework (1-2-3) and separating sites with contamination and physical stress due to harbour activities (3A) and sites with only historical sediment contamination (3B). Non-significant tests (grey).
Indices MetricsHabitat ZonesSediment Quality Classes
LSF-LSL-LSP-MHProb.1-2-3Prob.1-2-3A-3BProb.
Diversity
DMA-A-A-B0.0004A-A-A0.3832B-AB-C-A<0.0001
SHANGA-A-A-B0.0003A-A-A0.8649B-B-C-A<0.0001
Taxa richness
NBTETGA-A-B-B<0.0001A-A-A0.2897BC-AB-C-A<0.0001
NBTCOBGA-A-A-B<0.0001A-A-A0.4273B-AB-C-A<0.0001
Taxa abundance
AOLB-AB-AB-A0.0085A-A-A0.4617B-B-A-B0.0075
%OliGC-BC-B-A<0.0001A-A-A0.1796B-B-A-B<0.0001
%DipGA-B-B-B0.0005A-A-A0.9226AB-AB-B-A0.0176
P5FDBC-C-B-A<0.0001A-A-A0.8449B-BC-A-C<0.0001
ANEMA-A-A-A0.0846A-B-AB0.0181A-B-B-AB0.0380
AHIRA-A-A-A0.2213A-A-A0.6814A-A-A-A0.5122
AGOLDA-A-A-A0.4945A-A-A0.5070A-A-A-A0.5290
%MatchA-B-B-B<0.0001A-A-A0.8731AB-AB-B-A0.0176
%NoInscB-A-A-A0.0003A-A-A0.9340AB-AB-A-B0.0058
%GOLDGAB-B-B-A0.0006A-A-A0.1202B-AB-A-B0.0025
Publisher’s Note: MDPI stays neutral with regard to jurisdictional claims in published maps and institutional affiliations.

